Development, Implementation, and Testing of a GIS &...
149
Transcript of Development, Implementation, and Testing of a GIS &...

Santhosh Kumar Kadari
Development, Implementation, andTesting of a GIS & GPS based Real�Time
Vehicle Tracking System
Masterarbeit
zur Erlangung des akademischen Grades
Diplom�Ingenieur
Studium Information Technology
�������������
Alpen-Adria-Universität Klagenfurt
Fakultät für Technische Wissenschaften
Begutachter: Univ.-Prof. Dr.-Ing. Kyandoghere Kyamakya
Institute for Smart System-Technologies
Transportation Informatics
Klagenfurt, im April 2010

Eidesstattliche Erklärung
Ich erkläre ehrenwörtlich, dass ich die vorliegende wissenschaftliche Arbeit selbstständigangefertigt und die mit ihr unmittelbar verbundenen Tätigkeiten selbst erbracht habe. Icherkläre weiters, dass ich keine anderen als die angegebenen Hilfsmittel benutzt habe. Alleaus gedruckten, ungedruckten oder dem Internet im Wortlaut oder im wesentlichen Inhaltübernommenen Formulierungen und Konzepte sind gemäÿ den Regeln für wissenschaftlicheArbeiten zitiert und durch Fuÿnoten bzw. durch andere genaue Quellenangaben gekennze-ichnet.
Die während des Arbeitsvorganges gewährte Unterstützung einschlieÿlich signi�kanterBetreuungshinweise ist vollständig angegeben.
Die wissenschaftliche Arbeit ist noch keiner anderen Prüfungsbehörde vorgelegt worden.Diese Arbeit wurde in gedruckter und elektronischer Form abgegeben. Ich bestätige, dassder Inhalt der digitalen Version vollständig mit dem der gedruckten Version übereinstimmt.
Ich bin mir bewusst, dass eine falsche Erklärung rechtliche Folgen haben wird.
(Unterschrift) (Ort, Datum)
i

Abstract
In today's wireless world, the word "communication" is everywhere, with everybodyand at any time. We have come very close to this goal during the last few years. Alongwith the latest mobile communication technologies, people have been using two other tech-nologies, including Global Positing System (GPS) and Geographic Information System(GIS) for communication. The need for vehicle tracking and navigation has brought theemergence of GPS technology and the revolution in mapping procedures has brought GIStechnology to the everyday life of common people.
The main objective of my thesis is to develop, implement and test a software which canbe used in precision farming. Precision farming is a concept that denotes collecting �eldinformation using new technologies in agriculture. This information is used to estimatethe quantity of fertilizers needed, to evaluate the optimum sowing density and to predictcrop yields.
The steps to be followed in precision farming are:
• Gathering/Collecting of information on the sub-�eld
• Analyzing the gathered �eld information
• Considering/Taking decision steps based on analyzed information
• Implementation/Development of these decisions
The software to be developed will provide reliable communication between three parties,namely the User (Farmer), the Logistics O�ce (Central O�ce) and the Vehicle (MobileTerminal) by using GIS and GPS technologies.
The working process of the software is as follows:
• First, the farmer sends his/her address, �eld and GIS information to the logisticso�ce.
• Next, the logistics o�ce sends the farmer �eld information to the vehicle.
• Finally, the vehicle �nishes the farmer �eld work.
The vehicle sends its location information to the logistics o�ce every 10 seconds via GPS.Based on this information, the logistics o�ce relays the farmer's �eld information to thevehicle closest to the �eld. This �eld information includes a GIS ID with the help of whichthe vehicle locates the farmer's �eld.
ii

In my thesis project, two di�erent software languages have been used. These are Del-phi (Delphi IDE) and J2ME (Netbeans IDE). Delphi is used to create the Graphical UserInterface (GUI) form/window(s) at the position of farmer, central o�ce and vehicle. J2MEallows the user to create an environment to extract the GPS information from the GPSreceiver.
My thesis project aims at providing reliable communication between farmer, logistics o�ceand vehicle and also reducing the idle times in waiting for vehicles.
The thesis contains eight chapters. The �rst chapter elaborates on the research back-ground and motivation as well as the problem statement, research objectives, researchquestions and methodology. The second chapter gives a comprehensive summary of therelated state-of-the-art of the following technologies: precision farming, mobile GIS, posi-tioning technologies and location-based services. The third chapter explains the softwaredevelopment process and programming basics that are related to the software developmentlife cycle, requirements engineering concepts of software requirements, designing conceptssuch as UML as well as database and programming design methodology.
The fourth chapter describes the development and implementation of the system designwith the help of UML design, database design and software architecture. The �fth chap-ter describes the testing of the system design. A GIS and GPS based real-time vehicletracking system and interfaces are established and a prototype is tested. The sixth chap-ter gives the conclusion and o�ers recommendations with respect to the research questions.
The seventh chapter presents the source code which has been used to implement the soft-ware. The eighth chapter gives the description of the hardware and software platforms thatare related to the following technologies: GIS, DBMS, IDE's, mobile terminals, servers andwireless communication system.
Keywords: Geographic Information System, Global Positioning System, Central O�ce,Mobile Terminal.
iii

Acknowledgments
First and formost I would like to thank Univ.-Prof. Dr.-Ing. Kyandoghere Kyamakyafor accepting my request to work in the PROGIS company and for his constant encourage-ment and his constant support, advice throughout my work. I would like to thank C.E.O ofthe company Dip.-Ing. W.H.Mayer for giving me an opportunity to work in the company.It was a great learning experience working with the other colleagues in the company.
The informal support and encouragement of many friends has been indispensable, andI would like particularly to acknowledge the contribution of Adarsh Samrat for his constantencouragement and assistance throughout my master's program.
Finally, I would like to express my special thanks of gratitude to my parents KanthaRao and Indira Devi for their moral, emotional, �nancial and unconditional support. Iwould also like to thank my brother who helped me a lot during my studies. I am heartilythankful to my late grandfather Gopal Rao Neelagiri and late former chief minister ofAndhra Pradesh Dr.Rajasekhara Reddy Yeduguri Sandinti who always inspired me towork hard and to be positive all times.
iv

Contents
1 Introduction 11.1 Background and Motivation . . . . . . . . . . . . . . . . . . . . . . . . . . . 11.2 Problem Statement, Objectives and Research questions . . . . . . . . . . . . 21.3 Methodology to solve the problems . . . . . . . . . . . . . . . . . . . . . . . 4
1.3.1 Methodology to reach objective 1 . . . . . . . . . . . . . . . . . . . . 41.3.2 Methodology to reach objective 2 . . . . . . . . . . . . . . . . . . . . 41.3.3 Methodology to reach objective 3 . . . . . . . . . . . . . . . . . . . . 51.3.4 Methodology to reach objective 4 . . . . . . . . . . . . . . . . . . . . 51.3.5 Methodology to reach objective 5 . . . . . . . . . . . . . . . . . . . . 61.3.6 Methodology to reach objective 6 . . . . . . . . . . . . . . . . . . . . 71.3.7 Methodology to reach objective 7 . . . . . . . . . . . . . . . . . . . . 7
1.4 Outline of the thesis . . . . . . . . . . . . . . . . . . . . . . . . . . . . . . . 8
2 A comprehensive summary of the related state-of-the-art 102.1 Precision Farming . . . . . . . . . . . . . . . . . . . . . . . . . . . . . . . . 10
2.1.1 Concept of Precision Farming . . . . . . . . . . . . . . . . . . . . . . 102.1.2 Goals of Precision Farming system . . . . . . . . . . . . . . . . . . . 102.1.3 Functionalities of Precision Farming system . . . . . . . . . . . . . . 112.1.4 Basic Tasks of Precision Farming . . . . . . . . . . . . . . . . . . . . 112.1.5 Basic required technologies in Precision Farming . . . . . . . . . . . 122.1.6 Requirements of wireless technologies in Precision farming . . . . . . 122.1.7 Communication system architecture . . . . . . . . . . . . . . . . . . 132.1.8 Reasons for not considering GSM based positioning . . . . . . . . . . 14
2.2 MOBILE GIS . . . . . . . . . . . . . . . . . . . . . . . . . . . . . . . . . . . 162.2.1 Introduction to GIS . . . . . . . . . . . . . . . . . . . . . . . . . . . 162.2.2 Key Components of GIS . . . . . . . . . . . . . . . . . . . . . . . . . 162.2.3 Key Functions of GIS . . . . . . . . . . . . . . . . . . . . . . . . . . 172.2.4 GIS Operations . . . . . . . . . . . . . . . . . . . . . . . . . . . . . . 172.2.5 What is Mobile GIS . . . . . . . . . . . . . . . . . . . . . . . . . . . 172.2.6 Why Mobile GIS . . . . . . . . . . . . . . . . . . . . . . . . . . . . . 182.2.7 Tasks of Mobile GIS . . . . . . . . . . . . . . . . . . . . . . . . . . . 182.2.8 Bene�ts of Mobile GIS . . . . . . . . . . . . . . . . . . . . . . . . . . 182.2.9 Key components of Mobile GIS . . . . . . . . . . . . . . . . . . . . . 192.2.10 Generic Architecture of Mobile GIS . . . . . . . . . . . . . . . . . . . 19
2.3 Positioning Technologies . . . . . . . . . . . . . . . . . . . . . . . . . . . . . 22
v

2.3.1 De�nitions and terms . . . . . . . . . . . . . . . . . . . . . . . . . . 222.3.2 Positioning methods . . . . . . . . . . . . . . . . . . . . . . . . . . . 222.3.3 Types of Positioning Systems in ITS . . . . . . . . . . . . . . . . . . 232.3.4 Introduction to GPS . . . . . . . . . . . . . . . . . . . . . . . . . . . 242.3.5 GPS Segments . . . . . . . . . . . . . . . . . . . . . . . . . . . . . . 252.3.6 Working process of GPS Technology . . . . . . . . . . . . . . . . . . 262.3.7 The GPS Error Budget . . . . . . . . . . . . . . . . . . . . . . . . . 282.3.8 DGPS Technology . . . . . . . . . . . . . . . . . . . . . . . . . . . . 292.3.9 RTK - GPS Technology . . . . . . . . . . . . . . . . . . . . . . . . . 292.3.10 Components description of GPS receiver . . . . . . . . . . . . . . . . 302.3.11 Cellular Networks based positioning systems . . . . . . . . . . . . . . 312.3.12 GSM positioning versus GPS positioning . . . . . . . . . . . . . . . . 34
2.4 Mobile Applications and/or Location-Based Services (LBS) . . . . . . . . . 352.4.1 Introduction to LBS . . . . . . . . . . . . . . . . . . . . . . . . . . . 352.4.2 Concepts in LBSs . . . . . . . . . . . . . . . . . . . . . . . . . . . . . 352.4.3 What are LBSs . . . . . . . . . . . . . . . . . . . . . . . . . . . . . . 362.4.4 LBS communication model . . . . . . . . . . . . . . . . . . . . . . . 37
3 Software Development Process and Programming Basics 393.1 Basics of software development process . . . . . . . . . . . . . . . . . . . . . 39
3.1.1 Requirements Analysis . . . . . . . . . . . . . . . . . . . . . . . . . . 393.1.2 Design . . . . . . . . . . . . . . . . . . . . . . . . . . . . . . . . . . . 413.1.3 Implementation . . . . . . . . . . . . . . . . . . . . . . . . . . . . . . 413.1.4 Testing . . . . . . . . . . . . . . . . . . . . . . . . . . . . . . . . . . 413.1.5 Maintenance . . . . . . . . . . . . . . . . . . . . . . . . . . . . . . . 41
3.2 Basics of the Requirement Engineering of Software systems . . . . . . . . . 433.2.1 Introduction to Requirements Engineering . . . . . . . . . . . . . . . 433.2.2 De�nition to Requirements Engineering . . . . . . . . . . . . . . . . 433.2.3 Requirements Engineering Process . . . . . . . . . . . . . . . . . . . 443.2.4 UML-Basics . . . . . . . . . . . . . . . . . . . . . . . . . . . . . . . . 453.2.5 Structural modeling . . . . . . . . . . . . . . . . . . . . . . . . . . . 453.2.6 Behavioral modeling . . . . . . . . . . . . . . . . . . . . . . . . . . . 46
3.3 SysML - Basics . . . . . . . . . . . . . . . . . . . . . . . . . . . . . . . . . . 483.3.1 Diagram Overview of SysML . . . . . . . . . . . . . . . . . . . . . . 48
3.4 Database Design basics/methodology . . . . . . . . . . . . . . . . . . . . . . 493.4.1 Elements of Relational Database . . . . . . . . . . . . . . . . . . . . 503.4.2 Table Relationships . . . . . . . . . . . . . . . . . . . . . . . . . . . 503.4.3 Database Design Basics: . . . . . . . . . . . . . . . . . . . . . . . . . 50
3.5 Programming Design (basics/methodology) . . . . . . . . . . . . . . . . . . 513.5.1 Algorithms . . . . . . . . . . . . . . . . . . . . . . . . . . . . . . . . 513.5.2 Software Architecture . . . . . . . . . . . . . . . . . . . . . . . . . . 52
3.6 Software Testing . . . . . . . . . . . . . . . . . . . . . . . . . . . . . . . . . 533.6.1 Software Testing Principles . . . . . . . . . . . . . . . . . . . . . . . 543.6.2 Possible error types found by Software Testing . . . . . . . . . . . . 54
vi
4 Software Design and Implementation Process 564.1 UML design . . . . . . . . . . . . . . . . . . . . . . . . . . . . . . . . . . . . 56
4.1.1 Use-case diagram . . . . . . . . . . . . . . . . . . . . . . . . . . . . . 564.1.2 Class diagram . . . . . . . . . . . . . . . . . . . . . . . . . . . . . . . 574.1.3 Object diagram . . . . . . . . . . . . . . . . . . . . . . . . . . . . . . 584.1.4 Component diagram . . . . . . . . . . . . . . . . . . . . . . . . . . . 584.1.5 Deployment diagram . . . . . . . . . . . . . . . . . . . . . . . . . . . 594.1.6 Sequence diagram . . . . . . . . . . . . . . . . . . . . . . . . . . . . 594.1.7 Collaboration diagram . . . . . . . . . . . . . . . . . . . . . . . . . . 594.1.8 State diagram . . . . . . . . . . . . . . . . . . . . . . . . . . . . . . . 614.1.9 Activity diagram . . . . . . . . . . . . . . . . . . . . . . . . . . . . . 61
4.2 DB design . . . . . . . . . . . . . . . . . . . . . . . . . . . . . . . . . . . . . 634.3 Software architecture . . . . . . . . . . . . . . . . . . . . . . . . . . . . . . . 65
4.3.1 Out�ow of software architecture . . . . . . . . . . . . . . . . . . . . 654.3.2 Internal software architecture at farmer side . . . . . . . . . . . . . . 664.3.3 Internal software architecture at Logistics O�ce . . . . . . . . . . . 674.3.4 Internal software architecture at Vehicle . . . . . . . . . . . . . . . . 68
4.4 Selection of the appropriate IDE's . . . . . . . . . . . . . . . . . . . . . . . 694.5 Source code for software implementation . . . . . . . . . . . . . . . . . . . . 69
5 Testing and Interpretation of results 705.1 Testing of the software implemented . . . . . . . . . . . . . . . . . . . . . . 70
5.1.1 Black-box testing: . . . . . . . . . . . . . . . . . . . . . . . . . . . . 715.1.2 White-box testing: . . . . . . . . . . . . . . . . . . . . . . . . . . . . 715.1.3 Interpretation of the results when Black-box testing is applied . . . . 715.1.4 Interpretation of the results when White box testing is applied . . . 72
5.2 Comment on tests conducted . . . . . . . . . . . . . . . . . . . . . . . . . . 745.3 Software implementation process . . . . . . . . . . . . . . . . . . . . . . . . 74
5.3.1 Graphical User Interface of the software developed . . . . . . . . . . 74
6 Conclusion 84
7 Annex1 - Code implementation(Delphi, J2ME) 86
8 Annex2 - Description of the Hardware and Software Platforms 1138.1 Geographic Information System . . . . . . . . . . . . . . . . . . . . . . . . . 113
8.1.1 WinGIS . . . . . . . . . . . . . . . . . . . . . . . . . . . . . . . . . . 1148.2 DBMS (Microsoft Access, MySQL, PostgresSQL) . . . . . . . . . . . . . . . 115
8.2.1 Database Types . . . . . . . . . . . . . . . . . . . . . . . . . . . . . . 1168.2.2 Microsoft Access Database . . . . . . . . . . . . . . . . . . . . . . . . 1178.2.3 MySQL Database . . . . . . . . . . . . . . . . . . . . . . . . . . . . . 1178.2.4 PostgreSQL Database . . . . . . . . . . . . . . . . . . . . . . . . . . 119
8.3 IDE'S (Delphi 6.0, Netbeans 6.7): . . . . . . . . . . . . . . . . . . . . . . . . 1198.3.1 Delphi IDE . . . . . . . . . . . . . . . . . . . . . . . . . . . . . . . . 1198.3.2 Netbeans IDE . . . . . . . . . . . . . . . . . . . . . . . . . . . . . . . 124
8.4 Mobile Terminals . . . . . . . . . . . . . . . . . . . . . . . . . . . . . . . . . 1278.4.1 E71 Mobile device: . . . . . . . . . . . . . . . . . . . . . . . . . . . . 128
vii

8.4.2 N91 Mobile device: . . . . . . . . . . . . . . . . . . . . . . . . . . . . 1298.5 Server . . . . . . . . . . . . . . . . . . . . . . . . . . . . . . . . . . . . . . . 1298.6 Wireless Communication System . . . . . . . . . . . . . . . . . . . . . . . . 130
8.6.1 Key bene�ts of GPRS . . . . . . . . . . . . . . . . . . . . . . . . . . 1308.6.2 GPRS Network . . . . . . . . . . . . . . . . . . . . . . . . . . . . . . 131
Bibliography 132
viii

List of Figures
1.1 Flow Diagram of Methodology. . . . . . . . . . . . . . . . . . . . . . . . . . 3
2.1 Wireless Communication techniques. . . . . . . . . . . . . . . . . . . . . . . 132.2 Communication System Architecture. . . . . . . . . . . . . . . . . . . . . . . 152.3 Generic architecture of mobile GIS. . . . . . . . . . . . . . . . . . . . . . . . 192.4 Di�erential GPS System. . . . . . . . . . . . . . . . . . . . . . . . . . . . . . 292.5 Real-Time Kinematic GPS. . . . . . . . . . . . . . . . . . . . . . . . . . . . 302.6 The generic block diagram GPS Receiver. . . . . . . . . . . . . . . . . . . . 312.7 Cells in the GSM network. . . . . . . . . . . . . . . . . . . . . . . . . . . . . 342.8 General LBS communication. . . . . . . . . . . . . . . . . . . . . . . . . . . 37
3.1 A simple view of software development. . . . . . . . . . . . . . . . . . . . . 403.2 The Waterfall model. . . . . . . . . . . . . . . . . . . . . . . . . . . . . . . . 423.3 The process of design from the present through to future systems. . . . . . . 433.4 Activities within requirements. . . . . . . . . . . . . . . . . . . . . . . . . . 443.5 UML vs SysML. . . . . . . . . . . . . . . . . . . . . . . . . . . . . . . . . . 483.6 SysML Diagram Taxonomy. . . . . . . . . . . . . . . . . . . . . . . . . . . . 49
4.1 UML use-case diagram. . . . . . . . . . . . . . . . . . . . . . . . . . . . . . 564.2 UML class diagram. . . . . . . . . . . . . . . . . . . . . . . . . . . . . . . . 574.3 UML object diagram. . . . . . . . . . . . . . . . . . . . . . . . . . . . . . . 584.4 UML component diagram. . . . . . . . . . . . . . . . . . . . . . . . . . . . . 594.5 UML deployment diagram. . . . . . . . . . . . . . . . . . . . . . . . . . . . 604.6 UML sequence diagram. . . . . . . . . . . . . . . . . . . . . . . . . . . . . . 604.7 UML collaboration diagram. . . . . . . . . . . . . . . . . . . . . . . . . . . . 614.8 UML state diagram. . . . . . . . . . . . . . . . . . . . . . . . . . . . . . . . 624.9 UML activity diagram. . . . . . . . . . . . . . . . . . . . . . . . . . . . . . . 624.10 Database Form. . . . . . . . . . . . . . . . . . . . . . . . . . . . . . . . . . . 634.11 Table designing view. . . . . . . . . . . . . . . . . . . . . . . . . . . . . . . . 644.12 Store the data values in table. . . . . . . . . . . . . . . . . . . . . . . . . . . 644.13 Out�ow of software architecture. . . . . . . . . . . . . . . . . . . . . . . . . 664.14 Internal software architecture at farmer. . . . . . . . . . . . . . . . . . . . . 674.15 Internal software architecture at logistics side. . . . . . . . . . . . . . . . . . 684.16 Internal software architecture at vehicle side. . . . . . . . . . . . . . . . . . 69
5.1 Test bed process. . . . . . . . . . . . . . . . . . . . . . . . . . . . . . . . . . 705.2 Black-box testing approach. . . . . . . . . . . . . . . . . . . . . . . . . . . . 72
ix

5.3 The GUI testing. . . . . . . . . . . . . . . . . . . . . . . . . . . . . . . . . . 735.4 White-box testing approach. . . . . . . . . . . . . . . . . . . . . . . . . . . . 735.5 GUI of the software. . . . . . . . . . . . . . . . . . . . . . . . . . . . . . . . 755.6 GUI at the central o�ce. . . . . . . . . . . . . . . . . . . . . . . . . . . . . . 765.7 Unplanned Task Processed form. . . . . . . . . . . . . . . . . . . . . . . . . 775.8 Unplanned Task Processed form after click the check box. . . . . . . . . . . 775.9 Unplanned Task Processed form with updated the selected �eld task. . . . . 785.10 Updated unplanned task processed information. . . . . . . . . . . . . . . . . 785.11 Planning a Task and Info - Fenster information. . . . . . . . . . . . . . . . . 795.12 Planning a Task window. . . . . . . . . . . . . . . . . . . . . . . . . . . . . 795.13 Selektierte Schläge an Fahrzeuge Senden information. . . . . . . . . . . . . . 805.14 New user information. . . . . . . . . . . . . . . . . . . . . . . . . . . . . . . 805.15 New user address information. . . . . . . . . . . . . . . . . . . . . . . . . . . 815.16 Filter window. . . . . . . . . . . . . . . . . . . . . . . . . . . . . . . . . . . . 815.17 Mobile terminal form. . . . . . . . . . . . . . . . . . . . . . . . . . . . . . . 825.18 JobManagement window at mobile terminal. . . . . . . . . . . . . . . . . . . 835.19 GPS Information. . . . . . . . . . . . . . . . . . . . . . . . . . . . . . . . . . 83
8.1 Delphi IDE. . . . . . . . . . . . . . . . . . . . . . . . . . . . . . . . . . . . . 1208.2 Netbeans IDE. . . . . . . . . . . . . . . . . . . . . . . . . . . . . . . . . . . 1258.3 Project File. . . . . . . . . . . . . . . . . . . . . . . . . . . . . . . . . . . . . 1258.4 Navigator. . . . . . . . . . . . . . . . . . . . . . . . . . . . . . . . . . . . . . 1268.5 Code Editor. . . . . . . . . . . . . . . . . . . . . . . . . . . . . . . . . . . . 1268.6 Mobile Device Screen. . . . . . . . . . . . . . . . . . . . . . . . . . . . . . . 1278.7 Flow of Components. . . . . . . . . . . . . . . . . . . . . . . . . . . . . . . . 1278.8 Output Toolbox. . . . . . . . . . . . . . . . . . . . . . . . . . . . . . . . . . 1288.9 GPRS Network. . . . . . . . . . . . . . . . . . . . . . . . . . . . . . . . . . . 131
x

List of Tables
2.1 Comparison between wireless LAN, Bluetooth and ZigBee. . . . . . . . . . . 13
xi
Chapter 1
Introduction
1.1 Background and Motivation
Development of precision farming was �rst started in Europe. Additionally with new tech-nologies, precision farming was taken up in the USA and developed at great pace. Over thepast several years, agricultural machinery has been developed to high technical standardsin accordance with the enhancement of precision farming. The term 'Teil�ächenwirtschaft'is the German term for precision farming. In summary the following points were achieved:
• New types of machines (tractors) have been developed whereby an operator can workall day in a comfortable environment.
• Application equipments such as spreaders and sprayers have developed to achieveuniform application of plant protection chemicals and fertilizers.
Key Components of a precision farming typically include:
• A yield monitor
• Intensive testing of plant issues or soils with in a �eld
• Equipment for locating a position within a �eld via the Global Positioning System(GPS).
• Variable-rate technologies for seed, pesticides, fertilizer, and irrigation water that arecontinually computer adjusted for various parts of the �eld.
• A computer to manipulate and store spatial data using some form of GeographicInformation System (GIS) software.
The advancements in agriculture technology replaced the tools and the equipments usedfor farming resulting in higher yields. The basic concept of the precision farming is thecollection of the data and making decisions using the collective data has been around formany years. One can work out on small �elds very easily without this technology. As thesize of the farming increases this becomes a problem that should be handled to increasethe yields. Hence precision farming comes into play where the size of the farms matter.GIS is one of the �rst developed tools of the precision farming. It was used by the research
1

CHAPTER 1. INTRODUCTION 2
institutions at the start and was later commercialized. The maps designed in GIS can beuploaded into the GPS system and hence GPS system can be used as a source of the pathfor the automated guided vehicle systems. Thus, GPS played a major role in precisionfarming.
1.2 Problem Statement, Objectives and Research questions
The main focus of this thesis work is to develop a Tracking System application for support-ing various processes involved in the real-time operations of a modern precision farmingsystem. This tracking will basically involve two front-end types.
The �rst front-end is a mobile terminal concept which contains/involves/embed thefollowing core technologies:
• An appropriate GUI.
• GSM and GPRS communication capabilities.
• The "mobile GIS" technology.
• GPS positioning capability.
This front-end will be located in diverse vehicles and tractors that are involved in di�erentfarming and/or transportation processes in the frame of precision farming.
The second front-end type is a desk-top based interface for the farmer, through whichhe should interact with the tracking system and the overall precision-farming system,both in real-time and in o�-line mode. Through this interface the farmer can, amongstother things, either formulate his farming needs/requests or check the processing statusof his requests by the precision farming system. Concerning the back-end, the mobileand tracking application to be developed should e�ciently communicate with an alreadyexisting server, the so-called "Logistics O�ce Server" which is part of a complex precisionfarming IT system.
Therefore, this thesis is mainly addressing, in the core, the complete Systems Engi-neering of this tracking system involving a mobile application for the real-time supportof precision farming operations. This results in the following speci�c objectives and/orresearch issues:
1. Summarize the basic principles and the state-of-the-art of precision farming and ex-tract to formulate the related requirements (performance, availability, system archi-tecture and so on) with regard to wireless communication technologies, GeographicInformation Systems, and Global Positioning Systems. It should be discussed whyGPS based positioning is not considered here.
2. Summarize the basic principles and the related state-of-the-art of the GIS technologywith a focus on mobile GIS.

CHAPTER 1. INTRODUCTION 3
3. Summarize the basic principles and the related state-of-the-art of the Positioningtechnologies with a focus on GPS and GSM based positioning.
4. Summarize the basic principles and the related state-of-the-art of the so-called mobileapplications (and/or location-based Services).
5. Summarize the basics of the software-related Systems Engineering.
6. Apply the Systems Engineering methods to the case "Tracking System". A compre-hensive design is conducted by using the Systems Engineering instruments presentedin the objective 5.
7. Test the software system developed by applying the methods presented in the objec-tive 6.
Figure 1.1: Flow Diagram of Methodology.
CHAPTER 1. INTRODUCTION 4
1.3 Methodology to solve the problems
1.3.1 Methodology to reach objective 1
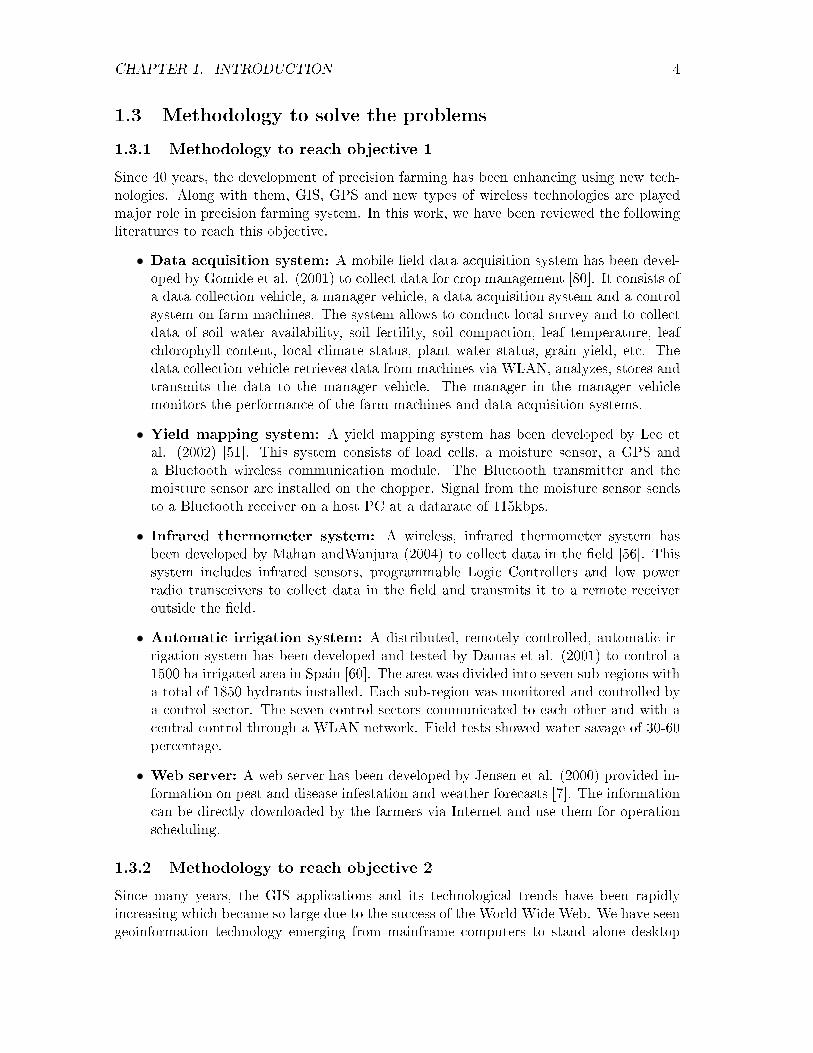
Since 40 years, the development of precision farming has been enhancing using new tech-nologies. Along with them, GIS, GPS and new types of wireless technologies are playedmajor role in precision farming system. In this work, we have been reviewed the followingliteratures to reach this objective.
• Data acquisition system: A mobile �eld data acquisition system has been devel-oped by Gomide et al. (2001) to collect data for crop management [80]. It consists ofa data collection vehicle, a manager vehicle, a data acquisition system and a controlsystem on farm machines. The system allows to conduct local survey and to collectdata of soil water availability, soil fertility, soil compaction, leaf temperature, leafchlorophyll content, local climate status, plant water status, grain yield, etc. Thedata collection vehicle retrieves data from machines via WLAN, analyzes, stores andtransmits the data to the manager vehicle. The manager in the manager vehiclemonitors the performance of the farm machines and data acquisition systems.
• Yield mapping system: A yield mapping system has been developed by Lee etal. (2002) [51]. This system consists of load cells, a moisture sensor, a GPS anda Bluetooth wireless communication module. The Bluetooth transmitter and themoisture sensor are installed on the chopper. Signal from the moisture sensor sendsto a Bluetooth receiver on a host PC at a datarate of 115kbps.
• Infrared thermometer system: A wireless, infrared thermometer system hasbeen developed by Mahan andWanjura (2004) to collect data in the �eld [56]. Thissystem includes infrared sensors, programmable Logic Controllers and low powerradio transceivers to collect data in the �eld and transmits it to a remote receiveroutside the �eld.
• Automatic irrigation system: A distributed, remotely controlled, automatic ir-rigation system has been developed and tested by Damas et al. (2001) to control a1500 ha irrigated area in Spain [60]. The area was divided into seven sub-regions witha total of 1850 hydrants installed. Each sub-region was monitored and controlled bya control sector. The seven control sectors communicated to each other and with acentral control through a WLAN network. Field tests showed water savage of 30-60percentage.
• Web server: A web server has been developed by Jensen et al. (2000) provided in-formation on pest and disease infestation and weather forecasts [7]. The informationcan be directly downloaded by the farmers via Internet and use them for operationscheduling.
1.3.2 Methodology to reach objective 2
Since many years, the GIS applications and its technological trends have been rapidlyincreasing which became so large due to the success of the World Wide Web. We have seengeoinformation technology emerging from mainframe computers to stand alone desktop
CHAPTER 1. INTRODUCTION 5
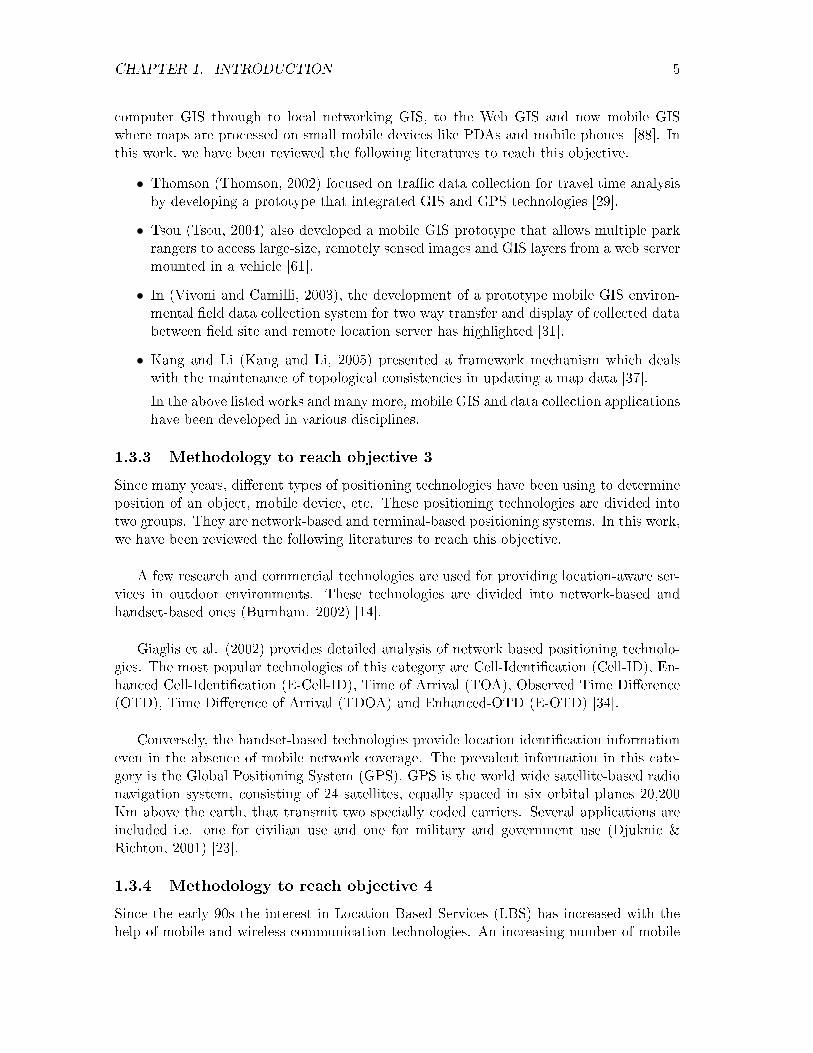
computer GIS through to local networking GIS, to the Web GIS and now mobile GISwhere maps are processed on small mobile devices like PDAs and mobile phones [88]. Inthis work, we have been reviewed the following literatures to reach this objective.
• Thomson (Thomson, 2002) focused on tra�c data collection for travel time analysisby developing a prototype that integrated GIS and GPS technologies [29].
• Tsou (Tsou, 2004) also developed a mobile GIS prototype that allows multiple parkrangers to access large-size, remotely sensed images and GIS layers from a web servermounted in a vehicle [61].
• In (Vivoni and Camilli, 2003), the development of a prototype mobile GIS environ-mental �eld data collection system for two way transfer and display of collected databetween �eld site and remote location server has highlighted [31].
• Kang and Li (Kang and Li, 2005) presented a framework mechanism which dealswith the maintenance of topological consistencies in updating a map data [37].
In the above listed works and many more, mobile GIS and data collection applicationshave been developed in various disciplines.
1.3.3 Methodology to reach objective 3
Since many years, di�erent types of positioning technologies have been using to determineposition of an object, mobile device, etc. These positioning technologies are divided intotwo groups. They are network-based and terminal-based positioning systems. In this work,we have been reviewed the following literatures to reach this objective.
A few research and commercial technologies are used for providing location-aware ser-vices in outdoor environments. These technologies are divided into network-based andhandset-based ones (Burnham. 2002) [14].
Giaglis et al. (2002) provides detailed analysis of network based positioning technolo-gies. The most popular technologies of this category are Cell-Identi�cation (Cell-ID), En-hanced Cell-Identi�cation (E-Cell-ID), Time of Arrival (TOA), Observed Time Di�erence(OTD), Time Di�erence of Arrival (TDOA) and Enhanced-OTD (E-OTD) [34].
Conversely, the handset-based technologies provide location identi�cation informationeven in the absence of mobile network coverage. The prevalent information in this cate-gory is the Global Positioning System (GPS). GPS is the world wide satellite-based radionavigation system, consisting of 24 satellites, equally spaced in six orbital planes 20,200Km above the earth, that transmit two specially coded carriers. Several applications areincluded i.e. one for civilian use and one for military and government use (Djuknic &Richton, 2001) [23].
1.3.4 Methodology to reach objective 4
Since the early 90s the interest in Location Based Services (LBS) has increased with thehelp of mobile and wireless communication technologies. An increasing number of mobile
CHAPTER 1. INTRODUCTION 6
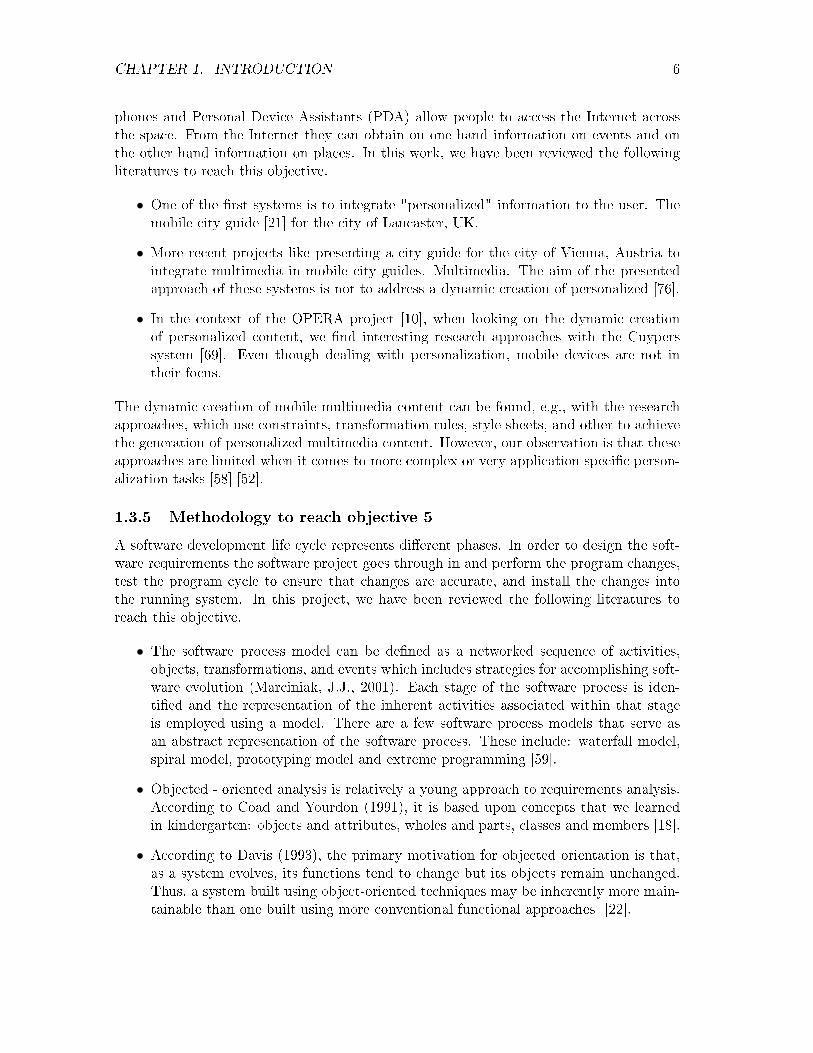
phones and Personal Device Assistants (PDA) allow people to access the Internet acrossthe space. From the Internet they can obtain on one hand information on events and onthe other hand information on places. In this work, we have been reviewed the followingliteratures to reach this objective.
• One of the �rst systems is to integrate "personalized" information to the user. Themobile city guide [21] for the city of Lancaster, UK.
• More recent projects like presenting a city guide for the city of Vienna, Austria tointegrate multimedia in mobile city guides. Multimedia. The aim of the presentedapproach of these systems is not to address a dynamic creation of personalized [76].
• In the context of the OPERA project [10], when looking on the dynamic creationof personalized content, we �nd interesting research approaches with the Cuyperssystem [69]. Even though dealing with personalization, mobile devices are not intheir focus.
The dynamic creation of mobile multimedia content can be found, e.g., with the researchapproaches, which use constraints, transformation rules, style sheets, and other to achievethe generation of personalized multimedia content. However, our observation is that theseapproaches are limited when it comes to more complex or very application speci�c person-alization tasks [58] [52].
1.3.5 Methodology to reach objective 5
A software development life cycle represents di�erent phases. In order to design the soft-ware requirements the software project goes through in and perform the program changes,test the program cycle to ensure that changes are accurate, and install the changes intothe running system. In this project, we have been reviewed the following literatures toreach this objective.
• The software process model can be de�ned as a networked sequence of activities,objects, transformations, and events which includes strategies for accomplishing soft-ware evolution (Marciniak, J.J., 2001). Each stage of the software process is iden-ti�ed and the representation of the inherent activities associated within that stageis employed using a model. There are a few software process models that serve asan abstract representation of the software process. These include: waterfall model,spiral model, prototyping model and extreme programming [59].
• Objected - oriented analysis is relatively a young approach to requirements analysis.According to Coad and Yourdon (1991), it is based upon concepts that we learnedin kindergarten: objects and attributes, wholes and parts, classes and members [18].
• According to Davis (1993), the primary motivation for objected orientation is that,as a system evolves, its functions tend to change but its objects remain unchanged.Thus, a system built using object-oriented techniques may be inherently more main-tainable than one built using more conventional functional approaches [22].
CHAPTER 1. INTRODUCTION 7
1.3.6 Methodology to reach objective 6
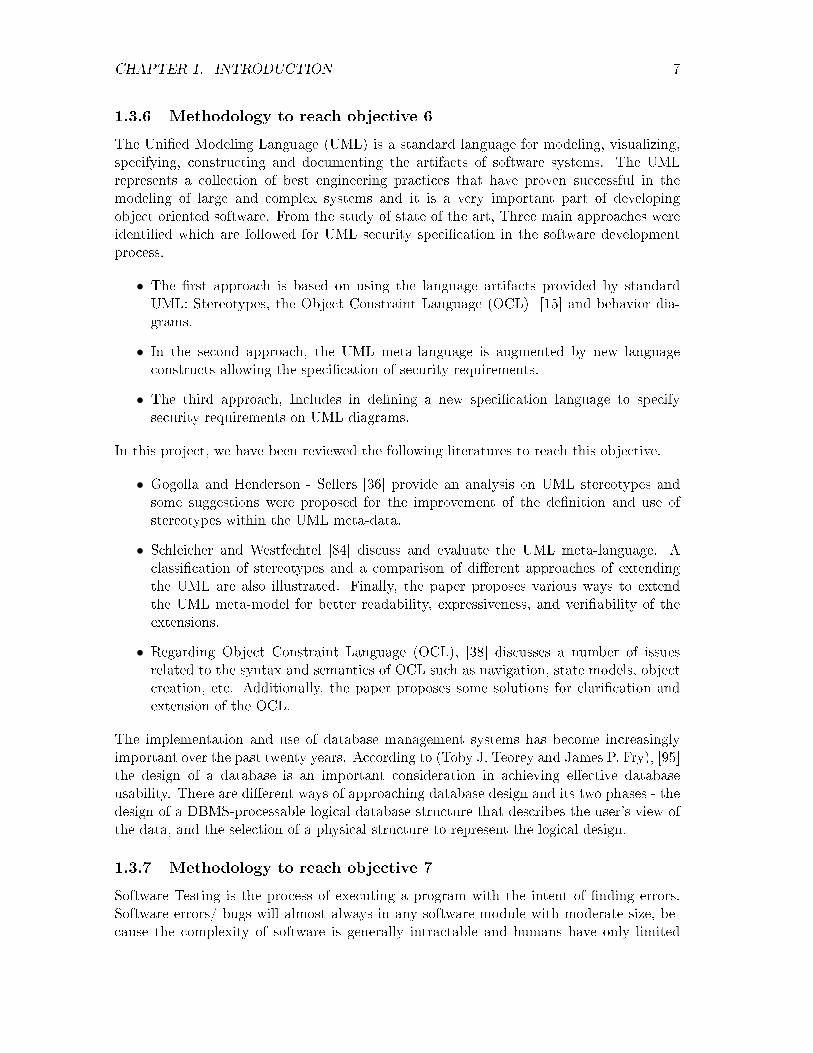
The Uni�ed Modeling Language (UML) is a standard language for modeling, visualizing,specifying, constructing and documenting the artifacts of software systems. The UMLrepresents a collection of best engineering practices that have proven successful in themodeling of large and complex systems and it is a very important part of developingobject oriented software. From the study of state of the art, Three main approaches wereidenti�ed which are followed for UML security speci�cation in the software developmentprocess.
• The �rst approach is based on using the language artifacts provided by standardUML: Stereotypes, the Object Constraint Language (OCL) [15] and behavior dia-grams.
• In the second approach, the UML meta-language is augmented by new languageconstructs allowing the speci�cation of security requirements.
• The third approach, Includes in de�ning a new speci�cation language to specifysecurity requirements on UML diagrams.
In this project, we have been reviewed the following literatures to reach this objective.
• Gogolla and Henderson - Sellers [36] provide an analysis on UML stereotypes andsome suggestions were proposed for the improvement of the de�nition and use ofstereotypes within the UML meta-data.
• Schleicher and Westfechtel [84] discuss and evaluate the UML meta-language. Aclassi�cation of stereotypes and a comparison of di�erent approaches of extendingthe UML are also illustrated. Finally, the paper proposes various ways to extendthe UML meta-model for better readability, expressiveness, and veri�ability of theextensions.
• Regarding Object Constraint Language (OCL), [38] discusses a number of issuesrelated to the syntax and semantics of OCL such as navigation, state models, objectcreation, etc. Additionally, the paper proposes some solutions for clari�cation andextension of the OCL.
The implementation and use of database management systems has become increasinglyimportant over the past twenty years. According to (Toby J. Teorey and James P. Fry), [95]the design of a database is an important consideration in achieving e�ective databaseusability. There are di�erent ways of approaching database design and its two phases - thedesign of a DBMS-processable logical database structure that describes the user's view ofthe data, and the selection of a physical structure to represent the logical design.
1.3.7 Methodology to reach objective 7
Software Testing is the process of executing a program with the intent of �nding errors.Software errors/ bugs will almost always in any software module with moderate size, be-cause the complexity of software is generally intractable and humans have only limited

CHAPTER 1. INTRODUCTION 8
to manage complexity. In this work, we reviewed the following literatures to reach thisobjective.
• The black-box approach is a testing method in which test data are derived from thespeci�ed functional requirements without regard to the �nal program structure [74].It is also termed data-driven, input/output driven [64], or requirements based test-ing [41].
• Contrary to black-box testing, software is viewed as a white-box, as the structure and�ow of the software under test are visible to the tester. Testing plans are made ac-cording to the details of the software implementation, such as programming language,logic, and styles. Test cases are derived from the program structure. White-box test-ing is also called glass-box testing, logic-driven testing [64], or design-based testing[41].
• According to Koutsoukos (2004), there are two types of service-oriented reengineer-ing. There are: Black box (does not need knowledge of the code) and White box(source code is modi�ed or changed) [49]. White box method can be seen as a morepermanent solution than block box but extra time may be needed to understandthe code if the system is not correctly documented [39]. Black box methods can bedi�cult to apply when business logic is tied up with presentation logic as softwareservices require clean functional interfaces [49].
1.4 Outline of the thesis
The thesis contains eight chapters namely: introduction as chapter 1; a comprehensivesummary of the related state-of-the-art as chapter 2; software development process andprogramming basics as chapter 3; software design and implementation process as chapter4; testing and interpretation of results as chapter 5; Conclusion as chapter 6; source codeimplementation as Annex 1 and description of the hardware and software platforms asAnnex 2.
• Chapter 2 gives a comprehensive summary of the related state-of-the-art of the fol-lowing technologies: precision farming, mobile GIS, positioning technologies andlocation-based services.
• Chapter 3 explains the software development process and programming basics thatare related to the software development life cycle, requirements engineering conceptsof software requirements, designing concepts such as UML as well as database andprogramming design methodology.
• Chapter 4 describes the development and implementation of the system design withthe help of UML design, database design and software architecture.
• Chapter 5 describes the testing of the system design. A GIS and GPS based real-timevehicle tracking system and interfaces are established and a prototype is tested.
• Chapter 6 gives the conclusion and o�ers recommendations with respect to the re-search questions.

CHAPTER 1. INTRODUCTION 9
• Chapter 7 presents the source code which has been used to implement the software.
• Chapter 8 gives the description of the hardware and software platforms that arerelated to the following technologies: GIS, GPS, DBMS, IDE's, mobile terminals,servers and wireless communication system.

Chapter 2
A comprehensive summary of therelated state-of-the-art
2.1 Precision Farming
This sub-chapter summarizes the basic principles and the related state-of-the-art of preci-sion farming and formulates the required parameters including performance, availability,system architecture, precision, cost and device size that have with regard to wireless com-munication technologies, Geographic Information System, and positioning technologies.
2.1.1 Concept of Precision Farming
Precision farming is also called as precision agriculture. It is intensive cultivation tech-nology of modern agriculture in order to obtain high grade, high production and highe�ciency by using modern information technology [100].
In other words, the concept of precision farming can be de�ned as a management prac-tice with the potential to increase pro�ts by utilizing more precise information [35]. GPStechnology makes it possible for farmers to measure yields and responses to managementpractices within their own �elds. By using GPS, it is possible to acquire numerous measure-ment of environmental or yield conditions, and fuse them with computer-aided collection,and prepare maps of yield characteristics.
2.1.2 Goals of Precision Farming system
The main goals of precision farming are:
• Improving water quality by targeting areas for reduced nutrient and pesticide appli-cation.
• Enhancing soil quality through reduced erosion and soil compaction.
• Emerging conservation through accurate and e�cient application of crop inputs.
10

CHAPTER 2. A COMPREHENSIVE SUMMARYOF THE RELATED STATE-OF-THE-ART11
2.1.3 Functionalities of Precision Farming system
Basic functionalities of precision farming system are [48]:
• Support for data collection by services organizations
• Support for data collection by farmers
• Data access for farmers
• Support for fertilization application by service organization
• Yield forecasting for farmers
2.1.4 Basic Tasks of Precision Farming
The basic principle of precision farming technology is an exact positional controlling offertilization with accuracy upto a few meters [48]. Such that process requires a big amountof data to be collected that enables controlling of the whole process.The total process ofprecision farming can be divided into:
• Data capturing
• Data access
• Data analysis
• Variable applications of fertilizers
• Variable applications of pesticides
• Variable seeding
This process can be understood as a cyclic optimization process, with some control points.Quality of the process can be measured by using these control points. Di�erent models ofoptimization are used [48]:
• Minimum cost
• Maximum economy
• Optimization of expenses
• Ecological e�ects

CHAPTER 2. A COMPREHENSIVE SUMMARYOF THE RELATED STATE-OF-THE-ART12
2.1.5 Basic required technologies in Precision Farming
Basic required technologies in precision farming system are:
• PC computers
• Hand held computers
• Notebooks
• Board computers in farm machines
• Net communication
• Internet
• Mobile phones
• GPS (Global Positioning system)
• GIS (Geographic Information System)
2.1.6 Requirements of wireless technologies in Precision farming
The use of wireless technologies is not a new concept. In the world around as, di�erenttypes of wireless technologies were already developed and many industries/companies aredeveloping new technologies like Mobile WiMAX and LTE by enhancing the datarate andthe coverage area with reducing the cost. In agriculture, types of wireless technologies arebeing used in di�erent ranges:
• IrDA (Infrared Data Association) uses infrared light for short range, point-to-pointcommunications.
• WPAN (Wireless Personal Area Network) for short range, point-to-multi-point com-munications, such as Bluetooth and ZigBee.
• WLAN (Wireless Local Area Network) for mid-range, multi-hop.
• Long-distance cellular phone systems, such as GSM/GPRS and CDMA [67].
Among them, the standards for wireless LAN, IEEE 802.11b (WiFi) [42] and wireless PAN,IEEE 802.15.1 (Bluetooth) [43] and IEEE 802.15.4 (ZigBee) [44], are most widely used formeasurement and automation application. Wireless communication standards are classi�edin �gure 2.1. All these standards use radio bands, including the MHz bands of 868-870MHz (Europe), 902-928 MHz (US), 433.05-434.79 (US and Europe) and 314-316 MHz(Japan) and the GHz bands of 2.400-2.4835 GHz (worldwide acceptable). Radio waveswith a lower frequency allow a longer transmission range and easily absorbed by variousmaterials, such as water and trees. Comparison of features between LAN, Bluetooth andZigBee are as shown in Table 2.1 [67].

CHAPTER 2. A COMPREHENSIVE SUMMARYOF THE RELATED STATE-OF-THE-ART13
Figure 2.1: Wireless Communication techniques.
Feature WiFi(IEEE 802.11b) Bluetooth(IEEE 802.15.1) ZigBee(IEEE 802.15.4)
Radio DSSS FHSS DSSSDatarate 11 Mbps 1 Mbps 250 kbpsLatency Up to 3s Up to 10s 30msRange(m) 100 10 70Extendability No roaming Yes Yes
Table 2.1: Comparison between wireless LAN, Bluetooth and ZigBee.
2.1.7 Communication system architecture
Communication system architecture is shown in �gure 2.2 [48]. This architecture consistsof PDA, Mobile PC, GSM/GPRS Provider, Central Computer, No Wireless Clients andInternet Provider. Communication between all of them is illustrated as follows:
• PDA (Personal Device Assistant) is also known as packet PC. This requires internetbrowser for accessing/updating information in the �eld.
• Mobile PC is any laptop. This requires Windows OS, Internet browser, GIS toolsand GPS.
• Central Computer is used to store data. This is an Internet and database server ofthe organization. Requirements of central computer are as follows:
� Windows NT/2000
� Internet server Apache
� Map server and Map script
� Geomedia webmap applications
� Mapserver applications
� GIS data collection
• EUROTEL, OSKAR, PAEGAS are GSM/GPRS providers.
• Internet provider requires WAP applications and Mapserver applications.

CHAPTER 2. A COMPREHENSIVE SUMMARYOF THE RELATED STATE-OF-THE-ART14
• No wireless clients are Personal computers. Requirements of PCs are:
� Internet browser� Windows OS� GIS tools� Network Card� Modem for Internet Access.
• For the wireless communication, the server (central computer) is connected to a GSMmodem with the datarate of 9.6/14.4 kb/s.
• For the wired communication, the central computer of the organization is connectedto an ISDN modem.
• Wireless communication requirements:
� GSM Phone (IrDA Port or Serial cable)∗ Eurotel provides datarate of 14.4 kb/s∗ Paegas provides datarate of 9.6 kb/s∗ Oskar provides datarate of 9.6 kb/s
� GPRS provides datarate of 20 to 115 kb/s
2.1.8 Reasons for not considering GSM based positioning
This section discusses or expresses the information about the reasons for not consideringthe GSM based positioning by taking or considering two types of GSM related positioningtechnologies such as self-positioning and remote-positioning individually.
GSM self-positioning:
• It is expensive to provide GSM remote coverage in remote areas, because GSM tendsto operate with very few base stations in these areas.
• The accuracy is unlikely to be as good as Di�erential Global Positioning System(DGPS) [24].
GSM remote positioning:
• There is limit to the number of users that GSM remote positioning can support.
• Poor coverage in rural areas.
• The accuracy will not be as good as Di�erential Global Positioning System (DGPS) [24].
Summary: This sub-chapter has summarized the basic concept of precision farming andmainly concentrated on principles including tasks, architecture and functionalities TheGIS, GPS and wireless technologies plays major role in precision farming system for datacollection and data processing. Finally, this sub-chapter summarizes that the GPS basedpositioning is more precise than GSM based positioning and works in areas which do nothave GSM coverage as well.

CHAPTER 2. A COMPREHENSIVE SUMMARYOF THE RELATED STATE-OF-THE-ART15
Figure 2.2: Communication System Architecture.

CHAPTER 2. A COMPREHENSIVE SUMMARYOF THE RELATED STATE-OF-THE-ART16
2.2 MOBILE GIS
This sub-chapter summarizes the basic principles and the related state-of-the-art of the GIStechnology with a speci�c focus on mobile GIS.
2.2.1 Introduction to GIS
Geographic Information System (GIS) can be looked at as information system that is usedto store, analyze, capture and manipulate geographic information for decision making.GIS technology started in 1950s and is seen in many applications such as land surveying,remote sensing, aerial photography, health and country planning. Development of GIS hasevolved into internet and now mobile GIS today [91].
De�nition of GIS: A system of hardware, software, and procedures designed to sup-port the capture, management, manipulation, analysis, modeling and display of spatially-referenced data for solving complex planning and management problems.(David Cowen,1988) [19]."
2.2.2 Key Components of GIS
Five major key components integrated by the GIS are:
• Hardware: GIS operates on wide range of hardware types, in which hardware isthe computer where GIS is operated. The hierarchy of these hardware types rangefrom centralized computers from servers to desktop PC's which are used in networkcon�guration [81].
• Data: The most important requirement of GIS is acquiring data. A GIS mostly usesthe DBMS for manage and organize the data.
• People: The power of GIS technology is increased by the users who uses and managesit. Over the worldwide, GIS has wide range of users from technical specialists whodesign it to the end users.
• Software: GIS software provides or produces the tools and functions needed tostore, display, and analyze geographic information. The following involved softwarecomponents are:
� A Database Management System (DBMS)
� Tools for manipulation of geographic information
� A Graphic User Interface (GUI) for easily accessing the tools.
• Methods: Methods include how the data will be retrieved, managed, input into thesystem, stored, transformed, analyzed, and �nally presented in a �nal output. Eachorganization which operates successful GIS has well designed plan and business rulesconsidering these like a model and operating practices which are unique to one'sorganization [81].
CHAPTER 2. A COMPREHENSIVE SUMMARYOF THE RELATED STATE-OF-THE-ART17
2.2.3 Key Functions of GIS
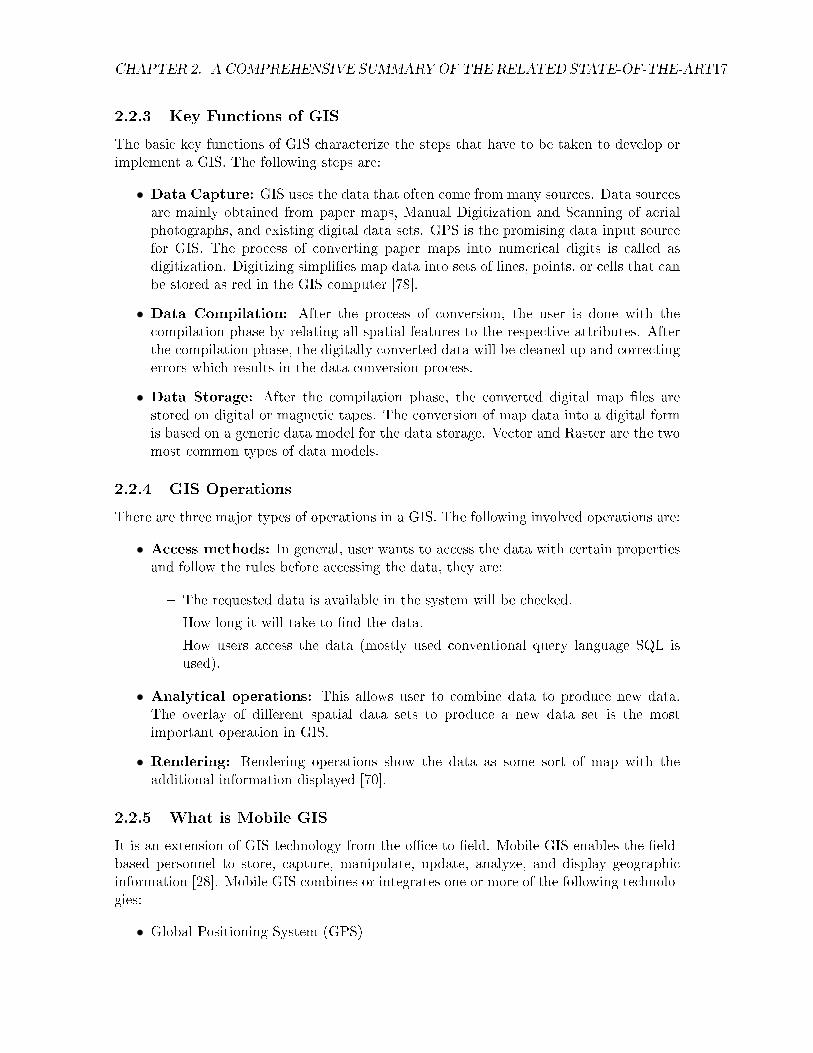
The basic key functions of GIS characterize the steps that have to be taken to develop orimplement a GIS. The following steps are:
• Data Capture: GIS uses the data that often come from many sources. Data sourcesare mainly obtained from paper maps, Manual Digitization and Scanning of aerialphotographs, and existing digital data sets. GPS is the promising data input sourcefor GIS. The process of converting paper maps into numerical digits is called asdigitization. Digitizing simpli�es map data into sets of lines, points, or cells that canbe stored as red in the GIS computer [78].
• Data Compilation: After the process of conversion, the user is done with thecompilation phase by relating all spatial features to the respective attributes. Afterthe compilation phase, the digitally converted data will be cleaned up and correctingerrors which results in the data conversion process.
• Data Storage: After the compilation phase, the converted digital map �les arestored on digital or magnetic tapes. The conversion of map data into a digital formis based on a generic data model for the data storage. Vector and Raster are the twomost common types of data models.
2.2.4 GIS Operations
There are three major types of operations in a GIS. The following involved operations are:
• Access methods: In general, user wants to access the data with certain propertiesand follow the rules before accessing the data, they are:
� The requested data is available in the system will be checked.
� How long it will take to �nd the data.
� How users access the data (mostly used conventional query language SQL isused).
• Analytical operations: This allows user to combine data to produce new data.The overlay of di�erent spatial data sets to produce a new data set is the mostimportant operation in GIS.
• Rendering: Rendering operations show the data as some sort of map with theadditional information displayed [70].
2.2.5 What is Mobile GIS
It is an extension of GIS technology from the o�ce to �eld. Mobile GIS enables the �eld-based personnel to store, capture, manipulate, update, analyze, and display geographicinformation [28]. Mobile GIS combines or integrates one or more of the following technolo-gies:
• Global Positioning System (GPS)

CHAPTER 2. A COMPREHENSIVE SUMMARYOF THE RELATED STATE-OF-THE-ART18
• Mobile devices
• Wireless communication for Internet GIS access
2.2.6 Why Mobile GIS
In general, the process of collecting �eld data and editing have been time consuming anderror prone. The geographic information data is travelled in the form of paper maps intothe �eld. Appending of �elds were performed using notes and sketches on paper maps andforms. These �eld edits were comprehend and manually entered into the GIS database,once back in to the o�ce [28]. A result in GIS database has often not been as up-to-date.
Recent developments in the mobile GIS have made many companies or industries totake the digital maps on mobile computers which provide access to enterprise geographicinformation to the �eld. Mobile GIS enables users or organizations to add real-time infor-mation to their database and applications, display, speeding up process or analysis, anddecision making by using up-to-date.
2.2.7 Tasks of Mobile GIS
Surveyors, Fire�ghters, engineering crews, soldiers, �eld biologists, utility workers, Policeo�cers, census workers, and others, use mobile GIS to �nish the following tasks:
• Field Mapping: Create, edit, and GIS maps are used.
• Asset Maintenance: Update asset location and schedule maintenance and condi-tion.
• Asset Inventories: Inventory of asset locations and attributes are created andmaintained.
• Incident Reporting: The incidents and events for future actions is reported by thedocumenting the location.
• Inspections: The legal code compliance and ticketing is done by maintaining digitalrecords and location of �eld records.
• GIS Analysis and Decision Making: Perform measuring, geo-processing, bu�er-ing, and other GIS analysis while in the �eld.
2.2.8 Bene�ts of Mobile GIS
Four major bene�ts rather than GIS are:
• Increased data accuracy
• More accurate decisions
• Better information accuracy
• Improved productivity

CHAPTER 2. A COMPREHENSIVE SUMMARYOF THE RELATED STATE-OF-THE-ART19
2.2.9 Key components of Mobile GIS
Key components of Mobile GIS are [93]:
• Mobile devices
• GIS editing tools
• Local maps and data
• Accurate location
• Spatial analysis
• Wireless connectivity
2.2.10 Generic Architecture of Mobile GIS
The architecture of mobile GIS is very similar to the wired-based Internet GIS and itextends the scope of server-based Internet GIS applications. Therefore, server-based ap-plications have been developed with both wired and wireless clients.
Figure 2.3: Generic architecture of mobile GIS.
The general architecture of mobile GIS is shown in �gure 2.3 [72]. This architectureincludes three types of elements.
• The presentation element is the user interface on an Internet-enabled hand-held de-vice.

CHAPTER 2. A COMPREHENSIVE SUMMARYOF THE RELATED STATE-OF-THE-ART20
• The business logic elements include a base transceiver station, a mobile switchingcenter, a gateway service, a web server, a GIS server and other server applications.
• The data element includes a location content server (data sever) and database sources.
Working process of architecture is illustrated as follows:
• The user with an Internet-enabled mobile device is a wireless network (GSM, GPRS,etc.) access any information by sending a request through a URL.
• The mobile device �rst veri�es whether it has already an open connection with thetelecommunication service provider; if not, it dials up the modem attached to adial-in server (Remote Access Service) in the base transceiver station [72].
• The Positioning-Determining Equipment (PDE) in the base transceiver station de-termines the location of the mobile device.
• The positioning information is processed and maintained by the mobile switchingcenter. This dial-in server gives the mobile device access to the protocols it needsand assigns it an IP address. The request for the URL is sent to the gateway service.
• The gateway service maintains the wireless connection between the Internet-enabledmobile device and content provide servers. The presence of the gate-way service is amajor di�erence between the wired Internet GIS and the mobile GIS. The gatewayservice acts as a translator between the mobile device and the web server, because ittranslates the requests from the mobile device to HTTP requests for the web serverand also converts the response from the content provider and web server to a formatthat is readable by the mobile devices.
• There is a normal web server at the content service provider side. This serverlinks with the GIS server (information process server), location content server anddatabases. Sometimes, the web server and the gateway service are combined as a"gateway server". The web server, depending on which type of browser the requestscome from, sends out contents in di�erent formats. For example, a browser insidethe mobile device is called as microbrowser and a browser from a PC is called as webbrowser.
• When the web server returns the contents provided by the GIS server and/or contentprovider server, the gateway service has to compile them into the format that canbe understood by the mobile device and can minimize the bandwidth usage. Thetransformed content is then passed back to the mobile device for display [72].
• Finally, the built-in microbrowser inside the Internet-enabled mobile device receivesand reads the �le and displays the contents on the mobile device for the user. Thisis the process that majority of mobile devices are connected to the web servers andGIS severs on the Internet.
Summary: This sub-chapter has summarized the basic principles of Geographic Infor-mation System (GIS) such as key components, key functions, and operations of GIS and

CHAPTER 2. A COMPREHENSIVE SUMMARYOF THE RELATED STATE-OF-THE-ART21
mainly concentrated on concepts of mobile GIS. Mobile GIS enables users to add real-timeinformation to their database and applications, display, speeding up process or analysis,and decision making by using up-to-date. Finally, this sub-chapter has described the pro-cess of mobile devices are connected to the web servers and GIS servers on the Internet.

CHAPTER 2. A COMPREHENSIVE SUMMARYOF THE RELATED STATE-OF-THE-ART22
2.3 Positioning Technologies
This sub-chapter summarizes the basic principles and the related state-of-the-art of thepositioning technologies with a particular focus on GPS and GSM based positioning.
2.3.1 De�nitions and terms
• Position: A position is de�ned by a set of coordinates related to a well-de�nedcoordinate reference frame. Every reference frame requires a convention on its originand orientation of its coordinate axes. The process of determining a position is calledposition determination [9].
• Location: Location describes a position in terms of topological relations. Theprocess of determining a location is called location determination [9].
• Positioning System: A positioning system is a mechanism for determining thelocation of an object.
• Lateration: Calculating the position of an object by measuring its distance frommultiple reference positions.
• Angulation: Calculating the position of an object by measuring the angles withwhich it sees multiple reference positions.
• Trilateration: Calculating the position of an object by measuring its distance fromthree reference positions.
2.3.2 Positioning methods
This section describes the di�erent positioning methods used to get the location of people,device, object and so on. A general classi�cation of positioning methods can be done intotwo groups:
• Network-based positioning: In this positioning method, tracking and evolutionof the user location is done by using the base station network. Therefore the mobiledevice sends either a signal or receives a signal which is sensed by the network.
• Terminal-based positioning: In this positioning method, the location is calculatedby the user device itself using Global Positioning System (GPS).
The following possible techniques are mostly used for positioning in combination:
• Cell of Origin (COO), location signature, location beacons: The cell id isusually the identi�er of the nearest base station, e.g. mobile phone antenna. Withthis technique, it is possible to get the known position in a de�ned cell or circle aroundthe base stations known position. Beacons (e.g. infrared, ultrasound or RFID) aremostly used indoors [90]. They transmit their exact position to the mobile device byusing identi�er id.
CHAPTER 2. A COMPREHENSIVE SUMMARYOF THE RELATED STATE-OF-THE-ART23
• Time of Arrival (TOA):In general, electromagnetic signals are usually moved withlight speed. Knowing the speed and the time di�erence between sending and receivingthe distance can be measured [90]. Light speed is very short and exact timers areneeded. This same principle is applicable for slower signals like ultrasound.
• Time Di�erence of Arrival (TDOA), Enhanced Observed Time Di�erence(E-OTD):These two techniques are also used to compute the distance by measuringthe runtime. But here the time di�erence between the signals of usually three di�erentbase stations has to be considered, such that they receive signals from di�erentneighboring base stations to triangulated position [90]. In case of TDOA, the positionis determined by the network provider. In contrast with E-OTD the calculation ofthe position is done in the mobile device.
• Angle of Arrival (AOA), Direction of Arrival (DOA): The angle of arrival inthe mobile device can be detected by using antennas with direction characteristics.This is exactly possible with many base stations with segment antennas which dividethe circum-circle of the base station into segments of 90, 120 or 180 degrees.
2.3.3 Types of Positioning Systems in ITS
The positioning system can be classi�ed based on its functions into two types self-positioningand remote positioning [24]. In self-positioning, the object itself actively determines itsown position. The GPS is a most important example of a self-positioning system. Inremote positioning, the determination of position is the responsibility of a remote facilityin which the object is not directly involved [9], for e.g. Radar for remote positioning. Thebasic classes of positioning system can be divided into three ways: signpost, wave-based,and dead reckoning.
Signpost System: Signpost system is the simplest form of positioning system. Thissystem measures position by virtue of the fact that the vehicle is located close to a speci�creference point, which is known as a signpost. Automated versions of these signpost systemsare commonly referred to as proximity beacon systems. This system works on the basisof reception of light, sound, or radio waves. New South Wales government's Roads andTra�c Authority's Automatic Network Travel Time Measurement system (ANTTS) [54]is an example of such systems. The vehicle - mounted "tag" and the roadside unit are thetwo most important elements of these systems.
The vehicle has a tag that picks up the signal from the beacon, in case of the systemcan be self-positioning. This signal will normally have some identi�cation code. Thereforethe vehicle knows to which beacon it is "in proximity" [24].
The system can also be remote positioning, if the beacon senses the presence of the tagon the vehicle. In this case, some form of identi�cation code can be emitted by the tag inorder that the system knows which vehicle is being interrogated [24].
CHAPTER 2. A COMPREHENSIVE SUMMARYOF THE RELATED STATE-OF-THE-ART24
Wave - based System: This system uses the propagation properties of waves to deter-mine position. Radar system is an example that uses the far-�eld planar wave front andthe �nite propagation time of electromagnetic waves. A wave-based positioning systemwill need one or more reference sites. Each reference site may have a transmitter or re-ceiver, or both. Each vehicle may have a receiver, transmitter, re�ective elements, or somecombination of those.
For example, in the case of GPS, each satellite is a reference site and there is a trans-mitter on each satellite. A GPS receiver on the mobile vehicle picks up the signals fromthe satellites and uses time-of-arrival (TOA) information to calculate position. In a simpleradar system, there is one reference site that �tted with both a transmitter and a receiver.The "targets" re�ect the radio energy back to the reference site [24].
Dead Reckoning System: This is a system that relay on sensing the components ofthe vehicle's velocity or acceleration information. This information can be then integratedto obtain the track of the vehicle. For example, consider a compass and odometer system.In order to perform the estimation of the distance traveled, the odometer integrates theangular velocity of the vehicle's wheels. The direction of travel can be de�ned by thecompass. The combined information can be used to track the course of the vehicle.
2.3.4 Introduction to GPS
GPS stands for Global Positioning System. In the early 1970s, the GPS was developedby the U.S Department of Defense (DOD) which is a satellite-based navigation system.Initially, it was used for military purposes, but in the year of 1980, U.S. government decidedto make the system's positioning data freely available to all over the world. Since then, mostof the companies or industries have taken up the opportunity to access positioning datathrough GPS and now they use it to improve or enhance their services and products [45].
Overview of GPS: GPS is a constellation of 24 satellites and they are orbiting the earthat about 12000 miles. This constellation known as the initial operational capability (IOC)and that was �nished in July 1993. The o�cial announcement was made on December 8,1993 [8]. Four GPS satellites are placed in each of six orbital planes to ensure continuousworldwide coverage. The GPS system was o�cially declared on July 17, 1995, to haveachieved full operational capability to ensure the availability of at least 24 operationalGPS satellites.
Basic idea of GPS: Each GPS satellite continuously transmits a signal composed ofa navigation message, two digital codes, and two frequency carriers. In the switch onmode, the GPS receiver will pick up the signal through the receiver antenna. GPS receiver

CHAPTER 2. A COMPREHENSIVE SUMMARYOF THE RELATED STATE-OF-THE-ART25
processes the GPS signal using built in software. The signal processing output consists ofthe satellite coordinates through the navigation message and the distances to the satellitesthrough the digital codes. Three satellites must be used to uniquely determine the GPS'slocation relative to the satellite [47].
2.3.5 GPS Segments
GPS technology requires three segments. They are space segment, control segment anduser segment [99].
Space Segment: This segment consists of constellation of 24 satellites which orbit theearth twice a day in a speci�c pattern. They travel at approximately 7,000 miles per hourabout 12,000 miles above the earth's surface. These satellites are spaced so that a GPSreceiver anywhere in the world can receive signals from at least four of them.Each GPSsatellite constantly sends radio signal to the earth. These signals contain the followinginformation:
• Two digital codes
• Two sine waves (carrier frequencies)
• A navigation message
GPS receiver uses the digital codes and carrier frequencies to calculate the distance fromthe user's receiver to the GPS satellites. The GPS satellites are powered by solar energy.If solar energy is unavailable, for example, when the satellite is in the earth's shadow, thesatellites use backup batteries to continue running. Each GPS satellite is built to lastabout 10 years. The Department of Defense monitors and replaces the satellites to ensurethat GPS technology continues to run smoothly for years to come [33].
Control Segment: This segment is responsible for constantly monitoring satellite heath,signal integrity, and orbital con�guration from the ground. The control segment includesthe following sections:
Monitor Stations: At least six monitor stations are located around the world. Eachstation constantly monitors and receives information from the GPS satellites and thensends the orbital and clock information to the Master Control Station (MCS).
Master Control Station (MCS): Located in the U.S. at Colorado Springs, Col-orado [26]. The MCS constantly receives GPS satellite orbital and clock informationfrom the monitor stations. The controllers in the MCS make precise corrections to thedata necessary and send that correct information to the GPS satellites using the groundantennas [33].
Ground Antennas: Receive the corrected orbital and clock information from the MCS(Master Control Station) and then send the correct information to the appropriate satel-lites.

CHAPTER 2. A COMPREHENSIVE SUMMARYOF THE RELATED STATE-OF-THE-ART26
User Segment: This consists of GPS receivers that collects and processes signals fromthe GPS satellites those are in view and then uses that information to determine anddisplay location, speed, time, and so forth. GPS receiver does transmit any informationback to the satellites.
2.3.6 Working process of GPS Technology
As discussed already, each GPS satellite continuously transmits a signal. GPS receiveron the earth accurately determines its location (longitude, latitude, and altitude) in anyweather, any where on the earth.
Calculating position: A GPS receiver needs to know the precise time to calculate itsposition. The receiver determines the signal transit time by comparing its internally gen-erated code (at the receiver clock time of reception) with the code sent by the satellite(at the satellite clock time of transmission). With this time, the receiver calculates thedistance to each satellite. GPS system applies trilateration principle to calculate the dis-tance. Formula for calculating the distance can be considered as speed of light multiplywith time of �ight (distance = speed of light x time of �ight).
The calculation of distance to each satellite from the receiver is very simple but in reallife the range (distance) measurement is corrupted with a number of imperfections. Thefollowing relevant imperfections are:
• The receiver internal clock is not synchronized with GPS time. Adding a range(distance) measurement to a fourth satellite allows the user to solve for a receiverclock o�set.
• The satellite internal clock is not synchronized with GPS time. The clock parametersin the navigation message allow calculation of this o�set.
• " The signal speed in the atmosphere is lower than the speed of light in a vacuum.Models for the tropospheric delay and ionospheric delay allow correction of thesedelays [97].
Incorporating the above e�ects, the range (distance) equation becomes:
PRiu(corr) =
√(Xi −Xu)2 + (Y i − Yu)2 + (Zi − Zu)2 − Cu (2.1)
where PRiu(corr) is the corrected pseudorange measurement to satellite i.
Xi, Y i, Zi are the geocentric position coordinates of satellite i.Xu, Yu, Zu are the geocentric position coordinates of the user(receiver).
Cu isthe receiver clock o�set in meters.

CHAPTER 2. A COMPREHENSIVE SUMMARYOF THE RELATED STATE-OF-THE-ART27
The relation between the corrected and measured pseudorange is:
PRiu(corr) = PRi
u(measured) − Ci − Iiu − T iu (2.2)
Where Ci is the clock o�set of satellite 'i' in meters.T iu is the tropospheric delay.Iiu is the ionospheric delay.
Equation 2.1 can not be solved directly. The equation must be linearized by developingthem into Taylor series and taking the �rst order terms:
PRiu = Ri
u(0) + (Xi −Xu(0)
Riu(0)
)∆X + (Y i − Yu(0)
Riu(0)
)∆Y + (Zi − Zu(0)
Riu(0)
)∆Z − Cu (2.3)
Where ∆Xu(0),∆Yu(0),∆Zu(0) are an initial guess for the coordinates of the user.Ri
u is the range between the satellite i and the user based on the initial user coordinates.∆X,∆Y,∆Zare the corrections to the initial user coordinates.
Equation 2.3 can be rearranged to give:
(Xi −Xu(0)
Riu(0)
)∆X + (Y i − Yu(0)
Riu(0)
)∆Y + (Zi − Zu(0)
Riu(0)
)∆Z − Cu = PRiu −Ri
u(0) (2.4)
The above relation in a more convenient matrix notation is:
A ∗D = L (2.5)
Where A =
Ai
1 Ai2 Ai
3 Ai4
. . . .
. . . .An
1 An2 An
3 An4
Ai
1 = (Xi−Xu(0)Ri
u(0))
Ai2 = (Y
i−Yu(0)Ri
u(0))
Ai3 = (Z
i−Zu(0)Ri
u(0))
Ai4 = −1
D = (∆X,∆Y,∆Z,Cu)T
L = (PR1u −R1
u(0), ..........PRnu −Rnu(0))T
n=number of satellites.

CHAPTER 2. A COMPREHENSIVE SUMMARYOF THE RELATED STATE-OF-THE-ART28
'D' in Equation 2.5 can be solved using matrix algebra techniques and used to updatethe initial user position X0, Y0, Z0. 'A' is then recalculated and 'D' is solved again. Thisprocess is iterated until the position corrections 'D' is close to zero [97]. This provides the�nal estimates of the X0, Y0, Z0 user positions, and the Cu is receiver clock error.
2.3.7 The GPS Error Budget
The GPS system has been designed to be as nearly accurate as possible. However, thereare still errors. These errors can cause a deviation of +/- 50 to 100 m from the actual GPSreceiver position. There are several sources for these errors; some of them are discussedhere:
Atmospheric Conditions: The ionosphere and troposphere both refract the GPS sig-nals. This causes the speed of the GPS signal in the ionosphere and troposphere to bedi�erent from the speed of the GPS signal in space. Therefore, the distance calculatedfrom "Signal Speed x Time" will be di�erent for the portion of the GPS signal path thatpasses through the ionosphere and troposphere and for the portion that passes throughspace [62].
• Ionosphere can introduce 0-30 meters of positional error
• Troposphere can introduce 0-30 meters of positional error
Ephemeris Errors/Clock Drift/Measurement Noise:
GPS signals contain information about ephemeris (orbital position) errors, and aboutthe rate of clock drift for the broadcasting satellite. This data concerning ephemeris errorsmay not exactly model the true satellite motion or the exact rate of clock drift [62].Distortion of the signal by measurement noise can further increase positional error.
• The disparity in ephemeris data can introduce 1-5 meters of positional error
• The clock disparity can introduce 0-1.5 meters of positional error
• The measurement noise can introduce 0-10 meters of positional error
Selective Availability:
This is the intentional alteration of the time and ephemeris signal by the Departmentof Defense.
• " Selective availability can introduce 0-70 meters of positional error
Multipath:
A GPS signal bouncing o� a re�ective surface prior to reaching the GPS receiverantenna is referred to as multipath. This multipath error is a serious concern to theGPS user, because it is di�cult to completely correct it, even in high precision GPS units.
• " Multipath can introduce 0-1 meter of positional error.

CHAPTER 2. A COMPREHENSIVE SUMMARYOF THE RELATED STATE-OF-THE-ART29
2.3.8 DGPS Technology
The GPS accuracy was good in the early days of it to within 100 meters for a given location.This was due to the U.S government's policy of "Selective Availability". But this selectiveavailability introduced a timing error in the GPS signal. As a result the government hasdropped this policy. Since then the accuracy of GPS units have improved tremendously.Most GPS units today are accurate to within 5-10 meters. This is good enough for mostuser applications such as road navigation, etc. For certain advanced applications, such asmaritime navigation and aircraft navigation, even more accuracy is desirable [20]. For thisa more accurate GPS system is required and one of the solutions is Di�erential GPS orDGPS.
Working process of DGPS: The working process of DGPS technology is as follows:
• The DGPS system works by placing a high-performance GPS receiver (referencestation or base station) at a known location.
• Since the base station receiver knows its exact location, it can determine the errors inthe satellite signals. It does this by measuring the ranges to each satellite using thesignals received and comparing these measured ranges to the actual ranges calculatedfrom its known position.
• The di�erence between the measured and calculated range is the total error. Theerror data for each tracked satellite is formatted into a correction message and trans-mitted to GPS users.
Figure 2.4: Di�erential GPS System.
2.3.9 RTK - GPS Technology
The DGPS accuracy is not enough for certain precision farming applications such as rowcrop bed preparation and planting and so forth. That's where centimeter solutions using
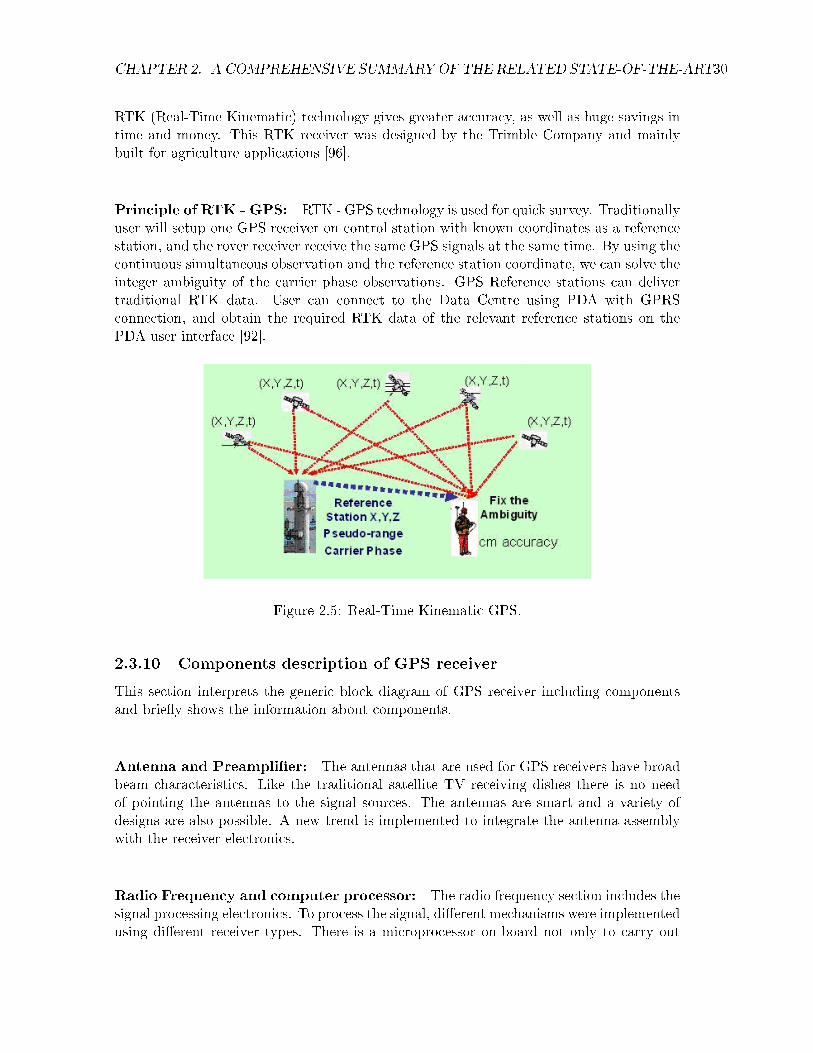
CHAPTER 2. A COMPREHENSIVE SUMMARYOF THE RELATED STATE-OF-THE-ART30
RTK (Real-Time Kinematic) technology gives greater accuracy, as well as huge savings intime and money. This RTK receiver was designed by the Trimble Company and mainlybuilt for agriculture applications [96].
Principle of RTK - GPS: RTK - GPS technology is used for quick survey. Traditionallyuser will setup one GPS receiver on control station with known coordinates as a referencestation, and the rover receiver receive the same GPS signals at the same time. By using thecontinuous simultaneous observation and the reference station coordinate, we can solve theinteger ambiguity of the carrier phase observations. GPS Reference stations can delivertraditional RTK data. User can connect to the Data Centre using PDA with GPRSconnection, and obtain the required RTK data of the relevant reference stations on thePDA user interface [92].
Figure 2.5: Real-Time Kinematic GPS.
2.3.10 Components description of GPS receiver
This section interprets the generic block diagram of GPS receiver including componentsand brie�y shows the information about components.
Antenna and Preampli�er: The antennas that are used for GPS receivers have broadbeam characteristics. Like the traditional satellite TV receiving dishes there is no needof pointing the antennas to the signal sources. The antennas are smart and a variety ofdesigns are also possible. A new trend is implemented to integrate the antenna assemblywith the receiver electronics.
Radio Frequency and computer processor: The radio frequency section includes thesignal processing electronics. To process the signal, di�erent mechanisms were implementedusing di�erent receiver types. There is a microprocessor on-board not only to carry out

CHAPTER 2. A COMPREHENSIVE SUMMARYOF THE RELATED STATE-OF-THE-ART31
Figure 2.6: The generic block diagram GPS Receiver.
computations such as determining the elevation/azimuth of the satellites and so on, butalso to control the tracking and measurement function within digital circuits [24].
Control unit interface: To interact with the microprocessor the operator is enabled bythe control unit. The size and type of the control unit is dynamic. The dynamic propertyvaries greatly for di�erent receivers, ranging from a handheld unit to soft keys, which issurrounded by a LCD screen �xed to the receiver box.
Recording device: The process of surveying is mainly done by the GPS receivers wherethe measured data must be preserved such that it is useful for the future work like dataprocessing. The large variety of ITS applications like logging of vehicle movement is done bythese GPS receivers which record the derived coordinates and velocity. A variety of storagedevices were used in the past, including tape records, computer tapes, �oppy disks, andcassette, and so on, but in the earlier days almost all receivers utilize RAM or removablememory cards.
Power supply: The power consumption of the GPS receiver is very low because itconsumes low voltage dc power and these receivers are also movable. Most GPS receiversoperate from a number of power sources, including internal lithium batteries or NiCad andexternal batteries as wet cell car batteries.
2.3.11 Cellular Networks based positioning systems
These are the radio-based mobile communication systems. The term cellular de�nes thatthe systems use many base stations to receive or transmit the signals from the mobile

CHAPTER 2. A COMPREHENSIVE SUMMARYOF THE RELATED STATE-OF-THE-ART32
telephones. The base stations are in a hexagonal pattern. A cell is de�ned as a coveragearea of a base station. The
Advantages of a cellular telephone positioning system are:
• Cellular systems already have a spectrum.
• There are large numbers of installed user base.
• The cellular system provides a two-way communication link.
Disadvantages of a cellular telephone positioning system:
• The bandwidths tend to be narrower than is optimal for a positioning system designedfor the higher accuracy ITS applications.
• Cellular systems tend to be designed so that it is only necessary for one base stationto pick up the signal from a mobile [24].
Positioning in the GSM Network:
GSM network is composed of adjacent cells [50]and each cell can cover an up to 20kilometers, while all cells together can cover very large physical area. To distinguish cellsfrom each other, the operator has given each cell a unique id number.Positioning methodsin GSM network can be divided into three types:
• Network based method
• Network oriented method
• GPS based method
Network based methods include location estimation methods that are provided by stan-dard equipment of GSM network infrastructure. All methods in this type are based onrecognizing id number of GSM cell that is currently serving the user. If physical locationof base station of the cell is known, the user's location can be estimated according to thecell size, if the cell size is known. Accuracy of the location estimation is based on cell size,which may vary from some hundred meters to tens of kilometers [83].
GSM network consists of data that can be used for providing more accurate estimatesabout the user's location in cell-id based positioning. The distance (range) between theGSM base station and the terminal device may vary a lot due to the user's mobility. Themobile terminal uses timing advance (TA) parameter to avoid radio signal overlapping ofthe multiple simultaneous transmitters in the time domain. Value of the timing advancecorresponds to the approximation of microseconds the signal from mobile phone requires totravel to the base station. Respectively, value of TA parameter corresponds to the distancebetween the base station and the mobile terminal. Thus, timing advance can be utilized in

CHAPTER 2. A COMPREHENSIVE SUMMARYOF THE RELATED STATE-OF-THE-ART33
determining location of the mobile terminal more accurately than plain cell-id [83]. Thisestimation can be further adjusted by using received radio signal level parameter.
In order to enable more accurate positioning methods, the GSM infrastructure can beupdated with location measurement units (LMUs).
• The network oriented positioning methods include time of arrival (TOA), angle ofarrival (AOA) and enhanced observed time di�erence (E-OTD).
• GPS based methods utilize GPS positioning and they require specialized hardware onthe terminal device. GPS positioning can be done in stand-alone mode with externalor integrated GPS receiver, which is connected to the mobile terminal.
• The problem with GPS positioning is that does not work in urban areas or insidethe buildings. To avoid this problem, assisted GPS (A-GPS) can be used to providepositioning, if mobile operator network and mobile terminal supports it.
GSM network illustrates in �gure 2.7, which is composed of several cells. Each cell has abase station, which acts as a network access point for the mobile terminals in the cell.
• As users move from one cell to another, a hando� takes place at the border of the twocells (marked as dots in Fig.2.7). If physical locations of base stations are known, itcan be used to determine that user's location is the same than location of the basestation.
• However, this pure cell based positioning assumes that the mobile terminal is con-nected to the nearest base station, but it is reported to be true in only 57 percentageof the cases [83].
• This is due to fact that in GSM system, the hando� is determined by the network,not by the terminal device. For example, if some part of the network su�ers highcongestion, the network may force terminals to move to another cell.
According to �gure 2.7, out of huge population, there are some users that carry GPSenabled mobile terminal. As the users move, every time when serving GSM cell changes,user's mobile terminal connects to the network server and creates a log with following data:id of the cell where user was coming from, id of the cell where user arrived, coordinatesof the hando� location (longitude, latitude). During that time there will be enough dataavailable that the physical locations of each cell can be determined. Thus, when a userwith no other positioning mechanism (GPS etc.) enters to the area, the outer bounds ofgeological region where the user is located can be calculated from data in the database [83].
One of the challenges in any cell based positioning methods is that they assume GSMnetwork to be static over time. However, in real life the network can be modi�ed in variousways.
• New cells may be included to the areas where amount of users is high. On the otherhand, some cells may be combined or dropped out.
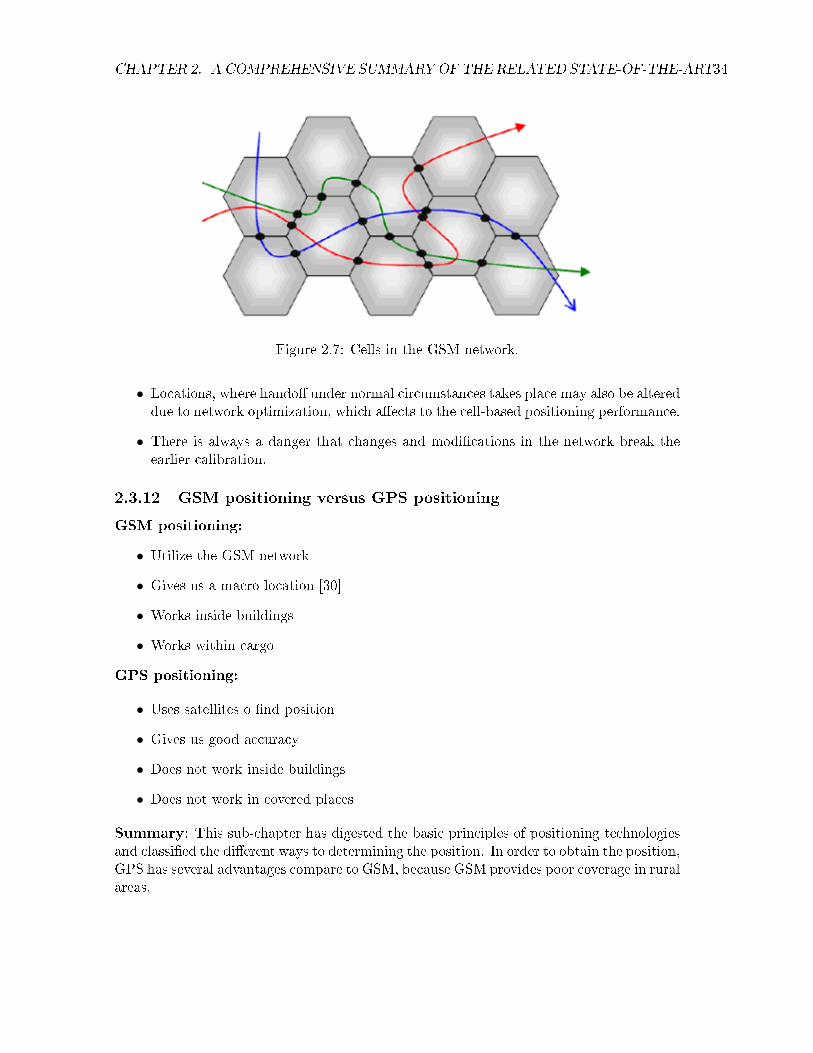
CHAPTER 2. A COMPREHENSIVE SUMMARYOF THE RELATED STATE-OF-THE-ART34
Figure 2.7: Cells in the GSM network.
• Locations, where hando� under normal circumstances takes place may also be altereddue to network optimization, which a�ects to the cell-based positioning performance.
• There is always a danger that changes and modi�cations in the network break theearlier calibration.
2.3.12 GSM positioning versus GPS positioning
GSM positioning:
• Utilize the GSM network
• Gives us a macro location [30]
• Works inside buildings
• Works within cargo
GPS positioning:
• Uses satellites o �nd position
• Gives us good accuracy
• Does not work inside buildings
• Does not work in covered places
Summary: This sub-chapter has digested the basic principles of positioning technologiesand classi�ed the di�erent ways to determining the position. In order to obtain the position,GPS has several advantages compare to GSM, because GSM provides poor coverage in ruralareas.
CHAPTER 2. A COMPREHENSIVE SUMMARYOF THE RELATED STATE-OF-THE-ART35
2.4 Mobile Applications and/or Location-Based Services (LBS)
This sub-chapter summarizes the basic principles and the related state-of-the-art of the socalled mobile applications (and/or location-based services).
2.4.1 Introduction to LBS
A location-based service is any information that is available on mobile device and makes useof geographical information. In other words, these are the information services accessiblewith mobile devices through the mobile network and utilizing the ability to make use ofthe location of the mobile devices. (Virrantaus et al.2001) [90].
Normally, location information can be described or expressed in spatial terms or textdescriptions. Spatial location information can be formulated or expressed in the widelyused longitude-latitude-altitude coordinate system [57]. Longitude is formulated as 0-180degrees east or west of the prime meridian, which passes through Greenwich, England, andlatitude as 0-90 degrees north or south of the equator. Altitude is formulated in metersabove sea level. Text description usually described as a street address, including postalcode, city, and so on.
2.4.2 Concepts in LBSs
Position:
• Position appears to developers in the form of spatial coordinates.
• It can be represented as a single point in the Cartesian coordinate.
Location:
• Location is associated with a certain place in the world.
• If positioning delivers a spatial location, it will be mapped onto a descriptive locationin order to be interpretable by the LBS user.
Location Service (LCS):
• Location service is distinguishable from location based service as it exclusively dealswith the localization of target, and also makes the resulting location data availableto external actors [87].
• It is responsible for the generation and delivery of location data.
Location Based Service (LBS):
• Location based service that adds value to target locations provided by location ser-vice. It uses knowledge of a mobile devices location to o�er value to the mobilesubscriber or to a third party [87].

CHAPTER 2. A COMPREHENSIVE SUMMARYOF THE RELATED STATE-OF-THE-ART36
2.4.3 What are LBSs
This section classi�es the location-based services and describes major characteristics ofthem. The following location-based services are:
• The relation of GIS and LBS
• LBS components
• Push and Pull services
The relation of GIS and LBS:
GIS has been developed during several decades on the basis of professional geographicdata applications, but LBS were born quite recently by the evolution of public mobileservices. GIS can be observed as professional systems intended for experienced users withwide range collection of functionality and also require extensive computing resources [90].In case of LBS, they are developed as limited services for large non-professional user groups.LBS applications are usually operating with the restrictions of mobile computing environ-ment like small display or screen, low computational power, and small battery run time ofthe mobile device.
LBS Components: This sub-section characterizes the major key components of LBSthat requires to the user to use a location based services. The following �ve major keycomponents of LBSs are:
Mobile Device: Mobile device is a tool for the user to request the needed information.Typical devices are PDA's (Personal Device Assistants), Mobile phones, Laptops, and soon [82] [63].
Communication Network: Transfers the user data and service request from the mobiledevice to the service provider and the acknowledged service sends to the user.
Positioning Component: Position of the user has to be obtained for the processingof a service. The user position can be determined either by using the GPS or by usingthe mobile communication network. Further possibilities to gain the position are radiobeacons, WLAN stations [63].
Service and Application Provider: The main task of service provider is to provide oro�er a variety number of di�erent services to the user. Such services o�er the computationof the position, �nding a route and so on.
Data and Content Provider: Normally, all the information requested by the users willnot be stored and maintained with the service providers. Therefore geographic data andlocation information data will be requested from the concerned authority.

CHAPTER 2. A COMPREHENSIVE SUMMARYOF THE RELATED STATE-OF-THE-ART37
Push and Pull Services: This sub-section distinguishes two kinds of location servicesthat are considered by a user to know whether the information is delivered on user inter-action or not:
Pull Services: Pull services deliver information directly requested from the user. Anexample for a directly requested service is to call a website in the Internet by giving itsURL in the web browser [90].
Push Services: Push services deliver information indirectly requested from the user.An example for an indirectly requested service is a news subscription which contains eventinformation with respect to the actual city directly from the service provider.
2.4.4 LBS communication model
Technologically, the realization of LBS can be described by a three-tier communicationmodel. This communication model illustrates in �gure 2.8, including a physical layer, amiddleware layer, and an application layer [45].
Figure 2.8: General LBS communication.
Process of work between all elements in the communication model is described asfollows:
• The positioning layer is responsible for calculating the position of a mobile device oruser with the help of position determination equipment (PDE) and geospatial dataheld in a geographic information system (GIS).
• While the PDE calculates where a device is in network terms, the GIS allow itto translate it to this raw information into geographic information (longitudes andlatitudes).
• The end result of this calculation is then passed on via location gateway either directlyto an application or to a middleware platform.

CHAPTER 2. A COMPREHENSIVE SUMMARYOF THE RELATED STATE-OF-THE-ART38
• The positioning layer would manage and send location information directly to amapplication that requests it for service delivery.
• The application layer comprises all of those services that request location data tointegrate it into their o�ering. Due to the use LBS applications increases, manynetwork operators have put a middleware layer between the application layer andpositioning layer [45].
• This middleware can signi�cantly reduce the complexity of service integration be-cause it is connected to the network and an operator's service environment once andthen mitigates and controls all location services added in the future.
Summary: This sub-chapter has digested the basic principles of location-based servicesand describes the basic concepts of it. Finally, this work has organized the communicationmodel of LBS.

Chapter 3
Software Development Process andProgramming Basics
This chapter deals with the basics of software development process and programming designconcepts.
3.1 Basics of software development process
When building a house, at �rst, the builder analyzes and takes many factors into accountsuch as requirements and possibilities. The architect considers these factors when designingthe house. Only then, the construction of the house is started.
It is desirable to act in the same way when constructing or developing a software. First,analyze the problem to be solved and describe the requirements in a very precise manner.Based on these requirements, the design is formulated. Finally, the implementation process(programming of the solution) is started [98].
The basic work�ow method for the software development process is shown in �g-ure 3.1and a brief description of each component is as follows:
3.1.1 Requirements Analysis
The main focus of requirements analysis is to get a complete description of the problemto be solved. The requirements analysis includes supporting software, hardware, and thenumber of users of the system to be developed. A description of the problem to be solvedincludes following things:
• Develop the functions of the software.
• Possible future extensions to the system.
• The amount and kind of documentation required.
• Response time and other performance requirements of the system.
39

CHAPTER 3. SOFTWARE DEVELOPMENT PROCESS AND PROGRAMMING BASICS40
Figure 3.1: A simple view of software development.

CHAPTER 3. SOFTWARE DEVELOPMENT PROCESS AND PROGRAMMING BASICS41
Feasible study is a part of the requirements analysis. The main purpose is to appraise ifit is both technically and economically feasible. At the end of this requirement analysis,various people (perspective users, customer, programmers, and designers) have to collab-orate intensively [98]. Communication between these people is not easy, because they arefrom di�erent backgrounds. Requirement speci�cation is the document, which shows theresult of this activity.
3.1.2 Design
A model of the whole system is developed during the design phase. The design phaseis crucial and the functions of these modules as well as the interfaces between them arespeci�ed in a very precise manner [98]. This phase is sometimes classi�ed into two levels:high-level design and low-level design. The detailed interfaces between the various sub-systems will be de�ned, during high-level design. At this level, the overall work can bedivided into subprojects for the various teams. The low level-design involves the design ofthe various subsystems.
3.1.3 Implementation
This phase involves the development of various subsystems that are based on the earlierdesign documents. To produce a working system, various subsystems are integrated. Theimplementation process depends on the nature of the subsystem. If the project is basedon hardware, there will be circuit board manufacturing and coding is used for softwareimplementation.
3.1.4 Testing
This phase follows the implementation phase. Testing phase comes in two �avors. Oneis veri�cation, which tests whether the transition from phase i to i+1 is correct or not.Another �avor is the validation, which checks the right track with regards to ful�lling userrequirements. Measuring e�ciency and optimization of software are also considered in thisphase.
3.1.5 Maintenance
There are often errors that may come into picture, after the delivery of the software. Postdelivery of the software, if there are errors/bugs which are realized while using it, thenthey have to rectify. In addition, changes and enhancements are requested by the actualsystem. All of these modi�cations are denoted by the rather unfortunate term maintenance.Maintenance concerns with all activities needed to keep the system operational after it hasbeen delivered to the user [98].
There are possible life cycle models that are used for the phased development of soft-ware. Here, one famous model, namely waterfall model is to be discussed.
The Waterfall Model: This is the simplest form of software development life cyclemodel.
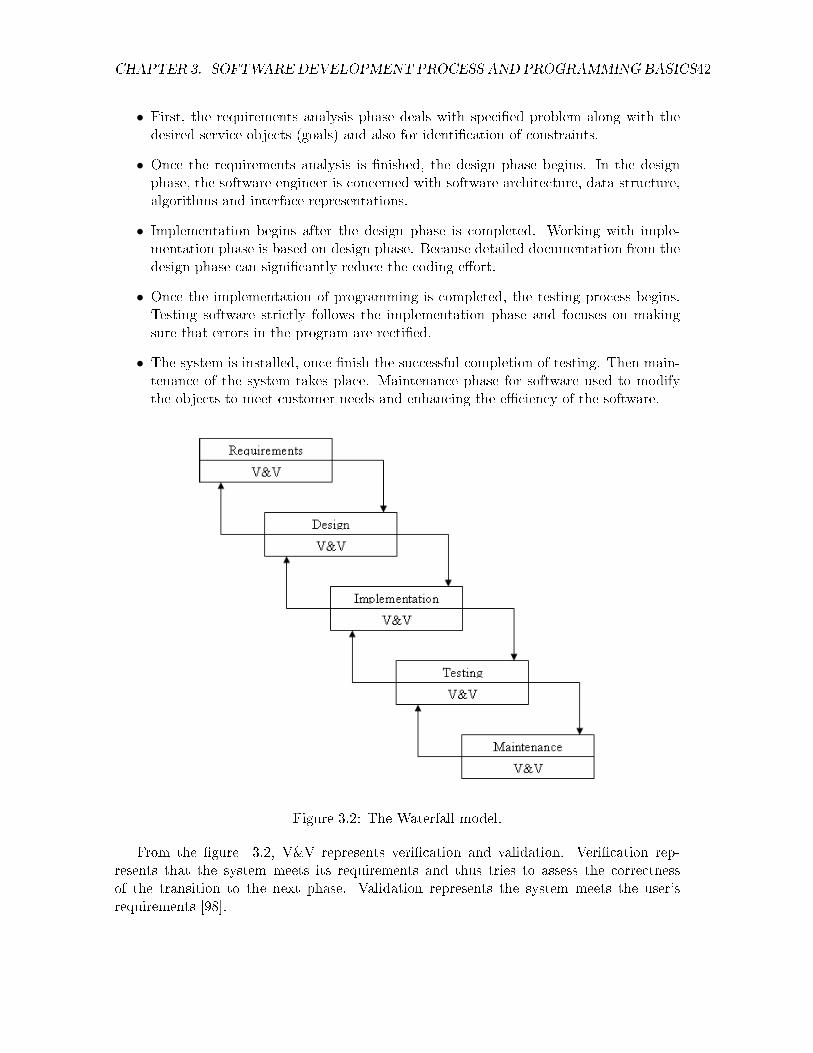
CHAPTER 3. SOFTWARE DEVELOPMENT PROCESS AND PROGRAMMING BASICS42
• First, the requirements analysis phase deals with speci�ed problem along with thedesired service objects (goals) and also for identi�cation of constraints.
• Once the requirements analysis is �nished, the design phase begins. In the designphase, the software engineer is concerned with software architecture, data structure,algorithms and interface representations.
• Implementation begins after the design phase is completed. Working with imple-mentation phase is based on design phase. Because detailed documentation from thedesign phase can signi�cantly reduce the coding e�ort.
• Once the implementation of programming is completed, the testing process begins.Testing software strictly follows the implementation phase and focuses on makingsure that errors in the program are recti�ed.
• The system is installed, once �nish the successful completion of testing. Then main-tenance of the system takes place. Maintenance phase for software used to modifythe objects to meet customer needs and enhancing the e�ciency of the software.
Figure 3.2: The Waterfall model.
From the �gure 3.2, V&V represents veri�cation and validation. Veri�cation rep-resents that the system meets its requirements and thus tries to assess the correctnessof the transition to the next phase. Validation represents the system meets the user'srequirements [98].

CHAPTER 3. SOFTWARE DEVELOPMENT PROCESS AND PROGRAMMING BASICS43
Advantages of Waterfall Life Cycle Model:
• Easy to explain to the user.
• Helps to plan and schedule the project.
• Activities and stages are well de�ned.
• Each stage of veri�cation ensures early detection of errors.
3.2 Basics of the Requirement Engineering of Software sys-tems
3.2.1 Introduction to Requirements Engineering
Requirements engineering is involved with what needs to be designed instead of how it is tobe designed. It is also involved with some future situation. Consider an example as systemdesign is shown in �gure 3.3, which consists of the user's present job and technologicaloptions as the inputs to the system and the future system is the output [55].
Figure 3.3: The process of design from the present through to future systems.
In �gure 3.3, it is not simple to design the system before the future situation is known.In this sense, we need the requirements for designing the system. There must be needsome knowledge of the future system included by the future situation, before the design canstart. Requirements engineering is involved with �nding out about the future situation andrelated change. It is involved with considering possible options and collecting information,and with identifying what should be designed in order to meet some perceived future need.
3.2.2 De�nition to Requirements Engineering
"Requirements Engineering can be de�ned as the systematic process of developing require-ments through an iterative co-operative process of analyzing the problem, documenting the
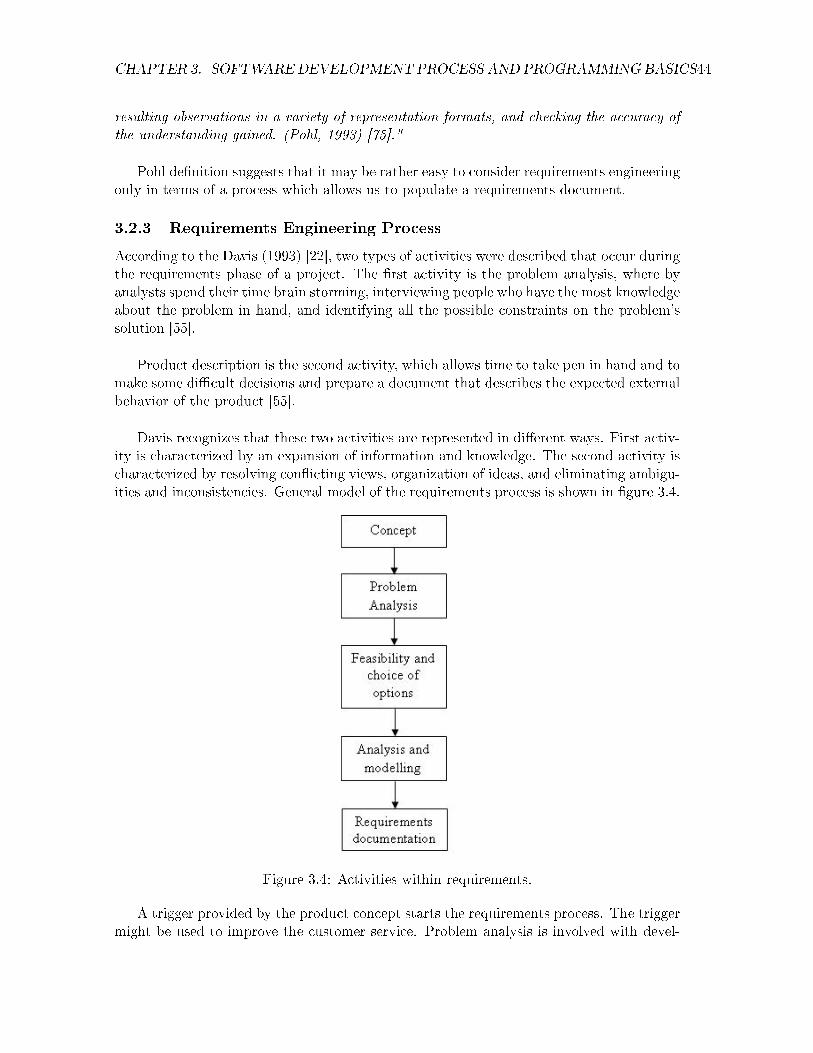
CHAPTER 3. SOFTWARE DEVELOPMENT PROCESS AND PROGRAMMING BASICS44
resulting observations in a variety of representation formats, and checking the accuracy ofthe understanding gained. (Pohl, 1993) [75]."
Pohl de�nition suggests that it may be rather easy to consider requirements engineeringonly in terms of a process which allows us to populate a requirements document.
3.2.3 Requirements Engineering Process
According to the Davis (1993) [22], two types of activities were described that occur duringthe requirements phase of a project. The �rst activity is the problem analysis, where byanalysts spend their time brain storming, interviewing people who have the most knowledgeabout the problem in hand, and identifying all the possible constraints on the problem'ssolution [55].
Product description is the second activity, which allows time to take pen in hand and tomake some di�cult decisions and prepare a document that describes the expected externalbehavior of the product [55].
Davis recognizes that these two activities are represented in di�erent ways. First activ-ity is characterized by an expansion of information and knowledge. The second activity ischaracterized by resolving con�icting views, organization of ideas, and eliminating ambigu-ities and inconsistencies. General model of the requirements process is shown in �gure 3.4.
Figure 3.4: Activities within requirements.
A trigger provided by the product concept starts the requirements process. The triggermight be used to improve the customer service. Problem analysis is involved with devel-

CHAPTER 3. SOFTWARE DEVELOPMENT PROCESS AND PROGRAMMING BASICS45
oping an understanding of the nature of the problem associated with the product concept.Possible solutions can be suggested, once the problem is clearly understood. Feasibility isinvolved with evaluating the costs and bene�ts of di�erent solutions. Once the solutionhas been decided upon, modeling of the solution is the next step. In order to check theaccuracy of the information collected, each activity should be followed by validation. Thenthe requirements process can be documented.
3.2.4 UML-Basics
UML stands for Uni�ed Modeling Language. This is an Object-oriented system used fordesigning, modeling or analyzing the ideas in software systems before being implementingthe project. UML diagrams are classi�ed into two types such as structural modeling andbehavioral modeling.
Structural modeling consists of �ve types of diagrams:
• Class Diagram
• Object Diagram
• Use-Case Diagram
• Component Diagram
• Deployment Diagram
Behavioral modeling consists of four types of diagrams:
• Sequence Diagram
• Collaboration Diagram
• State Diagram
• Activity Diagram
3.2.5 Structural modeling
Structural modeling helps in communicating and understanding the elements that makeup a system and the functionality the system provides.
Class diagram: Class diagram represents the structure of a system. Class diagramconsists of following elements.
• A class
• An association
• An attribute
• An operation

CHAPTER 3. SOFTWARE DEVELOPMENT PROCESS AND PROGRAMMING BASICS46
Object diagram:Object diagram represents the structure of a system at a particular point in time.
Object diagram consists of following elements.
• An object
• A link
• An attribute value
Use-case diagram:Use-case diagram represents the functionality of a system. Use-case diagram consists
of following elements.
• An actor
• A use case
• A communicate association
Component diagram:Component diagram is also known as implementation diagram that represents the
implementation of a system. Component diagram consists of following elements.
• A component
• A dependency relationship
Deployment diagram:Deployment diagram is also known as implementation diagram that represents the
implementation environment of a system. Both deployment and component diagrams arespeci�c types of implementation diagrams [6]. Deployment diagram consists of followingelements.
• A node
• A communication association
3.2.6 Behavioral modeling
Behavioral modeling helps in communicating and understanding how elements collaborateand interact to provide the functionality of a system.
Sequence diagram: Sequence diagram is also known as interaction diagram that repre-sents how elements interact over time. A vertical axis represents the time proceeding downthe page and a horizontal axis shows the elements involved in the interaction. Sequencediagram consists of following elements.
• Classes and objects

CHAPTER 3. SOFTWARE DEVELOPMENT PROCESS AND PROGRAMMING BASICS47
• A lifeline
• A communication
Collaboration diagram:Collaboration diagram is also known as interaction diagram that represents how el-
ements interact over time and how they are related. Both collaboration and sequencediagrams are speci�c types of interaction diagrams [6]. Collaboration diagram consists offollowing elements.
• Classes and objects
• Associations
• A communication
State diagram:State diagram is also known as statechart diagram that represents the lifecycle of an
element. State diagram consists of following elements.
• A state
• An event
• A transaction
• Initial state
• Final state
Activity diagram:Activity diagram represents the responsibilities and activities of elements. Activity
diagram consists of following elements.
• An action state
• A control-�ow transition
• An initial action state
• A �nal action state
• An object-�ow
• A swimlane
Clear description of each element in the behavioral and structural models is to be discussedin Chapter 4 with the help of proper diagrams.

CHAPTER 3. SOFTWARE DEVELOPMENT PROCESS AND PROGRAMMING BASICS48
3.3 SysML - Basics
SysML stands for Systems Modeling Language, which is a graphical modeling languagefor systems engineering developed by the OMG (Object Management Group), INCOSE(International Council on Systems Engineering's) and ISO AP 233 [3] [11]. This modelinglanguage supports the analysis, speci�cation, design, veri�cation and validation of systemsthat may include components for software, hardware, data, personnel, procedures, andfacilities. SysML reuses a content of UML 2 and provides or gives additional extensions tosatisfy the requirements or usage of the language. Relation between UML and SysML canbe observed in �gure 3.5.
Figure 3.5: UML vs SysML.
According to the �gure 3.5, SysML is an extension of UML 2.0 and also reused a setof UML 2.0. SysML is meant to be compatible and consistent with the UML 2.0.
3.3.1 Diagram Overview of SysML
SysML diagrams comprise diagram elements, such as nodes connected by paths that rep-resent model elements in the SysML model, such as associations, activities, and blocks.
Diagram taxonomy of SysML is shown in �gure 3.6. SysML mostly reuses the UMLdiagrams. UML diagrams such as sequence, state machine, use case, and package diagramsare strictly reused in SysML. The other types of diagrams are modi�ed and they areconsistent with SysML extensions. SysML holds three modi�ed diagrams from UML, suchas activity, block de�nition, internal block diagrams [3]. The internal block diagram, andblock de�nition diagram are similar to the UML composite structure diagram and classdiagram respectively. The activity diagram modi�cation has been also done via the activityextensions.
SysML does not use all of the UML diagrams such as the timing diagram, object di-agram, interaction overview diagram, deployment diagram, and communication diagram.SysML has added two new diagram types including the parametric diagram and the re-quirement diagram [3].
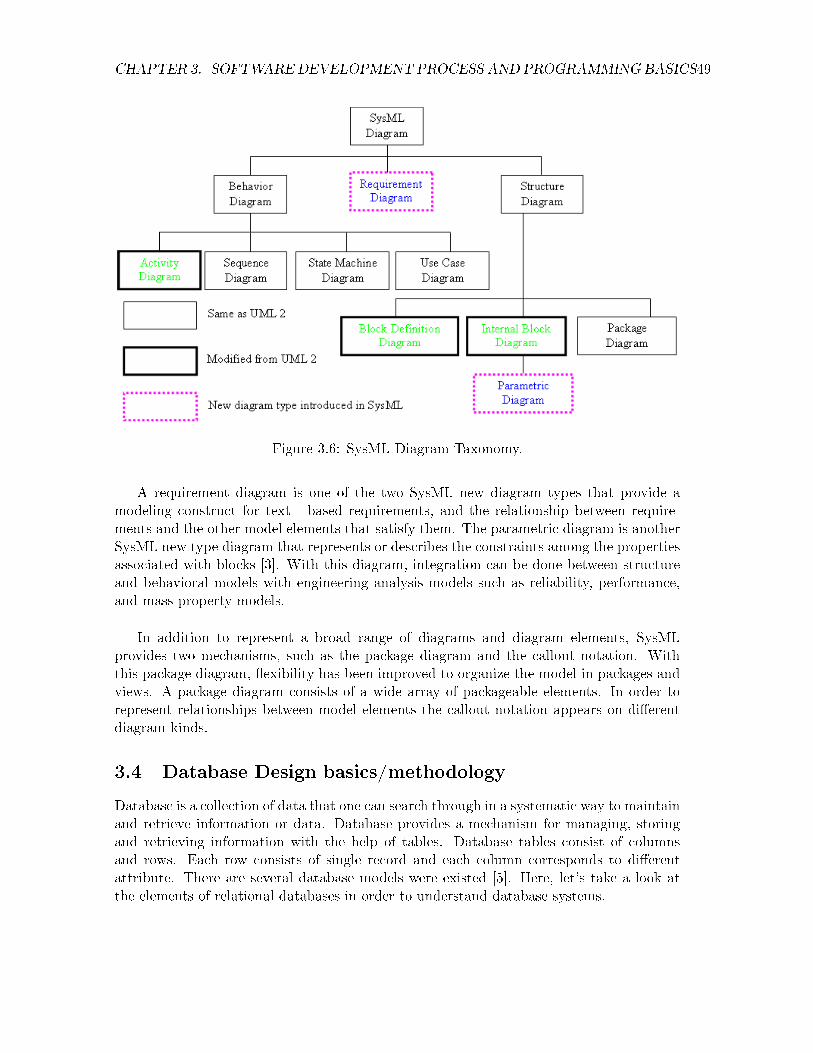
CHAPTER 3. SOFTWARE DEVELOPMENT PROCESS AND PROGRAMMING BASICS49
Figure 3.6: SysML Diagram Taxonomy.
A requirement diagram is one of the two SysML new diagram types that provide amodeling construct for text - based requirements, and the relationship between require-ments and the other model elements that satisfy them. The parametric diagram is anotherSysML new type diagram that represents or describes the constraints among the propertiesassociated with blocks [3]. With this diagram, integration can be done between structureand behavioral models with engineering analysis models such as reliability, performance,and mass property models.
In addition to represent a broad range of diagrams and diagram elements, SysMLprovides two mechanisms, such as the package diagram and the callout notation. Withthis package diagram, �exibility has been improved to organize the model in packages andviews. A package diagram consists of a wide array of packageable elements. In order torepresent relationships between model elements the callout notation appears on di�erentdiagram kinds.
3.4 Database Design basics/methodology
Database is a collection of data that one can search through in a systematic way to maintainand retrieve information or data. Database provides a mechanism for managing, storingand retrieving information with the help of tables. Database tables consist of columnsand rows. Each row consists of single record and each column corresponds to di�erentattribute. There are several database models were existed [5]. Here, let's take a look atthe elements of relational databases in order to understand database systems.

CHAPTER 3. SOFTWARE DEVELOPMENT PROCESS AND PROGRAMMING BASICS50
3.4.1 Elements of Relational Database
Relational database is based on the relational model, which is a group of rules set forthby E.F. Codd based on the relational algebra principles. This mathematical (relationalalgebra) principle de�nes how database management systems should function. The basicrelational database model is a combination of elements such as tables, rows, columns, andkeys.
• Table: Collection of logically related information treated as a unit. Table is madeup of rows and columns.
• Rows: A single occurrence of the data contained in a table and each row is treatedas a single unit.
• Columns: All rows in a table comprise the same set of columns.
• Keys: There are two types of keys namely primary and foreign. A primary key is acolumn whose value uniquely identi�es each row in a table. A foreign key is a columnvalue in one table that is required to match the column value of the primary key inanother table [5].
3.4.2 Table Relationships
Tables can be related to one another by sharing a common column or columns in relationaldatabase. This sharing process can be done by using primary and foreign keys. There arethree types of table relationships, such as one-to-one, one-to-many, and many-to-many. Aone-to-one relationship exists when each row in one table has only row in a second table. Aone-to-many relationship exists when each row in one table has one or many related rowsin a second table. A many-to-many relationship exists when a row in one table has manyrelated rows in a second table [5].
3.4.3 Database Design Basics:
Designing a database is an iterative process, which is mainly concerned with the followingphases:
Data Analysis: Data analysis is the �rst step in the database designing. This is usedto analyze and prepare input data in order to enter or append into the tables.
Logical Database Design: Creating logical database design is an information-gathering,iterative process. This includes following steps:
• De�ne the tables.
• Determine the relationships between the tables.
• Determine the columns of each table.
• Determine the primary keys and the column domain. A domain is the collection ofset of valid values for each column.

CHAPTER 3. SOFTWARE DEVELOPMENT PROCESS AND PROGRAMMING BASICS51
Physical Database Design:It is a re�nement of the logical design and involves the following steps:
• Determine commonly used data.
• Prepare indexes for columns in the table based on data access.
• Improve the database performance.
Physical Implementation:In this phase, after determining the physical design of database, check the software
and hardware components of development and deployment environments, such as storagedevices, disk drive access, operating systems and communication systems to maximize theapplication performance [5].
3.5 Programming Design (basics/methodology)
Programming design is the activity of progressing from a speci�cation of some requiredprogram to a description of the program itself. Program design is a phase model recognizedby the most phase models of software life cycle. A speci�cation of what the program isrequired to do is the input to programming design phase. Decisions are made during thisphase as to how the program will meet these requirements and description of the programis an output of the phase.
3.5.1 Algorithms
A simple de�nition for an algorithm is a set of instructions for solving a problem. Analgorithm is deterministic process for performing a goal which, given an initial state, willterminate in a de�ned end state. The e�ciency of implementation of the algorithm dependsupon size, speed and resource consumption. Algorithms are usually either simulated by aprogram or implemented by a program [85].
Algorithms are very essential to the way process of computers information, because analgorithm tells the computer what speci�c steps to perform in order to �nish the speci�edtask. Information is read from an input source, written to an output sink, and storedfor further processing, when an algorithm is typically associated with processing informa-tion [85]. Algorithms can be expressed in following ways:
• Pseudocode and �owcharts are formed ways to express algorithms that avoid theambiguities.
• Natural language expressions of algorithms tend to be ambiguous and verbose andrarely used for technical or complex algorithms.
• Programming languages are primarily used for expressing algorithms in a form thatcan be executed by a computer
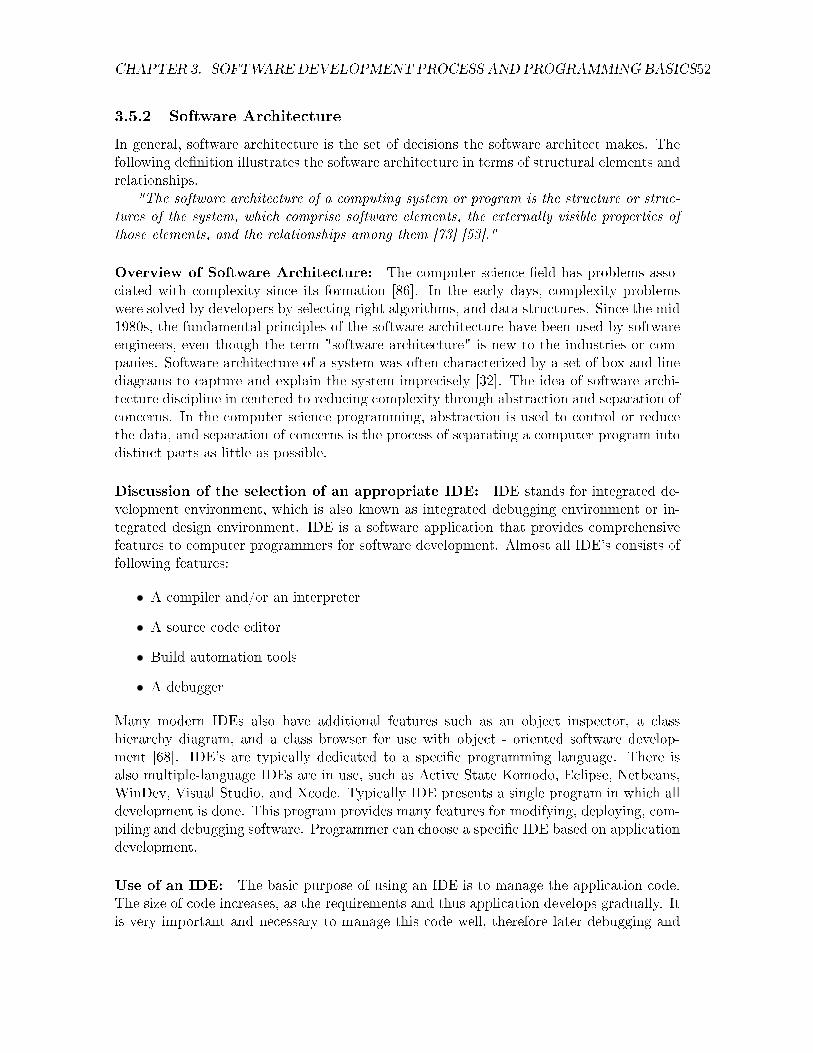
CHAPTER 3. SOFTWARE DEVELOPMENT PROCESS AND PROGRAMMING BASICS52
3.5.2 Software Architecture
In general, software architecture is the set of decisions the software architect makes. Thefollowing de�nition illustrates the software architecture in terms of structural elements andrelationships.
"The software architecture of a computing system or program is the structure or struc-tures of the system, which comprise software elements, the externally visible properties ofthose elements, and the relationships among them [73] [53]."
Overview of Software Architecture: The computer science �eld has problems asso-ciated with complexity since its formation [86]. In the early days, complexity problemswere solved by developers by selecting right algorithms, and data structures. Since the mid1980s, the fundamental principles of the software architecture have been used by softwareengineers, even though the term "software architecture" is new to the industries or com-panies. Software architecture of a system was often characterized by a set of box-and-linediagrams to capture and explain the system imprecisely [32]. The idea of software archi-tecture discipline in centered to reducing complexity through abstraction and separation ofconcerns. In the computer science programming, abstraction is used to control or reducethe data, and separation of concerns is the process of separating a computer program intodistinct parts as little as possible.
Discussion of the selection of an appropriate IDE: IDE stands for integrated de-velopment environment, which is also known as integrated debugging environment or in-tegrated design environment. IDE is a software application that provides comprehensivefeatures to computer programmers for software development. Almost all IDE's consists offollowing features:
• A compiler and/or an interpreter
• A source code editor
• Build automation tools
• A debugger
Many modern IDEs also have additional features such as an object inspector, a classhierarchy diagram, and a class browser for use with object - oriented software develop-ment [68]. IDE's are typically dedicated to a speci�c programming language. There isalso multiple-language IDEs are in use, such as Active State Komodo, Eclipse, Netbeans,WinDev, Visual Studio, and Xcode. Typically IDE presents a single program in which alldevelopment is done. This program provides many features for modifying, deploying, com-piling and debugging software. Programmer can choose a speci�c IDE based on applicationdevelopment.
Use of an IDE: The basic purpose of using an IDE is to manage the application code.The size of code increases, as the requirements and thus application develops gradually. Itis very important and necessary to manage this code well, therefore later debugging and

CHAPTER 3. SOFTWARE DEVELOPMENT PROCESS AND PROGRAMMING BASICS53
modi�cation of code can be carried out smoothly. An IDE helps to manage the applicationby breaking the application into projects, separating �les and grouping the �les into folders[40]. Consider an example for developing an accounts management system that might bebreak into three projects:
• One for user interface application
• Other for accounts implementation
• The last one for information storage
User interface project could be further divide into three folders:
• One for user interface forms
• Other for classes to interact with the accounts
• The last one for classes to interact with the information storage project
An IDE also provides its support from the start of development to the creation of �nalinstallation [40].
IDEs interesting for the thesis work: There are several popular IDEs that are ap-plicable or suitable for the thesis work. Apart from that, two IDEs are discussed here.
Eclipse: This is an IDE, which can be used to develop software in multiple languages.Eclipse was open sourced in November 2001. Eclipse is now controlled by the EclipseFoundation, which is an independent non pro�table organization. Over worldwide, thisIDE is now being used by thousands of developers [13]. A system requirement is the mainfactor for all IDEs. Eclipse runs on today's most popular operating systems, includingWindows XP, Mac OS X, and Linux.
Netbeans: This is an IDE, which can be used for developing software languages as PHP,C, C++, Java, JavaScript, Ruby, Python, and Groovy. Netbeans was �rst open sourced inNovember 2001 and it was brought by Sun Microsystems. Netbeans IDE is used to buildvery e�cient applications and runs on today's most popular operating systems, includingWindows, Linux, Mac OS X, and Solaris. Applications based on the Netbeans can beextended by third party developers [66].
3.6 Software Testing
Software testing is the process of identifying the completeness, correctness, quality, andsecurity of developed software. It is also an empirical investigation conducted to providestakeholders with information about the quality of the product [46]. Software testing canalso be stated as the process of validating and verifying that a software product:
• Works as expected.
• Meets the business and technical requirements that guided its design and development
• Can be implemented with the same characteristics.

CHAPTER 3. SOFTWARE DEVELOPMENT PROCESS AND PROGRAMMING BASICS54
3.6.1 Software Testing Principles
Software testing is an extremely creative and intellectually challenging task. The followingmandatory software testing principles are [17]:
• Testing must be performed by the person that developed the software since they tendto defend the correctness of the program.
• Only the best personnel must be assigned to design, implement, analyze test cases,test data and test results, because testing requires high responsibility and creativity.
• Testing should not be planned under the tacit assumption that no errors will befound.
• The program or application generates correct results when the test is valid.
• Testing is the process of executing software with the intent of �nding errors.
• The application or program must be static (not modi�ed) during the implementationof the set of designed test cases.
• Document test cases and test results.
3.6.2 Possible error types found by Software Testing
Di�erent software tests organize the methods for �nding the possible di�erent error typesis as follows [94]:
• Syntax errors: These errors can be best found by compiler, lint. Examples forthese errors are missing semicolons, values de�ned but not used, order of evolutiondisregarded.
• Data errors: These errors can be best found by software inspection and moduletests. Examples for these errors are Over�ow of variables at calculation, usage ofinappropriate data types.
• Algorithm and logical errors:These errors can be best found by software inspec-tion and module tests.Examples for these errors are wrong program �ow, use of wrongformulas and calculations.
• Interface errors: These errors can be best found by software inspection, moduletests and component tests. Examples for these errors are Overlapping ranges, rangeviolation, unexpected inputs.
• Operating system errors, architecture and design errors: These errors canbe best found by Design inspection, integration tests. Examples for these errors aredisturbances by OS interruptions, timing problems, lifetime and duration problems.
• Integration errors: These errors can be best found by Integration tests and systemtests. Examples for these errors are resource problems (run time, stack, registers,memory, etc).

CHAPTER 3. SOFTWARE DEVELOPMENT PROCESS AND PROGRAMMING BASICS55
• System errors: These errors can be best found by System tests. Examples for theseerrors are wrong system behaviour and speci�cation errors.
Summary: In this chapter, the following concepts were introduced.
• First, basics of software development process and the requirements engineering con-cepts for the software systems were discussed. There are several software developmentmodels. But, only the water fall method has discussed, because it is simple methodand also the basic principles of this method has helped to this thesis.
• Next, basics of modeling languages and database design methods were discussed.Elements in both structure and behavioral model have been showed and each elementshould be discussed in Chapter 5 diagrammatically.
• Finally, architecture, selection of integrated development environment and testingprinciples for software development were discussed.

Chapter 4
Software Design and ImplementationProcess
4.1 UML design
Basic concepts of UML design has been discussed in section 3.3. This section showspractical UML diagrams.
4.1.1 Use-case diagram
UML use-case diagram is shown in �gure 4.1. Brief description of each element can beexplained as follows:
Figure 4.1: UML use-case diagram.
• An actor: Shown as a stick �gure. This represents users and external elements withwhich the system we are discussing interacts.
56

CHAPTER 4. SOFTWARE DESIGN AND IMPLEMENTATION PROCESS 57
• A use case: Shown as an ellipse. This represents a functional requirement that isdescribed from the perspective of the users of a system.
• communication association: Shown as a solid-line path from an actor to a usecase. This represents that the actor uses the use case.
4.1.2 Class diagram
UML class diagram is shown in �gure 4.2. Brief description of each element can be ex-plained as follows:
• A class: Shown as a solid-outline rectangle labeled with a name. This represents ageneral concept.
• An attribute: Shown as a text string in a class's second compartment. This repre-sents what objects of the class know.
• An operation: Shown as a text string in a class's third compartment. This repre-sents what objects of the class can do.
• An association: Shown as a solid-line path. This represents a relationship betweenclasses.
Figure 4.2: UML class diagram.

CHAPTER 4. SOFTWARE DESIGN AND IMPLEMENTATION PROCESS 58
4.1.3 Object diagram
UML object diagram is shown in �gure 4.3. Brief description of each element can beexplained as follows:
• An Object: Shown as a solid-line rectangle labeled with a name.
• A link: Shown as a solid-line path. This represents a speci�c relationship betweenobjects.
• An attribute: Shown as a text string followed by an equal symbol and its value inan object's second compartment. This represents what the object knows.
Figure 4.3: UML object diagram.
4.1.4 Component diagram
UML component diagram is shown in �gure 4.4. Brief description of each element can beexplained as follows:
• A component: Shown as a rectangle with two small rectangles. This represents apart of the system that exists while the system is executing.
• A dependency relationship: Shown as an arrow. This represents that the clientcomponent uses the supplier component.

CHAPTER 4. SOFTWARE DESIGN AND IMPLEMENTATION PROCESS 59
Figure 4.4: UML component diagram.
4.1.5 Deployment diagram
UML deployment diagram is shown in �gure 4.5. Brief description of each element can beexplained as follows:
• A node: Shown as a three dimensional rectangle. This represents a resource that isavailable during execution time.
• A communication association: Shown as a solid-line path between nodes. Thisrepresents a communication path between the nodes.
4.1.6 Sequence diagram
UML sequence diagram is shown in �gure 4.6. Brief description of each element can beexplained as follows:
• Classes and objects: Classes and objects are shown much the same way as on classand object diagrams.
• A lifeline: Shown as a vertical dashed line from an element. This represents theexistence of the element over time.
• A communication: This is shown as a horizontal solid arrow from the lifeline senderto the lifeline of the receiver.
4.1.7 Collaboration diagram
UML collaboration diagram is shown in �gure 4.7. Brief description of each element canbe explained as follows:
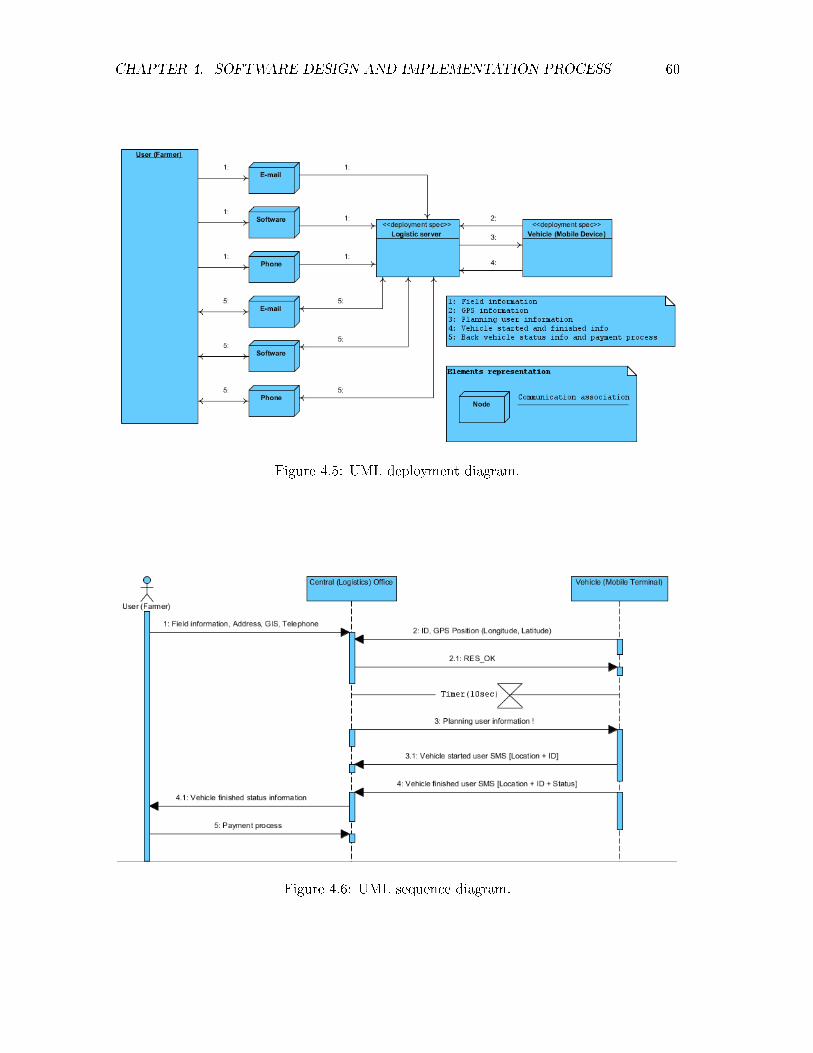
CHAPTER 4. SOFTWARE DESIGN AND IMPLEMENTATION PROCESS 60
Figure 4.5: UML deployment diagram.
Figure 4.6: UML sequence diagram.
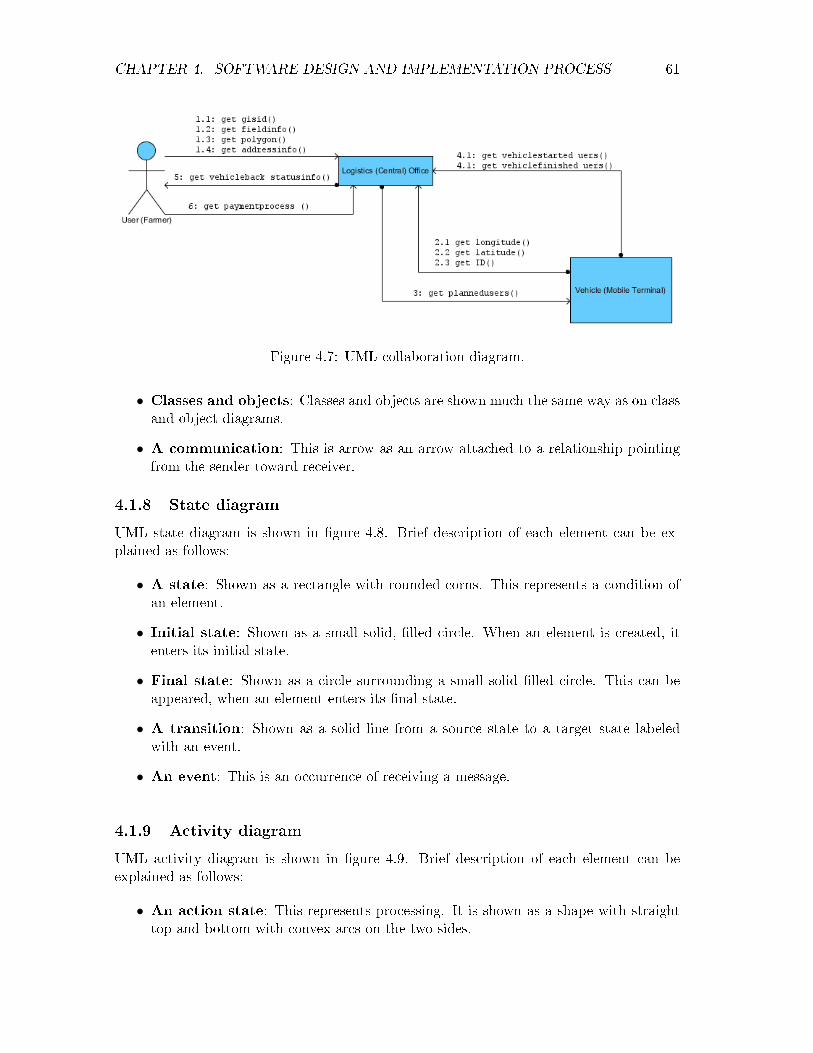
CHAPTER 4. SOFTWARE DESIGN AND IMPLEMENTATION PROCESS 61
Figure 4.7: UML collaboration diagram.
• Classes and objects: Classes and objects are shown much the same way as on classand object diagrams.
• A communication: This is arrow as an arrow attached to a relationship pointingfrom the sender toward receiver.
4.1.8 State diagram
UML state diagram is shown in �gure 4.8. Brief description of each element can be ex-plained as follows:
• A state: Shown as a rectangle with rounded corns. This represents a condition ofan element.
• Initial state: Shown as a small solid, �lled circle. When an element is created, itenters its initial state.
• Final state: Shown as a circle surrounding a small solid �lled circle. This can beappeared, when an element enters its �nal state.
• A transition: Shown as a solid line from a source state to a target state labeledwith an event.
• An event: This is an occurrence of receiving a message.
4.1.9 Activity diagram
UML activity diagram is shown in �gure 4.9. Brief description of each element can beexplained as follows:
• An action state: This represents processing. It is shown as a shape with straighttop and bottom with convex arcs on the two sides.
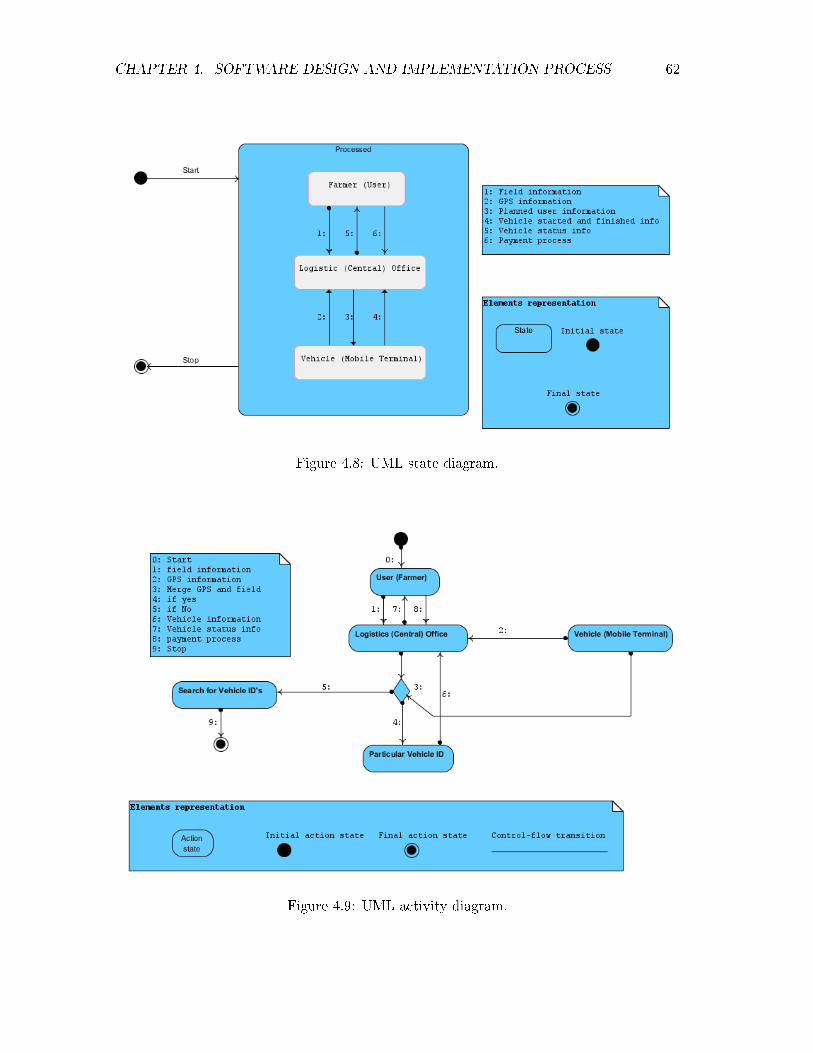
CHAPTER 4. SOFTWARE DESIGN AND IMPLEMENTATION PROCESS 62
Figure 4.8: UML state diagram.
Figure 4.9: UML activity diagram.

CHAPTER 4. SOFTWARE DESIGN AND IMPLEMENTATION PROCESS 63
• A control �ow transition: Shown as a solid line from a source action state to atarget action state. This represents that the target action starts its processing, oncethe source action state completes its processing.
• An initial action state: Shown as a small solid �lled circle. The control-�owtransition originating from the initial state.
• A �nal action state: Shown as a circle surrounding a small �lled circle. Thecontrol-�ow transition ends with the �nal state.
4.2 DB design
This section describes the information about practical database design. In this work,Microsoft Access 2000 version has been used for the database design. DB form is shownin �gure 4.10.
Figure 4.10: Database Form.
New �le in the DB form consists of objects such as tables, queries, forms, reports andform. All of these objects are used for designing a database. Table design view is shownin �gure 4.11, which consists of several features such as create table in design view, createtable by using wizard and create table by entering data. Entering and saving the datavalues are shown in �gure 4.12.
This work has been used the Delphi programming for Graphic User Interface (GUI)that access the data from MS Access database. Source code for accessing and deleting thedata from database is as follows:

CHAPTER 4. SOFTWARE DESIGN AND IMPLEMENTATION PROCESS 64
Figure 4.11: Table designing view.
Figure 4.12: Store the data values in table.

CHAPTER 4. SOFTWARE DESIGN AND IMPLEMENTATION PROCESS 65
adoconnection1.Close;adoconnection1.ConnectionString:='Provider=Microsoft.Jet.OLEDB.4.0; DataSource='+extract�lepath (application.ExeName) +�; Persist Security Info=False';
adotable1.TableName:= SELECT OBJECT_ID FROM MRW_OBJECT WHERESCHLAG_ID = '6';
adotable1.Open;adoconnection1.open;beginadotable1.Append;
adotable1.�eldbyname ('JOB_ID').AsString:= 'OBJECT_ID';
adotable1.close;adoconnection1.close;
adoconnection1.ConnectionString:='Provider=Microsoft.Jet.OLEDB.4.0; DataSource='+extract�lepath (application.ExeName) +�; Persist Security Info=False';
adotable1.TableName:= SELECT OBJECT_ID FROM MRW_OBJECT WHERESCHLAG_ID = '6';
adotable1.Open;adoconnection1.open;beginadotable1.Delete;
adotable1.�eldbyname ('JOB_ID').AsString:= 'OBJECT_ID';
adotable1.close;adoconnection1.close;
4.3 Software architecture
4.3.1 Out�ow of software architecture
The out�ow architecture of software is shown in �gure 4.13. This architecture illustratesthe external objects of the overall work. There are total three objects that are playedmajor role in this project work. They are farmer, logistics database, and vehicle. Thiswork aims to crate a software that provides reliable communication between three objects.
Working method of software is as follows:
• First, the user sends his/her address, �eld and GIS information to the logistics o�ce
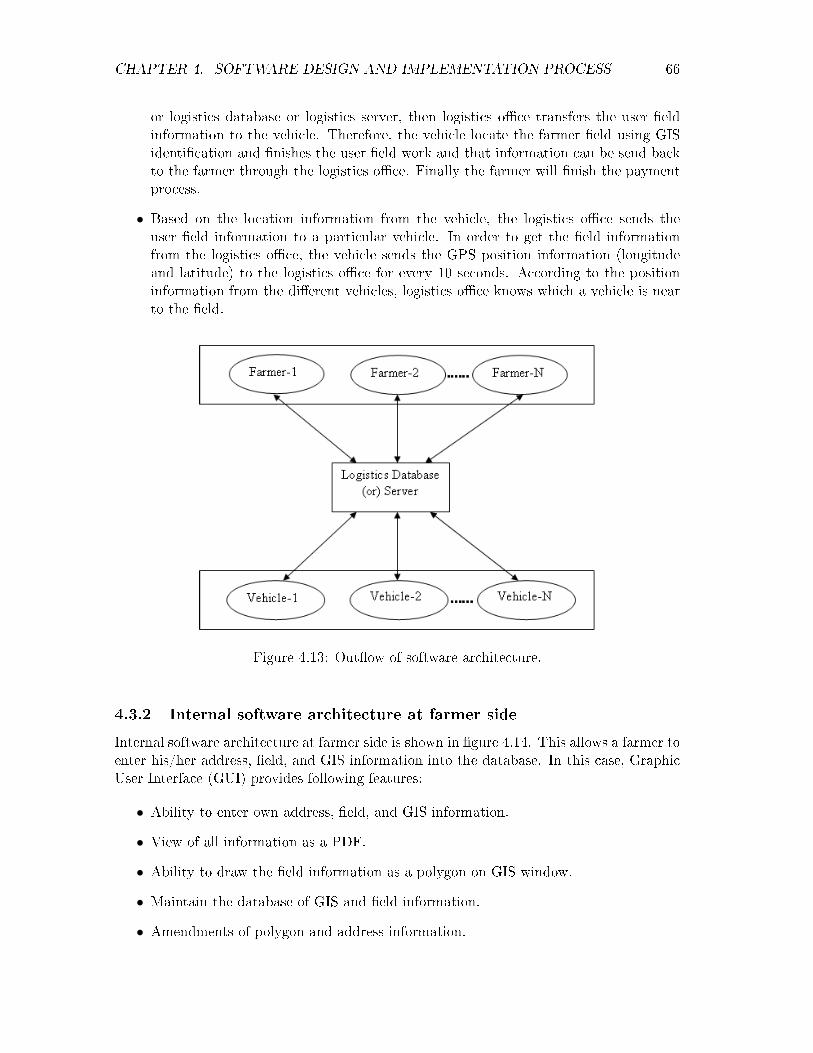
CHAPTER 4. SOFTWARE DESIGN AND IMPLEMENTATION PROCESS 66
or logistics database or logistics server, then logistics o�ce transfers the user �eldinformation to the vehicle. Therefore, the vehicle locate the farmer �eld using GISidenti�cation and �nishes the user �eld work and that information can be send backto the farmer through the logistics o�ce. Finally the farmer will �nish the paymentprocess.
• Based on the location information from the vehicle, the logistics o�ce sends theuser �eld information to a particular vehicle. In order to get the �eld informationfrom the logistics o�ce, the vehicle sends the GPS position information (longitudeand latitude) to the logistics o�ce for every 10 seconds. According to the positioninformation from the di�erent vehicles, logistics o�ce knows which a vehicle is nearto the �eld.
Figure 4.13: Out�ow of software architecture.
4.3.2 Internal software architecture at farmer side
Internal software architecture at farmer side is shown in �gure 4.14. This allows a farmer toenter his/her address, �eld, and GIS information into the database. In this case, GraphicUser Interface (GUI) provides following features:
• Ability to enter own address, �eld, and GIS information.
• View of all information as a PDF.
• Ability to draw the �eld information as a polygon on GIS window.
• Maintain the database of GIS and �eld information.
• Amendments of polygon and address information.

CHAPTER 4. SOFTWARE DESIGN AND IMPLEMENTATION PROCESS 67
• Analyze, view, and send address, GIS and �eld information to the logistics o�ce.
• Possible to send address, GIS and �eld information to the nearest vehicle.
Figure 4.14: Internal software architecture at farmer.
4.3.3 Internal software architecture at Logistics O�ce
Internal software architecture at logistics o�ce side is shown in �gure 4.15. This allowsfarmer information for processing. In this case, Graphic User Interface (GUI) providesfollowing features:
• Ability to enter new farmer address, �eld, and GIS information.
• View of farmer information as a PDF.
• Maintain the database of GIS and �eld information.
• Possible to send farmer address, GIS and �eld information to the nearest vehicle.
• Amendments of farmer polygon and address information.
• Designed to receive the address, GIS and �eld information from the nearest vehicle.
• Possible to �lter the all types of users.
• Ability to see the farmers in the same route.

CHAPTER 4. SOFTWARE DESIGN AND IMPLEMENTATION PROCESS 68
Figure 4.15: Internal software architecture at logistics side.
4.3.4 Internal software architecture at Vehicle
Internal software architecture at vehicle side is shown in �gure 4.16. This allows farmerprocessing information from logistics o�ce to �nish the farmer �eld work. In this case,Graphic User Interface (GUI) provides following features:
• Ability to enter the new farmer address, �eld, GIS information.
• View of farmer information as a PDF.
• Maintain the database of GIS and �eld information.
• Possible to send farmer address, GIS and �eld information to the logistics o�ce.
• Amendments of user polygon and address information.
• Designed to receive the address, GIS and �eld information from the logistics o�ce.
• Possible to �lter all types of users.
• Ability to see the users in the same route.

CHAPTER 4. SOFTWARE DESIGN AND IMPLEMENTATION PROCESS 69
Figure 4.16: Internal software architecture at vehicle side.
4.4 Selection of the appropriate IDE's
This work has been used two di�erent IDE's for two di�erent software languages. They areDelphi IDE for Delphi code implementation and Netbeans IDE for J2ME programminglanguages. Delphi IDE is used for implementing Graphic User Interface (GUI) at threedi�erent objects (farmer, logistics o�ce, vehicle (mobile terminal)). Netbeans IDE is usedfor sending/receiving GPS information, save the GPS coordinates into the mobile device,and also possible to send these coordinates from mobile to mobile as a text message.
4.5 Source code for software implementation
Source code of this thesis work is to be shown in Chapter 7 (Annex 1).
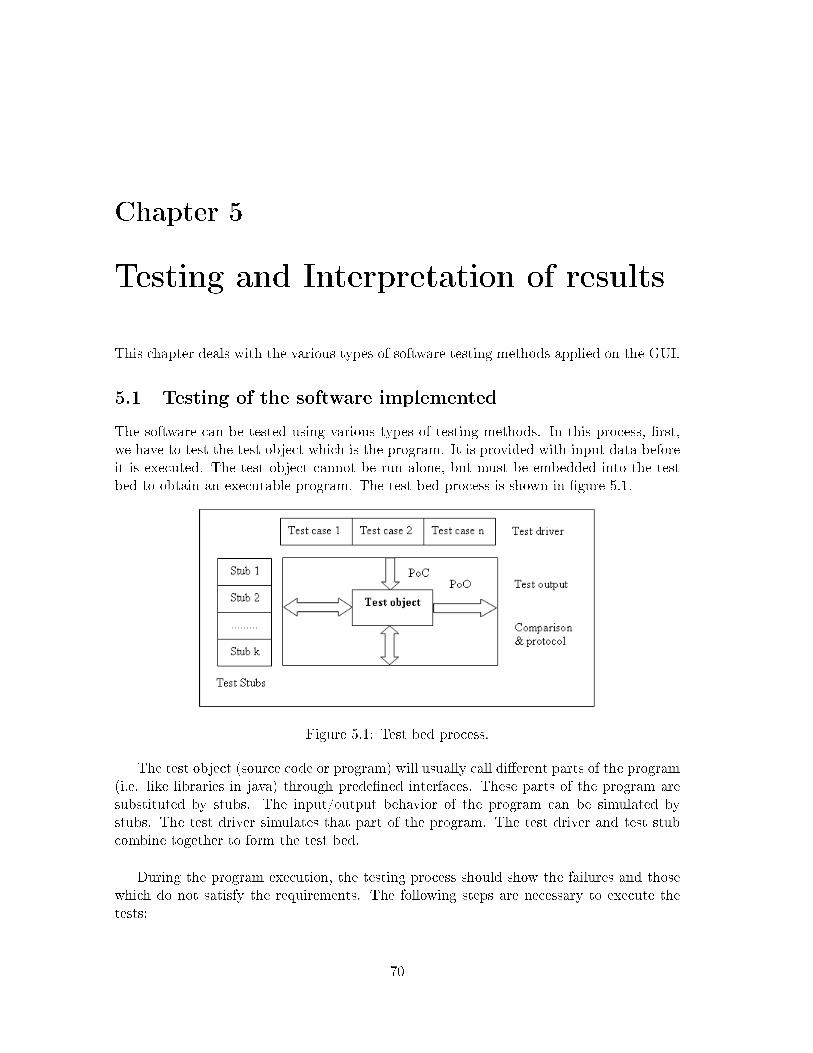
Chapter 5
Testing and Interpretation of results
This chapter deals with the various types of software testing methods applied on the GUI.
5.1 Testing of the software implemented
The software can be tested using various types of testing methods. In this process, �rst,we have to test the test object which is the program. It is provided with input data beforeit is executed. The test object cannot be run alone, but must be embedded into the testbed to obtain an executable program. The test bed process is shown in �gure 5.1.
Figure 5.1: Test bed process.
The test object (source code or program) will usually call di�erent parts of the program(i.e. like libraries in java) through prede�ned interfaces. These parts of the program aresubstituted by stubs. The input/output behavior of the program can be simulated bystubs. The test driver simulates that part of the program. The test driver and test stubcombine together to form the test bed.
During the program execution, the testing process should show the failures and thosewhich do not satisfy the requirements. The following steps are necessary to execute thetests:
70
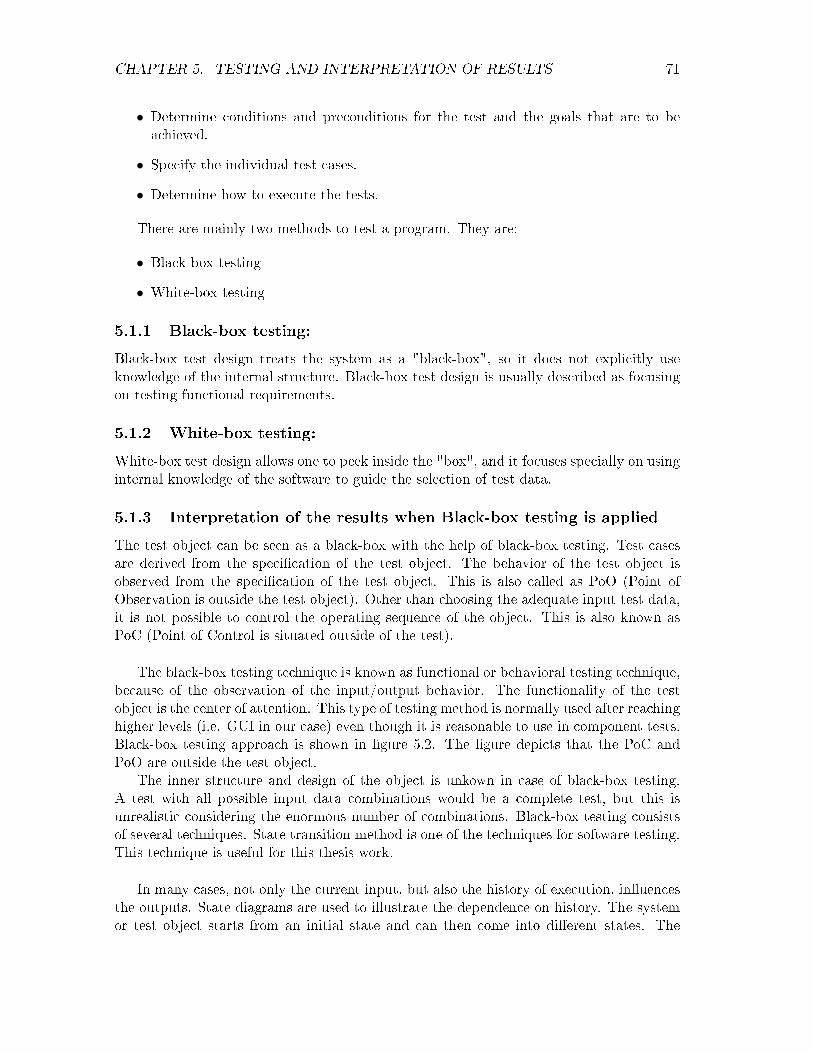
CHAPTER 5. TESTING AND INTERPRETATION OF RESULTS 71
• Determine conditions and preconditions for the test and the goals that are to beachieved.
• Specify the individual test cases.
• Determine how to execute the tests.
There are mainly two methods to test a program. They are:
• Black-box testing
• White-box testing
5.1.1 Black-box testing:
Black-box test design treats the system as a "black-box", so it does not explicitly useknowledge of the internal structure. Black-box test design is usually described as focusingon testing functional requirements.
5.1.2 White-box testing:
White-box test design allows one to peek inside the "box", and it focuses specially on usinginternal knowledge of the software to guide the selection of test data.
5.1.3 Interpretation of the results when Black-box testing is applied
The test object can be seen as a black-box with the help of black-box testing. Test casesare derived from the speci�cation of the test object. The behavior of the test object isobserved from the speci�cation of the test object. This is also called as PoO (Point ofObservation is outside the test object). Other than choosing the adequate input test data,it is not possible to control the operating sequence of the object. This is also known asPoC (Point of Control is situated outside of the test).
The black-box testing technique is known as functional or behavioral testing technique,because of the observation of the input/output behavior. The functionality of the testobject is the center of attention. This type of testing method is normally used after reachinghigher levels (i.e. GUI in our case) even though it is reasonable to use in component tests.Black-box testing approach is shown in �gure 5.2. The �gure depicts that the PoC andPoO are outside the test object.
The inner structure and design of the object is unkown in case of black-box testing.A test with all possible input data combinations would be a complete test, but this isunrealistic considering the enormous number of combinations. Black-box testing consistsof several techniques. State transition method is one of the techniques for software testing.This technique is useful for this thesis work.
In many cases, not only the current input, but also the history of execution, in�uencesthe outputs. State diagrams are used to illustrate the dependence on history. The systemor test object starts from an initial state and can then come into di�erent states. The

CHAPTER 5. TESTING AND INTERPRETATION OF RESULTS 72
Figure 5.2: Black-box testing approach.
test of a Graphic User Interface (GUI) is an example for state transition method. TheGUI consists of a set of screens and user controls, such as menus, dialog boxes, check box,text box, combo box and buttons. Between those, the user can switch back and forth. Ifscreens and user controls are seen as states and input reactions as state transitions thenthe GUI can be modelled as a �nite state machine. The GUI test is shown in �gure 5.3
5.1.4 Interpretation of the results when White box testing is applied
In white box testing, the user is aware of the test object with the help of which he buildsa test design. The internal processing of the test object as well as the output is analyzed,while executing the test cases. This process is also known as the Point of Observation (PoO)which is inside the test object. This white box testing is also called as structural testing,because the test designer considers the structure, which includes component hierarchy, �owcontrol, and data �ow of the test object. This testing is mostly applied at the lower levelsof the testing, i.e. component and integration test. White box testing approach is shownin �gure 5.4. The �gure depicts that the PoC and/or PoO are inside the test object.
This testing method is based on source code of the test object. Therefore, these tech-niques are often called as code-based testing techniques. The main idea of white boxtechniques is to execute every part of the test object at least once. Flow oriented test casesare identi�ed, by analyzing the program logic and then executed. The basic white box testcase design techniques are as follows:
• Statement Coverage
• Branch Coverage
Statement Coverage:
This method mainly focuses on each statement of the test object. The test cases shall
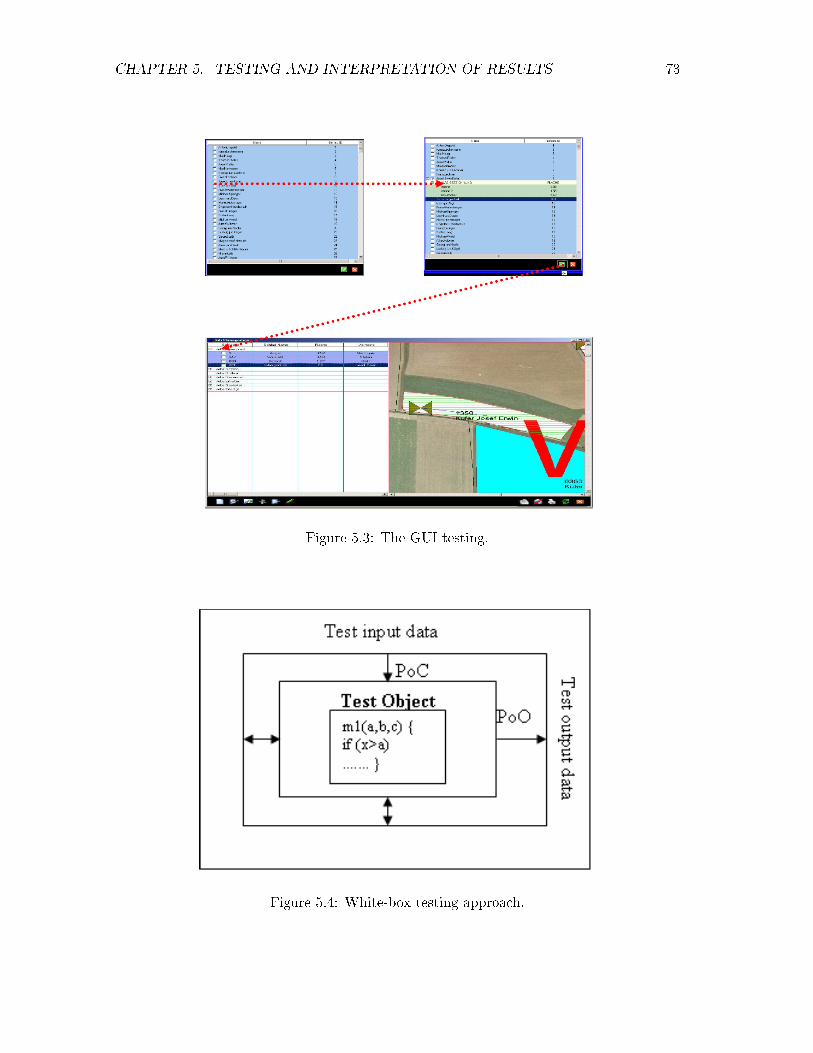
CHAPTER 5. TESTING AND INTERPRETATION OF RESULTS 73
Figure 5.3: The GUI testing.
Figure 5.4: White-box testing approach.

CHAPTER 5. TESTING AND INTERPRETATION OF RESULTS 74
execute all statements of the test object.
• The �rst step is to translate the source code into a control �ow graph.
• The graph makes it easier to specify in detail the control elements that must becovered.
• In the graph, the statements are represented as edges. If sequences of unconditionalstatements appear in the program, then they are illustrated as one single node,because execution of the �rst statement of the sequence guarantees that all followingstatements will be executed.
• During the execution, all statements (IF, CASE, WHILE, FOR) are covered.
Branch Coverage:
Branch coverage of the control �ow graph is a more advanced criterion for white boxtesting. For example, the edges in the graph are the center of attraction. In this case, theexecution of each statement is not considered, but rather the execution of decisions. Theresult of the decision determines which statement is executed next. Testing should makesure every decision is executed with both (TRUE and FALSE) possible outcomes.
5.2 Comment on tests conducted
As we have already discussed, there is a lot of di�erence between white box and blackbox software testing methods. Applying black box technique for software testing is anadvantage for customer, because there is no need to check the source code. The customersimply checks the results of Graphic User Interface (GUI), such as text boxes, tool buttonsand check boxes and so on. Therefore, the customer informs to the company/supplierwho produces the product, if operation of product is not working properly. In other case,applying white box technique for software testing is an advantage for programmer, becauseit allows the programmer to peek and the check the program or source code. This techniqueis also convenient for programmer to debug/run the program for every statement/step.
5.3 Software implementation process
In this process, �rst the farmer sends his/her �eld and personal information to the centralo�ce (logistics o�ce). With the help of this �eld information, the logistics o�ce �nds theunique GIS ID of that particular �eld. It then passes that information to the vehicle whichultimately �nishes the �eld work.
5.3.1 Graphical User Interface of the software developed
The following �gure 5.5 consists of various elements. They are:
• Basic data (Farmer information)
• Fields (Field information)

CHAPTER 5. TESTING AND INTERPRETATION OF RESULTS 75
• Planning (Planned �eld information)
• Harvest data (Harvest information)
• Mobile terminal (Vehicle)
• JobManagement (Central O�ce)
Figure 5.5: GUI of the software.
We can access the central o�ce GUI by pressing the JobManagement button as shownin above �gure. The form at the central o�ce looks as in �gure 5.6. It consists of sixdi�erent �elds. They are:
• Unplanned Tasks: Consists of tasks that are to be planned according to the infor-mation given by the farmer.
• Planned Tasks: These are the tasks which have been planned from the informationgiven.
• Outbox Tasks: Those tasks which do not reach the vehicle due to:
� Information delays
� Vehicle going o�ine
� Server problem
• Send Tasks: These are the tasks which have been successfully sent from the centralo�ce to the vehicle.
• Started Tasks: Tasks which are at working stage.
• Finished Tasks: Tasks that have been completed.

CHAPTER 5. TESTING AND INTERPRETATION OF RESULTS 76
Figure 5.6: GUI at the central o�ce.
By clicking on the 'Unplanned task' button in the JobManagement form, the 'Un-planned Task' form appears as shown in �gure 5.7. In this form, the name and the farmeridenti�cation will be generated from the database. If you click the check box beside afarmer name, a pop-up appears which displays all the �eld related information as shownin �gure 5.8.
Now select one of the �eld element names and click the update button as shown in�gure 5.9.
The updated information will automatically appear in the unplanned tasks menu asshown in �gure 5.10.
By clicking on the unplanned tasks as shown in above �gure, one more new button willopen at left bottom side of the window namely 'planning a task'. The use of this button isto display the received tasks, activity, machine ID, and comment. And also observe a newwindow (Info-Fenster) at right bottom side which displays the information about plannedtasks. The new button and the new window are to be shown in �gure 5.11.
By selecting the unplanned tasks and pressing the planning a task button, a windowwill appear as shown in �gure 5.12. Enter all �elds in that form and update them. Theupdated information will appear in the planned tasks �eld as shown in �gure 5.1�g. 5.12.This information can be sent to the vehicle by pressing the export button.
We can ability to enter the new farmer information by clicking the new farmer button.With this button also possible to edit the new farmer information like draw the farmer�eld in the GIS window.
Filter window is shown in �gure 5.16. This will match the same object names, such as�eldname, name, and machine.
By checking di�erent items in the �lter window in various sections there will open abutton in the middle of the each two boxes, from that choose a format either AND or ORand click the update button. The common items are displayed in the JobManagement

CHAPTER 5. TESTING AND INTERPRETATION OF RESULTS 77
Figure 5.7: Unplanned Task Processed form.
Figure 5.8: Unplanned Task Processed form after click the check box.

CHAPTER 5. TESTING AND INTERPRETATION OF RESULTS 78
Figure 5.9: Unplanned Task Processed form with updated the selected �eld task.
Figure 5.10: Updated unplanned task processed information.

CHAPTER 5. TESTING AND INTERPRETATION OF RESULTS 79
Figure 5.11: Planning a Task and Info - Fenster information.
Figure 5.12: Planning a Task window.
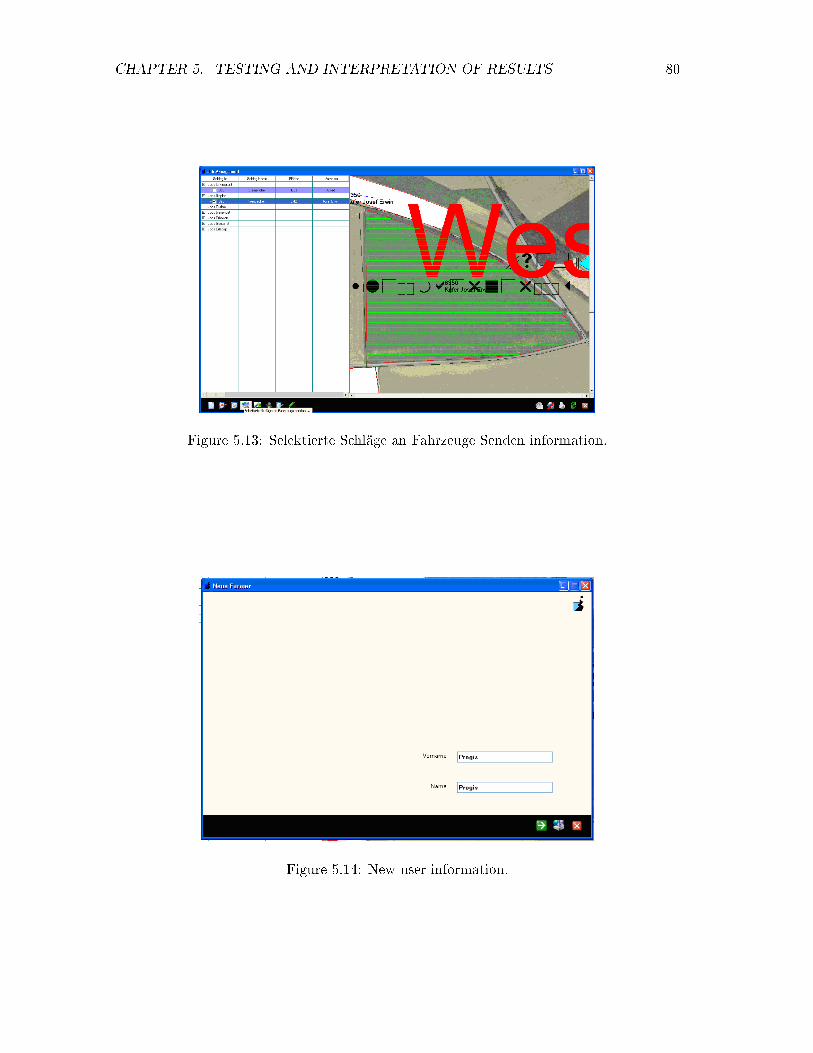
CHAPTER 5. TESTING AND INTERPRETATION OF RESULTS 80
Figure 5.13: Selektierte Schläge an Fahrzeuge Senden information.
Figure 5.14: New user information.

CHAPTER 5. TESTING AND INTERPRETATION OF RESULTS 81
Figure 5.15: New user address information.
Figure 5.16: Filter window.

CHAPTER 5. TESTING AND INTERPRETATION OF RESULTS 82
window.VirtualEarth button is the last button at the central o�ce and this is used for viewing
the various maps, Images, Roads map and for �nding the location.Mobile terminal (vehicle) window will open by clicking the mobile terminal button as
shown in �gure 5.5. The mobile terminal window is shown in �gure 5.17.
Figure 5.17: Mobile terminal form.
Vehicle should check the tasks in the tasks received and start the task by usingthe start/�nished button. For �nishing these tasks, the vehicle should check the samestart/�nished button. Start and �nished task information at vehicle will also being possi-ble to see at central o�cle. And in this mobile terminal, vehicle also possible to plan thetask like same as occurs at the central o�ce by using 'plan a task' button.
Vehicle uses the mobile device to �nd GPS information and send that information tothe logistics server through URL address. Along with GPS information, vehicle also sendsID, status and comment to the logistics server. The GUI functionalities at the mobiledevice are to be shown in �gure 5.19. The vehicle uses the following steps:
• Vehicle �nds the GPS information on the mobile device and sends those to Logisticsserver.
• Vehicle gets the processed job form logistics server.
• Vehicle �nishes the task and sends status information back to the server.

CHAPTER 5. TESTING AND INTERPRETATION OF RESULTS 83
Figure 5.18: JobManagement window at mobile terminal.
Figure 5.19: GPS Information.
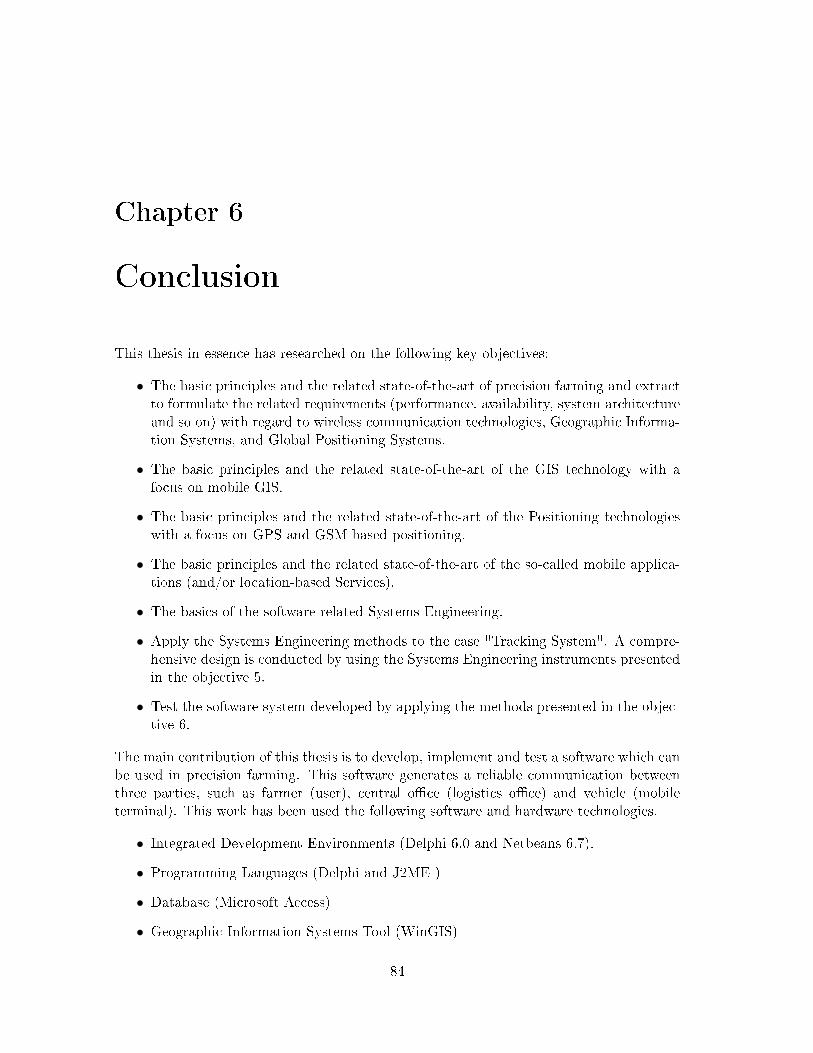
Chapter 6
Conclusion
This thesis in essence has researched on the following key objectives:
• The basic principles and the related state-of-the-art of precision farming and extractto formulate the related requirements (performance, availability, system architectureand so on) with regard to wireless communication technologies, Geographic Informa-tion Systems, and Global Positioning Systems.
• The basic principles and the related state-of-the-art of the GIS technology with afocus on mobile GIS.
• The basic principles and the related state-of-the-art of the Positioning technologieswith a focus on GPS and GSM based positioning.
• The basic principles and the related state-of-the-art of the so-called mobile applica-tions (and/or location-based Services).
• The basics of the software-related Systems Engineering.
• Apply the Systems Engineering methods to the case "Tracking System". A compre-hensive design is conducted by using the Systems Engineering instruments presentedin the objective 5.
• Test the software system developed by applying the methods presented in the objec-tive 6.
The main contribution of this thesis is to develop, implement and test a software which canbe used in precision farming. This software generates a reliable communication betweenthree parties, such as farmer (user), central o�ce (logistics o�ce) and vehicle (mobileterminal). This work has been used the following software and hardware technologies.
• Integrated Development Environments (Delphi 6.0 and Netbeans 6.7).
• Programming Languages (Delphi and J2ME )
• Database (Microsoft Access)
• Geographic Information Systems Tool (WinGIS)
84

CHAPTER 6. CONCLUSION 85
• Mobile Terminals (E71 and N95)
• Laptop (Acer)
• Wireless Internet Technologies (Wi-Fi and GPRS)
• Global Positioning Systems
• Geographic Information Systems
Chapter 7
Annex1 - Codeimplementation(Delphi, J2ME)
/* Locating the coordinates (Longitude, Latitude, Altitude) */****************************************************************/*/* To change this template, choose Tools or Templates/*/* santhosh1MIDlet.java/*/* and open the template in the editor./*package GPSCoordinates;import javax.microedition.midlet.*;import javax.microedition.lcdui.*;import javax.microedition.location.*;/**/* @author Santhosh/*/public class santhosh1MIDlet extends MIDlet implements CommandListenerprivate boolean midletPaused = false;//<editor-fold defaultstate="collapsed" desc=" Generated Fields ">private Command exitCommand;private Form form;private StringItem stringItem;//</editor-fold>/**/* The santhosh1MIDlet constructor./*/public Quali�edCoordinates Q;public santhosh1MIDlet (){}
86

CHAPTER 7. ANNEX1 - CODE IMPLEMENTATION(DELPHI, J2ME) 87
//<editor-fold defaultstate="collapsed" desc=" Generated Methods ">//</editor-fold>//<editor-fold defaultstate="collapsed" desc=" Generated Method: initialize ">/**/ * Initilizes the application./*/private void initialize(){// write pre-initialize user code here// write post-initialize user code here}//</editor-fold>//<editor-fold defaultstate="collapsed" desc=" Generated Method: startMIDlet ">public void startMIDlet(){// write pre-action user code hereswitchDisplayable(null, getForm());// write post-action user code here}//</editor-fold>//<editor-fold defaultstate="collapsed" desc=" Generated Method: resumeMIDlet ">public void resumeMIDlet(){// write pre-action user code here// write post-action user code here}//</editor-fold>//<editor-fold defaultstate="collapsed" desc=" Generated Method: switchDisplayable">/**/* Switches a current displayable in a display./* @param alert the Alert which is temporarily set to the display; if<code>null</code>, then <code>nextDisplayable</code> is set immediately/* @param nextDisplayable the Displayable to be set/*/public void switchDisplayable(Alert alert, Displayable nextDisplayable){// write pre-switch user code hereDisplay display = getDisplay();if (alert == null)
display.setCurrent(nextDisplayable);else
display.setCurrent(alert, nextDisplayable);

CHAPTER 7. ANNEX1 - CODE IMPLEMENTATION(DELPHI, J2ME) 88
// write post-switch user code here}//</editor-fold>//<editor-fold defaultstate="collapsed" desc=" Generated Method: commandAction forDisplayables ">/**/* @param command the Command that was invoked/* @param displayable the Displayable where the command was invoked/*/public void commandAction(Command command, Displayable displayable){// write pre-action user code hereif (displayable == form){if (command == exitCommand){// write pre-action user code hereexitMIDlet();// write post-action user code here}}// write post-action user code here}//</editor-fold>//<editor-fold defaultstate="collapsed" desc=" Generated Getter: exitCommand ">/**/* Returns an initiliazed instance of exitCommand component./* @return the initialized component instance/*/public Command getExitCommand(){if (exitCommand == null){// write pre-init user code hereexitCommand = new Command("Exit", Command.EXIT, 0);// write post-init user code here}return exitCommand;}//</editor-fold>//<editor-fold defaultstate="collapsed" desc=" Generated Getter: form ">/**/* Returns an initiliazed instance of form component./* @return the initialized component instance/*/public Form getForm()

CHAPTER 7. ANNEX1 - CODE IMPLEMENTATION(DELPHI, J2ME) 89
{if (form == null){// write pre-init user code hereform = new Form("form", new Item[] { getStringItem() });form.addCommand(getExitCommand());form.setCommandListener(this);// write post-init user code hereform.append("Finding for Location...");Display.getDisplay(this).setCurrent(form);//boolean found = false;//while (found == false)try {Criteria c=new Criteria();c.setHorizontalAccuracy(5000);c.setVerticalAccuracy(5000);// c.setPreferredPowerConsumption(Criteria.POWER_USAGE_LOW);LocationProvider lp=LocationProvider.getInstance(c);Location loc=lp.getLocation(600);Q=loc.getQuali�edCoordinates();if (Q!=null){ form.append("Altitude:" +Q.getAltitude()+ "");form.append("Latitude:"+Q.getLatitude()+"");form.append("Longitude:"+Q.getLongitude()+"");}else{form.append("Location API failed");}//found = true;}catch(Exception e)form.append("Exception:"+e);}//} // while}return form;}//</editor-fold>//<editor-fold defaultstate="collapsed" desc=" Generated Getter: stringItem ">/**/* Returns an initiliazed instance of stringItem component./* @return the initialized component instance/*/public StringItem getStringItem() {if (stringItem == null) {// write pre-init user code here
CHAPTER 7. ANNEX1 - CODE IMPLEMENTATION(DELPHI, J2ME) 90
stringItem = new StringItem("", "");// write post-init user code here}return stringItem;}//</editor-fold>/**/* Returns a display instance./* @return the display instance./*/public Display getDisplay () {return Display.getDisplay(this);/**/* Exits MIDlet./*/public void exitMIDlet() {switchDisplayable (null, null);destroyApp(true);notifyDestroyed();/**/ * Called when MIDlet is started./ */public void startApp() {if (midletPaused)resumeMIDlet ();} elseinitialize ();startMIDlet ();}midletPaused = false;}/**/* Called when MIDlet is paused./*/public void pauseApp(){midletPaused = true;}/**/* Called to signal the MIDlet to terminate./*/public void destroyApp(boolean unconditional){}}

CHAPTER 7. ANNEX1 - CODE IMPLEMENTATION(DELPHI, J2ME) 91
/* Save coordinates (Longitude,Latitude,Altitudes)in Text File */****************************************************************package SaveCoordinates;/*/ * santhosh2MIDlet.java/*/* Created on October 6, 2009, 12:20 PM/*///import javax.microedition.midlet.*;//import javax.microedition.lcdui.*;//import java.io.InputStream;import java.io.OutputStream;import javax.microedition.io.Connector;import javax.microedition.io.�le.FileConnection;//import javax.microedition.lcdui.Alert;import javax.microedition.lcdui.Command;import javax.microedition.lcdui.CommandListener;import javax.microedition.lcdui.Display;import javax.microedition.lcdui.Displayable;import javax.microedition.lcdui.TextBox;import javax.microedition.lcdui.TextField;import javax.microedition.midlet.MIDlet;import javax.microedition.midlet.MIDletStateChangeException;import javax.microedition.location.*;/**/*/* @author Santhosh/* @version/*/public class santhosh2MIDlet extends MIDlet implements CommandListener,Runnable{Command save, exit;TextBox text;Display display;public Quali�edCoordinates Q;public santhosh2MIDlet () {text = new TextBox("", "", 400, TextField.ANY);save = new Command("Save", Command.SCREEN, 1);exit = new Command("Exit", Command.EXIT, 1);text.addCommand(save);text.addCommand(exit);text.setCommandListener(this);try{Criteria c=new Criteria();c.setHorizontalAccuracy(5000);

CHAPTER 7. ANNEX1 - CODE IMPLEMENTATION(DELPHI, J2ME) 92
c.setVerticalAccuracy(5000);LocationProvider lp=LocationProvider.getInstance(c);Location loc=lp.getLocation(600);Q=loc.getQuali�edCoordinates();double Altitude;double Latitude;double Longitude;if (Q!=null){Altitude = Q.getAltitude();Latitude = Q.getLatitude();Longitude = Q.getLongitude();text.setString("Altitude:" + Double.toString(Altitude)+ "n" +"Latitude:" +Double.toString(Latitude)+ "n" + "Longitude:"+ Double.toString(Longitude)+ "n");}elses{text.setString("Location API failed");}}catch(Exception e){text.setString("Exception:"+e);}}protected void destroyApp(boolean arg0) throws MIDletStateChangeException{}protected void pauseApp(){}protected void startApp() throws MIDletStateChangeException{display = Display.getDisplay(this);display.setCurrent(text);}public void commandAction(Command arg0, Displayable arg1){if (arg0 == save){Thread t = new Thread(this);t.start();}else if (arg0 == exit){try{

CHAPTER 7. ANNEX1 - CODE IMPLEMENTATION(DELPHI, J2ME) 93
destroyApp(true);this.notifyDestroyed();} catch (MIDletStateChangeException e){e.printStackTrace();}}}public void run(){saveFile();}void saveFile(){try {FileConnection c = (FileConnection) Connector.open("�le:///root1/photos/prog.txt",Connector.READ_WRITE);if (c.exists()){System.out.println("exist");} else{System.out.println("no exist");c.create();OutputStream out = c.openOutputStream();String userText = text.getString();//System.out.println(userText);out.write(userText.getBytes());out.close();c.close();}} catch (Exception e){System.out.println(e.toString());}}}
/* Send coordinates(Longitude,Latitude,Altitudes)to the server */****************************************************************package ServerCoordinates;/*/ * HttpMidlet.java/*/* Created on September 6, 2009, 12:20 PM/*/
CHAPTER 7. ANNEX1 - CODE IMPLEMENTATION(DELPHI, J2ME) 94
import javax.microedition.midlet.*;import javax.microedition.lcdui.*;import javax.microedition.location.*;import javax.microedition.io.*;import java.io.*;public class HttpMidlet extends MIDlet implements CommandListener,Runnable {private static String defaultURL = "" ;private static String defaultID = "";private static String defaultStatus ;private Display myDisplay = null;private Form requestScreen;private TextField requestField;private Form IDScreen;private TextField id;private TextField status;private List list;private String[] menuItems;private Form resultScreen;private StringItem resultField;private boolean bBreak;private int task;private Thread thread = null;// requestScreen CommandCommand UnextCommand;// Setting ON CommandsCommand SONbackCommand;Command SONnextCommand;// reslutScreen CommandsCommand resultbackCommand;Command resultexitCommand;ChoiceGroup myChoiceGroup;public Quali�edCoordinates qc;public HttpMidlet(){ // initialize the GUI componentsmyDisplay = Display.getDisplay( this );// display the request URLUnextCommand = new Command("Next",Command.SCREEN,1);requestScreen = new Form( "Type in a URL:" );requestField = new TextField( null, defaultURL, 200, TextField.URL);requestScreen.append( requestField );requestScreen.addCommand(UnextCommand);requestScreen.setCommandListener( this );// settings ON OperationSONbackCommand = new Command("Back",Command.BACK,1);SONnextCommand = new Command("Next",Command.SCREEN,1);IDScreen = new Form ("Operation Settings");

CHAPTER 7. ANNEX1 - CODE IMPLEMENTATION(DELPHI, J2ME) 95
id = new TextField("ID[PhoneNumber] (*):", defaultID, 200,TextField.ANY);IDScreen.append(id);myChoiceGroup = new ChoiceGroup("Setting Status", Choice.EXCLUSIVE);myChoiceGroup.append("First", null);myChoiceGroup.append("Second", null);myChoiceGroup.append("Third", null);//myChoiceGroup.setSelectedIndex(1, true);IDScreen.append(myChoiceGroup);RadioButton();status = new TextField("Status :", defaultStatus, 100, TextField.ANY);IDScreen.append(status);//Thread t1 = new Thread(this);//t1.start();// Display Longitude, Latitude, Altitudetry{Criteria c=new Criteria();c.setHorizontalAccuracy(5000);c.setVerticalAccuracy(5000);LocationProvider lp=LocationProvider.getInstance(c);Location loc=lp.getLocation(600);qc=loc.getQuali�edCoordinates();if (qc!=null){IDScreen.append("Longitude:"+qc.getLongitude()+"");IDScreen.append("Latitude:"+qc.getLatitude()+"");IDScreen.append("Altitude:" +qc.getAltitude()+ "");}else{IDScreen.append("Location API failed "); }} catch(Exception e){IDScreen.append("Exception:"+e);}IDScreen.addCommand(SONbackCommand);IDScreen.addCommand(SONnextCommand);IDScreen.setCommandListener( this );// select the HTTP request method desiredmenuItems = new String[] "GET Request";list = new List( "Select an HTTP method:", List.IMPLICIT, menuItems, null );list.setCommandListener( this );// display the message received from serverresultbackCommand = new Command("Back",Command.BACK,1);resultexitCommand = new Command("Exit",Command.EXIT,1);resultScreen = new Form( "Server Response:" );
CHAPTER 7. ANNEX1 - CODE IMPLEMENTATION(DELPHI, J2ME) 96
resultScreen.addCommand( resultbackCommand );resultScreen.addCommand(resultexitCommand);resultScreen.setCommandListener( this );}public void startApp()throws MIDletStateChangeException{myDisplay = Display.getDisplay(this);myDisplay.setCurrent(requestScreen);}public void commandAction( Command com, Displayable disp ){if ( com == UnextCommand)
id.setString(defaultID);status.setString(defaultStatus);myDisplay.setCurrent(IDScreen);task = 0;bBreak = false;thread = new Thread(this);thread.start();}else if (com == resultbackCommand){myDisplay.setCurrent(requestScreen);}else if (com == SONbackCommand){myDisplay.setCurrent( requestScreen );}else if (com == SONnextCommand){bBreak = true;myDisplay.setCurrent( list );}else if (disp == list com == List.SELECT_COMMAND){task = 1;bBreak = false;thread = new Thread(this);thread.start();}else if ( com == resultexitCommand ){try{destroyApp(true);

CHAPTER 7. ANNEX1 - CODE IMPLEMENTATION(DELPHI, J2ME) 97
this.notifyDestroyed();} catch (MIDletStateChangeException e)
e.printStackTrace();
}}public void RadioButton(){int i = myChoiceGroup.getSelectedIndex();//String san = myChoiceGroup.getString(i);for (i=0; i<3; i++){if(i==0)
defaultStatus= "1";
else if(i==1)
defaultStatus= "2";}else if(i==2){defaultStatus= "3";}}}public void run(){while(bBreak == false)
if (task == 0)
int index = myChoiceGroup.getSelectedIndex();status.setString(""+index);
else if (task == 1)
String result = sendHttpGet(requestField.getString()+ "?op=pos"+"&id="+id.getString().trim()+"&x="+qc.getLongitude()+"&y="+qc.getLatitude()+"&status="+status.getString().trim());resultField = new StringItem( null, result );resultScreen.appends( resultField );myDisplay.setCurrent( resultScreen );bBreak = true;}}
CHAPTER 7. ANNEX1 - CODE IMPLEMENTATION(DELPHI, J2ME) 98
}private String sendHttpGet( String url ){HttpConnection hcon = null;DataInputStream dis = null;StringBu�er responseMessage = new StringBu�er();try {// a standard HttpConnection with READ accesshcon = ( HttpConnection )Connector.open( url );// obtain a DataInputStream from the HttpConnectiondis = new DataInputStream( hcon.openInputStream() );// retrieve the response from the serverint ch;while ( ( ch = dis.read() ) != -1 )responseMessage.append( (char) ch );}//end while ( ( ch = dis.read() ) != -1 )}catch( Exception e ){e.printStackTrace();responseMessage.append( "ERROR" );} �nallytryif ( hcon != null ) hcon.close();if ( dis != null ) dis.close();catch ( IOException ioe )
ioe.printStackTrace();//end try/catch}//end try/catch/�nallyreturn responseMessage.toString();}//end sendHttpGet( String )public void pauseApp(){}//end pauseApp()protected void destroyApp(boolean com) throws MIDletStateChangeException{}}
/* Send SMS(Longitude,Latitude,Altitudes)to the Mobile Device */****************************************************************package ProSMS;import javax.microedition.midlet.*;import javax.microedition.lcdui.*;import javax.microedition.io.Connector;import javax.wireless.messaging.MessageConnection;
CHAPTER 7. ANNEX1 - CODE IMPLEMENTATION(DELPHI, J2ME) 99
import javax.wireless.messaging.TextMessage;//import com.sun.midp.lcdui.CommandAccess;public class prosendSMS extends MIDlet implements CommandListener, Runnable{private Command cmSend, cmExit;private TextBox tbMessage;public void pauseApp(){}public void destroyApp(boolean arg0) throws MIDletStateChangeException{}protected void startApp() throws MIDletStateChangeException{tbMessage = new TextBox("Message", "", 160, TextField.ANY);tbMessage.addCommand(cmSend = new Command("Send SMS", Command.OK, 1));tbMessage.addCommand(cmExit = new Command("Exit", Command.EXIT, 1));tbMessage.setCommandListener(this);Display.getDisplay(this).setCurrent(tbMessage);}public void commandAction(Command c, Displayable d){if(c == cmExit){notifyDestroyed();}else //if(c == cmSend){new Thread(this).start();}}public void run(){boolean result = sendSms("", tbMessage.getString());}public boolean sendSms(String number, String message){boolean result = true;try{//sets address to send messageString addr = "sms://" + number;// opens connectionMessageConnection conn = (MessageConnection) Connector.open(addr);// prepares text messageTextMessage msg =
CHAPTER 7. ANNEX1 - CODE IMPLEMENTATION(DELPHI, J2ME) 100
(TextMessage)conn.newMessage(MessageConnection.TEXT_MESSAGE);//set textmsg.setPayloadText(message);// send messageconn.send(msg);conn.close();}catch(SecurityException se){result = false;}catch (Exception e){result = false;}return result;}}
unit vehicleinfo;interfaceusesWindows, Messages, SysUtils, Variants, Classes, Graphics, Controls, Forms, Dialogs, DB,ADODB, StdCtrls, ComCtrls, ElTree, ExtCtrls, MM_GISCom, ToolWin, ImgList ;typeTfrmvehicleinformation = class(TForm)Panel1: TPanel;ListBox1: TListBox;ElTree1: TElTree;ProgressBar1: TProgressBar;ADOTable1: TADOTable;ADOConnection1: TADOConnection;ToolBar1: TToolBar;ImageList1: TImageList;ToolButton1: TToolButton;ToolButton2: TToolButton;ToolButton3: TToolButton;ToolButton4: TToolButton;ToolButton5: TToolButton;ToolButton6: TToolButton;procedure FormClose(Sender: TObject; var Action: TCloseAction);procedure ElTree1ItemSelectedChange(Sender: TObject;Item: TElTreeItem);procedure ToolButton2Click(Sender: TObject);procedure ToolButton3Click(Sender: TObject);

CHAPTER 7. ANNEX1 - CODE IMPLEMENTATION(DELPHI, J2ME) 101
procedure ToolButton4Click(Sender: TObject);procedure FormShow(Sender: TObject);privatePrivate-Declarationprocedure OnWINGISSelected(Sender: TObject; var IDList: OleVariant);function GetTableInformation(sTablename, sIDFieldname, sValue: string): string;procedure showingis;publicPublic-Deklarationenend;varfrmvehicleinformation: Tfrmvehicleinformation;implementationR *.dfmuses start, mobilegis;function Tfrmvehicleinformation.GetTableInformation(sTablename, sIDFieldname,sValue: string): string;vari: integer;beginresult:=�;adotable1.Close;adotable1.TableName:=sTablename;adotable1.Open;if not adotable1.Locate(sIDFieldname,sValue,[]) then exit;for i:=0 to adotable1.FieldCount-1 dobeginresult:=result+adotable1.Fields[i].FieldName+';'+adotable1.Fields[i].AsString+';';end;end;procedure Tfrmvehicleinformation.FormClose(Sender: TObject; var Action:TCloseAction);begintheGIS.COM.SetCanvas(frmstart.pan_gis_hide.Handle,false);theGIS.COM.Core.OnMonitoring:=nil;end;procedure Tfrmvehicleinformation.showingis;varsl: TStringlist;beginif eltree1.Selected=nil then exit;sl:=TStringlist.Create;sl.Add(eltree1.Selected.subitems[1]);theGIS.COM.SelectInGIS(sl,true,true,-1);sl.Free;end;
CHAPTER 7. ANNEX1 - CODE IMPLEMENTATION(DELPHI, J2ME) 102
procedure Tfrmvehicleinformation.ElTree1ItemSelectedChange(Sender: TObject; Item:TElTreeItem);beginshowingis;end;procedure Tfrmvehicleinformation.OnWINGISSelected(Sender: TObject; var IDList:OleVariant);var i: integer;s: string;begins:=IDList.item[0];for i:=0 to eltree1.Items.Count-1 dobeginif eltree1.Items[i].SubItems[1]=s thenbegineltree1.Items[i].Selected:=true;eltree1.Selected:=eltree1.Items[i];eltree1.EnsureVisible(eltree1.Selected);exit;end;end;end;procedure Tfrmvehicleinformation.ToolButton2Click(Sender: TObject);vart: TELTreeItem;s: String;//display the information of NEWJOBS into the eltree1begintheGIS.COM.SetCanvas(panel1.Handle,true);theGIS.COM.SwitchAutoMonitoringOnO�(true);theGIS.COM.Core.OnMonitoring:=OnWINGISSelected;adotable1.Close;adoconnection1.Close;adoconnection1.ConnectionString=�; adotable1.TableName:='NEWJOBS';adoconnection1.open;adotable1.Open;eltree1.items.clear;progressbar1.Min:=1;progressbar1.Max:=adotable1.RecordCount;progressbar1.Position:=1;progressbar1.Show;while not adotable1.Eof dobegins:=�;t:=eltree1.Items.AddItem(nil);s:=adotable1.FieldByName('Jobid').AsString;

CHAPTER 7. ANNEX1 - CODE IMPLEMENTATION(DELPHI, J2ME) 103
t.Text:=s;s:=adotable1.FieldByName('Fieldtype').AsString;t.SubItems.Add(s);s:=adotable1.FieldByName('Fieldid').AsString;t.SubItems.Add(s);s:=adotable1.FieldByName('Name').AsString;t.SubItems.Add(s);s:=adotable1.FieldByName('Vorname').AsString;t.SubItems.Add(s);s:=adotable1.FieldByName('RUNDE').AsString;t.SubItems.Add(s);s:=adotable1.FieldByName('Area').AsString;t.SubItems.Add(s);s:=adotable1.FieldByName('fruitid').AsString;t.SubItems.Add(s);s:=adotable1.FieldByName('Begintime').AsString;t.SubItems.Add(s);s:=adotable1.FieldByName('Fruit').AsString;t.SubItems.Add(s);s:=adotable1.FieldByName('Object').AsString;t.SubItems.Add(s);s:=adotable1.FieldByName('�eldid').AsString;t.SubItems.Add(s);s:=adotable1.FieldByName('Adress').AsSstring;t.SubItems.Add(s);s:=adotable1.FieldByName('ABFUHRPLAN_ID').AsString;t.SubItems.Add(s);s:=adotable1.FieldByName('ANBAUER_ID').AsString;t.SubItems.Add(s);s:=adotable1.FieldByName('GIS_ID').AsString;t.SubItems.Add(s);adotable1.Next;progressbar1.StepIt;end;progressbar1.Hide;adotable1.Close;adoconnection1.Close;end;procedure Tfrmvehicleinformation.ToolButton3Click(Sender: TObject);vart: TELTreeItem;s: string;res,i: integer;begint:=eltree1.Selected;listbox1.Clear;

CHAPTER 7. ANNEX1 - CODE IMPLEMENTATION(DELPHI, J2ME) 104
s:=t.text;s:='#JOB_ID#'+GetTableInformation('NEWJOBS','JOB_ID',eltree1.Selected.Text);listbox1.Items.Add(s);s:='#ACTIVITY#'+GetTableInformation('NEWJOBS','ACTIVITY',eltree1.Selected.SubItems.Strings[0]);listbox1.Items.Add(s);s:='#ACTIVITY_ID#'+GetTableInformation('NEWJOBS','ACTIVITY_ID',eltree1.Selected.SubItems.Strings[1]);listbox1.Items.Add(s);s:='#NAME#'+GetTableInformation('NEWJOBS','NAME',eltree1.Selected.SubItems.Strings[2]);listbox1.Items.Add(s);s:='#VORNAME#'+GetTableInformation('NEWJOBS','VORNAME',eltree1.Selected.SubItems.Strings[3]);listbox1.Items.Add(s);s:='#RUNDE#'+GetTableInformation('NEWJOBS','RUNDE',eltree1.Selected.SubItems.Strings[4]);listbox1.Items.Add(s);s:='#FLAECHE#'+GetTableInformation('NEWJOBS','FLAECHE',eltree1.Selected.SubItems.Strings[5]);listbox1.Items.Add(s);s:='#FRUCHTART#'+GetTableInformation('NEWJOBS','FRUCHTART',eltree1.Selected.SubItems.Strings[6]);listbox1.Items.Add(s);s:='#ERFASST#'+GetTableInformation('NEWJOBS','ERFASST',eltree1.Selected.SubItems.Strings[7]);listbox1.Items.Add(s);s:='#FRUCHT#'+GetTableInformation('NEWJOBS','FRUCHT',eltree1.Selected.SubItems.Strings[8]);listbox1.Items.Add(s);s:='#OBJECT_ID#'+GetTableInformation('NEWJOBS','OBJECT_ID',eltree1.Selected.SubItems.Strings[9]);listbox1.Items.Add(s);s:='#SCHLAG_ID#'+GetTableInformation('NEWJOBS','SCHLAG_ID',eltree1.Selected.SubItems.Strings[10]);listbox1.Items.Add(s);s:='#ADRESS_ID#'+GetTableInformation('NEWJOBS','ADRESS_ID',eltree1.Selected.SubItems.Strings[11]);listbox1.Items.Add(s);s:='#ABFUHRPLAN_ID#'+GetTableInformation('NEWJOBS','ABFUHRPLAN_ID',eltree1.Selected.SubItems.Strings[12]);listbox1.Items.Add(s);s:='#ANBAUER_ID#'+GetTableInformation('NEWJOBS','ANBAUER_ID',eltree1.Selected.SubItems.Strings[13]);listbox1.Items.Add(s);s:='#GIS_ID#'+GetTableInformation('NEWJOBS','GIS_ID',eltree1.Selected.SubItems.Strings[14]);listbox1.Items.Add(s);// message box show and ask the question "Is the job completed"with Application dobeginNormalizeTopMosts;res:=MessageBox('Is the Job Completed', 'Look', MB_YESNO);RestoreTopMosts;end;//if yes append the job done information into the MRW_COMPLETEJOBS tableif res = IDYES thenbeginadoconnection1.Close;adoconnection1.ConnectionString:='Provider=Microsoft.Jet.OLEDB.4.0;DataSource='+extract�lepath(application.ExeName)+�;Persist Security Info=False';
CHAPTER 7. ANNEX1 - CODE IMPLEMENTATION(DELPHI, J2ME) 105
adotable1.TableName:='COMPLETEJOBS';adotable1.Open;adoconnection1.open;beginadotable1.Append;if adotable1.�nd�eld('JOB_ID')<> nil thenadotable1.�eldbyname('JOB_ID').AsString :=GetTableInformation('NEWJOBS','JOB_ID',eltree1.Selected.Text);if adotable1.�nd�eld('ACTIVITY')<> nil thenadotable1.�eldbyname('ACTIVITY').AsString :=GetTableInformation('NEWJOBS','ACTIVITY',eltree1.Selected.SubItems.Strings[0]) ;if adotable1.�nd�eld('ACTIVITY_ID')<> nil thenadotable1.�eldbyname('ACTIVITY_ID').AsString := GetTableInforma-tion('NEWJOBS','ACTIVITY_ID',eltree1.Selected.SubItems.Strings[1]);if adotable1.�nd�eld('NAME')<> nil thenadotable1.�eldbyname('NAME').AsString :=GetTableInformation('NEWJOBS','NAME',eltree1.Selected.SubItems.Strings[2]);if adotable1.�nd�eld('VORNAME')<> nil thenadotable1.�eldbyname('VORNAME').AsString :=GetTableInformation('NEWJOBS','VORNAME',eltree1.Selected.SubItems.Strings[3]);if adotable1.�nd�eld('RUNDE')<> nil thenadotable1.�eldbyname('RUNDE').AsString :=GetTableInformation('NEWJOBS','RUNDE',eltree1.Selected.SubItems.Strings[4]);if adotable1.�nd�eld('FLAECHE')<> nil thenadotable1.�eldbyname('FLAECHE').AsString :=GetTableInformation('NEWJOBS','FLAECHE',eltree1.Selected.SubItems.Strings[5]);if adotable1.�nd�eld('FRUCHTART')<> nil thenadotable1.�eldbyname('FRUCHTART').AsString :=GetTableInformation('NEWJOBS','FRUCHTART',eltree1.Selected.SubItems.Strings[6]);if adotable1.�nd�eld('ERFASST')<> nil thenadotable1.�eldbyname('ERFASST').AsString :=GetTableInformation('NEWJOBS','ERFASST',eltree1.Selected.SubItems.Strings[7]);if adotable1.�nd�eld('FRUCHT')<> nil thenadotable1.�eldbyname('FRUCHT').AsString :=GetTableInformation('NEWJOBS','FRUCHT',eltree1.Selected.SubItems.Strings[8]);if adotable1.�nd�eld('OBJECT_ID')<> nil thenadotable1.�eldbyname('OBJECT_ID').AsString :=GetTableInformation('NEWJOBS','OBJECT_ID',eltree1.Selected.SubItems.Strings[9]);if adotable1.�nd�eld('SCHLAG_ID')<> nil thenadotable1.�eldbyname('SCHLAG_ID').AsString :=GetTableInformation('NEWJOBS','SCHLAG_ID',eltree1.Selected.SubItems.Strings[10]);if adotable1.�nd�eld('ADRESS_ID')<> nil thenadotable1.�eldbyname('ADRESS_ID').AsString :=GetTableInformation('NEWJOBS','ADRESS_ID',eltree1.Selected.SubItems.Strings[11]);if adotable1.�nd�eld('ABFUHRPLAN_ID')<> nil thenadotable1.�eldbyname('ABFUHRPLAN_ID').AsString := GetTableInforma-

CHAPTER 7. ANNEX1 - CODE IMPLEMENTATION(DELPHI, J2ME) 106
tion('NEWJOBS','ABFUHRPLAN_ID',eltree1.Selected.SubItems.Strings[12]);if adotable1.�nd�eld('ANBAUER_ID')<> nil thenadotable1.�eldbyname('ANBAUER_ID').AsString := GetTableInforma-tion('NEWJOBS','ANBAUER_ID',eltree1.Selected.SubItems.Strings[13]);if adotable1.�nd�eld('GIS_ID')<> nil thenadotable1.�eldbyname('GIS_ID').AsString :=GetTableInformation('NEWJOBS','GIS_ID',eltree1.Selected.SubItems.Strings[14]);adotable1.Post;end;adoconnection1.Close;end;//if yes delete the job done information from the MRWNEWJOBStableadoconnection1.Close;adoconnection1.ConnectionString:='Provider=Microsoft.Jet.OLEDB.4.0;UserID=Admin;Data Source='+extract�lepath(application.ExeName)+�;Mode=Share DenyNone;Extended Properties="";Persist Security Info=False';adotable1.TableName:='NEWJOBS';adotable1.Open;adoconnection1.open;if adotable1.�nd�eld('Jobid').AsString =GetTableInformation('NEWJOBS','JOB_ID',eltree1.Selected.Text) thenadotable1.�eldbyname('Jobid').Clear;if adotable1.�nd�eld('ACTIVITY').AsString =GetTableInformation('NEWJOBS','ACTIVITY',eltree1.Selected.SubItems.Strings[0])thenadotable1.�eldbyname('ACTIVITY').Clear;if adotable1.�nd�eld('ACTIVITY_ID').AsString =GetTableInformation('NEWJOBS','ACTIVITY_ID',eltree1.Selected.SubItems.Strings[1])thenadotable1.�eldbyname('ACTIVITY_ID').Clear;if adotable1.�nd�eld('NAME').AsString =GetTableInformation('NEWJOBS','NAME',eltree1.Selected.SubItems.Strings[2]) thenadotable1.�eldbyname('NAME').Clear;if adotable1.�nd�eld('VORNAME').AsString =GetTableInformation('NEWJOBS','VORNAME',eltree1.Selected.SubItems.Strings[3])then adotable1.�eldbyname('VORNAME').Clear;if adotable1.�nd�eld('RUNDE').AsString =GetTableInformation('NEWJOBS','RUNDE',eltree1.Selected.SubItems.Strings[4]) thenadotable1.�eldbyname('RUNDE').Clear;if adotable1.�nd�eld('FLAECHE').AsString =GetTableInformation('NEWJOBS','FLAECHE',eltree1.Selected.SubItems.Strings[5])thenadotable1.�eldbyname('FLAECHE').Clear;if adotable1.�nd�eld('FRUCHTART').AsString =GetTableInformation('NEWJOBS','FRUCHTART',eltree1.Selected.SubItems.Strings[6])then

CHAPTER 7. ANNEX1 - CODE IMPLEMENTATION(DELPHI, J2ME) 107
adotable1.�eldbyname('FRUCHTART').Clear;if adotable1.�nd�eld('ERFASST').AsString =GetTableInformation('NEWJOBS','ERFASST',eltree1.Selected.SubItems.Strings[7]) thenadotable1.�eldbyname('ERFASST').Clear;if adotable1.�nd�eld('FRUCHT').AsString =GetTableInformation('NEWJOBS','FRUCHT',eltree1.Selected.SubItems.Strings[8]) thenadotable1.�eldbyname('FRUCHT').Clear;if adotable1.�nd�eld('OBJECT_ID').AsString =GetTableInformation('NEWJOBS','OBJECT_ID',eltree1.Selected.SubItems.Strings[9])thenadotable1.�eldbyname('OBJECT_ID').Clear;if adotable1.�nd�eld('SCHLAG_ID').AsString =GetTableInformation('NEWJOBS','SCHLAG_ID',eltree1.Selected.SubItems.Strings[10])thenadotable1.�eldbyname('SCHLAG_ID').Clear;if adotable1.�nd�eld('ADRESS_ID').AsString =GetTableInformation('NEWJOBS','ADRESSID′, eltree1.Selected.SubItems.Strings[11])thenadotable1.�eldbyname('ADRESS_ID').Clear;if adotable1.�nd�eld('ABFUHRPLAN_ID').AsString =GetTableInformation('NEWJOBS','ABFUHRPLANID
′, eltree1.Selected.SubItems.Strings[12])thenadotable1.�eldbyname('ABFUHRPLAN_ID').Clear;if adotable1.�nd�eld('ANBAUER_ID').AsString =GetTableInformation('NEWJOBS','ANBAUERID
′, eltree1.Selected.SubItems.Strings[13])thenadotable1.�eldbyname('ANBAUER_ID').Clear;if adotable1.�nd�eld('GIS_ID').AsString =GetTableInformation('NEWJOBS','GISID′, eltree1.Selected.SubItems.Strings[14])thenadotable1.�eldbyname('GIS_ID').Clear;adotable1.Post;end;procedure Tfrmvehicleinformation.ToolButton4Click(Sender: TObject);beginClose;end;procedure Tfrmvehicleinformation.FormShow(Sender: TObject);beginToolButton2.Click;end;end.unit vehicle�nishedinfo;interfaceusesWindows, Messages, SysUtils, Variants, Classes, Graphics, Controls, Forms,Dialogs, DB,ADODB, StdCtrls, ComCtrls, ExtCtrls, ElTree, MMGISCom, ImgList, ToolWin;typeTfrmvehiclecompletedinformation = class(TForm)ElTree1: TElTree;

CHAPTER 7. ANNEX1 - CODE IMPLEMENTATION(DELPHI, J2ME) 108
Panel1: TPanel;ProgressBar1: TProgressBar;ADOTable1: TADOTable;ADOConnection1: TADOConnection;ToolBar1: TToolBar;ToolButton1: TToolButton;ToolButton2: TToolButton;ToolButton3: TToolButton;ToolButton4: TToolButton;ToolButton5: TToolButton;ToolButton6: TToolButton;ImageList1: TImageList;Procedure FormClose(Sender: TObject; var Action: TCloseAction);procedure ElTree1ItemSelectedChange(Sender: TObject; Item: TElTreeItem);procedure ToolButton1Click(Sender: TObject);procedure ToolButton2Click(Sender: TObject);procedure ToolButton3Click(Sender: TObject);procedure FormShow(Sender: TObject);privateprocedure OnWINGISSelected(Sender: TObject; var IDList: OleVariant);procedure showingis;function GetTableInformation(sTablename, sIDFieldname, sValue: string): string;Private-DeklarationenpublicPublic-Deklarationenend;varfrmvehiclecompletedinformation: Tfrmvehiclecompletedinformation;implementationR *.dfmuses start,mobgis;// Calling function for collecting the information from report tablesfunction Tfrmvehiclecompletedinformation.GetTableInformation(sTablename,sIDFieldname, sValue: string): string;vari: integer;beginresult:=�;adotable1.Close;adotable1.TableName:=sTablename;adotable1.Open;if not adotable1.Locate(sIDFieldname,sValue,[]) then exit;for i:=0 to adotable1.FieldCount-1 dobeginresult:=result+adotable1.Fields[i].FieldName+';'+adotable1.Fields[i].AsString+';';end;

CHAPTER 7. ANNEX1 - CODE IMPLEMENTATION(DELPHI, J2ME) 109
end;procedure Tfrmvehiclecompletedinformation.FormClose(Sender: TObject; var Action:TCloseAction);begintheGIS.COM.SetCanvas(frmstart.pangishide.Handle, false);theGIS.COM.Core.OnMonitoring:=nil;end;procedure Tfrmvehiclecompletedinformation.showingis;varsl: TStringlist;beginif eltree1.Selected=nil then exit;sl:=TStringlist.Create;sl.Add(eltree1.Selected.subitems[1]);theGIS.COM.SelectInGIS(sl,true,true,-1);sl.Free;end;procedure Tfrmvehiclecompletedinformation.ElTree1ItemSelectedChange(Sender:TObject; Item: TElTreeItem);beginshowingis;end;procedure Tfrmvehiclecompletedinformation.OnWINGISSelected(Sender: TObject; varIDList: OleVariant);vari: integer;s: string;begins:=IDList.item[0];for i:=0 to eltree1.Items.Count-1 dobeginif eltree1.Items[i].SubItems[1]=s thenbegineltree1.Items[i].Selected:=true;eltree1.Selected:=eltree1.Items[i];eltree1.EnsureVisible(eltree1.Selected);exit;end;end;end;procedure Tfrmvehiclecompletedinformation.ToolButton1Click(Sender: TObject);vart: TELTreeItem;s: string;beginEltree1.CleanupInstance;
CHAPTER 7. ANNEX1 - CODE IMPLEMENTATION(DELPHI, J2ME) 110
theGIS.COM.SetCanvas(panel1.Handle,true);theGIS.COM.SwitchAutoMonitoringOnO�(true);theGIS.COM.Core.OnMonitoring:=OnWINGISSelected;adotable1.close;adoconnection1.Close;adoconnection1.ConnectionString:='Provider=Microsoft.Jet.OLEDB.4.0;UserID=Admin;DataSource='+extract�lepath(application.ExeName)+�;Mode=Share Deny None;ExtendedProperties="";Persist Security Info=False';adotable1.TableName:='MRWCOMPLETEJOBS′;adotable1.open;adoconnection1.Open;adotable1.First;eltree1.items.clear;progressbar1.Min:=1;progressbar1.Max:=adotable1.RecordCount;progressbar1.Position:=1;progressbar1.Show;while not adotable1.Eof dobegins:=�;t:=eltree1.Items.AddItem(nil);s:=adotable1.FieldByName('JOB_ID').AsString;t.Text:=s;s:=adotable1.FieldByName('ACTIVITY').AsString;t.SubItems.Add(s);s:=adotable1.FieldByName('ACTIVITY_ID').AsString;t.SubItems.Add(s);s:=adotable1.FieldByName('NAME').AsString;t.SubItems.Add(s);s:=adotable1.FieldByName('VORNAME').AsString;t.SubItems.Add(s);s:=adotable1.FieldByName('RUNDE').AsString;t.SubItems.Add(s);s:=adotable1.FieldByName('FLAECHE').AsString;t.SubItems.Add(s);s:=adotable1.FieldByName('FRUCHTART').AsString;t.SubItems.Add(s);s:=adotable1.FieldByName('ERFASST').AsString;t.SubItems.Add(s);s:=adotable1.FieldByName('FRUCHT').AsString;t.SubItems.Add(s);s:=adotable1.FieldByName('OBJECT_ID').AsString;t.SubItems.Add(s);s:=adotable1.FieldByName('SCHLAG_ID').AsString;t.SubItems.Add(s);s:=adotable1.FieldByName('ADRESS_ID').AsString;
CHAPTER 7. ANNEX1 - CODE IMPLEMENTATION(DELPHI, J2ME) 111
t.SubItems.Add(s);s:=adotable1.FieldByName('ABFUHRPLAN_ID').AsString;t.SubItems.Add(s);s:=adotable1.FieldByName('ANBAUER_ID').AsString;t.SubItems.Add(s);s:=adotable1.FieldByName('GIS_ID').AsString;t.SubItems.Add(s);adotable1.Next;progressbar1.StepIt;end;progressbar1.Hide;adotable1.Close;adoconnection1.Close;end;procedure Tfrmvehiclecompletedinformation.ToolButton2Click(Sender: TObject);vart: TELTreeItem;s: string;i: integer;begint:=eltree1.Selected;s:=t.SubItems.Strings[14];s:=s+'#JOBID#′ +GetTableInformation(′MRW_COMPLETEJOBS′,′ JOBID
′, eltree1.Selected.Text);s:=s+'#ACTIVITY#'+GetTableInformation('MRW_COMPLETEJOBS','ACTIVITY',eltree1.Selected.SubItems.Strings[0]);s:=s+'#ACTIVITYID#′ +GetTableInformation(′MRW_COMPLETEJOBS′,′ACTIV ITY_ID′, eltree1.Selected.SubItems.Strings[1]);s:=s+'#NAME#'+GetTableInformation('MRW_COMPLETEJOBS','NAME',eltree1.Selected.SubItems.Strings[2]);s:=s+'#VORNAME#'+GetTableInformation('MRW_COMPLETEJOBS','VORNAME',eltree1.Selected.SubItems.Strings[3]);s:=s+'#RUNDE#'+GetTableInformation('MRW_COMPLETEJOBS','RUNDE',eltree1.Selected.SubItems.Strings[4]);s:=s+'#FLAECHE#'+GetTableInformation('MRW_COMPLETEJOBS','FLAECHE',eltree1.Selected.SubItems.Strings[5]);s:=s+'#FRUCHTART#'+GetTableInformation('MRW_COMPLETEJOBS','FRUCHTART',eltree1.Selected.SubItems.Strings[6]);s:=s+'ERFASST'+GetTableInformation('MRW_COMPLETEJOBS','ERFASST',eltree1.Selected.SubItems.Strings[7]);s:=s+'#FRUCHT#'+GetTableInformation('MRW_COMPLETEJOBS','FRUCHT',eltree1.Selected.SubItems.Strings[8]);s:=s+'#OBJECT_ID#'+GetTableInformation('MRW_COMPLETEJOBS','OBJECT_ID',eltree1.Selected.SubItems.Strings[9]);s:=s+'#SCHLAGID#′ +GetTableInformation(′MRW_COMPLETEJOBS′,′ SCHLAG_ID′, eltree1.Selected.SubItems.Strings[10]);s:=s+'#ADRESS_ID#'+GetTableInformation('MRW_COMPLETEJOBS','ADRESS_ID',eltree1.Selected.SubItems.Strings[11]);s:=s+'#ABFUHRPLAN_ID#'+GetTableInformation('MRW_COMPLETEJOBS','ABFUHRPLAN_ID',eltree1.Selected.SubItems.Strings[12]);s:=s+'#ANBAUER_ID#'+GetTableInformation('MRW_COMPLETEJOBS','ANBAUER_ID',eltree1.Selected.SubItems.Strings[13]);s:=s+'#GIS_ID#'+GetTableInformation('MRW_COMPLETEJOBS','GIS_ID',eltree1.Selected.SubItems.Strings[14]);theMobGIS.SendText(cJOB,cNoACK,s,false,progressbar1,true,�,true);Showmessage('Export �nished!');end;procedure Tfrmvehiclecompletedinformation.ToolButton3Click(Sender:TObject);begin

CHAPTER 7. ANNEX1 - CODE IMPLEMENTATION(DELPHI, J2ME) 112
close;end;procedureTfrmvehiclecompletedinformation.FormShow(Sender: TObject);beginToolButton1.Click;end;end.
Chapter 8
Annex2 - Description of theHardware and Software Platforms
8.1 Geographic Information System
A Geographic Information System (GIS) integrates hardware, software, and database forcapturing, storing, updating, managing, analyzing, and displaying all forms of geographi-cally referenced data. The following two types of geospatial data are [4]:
• Vector Data: A data structure that is used to represent linear geographic featuresthat are made of ordered lists of x, y coordinates. These coordinates are representedby points, lines, or polygons. Attributes are associated with each feature.
• Raster data: A spatial data model which is combination of rows and columns ofgrid cells. Each cell contains an attribute value and location coordinates. Group ofcells that share the same value to represent geographic features.
GIS can be viewed as three di�erent ways that are database view, map view and modelview.
• Database View: A geographic database namely "geodatabase" is a unique kindof database for GIS in the world. Geodatabase combines data repository (database)with spatial data (geo) to create a central data repository for storage of spatial data.Geodatabase allows you to store GIS data in central data repository for easy accessand management and this stored information can be leveraged in all environmentslike server, mobile or desktop. Geodatabase o�ers you the ability to [27]:
� Store collection of spatial data in a central data repository
� Maintain advanced geospatial relational models (e.g. networks, topologies)
� Apply sophisticated relationships and rules to the data
� De�ne and maintain integrity of spatial data with a accurate database
• Map View: A GIS is a collection of intelligent maps and other views that show fea-ture relationships on the earth surface. For supporting queries, analysis and editing
113
CHAPTER 8. ANNEX2 - DESCRIPTION OF THE HARDWARE AND SOFTWARE PLATFORMS114
the information on GIS maps, maps of the geographic information can be constructedand used as windows into database.
• Model View: A GIS is a collection of information tools that creates geographicdatasets from already existing datasets [27]. Geoprocessing functions take data fromalready existing datasets, apply analytical functions and write results into newlycreated datasets.
8.1.1 WinGIS
This is an object-oriented professional Geographic Information System developed by thePROGIS Software GmbH Company and used for the window's environment. It o�ers fullfunctionality of a GIS, such as the display of geo-referenced orthophotos, graphical objectsusing coordinates, import and export interfaces for all major GIS and CAD applications.The following points required for the WINGIS software tool are [79]:
• 80856 or PENTIUM or compatible processor
• 64 MB main memory (more is better)
• System software MS Windows 95 / NT 4.0 (or higher)
• Graphic card (800X600, 65536 colors)
• Monitor (17 inches or bigger)
• 120 MB disc space
Current graphic user interface (GUI) standard of this software o�ers consistent with otherpopular windows o�ce applications. WinGIS has a powerful graphic and data exchangetechniques that can be used to exchange the information in real time. WinGIS o�ered bythe following requirements are:
• Graphic Editor:
� Working process is easy with the graphic interface of MS windows.
� A hybrid system based on vector diagram with embedded raster graphics.
� Assign of attributes to each graphics object (e.g. lines and points) is also possibleoutside the database [79].
� Changes in the graphics of an object will automatically update in the database.
� Universal zoom functions (transparent, selective).
• Special functions:
� Polygon overlay (with each overlaying polygons a new entry in the database isgenerated)
� Automatic generation of grid points (e.g. as raster).
� The raster graphics can be used for interactive digitization.
CHAPTER 8. ANNEX2 - DESCRIPTION OF THE HARDWARE AND SOFTWARE PLATFORMS115
� Enclosed library for lines, symbols, hatchings and texts.
� Digitization: Snap minimizes errors; automatic snap allows corrections of al-ready digitized maps.
� Plot of certain views, user de�ned regions, automatic cartographic grids, designof templates, plots on multiple pages.
• WinGIS - Database Features:
� Graphic interface that guarantees simple working under MS windows.
� The PROGIS standard database is WinMaster 2000 or WinMonitor.
� Relational SQL standard, tabular structure of columns and rows.
• Functions of WinGIS database:
� Database queries: each relationship and each nesting of queries possible.
� Each ODBC (Open Database Connectivity) database binding.
� Ability to open di�erent database �les, like e.g.: ACCESS.
� Statistic and mathematical operations and connections of data �elds are possi-ble.
� Interactive monitoring: Possible to see one or more objects of attribute data,while working in the graphics surface.
� Monitoring: Display data �elds with connected objects [79].
� Edit / Paste the database.
� Label Objects: Look charts layout additional options.
� Diagram: Charts layout and additional options.
8.2 DBMS (Microsoft Access, MySQL, PostgresSQL)
Database provides a mechanism for managing, storing and retrieving information throughthe use of tables [16]. Since 30 years, the process of data has been changing dramatically.Data processing with conventional �les ful�lled a need that existed during the 1960s. Asusers are exposed to data processing, they �nd the additional ways to use the services [89].Today, di�erent people can access the same data from di�erent places with the help ofDBMS.
DBMS stands for Database Management System. Processing with database manage-ment system o�ers several advantages. By using DBMS, one can store the data in onelocation and accessing the same data in many di�erent systems. Storage, manipulate andretrieval of data can be organized by DBMS with the help of software and this softwareprovides data integrity in database management system. There are always compromises,while using hardware and software requirements for installing or working with DBMS soft-ware [89]. Following advantages and disadvantages of DBMS are:

CHAPTER 8. ANNEX2 - DESCRIPTION OF THE HARDWARE AND SOFTWARE PLATFORMS116
• Advantages:
� Data independence
� Data security
� Data integrity
� Consistent data
� No unplanned redundant data
• Disadvantages:
� Size - very large
� High cost
� Complex
� High impact of failure
� Increased hardware requirements
First, when you enter the data that can be stored in database as a physical sequence, afterthat entire �le must be read and rewritten for performing the maintenance. This must betrue even if you change one record. By using linked lists, data can be stored signi�cantlyand reduces the number of records with better performance of maintaining the records andtables. Since user views the data in many objectives, DBMS are usually classi�ed intoseveral models. Some of them are as follows:
8.2.1 Database Types
• Relational Databases: In this case, data can be represented as a two-dimensionaltable. Data stored by this model have the outward appearance of a �at �le or atable. Each table has rows and columns of data. Select the data from the tableby specifying the name assigned to the column and identi�er of row (s) containingthe desired data. In DBMS models, relational data manipulation is very powerfuland easy to use. This data base model is usually based on complex mathematicalnotation of relational calculus and relational algebra. Every database model usesquery languages for accessing data. Relational database model uses SQL (StructuredQuery Language) for data manipulation.
• Hierarchical Databases: In this model, data relationships are viewed as a treestructure. This model represents the data as well as simple or complex networks.The application program views of the data maintain the framework of the hierarchicalmodel. In hierarchical model, application program views of data represented as a treestructure. Establish the new databases with little or no change of existing programsas long as basic rules of the software are followed.
• Network Database Models: In this model, data relationships can be representedas 1: M relationship termed sets. It was common to determine the design of thesystem and requirements of the system in the starting days of data processing to check

CHAPTER 8. ANNEX2 - DESCRIPTION OF THE HARDWARE AND SOFTWARE PLATFORMS117
the software and hardware requirements that are available. Actually doing businessmethod has to be change to �t the data processing system, but data processingsystem has changed to user needs. In this model case, unable to represent the datarelationships directly using tree structures (for example incase of child has more thanone parent). In this network model case, data relationships exist under networks incomplexity and it uses one to many relationships.
8.2.2 Microsoft Access Database
It is a relational database management system that o�ers full featured procedural program-ming language and features of Microsoft Access has extended to object oriented. From earlydays onwards, Microsoft has been supporting many features and o�ers several products.Microsoft Access package contains following elements:
• Access is a relational database management system, which supports both query lan-guages as SQL (Structured Query Language) and QBE (Query By Example) foraccessing database [12].
• Access o�ers full featured procedural programming language that expects you to viewyour application as commands to be sequentially executed.
• Access has extended the features to object oriented that expects you to view yourapplication as objects.
Microsoft Access database �le:In general database is a collection of relate data tables.In addition to the data tables, Microsoft access database �le contains several databaseobjects. Database objects in Microsoft access are [12]:
• Reports for printing results.
• Forms for interacting with data on screen.
• Saved queries for organizing data.
• Visual basic programs and macros for extending the database functionality applica-tions.
All of the database objects are stored in a �le named with <some �lename>. mdb andwhen you run Microsoft access, temporarily generate a �le name with <some �lename>.ldb.
8.2.3 MySQL Database
Microsoft Access is a powerful relational database management system that allows everyoneto store information in tables and that manages directly from the local disk. Coming tomy SQL database, which is a storage manager. Access can be ability to make ODBCconnections to MySQL database servers over the network, if MyODBC driver has alreadyinstalled in the system [25]. Still possible to see the contents of table information throughthe Access, but the tables themselves are hosted by the MySQL server. Microsoft Access

CHAPTER 8. ANNEX2 - DESCRIPTION OF THE HARDWARE AND SOFTWARE PLATFORMS118
has its own strength such as an easy to use interface and at the same time has ownlimitations are generally used for single user application and managing limited amounts ofdata.
• Reasons to Migrate fromMicrosoft Access to the MySQL database: MySQLdatabase o�ers several features rather than Access and it also supports Access fea-tures. Some of the features are discussed here.
� Deployment of information: Contents of MySQL table information can beused in many ways and to be access that information not only from the MySQLtable at other location but also from Microsoft Access table. The MySQLdatabase easily integrates with Web servers like Apache through a number oflanguages, such as PHP, Perl, Ruby, Python and Java [25].
� Multi-user access: Access only support single user interface, but My SQLeasily handles many simultaneous users.
� Management of large databases: Ability to manage hundreds of megabytesof data by using MySQL database.
� Security: There is no particular security features in Microsoft Access. So,anyone can easily access the data from the tables in the Access. MySQL servermanages security, if store the data tables in MySQL. One can access the datatables in MySQL with proper username and password only.
� Cost: Cost evolution of MySQL is freely obtainable, but Microsoft Access isnot free.
� Hardware choices: Microsoft Access works on a single platform but My SQLruns on several platforms.
• Methods of Transferring Database from Microsoft Access to the MySQLdatabase: Before migrating information from Access to MySQL database, �rst copythe all contents of table information from Access to the MySQL database, then deletethe table information stored in Access database. Establish an ODBC connection fromAccess to the MySQL server and recreating the table(s) links to the MySQL links.
• Telling Microsoft Access to Export its own Tables: Migrating data fromAccess to the MySQL can be done by using the export feature provided by Accessitself to write out the contents of each table as a text �le. Using a LOAD DATAstatement, each �le can be loaded into MySQL. MySQL program for importing thetable �le from Access to the My SQL database is shown like here [25]:
C:� mysqlimport �local �fields-terminated-by=,
�fields-enclosed-by='"'
�lines-terminated-by='rn'
mydb Tablename.txt
As discussed already, to create the username, hostname and password to the My SQLdatabase of security purpose that commands are shown here:

CHAPTER 8. ANNEX2 - DESCRIPTION OF THE HARDWARE AND SOFTWARE PLATFORMS119
C:� mysqlimport �local �fields-terminated-by=,
�fields-enclosed-by='"'
�lines-terminated-by='rn'
-h some_host -p -u some_user
mydb Tablename.txt
8.2.4 PostgreSQL Database
PostgreSQL is an Object-Relational Database Management System (ORDBMS) developedby the computer science department members at the University of California and it o�ersseveral modern features. Modern features o�ered by postgreSQL are [77]:
• Triggers:This is a speci�cation function. In PostgreSQL, using with a trigger,database should execute a particular function automatically whenever a certain typeof operation is performed. Triggers are generally organized or de�ned to functionseither before or after any UPDATE, INSERT or DELETE operation, either onceper modi�ed row, or once per SQL statement. PostgreSQL o�ers two types of trig-gers such as per-statement triggers and per-row triggers. The trigger function ofper-statement is invoked only once when an appropriate statement is executed inPostgreSQL database. The per-row trigger can be used once for each row. Thesetriggers are sometimes called statement-level triggers and row-level triggers, respec-tively.
• Views:In PostgreSQL, views are implemented using the rule system. The viewprogram used by PostgreSQL is shown here.
CREATE TABLE myview (same attribute list as for mytab);
CREATE RULE "_RETmyview" AS ON SELECT TO myview DO INSTEAD
SELECT * FROM mytab;
• Multi Version concurrency control:MVCC removes old data level locking andreplace it with a new locking system that is most superior to the commercial databasesystem. To preventing reads by other users in a traditional system, each row that ismodi�ed is locked until committed [77].
Along with modern features, PostgreSQL also o�ers new data types, functions, op-erators, and procedural languages therefore user can be extend the PostgreSQL inmany ways.
8.3 IDE'S (Delphi 6.0, Netbeans 6.7):
This section discusses about two di�erent integrated development environments.
8.3.1 Delphi IDE
It is the premier development environment for software developers and databaseapplication developers who need to rapidly deliver high performance and easy to

CHAPTER 8. ANNEX2 - DESCRIPTION OF THE HARDWARE AND SOFTWARE PLATFORMS120
maintain software applications. Compare to other versions, which provides threeeditions such as Enterprise, Professional, and personal. The personal edition is aimedlacks database support and other advanced features the professional version enablesdatabase support and other cross platform development but has no support for newXML and WEB services technologies.
Use the powerful Delphi IDE with its visual design surface, extensive component uni-verse and powerful heterogeneous database framework to visually design and deliverapplications in a fraction of the time. The powerful Delphi language and compilerdeliver high performance and access to all the power and speed of native windowsdevelopment. Delphi also provides a comprehensive set of editing, refactoring, anddebugging tools in a complete solution focused on making development faster andeasier. It has new features in the following areas [71]:
� Data modules: The title bar of a module displays the module's name. "Data-ModuleN" is the default name for a data module where N is a number repre-senting the lowest unused unit number in a project.
For example, when we start to implement new project, we have to open newproject or new form. That the project name is Unit1, Unit2... etc. the namewill be displayed except our presently using the project name. The followingsteps are needed to rename the project.
∗ Select the module and possible to edit the name property for the modulein the Object Inspector.
∗ The new name for the module appears in the title bar when the title Nameproperty in the Object Inspector no longer has focus.
Figure 8.1: Delphi IDE.

CHAPTER 8. ANNEX2 - DESCRIPTION OF THE HARDWARE AND SOFTWARE PLATFORMS121
By changing the name of a data module at design time that leads to change itsvariable name in the mode of interface section and it also changes any use oftype name the procedure declarations. So, try to being change any referencesby manually to the data module in the code.
� Object Tree View: Object Tree View is located in the upper left-hand cornerof the Delphi IDE and Tree View is a type of diagram that displays the logicalrelationships between non visual and visual components on a form, frame ordata module. The Tree View is synchronized with the Object Inspector andForm Designer so, if we select an item and change the focus in any one ofthese three tools, the focus changes in the two tools. Functions of Object TreeView [71]:
∗ The Tree View is positioned above the Object Inspector and if not displayed,appears when you press Alt+Shift+F11 or Choose View Object Tree View.
∗ The Tree View includes components on a form and a frame as well as adata module.
∗ The Tree View includes visual as well as nonvisual components.∗ A new toolbar includes New Item, Delete, and Move Up/Down buttons.These buttons work for component properties.
For example, if we have added a dataset component, we can select the aggregatesproperty and click the New Item button to add a �eld. If there is more thanone type of thing that can be added, the New Item button will drop down amenu to pick from.
� Code editor:The code editor now supports surface designs, or package-loadedcustom views. These views are accessible as tabs, or pages, located on thestatus bar. The only built-in view is the standard code page. There is a pageon the code editor name as diagram that provides lines to display relationshipsschematically and visual tools for setting up a diagram of boxes and possible toadd comments to the diagram page. Components do not appear on the diagrampage until we drag them from the Object Tree View.
∗ We can select the multiple items from the Object Tree View and drag themto the diagram page at one time.
∗ The left side of the diagram pages an edit box where you can type a nameand description for each diagram we create and a drop-down list box to �ndpreviously named diagrams.
∗ The toolbar of buttons for connector relationships and comment blocks sitsat the top of the diagram page.
∗ Property connectors are labeled automatically. We can drag the labelselsewhere on the page.
∗ We can create a diagram for each data module, form, or frame we haveadded to our project.
� Object Inspector: The Object Inspector is located below the Object TreeView in the Delphi Environment. Instance List box :
∗ The instance drop-down list box is at the top of the Object Inspector.
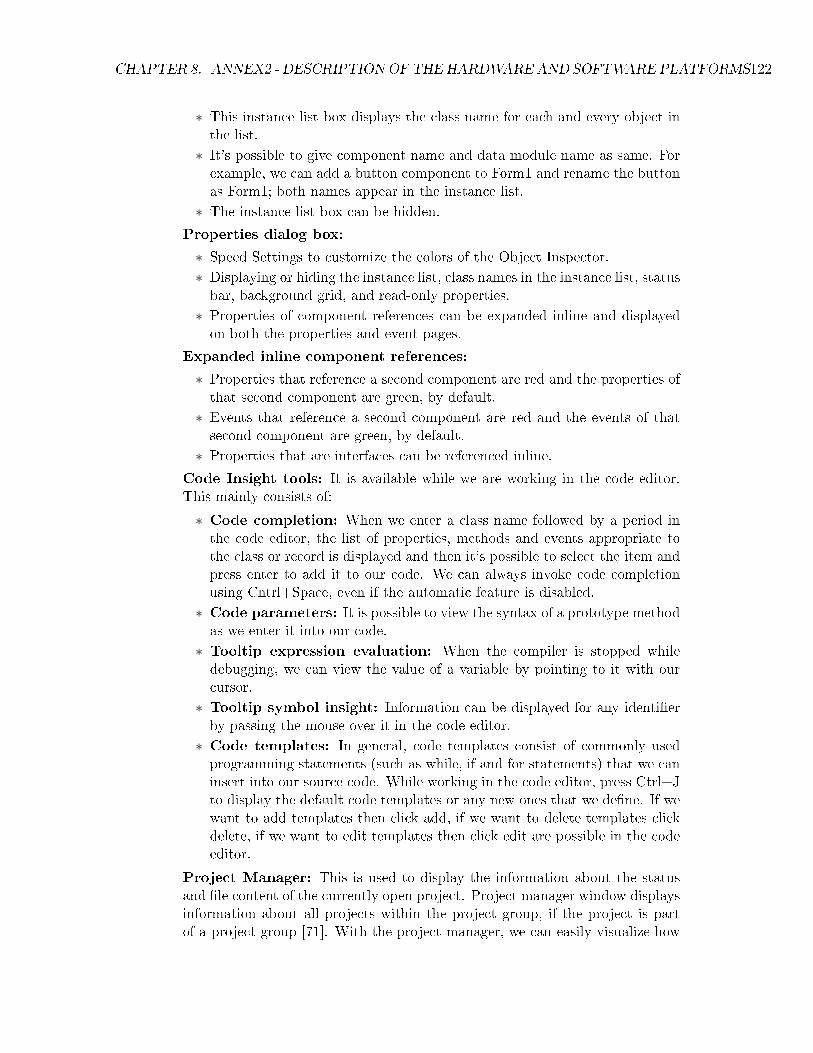
CHAPTER 8. ANNEX2 - DESCRIPTION OF THE HARDWARE AND SOFTWARE PLATFORMS122
∗ This instance list box displays the class name for each and every object inthe list.
∗ It's possible to give component name and data module name as same. Forexample, we can add a button component to Form1 and rename the buttonas Form1; both names appear in the instance list.
∗ The instance list box can be hidden.
Properties dialog box:
∗ Speed Settings to customize the colors of the Object Inspector.∗ Displaying or hiding the instance list, class names in the instance list, statusbar, background grid, and read-only properties.
∗ Properties of component references can be expanded inline and displayedon both the properties and event pages.
Expanded inline component references:
∗ Properties that reference a second component are red and the properties ofthat second component are green, by default.
∗ Events that reference a second component are red and the events of thatsecond component are green, by default.
∗ Properties that are interfaces can be referenced inline.
� Code Insight tools: It is available while we are working in the code editor.This mainly consists of:
∗ Code completion: When we enter a class name followed by a period inthe code editor, the list of properties, methods and events appropriate tothe class or record is displayed and then it's possible to select the item andpress enter to add it to our code. We can always invoke code completionusing Cntrl+Space, even if the automatic feature is disabled.
∗ Code parameters: It is possible to view the syntax of a prototype methodas we enter it into our code.
∗ Tooltip expression evaluation: When the compiler is stopped whiledebugging, we can view the value of a variable by pointing to it with ourcursor.
∗ Tooltip symbol insight: Information can be displayed for any identi�erby passing the mouse over it in the code editor.
∗ Code templates: In general, code templates consist of commonly usedprogramming statements (such as while, if and for statements) that we caninsert into our source code. While working in the code editor, press Ctrl+Jto display the default code templates or any new ones that we de�ne. If wewant to add templates then click add, if we want to delete templates clickdelete, if we want to edit templates then click edit are possible in the codeeditor.
� Project Manager: This is used to display the information about the statusand �le content of the currently open project. Project manager window displaysinformation about all projects within the project group, if the project is partof a project group [71]. With the project manager, we can easily visualize how
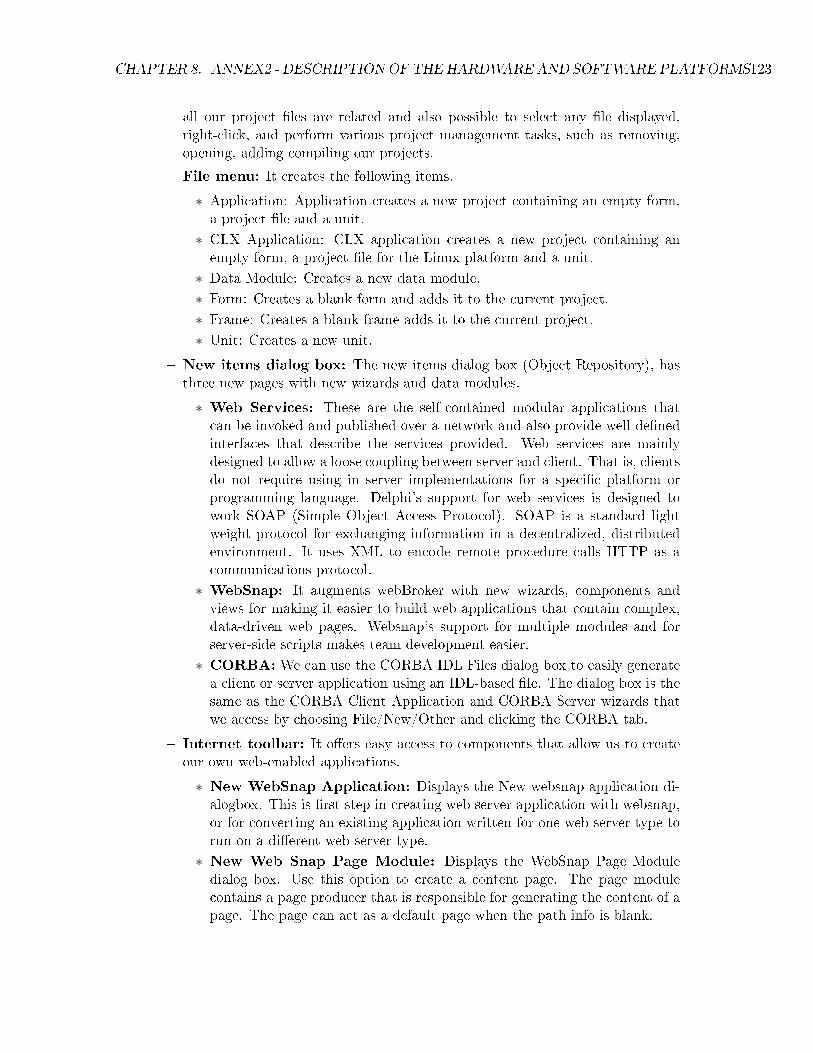
CHAPTER 8. ANNEX2 - DESCRIPTION OF THE HARDWARE AND SOFTWARE PLATFORMS123
all our project �les are related and also possible to select any �le displayed,right-click, and perform various project management tasks, such as removing,opening, adding compiling our projects.
� File menu: It creates the following items.
∗ Application: Application creates a new project containing an empty form,a project �le and a unit.
∗ CLX Application: CLX application creates a new project containing anempty form, a project �le for the Linux platform and a unit.
∗ Data Module: Creates a new data module.∗ Form: Creates a blank form and adds it to the current project.∗ Frame: Creates a blank frame adds it to the current project.∗ Unit: Creates a new unit.
� New items dialog box: The new items dialog box (Object Repository), hasthree new pages with new wizards and data modules.
∗ Web Services: These are the self-contained modular applications thatcan be invoked and published over a network and also provide well-de�nedinterfaces that describe the services provided. Web services are mainlydesigned to allow a loose coupling between server and client. That is, clientsdo not require using in server implementations for a speci�c platform orprogramming language. Delphi's support for web services is designed towork SOAP (Simple Object Access Protocol). SOAP is a standard lightweight protocol for exchanging information in a decentralized, distributedenvironment. It uses XML to encode remote procedure calls HTTP as acommunications protocol.
∗ WebSnap: It augments webBroker with new wizards, components andviews for making it easier to build web applications that contain complex,data-driven web pages. Websnap's support for multiple modules and forserver-side scripts makes team development easier.
∗ CORBA: We can use the CORBA IDL Files dialog box to easily generatea client or server application using an IDL-based �le. The dialog box is thesame as the CORBA Client Application and CORBA Server wizards thatwe access by choosing File/New/Other and clicking the CORBA tab.
� Internet toolbar: It o�ers easy access to components that allow us to createour own web-enabled applications.
∗ New WebSnap Application: Displays the New websnap application di-alogbox. This is �rst step in creating web server application with websnap,or for converting an existing application written for one web server type torun on a di�erent web server type.
∗ New Web Snap Page Module: Displays the WebSnap Page Moduledialog box. Use this option to create a content page. The page modulecontains a page producer that is responsible for generating the content of apage. The page can act as a default page when the path info is blank.

CHAPTER 8. ANNEX2 - DESCRIPTION OF THE HARDWARE AND SOFTWARE PLATFORMS124
∗ New WebSnap Module: Displays the new WebSnap Data Module dialogbox to create an empty data module for adding websnap internet compo-nents. For selecting this type of module does not create a content page andis only used as a container for components shared by other modules.
� Component palette changes: Component palette changes are used for build-ing customized menus and toolbars, including TactionManager, TactionMain-Bar, and TactionToolBar [71].
∗ For CLX applications, the Common controls page substitutes the Win32page.
∗ A new WebSnap page has been added with components to build a webserver application with multiple modules.
∗ The web service page has been added for writing multipier applications overa network or the web.
∗ There are many changes have been made on the database component palattepages.
8.3.2 Netbeans IDE
This is a type of IDE (Integrated Development Environment), mostly used for devel-oping the java applications and also supports other software language applicationssuch as PHP, Ruby, Python, Groovy, C and C++.
Netbeans IDE has written in java therefore it runs everywhere, if the JVM (JavaVirtual Machine) is already installed in the system and this IDE supports severaloperating systems they are Windows, Linux, Mac OS, and Solaris.
In this thesis, Netbeans 6.7 version has been used for developing the mobile applica-tions. Major features o�ered by Netbeans 6.7 are:
� XML Editor
� C/C++ Development
� Mobile Application Development (Java Micro Edition)
� Java ME CLDC Features (MIDP)
� UML Modeling
� New APIs (Application Program Interfaces)
�gure 8.2 represents the Netbeans 6.7 IDE, which is having several features thatsupports and runs many languages on this IDE. Main tools which we can see on thisIDE are project �les, Navigator, Code Editor and Mobile device Screen [65].
Project Files: �gure 8.3 represents the project �les and that will maintain allprojects �les. Files include source code �les and when tried to run the source codethat will automatically create 'jar' �les in the background. Jar �les are enough torun the entire project on a mobile device.

CHAPTER 8. ANNEX2 - DESCRIPTION OF THE HARDWARE AND SOFTWARE PLATFORMS125
Figure 8.2: Netbeans IDE.
Figure 8.3: Project File.
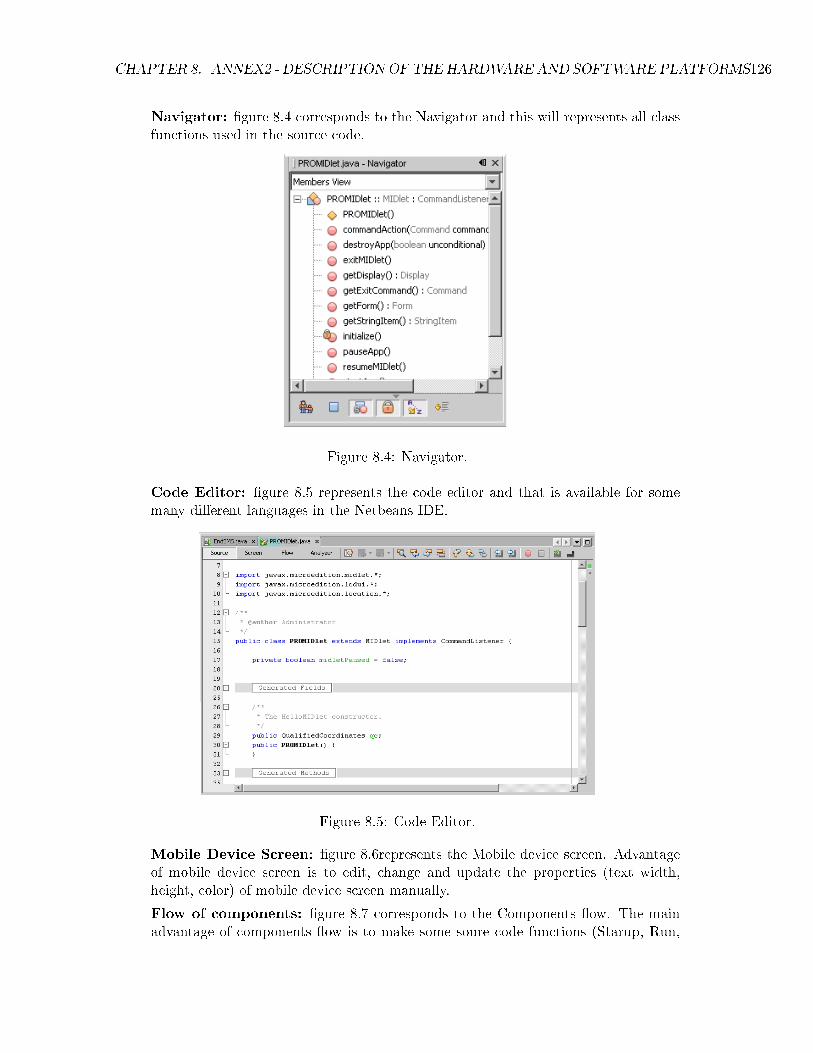
CHAPTER 8. ANNEX2 - DESCRIPTION OF THE HARDWARE AND SOFTWARE PLATFORMS126
Navigator: �gure 8.4 corresponds to the Navigator and this will represents all classfunctions used in the source code.
Figure 8.4: Navigator.
Code Editor: �gure 8.5 represents the code editor and that is available for somemany di�erent languages in the Netbeans IDE.
Figure 8.5: Code Editor.
Mobile Device Screen: �gure 8.6represents the Mobile device screen. Advantageof mobile device screen is to edit, change and update the properties (text width,height, color) of mobile device screen manually.
Flow of components: �gure 8.7 corresponds to the Components �ow. The mainadvantage of components �ow is to make some soure code functions (Starup, Run,

CHAPTER 8. ANNEX2 - DESCRIPTION OF THE HARDWARE AND SOFTWARE PLATFORMS127
Figure 8.6: Mobile Device Screen.
Form, and Command Listener) automatically by using components in the code editorinstead of writing source code by the user [65].
Figure 8.7: Flow of Components.
Output Toolbox: �gure 8.8 corresponds to the output toolbox, which generateserrors, if any, while debugging or running the source code.
8.4 Mobile Terminals
This section discusses about two types of mobile devices.
CHAPTER 8. ANNEX2 - DESCRIPTION OF THE HARDWARE AND SOFTWARE PLATFORMS128
Figure 8.8: Output Toolbox.
8.4.1 E71 Mobile device:
E71 mobile device is used for obtaining the GPS coordinates and sending them to aserver.
Software and hardware speci�cations of Nokia E71:
Security features:
� Device lock
� Data encryption for both phone memory and microSD content
� Remote lock
Connectors:
� Micro USB connector
� 2.5mm Nokia AV connector
Memory:
� MicroSD memory card slot, hot swappable, max 8GB
� 110 MB internal dynamic memory
Operating Frequency:
� Quad-Band EGSM 850/900/1800/1900, WCDMA 900/2100 HSDPA
GPS and Navigation:
� Integrated A-GPS
� Nokia Maps application
Software platform and user interface:
� S60 3rd Edition
� Voice commands
� Symbian OS v9.2
� Two home screens with customizable active standby views
Data Network:

CHAPTER 8. ANNEX2 - DESCRIPTION OF THE HARDWARE AND SOFTWARE PLATFORMS129
� GPRS class A, multislot class 32, maximum speed 100/60 kbps (DL/UL)
� EDGE class A, multislot class 32, maximum speed 296/177.6 kbps (DL/UL)
� WCDMA 900/2100 or 850/1900 or 850/2100, maximum speed 384/384 kbps(DL/UL)
� HSDPA class 6, maximum speed 3.6 Mbps/384 kbps (DL/UL)
� WLAN IEEE 802.11b/g
8.4.2 N91 Mobile device:
N91 mobile device is used for obtaining the GPS coordinates and sending them to aserver.
Software and hardware speci�cations of Nokia N91:
Operating System:
� Symbian OS v9.2
Frequency Band:
� GSM 850
� GSM 900
� GSM 1800
� GSM 1900
� WCDMA 2100
GPS and Navigation:
� Integrated A-GPS
� Nokia Maps application
Graphics Formats:
� BMP,EXIF,GIF,JPEG,PNG
8.5 Server
This section gives the detailed information of working with My SQL server. First,use the login by choosing hostname, password and username that allows enteringinto the MySQL for security purpose.
# [mysql dir]/bin/mysql -h hostname -u root -p
Create a database on the sql server.
mysql> create database [DATABASENAME];
CHAPTER 8. ANNEX2 - DESCRIPTION OF THE HARDWARE AND SOFTWARE PLATFORMS130
Show databases on the sql server.
mysql> show databases;
Switch to a database.
mysql> use [db name];
See all the tables in the db.
mysql> show tables;
See database's �eld formats.
mysql> describe [table name];
To delete a db.
mysql> drop database [database name];
To delete a table.
mysql> drop table [MRW-OBJECT];
Show all data in a table.
mysql> SELECT * FROM [MRW-OBJECT];
The column information to the designed table.
mysql> show columns from [MRW-OBJECT];
Show the selected rows with the values.
mysql> SELECT * FROM [MRW-OBJECT] WHERE [�eld name] = "OBJECT-ID";
8.6 Wireless Communication System
This section discusses about the GPRS wireless communication system. GPRS standsfor General Packet Radio Service which is a packet based wireless communicationservice for mobile terminals that allows data to be transmitted and received overa mobile telephone network [1]. Actually GPRS is a step towards third generation(3G) but often referred as 2.5G. Some key bene�ts of GPRS are to be discussed here.
8.6.1 Key bene�ts of GPRS
� Connectivity: GPRS supports always-on service and it makes services instan-taneously available to a terminal.
� Speed: GPRS o�ers higher connection speeds at around 56 to 118 kbps and20 to 50 kbps corresponds to lower connection speeds.
� New and Better applications: As we have already discussed, GPRS o�ersalways-on connectivity and high speed connection that enables full internet ap-plications and services as video conferencing for desktop and mobile devices [2].

CHAPTER 8. ANNEX2 - DESCRIPTION OF THE HARDWARE AND SOFTWARE PLATFORMS131
8.6.2 GPRS Network
GPRS network is shown in �gure ?? which consists of the following key elements:
� SGSN (Serving GPRS Support Node): With in the GSM infrastructure,this node sends and receives packet data to and from the mobile stations andkeeps track of the mobiles within its service area. SGSNs send queries to HomeLocation Registers (HLRs) to obtain pro�le data of GPRS subcarriers and de-tects new GPRS mobile stations in a given service area. The SGSN performsseveral functions such as, tracking a mobile location, user veri�cation, and col-lection of billing data [2].
� GGSN (Gateway GPRS Support Node): This node interfaces to externalPublic Data Networks (PDNs) such as the Internet and X.25 protocol. GGSNsmaintain routing information that is necessary to tunnel the Protocol Data Units(PDUs) to the SGSNs. The GGSN performs several other functions includenetwork and subcarrier screening and address mapping.
Figure 8.9: GPRS Network.
� GTP (GPRS Tunneling Protocol): This is a specialized protocol that op-erates over the top of standard TCP/IP protocols to encapsulate IP packets.
� Base Station System (BSS): This must be enhanced to recognize and senduser data to the SGSN that is serving the area.
� Home Location Register (HLR): This must be enhanced to register GPRSuser pro�les and respond to queries originating from SGSNs regarding thesepro�les.
Bibliography
[1] Gprs tutorial. MorganDoyle Limited, 15 Devon Street, Bury, UK, 20002.
[2] General packet radio service. White Paper by Usha Communications Technol-ogy, 2006.
[3] Omg systems modeling language (omg sysml�), November 2008.
[4] Gis basics. Miami Valley Regional Planning Commission, February 15, 2006.
[5] Progress database design guide. Progress Software Corporation, May 2001.
[6] S.S. Alhir. Learning URL. O�reilly., 2003.
[7] I.Thysen B.K.Pathak A.L.Jensen, P.S.Boll. Pl@nteinfo � a web-based systemfor personalised decision support in crop management. Computers and Elec-tronics Agriculture, 25:271�293, February 2000.
[8] J. Collins B. Hofmann-Wellenhof, H. Lichtenegger. Global Positioning System:Theory and Practice. Springer; 5th edition, February 8, 2001.
[9] M. Wieser H. Lichtenegger B. Hofmann-Wellenhof, K. Legat. Navigation: Prin-ciples of Positioning and Guidance. Springer; 1 edition, Oct 2 2003.
[10] Frederic Bes, Muriel Jourdan, and Farid Khantache. A generic architecture forautomated construction of multimedia presentations. In In Proceedings of theInternational Conference on Multimedia Modeling, 2001.
[11] Ljerka Beus-Dukic. An introduction to sysml. School of Informatics, Universityof Westminster, London, UK, 2007.
[12] Michael Brydon. Access tutorial 1: Introduction to microsoft access. 1997.
[13] Ed Burnette. Eclipse IDE Pocket Guide. O�reilly., 2005.
[14] John P. Burnham. The Essential Guide to the Business of U.S. Mobile WirelessCommunications. Prentice Hall PTR, Upper Saddle River, NJ, USA, 2001.
[15] Framingham Corporate Center. Object management group, 2006.
[16] Mike Chappel. Databases guide. 2009.
[17] Cho C.K. An Introduction to Software Quality Control. John Wiley & SonsPublication, New York, 1980.
[18] Peter Coad and Edward Yourdon. Object Oriented Analysis. Prentice HallPTR; 2 edition, October 1, 1990.
[19] David J. Cowen and Scott Reily Love. A hypercard based workstation for adistributed gis network. GIS/LIS �88; San Antonio, 1:285�294, 1988.
132

BIBLIOGRAPHY 133
[20] Debasis Das. Di�erential gps - how dgps works. 2009.
[21] Nigel Davies, Keith Cheverst, Keith Mitchell, and Adrian Friday. 'caches inthe air': Disseminating tourist information in the guide system. In WMCSA'99: Proceedings of the Second IEEE Workshop on Mobile Computer Systemsand Applications, 1999.
[22] Alan M. Davis. Software Requirements: Objects, Functions and States. PrenticeHall; 2 edition, March 14, 1993.
[23] Goran M. Djuknic and Robert E. Richton. Geolocation and assisted gps.Compter, 34:123�125, 2001.
[24] Chris R. Drane and Chris Rizos. Positioning Systems in Intelligent Transporta-tion Systems. Artech House, Inc., 1998.
[25] Paul DuBois. Migrating from microsoft access to the mysql database. NuSphereCorporation, 2002.
[26] Ahmed El-Rabbany. Introduction to GPS: The Global Positioning System.Artech House Publishers; 1st edition, January 1, 2002.
[27] ESRI. The guide to geographic information system. 2003.
[28] ESRI. Mobile gis. May 2007.
[29] E.Thomson. Integrating pda, gps and gis technologies for mobile tra�c dataacquisition. Master's thesis, IT University of Goteborg, Sweden, 2002.
[30] Electronic Tracking System (ETS). Gsm vs gps positioning. 2007.
[31] E.Vivoni and R.Camilli. Real-time streaming of environmental �eld data. Com-puter and Geoscience, 29:457�468, 2003.
[32] David Garlan and Dewayne Perry. Introduction to the special issue on softwarearchitecture. IEEE Transactions on Software Engineering, 21:269�274, Apr.1995.
[33] GARMIN. Gps beginner�s guide. 2008.
[34] George M. Giaglis, Panos Kourouthanassis, and Argirios Tsamakos. Towardsa classi�cation framework for mobile location services. pages 67�85, 2003.
[35] Assistant Professor Glen C. Rains, Biological Daniel L. Thomas, Former Pro-fessor, and Agricultural Engineering. Precision farming: An introduction. TheUniversity of Georgia and Ft. Valley State University, 2007.
[36] Martin Gogolla and Brian Henderson-sellers. Analysis of uml stereotypes withinthe uml metamodel. In in Proceedings of UML, 2002, 2002.
[37] Min-Soo Kim Hae-Kyong Kang, Ki-Joune Li. A framework for dynamic updatesof map data in mobile devices. International Journal of Web Engineering andTechnology, 3:176 � 195, 2007.
[38] Ali Hamie, Franco Civello, John Howse, Stuart Kent, and Richard Mitchell.Re�ections on the object constraint language. In In The Uni�ed ModelingLanguage (UML), LNCS, 1998.

BIBLIOGRAPHY 134
[39] Wilhelm Hasselbring, Ralf Reussner, Holger Jaekel, Jurgen Schlegelmilch,Thorsten Teschke, and Stefan Kriegho�. The dublo architecture pattern forsmooth migration of business information systems: An experience report. InICSE '04: Proceedings of the 26th International Conference on Software Engi-neering, 2004.
[40] Programmers Heaven. Integrated development environment. 2009.
[41] Bill Hetzel. The complete guide to software testing (2nd ed.). QED InformationSciences, Inc., 1988.
[42] 1999b. IEEE. Wireless medium access control (mac) and physical layer (phy)speci�cations: Higher-speed physical layer extension in the 2.4 ghz band. ieeestandard 802.11b. The Institute of Electrical and Electronics Engineers Inc.,345 East 47th Street, New York, USA.
[43] 2002. IEEE. Wireless medium access control (mac) and physical layer(phy) speci�cations for wireless personal area networks (wpans). ieee standard802.15.1. The Institute of Electrical and Electronics Engineers Inc., 345 East47th Street, New York USA.
[44] 2003. IEEE. Wireless medium access control (mac) and physical layer (phy)speci�cations for low-rate wireless personal area networks (lr-wpans). ieee stan-dard 802.15.4. The Institute of Electrical and Electronics Engineers Inc., 345East 47th Street, New York, USA.
[45] A.Voisard J.Schiller. Location-Based Services. Morgan Kaufmann; 1 edition,May 14, 2004.
[46] Cem Kaner. Quality assurance institute worldwide annual software testingconference. In November 2006.
[47] Elliott D. Kaplan. Understanding GPS: Principles and Applications. ArtechHouse Publishers, February 21, 1996.
[48] Pavel Gnip Adam Sida Karel Charvat, Stanislav Holy. Precision farmingthrough internet and mobile communication. 2002.
[49] Gouveia J. & El-Ramy M. Koutsoukos G., Andrade L. Service extraction. 2006.
[50] William C.Y. Lee. Mobile Cellular Telecommunications: Analog and DigitalSystems. McGraw-Hill Professional, 1995.
[51] Won Suk Lee, An Asae, Meeting Presentation, Thomas F. Burks, AssistantProfessor, John K. Schueller, and Hyatt Regency Chicago. Silage yield moni-toring system. American Society of Agricultural and Biological Engineers, St.Joseph, Michigan,USA, 2002.
[52] Tayeb Lemlouma and Nabil Layada. Adapted content delivery for di�erentcontexts. Applications and the Internet, IEEE/IPSJ International Symposiumon, 0:190, 2003.
[53] Rick Kazman Len Bass, Paul Clements. Software Architecture in Practice.Addison-Wesley Professional; 2 edition, April 19, 2003.
[54] J.E. Longfoot and D.J. Quil. An automic network travel time measurementsystem-antts. proc. of the 15th ARRB conf., 6:147�170, 1990.
BIBLIOGRAPHY 135
[55] L. A. (1996) Macaulay. Requirements engineering. Springer Verlags, 1996.
[56] J. Mahan and D. Wanjura. Design and construction of a wireless infraredthermometry system. The USDA Annual Report, 2004.
[57] Qusay H. Mahmoud. J2me and location-based services. March 2004.
[58] Jari Korva Petri Määttä-Jaakko Sauvola Maija Metso, Mikko Löytynoja. Mo-bile multimedia services � content adaptation. In: 3rd International Confer-ence on Information, Communication and Signal Processing, 2001.
[59] J.J. Marciniak. Process models in software engineering. Encyclopedia of Soft-ware Engineering, 2nd Edition, John Wiley and Sons, December 2001.
[60] F.Gomez G.Olivares M.Damas, A.M.Prados. Hidrobus system: �eldbus forintegrated management of extensive areas of irrigated land. Microprocessorsand Microsystems, 25:177�184, 30 May 2001.
[61] M.H.Tsou. Integrating mobile gis and wireless internet map servers for en-vironmental monitoring and management. Cartographic and GeoinformationScience, 31:153�165, 2004.
[62] Corvallis Microtechnology. Introduction to the global positioning system forgis and traverse. 2000.
[63] M.R.Sivaraman. Gps, gagan&lbs. Retd. Scientist Space Applications CentreAhmedabad.
[64] Glenford J. Myers and Corey Sandler. The Art of Software Testing. John Wiley& Sons, 2004.
[65] NetBeans. Netbeans ide 6.7. 2008.
[66] Netbeans. Netbeans platform learning trail. 2009.
[67] Naiqian Zhangb Ning Wanga and Maohua Wangc. Wireless sensors in agricul-ture and food industry�recent development and future perspective. Computersand Electronics in Agriculture, 50:1�14, January 2006.
[68] Dana Nourie. Getting started with an integrated development environment.Sun Microsystems, 2005.
[69] J. R. Van Ossenbruggen, F. J. Cornelissen, J. P. T. M. Geurts, L. W. Rutledge,H. L. Hardman, Jacco Van Ossenbruggen, Frank Cornelissen, Joost Geurts,Lloyd Rutledge, and Lynda Hardman. Cuypers: a semi-automatic hypermediageneration system. Technical report, Review of Austrian Economics, 2000.
[70] G. Scott Owen. Gis operations. 1999.
[71] Xavier Pacheco. Delphi 6 Developer's Guide. Sams, December 17, 2001.
[72] Zhong-Ren Peng and J. G. Speight. Internet GIS: Distributed Geographic In-formation Services for the Internet and Wireless Networks. John Wiley & Sons,Inc., 2003.
[73] Dewayne E. Perry and Alexander L. Wolf. Foundations for the study of softwarearchitecture. ACM SIGSOFT Software Engineering Notes, 17, October 1992:.
[74] William E. Perry. A standard for testing application software. Auerbach Pub-lications, 1986.
BIBLIOGRAPHY 136
[75] K. Pohl. The three dimensions of Requirements Engineering. in C. Rolland,F. Bodart and C. Cauvet (eds), Fifth International Conference on AdvancedInformation Systems Engineering (CAiSE�93), pp.175-292. Paris: Springer-Verlag., 1993.
[76] Günther Pospischil, Harald Kunczier, Er Kuchar, and Forschungszen-trum Telekommunikation Wien. Lol@: A umts location based service. InIn: International Symposion on 3rd Generation Infrastructure and Services,Athen, 2001.
[77] PostgreSQL. Postgresql 8.3.10 documentation. Documentation The Post-greSQL Global Development Group, 2008.
[78] GIS PRIMER. Functions of gis. Designed and Developed by Remote Sensing& GIS Division, National Informatics Center(NIC), New Delhi.
[79] rank Solutions. Wingis-gis for decision makers. 2002.
[80] Daniel M. Queiroz Evandro C. Mantovani Werner F. Santos Reinaldo L. Go-mide, Ricardo Y. Inamasu. An automatic data acquisition and control mobilelaboratory network for crop production systems data management and spa-tial variability studies in the brazilian center-west region. American Society ofAgricultural and Biological Engineers, St. Joseph, Michigan,USA, 2001.
[81] RDL/GIS Geographic Information Systems Resources. Components of a gis.Environmental Systems Research Institute, 1996.
[82] RoseIndia. Basic components & functionality of lbs. 2008.
[83] Timo Salminen and Simo Hosio. Region-based positioning method for cellularnetworks. In Mobility '06: Proceedings of the 3rd international conference onMobile technology, applications & systems, 2006.
[84] A. Schleicher and B. Westfechtel. Beyond stereotyping: Metamodeling ap-proaches for the uml. Hawaii International Conference on System Sciences,3:3051, 2001.
[85] Scriptol. De�nitions of algorithm. 2006.
[86] Je�rey Shallit. A Very Brief of Computer Science. University of Waterloo,2006.
[87] Jungwon Min Shu Wang and Byung K.Yi. Location based services for mobiles:Technologies and standards. IEEE International Conference on Communica-tion (ICC), 2008.
[88] S.N.Rajinder. Cartographic visualization for mobile application. Master's the-sis, ITC/IIRS, 2004.
[89] Ronald P. Anjard Sr. The basics of database management systems (dbms).Industrial Management & Data Systems, 94:11�15, 1994.
[90] Stefan Steiniger, Moritz Neun, and Alistair Edwardes. Foundations of locationbased services lesson 1 cartouche 1- lecture notes on lbs, v. 1.0, 2008.
[91] Yuting Sun, Shuliang Zhang, Yiming Zhang, and Guonian Lv. Design andimplementation of integration framework for terminal-oriented mobile gis datacollection. In GPC-WORKSHOPS '08: Proceedings of the 2008 The 3rd Inter-national Conference on Grid and Pervasive Computing - Workshops, 2008.
BIBLIOGRAPHY 137
[92] Survey and Mapping O�ce/Lands Department. Global positioning systemtechnology. 2009.
[93] Tom Swanson. Esri mobile gis solutions. 2007.
[94] Target. The software experts. 2009.
[95] Toby J. Teorey and James P. Fry. The logical record access approach todatabase design. ACM Comput. Surv., 12:179�211, 1980.
[96] Trimble. Gps for precision agriculture. 2009.
[97] Sam van Leeuwen. Gps point position calculation. GPS Solutions, 6:115�117,November,2002.
[98] Hans van Vliet. Software Engineering: Principles and Practice. Wiley; 2edition, August 30, 2000.
[99] D. E. Wells. Guide to gps positioning. Fredericton, New Brunswick: CanadianGPS Associates, 1987.
[100] Zhenhui. Ren. Yanxia. Gu., Baozhong. Wu. Research of precision farmingexpert system based on gis. In: Proceedings of the IEEE International Confer-ence., 2007.


![CNN Based High Performance Computing for Real Time Image ...vi.uni-klu.ac.at/publications/papers/2011potluri.pdf · Real time image processing using modern processors is limited [4].](https://static.fdocuments.us/doc/165x107/5f99ec4010a8f948312f4cfe/cnn-based-high-performance-computing-for-real-time-image-viuni-kluacatpublicationspapers.jpg)