Development and characterization of self-emulsifying ...
118
Development and characterization of self-emulsifying pellets by extrusion/spheronization Dissertation Zur Erlangung des akademischen Grades Doctor rerum naturalium (Dr. rer. nat.) vorgelegt der Naturwissenschaftlichen Fakultät I Biowissenschaften der Martin-Luther-Universität Halle-Wittenberg Von Ahmed Mohamed Effat M. Abdalla geboren am 08. Mai 1977 in Riad, Saudi-Arabien Gutachter: 1. Prof. Dr. Karsten Mäder 2. Prof. Dr. Alfred Blume 3. Prof. Dr. Michaela Schulz-Siegmund Halle (Saale), den 28.10.2008
Transcript of Development and characterization of self-emulsifying ...

Development and characterization of self-emulsifying
pellets by extrusion/spheronization
Dissertation
Zur Erlangung des akademischen Grades
Doctor rerum naturalium (Dr. rer. nat.)
vorgelegt der
Naturwissenschaftlichen Fakultät I
Biowissenschaften
der Martin-Luther-Universität Halle-Wittenberg
Von
Ahmed Mohamed Effat M. Abdalla
geboren am 08. Mai 1977 in Riad, Saudi-Arabien
Gutachter:
1. Prof. Dr. Karsten Mäder
2. Prof. Dr. Alfred Blume
3. Prof. Dr. Michaela Schulz-Siegmund
Halle (Saale), den 28.10.2008

II
This work is dedicated to my parents
my wife Marwa and my son Khaled

III
Table of contents
1 Introduction 1
1.1 Formulation approaches for poorly soluble drugs 1
1.2 Self-emulsifying drug delivery systems 6
1.2.1 General 6
1.2.2 Formulation of SEDDS 6
1.2.2.1 Oils 7
1.2.2.3 Surfactants 8
1.2.2.4 Co-solvents 9
1.2.2.5 Other excipients 11
1.2.3 Mechanism of self-emulsification 12
1.2.4 Improvement of drug absorption by SEDDS 13
1.3 Lipid digestion and its effect on drug solubilization 16
1.4 Pellets 18
1.4.1 Extrusion/Spheronization 19
1.5 Electron spin resonance (ESR) spectroscopy 23
1.5.1 Basics 23
1.5.1.1 General 23
1.5.1.2 Zeeman effect and resonance condition 24
1.5.1.3 Mathematical description 25
1.5.1.4 Hyperfine Interaction 26
1.5.1.5 Relaxation 28
1.5.2 Instrumentation 28
1.5.3 Decoding ESR spectra 29
1.5.3.1 Mobility and microviscosity 30
1.5.3.2 Micropolarity 32
IV
1.5.3.3 pH 33
2. Preparation and characterization of a self-emulsifying pellet formulation containing Solutol® and a mixture of C18 mono- and di-glycerides 34
2.1 Introduction 34
2.2 Materials 35
2.3 Methods 36
2.3.1 Preparation of pellets 36
2.3.1.1 Preparation of the self-emulsifying mixture 36
2.3.1.2 Extrusion/Spheronization 36
2.3.2 Pellets size analysis 37
2.3.3 Pellets shape analysis 37
2.3.4 Assessment of self-emulsification 37
2.3.5 Friability testing of pellets 38
2.3.6 Disintegration testing of pellets 38
2.3.7 Electron Microscopy 38
2.3.8 ESR flow through cell experiment 38
2.3.9 Dissolution testing 40
2.4 Results and discussion 41
2.4.1 Physical characterization of the pellets 41
2.4.2 Assessment of self-emulsification 44
2.4.3 ESR flow through cell experiment 45
2.4.4 Dissolution testing 46
2.5 Conclusion 48
3. Preparation and characterization of a self-emulsifying pellet formulation containing Solutol® HS15, a mixture of medium chain mono- and di-glycerides and tri-glycerides of caprylic/capric acid. 49
3.1 Introduction 49

V
3.2 Materials 51
3.3 Methods 52
3.3.1 Preparation and assessment of Self-emulsifying mixtures 52
3.3.1.1 Preparation of Self-emulsifying mixtures 52
3.3.1.2 Assessment of self-emulsification 53
3.3.1.3 Droplet size determination 53
3.3.1.4 Equilibrium Solubility Measurements 53
3.3.1.5 ESR spectroscopy 54
3.3.1.6 In Vitro Digestion 54
3.3.1.7 Monitoring of In Vitro lipid digestion by ESR 56
3.3.2 Formulation and characterization of pellets 56
3.3.2.1 Formulation of pellets 56
3.3.2.2 Electron Microscopy 56
3.3.2.3 T2 NMR distribution measurement 57
3.3.2.4 In Vitro release testing 57
3.4 Results 58
3.4.1 Preparation and in vitro assessment of the SE mixtures 58
3.4.2 Equilibrium solubility 64
3.4.2 In Vitro digestion 66
3.4.3 Monitoring of In Vitro lipid digestion by ESR 67
3.4.4 Formulation and assessments of SE pellets 72
3.4.4.1 Pellets size and shape analysis 72
3.4.4.2 ESEM investigations 72
3.4.4.3 Assessment of friability 74
3.4.4.4 NMR T2 Distribution measurement 75
3.4.4.5 ESR flow through experiment 77
3.4.4.6 In Vitro release testing 78

VI
3.5 Conclusion 80
4 Summary 82
4.1 English version 82
4.1 German version 84
5. References 87

VII
Abbreviations
BCS Biopharmaceutical classification system BHA Butylated hydroxyanisole
BHT Butylated hydroxytoluene BS Bile salts
CMC Carboxymethylethyl cellulose CsA Cyclosporin A
CW Continuous wave DLS Dynamic light scattering
EPR Electron paramagnetic resonance ES Extrusion/Spheronization
ESEM Environmental scanning electron microscopy ESR Electron spin resonance
FaSSIF Fasted state simulated intestinal fluid FeSSIF Fed state simulated intestinal fluid
GMS Glyceryl monostearate GRAS Generally regarded as safe
GSE Gas secondary electron Hfs Hyperfine splitting
HLB Hydrophilic lipohilic balance HPC Hydroxypropyl cellulose
HPLC High performance liquid chromatography HPMC Hydroxypropyl methyl cellulose
HPMCP Hydroxypropyl methyl cellulose phthalate LC Liquid crystalline
LFCS Lipid formulation classification system Log P Log octanol/water partition coefficient
MCC Microcrystalline Cellulose NMR Nuclear magnetic resonance
PCS Photon correlation spectroscopy PEG Polyethylene glycol
PG Propylene glycol PL Phospholipids

VIII
PVP Polyvinyl pyrrolidone SE Self-emulsifying
SEDDS Self-emulsifying drug delivery systems SEM Scanning electron microscopy
SMEDDS Self-microemulsifying drug delivery systems TB Tempolbenzoate
TL Tempol
Chapter 1 Introduction
1
1 Introduction
1.1 Formulation approaches for poorly soluble drugs Solubility is one of the important factors affecting oral bioavailability of a drug.
Hörter and Dressman have defined a drug as ‘poorly soluble’ when its dissolution
rate is so slow that dissolution takes longer than the transit time of the drug in the
absorption site, resulting in incomplete bioavailability [1-3]. Up to 41% of newly
discovered chemical entities fail in the drug development process due to their poor
aqueous solubility despite having potential pharmacodynamic activity [4]. On the
other hand, marketed poorly soluble drugs are administered in higher doses than
actually needed to achieve the desired plasma level which consequently leads to
toxicity problems. Dissolution is often the rate limiting step if the drug has reasonable
membrane permeability [5-8]. Such characteristics are typical to compounds that
belong to class II in the biopharmaceutical classification system (BCS) [9].
Formulation design can be a useful approach to improve the absorption and thus the
oral bioavailability for such drug candidates. Drugs exhibiting poor solubility as well
as low membrane permeability are categorized as BCS class IV drugs. Formulation
approaches may improve the bioavailability of this class but they are likely to be
compromised by their poor membrane permeability [6]. These drugs are not
preferred for oral administration except in cases where they are potent enough to be
effective at low plasma levels [10]. Improvement of the bioavailability of class IV
drugs could be better achieved through returning to the lead optimization phases and
select a chemical entity with more appropriate biopharmaceutical properties.
Generally, for drugs with an aqueous solubility of less than 100 µg/ml bioavailability
problems can be expected [2]. Several formulation approaches are presently
employed to tackle the formulation challenges of poorly soluble drugs. The selection
of a particular formulation approach depends on the optimum bioavailability that can
be achieved.
According to Pouton, strategies for formulation of poorly soluble drugs include
crystalline solid formulations, amorphous formulations and lipid formulations [6]. In
the crystalline solid formulations, improvement of the dissolution rate is obtained
through reducing the particle size and therefore increasing the surface area of the
drug exposed to gastrointestinal (GI) fluids. Moreover, the crystalline drug will remain

Chapter 1 Introduction
2
in a physically stable state throughout the dissolution phase in the gut lumen.
Strategies involved for such formulations include micronization [11-13], using
different milling techniques that results in particle size range of 0.1-25 µm, and
Nanosuspensions [14-22], produced by means of precipitation, pearl milling [e.g.
NanoCrystals® (particle size range obtained is 100-250 nm)], high-pressure
homogenization (e.g. DissoCubes®), and supercritical CO2 technology [10].
Modification of the crystal habit of a drug could be also utilized to improve the
dissolution and therefore the bioavailability as different polymorphs of a compound
can exhibit different physicochemical as well as biological activity [23-25].
Amorphous formulations, such as solid dispersions, offer many advantages over
other formulation techniques including dispersion of the drug in a carrier at a
molecular level, absence of crystal structure of drug in the formulation, and
improvement of wettability and/or solubilization effect [26-29]. Solid dispersions can
be formulated by solvent-based methods, such as casting and spray drying, or melt
extrusion which provide solvent-free process and therefore overcoming the problem
of residual solvents [30]. The most commonly used carriers included in the
formulation of solid dispersions are polyethylene glycol (PEG), polyvinyl pyrrolidone
(PVP), hydroxy-propyl methyl cellulose (HPMC), hydroxypropyl cellulose (HPC),
carboxymethylethyl-cellulose (CMC),hydroxypropyl methyl cellulose phthalate
(HPMCP), polyacrylates and polymethyl acrylates, urea, sugars, polyols, emulsifiers,
and organic acid derivatives [29]. Examples of drugs formulated as solid dispersions
are griseofulvin in PVP and in succinic acid [31, 32], acetaminophen in a urea system
[33], and tolazamide in PEG 8000 [34]. Complexation is also one of the approaches
used to improve the solubility of poorly soluble drugs. Complexing agents like
cyclodextrines and its derivatives and nicotinamide are used to enclose poorly
soluble drugs within its hydrophobic core environment resulting in increased solubility
[35-39].
The use of lipid based formulations has generated considerable interest as a
potential formulation approach to improve the oral bioavailability of poorly soluble
drugs [40-42]. Practically, lipid formulations can be described as a diverse group of
formulations with a wide variety of properties result from blending of up to five
classes of excipients ranging from triglyceride oils, through mixed glycerides,
lipophilic surfactants, hydrophilic surfactants, and water soluble surfactants [43]. The
appropriate formulation of a poorly soluble drug can decrease the intrinsic limitations

Chapter 1 Introduction
3
of slow and incomplete dissolution of such drugs by facilitating the formation of
solubilized phases from which absorption takes place. The achievement of such
phases will not essentially take place from the formulation itself, but alternatively from
taking the advantage of the intraluminal processing to which lipids are subjected [44].
Porter et al have described in a recent review three possible mechanisms by which
lipids and lipophilic excipients affect absorption, bioavailability and disposition of the
co-administered drug. These are: (i) enhancing drug solubilization in the intestinal
milieu by changing composition and character of the colloidal phases formed within
the intestinal lumen such as vesicles and mixed micelles, (ii) by interacting with
enterocyte-based transport process and therefore potentially changing drug uptake,
efflux, disposition and formation of metabolites within enterocytes, (iii) by changing
the pathway of drug transport to the systemic circulation from the normal portal vein
pathway to the intestinal lymphatic system pathway which consequently reduce first
pass drug metabolism as it travels directly to the systemic circulation without passing
through the liver [45]. Lipid formulations include simple solutions, self-emulsifying
drug delivery systems (SEDDS), and systems with very little oil that disperse to form
micellar solutions [43]. Pouton has introduced the lipid formulation classification
system (LFCS) in which he classified lipid-based formulations into four groups
according to the polarity of the components used [6, 43]. Formulations with the drug
dissolved in triglyceride oils [mainly vegetable oil or medium chain triglycerides
classed as GRAS (generally regarded as safe) by regulatory agencies] and/or mixed
glycerides are classified as type I. Since solvent capacity of triglycerides are low, oil
solutions may be a realistic option for potent drugs or for compounds with log P>4.
For less hydrophobic drugs solvent capacity could be improved by mixing
triglycerides with other excipients such as mixed mono- and di-glycerides. The
solvent capacity can be improved more by the inclusion of a lipophilic surfactant
(HLB< 12) which also promotes efficient self-emulsification. This type of formulation
is known as SEDDS and referred to as type II systems. Formulations which include
water-soluble components, surfactant with HLB higher than 12, are referred to as
type III systems in the LFCS and are called self-microemulsifying systems due to the
optical clarity which can be obtained with these systems. Type III formulations could
be further split into type IIIA and type IIIB with the later containing higher proportion
of hydrophilic components. A recent modification has been introduced to the LFCS
through the inclusion of type IV which represents the recent trend towards

Chapter 1 Introduction
4
formulations containing predominantly a mixture of hydrophilic surfactants and
cosolvents (table 1.1). This type of formulations offer the advantages of better solvent
capacity on dilution than cosolvent alone and reducing variability and irritancy caused
by high local concentrations of surfactants as the cosolvent facilitate its dispersion in
the GIT [6, 46].
Characteristic features, advantages and disadvantages of various types of lipid
formulation included in the LFCS are shown in table 2.1. The in vivo performance of
lipid-based formulations and the fate of the co-administered drug in the GIT depend
on the physical changes that take place upon the dilution of the formulation and the
influence of digestion on drug solubilization. As stated before, the main advantage of
lipid formulations is their ability to maintain the drug in a solubilized state throughout
its residence time in the GIT. Care should be taken in the development of lipid based
formulations to prevent loosing such advantage and prevent precipitation of the drug
at any stage, which is more common to occur with systems with high concentration of
hydrophilic excipients. Using LFCS combined with appropriate in vitro tests such as
bile salt mixed micelle solubility testing, formulation dispersion/drug precipitation
investigations and in vitro digestion tests could be used to predict the likelihood of
drug precipitation and to optimize the choice of lipid formulation for a particular drug
[6, 47-51].
Table 1.1 Lipid formulation classification system (LFCS) showing typical composition of various types of lipid formulations according to Pouton [6]
Content of formulation (%, w/w) Excipients in the formulation
Type I Type II Type IIIA Type IIIB Type IV
Oils: triglycerides or mixed mono and diglycerides 100 40- 80 40- 80 <20 ▬
Water-insoluble surfactant (HLB<12) ▬ 20- 60 ▬ ▬ 0- 20
Water-soluble surfactant (HLB>12) ▬ ▬ 20- 40 20- 50 30- 80
Hydrophilic cosolvents (e.g. PEG, Propylene glycol, transcutol) ▬ ▬ 0- 40 20- 50 0- 50

Chapter 1 Introduction
5
Table 2.1 Characteristic features, advantages and disadvantages of the various types of lipid formulations according to Pouton [6] LFCS Characteristics Advantages Disadvantages
Type I Non-dispersing; requires digestion GRAS status; simple; excellent capsule Formulation has poor solvent capacity compatibility unless drug is highly lipophilic
Type II SEDDS without water-soluble Unlikely to lose solvent capacity on Turbid o/w dispersion (particle size
components dispersion 0.25-2 µm)
Type IIIA SEDDS/SMEDDS with water-soluble Clear or almost clear dispersion; drug Possible loss of solvent capacity on
components absorption without digestion dispersion; less easily digested
Type IIIB SMEDDS with water-soluble Clear dispersion; drug absorption Likely loss of solvent capacity on
components and low oil content without digestion dispersion
Type IV Oil-free formulation based on Good solvent capacity for many drugs; Loss of solvent capacity on dilution:
surfactants and cosolvents disperses to micellar solution may not be digestible

Chapter 1 Introduction
6
1.2 Self-emulsifying drug delivery systems
1.2.1 General
Self-emulsifying drug delivery systems (SEDDS) are considered one of the
promising approaches for tackling formulation problems associated with drugs with
poor aqueous solubility. SEDDS is an oral lipid dosage form composed of a mixture
of natural or synthetic oils, solid or liquid surfactants, or alternatively, one or more
hydrophilic solvents and cosolvents/surfactants [52-55]. These formulations disperse
freely when they come to contact with gastric fluids and form an oil-in-water emulsion
or microemulsion utilizing mild agitation conditions provided by gastric motility. In
such system, the lipophilic drug is presented in solution, in small droplets of oil,
leading to the elimination of the dissolution step which can be the rate limiting step in
the absorption of poorly soluble drugs and therefore improving the rate and extent of
drug absorption and the reproducibility of the plasma profile [56]. Fine oil droplets are
expected to be rapidly emptied from the stomach and promote a better distribution of
the drug throughout the GIT. This can minimize irritation caused by extended contact
between drug substance and the gut wall. Compared to conventional oily solutions,
SEDDS provide a large interfacial area which enhances drug absorption through
increasing the rate of diffusion from oil to the aqueous media of the GIT [53]. The
extent of drug absorption from lipid vehicles is significantly affected by the
dispersability of the administered lipid. Additionally, because of the inherent physical
instability, the large volume of the two phase emulsion and the poor precision of the
dose the use of conventional emulsions are problematic. The use of either
microemulsions or SEDDS helps overcoming these restrictive problems. Other
advantages offered by SEEDS include ease of formulation, enhanced solvent
capacity and high stability [57].
1.2.2 Formulation of SEDDS
Self-emulsification has been shown to be specific to the nature of the
oil/surfactant pair, the surfactant concentration, oil to surfactant ratio, and to
temperature at which self-emulsification takes place [52, 58]. In light of these
informations, it has also been demonstrated that only very specific combinations of

Chapter 1 Introduction
7
pharmaceutical excipients could result in efficient self-emulsifying systems [52, 59,
60]. A large variety of liquid or waxy excipients, ranging from oils through biological
lipids, hydrophilic and hydrophobic surfactants, to water soluble cosolvents, are
available for SEDDS formulation. The earliest reports of Self-emulsifying systems
using pharmaceutical materials were of pastes, utilizing waxy alcohol ethoxylates
[61]. The selection of appropriate excipients for SEDDS formulation should take in
consideration their acceptability due to potential toxicity [62, 63]. As a general rule it
is reasonable to use the simplest most effective mixtures, limiting the number of
excipients used to a minimum [64]. Table 3.1 summarizes the most commonly used
excipients used to formulate SEDDS. Generally, the following classes of excipients
are currently employed in the formulation of SEDDS.
1.2.2.1 Oils Oil is one of the most important component in the formulation of SEDDS because
of its ability to solubilize marked amounts of lipophilic drugs, to facilitate self-
emulsification as well as increasing the fraction of lipophilic drug transported via the
intestinal lymphatic system and consequently increasing drug absorption from the
GIT which depends on the molecular nature of the triglyceride oil [65-69]. Both long
and medium chain triglycerides with different degrees of saturation have been used
for the design of self-emulsifying formulations. Medium chain glycerides derived from
coconut oil present a more attractive choice than other glycerides in formulating
SEDDS since, a) they are more stable against oxidation, b) Self-microemulsifying
drug delivery systems incorporating these glycerides can be formulated at ambient
temperature over a wide range of compositions, and c) they are reported to improve
the intestinal absorption of co-administered drugs [63, 70-76]. Edible oils could
represent a logical choice for the development of SEDDS but their use could be
limited due to the poor ability to dissolve large amounts of many lipophilic drugs.
Therefore, edible oils are mixed with more polar lipids such as partial glycerides and
PEGylated lipids to improve its solvent properties. Alternatively, modified or
hydrolyzed vegetable oils have been used since they have better emulsification and
drug solubilization properties [59, 60, 77]. Recently polyglycolyzed glycerides with
varying fatty acid and polyethylene glycol (PEG) chain lengths have shown their
ability to promote self-emulsification of oil in water and efficiently improve the oral
absorption and hence the bioavailability of lipophilic drug [54, 78]. These products
are derived from the reaction between selected, high purity food grade vegetable oils
Chapter 1 Introduction
8
and pharmaceutical grade PEG and therefore expected to be well tolerated by the
body [77].
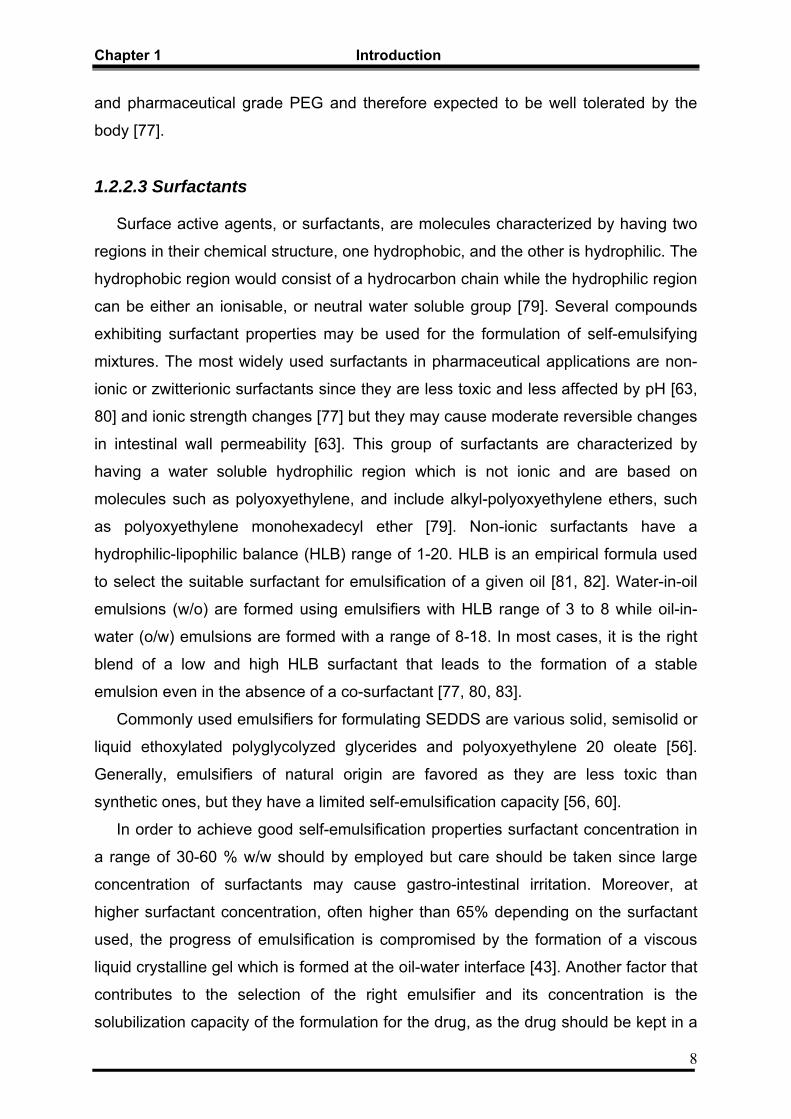
1.2.2.3 Surfactants
Surface active agents, or surfactants, are molecules characterized by having two
regions in their chemical structure, one hydrophobic, and the other is hydrophilic. The
hydrophobic region would consist of a hydrocarbon chain while the hydrophilic region
can be either an ionisable, or neutral water soluble group [79]. Several compounds
exhibiting surfactant properties may be used for the formulation of self-emulsifying
mixtures. The most widely used surfactants in pharmaceutical applications are non-
ionic or zwitterionic surfactants since they are less toxic and less affected by pH [63,
80] and ionic strength changes [77] but they may cause moderate reversible changes
in intestinal wall permeability [63]. This group of surfactants are characterized by
having a water soluble hydrophilic region which is not ionic and are based on
molecules such as polyoxyethylene, and include alkyl-polyoxyethylene ethers, such
as polyoxyethylene monohexadecyl ether [79]. Non-ionic surfactants have a
hydrophilic-lipophilic balance (HLB) range of 1-20. HLB is an empirical formula used
to select the suitable surfactant for emulsification of a given oil [81, 82]. Water-in-oil
emulsions (w/o) are formed using emulsifiers with HLB range of 3 to 8 while oil-in-
water (o/w) emulsions are formed with a range of 8-18. In most cases, it is the right
blend of a low and high HLB surfactant that leads to the formation of a stable
emulsion even in the absence of a co-surfactant [77, 80, 83].
Commonly used emulsifiers for formulating SEDDS are various solid, semisolid or
liquid ethoxylated polyglycolyzed glycerides and polyoxyethylene 20 oleate [56].
Generally, emulsifiers of natural origin are favored as they are less toxic than
synthetic ones, but they have a limited self-emulsification capacity [56, 60].
In order to achieve good self-emulsification properties surfactant concentration in
a range of 30-60 % w/w should by employed but care should be taken since large
concentration of surfactants may cause gastro-intestinal irritation. Moreover, at
higher surfactant concentration, often higher than 65% depending on the surfactant
used, the progress of emulsification is compromised by the formation of a viscous
liquid crystalline gel which is formed at the oil-water interface [43]. Another factor that
contributes to the selection of the right emulsifier and its concentration is the
solubilization capacity of the formulation for the drug, as the drug should be kept in a

Chapter 1 Introduction
9
solubilized form for a long time at the absorption site and precipitation of the drug
compound should be prevented [84]. Formulations with higher surfactant and
hydrophilic cosolvent to oil ratios can be referred to as self-microemulsifying drug
delivery systems (SMEDDS) as they disperse upon gentle agitation condition to form
an optically clear microemulsion [43]. This approach was used for the formulation of
cyclosporin A as Neoral ® [85-88].
It was shown in several research articles that there is a strong relation between
surfactant concentration and the droplet diameter of the diluted self-emulsifying
mixtures. This effect could be attributable to the localization of the surfactant
molecules at the oil-water interface leading to the dispersion and solubilization of the
oil droplets [89]. Conversely, the mean droplet diameter may also increase with
increasing surfactant concentration [90]. This phenomenon could be caused by the
interfacial disruption elicited by enhanced water penetration into the oil droplets
mediated by the increased surfactant concentration and leading to ejection of oil
droplets into the aqueous phase [56].
1.2.2.4 Co-solvents
The incorporation of a hydrophilic cosolvent in the formulation of SEDDS enables
the dissolution of large quantities of the hydrophilic surfactant in the lipid base [56].
Additionally, the motivation for using water-soluble cosolvents may also be to
increase the solvent capacity of the formulation for drugs with intermediate log P
(2<log P<4) [43]. Systems utilizing a water soluble cosolvent in addition to the
hydrophilic surfactant (HLB>11) are classified as type III in the LFCS (see table 1.1).
For these mixtures the water soluble components will tend to part from the oil during
emulsification, and become dissolved in the aqueous phase. As a result of this phase
separation, which may be in fact the driving force for emulsification by diffusion and
stranding, is loss of solvent capacity with a possibility of partial precipitation of the
drug [43].
Organic solvents such as ethanol, propylene glycol (PG), and polyethylene glycol
(PEG), suitable for oral delivery, are examples of commonly used cosolvents. A
limitation of the use of volatile cosolvents is the possible interaction with the shell of
soft or hard gelatine capsules and evaporation from the matrix of the self-emulsifying
mixture which could result in precipitation of the drug. Therefore, alcohol free

Chapter 1 Introduction
10
formulations have been designed but their lipophilic drug dissolution ability may be
limited [56].
Table 3.1 Commonly used excipients to formulate SEDDS
Excipient HLB Chemical definition
Arlacel® 80 4.3 Sorbitan oleate
Arlacel® 186 2.8 Monoolein: Propylene glycol (90:10)
Capmul® MCM 5.5–6 C8/C10 mono-/diglycerides from coconut oil
Captex® 200 oil C8/C10 diesters of propylene glycol from coconut oil
Captex® 355 oil C8/C10 triglycerides from coconut oil
Centrophase® 31 4 Liquid lecithin
Cremophor® EL 13.5 Polyoxyethylene glycerol triricinoleate 35 DAC
Labrafac® CM 10 10 C8/C10 polyglycolyzed glycerides from coconut oil
Labrafil® M 1944 CSD 3–4 Primarily oleic acid (C18:1) polyglycolyzed glycerides from
apricot kernel oil
Labrafil® M 2125 CS 3–4 Primarily linoleic acid (C18:2) polyglycolyzed glycerides from
corn oil
Labrasol® 14 C8/C10 polyglycolyzed glycerides from coconut oil
Miglyol® 812 oil C8/C10 triglycerides from coconut oil
Myvacet® oil Distilled acetylated monoglycerides
Myverol® 18-92 3.7 Distilled sunflower oil monoglycerides (90 % glyceryl linoleate)
Soybean oil oil Primarily oleic (25%) and linoleic (54%) triglycerides
Tagat® TO 11.3 Polyoxyethylene (25) glycerol trioleate
Tween® 80 15 Polyoxyethylene (20) sorbitan oleate
Solutol® HS15 14-16 Polyoxyethylene esters of 12-hydroxystearic acid

Chapter 1 Introduction
11
1.2.2.5 Other excipients The addition of a polymeric precipitation inhibitor may stabilize a temporarily
supersaturated state of the drug after dispersion of SEDDS in the GIT. Such an
approach has led to the development of supersaturable SEDDS (S-SEDDS) which
incorporate Hydroxypropyl methyl cellulose (HPMC) as a precipitation inhibitor. The
addition of HPMC permits also to lower surfactant concentration in an attempt to
reduce surfactant side-effects [91, 92]. The S-SEDDS formulation, with a HPMC load
of 5%, led to a marked improvement in paclitaxel bioavailability. Furthermore, the
incorporation of CsA as an inhibitor of P-gp and CYP 3A4 enzyme into the S-SEDDS
further enhances the systemic exposure of paclitaxel [92].
The charge of the oil droplet in conventional SEDDS is negative due to the
existence of free fatty acids [56]. The incorporation of a cationic lipid such as
oleylamine at a concentration range of 1.0-3%, will result in SEDDS with a positive ζ-
potential with a value of about 34-45 mV [93-95]. Positively charged emulsion
droplets interact with the negative charge surface component of the gastro intestinal
lumen [94]. It was found in a bioavailability study performed on perfused rats that
administration of CsA in a positively charged SEDDS led to higher plasma levels
compared to the corresponding negatively charged formulation [66]. Additionally,
comparative oral bioavailability studies in young female rats using several different
liquid dosage forms of progesterone indicated that only the positively charged
SEDDS could be considered a potential effective dosage form for oral administration
of progesterone since it elicited the highest and most satisfactory absorption profile
[93].
Excipients such as antioxidants may be necessarily incorporated in SEEDS
formulation when the oil phase is susceptible to oxidation. Antioxidants as
tocopherol, ascorbyl palmitate, butylated hydroxytoluene (BHT), butylated
hydroxyanisole (BHA) and propyl gallate may be used [96].

Chapter 1 Introduction
12
1.2.3 Mechanism of self-emulsification The mechanism by which self-emulsification take place is not yet well understood.
It has been suggested that the process of self-emulsification occurs when the entropy
change that favours dispersion is greater than the energy required to increase the
surface area of the dispersion [97]. Moreover, the free energy of a conventional
emulsion formation is a direct function of the energy required to create a new surface
between oil and water phases and can be described by equation 1 [97].
22G N rπ σΔ =∑ (1)
Where ΔG is the free energy associated with the process of emulsification, N is the
number of droplets of radius r, and σ represents the interfacial energy. The two
phases of the emulsion tend to separate by time in order to reduce the interfacial
tension and consequently the free energy of the system. Therefore, surfactants are
used in oil-water systems to decrease the interfacial energy between the two liquids
and thus promote the ease of dispersion. Surfactants were found to form a
monolayer around the emulsion droplet and hence reducing the interfacial energy as
well as providing a barrier to coalescence. Further strengthening of the interface
could be achieved by improving the viscous or elastic properties, or by providing
steric or electrostatic stabilization [98].
In the case of self-emulsifying mixtures, spontaneous emulsification takes place
because the free energy required to form the emulsion is either very low and positive
or negative [77]. In order for emulsification to occur, it is necessary for the interfacial
structure to have no resistance against surface shearing [99].
It has been suggested that the ease of emulsification is associated with the ease
of water penetration into various liquid crystalline (LC) or gel phases formed on the
surface of the oil droplet [100-102]. The interface between the oil and the aqueous
continuous phase is formed upon addition of a binary mixture, usually composed of
oil and a non-ionic surfactant, to water. This is followed by the solubilization of water
within the oil phase, subsequent to gentle agitation of SEDDS, as a result of aqueous
penetration through the interface which will continue until the solubilization limit, close
to the interface, is reached. Further penetration will result in the formation of a
dispersed LC phase. The actual amount of the formed LC phase depends on the
surfactant concentration in the binary mixture. As a consequence for the LC phase

Chapter 1 Introduction
13
formation around the oil droplets, SEDDS become more stable to coalescence.
Wakerly et al. have extensively studied the involvement of LC phases in the
spontaneous emulsification process of SEDDS [52, 90]. Additionally, Craig et al.
used the combination of particle size analysis and low frequency dielectric
spectroscopy to evaluate self-emulsification properties of a series of SEDDS
comprising Imwitor 742 and Tween 80 [55, 103]. This study showed evidence of the
formation of liquid crystalline phases at concentrations corresponding to those shown
to be efficient self-emulsifying systems and it was therefore suggested that self-
emulsification may be associated with liquid crystal formation, although the relation
was clearly complex. Moreover, it was also shown that the incorporation of a drug
may change emulsion characteristics, possibly by interacting with the LC phase.
1.2.4 Improvement of drug absorption by SEDDS
Drug release from SEDDS occurs upon partitioning into the aqueous environment
within the intestinal lumen after dispersion and emulsification. Many reports have
outlined the improvement of bioavailability associated with lipophilic drug
administration as an o/w emulsion [104-111]. On the other hand, because of the
inherent physical instability the large volume of the two phase emulsion, and the poor
precision of the dose, the use of conventional emulsions is problematic. Hence,
SEDDS may be a promising approach to avoid such restrictive problems associated
with the use of conventional emulsions.
Cyclosporin A (CsA) is a famous example of poorly soluble drugs which was
successfully formulated and marketed as a SMEDDS [88]. The first marketed product
for cyclosporin was Sandimmune® formulated in an olive oil based solution that also
contains ethanol and Labrafil® M 1944 CS (see table 3.1) and a second soft gelatine
formulation that contains corn oil, gelatine, dehydrated ethanol and Labrafil® M 2125
Cs (see table 3.1). However, the rate of the drug absorption from these formulations
varies widely with oral bioavailability being in the range of 7-90 % and tmax between
1.5 to 22 hours [112]. Therefore, there has been a need for the development of more
effective formulation for cyclosporin with more consistent absorption characteristics.
A new formulation of cyclosporin has been introduced into the market with the name
Sandimmune Neoral® [85]. Due to differences in composition in the oil and the
surfactant between Sandimmune® and the new Sandimmune Neoral®, the later

Chapter 1 Introduction
14
formulation disperses to form an o/w microemulsion where the former formulation
disperses into a crude emulsion [77]. Clinical, comparative bioavailability, and
pharmacokinetic studies have shown that the latter formulation of cyclosporin offers
substantial advantages over the older one with respect to the consistency and extent
of absorption with a consequent improvement in the oral bioavailability which was
shown to be less affected by the presence of food [85]. Moreover, it was also found
that a large amount of dissolved CsA from Sandimmune was in the undigested lipid
phase while a mixed micellar phase was formed as a result of the in vitro digestion of
the oily solution following the administration of Sandimmune Neoral [113].
Surfactants exhibit a major role in absorption enhancement associated with
SEDDS. They partition into the cell membrane and disrupt the structural organization
of the lipid bilayer leading to permeation enhancement [63]. Additionally, it has been
shown that due to micellar solubilization of lipophilic drugs in surfactants the amount
of free drug and the extent of absorption was largely affected [114, 115]. On the other
hand, in vitro permeability studies demonstrated a significant decrease in
permeability of CsA in Caco-2 cells associated with the presence of surfactants such
as Cremophor EL (table 3.1) at concentrations above 0.02% w/v via micellar
solubilization which outweighed the increase in permeability mediated by P-
glycoprotein (P-gp) efflux inhibition [115].
Lipid content in the formulation exerts a major impact on the oral bioavailability of
poorly soluble drugs. Many mechanisms have been suggested to explain such effect
including increased dissolution rate and solubility of the drug in the intestinal fluids,
protection of the drug molecule inside oil droplets from chemical as well as enzymatic
degradation, and the formation of lipoproteins promoting the lymphatic transport of
highly lipophilic drugs [67, 110, 116-118]. After absorption into the enterocytes, lipid
digestion products either enter the portal vein through direct diffusion across the cell
,leading to access to the systemic circulation through the liver, or are trafficked
intracellularly to the endoplasmic reticulum (ER) system where they are re-esterified
to triglycerides and then incorporated into chylomicrons (the main lipoprotein
secreted by the enterocytes, [119]). Chylomicrons fuse with basolateral cell
membrane of the enterocytes before release into the interstitial space and as a result
of the impermeability of the vascular endothelium to large colloidal particles and the
large inter-endothelial gaps present in the lymphatic endothelium, preferential
direction of chylomicrons and other lipoproteins toward selective uptake by the

Chapter 1 Introduction
15
intestinal lymphatic system, rather than the blood capillaries, takes place [45].
Generally, short and medium chain fatty acids are transported to the systemic
circulation through the portal blood and are not incorporated to a great extent in
chylomicrons [120]. Conversely, long chain fatty acids and monoglycerides are re-
esterified to triglycerides in the intestinal wall, incorporated into chylomicrons and
secreted into the lymph vessels by exocytosis [121]. Therefore, improvement of the
oral bioavailability of highly lipophilic drugs could be achieved through the
manipulation of the absorption profile of the co-administered drug in a SEDDS
formulation by changing the medium and the long chain triglycerides content in the
formulation.
Generally, possible mechanisms for improving drug absorption from SEDDS
include:
1- Increase in membrane fluidity facilitating transcellular absorption.
2- Larger surface area provided by the fine emulsion droplets and
subsequent lipolysis and enhancement of drug solubilization through
changing composition and character of the colloidal environment
formed (for example, vesicles and mixed micelles).
3- Opening of the tight cellular junction to allow paracellular transport
which is mainly relevant for ionized drugs or hydrophilic macro-
molecules.
4- Inhibition of P-gp drug efflux (Increased intestinal expression of P-
glycoprotein can reduce the absorption of drugs that are substrates for
P-glycoprotein. Thus, there is a reduced bioavailability, therapeutic
plasma concentrations are not attained) with subsequent enhancement
of drug uptake from GIT [118, 122-124].
5- Stimulation of lipoproteins (mainly chylomicrons) formation which
promotes the lymphatic transport of highly lipophilic drugs and offers
many potential advantages including avoidance of first pass effect,
specific targeting of drugs to the lymphatic system, and providing a
controlled rate for entrance of drugs to the systemic circulation [96].

Chapter 1 Introduction
16
1.3 Lipid digestion and its effect on drug solubilization Oral administration of lipids stimulates the secretion of gastric lipase from the chief
cells lining the gastric mucosa [125-127], with subsequent secretion of pancreatic
lipase and co-lipase from the pancreas [128]. Lipid digestion is initiated in the
stomach by the action of gastric lipase on triglycerides (many other non-ionic esters,
such as mixed glycerides and surfactants present also possible substrates for lipase)
which leads to partial digestion into di-glycerides and fatty acids [129-131]. Although
gastric lipolysis is known to be a minor contributor to the overall lipolysis process,
some studies have suggested that it is responsible for about 25% of acyl chain
hydrolysis [132, 133]. Lipids are crudely emulsified in the stomach and subsequently
transferred to the small intestine where pancreatic lipase-colipase exerts its action on
the interface (this enzyme attains its full catalytic activity in the presence of o/w
emulsions because it is activated by the interfacial binding [134]) and catalyses the
hydrolysis of tri- and di-glycerides in the lumen of the small intestine [135, 136]. This
results in the formation of 2-monoglycerides and fatty acids as the major products of
lipid lipolysis. Although 2-monoglycerides may undergo slow and non-enzymatic
isomerization at alkaline pHs to yield 1-monoglycerides, which are then available for
hydrolysis by pancreatic lipase, this process is generally believed to be limited in vivo
[137]. The presence of lipids and lipolysis products stimulates the secretion of bile
(composed mainly of water, bile salts, cholesterol, phospholipids, bicarbonate and
bile pigments [138]) into the small intestine from the gall bladder. The components of
bile constitute a vehicle for solubilization of poorly soluble fatty acids, monoglycerides
and di-glycerides products of the lipid lipolysis process. These substances are
incorporated into various colloidal phases formed in the intestinal lumen such as
mixed micelles and vesicles (Figure 1.1).
The colloidal structures formed during in vivo lipid digestion provide a good
vehicle within which lipophilic drugs may reside during gastro intestinal transit and
therefore preventing precipitation and enhancing drug absorption [139]. The intestinal
phase behavior of formulation-derived lipids and their digestion products are
expected to play a significant role in the solubilization of administered drugs [140,
141]. Greater understanding of the interaction between the administered drug and
the digestible oily vehicles during pre-absorptive intraluminal processing may lead to
a more guided selection of the ideal lipids for incorporation into a lipid-based
formulation [142].

Chapter 1 Introduction
17
Figure 1.1 Schematic presentation of the lipid digestion process in the GIT.

Chapter 1 Introduction
18
1.4 Pellets Pellets are spherical, free-flowing multi-particulate drug delivery system which
range in size between 0.5-1.5 mm depending on the processing technologies
employed [143]. Applications of pellets are not only found in pharmaceutical industry
but also in agriculture and in polymer industry. Pellets are of great interest to the
pharmaceutical industry as they have many therapeutic as well as technological
advantages over conventional solid dosage forms. Advantages of using pellets
include:
1) Flexibility in designing and developing the dosage form, as they could be filled
into hard gelatine capsules, compressed into tablets and/or coated with
varying materials and polymers to achieve certain release profile. Moreover,
pellets composed of different drug entities and chemically incompatible
bioactive agents can be formulated in a single dosage form [143, 144].
2) Pellets disperse freely in the gastro-intestinal tract and therefore drug
absorption is maximized with a subsequent reduction in peak plasma
fluctuations and minimization of potential side effects without lowering drug
bioavailability [145].
3) Reduction in the variation in gastric emptying rates and overall transit time and
consequently reducing intra- and inter-subject variability of plasma profile
associated usually with single unit dosage forms and leads to deleterious
effects on the reproducibility of the therapeutic effect of drugs [146, 147].
4) Decreasing the problem of high local concentration of drugs and thus avoiding
irritation that may be caused by certain active constituents.
5) Pellets are less susceptible to dose dumping, when formulated as modified
release dosage forms, than the reservoir type single unit formulations [143].
6) Good flow properties, narrow particle size distribution, less friable dosage form
and uniform packaging are also among the advantages of using pellets [148,
149].
7) Low surface area to volume ratio and therefore pellets provide an ideal shape
for the application of film coatings [143].
8) Pellets can also be made attractive through various shades and colors that
can be easily imparted to them during the manufacturing process [143].

Chapter 1 Introduction
19
1.4.1 Extrusion/Spheronization
The most commonly used techniques for pellets production in the pharmaceutical
industry are extrusion/spheronization (ES), solution/suspension layering, and powder
layering [143]. Extrusion is the process of applying a pressure to a semisolid mass
and forcing it against an orifice or a die to form an extrudate of defined geometry
[150]. Extruders used in pharmaceutical industry are classified into: screw, sieve and
basket, roll, and ram extruders. Screw extruders are the only continuous extrusion
equipment as it can afford a continuous and smooth exit of the extruded mass
through the uniform openings (Figure 2.1) [151].
Figure 2.1 Photograph of the twin screw radial discharge extruder.

Chapter 1 Introduction
20
Spheronization describes the process of gradually transforming cylindrically
shaped extrudates into spherically shaped pellets by contact with a rotating disk
(frictional plate), by collision between particles, and by collision with the wall [152]. A
spheronizer is a device consisting of a vertical hollow cylinder equipped with a
horizontal rotating frictional plate (Figure 3.1). The process of spheronization was
originally invented in 1966 by Nakahara, who described a method and apparatus for
making spherical granules that involves extrusion of a wetted mass to provide
cylindrical segments (extrudates) followed by spheronization of the extrudate in the
Marumerizer [153]. The process was widely overlooked in the pharmaceutical
industry until the early 1970s when several research articles have described the
steps and equipments involved in the process and its direct application in
pharmaceutical industry [149, 154-157]. Since then, the process of ES has become
the method of choice in the preparation of pellet-based dosage forms and become a
subject of intensive research.
Figure 3.1 Schematic presentation of the frictional plate used in the radial plate spheronizer showing (a) typical grid pattern (the cross hatched design), and (b) details of grid pattern and a cut away view of the plate with the dimensions of plate design.

Chapter 1 Introduction
21
Advantages of using ES include:
• Ease of operation.
• High throughput with low wastage.
• Narrow particle-size distribution.
• Production of pellets with low friability.
• Production of pellets that are suited for film coating.
• Ease of coating.
• Good flow.
• Low dusting.
The process of ES is a multi-step process that involves the following steps:
1) Granulation through mixing of the dry ingredients with the granulation liquid.
2) Extrusion of the wet mass into cylindrical extrudates.
3) Spheronization of the extrudates into spherical pellets.
4) Drying of the produced pellets.
According to the shape of particles, different stages can be distinguished in the
spheonization process. The edges of the extrudates cylinders are transformed into a
more rounded form then to dumb-bells and elliptical particles and eventually to
perfect spheres [152]. Baret and Remon suggested the possible coexistence of
another pellets forming mechanism [158]. In this mechanism the rounded edge
cylinder is subjected to twisting until it breaks into two distinct parts with both parts
having a round and a flat side. Due to the rotational and the frictional forces the
edges of the flat side collapse together like a flower forming the cavity observed in
certain pellets. Figure 4.1 illustrates both pellet-forming mechanisms. Different
process variables and parameters that can affect quality of extrudates and pellets
and consequently the release properties of drugs from pellets have been discussed
intensively in several research articles [159-163].
The most commonly used excipients in pellet formulations include binders, fillers,
lubricants, disintegrants, separating agents, spheronization enhancers, glidants and
release modifiers [164]. Microcrystalline Cellulose (MCC) is a spheronization
enhancer that has been used extensively for pellets production since it provides a
balance between rigidity, as it has binding properties, and plasticity which is
necessary for a successful production of spherical pellets by ES technique.

Chapter 1 Introduction
22
Figure 4.1 Pellets formation mechanism according to a) Rowe [152]- I. Cylinder, II. Cylinder with rounded edges, III. Dumb-bell; IV, Ellipse, V Sphere. (b) Baert et al [158]- I. Cylinder, II. Rope, III. Dumb-bell, IV. Sphere with a cavity outside, V. Sphere. (from reference [165]).
MCC is manufactured by mineral chemical acid hydrolysis of alpha cellulose
(which acts on the amorphous regions of cellulose increasing the percent of
crystalline bundles) and subsequent spray drying [166]. The first model to elucidate
the possible role of MCC in ES process was introduced by Fielden et al [167]. The
model described MCC as a sponge with a high ability to hold water. During extrusion,
the sponges are compressed until water is squeezed out and lubricate the particles
flowing through the extruder. After extrusion, the volume of the sponges will increase
and the extrudate will be apparently dry and brittle, allowing it to be chopped into
short lengths during spheronization. The crystallite-gel-model was introduced by
Kleinebudde as an alternative model to elucidate the unique role of MCC in the
process of ES [168]. This model proposed that MCC are broken to smaller particles
and possibly to single crystallites during granulation and extrusion process in the
presence of a liquid. The small particles produced are capable of forming a
crystallite-gel and immobilize the liquid.

Chapter 1 Introduction
23
1.5 Electron spin resonance (ESR) spectroscopy
Electron spin resonance (ESR) spectroscopy (also known as electron
paramagnetic resonance (EPR) spectroscopy) is a magnetic resonance method
principally related to the more popular nuclear magnetic resonance (NMR)
spectroscopy. ESR is used to detect and characterize paramagnetic materials such
as free radicals and transition metals such as copper and manganese. Since the
majority of drug delivery samples are diamagnetic and ESR silent, the incorporation
of a paramagnetic molecule or group as spin probes is therefore necessary. The
most widely used spin probes are stable nitroxide radicals. A very broad variety of
low and high molecular weight nitroxides with different physicochemical properties
are available. Alternatively, covalent coupling of paramagnetic species to the
molecules of interest, a technique called spin labeling, has expanded the application
of ESR spectroscopy [169]. Furthermore, Gamma irradiation of crystalline drugs or
crystalline polymers might lead to the formation of stable radicals which can be used
as endogenous paramagnetic species [170].
ESR is considered a powerful spectroscopic technique for in vitro and in vivo non-
invasive monitoring of drug delivery systems [171-174]. The following section will
explain the basics and applications of this technique.
1.5.1 Basics 1.5.1.1 General Generally, atoms and molecules gain or lose energy when transferring from one
energy level to the other. Spectroscopy deals with the measurement and
interpretation of those transitions and therefore it can provide valuable information
about the structure and dynamics of the investigated samples.
In all spectroscopic methods, electromagnetic waves are used as the energy
source necessary to induce the transition from the ground to the excited level.
According to Plank’s law, the energy necessary for the transition from the lower to
the higher energy level ( EΔ ) is proportional to the frequency of the electromagnetic
waves.
E hνΔ = (2)

Chapter 1 Introduction
24
Where h is Plank’s constant and ν is the frequency.
ESR is a form of absorption spectroscopy that utilizes microwave radiation applied
at a well defined and predictable frequency, in the GHz region, to induce the
transition of electron spins from the ground to the excited level where a resonance
condition is reached.
1.5.1.2 Zeeman effect and resonance condition
A single electron, being a charged particle that rotates around its own axis,
creates a magnetic field called the spin magnetic moment which leads it to behave
like a tiny magnet with a north and south pole. In the absence of external magnetic
field, electron spins are oriented randomly and their energies do not actually differ
from each other. When the electron spins is placed in an external magnetic field, and
since the electron spin is quantized, i.e. it can take only one of two possible values,
the spin vector of the electron aligns itself either with (and thus being in the low
energy state) or against (and thus being in the high energy state) the direction of the
external field. This phenomenon is known as Zeeman effect (Figure 6.1).
Figure 6.1 A schematic diagram illustrating the Zeeman effect. Left, random orientation of the electron spins. Right, alignment of the electron spins with or against the external magnetic field B0 (modified from Ref. [169]).

Chapter 1 Introduction
25
Transition between the two energy states is induced by the absorption of a
photon. An Electron in the lower energy state absorbs a photon and ends up in the
upper energy state. The energy of this photon ( hν ) must exactly match the energy
difference between the two states ( E hνΔ = ). This is the so called resonance
condition where 180○ flipping of the electron spin takes place.
1.5.1.3 Mathematical description
The energy of a magnetic dipole in an external magnetic field is given by:
0E µB= (4)
Where µ is the magnetic dipole and 0B is the strength of the external magnetic
field. The magnetic dipole of an electron is generated by its spin S ,
µ g Sβ= (5)
Where β is the Bohr magneton (the intrinsic value of an electron’s magnetic
moment), g is the spectroscopic splitting factor, or simply the g -factor, denoting the
contribution of spin and orbital motion of the electron to its total magnetic momentum.
For nitroxides, the orbital momentum plays a minor role and g -factor value is quite
close to that of a free electron [169].
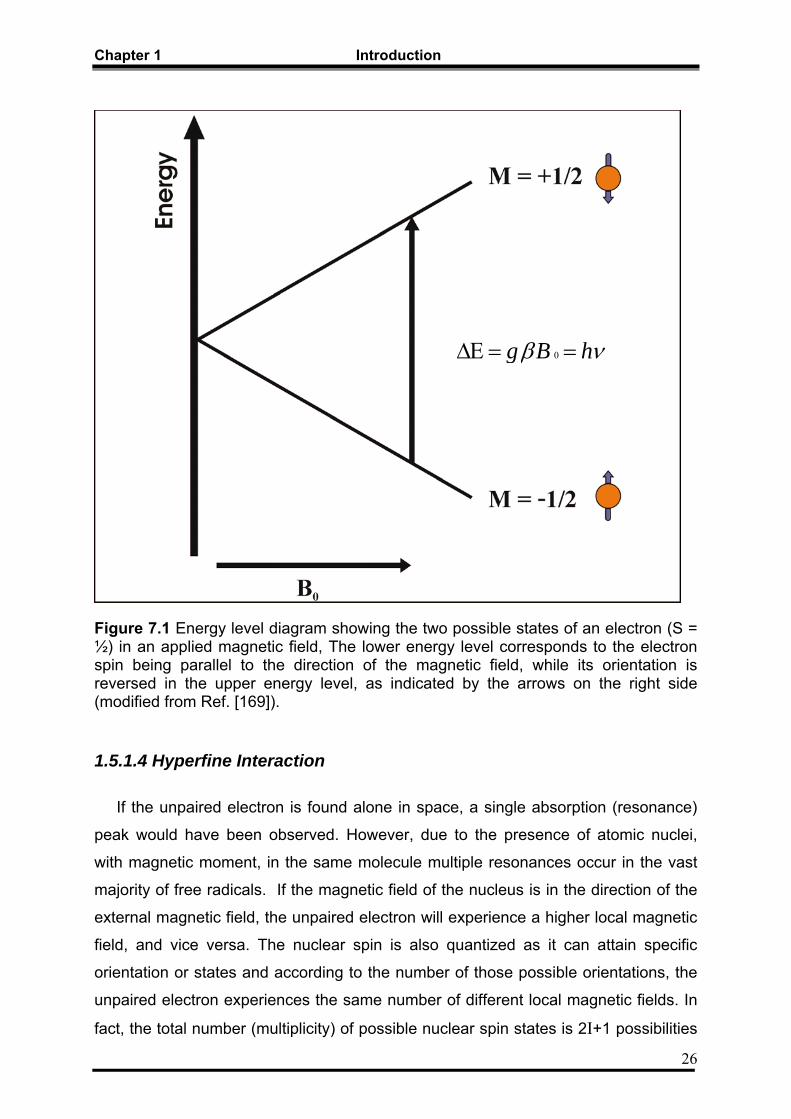
The electron spin S is quantized with a value of either +1/2 or -1/2 (Figure 7.1).
Thus after substituting the value of µ in equation 4 with that in equation 5, the
energy levels are equal to E = +1/2g βB0 and -1/2g βB0 and the difference
0E g BβΔ = (7)
And therefore
0h g Bν β= (8)
Chapter 1 Introduction
26
Figure 7.1 Energy level diagram showing the two possible states of an electron (S = ½) in an applied magnetic field, The lower energy level corresponds to the electron spin being parallel to the direction of the magnetic field, while its orientation is reversed in the upper energy level, as indicated by the arrows on the right side (modified from Ref. [169]). 1.5.1.4 Hyperfine Interaction If the unpaired electron is found alone in space, a single absorption (resonance)
peak would have been observed. However, due to the presence of atomic nuclei,
with magnetic moment, in the same molecule multiple resonances occur in the vast
majority of free radicals. If the magnetic field of the nucleus is in the direction of the
external magnetic field, the unpaired electron will experience a higher local magnetic
field, and vice versa. The nuclear spin is also quantized as it can attain specific
orientation or states and according to the number of those possible orientations, the
unpaired electron experiences the same number of different local magnetic fields. In
fact, the total number (multiplicity) of possible nuclear spin states is 2I+1 possibilities
0g B hβ νΔΕ = =

Chapter 1 Introduction
27
or states, where I is the nuclear spin quantum number [175]. Therefore, instead of
having a single absorption peak or line, 2I+1 lines are obtained.
Figure 8.1 Energy levels and transitions for a nitroxide spin probe (14N) with electron spin (S) = ½ and nuclear spin (I) = 1 (adapted from Ref. [176]).
For the nitrogen atom of the nitroxide radicals, 14N, the nuclear spin quantum
number is 1 and therefore microwave energy can be absorbed at three different
levels instead of one leading to an ESR spectrum with 3 characteristic lines (Figure
8.1). For the less abundant isotope, 15N, the nuclear spin quantum number is ½, and
so only 2 lines are seen. The interaction of the unpaired electron spins with the
magnetic nuclei is known as “hyperfine interaction” and it give rise to “hyperfine
splitting”.

Chapter 1 Introduction
28
1.5.1.5 Relaxation
Electrons in the excited state will tend to return back to the ground state, i.e. to
relax. During relaxation process energy is released either to the environment, a
process called spin-lattice relaxation T1, or by interacting with other paramagnetic
species, spin-spin relaxation T2. The resonance peak line width is inversely
proportional to the relaxation rate.
1.5.2 Instrumentation
Two main categories of ESR spectrometers are available. The first and most
commonly used is the continuous wave ESR (CW-ESR), and the second is pulsed or
time domain ESR spectrometers. In pulsed ESR experiment a short burst of
microwave radiation is applied to the sample, after which the emitted radiation is
detected forming the ESR signal. However, pulsed ESR is rather difficult to
implement, especially with biological or living samples, and instead CW-ESR is most
widely used. In CW-ESR a constant microwave radiation with a fixed frequency is
continuously used as the energy source, and the magnetic field is swept in order to
achieve resonance [177]. As an alternative technique to achieve resonance,
microwave radiation is swept at a constant magnetic field, but as this is technically
complicated the first technique is more implemented.
The sample is placed in the resonator cavity which is tuned to a chosen frequency
(Figure 9.1). Microwave radiation is applied from the microwave bridge into the
resonator. In the meantime, the magnetic field is swept continuously and magnetic
field modulation takes place to improve the sensitivity, where the amplitude of the
external field oscillates at 100 KHz as the field is swept. During magnetic field sweep
the unpaired electron spins in the sample will reach resonance condition. Under this
resonance condition the sample absorbs a quantity of energy which is detected as a
loss of energy by a phase-sensitive modulated diode and represents the ESR signal
from the sample. The spectrometer is adjusted to detect only signals where the
change of the amplitude of the microwave absorption signal has the same frequency
and is in phase with the applied change of the magnetic field. That’s why the output
of the ESR spectrometer is presented as a first derivative, i.e. the changes of the
absorption signal relative to the change of the magnetic field.
Chapter 1 Introduction
29
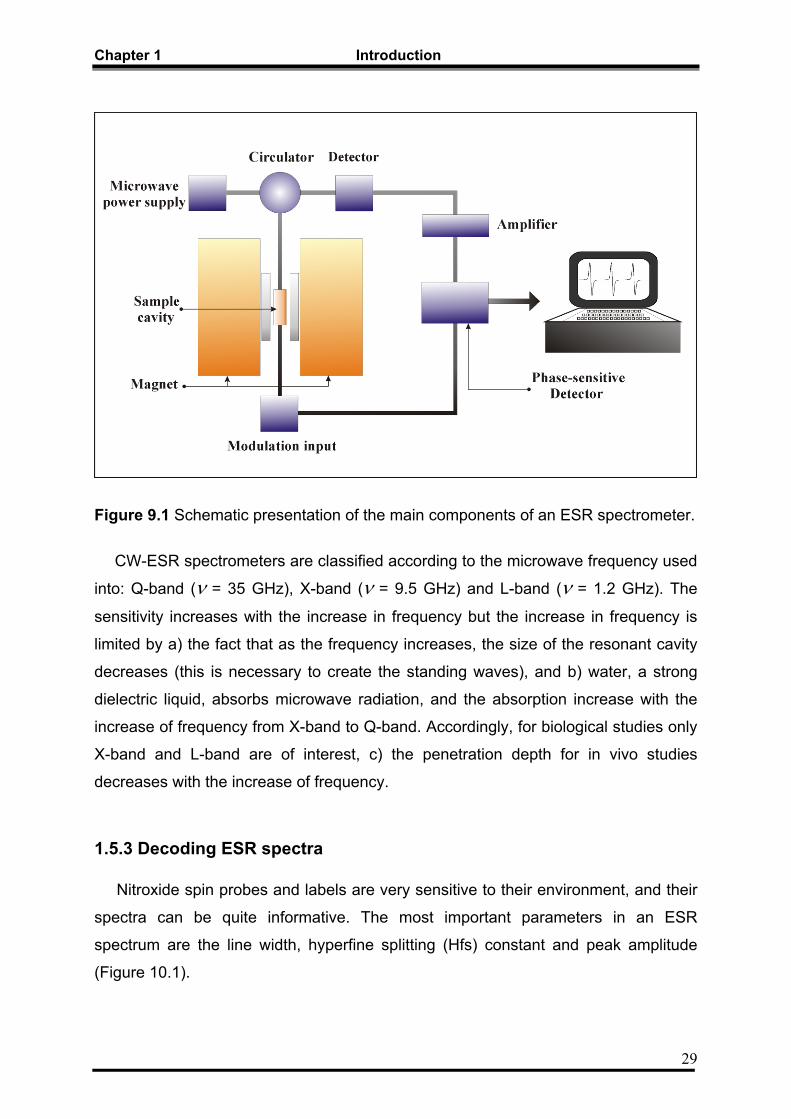
Figure 9.1 Schematic presentation of the main components of an ESR spectrometer. CW-ESR spectrometers are classified according to the microwave frequency used
into: Q-band (ν = 35 GHz), X-band (ν = 9.5 GHz) and L-band (ν = 1.2 GHz). The
sensitivity increases with the increase in frequency but the increase in frequency is
limited by a) the fact that as the frequency increases, the size of the resonant cavity
decreases (this is necessary to create the standing waves), and b) water, a strong
dielectric liquid, absorbs microwave radiation, and the absorption increase with the
increase of frequency from X-band to Q-band. Accordingly, for biological studies only
X-band and L-band are of interest, c) the penetration depth for in vivo studies
decreases with the increase of frequency.
1.5.3 Decoding ESR spectra Nitroxide spin probes and labels are very sensitive to their environment, and their
spectra can be quite informative. The most important parameters in an ESR
spectrum are the line width, hyperfine splitting (Hfs) constant and peak amplitude
(Figure 10.1).

Chapter 1 Introduction
30
Figure 10.1 A typical nitroxide spectrum showing the important spectral parameters. Bpp is the peak to peak line width, aN is the hfs constant, and A is the peak amplitude.
Incorporation of spin probes into drug delivery samples can provide a wide
scope of information of their microenvironment including, but not limited to, molecular
mobility and microviscosity, micropolarity, microacidity, and concentration of the
oxygen. The following sections will discus some of these parameters.
1.5.3.1 Mobility and microviscosity
The unpaired electron on the nitroxide spin probe is shared between the N and O
atoms. In the N atom, it occupies the Z direction of the P orbital. Accordingly, if a
single crystal of the nitroxide molecule is placed in the magnetic field, the spectrum
produced will depend on the orientation of the crystal, with the highest splitting of the
peaks when the Z orbital is parallel to the external magnetic field. This leads to the
anisotropy of the hyperfine splitting constant, i.e. it has different values in different
directions.
Chapter 1 Introduction
31
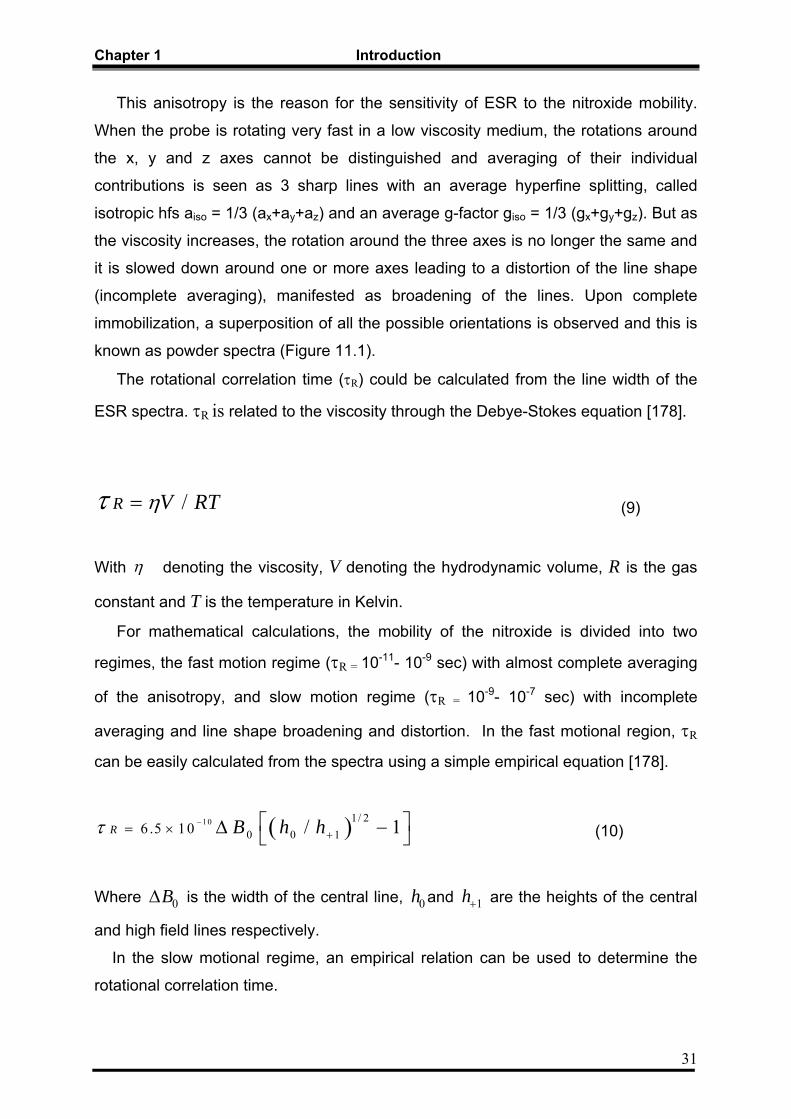
This anisotropy is the reason for the sensitivity of ESR to the nitroxide mobility.
When the probe is rotating very fast in a low viscosity medium, the rotations around
the x, y and z axes cannot be distinguished and averaging of their individual
contributions is seen as 3 sharp lines with an average hyperfine splitting, called
isotropic hfs aiso = 1/3 (ax+ay+az) and an average g-factor giso = 1/3 (gx+gy+gz). But as
the viscosity increases, the rotation around the three axes is no longer the same and
it is slowed down around one or more axes leading to a distortion of the line shape
(incomplete averaging), manifested as broadening of the lines. Upon complete
immobilization, a superposition of all the possible orientations is observed and this is
known as powder spectra (Figure 11.1).
The rotational correlation time (τR) could be calculated from the line width of the
ESR spectra. τR is related to the viscosity through the Debye-Stokes equation [178].
/R V RTητ = (9)
With η denoting the viscosity, V denoting the hydrodynamic volume, R is the gas
constant and T is the temperature in Kelvin.
For mathematical calculations, the mobility of the nitroxide is divided into two
regimes, the fast motion regime (τR = 10-11- 10-9 sec) with almost complete averaging
of the anisotropy, and slow motion regime (τR = 10-9- 10-7 sec) with incomplete
averaging and line shape broadening and distortion. In the fast motional region, τR
can be easily calculated from the spectra using a simple empirical equation [178].
( )10 1/ 20 0 16 .5 10 / 1R B h hτ −
+= × ⎡ ⎤Δ −⎣ ⎦ (10)
Where 0BΔ is the width of the central line, 0h and 1h+ are the heights of the central
and high field lines respectively.
In the slow motional regime, an empirical relation can be used to determine the
rotational correlation time.

Chapter 1 Introduction
32
/1 '[ ]bR z za A Aτ = − (11)
Where zA is the experimental hfs constant and 'zA is the hfs at complete
immobilization.
One must note that for nitroxides, the broadening of the 3 peaks is not the same.
The high field peak is the most affected followed by the low field peak and then the
central one.
Figure 11.1 ESR spectra of TEMPOL in different environments indicating the sensitivity of the line shape to the viscosity of the media (from reference [177]). 1.5.3.2 Micropolarity
In polar solvents, the oxygen atom of the nitroxide groups attracts the partially
positive parts of the solvent molecule, pushing the unpaired electron to the nitrogen
atom which is the atom that causes the hyperfine splitting (hfs). This leads to an
increase in the hfs. Therefore, hfs is a sensitive parameter to the polarity of the
environment. This property is used to monitor localization and portioning of spin
Chapter 1 Introduction
33
probes or spin labeled compounds between compartments of different polarity [179,
180].
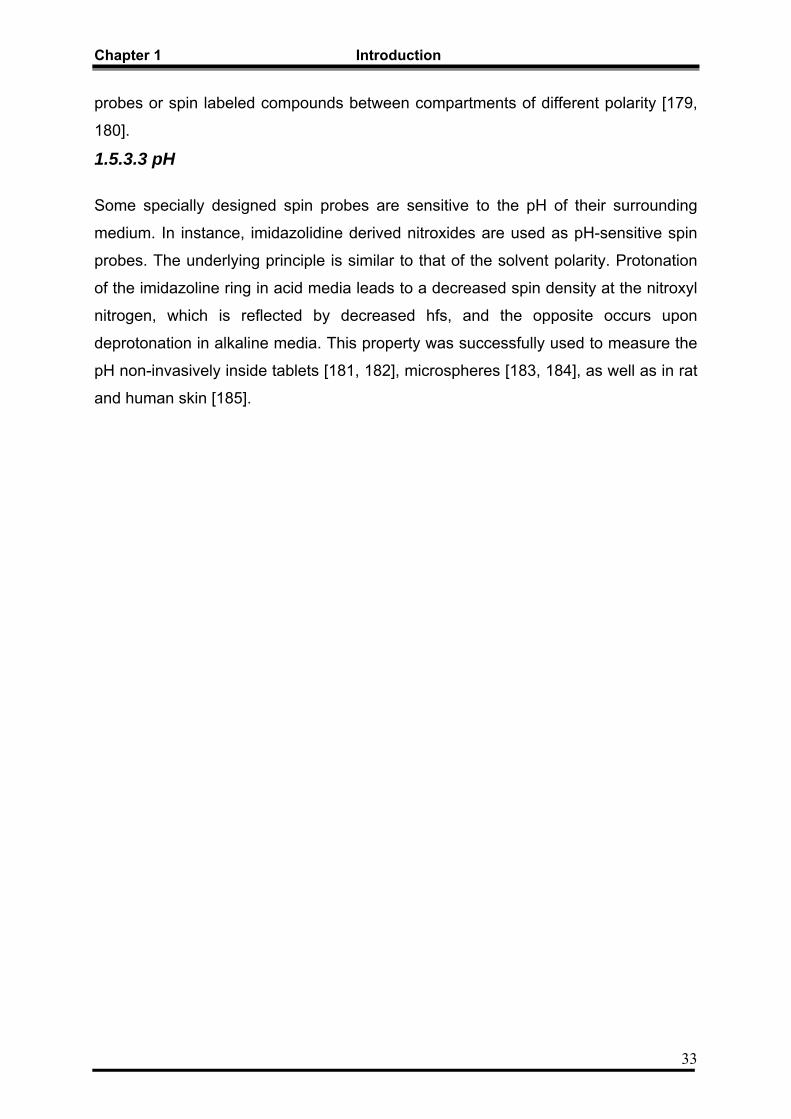
1.5.3.3 pH
Some specially designed spin probes are sensitive to the pH of their surrounding
medium. In instance, imidazolidine derived nitroxides are used as pH-sensitive spin
probes. The underlying principle is similar to that of the solvent polarity. Protonation
of the imidazoline ring in acid media leads to a decreased spin density at the nitroxyl
nitrogen, which is reflected by decreased hfs, and the opposite occurs upon
deprotonation in alkaline media. This property was successfully used to measure the
pH non-invasively inside tablets [181, 182], microspheres [183, 184], as well as in rat
and human skin [185].

Chapter 2 Formulation and characterization of self-emulsifying pellets containing Solutol® HS15 and GMS
34
2. Preparation and characterization of a self-emulsifying pellet formulation containing Solutol® and a mixture of C18 mono- and di-glycerides
2.1 Introduction SEDDS have shown a reasonable success in improving oral bioavailability of
poorly-water soluble and lipophilic drugs [186, 187]. SEDDS are composed of a
mixture of oil and a surfactant and they are capable of forming an O/W emulsion
upon gentle agitation condition provided by gastro-intestinal motion [43]. In such
system, the lipophilic drug is presented in emulsion, with small droplets of oil, leading
to the elimination of dissolution which can be the rate limiting step in absorption of
poorly-water soluble drugs. SEDDS are usually formulated in a liquid form which has
some disadvantages, especially in the manufacturing process, leading to high
production costs. Furthermore, incompatibility problems with the capsule shell are
common. The incorporation of the self-emulsifying mixture into a solid dosage form is
desirable, but challenging, because self-emulsifying properties are harder to achieve
with solid materials. However, the potential advantages of solid self-emulsifying
dosage forms have been described by several authors [188-190].
As discussed in the introduction section, pellets have many advantages over
conventional solid dosage forms, making them of great interest to pharmaceutical
industry. Flexibility in designing and developing the dosage form, and improving the
safety and efficacy of bioactive agents are among these advantages. Due to the fact
that pellets disperse freely in the gastrointestinal tract, drug absorption is maximized
with a subsequent reduction in peak plasma fluctuations and hence minimizing
potential side effects without lowering drug bioavailability. Pellets also reduce
variations in gastric emptying rates and overall transit time and therefore a reduction
of intra- and inter-subject variability of plasma profiles is achieved. In addition, pellets
reduce the problem of high local concentration of drugs and thus avoiding irritation
that may be caused by certain active constituents [143].
It is therefore very attractive to combine the advantages of self-emulsifying delivery
systems with pellets. However, the development of self-emulsifying pellets is
challenging, because high lipid loads often impair pellet formation. Using extrusion-

Chapter 2 Formulation and characterization of self-emulsifying pellets containing Solutol® HS15 and GMS
35
spheronization technique, mixtures of mono- and di-stearate, Solutol® HS15 (Figure
1.2) and MCC were investigated. Pellets were characterized for their size, shape,
friability and dissolution. In addition, nitroxide loaded pellets were produced and the
microenvironment within the pellets during the release process was monitored in an
online process by the use of electron spin resonance (ESR) spectroscopy, since ESR
is considered a powerful spectroscopic technique to monitor drug release processes
non-invasively and continuously [191].
2.2 Materials Avicel PH 101 (Microcrystalline cellulose (MCC)) was purchased from FMC
BioPolymer (PA, USA), and was used as the pellet forming material. Solutol® HS 15
(Macrogol-15-Hydroxystearate) was kindly provided by BASF AG, Ludwigshafen,
Germany. Cithrol GMS® (C18 mono-and di-glycerides) was kindly provided by Croda
GmbH, Nettetal, Germany. Tempolbenzoate (4-Benzoyloxy-2,2,6,6-tetramethyl-
piperidine-1-oxyl, TB) and Tempol (2,2,6,6-tetramethyl-4-hydroxy-piperidin-1-oxyl,
TL), were purchased from Aldrich Chem. Co., USA. Sudan ® -red 7B dye was
purchased from Riedel-de Haën AG, Germany. Diazepam was purchased from
Fagron GmbH, Barsbüttel, Germany.
Figure 1.2 Chemical structures of the main components of the lipophilic part of Solutol® HS15 which consists of polyglycol mono- and di-esters of 12-hydroxystearic acid. A small part of the 12-hydroxy group can be etherified with polyethylene glycol.

Chapter 2 Formulation and characterization of self-emulsifying pellets containing Solutol® HS15 and GMS
36
2.3 Methods
2.3.1 Preparation of pellets Details of the composition of the dry ingredients of the formulations prepared are
given in table 1.2. The reference pellets were prepared by the same method used for
the preparation of the self-emulsifying pellets.
Table 1.2 Composition of the investigated pellets (% w/w) Diazepam pellets Sudan red pellets Pellets for ESR
Ingredients Self-emulsifying
Reference
Self-emulsifying
Reference
Self-emulsifying
Reference
MCC PH 101 49.5 49.5 49,9 49,9 50 50
C18 mono- & di-glycerides 25 50 25 50 25 50
Solutol® HS15 25 - 25 - 25 -
Diazepam 0.5 0,5 - - - -
Sudan Red - - 0,1 0,1 - -
Nitroxide (TL or TB) - - - - 2 mmol/kg 2 mmol/kg
2.3.1.1 Preparation of the self-emulsifying mixture
The preparation of the self-emulsifying mixture involved the following steps:
• Melting of GMS and Solutol® HS15 at 70°C.
• Dissolving the model drug, the dye or the spin probe in the molten blend.
• Addition of water to the molten lipid blend until a creamy mass is produced.
• Cooling to room temperature.
• Addition of the dry MCC and mixing in a kneader for 15 minutes.
• Further addition of water until a mass suitable for extrusion is obtained.
2.3.1.2 Extrusion/Spheronization
The wet mass was extruded at 40 rpm in a radial screen twin-screw extruder (Fuji-
Paudal, Japan) equipped with a die of 1 mm diameter circular openings and 1mm
thickness. The extrudate was then spheronized for 5 min in a 250 mm radial plate

Chapter 2 Formulation and characterization of self-emulsifying pellets containing Solutol® HS15 and GMS
37
spheronizer (Fuji-Paudal, Japan) using a cross-hatch frictional plate of 3x3 mm2 pitch
and 1.2 mm depth (see figure 1.1 for illustration). The resulting pellets were dried in
an oven at 50 ºC until a constant weight has been reached.
2.3.2 Pellets size analysis
Size analysis was performed using a set of standard sieves (Retsch, Hann,
Germany) of a 2 progression ranging from 500 to 2800, with 100 g of pellets,
agitated on a sieve shaker (Retsch, Hann, Germany) for 20 min. The modal size
fraction and the interquartile range (IQR) were determined from the cumulative
percent undersize curve. The geometrical mean diameter (Dg) and the geometrical
standard deviation (σg) were determined from the log-normal distribution curve [192].
2.3.3 Pellets shape analysis
Shape analysis was preformed by the use of a stereomicroscope (SZX9,
Olympus, Germany), a digital camera (DIG 1300C, Micromotion, Germany)
connected to a personal computer with an Image analysis software Image C
(Imtronic, Germany). 1000 pellets were used and for each pellet, 36 Feret diameters
were measured and used to calculate the mean Feret diameter. The maximum Feret
diameter and Feret diameter 90º to the maximum Feret diameter were obtained and
the aspect ratio was calculated as the ratio between the maximum Feret diameter
and the Feret diameter 90º [193].
2.3.4 Assessment of self-emulsification
For the preliminary assessment of the self-emulsifying properties of the
formulation, 0.1 % Sudan Red was incorporated. 1g pellets were then gently agitated
in 50 ml distilled water. Agitation was provided by gentle shaking on a shaking water
bath at 50 oscillations per min and a temperature of 37ºC. Samples were taken after
30 min for microscopic examination using a light microscope (Axiolab re, Carl Zeiss,
Germany) with an optical zoom of 50 x /0.70 and an eye piece of 10 x /20.

Chapter 2 Formulation and characterization of self-emulsifying pellets containing Solutol® HS15 and GMS
38
2.3.5 Friability testing of pellets
Friability testing was conducted using a friability tester (Arzneimittelwerk,
Dresden, Germany). A 10 g pellet sample was placed into the drum together with 10
g glass spheres of 5 mm diameter, and rotated for 10 min at 25 rpm [194]. Pellets
were then weighed and friability was calculated according to:
Friability % = 100ab
b
m mm−
×
Where, mb and ma are the masses of pellets before and after testing and the result is
the mean of three runs.
2.3.6 Disintegration testing of pellets
Disintegration time of pellets was measured by the use of a disintegration tester
(Erweka ZT2, Heusenstamm, Germany), modified by the installation of 500µm mesh
at the bottom of the tubes. Six pellets were tested in distilled water at 37 ºC and the
end point was taken at the point at which no particles were present on the sieve.
2.3.7 Electron Microscopy
Surface characteristics of pellets were investigated by means of environmental
scanning electron microscopy (ESEM, Philips XL 30 FEG, Philips electron optics).
SEM micrographs were obtained by means of a special gas secondary electron
(GSE) detector using the wet-mode method with a pressure of 1.3 mbar and
acceleration voltage of 12 kV. Moreover, pure MCC pellets, prepared with the same
method, were also investigated.
2.3.8 ESR flow through cell experiment
Samples of 200 mg Tempol-benzoate (TB) or Tempol (TL) (Figure 2.2) loaded
pellets (2mmol/kg) were placed in a flow through cell. Phosphate buffer (pH 6.8) was
pumped into the cell, by the mean of peristaltic pump, at a rate of 4 ml/min.

Chapter 2 Formulation and characterization of self-emulsifying pellets containing Solutol® HS15 and GMS
39
Figure 2.2 Chemical structures of the ESR spin probes Tempol and Tempolbenzoate. Figure 3.2 is showing a schematic illustration of the ESR flow through system. The
ESR spectra were recorded continuously using a 1.3 GHz L-band spectrometer
(Magnettech Gmbh, Berlin, Germany) equipped with a re-entrant resonator. The ESR
parameters used were as follow: field center 49 mT, scan range 12 mT, scan time 60
sec, and modulation amplitude of 0.14 mT.
Figure 3.2. Schematic diagram showing the setup of the ESR flow through system. A flow through cell is placed inside the measurement (resonator) chamber between the magnets. The cell is connected from one end to a peristaltic pump and the other end to the waste collection.

Chapter 2 Formulation and characterization of self-emulsifying pellets containing Solutol® HS15 and GMS
40
2.3.9 Dissolution testing The USP 24 rotating paddle apparatus (Pharma Test PTW II, Hainburg,
Germany), rotating at a rate of 70 rpm and a temperature of 37 °C, was used to
asses the release of diazepam from the pellets in two different conditions. In the first
set of experiments, 900 ml phosphate buffer (pH 6.8) was used as the dissolution
media and samples of pellets with a diazepam content of 2.5 mg were assessed. In
the second set of experiments, the volume of the dissolution media was decreased to
be 500 ml and pellets with diazepam content of 27.5 mg were used. 5ml samples
were withdrawn at regular time intervals filtered and then assayed
spectrophtometrically (Spectronic 60, Milton Ray, Ivy- land, USA) at 241 nm.
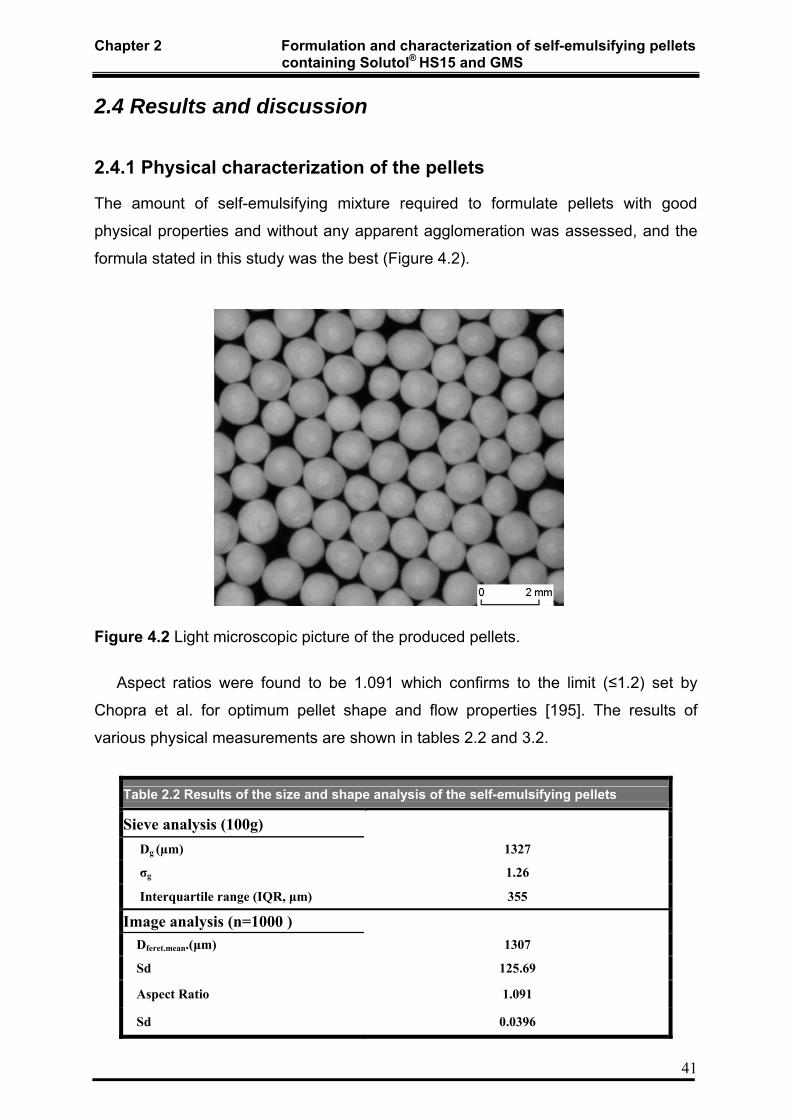
Chapter 2 Formulation and characterization of self-emulsifying pellets containing Solutol® HS15 and GMS
41
2.4 Results and discussion
2.4.1 Physical characterization of the pellets The amount of self-emulsifying mixture required to formulate pellets with good
physical properties and without any apparent agglomeration was assessed, and the
formula stated in this study was the best (Figure 4.2).
Figure 4.2 Light microscopic picture of the produced pellets.
Aspect ratios were found to be 1.091 which confirms to the limit (≤1.2) set by
Chopra et al. for optimum pellet shape and flow properties [195]. The results of
various physical measurements are shown in tables 2.2 and 3.2.
Table 2.2 Results of the size and shape analysis of the self-emulsifying pellets
Sieve analysis (100g)
Dg (µm) 1327
σg 1.26
Interquartile range (IQR, μm) 355
Image analysis (n=1000 )
Dferet.mean.(μm) 1307
Sd 125.69
Aspect Ratio 1.091
Sd 0.0396

Chapter 2 Formulation and characterization of self-emulsifying pellets containing Solutol® HS15 and GMS
42
The increase of Solutol® HS15 content above 35% led to the production of pellets
with poor physical characteristics. On the other hand, a loss of the self-emulsifying
properties was observed when the content of Solutol® HS15 was decreased below
25%. Furthermore, it was observed that the order of mixing is very critical for a
successful extrusion / spheronization process. As an example, small rods rather than
pellets were formed if the MCC was mixed with the molten glycerides prior to the
addition of water.
Table 3.2 Friability % and Disintegration time for self-emulsifying pellets in the fraction1000- 1400 µm
Friability testing (n=3)
Friability (%) 1.2
Sd 0.45
Disintegration Testing (n=6)
Time (min.) 22.32
Sd 1.26
ESEM Micrographs with the lowest magnification show that the produced pellets
were spherical in shape, which confirms with the aspect ratio measurements (Figure
5.2). More details about the surface characteristics of pellets were obtained with
increasing the magnification. Figure 5.2a shows typical features of the surface of
MCC pellets with a highly rough and porous surface with apparent cellulose fibers
network. After incorporation of 50 % of the self-emulsifying mixture the surface
becomes smoother and less porous (Figure 5.2b). A noticeable incorporation of the
SE mixture within the cellulose fibers network was observed with a subsequent
decrease in the pellet porosity.
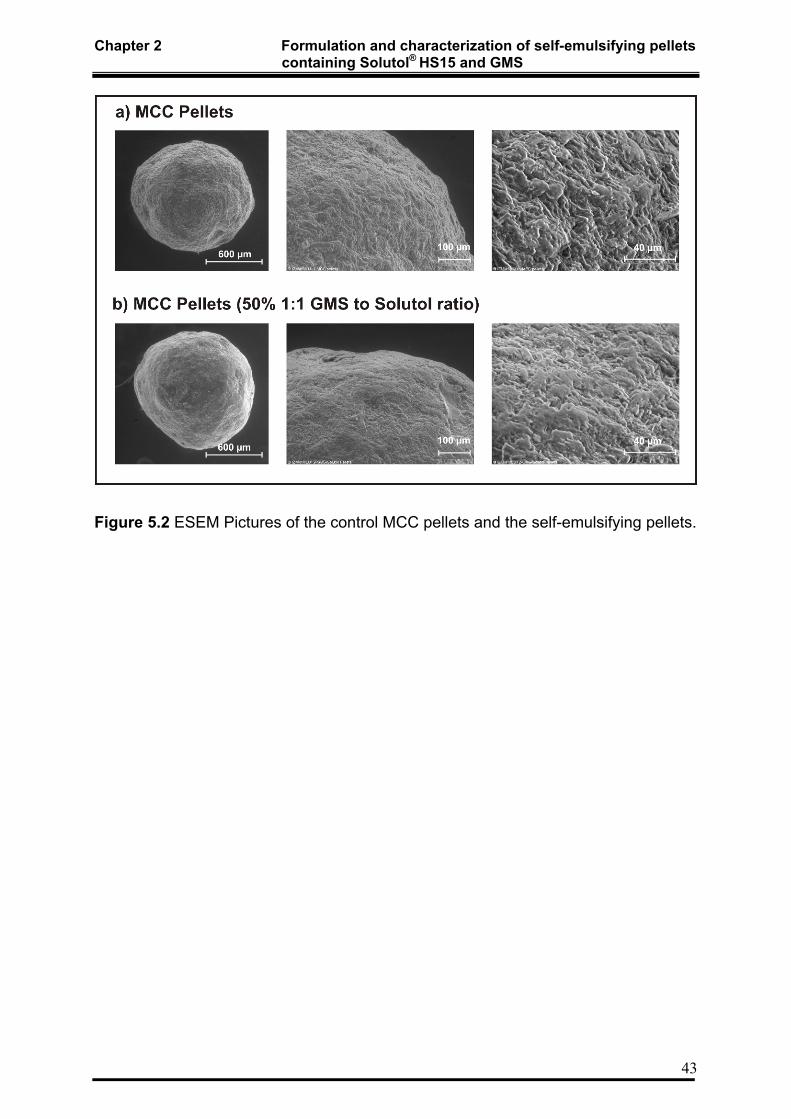
Chapter 2 Formulation and characterization of self-emulsifying pellets containing Solutol® HS15 and GMS
43
Figure 5.2 ESEM Pictures of the control MCC pellets and the self-emulsifying pellets.

Chapter 2 Formulation and characterization of self-emulsifying pellets containing Solutol® HS15 and GMS
44
2.4.2 Assessment of self-emulsification The self-emulsifying formulation was able to transfer Sudan Red into water within
the first few minutes following gentle agitation. The reference pellets, composed of
MCC and GMS were not able to deliver the lipophilic dye into the media (Figure 6.2 a
and b). Microscopic examination of the release media of the self-emulsifying pellets
showed lipid droplets, incorporating the dye (Figure 6.2 c). On the contrary,
microscopic examination of the release media of the reference pellets did not show
any droplets (Figure 6.2 d).
Figure 6.2 Photograph showing the release media of (a) self-emulsifying pellet formulation. (b) Reference pellets, containing Sudan red dye, after 30 min of dissolution in distilled water at a temperature of 37 ○C. And microscopic picture of the release media of (c) self-emulsifying pellets (d) reference pellets.

Chapter 2 Formulation and characterization of self-emulsifying pellets containing Solutol® HS15 and GMS
45
2.4.3 ESR flow through cell experiment The release kinetics and the microenvironment of the formulation during the
release process were assessed by low frequency ESR spectroscopy. The ESR
spectra of the nitroxides in Solutol, GMS and GMS-Solutol mixtures were recorded
(Figure 7.2a and b). The mobility of the nitroxides is reflected in the line width. Both
spin probes are more mobile in Solutol compared to GMS. The mobility in 1:1 GMS-
Solutol® HS15 mixtures is comparable to pure Solutol® HS15 and higher compared to
the mobility in dry pellets which contain MCC. This observation indicates that MCC
causes a decreased mobility. However, the nitroxides still re-orientate quite fast in
the solid material (within the nanosecond range).
After exposure to the dissolution medium, the ESR signal intensity decreased
rapidly both for the hydrophilic TL and the lipophilic TB molecules due to the release
of the nitroxides (Figure 7.2 c and d). Only small signals were detected after 30
minutes.
Figure 7.2 ESR spectra of TB (a) and TL (b) loaded formulation ingredients and mixtures. ESR spectra of TB (c) and TL (d) loaded pellets before, 2 and 30 min after buffer exposure in the flow cell system.

Chapter 2 Formulation and characterization of self-emulsifying pellets containing Solutol® HS15 and GMS
46
As the release media passes through the flow-cell, the shape of the TL spectra
has changed significantly and rapidly into a sharp isotropic spectrum with a higher
hyperfine splitting constant (aN=1.72 mT; Figure 7.2 d), indicating the presence of the
spin probe in an aqueous environment. In contrast, the ESR spectra of the more
lipophilic probe TB show no significant change of the spectral shape and the
hyperfine splitting constant during the release process. This indicates the preferential
localization of the TB spin probe in the lipid environment all over the study period
(Figure 7.2c).
2.4.4 Dissolution testing The complete release of diazepam (Figure 8.2) from the non self-emulsifying
GMS/MCC pellets has taken 3-folds the duration of that from the self-emulsifying
pellets (Figure 9.2a).
Figure 8.2 Chemical structure of diazepam.
Nearly 90% of the drug was released after 1 h, while only 55% was released
from the GMS/MCC pellets after the same time. In the second experiment, with
higher load of diazepam and lower volume of the dissolution media, the self-
emulsifying pellets were capable of releasing diazepam into the media and a state of
supersaturation was generated. Supersaturation was observed for several hours and
there was no evidence of diazepam crystallization throughout the time of the
experiment. On the other hand, pellets composed of MCC/GMS were only capable of
releasing diazepam until the saturation solubility was reached (Figure 9.2b).

Chapter 2 Formulation and characterization of self-emulsifying pellets containing Solutol® HS15 and GMS
47
Figure 9.2 Mean (±SEM, n=3) percentage of a) Diazepam released as a function of time (h) in 900 ml phosphate buffer pH 6.8, and diazepam load of 2.5 mg from GMS/MCC pellets (■), and GMS-Solutol/MCC pellets (▲) b) Diazepam release as a function of time (h) in 500 ml phosphate buffer pH 6.8, and diazepam load of 27.5 mg from GMS/MCC pellets (■), and GMS-Solutol/MCC pellets (▲).

Chapter 2 Formulation and characterization of self-emulsifying pellets containing Solutol® HS15 and GMS
48
2.5 Conclusion The current results demonstrate the possibility of using extrusion/spheronization
to develop a self-emulsifying pellet formulation with 50% of the self-emulsifying
mixture. The pellets have a spherical shape, small size distribution, and low friability.
In contrast to MCC-GMS pellets, they were able to transfer lipophilic dyes or drugs
into the aqueous phase of the dissolution media. Therefore, a decreased food
dependency (bile acid concentration, digestion rate) can be expected.
Pellet formation is strongly dependent on the pellet composition and the order of
processing. MCC is essential as a spheronization aid in pellet production, therefore a
compromise between the least amount of MCC that can produce pellets with good
physical characteristics and the amount of lipid, drug containing phase, should be
achieved. Since GMS alone is not self-emulsifying, Solutol was used to aid the self-
emulsification process.
The ESR results indicate that the lipophilic spin probe (TB) mainly localizes in
the lipid environment inside the pellets until it was completely released into the
media. The release data showed a noticeable improvement in the in vitro dissolution
of diazepam when compared to the release from the non-emulsifying formulation.
Moreover, the results from the second release study, with higher load of diazepam
and lower volume of the dissolution media, showed that the formulation was able to
create and maintain a state of supersaturation for the poorly water soluble diazepam.

Chapter 3 Formulation and characterization of self-emulsifying pellets containing Solutol® HS15, Capmul® and Captex®
49
3. Preparation and characterization of a self-emulsifying pellet formulation containing Solutol® HS15, a mixture of medium chain mono- and di-glycerides and tri-glycerides of caprylic/capric acid.
3.1 Introduction In the previous section, the possibility of incorporating a semisolid self-emulsifying
system into pellets and the production of pellets by means of extrusion/
spheronization was shown. The purpose of the current study is to develop a new
SEDDS using a mixture of medium chain mono- and di-glycerides, triglycerides of
caprylic/capric acid and Solutol® HS15. These systems were then assessed for self-
emulsification and for droplet size diameter after dispersion.
The significance of emulsion droplet size in the in vivo performance of the
formulation is not yet clear. Tarr and Yalkowsky have demonstrated enhancement of
the rate of intestinal absorption of cyclosporine through the reduction of emulsion
droplet size [196]. One possible explanation of the enhanced absorption observed
with small particle size is the larger surface area available for partitioning of the drug
and for lipase activity. Conversely, Pouton stated, in a recent review, that the role of
droplet size is less important than it was assumed by some authors and he ascribed
this to the fact that digestion will take place directly after the dispersion leaves the
stomach and at this stage particle size will have no or little effect [6]. In this study,
the droplet diameter, expressed as Z-average (the intensity weighted mean
hydrodynamic size of the ensemble collection of particles), of the emulsion resulted
from the dispersion of different SE mixtures was determined by means of photon
correlation spectroscopy (PCS), which is a dynamic light scattering (DLS) technique.
Emulsion droplet polarity is one of the important factors for the performance of
SEDDS [54]. Polarity describes the affinity of the drug compound to oil and/or water
which consequently affects the release of the drug into the aqueous phase [56]. As
described before in the introduction section, ESR spectra of nitroxide spin probes can
provide information about their environment. For instance, the hyperfine splitting
constant (aN) is a sensitive parameter to the polarity of the environment (see figure
Chapter 3 Formulation and characterization of self-emulsifying pellets containing Solutol® HS15, Capmul® and Captex®
50
1.3 for illustration) and this property is used to monitor partitioning and localization of
spin probes in compartments of different polarity [180]. In the current study, Electron
spin resonance (ESR) spectroscopy was used to monitor the microenvironment and
to follow up partitioning and localization of the spin probe in different environments
within emulsions resulted from the dispersion of different self-emulsifying mixtures in
water. Since the majority of drug delivery samples are diamagnetic and ESR silent,
the incorporation of the nitroxide spin probe TB, as a model for poorly soluble drugs,
was necessary for the ESR experiment.
Digestion of lipid based formulations, in the presence of endogenous materials
(bile salts (BS), phospholipids (PL) and cholesterol), induces a change in lipid
composition and results in the formation of different colloidal phases (micelles,
vesicles, and liquid crystalline phases) in the intestinal lumen [197-201]. The change
in lipid composition, induced by digestion, plays a major role in the solubilization
process and consequently the absorption of the co-administered drug [45, 202, 203].
Therefore, development of an in vitro digestion model was a subject of interest for
many research groups [141, 204-208]. In vitro lipid digestion experiment was carried
out to asses the change in the solubilization capacity of progesterone in different SE
mixtures after dilution and digestion in simulated intestinal fluids. Moreover, in vitro
digestion was monitored by ESR spectroscopy to have an insight on the
characteristics of the phases formed during the digestion process and to asses the
distribution and localization of the spin probe in such phases [209].
The system that shows a compromise between good self-emulsifying properties,
acceptable solubilization of the model drug and optimum surfactant concentration
was selected to be incorporated into pellets by means of extrusion/spheronization.
Pellets were then characterized for size and shape. Additionally, one aim of the
study was to explore the possibility of using a benchtop NMR instrument to monitor
T2 distribution in order to evaluate the state of the lipid after the incorporation of
different percentages of the SE mixture into MCC pellets. Moreover, nitroxide loaded
pellets were produced and an ESR spectroscopy experiment was carried out to
assess the microenvironment within the pellets during the release process. A
dissolution experiment was designed to asses the release of progesterone from the
pellets in different media.

Chapter 3 Formulation and characterization of self-emulsifying pellets containing Solutol® HS15, Capmul® and Captex®
51
3.2 Materials
Avicel PH 101 (microcrystalline cellulose (MCC)) was purchased from FMC
BioPolymer (PA, USA), and was used as a pellet forming material. Solutol® HS 15
(macrogol-15-hydroxystearate) was kindly provided by BASF AG (Ludwigshafen,
Germany). Captex 355 EP/NF (triglycerides of caprylic/capric acid) and Capmul MCM
(medium chain mono- and di-glycerides) were kindly provided by Abitec Corporation
(Janesville, WI, USA). Progesterone (Figure 1.3) was purchased from Sigma-Aldrich
(Steinheim, Germany). Pancreatin (activity equal to 8 X USP specification) and bile
extract [used as a heterogeneous source of bile salts (BS)] were obtained from
Sigma (Steinheim, Germany). Tempolbenzoate (4-Benzoyloxy-2,2,6,6-
tetramethylpiperidine-1-oxyl, TB) was purchased from Sigma-Aldrich (Steinheim,
Germany). Acetonitrile and Methanol were of HPLC gradient grade and were
purchased from Mallinckrodt Baker (Deventer, Netherlands). All other materials were
of analytical grade and were used as received.
Figure 1.3 Chemical structure of progesterone.

Chapter 3 Formulation and characterization of self-emulsifying pellets containing Solutol® HS15, Capmul® and Captex®
52
3.3 Methods
3.3.1 Preparation and assessment of self-emulsifying mixtures
3.3.1.1 Preparation of Self-emulsifying mixtures The compositions of the formulations prepared are listed in table 1.3. The
preparation of the self-emulsifying (SE) mixtures involved the following steps:
Mixing of Solutol® HS 15, Captex® and Capmul® at 50°C.
Dissolving Progesterone in the lipid mixture.
Cooling to room temperature.
Equilibrating the mixtures for 24 h, to examine for any signs of phase
separation.
Table 1.3 Formulations composition of the different self-emulsifying mixtures produced
Self-emulsifying mixture composition (% w/w) Formulation
Captex 355:Capmul MCM Solutol HS15
Formulation A with 1:1 Captex to Capmul ratio
A1 80 20
A2 75 25
A3 70 30
A4 65 35
A5 60 40
A6 55 45
A7 50 50
Formulation B with 2:1 Captex to Capmul ratio
B1 80 20
B2 75 25
B3 70 30
B4 65 35
B5 60 40
B6 55 45
B7 50 50

Chapter 3 Formulation and characterization of self-emulsifying pellets containing Solutol® HS15, Capmul® and Captex®
53
3.3.1.2 Assessment of self-emulsification
The USP 24 rotating paddle apparatus (Pharma Test PTW II, Hainburg,
Germany), was used to evaluate the efficiency of self-emulsification of different
mixtures. One gram of each mixture was added to 200 ml of distilled water with
gentle agitation condition provided by a rotating paddle at 70 rpm and at a
temperature of 37°C. The process of self-emulsification was visually monitored for
the rate of emulsification and for the appearance of the produced emulsions.
3.3.1.3 Droplet size determination
Photon correlation spectroscopy (PCS) was used for determination of droplet
diameter of the formed emulsions. The measurements were performed by means of
a Malvern HPPS system (Malvern Instruments Ltd, United Kingdom) utilizing a
backscatter angle of 173°. Samples were taken from the previous experiment
(3.3.1.2) and were measured without dilution at 25C°. Mean hydrodynamic droplet
diameter, expressed as z-average, was recorded using the Malvern HPPS software.
3.3.1.4 Equilibrium solubility measurements Progesterone equilibrium solubility measurements were carried out in the following
media: phosphate buffer pH 6.8, FaSSIF and FeSSIF (see section 3.3.1.6 for
detailed composition). Furthermore, blank SE mixtures were mixed with different
dissolution media (1% w/v) in order to evaluate the influence of the formulation on
drug solubilization. For the assessment of the Progesterone equilibrium solubility in
digested self-emulsifying systems under physiological conditions, blank aqueous
digestion phases were obtained by carrying out the in vitro digestion experiment (see
section 3.3.1.6) with drug free SE mixtures for 1 hour, followed by ultracentrifugation
(108,000 g, 30 min, 37° C, Avanti J-301 centrifuge, Beckman Coulter Inc., CA, USA)
and separation of the aqueous phase from the pellet phase.
Progesterone was added in excess to 5 ml of the dissolution medium in sealed
tubes. Samples were incubated in an end-over-end mixer at 37°C for 24 hours and
then centrifuged for 10 minutes in an Eppendorf centrifuge (MiniSpin, Eppendorf AG,
Hamburg, Germany) at 13,000 rpm. The supernatant was filtered through a 0.2 µm
Millipore filter, diluted to a suitable concentration range and analyzed by HPLC for
Progesterone concentration.

Chapter 3 Formulation and characterization of self-emulsifying pellets containing Solutol® HS15, Capmul® and Captex®
54
3.3.1.5 ESR spectroscopy
Nitroxide loaded SE mixtures were produced and the microenvironment within the
oil droplets after emulsification was evaluated using electron spin resonance (ESR)
spectroscopy. The nitroxide spin probe tempol-benzoate (TB) was used as a model
for poorly water-soluble drugs. One gram of each TB loaded self-emulsifying mixture
(2 mmol/kg) was added to 200 ml of distilled water in dissolution apparatus rotating at
a rate of 70 rpm and a temperature of 37°C. Samples were taken after 30 minutes
and the ESR spectra were recorded by means of a 9.3-9.55 GHz X-band
spectrometer (MiniScope MS200, Magnettech, Berlin) using the following
parameters: Sweep 10 mT, sweep time 60 s, modulation amplitude 0.1 mT.
Furthermore, the ESR spectra of TB in different formulation components were
recorded using the same conditions.
Simulation of the ESR spectra was performed by the use of Nitroxide spectra
simulation software (Biophysical laboratory, EPR center, Josef Stefan Institute,
Ljubljana, Slovenia).
3.3.1.6 In Vitro Digestion
Digestion experiments were carried out by the dispersion of 1% (w/v) of the SE
mixtures, containing the drug dissolved at around 70% of saturation solubility in the
corresponding mixture, in 7.5 ml digestion buffer (53.4% KH2PO4 1/15 M and 46.6%
Na2HPO4•2H2O 1/15 M, 150 mM NaCl, 5 mM CaCl2•2H2O, pH 6.8) containing either
a low (5/1.25 mM BS/PL) or a high (20/5 mM BS/PL) concentration of BS and PL to
simulate the intestinal fluids in the fasting (FaSSIF) and the fed state (FeSSIF)
respectively [210-213]. Figure 2.3 is illustrating the setup of the in vitro digestion
experiment. Experiments were carried out in an end-over-end apparatus rotating at a
rate of 15 rpm and a temperature of 37°C, and were started by the addition of 65.77
mg Pancreatin enzyme containing 450 U/ml of pancreatic lipase activity. 200 µl
samples were taken at regular time intervals and centrifuged at 13,400 rpm for 4
minutes in an Eppendorf centrifuge (MiniSpin, Eppendorf AG, Hamburg, Germany) in
order to separate the precipitate from the micellar phase. The supernatant was
diluted with the mobile phase and analyzed for progesterone by HPLC using Merck
Hitachi HPLC system consisting of a model AS 4000A auto-sampler, L 6200A
programmable pump and a L 4250 UV-Vis detector (Merck, Darmstadt, Germany)

Chapter 3 Formulation and characterization of self-emulsifying pellets containing Solutol® HS15, Capmul® and Captex®
55
using a Hibar® RT 125-4 LiChrospher® 100 RP-18 (5 µm) column (Merck, Darmstadt,
Germany). The mobile phase, composed of acetonitrile-water (70:30, v/v) adjusted to
pH 3.5 with orthophosphoric acid, was pumped at a flow rate of 1 ml/min. 20 µl was
injected and the column effluent was monitored at a wavelength of 240 nm. The
retention time for progesterone was found to be 2.9 minutes.
Figure 2.3 schematic presentation of the in vitro digestion experiment
Chapter 3 Formulation and characterization of self-emulsifying pellets containing Solutol® HS15, Capmul® and Captex®
56
3.3.1.7 Monitoring of In Vitro lipid digestion by ESR
ESR spectroscopy experiments were carried out to monitor the in vitro lipid
digestion of a selected SE mixture. The lipophilic spin probe TB was mixed first with
the SE mixture to obtain a final concentration of 1mM. 1 % of the nitroxide loaded SE
mixture B5 was mixed with 7.5 ml of the previously described digestion buffer (see
section 3.3.1.6 for details). Experiment was initiated by the addition of 65.77 mg
Pancreatin (450 U/ml of pancreatic lipase activity) to the mixture. The mixture was
then incubated in an end over end apparatus at 37 °C and pH was adjusted to 6.8
every 10 minutes. 100 µl samples were taken at fixed time intervals, filled into a
capillary tube and measured by X-band ESR spectrometer. Control experiments of
TB in different media were carried out to help understanding and interpreting the
resulting spectra. The obtained spectra were simulated by means of simulation
software (EPR center, Josef Stefan Institute, Ljubljana, Slovenia). For the control
experiments blank aqueous digestion phases were obtained by carrying out the
experiment with drug free self-emulsifying mixtures for 1 hour, followed by
ultracentrifugation (108,000 g, 30 min, 37° C, Avanti J-301 centrifuge, Beckman
Coulter Inc., CA, USA) and separation of the aqueous phase from the pellet phase.
3.3.2 Formulation and characterization of pellets
3.3.2.1 Formulation of pellets
Self-emulsifying mixture B5 was selected for incorporation into pellets, in three
different levels (10, 20, and 40 %), by the mean of extrusion/ spheronization.
The self-emulsifying mixture was mixed with MCC in a kneader for 15 minutes.
This was followed by addition of water until a mass suitable for extrusion is obtained.
The wet mass produced was then extruded and then spheronized using the same
method described in section 2.3.1.2. The produced pellets were then dried in a
desiccator over silica gel at room temperature.
3.3.2.2 Electron Microscopy
Surface characteristics of pellets with 10, 20 and 40% content of SE mixture B5
were investigated by means of environmental scanning electron microscopy (ESEM).
SEM micrographs were obtained using the same method described in section 2.3.7.

Chapter 3 Formulation and characterization of self-emulsifying pellets containing Solutol® HS15, Capmul® and Captex®
57
3.3.2.3 T2 NMR distribution measurement
A benchtop NMR instrument (20 MHz, Oxford Instruments, Abingdon,
Oxfordshire, UK) was used to measure T2 distribution of pellets with 10, 20 and 40%
SE mixture B5 incorporated into MCC. Moreover, T2 distribution measurements were
performed for the liquid SE mixture. The measurements were carried out utilizing a
CPMG sequence using the following parameters: P90 3.65 µs, tau 135 µs, dwell time
10 µs.
3.3.2.4 In Vitro release testing
In vitro release experiments were performed in an end over end apparatus
rotating at a rate of 15 rpm and a temperature of 37 °C. Therefore samples of pellets
corresponding to 1% (w/v) final SE mixture concentration in the release media were
assayed. The composition of the investigated pellets is shown in table 2.3.
Three different release media were chosen: phosphate buffer (pH 6.8) and in vitro
digestion buffer with Pancreatin under either FaSSIF or FeSSIF conditions.
Pancreatin powder containing 450 U/ml of pancreatic lipase activity was added at the
beginning of the digestion experiment. 200 µl samples were taken at regular time
intervals and centrifuged at 13,400 rpm for 4 minutes in order to separate a
dispersed phase and a pellet phase. The supernatant was diluted with the mobile
phase and analyzed for Progesterone by the previously described HPLC method. All
experiments were carried out in triplicate.
Table 2.3 Composition of the investigated pellets
Pellets composition (% w/w) Ingredients
Progesterone pellets Pellets for ESR
MCC PH 101 58.7 60
Solutol HS15 16 16
Captex 355 16 16
Capmul MCM 8 8
Progesterone 1.3 ─
Tempol benzoate ─ 2 mmol/Kg

Chapter 3 Formulation and characterization of self-emulsifying pellets containing Solutol® HS15, Capmul® and Captex®
58
3.4 Results
3.4.1 Preparation and in vitro assessment of the SE mixtures
Most of the SE mixtures produced belong to type IIIA in the lipid formulation
classification system (LFCS) proposed by C. W. Pouton with an oil content of 40-
80% (w/w), a water soluble surfactant (HLB >12) content of 20-40 % and hydrophilic
cosolvent content of 0-40% [6, 43]. In this study, Captex® 355 EP/NF (triglycerides of
caprylic/capric (C8/C10) acid) was used as the oil, and the corresponding mono- and
di-glycerides mixture (Capmul® MCM) was used to increase the solubilization and
self-emulsification capacity. Solutol® HS 15 (main component: polyoxyethylene-660-
12-hydroxy stearate) was used as the water soluble surfactant (HLB= 14-16).
All the formulated mixtures were efficiently emulsified within the first minute of
contact with the dispersion medium and there was no evidence of phase separation
or any instability problem for at least 24 hours. The optical clarity of the produced
emulsions was strongly dependent on the composition. It changed largely, from a
bright white at low Solutol® HS15 concentration toward a clear or slightly bluish
emulsion, with increasing Solutol® HS15 concentration in the formulation, indicating
that the surfactant plays a crucial role in determining the properties and functionality
of the resulting dispersion.
Droplet diameter, expressed as Z-average (the intensity weighted mean
hydrodynamic size of the ensemble collection of particles), of the emulsion resulted
from the dispersion of different SE mixtures was determined by means of PCS. The
results of droplet size determination experiment of the different formulation studied
are shown in figure 3.3. The concentration of Solutol® HS in the formulation
noticeably affects the nature of the emulsion formed. Increasing Solutol® HS
concentration leads to an obvious improvement in the optical clarity, which correlates
well with the determined particle size of the corresponding dispersion. It was also
noticeable that increasing the amount of Captex®, the medium chain triglyceride oil,
and decreasing the amount of Capmul®, in the formulation with a 2:1 w/w Captex® to
Capmul® ratio, decreased the emulsification efficiency and caused higher particle
sizes and lower optical clarity. This finding corresponds to the decreased polarity of
the oily phase. At higher Solutol® HS 15 concentrations the decrease in the droplet
diameter in relation to the Solutol® HS 15 concentration was very small for both

Chapter 3 Formulation and characterization of self-emulsifying pellets containing Solutol® HS15, Capmul® and Captex®
59
Captex®/Capmul® ratios. This can be attributed to the fact that Solutol® HS 15 is a
micelle forming agent.
Figure 3.3 Effect of Solutol content on the droplet diameter (mean ± SD, n=3) of the emulsions produced by dispersing SE mixtures in water.
The preference between different Captex® to Capmul® ratios will depend on the
solubilization characteristics of the drug. For instance, a higher proportion of
triglyceride oil will be required for highly hydrophobic drugs but for less hydrophobic
drugs an improvement of solvent capacity could be achieved through increasing the
proportion of mixed mono- and di-glycerides. In general, a compromise between drug
loading capacity and efficient emulsification has to be achieved.
ESR experiments were carried out to assess the microenvironment and to monitor
partitioning and localization of the spin probe in different environments within the
produced emulsions. In addition, ESR spectra of TB in different formulation
components were recorded and simulated to to serve as references (Figure 4.3).
Figure 4.3 (right diagram) shows the sensitivity of the line shape to the viscosity of
the different media.

Chapter 3 Formulation and characterization of self-emulsifying pellets containing Solutol® HS15, Capmul® and Captex®
60
Figure 4.3 ESR spectra of TB in environments with different polarity and viscosity. The hyperfine coupling constant aN is sensitive to the polarity of the environment (left diagram) which is used to monitor the partitioning of spin probes between compartments with different polarity. Please note the effect of increasing the viscosity on the broadening of the line width (right diagram).
In a low viscosity medium like water, the rotation (tumbling) of the spin probe is
very fast and the rotations around the x, y and z axes cannot be distinguished
resulting in an almost complete averaging of their individual contributions seen as 3
sharp lines. As the viscosity increases (from Captex ® 355 to Caprol ® MPGO), the
rotation around the three axes is no longer the same and its slowed down around
one or more axes leading to distortion of the line shape manifested as broadening of
the lines with a special effect on the third line. In Captex® 355, the mobility of the spin
probe is still fast and it is higher than the mobility in the other formulation ingredients,
Solutol® HS15 and Capmul® MCM. Even though Solutol ® HS15 is a semisolid
material, the spectrum is still showing relatively high mobility of the spin probe. From
the line width of the spectra, the rotational correlation time (τR) can be determined
and it can be related to the viscosity of the media. The left diagram in figure 4.3 is
showing the sensitivity of the hyperfine coupling constant aN to the polarity of the
environment. This property is used to monitor the partitioning and the localization of
spin probes between compartments with different polarity. As the polarity decreases
from water toward paraffin oil, the hyperfine coupling constant decreases. The
polarity of Captex® 355, composed of triglycerides of caprylic/capric (C8/C10) acid, is
lower than the polarity of the corresponding mono- and di-glycerides mixture
(Capmul® MCM) which lies in between the polarity of water and paraffin oil. This

Chapter 3 Formulation and characterization of self-emulsifying pellets containing Solutol® HS15, Capmul® and Captex®
61
confirms with the function of Capmul ® MCM in the formulation which is increasing the
solubilization and self-emulsification capacity. Figure 5.3 shows an illustration of the
results of the ESR experiments.
Figure 5.3 Schematic presentation of the in vitro ESR experiment.
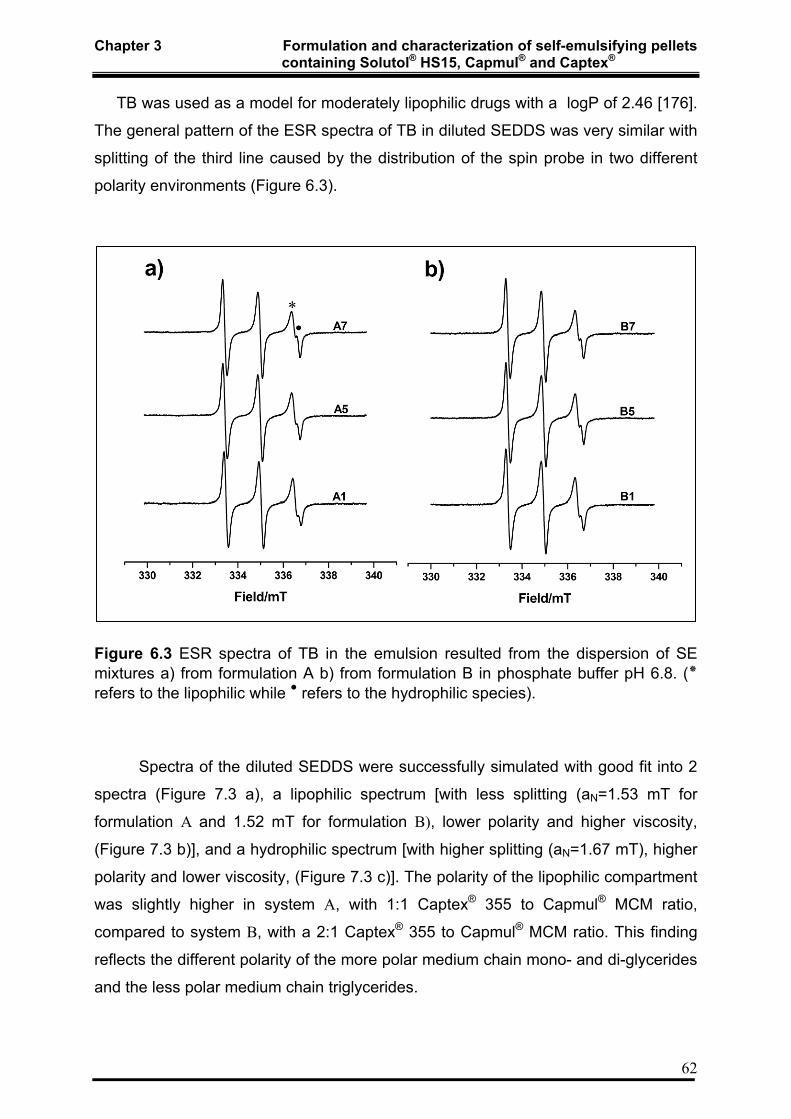
Chapter 3 Formulation and characterization of self-emulsifying pellets containing Solutol® HS15, Capmul® and Captex®
62
TB was used as a model for moderately lipophilic drugs with a logP of 2.46 [176].
The general pattern of the ESR spectra of TB in diluted SEDDS was very similar with
splitting of the third line caused by the distribution of the spin probe in two different
polarity environments (Figure 6.3).
Figure 6.3 ESR spectra of TB in the emulsion resulted from the dispersion of SE mixtures a) from formulation A b) from formulation B in phosphate buffer pH 6.8. (٭٭ refers to the lipophilic while ● refers to the hydrophilic species).
Spectra of the diluted SEDDS were successfully simulated with good fit into 2
spectra (Figure 7.3 a), a lipophilic spectrum [with less splitting (aN=1.53 mT for
formulation A and 1.52 mT for formulation B), lower polarity and higher viscosity,
(Figure 7.3 b)], and a hydrophilic spectrum [with higher splitting (aN=1.67 mT), higher
polarity and lower viscosity, (Figure 7.3 c)]. The polarity of the lipophilic compartment
was slightly higher in system A, with 1:1 Captex® 355 to Capmul® MCM ratio,
compared to system B, with a 2:1 Captex® 355 to Capmul® MCM ratio. This finding
reflects the different polarity of the more polar medium chain mono- and di-glycerides
and the less polar medium chain triglycerides.
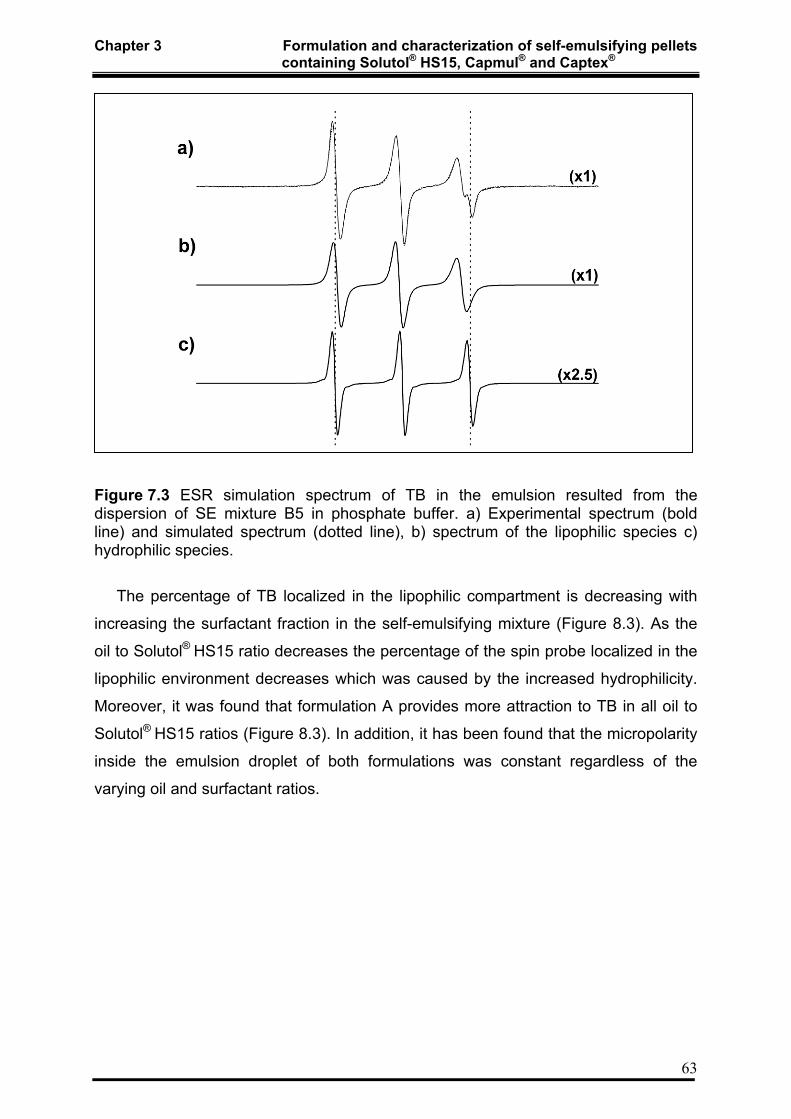
Chapter 3 Formulation and characterization of self-emulsifying pellets containing Solutol® HS15, Capmul® and Captex®
63
Figure 7.3 ESR simulation spectrum of TB in the emulsion resulted from the dispersion of SE mixture B5 in phosphate buffer. a) Experimental spectrum (bold line) and simulated spectrum (dotted line), b) spectrum of the lipophilic species c) hydrophilic species.
The percentage of TB localized in the lipophilic compartment is decreasing with
increasing the surfactant fraction in the self-emulsifying mixture (Figure 8.3). As the
oil to Solutol® HS15 ratio decreases the percentage of the spin probe localized in the
lipophilic environment decreases which was caused by the increased hydrophilicity.
Moreover, it was found that formulation A provides more attraction to TB in all oil to
Solutol® HS15 ratios (Figure 8.3). In addition, it has been found that the micropolarity
inside the emulsion droplet of both formulations was constant regardless of the
varying oil and surfactant ratios.
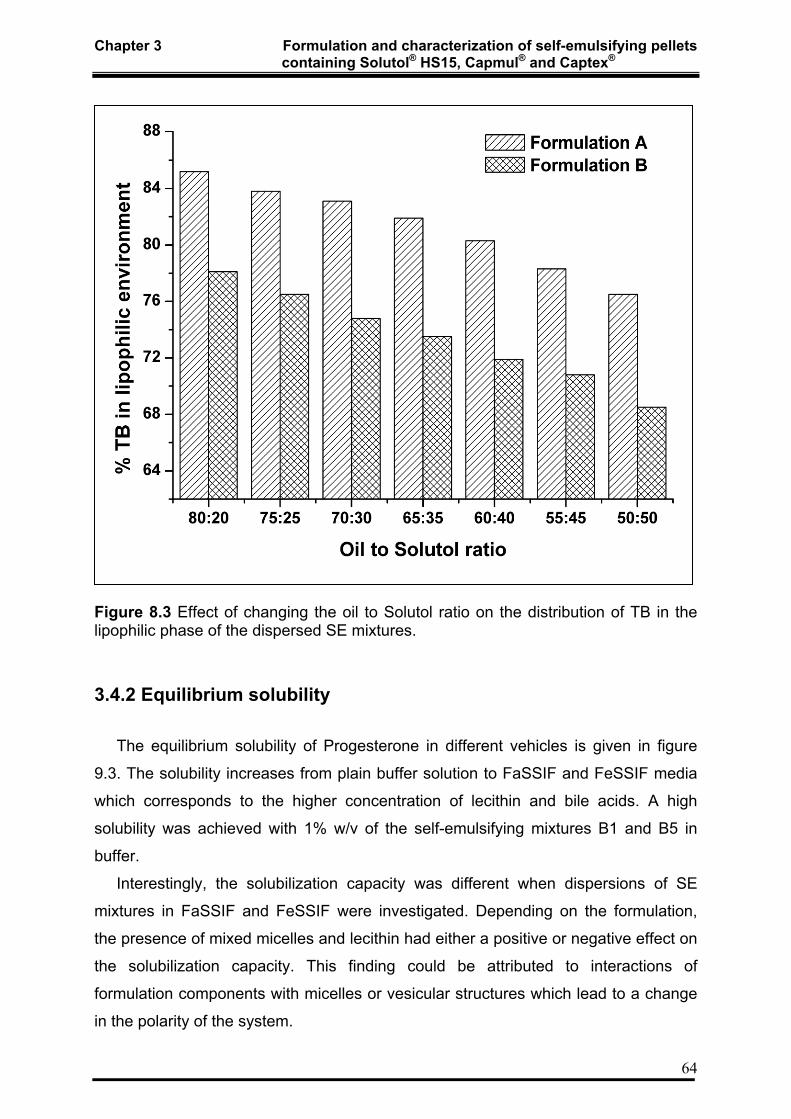
Chapter 3 Formulation and characterization of self-emulsifying pellets containing Solutol® HS15, Capmul® and Captex®
64
Figure 8.3 Effect of changing the oil to Solutol ratio on the distribution of TB in the lipophilic phase of the dispersed SE mixtures.
3.4.2 Equilibrium solubility
The equilibrium solubility of Progesterone in different vehicles is given in figure
9.3. The solubility increases from plain buffer solution to FaSSIF and FeSSIF media
which corresponds to the higher concentration of lecithin and bile acids. A high
solubility was achieved with 1% w/v of the self-emulsifying mixtures B1 and B5 in
buffer.
Interestingly, the solubilization capacity was different when dispersions of SE
mixtures in FaSSIF and FeSSIF were investigated. Depending on the formulation,
the presence of mixed micelles and lecithin had either a positive or negative effect on
the solubilization capacity. This finding could be attributed to interactions of
formulation components with micelles or vesicular structures which lead to a change
in the polarity of the system.
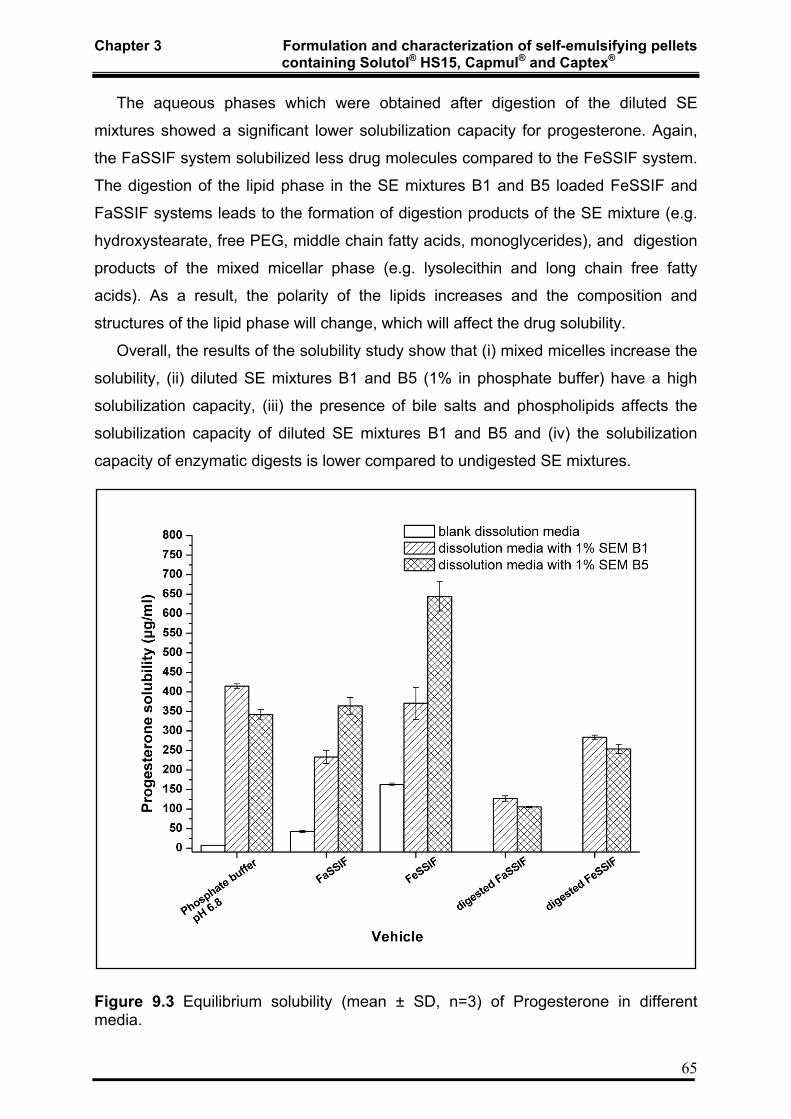
Chapter 3 Formulation and characterization of self-emulsifying pellets containing Solutol® HS15, Capmul® and Captex®
65
The aqueous phases which were obtained after digestion of the diluted SE
mixtures showed a significant lower solubilization capacity for progesterone. Again,
the FaSSIF system solubilized less drug molecules compared to the FeSSIF system.
The digestion of the lipid phase in the SE mixtures B1 and B5 loaded FeSSIF and
FaSSIF systems leads to the formation of digestion products of the SE mixture (e.g.
hydroxystearate, free PEG, middle chain fatty acids, monoglycerides), and digestion
products of the mixed micellar phase (e.g. lysolecithin and long chain free fatty
acids). As a result, the polarity of the lipids increases and the composition and
structures of the lipid phase will change, which will affect the drug solubility.
Overall, the results of the solubility study show that (i) mixed micelles increase the
solubility, (ii) diluted SE mixtures B1 and B5 (1% in phosphate buffer) have a high
solubilization capacity, (iii) the presence of bile salts and phospholipids affects the
solubilization capacity of diluted SE mixtures B1 and B5 and (iv) the solubilization
capacity of enzymatic digests is lower compared to undigested SE mixtures.
Figure 9.3 Equilibrium solubility (mean ± SD, n=3) of Progesterone in different media.

Chapter 3 Formulation and characterization of self-emulsifying pellets containing Solutol® HS15, Capmul® and Captex®
66
3.4.2 In Vitro digestion
The solubilization of progesterone during in vitro digestion of SE mixture B1 and
B5 was monitored in both FaSSIF and FeSSIF conditions. Digests were centrifuged
and were consequently separated into a dispersed phase and a pellet phase with no
evident oil phase which complies with the data presented in different studies [142,
210]. Results of the digestion experiment are shown in figure 10.3. For formulation
B1 in FeSSIF condition, progesterone concentration was reaching and maintaining
the saturated solubility for at least one hour after which dropping of the solubilization
capacity was noticed. Precipitation of progesterone in FeSSIF occurs more rapidly for
formulation B5, which could be attributed to the lower oil content in the formulation
leading to the liberation of a lower amount of monoglycerides and fatty acids as
digestion proceeds [210, 213]. In FaSSIF digestion experiment, precipitation starts at
earlier stage for both formulations which is attributable to the lower concentration of
BS and PL in the digestion media.
Figure 10.3 Mean (±SD, n=3) percentage of progesterone dissolved as a function of time (h), after the digestion of 1% (w/v) of the SE mixtures B1 in the digestion buffer in FaSSIF (□) and in FeSSIF (■), and SE mixture B5 in FaSSIF (○) and FeSSIF (●). Experiments were initiated by the addition of Pancreatin enzyme (450 U/ml of pancreatic lipase activity).

Chapter 3 Formulation and characterization of self-emulsifying pellets containing Solutol® HS15, Capmul® and Captex®
67
Furthermore, these data are in agreement with the results obtained from the
equilibrium solubility study of progesterone. The results clearly indicate that (i)
enzymatic digestion decreases the solubilization capacity for progesterone, (ii) the
solubility is enhanced under FeSSIF conditions, (iii) the digested formulation B1
solubilize slightly more drug compared to the digested B5 SE mixture.
3.4.3 Monitoring of In Vitro lipid digestion by ESR
To have an insight into different phases formed during in vitro digestion of the self-
emulsifying mixture B5, and to investigate the distribution and localization of TB, as a
model for poorly soluble drugs, in such phases, an ESR in vitro digestion experiment
was performed. There were no need for centrifugation and separation of different
phases formed, and direct measurement of the digestion mixture was carried out at
different time intervals after starting the experiment.
Values of rotational correlation time, related to mobility of the spin probe and
microviscosity of the media, and hyperfine splitting constant (hfs), related to the
micropolarity were obtained from simulating TB spectra by means of ESR spectra
simulation software. The results obtained from the control experiment of TB in
different media are shown in figure 11.3. There were no difference between water
and phosphate buffer with both having small rotational correlation time, reflecting low
viscosity, and high hyperfine coupling constant, reflecting high polarity (Figure 11.3 a
and b). In mixed micelles and aqueous digestion media, the rotational correlation
time increases reflecting a large increase in viscosity compared to water and
phosphate buffer. Moreover, a large difference was noticed between the hydrophilic
and the lipophilic species in mixed micelles and aqueous digestion media in both
FaSSIF and FeSSIF conditions (Figure 11.3 a). The difference in viscosity was more
noticeable in the case of mixed micelles in FaSSIF condition compared to other
media. A smaller difference in hyperfine coupling constant, and hence in polarity, was
noticed between the FeSSIF and the FaSSIF conditions in both mixed micelles and
aqueous digestion media (Fig.11.3 b).

Chapter 3 Formulation and characterization of self-emulsifying pellets containing Solutol® HS15, Capmul® and Captex®
68
Figure 11.3 Values of a) Rotational correlation time and, b) Hyperfine coupling constant, for TB in different control media.
The spectra obtained from the in vitro digestion experiment have been
successfully simulated with two species, which reflect the localization of the spin
probe in two different environments (Figure 12.3). In the spectra of the hydrophilic
species, it was noticed that the third line has 50% lower amplitude than the middle
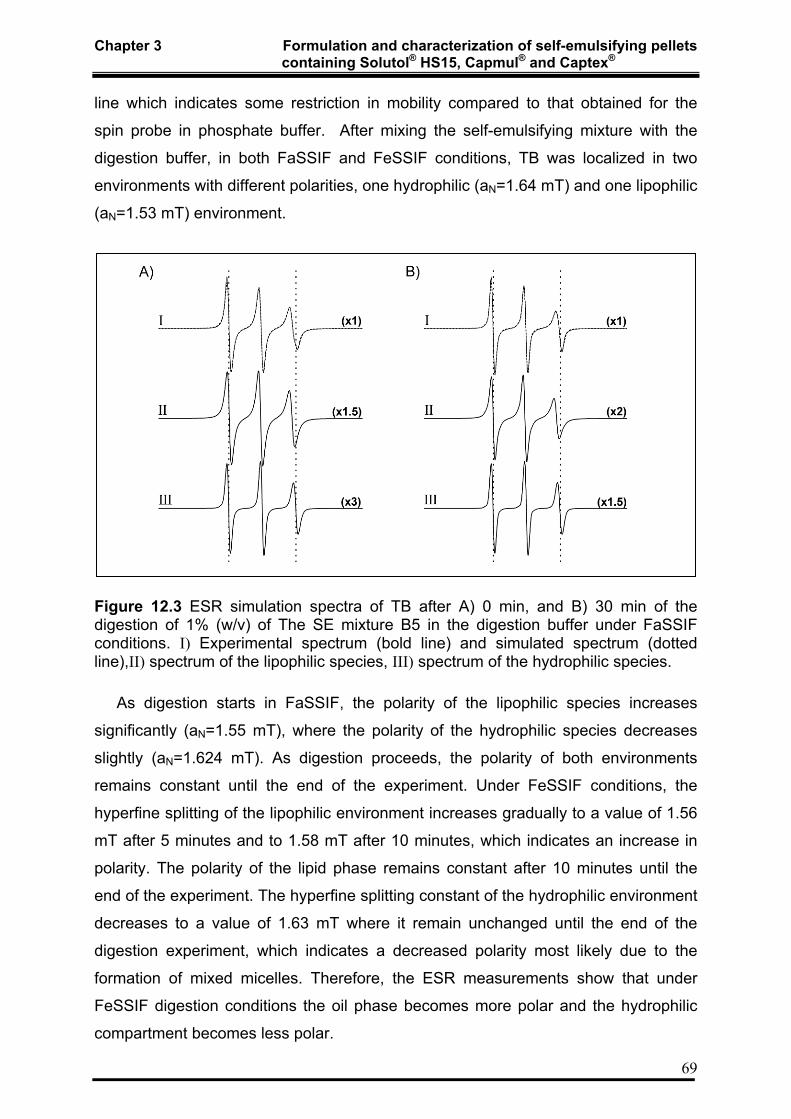
Chapter 3 Formulation and characterization of self-emulsifying pellets containing Solutol® HS15, Capmul® and Captex®
69
line which indicates some restriction in mobility compared to that obtained for the
spin probe in phosphate buffer. After mixing the self-emulsifying mixture with the
digestion buffer, in both FaSSIF and FeSSIF conditions, TB was localized in two
environments with different polarities, one hydrophilic (aN=1.64 mT) and one lipophilic
(aN=1.53 mT) environment.
Figure 12.3 ESR simulation spectra of TB after A) 0 min, and B) 30 min of the digestion of 1% (w/v) of The SE mixture B5 in the digestion buffer under FaSSIF conditions. I) Experimental spectrum (bold line) and simulated spectrum (dotted line),II) spectrum of the lipophilic species, III) spectrum of the hydrophilic species.
As digestion starts in FaSSIF, the polarity of the lipophilic species increases
significantly (aN=1.55 mT), where the polarity of the hydrophilic species decreases
slightly (aN=1.624 mT). As digestion proceeds, the polarity of both environments
remains constant until the end of the experiment. Under FeSSIF conditions, the
hyperfine splitting of the lipophilic environment increases gradually to a value of 1.56
mT after 5 minutes and to 1.58 mT after 10 minutes, which indicates an increase in
polarity. The polarity of the lipid phase remains constant after 10 minutes until the
end of the experiment. The hyperfine splitting constant of the hydrophilic environment
decreases to a value of 1.63 mT where it remain unchanged until the end of the
digestion experiment, which indicates a decreased polarity most likely due to the
formation of mixed micelles. Therefore, the ESR measurements show that under
FeSSIF digestion conditions the oil phase becomes more polar and the hydrophilic
compartment becomes less polar.

Chapter 3 Formulation and characterization of self-emulsifying pellets containing Solutol® HS15, Capmul® and Captex®
70
In a further step, the quantitative distribution of the spin probe in different
environments was calculated. As shown in figure 13.3, the percentage of TB
localized in the hydrophilic environment increases significantly within the first 5
minutes under both FaSSIF and FeSSIF digestion conditions and it remains constant
for the remaining time. This change in the distribution and localization of the spin
probe is caused by enzymatic induced hydrolysis of the apolar triglycerides and the
formation of the more polar fatty acids and monoglycerides and the localization of the
spin probe into the core of either polar colloidal structures, like mixed micelles, or into
the interior of less polar structures, like vesicles or liquid crystalline phases.
Figure 13.3 Distribution of TB in the hydrophilic compartment as a function of time, after the digestion of 1% (w/v) of the SE mixture B5 in the digestion buffer under FaSSIF (■), and FeSSIF (●) conditions.
The rotational correlation time, related to the mobility of the spin probe and the
viscosity of the media, was monitored throughout the digestion of the formulation. For
the lipophilic species in both conditions, the microviscosity increases significantly
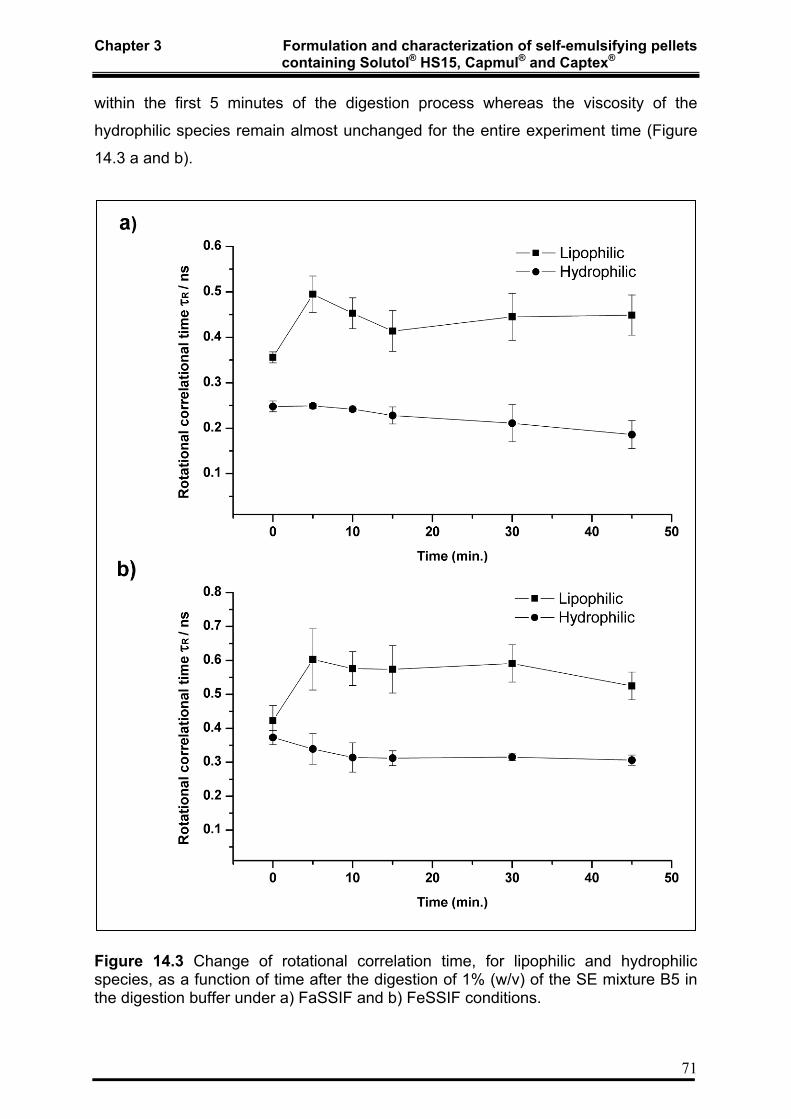
Chapter 3 Formulation and characterization of self-emulsifying pellets containing Solutol® HS15, Capmul® and Captex®
71
within the first 5 minutes of the digestion process whereas the viscosity of the
hydrophilic species remain almost unchanged for the entire experiment time (Figure
14.3 a and b).
Figure 14.3 Change of rotational correlation time, for lipophilic and hydrophilic species, as a function of time after the digestion of 1% (w/v) of the SE mixture B5 in the digestion buffer under a) FaSSIF and b) FeSSIF conditions.

Chapter 3 Formulation and characterization of self-emulsifying pellets containing Solutol® HS15, Capmul® and Captex®
72
3.4.4 Formulation and assessments of SE pellets
3.4.4.1 Pellets size and shape analysis
Because of its superior emulsification properties, formulation B5 was selected for
incorporation into MCC in different ratios to assess the possibility of pellets
production. Pellets were produced using extrusion/spheronization technique.
Assessment of the quality of the produced pellets was made by evaluating there size
and shape utilizing the same technique described in sections 2.3.2 and 2.3.3 . Details
of the results of size and shape analysis are shown in table 3.3 which includes the
values of the geometrical mean diameter (Dg) and the geometrical standard
deviation, the interquartile range (IQR, expected to include about 50% of the data),
the mean Feret diameter (Dferet.mean) and the aspect ratio. The results show that it was
possible to produce pellets with all MCC-lipid ratios used with the exception of the
formulation containing equal parts of the components where the extrudate stuck
together to form a big mass rather than pellets.
Table 3.3 Results of the size and shape analysis of the pellets
Pellets composition (%w/w) Sieve analysis (100 g) Image analysis
SE mixture (B5) MCC Dg (µm) σg IQR (µm) Dferet.mean.(μm) Aspect ratio
10 90 1103.3 1.16 243 1100.45 (145.7) 1.054 (0.051)
20 80 1274.6 1.38 267 1240.32 (143.2) 1.065 (0.045)
40 60 1353.2 1.59 320 1412.68 (194.6) 1.087 (0.092)
3.4.4.2 ESEM investigations
ESEM investigations show that pellets with different incorporation levels of SE
mixture B5 exhibit different surface structures. Micrographs with the lowest
magnification show that all produced pellets were spherical in shape, which confirms
with the aspect ratio measurements (Figure15.3). More details about the surface
characteristics of pellets were obtained with increasing the magnification. Figure
15.3a shows typical features of the surface of MCC pellets with a highly rough and
porous surface with apparent cellulose fibers network. For the pellets with 10% SE
mixture, the surface become smoother, less porous but the cellulose fibers network

Chapter 3 Formulation and characterization of self-emulsifying pellets containing Solutol® HS15, Capmul® and Captex®
73
were still observed on the surface (Figure 15.3b). As the SE mixture load increases
to 20 and 40 %, the pellets surface becomes smoother. There is obviously an
incorporation of the SE mixture within the cellulose fibers network which causes a
decrease of the pellet porosity (Fig. 15.3 c and d).
Figure 15.3 ESEM Pictures of self-emulsifying pellets with different load of the liquid self-emulsifying lipid mixture.

Chapter 3 Formulation and characterization of self-emulsifying pellets containing Solutol® HS15, Capmul® and Captex®
74
3.4.4.3 Assessment of friability
Friability testing of the produced pellets was conducted using the same method
described in section 2.3.5. The results show that the friability was less than 1 % for
lipid loads below 20 % and less than 1.5 % for the high lipid load of 40 % (Figure
16.3). Interestingly, the small lipid load of 10 % seems to cause even a slight
decrease of the friability compared to the MCC control pellets. Generally, friability is
increasing with increasing lipid load. The liquid lipid, which is adsorbed between the
solid MCC weakens the interactions between the MCC fibers. Nevertheless, the low
friability values are very encouraging.
Figure 16.3 Friability % (mean ± SD, n=3) of MCC pellets prepared with different % of self-emulsifying mixture incorporation.
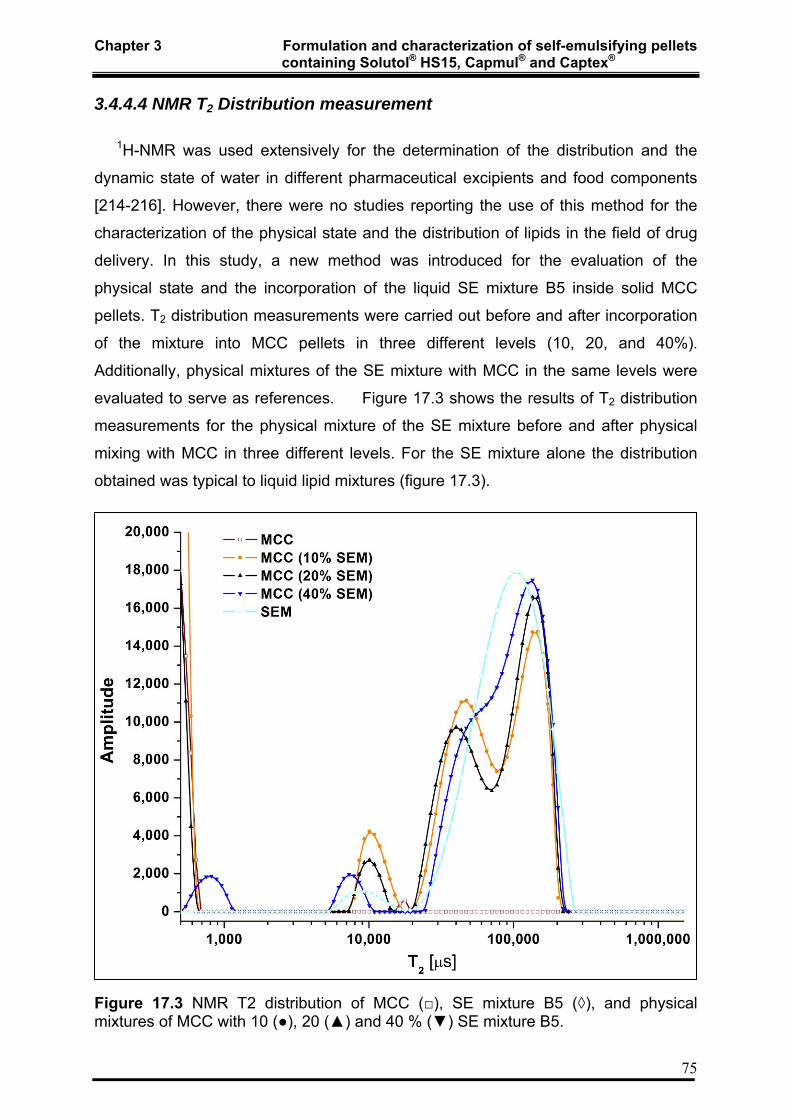
Chapter 3 Formulation and characterization of self-emulsifying pellets containing Solutol® HS15, Capmul® and Captex®
75
3.4.4.4 NMR T2 Distribution measurement
1H-NMR was used extensively for the determination of the distribution and the
dynamic state of water in different pharmaceutical excipients and food components
[214-216]. However, there were no studies reporting the use of this method for the
characterization of the physical state and the distribution of lipids in the field of drug
delivery. In this study, a new method was introduced for the evaluation of the
physical state and the incorporation of the liquid SE mixture B5 inside solid MCC
pellets. T2 distribution measurements were carried out before and after incorporation
of the mixture into MCC pellets in three different levels (10, 20, and 40%).
Additionally, physical mixtures of the SE mixture with MCC in the same levels were
evaluated to serve as references. Figure 17.3 shows the results of T2 distribution
measurements for the physical mixture of the SE mixture before and after physical
mixing with MCC in three different levels. For the SE mixture alone the distribution
obtained was typical to liquid lipid mixtures (figure 17.3).
Figure 17.3 NMR T2 distribution of MCC (□), SE mixture B5 (◊), and physical mixtures of MCC with 10 (●), 20 (▲) and 40 % (▼) SE mixture B5.

Chapter 3 Formulation and characterization of self-emulsifying pellets containing Solutol® HS15, Capmul® and Captex®
76
For the physical mixtures, T2 distribution were close to that obtained for the SE
mixture with the existence of a moderately immobilized species indicating a little
incorporation of the SE mixture into the MCC in all levels. For the pellets, dropping of
the relaxation time was observed for the 10% SE mixture loaded MCC, indicating that
the lipid mixture was strongly immobilized within the MCC matrix. As the SE mixture
load increases to 20%, the existence of more mobile species was observed. In the
pellets with 40% SEDDS, the freely moving liquid mixture was observed again and
the existence of highly (I), medium (II) and low (III) bound species was noticed
(figure 18.3). Additionally, in all the produced levels the immobilization was much
higher in pellets than that observed in the physical mixture indicating the big effect of
the extrusion/spheronization process in incorporating the SE mixture into the MCC.
Figure 18.3 NMR T2 distribution of MCC (■), SE mixture B5 (♦), and pellets with 10 (●),20 (▲)and 40 % (▼) of incorporated SE mixture B5.

Chapter 3 Formulation and characterization of self-emulsifying pellets containing Solutol® HS15, Capmul® and Captex®
77
3.4.4.5 ESR flow through experiment
The incorporation of the self-emulsifying mixture into MCC pellets might change
the physicochemical properties of the lipid phase and also the release behavior.
Therefore, the microenvironment within the pellets during the release process was
monitored continuously and non-invasively by means of a flow through experiment
using low frequency ESR spectroscopy (see section 2.3.8 for details). Additionally,
the ESR spectra of TB in different formulation components were recorded as
references (Figure 19.3). The results of the control experiment show that the mobility
of the spin probe was higher in Captex® 355 compared to that in Capmul® MCM and
Solutol® HS15. Moreover, TB mobility in the self-emulsifying mixture was higher than
that in self-emulsifying pellets due to the partial immobilization of the self-emulsifying
mixture within MCC.
Figure 19.3 ESR spectra of TB in different formulation components and mixtures, reflecting the sensitivity of the line shape (right) and rotational correlation time (left) to the viscosity of different media.
The spectral line shape changes progressively when the nitroxide mobility
changes from a free rotation, with a rotational correlation time (τR) of the order of 0.01
ns, to that of a restricted mobility with τR more than 1 µs. Immediately after pellets
exposure to the dissolution media inside the flow cell, the mobility of the spin probe
changed rapidly within the first 5 minutes and was comparable to that in the free self-
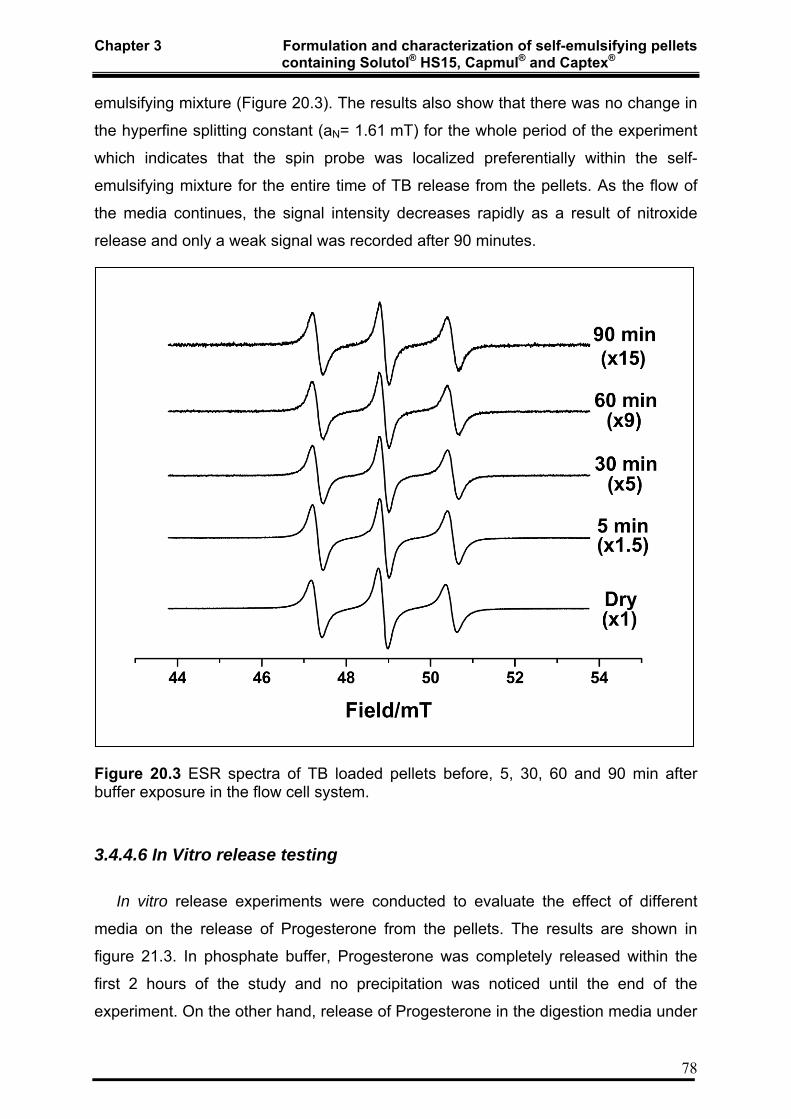
Chapter 3 Formulation and characterization of self-emulsifying pellets containing Solutol® HS15, Capmul® and Captex®
78
emulsifying mixture (Figure 20.3). The results also show that there was no change in
the hyperfine splitting constant (aN= 1.61 mT) for the whole period of the experiment
which indicates that the spin probe was localized preferentially within the self-
emulsifying mixture for the entire time of TB release from the pellets. As the flow of
the media continues, the signal intensity decreases rapidly as a result of nitroxide
release and only a weak signal was recorded after 90 minutes.
Figure 20.3 ESR spectra of TB loaded pellets before, 5, 30, 60 and 90 min after buffer exposure in the flow cell system.
3.4.4.6 In Vitro release testing
In vitro release experiments were conducted to evaluate the effect of different
media on the release of Progesterone from the pellets. The results are shown in
figure 21.3. In phosphate buffer, Progesterone was completely released within the
first 2 hours of the study and no precipitation was noticed until the end of the
experiment. On the other hand, release of Progesterone in the digestion media under
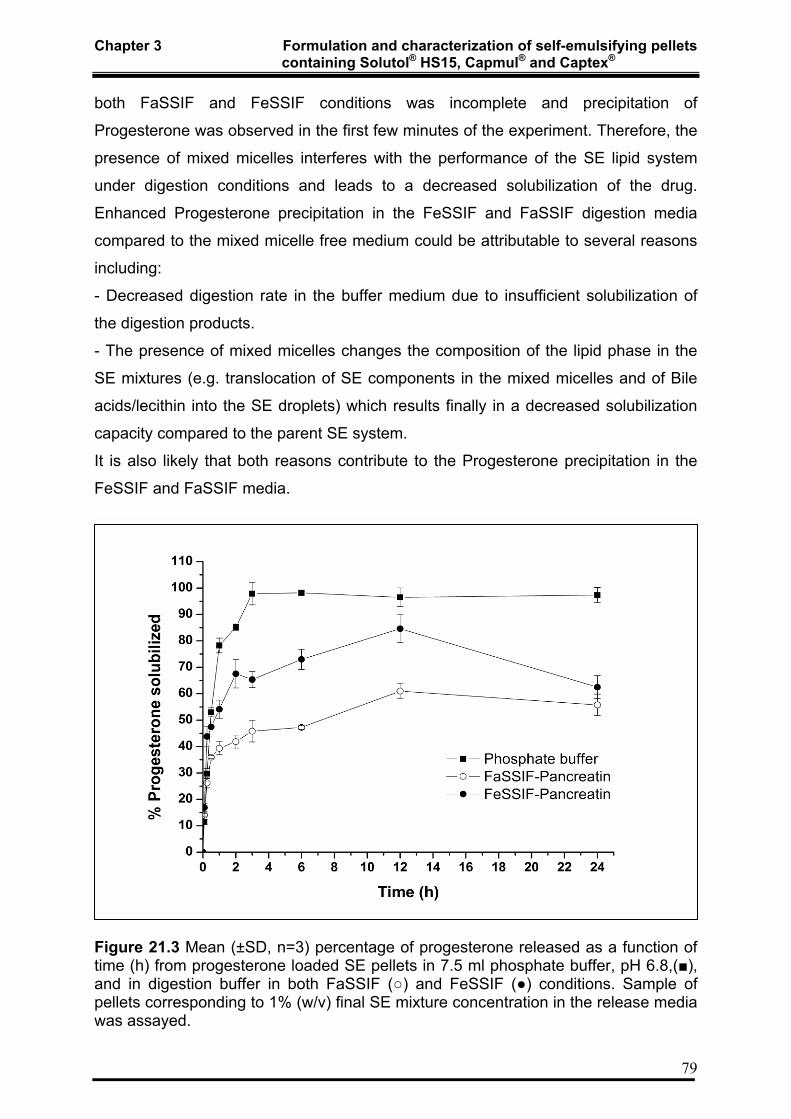
Chapter 3 Formulation and characterization of self-emulsifying pellets containing Solutol® HS15, Capmul® and Captex®
79
both FaSSIF and FeSSIF conditions was incomplete and precipitation of
Progesterone was observed in the first few minutes of the experiment. Therefore, the
presence of mixed micelles interferes with the performance of the SE lipid system
under digestion conditions and leads to a decreased solubilization of the drug.
Enhanced Progesterone precipitation in the FeSSIF and FaSSIF digestion media
compared to the mixed micelle free medium could be attributable to several reasons
including:
- Decreased digestion rate in the buffer medium due to insufficient solubilization of
the digestion products.
- The presence of mixed micelles changes the composition of the lipid phase in the
SE mixtures (e.g. translocation of SE components in the mixed micelles and of Bile
acids/lecithin into the SE droplets) which results finally in a decreased solubilization
capacity compared to the parent SE system.
It is also likely that both reasons contribute to the Progesterone precipitation in the
FeSSIF and FaSSIF media.
Figure 21.3 Mean (±SD, n=3) percentage of progesterone released as a function of time (h) from progesterone loaded SE pellets in 7.5 ml phosphate buffer, pH 6.8,(■), and in digestion buffer in both FaSSIF (○) and FeSSIF (●) conditions. Sample of pellets corresponding to 1% (w/v) final SE mixture concentration in the release media was assayed.

Chapter 3 Formulation and characterization of self-emulsifying pellets containing Solutol® HS15, Capmul® and Captex®
80
3.5 Conclusion
Stable isotropic SE mixtures have been formulated using a mixture of medium
chain mono- and di-glycerides, medium chain triglycerides, and Solutol® HS 15 as a
surfactant. The droplet sizes after dilution decreased with increasing Solutol® HS 15
content and were lower for more polar lipid mixtures (e.g. increased ratio of partial
glycerides compared to triglycerides). SE mixtures are able to solubilize
progesterone in buffer. The results have shown the potential advantages of using
ESR spectroscopy to asses the micropolarity within the emulsion droplet of diluted
SE mixtures. This can help in developing an optimum mixture for a certain drug in
order to achieve a compromise between solubilization of the drug and its distribution
into the aqueous media of the GIT after dispersion. After dilution of different spin
probe loaded self-emulsifying mixtures, ESR spectra with a splitting of third line were
obtained. This indicates the availability of two environments, a lipophilic highly
viscous environment and a very hydrophilic environment with low viscosity.
Digestion of the lipid phase decreases the solubilization capacity for
progesterone. It was also shown that the solubilization capacity strongly depends on
the concentration of endogenously secreted materials such as BS and PL. A change
in the localization of the spin probe was noticed as the digestion process starts. This
can be explained by the enzymatic hydrolysis of the formulation triglycerides resulting
in the formation of fatty acids and monoglycerides. In the presence of endogenous
materials like bile salts, phospholipids and cholesterol, fatty acids and
monoglycerides are then incorporated into different phases with different polarity and
viscosity. The spin probe was localized either in polar colloidal structures like mixed
micelles or in less polar structures like vesicles or liquid crystalline phases. The
change in the lipid composition associated with digestion of lipid based formulations
could affect the solubilization capacity of the administered drug. Therefore, applying
in vitro digestion experiments for lipid formulations is important to enable prediction of
the possible fate of the co-administered drug.
The liquid lipid SE mixture was successfully transformed into solid pellets by
means of extrusion/spheronization with a maximum load of 40%. The pellets had a
uniform size, a spherical shape and low friability. ESEM pictures show the adsorption
of the liquid oil between the MCC fibers. Moreover, the self-emulsifying properties are

Chapter 3 Formulation and characterization of self-emulsifying pellets containing Solutol® HS15, Capmul® and Captex®
81
still preserved in the pellets. Therefore, extrusion/spheronization of SEDDS systems
is an alternative to encapsulation in gelatine capsules.
The NMR results have shown the potential advantages of using NMR T2
distribution measurements for the characterization of lipids. A higher degree of
immobilization was achieved with the pellets formulated using extrusion
/spheronization compared to the physical mixtures of the SE mixture and MCC.
Results of the ESR flow through experiment show that the mobility of the spin
probe in the pellets increased rapidly from partial immobilization within the dry pellets
to high mobility, compared to that in the free self-emulsifying mixture, after the
exposure to the buffer. It was also shown that the spin probe was localized within the
self-emulsifying mixture during the release process from the pellets.

Chapter 4 Summary
82
4 Summary
4.1 English version The idea of combining advantages of pellets, as a solid multiparticulate drug
delivery system, and SEDDS, which was successfully used to improve bioavailability
of lipophilic drugs, was the main motive behind the current research work. Two
different self-emulsifying systems have been developed for testing the feasibility of
incorporating them into MCC pellets by means of extrusion/spheronization.
The first self-emulsifying mixture was composed of a mixture of Cithrol GMS (C18
mono- and di-glycerides) and Solutol HS15. This mixture was incorporated into MCC
and pellets were produced using Extrusion/spheronization technique. Furthermore,
reference pellets containing GMS and MCC were formulated. Pellets were
characterized for size, shape, friability and dissolution for diazepam loaded pellets. In
addition, nitroxide loaded pellets were produced and the microenvironment inside the
pellets during the release process was monitored in an online process using ESR
spectroscopy. Results demonstrated the possibility of producing self-emulsifying
pellets containing 50% of the Self-emulsifying mixture. The produced pellets were of
good physical properties concerning shape, size distribution and friability. In contrast
to GMS-MCC pellets, they were able to introduce the lipophilic dyes or drugs into the
aqueous phase of the dissolution media. This shows that GMS alone is not self-
emulsifying and solutol addition was necessary to achieve self-emulsification
properties. The ESR results show that the lipophilic spin probe was mainly localized
in the lipid environment inside the pellets for the whole release period. The release
data showed a noticeable improvement in the in vitro dissolution of diazepam in
comparison with the non-emulsifying formulation. Additionally, a supersaturated state
for the water soluble diazepam was achieved and maintained in a dissolution study
with a higher diazepam load.
The second self-emulsifying mixture was composed of a mixture of medium chain
mono- and di-glycerides (Capmul®), medium chain tri-glycerides mixture (Captex®)
and Solutol® HS15. Self-emulsifying mixtures with different composition were
formulated and droplet diameter of the emulsion resulted from the dilution of SE
mixtures were measured using PCS. ESR was used to monitor the microenvironment
of the diluted mixtures and to evaluate the polarity of emulsion droplets. Additionally,

Chapter 4 Summary
83
in vitro digestion experiments were carried out to asses the change in the
solubilization capacity of progesterone after dilution and enzymatic digestion of self-
emulsifying mixtures in simulated intestinal fluids in both the fasted and the fed state.
In vitro digestion was also monitored by ESR spectroscopy to have an insight on the
characteristics of the different phases formed during digestion process and to
evaluate the distribution and localization of the nitroxide spin probe TB in these
phases. Self-emulsifying mixture that combines good emulsification properties,
acceptable solubilization of the model drug and optimum surfactant concentration
was then incorporated into MCC and self-emulsifying pellets were produced by
means of extrusion/spheronization. The formulated pellets were then characterized
for size and shape. Furthermore, NMR T2 distribution measurements were carried
out to evaluate the incorporation of different levels of self-emulsifying mixture into
MCC pellets. TB loaded self-emulsifying pellets were produced and an ESR flow
through experiment was carried out to monitor the microenvironment within pellets
during the release process. Dissolution experiment was designed to evaluate the
release of progesterone from pellets in different release media. The results show that
the optical clarity and droplet diameter of the dispersed SE mixtures were largely
affected by changing oil to Solutol ratio. The percent of TB localized in the lipophilic
environment of the diluted self-emulsifying mixture was decreasing with increasing
the surfactant fraction. Different phases with variable viscosity and polarity have been
resulted from the digestion of SE mixtures. This leads to a change in the
solubilization capacity of progesterone. Pellets with good properties, concerning size
and shape, have been produced through the incorporation of a selected SE mixture
into MCC. NMR T2 distribution measurements showed that as the lipid load increases
the existence of highly, medium and low bound species was noticed within pellets.

Chapter 4 Summary
84
4.1 German version
Die Motivation für diese Arbeit war es, die Vorteile von selbstemulgierenden Drug-
Delivery-Systemen (SEDDS), die zur Verbesserung der Bioverfügbarkeit
schwerlöslicher Arzneistoffe verwendet werden, mit den Vorteilen von Pellets als
feste multipartikuläre Drug-Delivery-Systeme zu kombinieren,. Zwei verschiedene
selbstemulgierende Systeme wurden entwickelt, um zu untersuchen, ob sie durch
Extrusion/ Spheronisation in MCC-Pellets eingebaut werden können.
Das erste selbstemulgierende System bestand aus Cithrol GMS (C18-Mono- und
Diglyceride) und Solutol HS15. Diese Mischung wurde in MCC eingearbeitet und
dann zur Herstellung von Pellets nach der Extrusions-/ Spheronisationsmethode
verwendet. Weiterhin wurden Referenz-Pellets hergestellt, welche nur Cithrol GMS
und MCC enthielten. Die Pellets wurden hinsichtlch ihrer Größe, Gestalt und ihres
Abriebs untersucht. Für die mit Diazepam beladenen Pellets wurden Freisetzungs-
Tests durchgeführt. Zusätzlich wurden auch Pellets hergestellt, die eine Nitroxid-
Spinsonde als Modellarzneistoff enthielten. Mit Hilfe der ESR Spektroskopie war es
so möglich, das Mikromilieu innerhalb der Pellets während des gesamten
Freisetzungsprozesses zu untersuchen.
Die Ergebnisse dieser Untersuchungen zeigten, dass es möglich ist
selbstemulgierende Pellets mit einem Anteil von 50 % des selbstemulgierenden
Systems herzustellen. Die hergestellten Pellets hatten eine gute Qualität zeichneten
sich durch eine homogene Größe, sphärische Gestalt und geringen Abrieb aus. Im
Gegensatz zu den GMS-MCC-Pellets waren sie in der Lage, die lipophile Spinsonde
und Diazepam in das wässrige Freisetzungsmedium freizusetzen. Daraus folgt, dass
die Zugabe von Solutol HS15 notwendig ist, um ein selbstemulgierendes System zu
erhalten.
Die ESR-Daten ergaben, dass die lipophile Spinsonde während der gesamten
Freisetzungsperiode hauptsächlich in den hydrophoben Bereichen innerhalb der
Pellets lokalisiert ist. Durch die Freisetzungsversuche mit den Diazepam beladenen
Pellets konnte gezeigt werden, dass die in-vitro Freisetzung von Diazepam deutlich?
verbessert wurde im Vergleich zu nichtemulgierenden Systemen. Durch Verwendung
höherer Diazepam-Konzentrationen war es sogar möglich, einen übersättigten
Zustand für Diazepam in Wasser zu erreichen und diesen über den
Freisetzungszeitraum zu erhalten.

Chapter 4 Summary
85
Das zweite selbstemulgierende System enthielt ein Gemisch aus mittelkettigen
Mono- und Diglyceriden (Capmul®), mittelkettigen Triglyceriden (Captex®) und Solutol
HS15. Selbstemulgierende Systeme mit unterschiedlicher Zusammensetzung
wurden hergestellt. Die jeweils nach Verdünnung resultierenden Tröpfchengrößen
wurden mittels Photonenkorrelationsspektroskopie (PCS) bestimmt. Durch ESR
Spektroskopie war es möglich die Polaritätsverhältnisse in diesen
Emulsionssystemen zu bestimmen.
Außerdem wurden in-vitro Verdauungsexperimente durchgeführt, um zu untersuchen
ob die Solubilisierung von Progesteron durch Verdünnung und enzymatische
Verdauung der selbstemulgierenden Systeme in simulierten intestinalen
Flüssigkeiten (im nüchternen und postprandialen Zustand) beeinflusst wird. Der
Verdauungsprozess wurde auch durch ESR Spektroskopie beobachtet, um einen
Einblick in die Eigenschaften der verschiedenen Phasen zu erhalten, die sich beim
Verdauungsprozess bilden. Außerdem wurde das Verteilungsverhalten und die
bevorzugte Lokalisation der Spinsonde Tempolbenzoat (TB) in diesen Phasen
untersucht.
Die Lipidsysteme, die sowohl gute selbstemulgierende Eigenschaften, als auch
ausreichende Arzneistoff-Solubilisation und optimale Tensid-Konzentration
aufwiesen, wurden ausgewählt und zusammen mit MCC zu selbstemulgierenden
Pellets verarbeitet. Diese Pellets wurden hinsichtlich Gestalt und Größe untersucht.
Außerdem wurden mittels 1H-NMR T2-Relaxationszeitverteilungen bestimmt, um die
Inkorporation des selbstemulgierenden Systems in die MCC-Pellets zu untersuchen.
Selbstemulgierende Pellets, die TB als Modellarzneistoff enthielten, wurden
hergestellt und für Freisetzungsversuche mittles einer ESR-Durchflusszelle
verwendet. Außerdem wurde auch die Freisetzung von Progesteron aus den Pellets
in verschiedenen Freisetzungsmedien untersucht. Die Ergebnisse zeigen, dass die
optische Transparenz und die Tröpfchengröße der dispergierten SE-Systeme stark
vom Verhältnis zwischen Öl und Solutol abhängen. Ein steigender Anteil an Solutol
führte zu einem höheren Prozentsatz an TB in der hydrophilen Phase innerhalb des
dispergierten selbstemulgierenden Systems. Verdauungsprozesse führen zu einer
Bildung verschiedener Phasen, die sich hinsichtlich ihrer Viskosität und Polarität
unterscheiden lassen. Dadurch kommt es zu einer Veränderung in der
Solubilisierungskapazität für Progesteron.

Chapter 4 Summary
86
Einige selbstemulgierende Systeme wurde ausgewählt und nach Mischen mit MCC
dazu verwendet, Pellets mit guten Eigenschaften hinsichtlich Größe und Gestalt
herzustellen. NMR Relaxationszeitmessungen zur Bestimmung von T2 Verteilungen
zeigten, dass mit steigender Lipidkonzentration stark, mittel und schwach gebundene
Lipidanteile nachweisbar sind.
References
87
5. References
[1] C.A. Lipinski. Drug-like properties and the causes of poor solubility and poor
permeability. J. Pharmacol. Toxicol. Meth. 44:235-249 (2000).
[2] D. Horter and J.B. Dressman. Influence of physicochemical properties on dissolution
of drugs in the gastrointestinal tract. Adv. Drug Deliv. Rev. 25:3-14 (1997).
[3] C.A. Lipinski, F. Lombardo, B.W. Dominy, and P.J. Feeney. Experimental and
computational approaches to estimate solubility and permeability in drug discovery
and development settings. Adv. Drug Deliv. Rev. 23:3-25 (1997).
[4] C.A. Lipinski, F. Lombardo, B.W. Dominy, and P.J. Feeney. Experimental and
computational approaches to estimate solubility and permeability in drug discovery
and development settings. Adv. Drug Deliv. Rev. 46:3-26 (2001).
[5] M. Gibaldi, S. Feldman, and N.D. Weiner. Hydrodynamic and diffusional
considerations in assessing effects of surface active agents on dissolution rate of
drugs. Chem. Pharmaceut. Bull. 18:715-723 (1970).
[6] C.W. Pouton. Formulation of poorly water-soluble drugs for oral administration:
Physicochemical and physiological issues and the lipid formulation classification
system. Eur. J. Pharm. Sci. 29:278-287 (2006).
[7] M. Gibaldi and S. Feldman. Mechanisms of surfactant effects on drug absorption. J.
Pharm. Sci. 59:579-589 (1970).
[8] M. Gibaldi. Introduction to biopharmaceutics, Lea & Febiger 1971.
[9] L.X. Yu, G.L. Amidon, J.E. Polli, H. Zhao, M.U. Mehta, D.P. Conner, V.P. Shah, L.J.
Lesko, M.L. Chen, V.H.L. Lee, and A.S. Hussain. Biopharmaceutics classification
system: The scientific basis for biowaiver extensions. Pharm. Res. 19:921-925 (2002).
[10] S. Pinnamaneni, N.G. Das, and S.K. Das. Formulation approaches for orally
administered poorly soluble drugs. Pharmazie. 57:291-300 (2002).
[11] J.C. Chaumeil. Micronization: A method of improving the bioavailability of poorly
soluble drugs. Meth. Find. Exp. Clin. Pharmacol. 20:211-215 (1998).

References
88
[12] G.T. Mcinnes, M.J. Asbury, L.E. Ramsay, J.R. Shelton, and I.R. Harrison. Effect of
micronization on the bioavailability and pharmacologic activity of spironolactone. J.
Clin. Pharmacol. 22:410-417 (1982).
[13] R.H. Muller, C. Jacobs, and O. Kayser. Nanosuspensions as particulate drug
formulations in therapy rationale for development and what we can expect for the
future. Adv. Drug Deliv. Rev. 47:3-19 (2001).
[14] V.B. Patravale, A.A. Date, and R.M. Kulkarni. Nanosuspensions: A promising drug
delivery strategy. J. Pharm. Pharmacol. 56:827-840 (2004).
[15] D. Duchene and G. Ponchel. Bioadhesion of solid oral dosage forms, why and how?
Eur. J. Pharm. Biopharm. 44:15-23 (1997).
[16] C. Nyström. Dissolution properties of soluble drugs: Theoretical background and
possibilities to improve the dissolution behaviour. In R.H. Müller, S. Benita, and B.
Böhm (eds.), Emulsions and nanosuspensions for the formulation of poorly soluble
drugs, Medpharm Scientific Publishers, Stuttgart, 1998, p. 143.
[17] E. MeriskoLiversidge, P. Sarpotdar, J. Bruno, S. Hajj, L. Wei, N. Peltier, J. Rake, J.M.
Shaw, S. Pugh, L. Polin, J. Jones, T. Corbett, E. Cooper, and G.G. Liversidge.
Formulation and antitumor activity evaluation of nanocrystalline suspensions of
poorly soluble anticancer drugs. Pharm. Res. 13:272-278 (1996).
[18] E. Merisko-Liversidge, G.G. Liversidge, and E.R. Cooper. Nanosizing: A formulation
approach for poorly-water-soluble compounds. Eur. J. Pharm. Sci.18:113-120 (2003).
[19] P. Gassmann, M. List, A. Schweitzer, and H. Sucker. Hydrosols - alternatives for the
parenteral application of poorly water-soluble drugs. Eur. J. Pharm. Biopharm. 40:64-
72 (1994).
[20] C. Jacobs, O. Kayser, and R.H. Muller. Nanosuspensions as a new approach for the
formulation for the poorly soluble drug tarazepide. Int. J. Pharm. 196:161-164 (2000).
[21] C. Jacobs, O. Kayser, and R.H. Muller. Production and characterisation of
mucoadhesive nanosuspensions for the formulation of bupravaquone. Int. J. Pharm.
214:3-7 (2001).
[22] O. Kayser. A new approach for targeting to cryptosporidium parvum using
mucoadhesive nanosuspensions: Research and applications. Int. J. Pharm. 214:83-85
(2001).
References
89
[23] S.R. Vippagunta, H.G. Brittain, and D.J.W. Grant. Crystalline solids. Adv. Drug Deliv.
Rev. 48:3-26 (2001).
[24] J. Haleblia and W. McCrone. Pharmaceutical applications of polymorphism. J. Pharm.
Sci. 58:911-929 (1969).
[25] S. Agatonovic-Kustrin, V. Wu, T. Rades, D. Saville, and I.G. Tucker. Powder
diffractometric assay of two polymorphic forms of ranitidine hydrochloride. Int. J.
Pharm. 184:107-114 (1999).
[26] A.M. Kaushal, P. Gupta, and A.K. Bansal. Amrphous drug delivery systems:
Molecular aspects, design, and performance. Crit. Rev. Ther. Drug Carrier Syst.
21:133-193 (2004).
[27] A.H. Goldberg, M. Gibaldi, J.L. Kanig, and Mayersoh.M. Increasing dissolution rates
and gastrointestinal absorption of drugs via solid solutions and eutectic mixtures .4.
Chloramphenicol-urea system. J. Pharm. Sci. 55:581-583 (1966).
[28] V. Andronis and G. Zografi. Molecular mobility of supercooled amorphous
indomethacin, determined by dynamic mechanical analysis. Pharm. Res. 14:410-414
(1997).
[29] C. Leuner and J. Dressman. Improving drug solubility for oral delivery using solid
dispersions. Eur. J. Pharm. Biopharm. 50:47-60 (2000).
[30] J. Breitenbach. Melt extrusion: From process to drug delivery technology. Eur. J.
Pharm. Biopharm. 54:107-117 (2002).
[31] M. Mayersoh and M. Gibaldi. New method of solid-state dispersion for increasing
dissolution rates. J. Pharm. Sci. 55:1323-1324 (1966).
[32] A.H. Goldberg, M. Gibaldi, and J.L. Kanig. Increasing dissolution rates and
gastrointestinal absorption of drugs via solid solutions and eutectic mixtures .3.
Experimental evaluation of griseofulvin-succinic acid solid solution. J. Pharm. Sci.
55:487-492 (1966).
[33] A.H. Goldberg, M. Gibaldi, and J.L. Kanig. Increasing dissolution rates and
gastrointestinal absorption of drugs via solid solutions and eutectic mixtures .2.
Experimental evaluation of a eutectic mixture - urea-acetaminophen system. J. Pharm.
Sci. 55:482-487 (1966).

References
90
[34] G.V. Betageri and S.R. Dipali. Preparation and in-vitro dissolution profiles of
tolazamide-polyethylene glycol solid dispersions. Drug Dev. Ind. Pharm. 21:1347-
1352 (1995).
[35] V.L. Bassani, D. Krieger, D. Duchene, and D. Wouessidjewe. Enhanced water-
solubility of albendazole by hydroxypropyl-beta-cyclodextrin complexation. Journal
of Inclusion Phenomena and Molecular Recognition in Chemistry. 25:149-152 (1996).
[36] A.A. Rasool, A.A. Hussain, and L.W. Ditter. Solubility enhancement of some water-
insoluble drugs in the presence of nicotinamide and related-compounds. J. Pharm. Sci.
80:387-393 (1991).
[37] L. Szente and J. Szejtli. Highly soluble cyclodextrin derivatives: Chemistry,
properties, and trends in development. Adv. Drug Deliv. Rev. 36:17-28 (1999).
[38] P. Montassier, D. Duchene, and M.C. Poelman. Inclusion complexes of tretinoin with
cyclodextrins. Int. J. Pharm. 153:199-209 (1997).
[39] J.W. Wong and K.H. Yuen. Improved oral bioavailability of artemisinin through
inclusion complexation with beta- and gamma-cyclodextrins. Int. J. Pharm. 227:177-
185 (2001).
[40] S. Chakrabarti and F.M. Belpaire. Bioavailability of phenytoin in lipid containing
dosage forms in rats. J. Pharm. Pharmacol. 30:330-331 (1978).
[41] T. Tokumura, Y. Tsushima, K. Tatsuishi, M. Kayano, Y. Machida, and T. Nagai.
Enhancement of the oral bioavailability of cinnarizine in oleic-acid in beagle dogs. J.
Pharm. Sci. 76:286-288 (1987).
[42] A.K. Trull, K.K.C. Tan, L. Tan, G.J.M. Alexander, and N.V. Jamieson. Absorption of
cyclosporine from conventional and new microemulsion oral formulations in liver-
transplant recipients with external biliary diversion. Br. J. Clin. Pharmacol. 39:627-
631 (1995).
[43] C.W. Pouton. Lipid formulations for oral administration of drugs: Non-emulsifying,
self-emulsifying and 'self-microemulsifying' drug delivery systems. Eur. J. Pharm.
Sci. 11:S93-S98 (2000).
[44] A.J. Humberstone and W.N. Charman. Lipid-based vehicles for the oral delivery of
poorly water soluble drugs. Adv. Drug Deliv. Rev. 25:103-128 (1997).

References
91
[45] C.J.H. Porter, N.L. Trevaskis, and W.N. Charman. Lipids and lipid-based
formulations: Optimizing the oral delivery of lipophilic drugs. Nature Reviews Drug
Discovery. 6:231-248 (2007).
[46] R.G. Strickley. Solubilizing excipients in oral and injectable formulations. Pharm.
Res. 21:201-230 (2004).
[47] L.J. Naylor, V. Bakatselou, and J.B. Dressman. Comparison of the mechanism of
dissolution of hydrocortisone in simple and mixed micelle systems. Pharm. Res.
10:865-870 (1993).
[48] L.J. Naylor, V. Bakatselou, N. RodriguezHornedo, N.D. Weiner, and J.B. Dressman.
Dissolution of steroids in bile salt solutions is modified by the presence of lecithin.
Eur. J. Pharm. Biopharm. 41:346-353 (1995).
[49] J.B. Dressman, M. Vertzoni, K. Goumas, and C. Reppas. Estimating drug solubility in
the gastrointestinal tract. Adv. Drug Deliv. Rev. 59:591-602 (2007).
[50] T.S. Wiedmann, W. Liang, and L. Kamel. Solubilization of drugs by physiological
mixtures of bile salts. Pharm. Res. 19:1203-1208 (2002).
[51] T.S. Wiedmann and L. Kamel. Examination of the solubilization of drugs by bile salt
micelles. J. Pharm. Sci. 91:1743-1764 (2002).
[52] M.G. Wakerly, C.W. Pouton, B.J. Meakin, and F.S. Morton. Self-emulsification of
vegetable oil-nonionic surfactant mixtures - a proposed mechanism of action. Acs
Symposium Series. 311:242-255 (1986).
[53] S.A. Charman, W.N. Charman, M.C. Rogge, T.D. Wilson, F.J. Dutko, and C.W.
Pouton. Self-emulsifying drug delivery systems - formulation and biopharmaceutic
evaluation of an investigational lipophilic compound. Pharm. Res. 9:87-93 (1992).
[54] N.H. Shah, M.T. Carvajal, C.I. Patel, M.H. Infeld, and A.W. Malick. Self-emulsifying
drug-delivery systems (sedds) with polyglycolyzed glycerides for improving in-vitro
dissolution and oral absorption of lipophilic drugs. Int. J. Pharm. 106:15-23 (1994).
[55] D.Q.M. Craig, H.S.R. Lievens, K.G. Pitt, and D.E. Storey. An investigation into the
physicochemical properties of self-emulsifying systems using low-frequency
dielectric-spectroscopy, surface-tension measurements and particle-size analysis. Int.
J. Pharm. 96:147-155 (1993).

References
92
[56] R.N. Gursoy and S. Benita. Self-emulsifying drug delivery systems (sedds) for
improved oral delivery of lipophilic drugs. Biomed. Pharmacother. 58:173-182
(2004).
[57] C.W. Pouton. Self-emulsifying drug delivery systems - assessment of the efficiency of
emulsification. Int. J. Pharm. 27:335-348 (1985).
[58] C.W. Pouton. Effects of the inclusion of a model drug on the performance of self-
emulsifying formulations J. Pharm. Pharmacol. 37:1P (1985).
[59] M. Kimura, M. Shizuki, K. Miyoshi, T. Sakai, H. Hidaka, H. Takamura, and T.
Matoba. Relationship between the molecular-structures and emulsification properties
of edible oils. Biosci. Biotechnol. Biochem. 58:1258-1261 (1994).
[60] D.J. Hauss, S.E. Fogal, J.V. Ficorilli, C.A. Price, T. Roy, A.A. Jayara, and J.J. Keirns.
Lipid-based delivery systems for improving the bioavailability and lymphatic
transport of a poorly water-soluble ltb4 inhibitor. J. Pharm. Sci. 87:164-169 (1998).
[61] M.J. Groves and D.A. Degalindez. Self-emulsifying action of mixed surfactants in oil.
Acta Pharm. Suecica. 13:361-372 (1976).
[62] M. Sekine, E. Maeda, K. Sasahara, R. Okada, K. Kimura, M. Fukami, and S. Awazu.
Improvement of bioavailability of poorly absorbed drugs .3. Oral acute toxicity and
local irritation of medium chain glyceride. J. Pharmacobio-Dynam. 8:633-644 (1985).
[63] E.S. Swenson and W.J. Curatolo. Intestinal permeability enhancement for proteins,
peptides and other polar drugs - mechanisms and potential toxicity .2. Adv. Drug
Deliv. Rev. 8:39-92 (1992).
[64] C.W. Pouton. Formulation of self-emulsifying drug delivery systems. Adv. Drug
Deliv. Rev. 25:47-58 (1997).
[65] T. Lindmark, T. Nikkila, and P. Artursson. Mechanisms of absorption enhancement by
medium-chain fatty-acids in intestinal epithelial caco-2 cell monolayers. J.
Pharmacol. Exp. Therapeut. 275:958-964 (1995).
[66] T. Gershanik and S. Benita. Self-dispersing lipid formulations for improving oral
absorption of lipophilic drugs. Eur. J. Pharm. Biopharm. 50:179-188 (2000).
[67] W.N. Charman and V.J. Stella. Transport of lipophilic molecules by the intestinal
lymphatic-system. Adv. Drug Deliv. Rev. 7:1-14 (1991).

References
93
[68] R. Holm, C.J.H. Porter, A. Mullertz, H.G. Kristensen, and W.N. Charman. Structured
triglyceride vehicles for oral delivery of halofantrine: Examination of intestinal
lymphatic transport and bioavailability in conscious rats. Pharm. Res. 19:1354-1361
(2002).
[69] R. Holm, C.J.H. Porter, G.A. Edwards, A. Mullertz, H.G. Kristensen, and W.N.
Charman. Examination of oral absorption and lymphatic transport of halofantrine in a
triple-cannulated canine model after administration in self-microemulsifying drug
delivery systems (smedds) containing structured triglycerides. Eur. J. Pharm. Sci.
20:91-97 (2003).
[70] J.M. Kovarik, E.A. Mueller, J.B. Vanbree, W. Tetzloff, and K. Kutz. Reduced
interindividual and intraindividual variability in cyclosporine pharmacokinetics from a
microemulsion formulation. J. Pharm. Sci. 83:444-446 (1994).
[71] P.P. Constantinides, J.P. Scalart, C. Lancaster, J. Marcello, G. Marks, H. Ellens, and
P.L. Smith. Formulation and intestinal-absorption enhancement evaluation of water-
in-oil microemulsions incorporating medium-chain glycerides. Pharm. Res. 11:1385-
1390 (1994).
[72] P.P. Constantinides, C.M. Lancaster, J. Marcello, D.C. Chiossone, D. Orner, I.
Hidalgo, P.L. Smith, A.B. Sarkahian, S.H. Yiv, and A.J. Owen. Enhanced intestinal-
absorption of an rgd peptide from water-in-oil microemulsions of different
composition and particle-size. J. Control. Release. 34:109-116 (1995).
[73] M. Sekine, H. Terashima, K. Sasahara, K. Nishimura, R. Okada, and S. Awazu.
Improvement of bioavailability of poorly absorbed drugs .2. Effect of medium chain
glyceride base on the intestinal-absorption of cefmetazole sodium in rats and dogs. J.
Pharmacobio-Dynam. 8:286-295 (1985).
[74] M. Sekine, K. Sasahara, R. Okada, and S. Awazu. Improvement of bioavailability of
poorly absorbed drugs .4. Mechanism of the promoting effect of medium chain
glyceride on the rectal absorption of water-soluble drugs. J. Pharmacobio-Dynam.
8:645-652 (1985).
[75] J. Unowsky, C.R. Behl, G. Beskid, J. Sattler, J. Halpern, and R. Cleeland. Effect of
medium chain glycerides on enteral and rectal absorption of beta-lactam and
aminoglycoside antibiotics. Chemotherapy. 34:272-276 (1988).

References
94
[76] G. Beskid, J. Unowsky, C.R. Behl, J. Siebelist, J.L. Tossounian, C.M. Mcgarry, N.H.
Shah, and R. Cleeland. Enteral, oral, and rectal absorption of ceftriaxone using
glyceride enhancers. Chemotherapy. 34:77-84 (1988).
[77] P.P. Constantinides. Lipid microemulsions for improving drug dissolution and oral
absorption - physical and biopharmaceutical aspects. Pharm. Res. 12:1561-1572
(1995).
[78] T.R. Kommuru, B. Gurley, M.A. Khan, and I.K. Reddy. Self-emulsifying drug
delivery systems (SEDDS) of coenzyme Q(10): Formulation development and
bioavailability assessment. Int. J. Pharm. 212:233-246 (2001).
[79] G. Buckton. Surfactants. In G. Buckton (ed.), Interfacial phenomena in drug delivery
and targeting, Harwood academic publishers, Chur, 1995, pp. 135-161.
[80] D.W. Osborne, C.A. Middleton, and R.L. Rogers. Alcohol-free microemulsions.
Journal of Dispersion Science and Technology. 9:415-423 (1988).
[81] G.M. Eccleston. Microemulsions. In J. Swarbrickand J.C. Boylan (eds.), Encyclopedia
of pharmaceutical technology, Vol. 9, Marcel Dekker, New York, 1992, pp. 375-421.
[82] D. Attwood. Microemulsions. In J. Kreuter (ed.), Colloidal drug delivery systems,
Marcel Dekker, New York, 1994, pp. 31-71.
[83] M.G. Wakerly, C.W. Pouton, B.J. Meakin, and F.S. Morton. The effect of surfactant
hlb on the self-emulsifying efficiency of nonionic surfactant-vegetable oil mixture. J.
Pharm. Pharmacol. 38:2P (1986).
[84] A.T.M. Serajuddin, P.C. Sheen, D. Mufson, D.F. Bernstein, and M.A. Augustine.
Effect of vehicle amphiphilicity on the dissolution and bioavailability of a poorly
water-soluble drug from solid dispersions. J. Pharm. Sci. 77:414-417 (1988).
[85] D.W. Holt, E.A. Mueller, J.M. Kovarik, J.B. Vanbree, and K. Kutz. The
pharmacokinetics of sandimmun-neoral - a new oral formulation of cyclosporine.
Transplant. Proc. 26:2935-2939 (1994).
[86] E.A. Mueller, J.M. Kovarik, J.B. Vanbree, W. Tetzloff, J. Grevel, and K. Kutz.
Improved dose linearity of cyclosporine pharmacokinetics from a microemulsion
formulation. Pharm. Res. 11:301-304 (1994).
[87] L. Vernillet, J.M. Kovarik, R. Freiburghaus, P. Schaub, E.A. Mueller, W.
Niederberger, and H. Zehender. Blood cyclosporine-A and metabolite kinetic profiles

References
95
after administration of sandimmune soft gelatin capsules and neoral in transplant
recipients. Transplant. Proc. 26:2964-2968 (1994).
[88] J. Vonderscher and A. Meinzer. Rationale for the development of sandimmune-neoral.
Transplant. Proc. 26:2925-2927 (1994).
[89] M.Y. Levy and S. Benita. Drug release from submicronized o/w emulsion - a new
invitro kinetic evaluation model. Int. J. Pharm. 66:29-37 (1990).
[90] M.G. Wakerly, C.W. Pouton, and B.J. Meakin. Evaluation of the self-emulsifying
performance of a non-ionic surfactant-vegetable oil mixture. J. Pharm. Pharmacol.
39:6P (1987).
[91] P. Gao, M.E. Guyton, T.H. Huang, J.M. Bauer, K.J. Stefanski, and Q. Lu. Enhanced
oral bioavailability of a poorly water soluble drug pnu-91325 by supersaturatable
formulations. Drug Dev. Ind. Pharm. 30:221-229 (2004).
[92] P. Gao, B.D. Rush, W.P. Pfund, T.H. Huang, J.M. Bauer, W. Morozowich, M.S. Kuo,
and M.J. Hageman. Development of a supersaturable sedds (s-sedds) formulation of
paclitaxel with improved oral bioavailability. J. Pharm. Sci. 92:2386-2398 (2003).
[93] T. Gershanik and S. Benita. Positively charged self-emulsifying oil formulation for
improving oral bioavailability of progesterone, Vol. 1, Informa Healthcare, 1996, pp.
147 - 157.
[94] T. Gershanik, S. Benzeno, and S. Benita. Interaction of a self-emulsifying lipid drug
delivery system with the everted rat intestinal mucosa as a function of droplet size and
surface charge. Pharm. Res. 15:863-869 (1998).
[95] T. Gershanik, E. Haltner, C.M. Lehr, and S. Benita. Charge-dependent interaction of
self-emulsifying oil formulations with caco-2 cells monolayers: Binding, effects on
barrier function and cytotoxicity. Int. J. Pharm. 211:29-36 (2000).
[96] E. Atef. Formulation and in-vitro and in-vivo testing of phenytoin self-emulsifying
drug delivery system (SEDDS). Ph.D. Thesis, Massachusetts college of pharmacy and
health sciences, Boston, 2004.
[97] H. Reiss. Entropy-induced dispersion of bulk liquids. J. Colloid. Interface. Sci. 53:61-
70 (1975).

References
96
[98] G. Buckton. Interfacial phenomena, surface tension and liquid/liquid interface. In G.
Buckton (ed.), Interfacial phenomena in drug delivery and targeting, Harwood
academic publishers, Chur, 1995, pp. 1-25.
[99] T. Dabros, A. Yeung, J. Masliyah, and J. Czarnecki. Emulsification through area
contraction. J. Colloid. Interface. Sci. 210:222-224 (1999).
[100] M.J. Groves and R.M.A. Mustafa. Measurement of spontaneity of self-emulsifiable
oils. J. Pharm. Pharmacol. 26:671-681 (1974).
[101] M.J. Groves, R.M.A. Mustafa, and J.E. Carless. Phase studies of mixed phosphated
surfactants, normal-hexane and water. J. Pharm. Pharmacol. 26:616-623 (1974).
[102] M.J. Rang and C.A. Miller. Spontaneous emulsification of oils containing
hydrocarbon, nonionic surfactant, and oleyl alcohol. J. Colloid. Interface. Sci.
209:179-192 (1999).
[103] D.Q.M. Craig, S.A. Barker, D. Banning, and S.W. Booth. An investigation into the
mechanisms of self-emulsification using particle-size analysis and low-frequency
dielectric-spectroscopy. Int. J. Pharm. 114:103-110 (1995).
[104] H. Toguchi, Y. Ogawa, K. Iga, T. Yashiki, and T. Shimamoto. Gastrointestinal
absorption of ethyl 2-chloro-3-[4-(2-methyl-2-phenylpropyloxy)phenyl]propionate
from different dosage forms in rats and dogs. Chem. Pharmaceut. Bull. 38:2792-2796
(1990).
[105] H. Toguchi, Y. Ogawa, and T. Shimamoto. Effects of the physicochemical properties
of the emulsion formulation on the bioavailability of ethyl 2-chloro-3-[4-(2-methyl-2-
phenylpropyloxy)phenyl]propionate in rats. Chem. Pharmaceut. Bull. 38:2797-2800
(1990).
[106] K.J. Palin, A.J. Phillips, and A. Ning. The oral absorption of cefoxitin from oil and
emulsion vehicles in rats. Int. J. Pharm. 33:99-104 (1986).
[107] R.A. Myers and V.J. Stella. Systemic bioavailability of penclomedine (nsc-338720)
from oil-in-water emulsions administered intraduodenally to rats. Int. J. Pharm.
78:217-226 (1992).
[108] V. Stella, J. Haslam, N. Yata, H. Okada, S. Lindenbaum, and T. Higuchi.
Enhancement of bioavailability of a hydrophobic amine anti-malarial by formulation
with oleic-acid in a soft gelatin capsule. J. Pharm. Sci. 67:1375-1377 (1978).

References
97
[109] T.T. Kararli, T.E. Needham, M. Griffin, G. Schoenhard, L.J. Ferro, and L. Alcorn.
Oral delivery of a renin inhibitor compound using emulsion formulations. Pharm. Res.
9:888-893 (1992).
[110] D.J. Hauss, S.C. Mehta, and G.W. Radebaugh. Targeted lymphatic transport and
modified systemic distribution of ci-976, a lipophilic lipid-regulator drug, via a
formulation approach. Int. J. Pharm. 108:85-93 (1994).
[111] C. Malcolmson and M.J. Lawrence. A comparison of the incorporation of model
steroids into nonionic micellar and microemulsion systems. J. Pharm. Pharmacol.
45:141-143 (1993).
[112] R.J. Ptachcinski, R. Venkataramanan, and G.J. Burckart. Clinical pharmacokinetics of
cyclosporine. Clin. Pharmacokinet. 11:107-132 (1986).
[113] A. Meinzer, E.A. Mueller, and J. Vonderscher. Microemulsion - a suitable galenical
approach for the absorption enhancement of low soluble compounds. B T Gattefosse
21-26 (1995).
[114] F.G.J. Poelma, R. Breas, and J.J. Tukker. Intestinal-absorption of drugs .3. The
influence of taurocholate on the disappearance kinetics of hydrophilic and lipophilic
drugs from the small-intestine of the rat. Pharm. Res. 7:392-397 (1990).
[115] Y.Y. Chiu, K. Higaki, B.L. Neudeck, J.L. Barnett, L.S. Welage, and G.L. Amidon.
Human jejunal permeability of cyclosporin a: Influence of surfactants on p-
glycoprotein efflux in caco-2 cells. Pharm. Res. 20:749-756 (2003).
[116] C.J.H. Porter. Lipid-based delivery systems for poorly water soluble drugs:
Biopharmaceutical implications. Eur. J. Pharm. Sci. 28:S8-S8 (2006).
[117] K. Kawakami, T. Yoshikawa, Y. Moroto, E. Kanaoka, K. Takahashi, Y. Nishihara,
and K. Masuda. Microemulsion formulation for enhanced absorption of poorly soluble
drugs - i. Prescription design. J. Control. Release. 81:65-74 (2002).
[118] J.M. Dintaman and J.A. Silverman. Inhibition of p-glycoprotein by d-alpha-tocopheryl
polyethylene glycol 1000 succinate (tpgs). Pharm. Res. 16:1550-1556 (1999).
[119] B.K. Nordskog, C.T. Phan, D.F. Nutting, and P. Tso. An examination of the factors
affecting intestinal lymphatic transport of dietary lipids. Adv. Drug Deliv. Rev. 50:21-
44 (2001).

References
98
[120] J.Y. Kiyasu, B. Bloom, and I.L. Chaikoff. The portal transport of absorbed fatty acids.
J. Biol. Chem. 199:415-419 (1952).
[121] S.M. Caliph, W.N. Charman, and C.J.H. Porter. Effect of short-, medium-, and long-
chain fatty acid-based vehicles on the absolute oral bioavailability and intestinal
lymphatic transport of halofantrine and assessment of mass balance in lymph-
cannulated and non-cannulated rats. J. Pharm. Sci. 89:1073-1084 (2000).
[122] R.L. Juliano and V. Ling. Surface glycoprotein modulating drug permeability in
chinese-hamster ovary cell mutants. Biochimica Et Biophysica Acta. 455:152-162
(1976).
[123] Y.L. Lo, C.Y. Hsu, and J.D. Huang. Comparison of effects of surfactants with other
mdr reversing agents on intracellular uptake of epirubicin in caco-2 cell line.
Anticancer Res. 18:3005-3009 (1998).
[124] L. Yu, A. Bridgers, J. Polli, A. Vickers, S. Long, A. Roy, R. Winnike, and M. Coffin.
Vitamin e-tpgs increases absorption flux of an hiv protease inhibitor by enhancing its
solubility and permeability1. Pharm. Res. 16:1812-1817 (1999).
[125] W. Schwizer, K. Asal, C. Kreiss, C. Mettraux, J. Borovicka, B. Remy, C. Guzelhan,
D. Hartmann, and M. Fried. Role of lipase in the regulation of upper gastrointestinal
function in humans. Am. J. Physiol. Gastrointest. Liver Physiol. 273:G612-G620
(1997).
[126] J. Borovicka, W. Schwizer, C. Mettraux, C. Kreiss, B. Remy, K. Asal, J.B.M.J.
Jansen, I. Douchet, R. Verger, and M. Fried. Regulation of gastric and pancreatic
lipase secretion by cck and cholinergic mechanisms in humans. Am. J. Physiol.
Gastrointest. Liver Physiol. 273:G374-G380 (1997).
[127] H. Moreau, A. Bernadac, Y. Gargouri, F. Benkouka, R. Laugier, and R. Verger.
Immunocytolocalization of human gastric lipase in chief cells of the fundic mucosa.
Histochem. 91:419-423 (1989).
[128] A.B.R. Thomson, M. Keelan, M.L. Garg, and M.T. Clandinin. Intestinal aspects of
lipid absorption - in review. Can. J. Physiol. Pharmacol. 67:179-191 (1989).
[129] T.H. Liao, M. Hamosh, and P. Hamosh. Fat digestion in the stomach - mechanism of
action and substrate-specificity of lingual lipase. Federation Proceedings. 40:941-941
(1981).

References
99
[130] M. Hamosh, J.W. Scanlon, D. Ganot, M. Likel, K.B. Scanlon, and P. Hamosh. Fat
digestion in the newborn - characterization of lipase in gastric aspirates of premature
and term infants. J. Clin. Investig. 67:838-846 (1981).
[131] C.K. Abrams, M. Hamosh, T.C. Lee, A.F. Ansher, M.J. Collen, J.H. Lewis, S.B.
Benjamin, and P. Hamosh. Gastric lipase - localization in the human stomach.
Gastroenterology. 95:1460-1464 (1988).
[132] F. Carriere, J.A. Barrowman, R. Verger, and R. Laugier. Secretion and contribution to
lipolysis of gastric and pancreatic lipases during a test meal in humans.
Gastroenterology. 105:876-888 (1993).
[133] C. Renou, F. Carriere, E. Ville, P. Grandval, M. Joubert-Collin, and R. Laugier.
Effects of lansoprazole on human gastric lipase secretion and intragastric lipolysis in
healthy human volunteers. Digestion. 63:207-213 (2001).
[134] G.C. Ferreira and J.S. Patton. Inhibition of lipolysis by hydrocarbons and fatty
alcohols. J. Lipid Res. 31:889-897 (1990).
[135] J.K. Embleton and C.W. Pouton. Structure and function of gastro-intestinal lipases.
Adv. Drug Deliv. Rev. 25:15-32 (1997).
[136] C. Chapus, M. Semeriva, C. Bovierlapierre, and P. Desnuelle. Mechanism of
pancreatic lipase action .1. Interfacial activation of pancreatic lipase. Biochemistry.
15:4980-4987 (1976).
[137] F.H. Mattson and R.A. Volpenhein. The digestion and absorption of triglycerides. J.
Biol. Chem. 239:2772-2777 (1964).
[138] W.C. Duane, R.L. Ginsberg, and L.J. Bennion. Effects of fasting on bile-acid
metabolism and biliary lipid-composition in man. J. Lipid Res. 17:211-219 (1976).
[139] J.M. Laher and J.A. Barrowman. Polycyclic-hydrocarbon and polychlorinated
biphenyl solubilization in aqueous-solutions of mixed micelles. Lipids. 18:216-222
(1983).
[140] J.O. Christensen, K. Schultz, B. Mollgaard, H.G. Kristensen, and A. Mullertz.
Solubilisation of poorly water-soluble drugs during in vitro lipolysis of medium- and
long-chain triacylglycerols. Eur. J. Pharm. Sci. 23:287-296 (2004).

References
100
[141] K.J. MacGregor, J.K. Embleton, J.E. Lacy, E.A. Perry, L.J. Solomon, H. Seager, and
C.W. Pouton. Influence of lipolysis on drug absorption from the gastro-intestinal tract.
Adv. Drug Deliv. Rev. 25:33-46 (1997).
[142] L. Sek, C.J.H. Porter, A.M. Kaukonen, and W.N. Charman. Evaluation of the in-vitro
digestion profiles of long and medium chain glycerides and the phase behaviour of
their lipolytic products. J. Pharm. Pharmacol. 54:29-41 (2002).
[143] I. Ghebre-Sellassie. Pellets: A general overview. In I. Ghebre-Sellassie (ed.),
Pharmaceutical pelletization technology, Marcel Dekker, New York, 1989, pp. 1-13.
[144] S.R. Bechard and J.C. Leroux. Coated pelletized dosage form - effect of compaction
on drug release. Drug Dev. Ind. Pharm. 18:1927-1944 (1992).
[145] C. Eskilson. Controlled release by microencapsulation .1. Manufacturing Chemist.
56:33-39 (1985).
[146] H. Bechgaard and K. Ladefoged. Distribution of pellets in gastrointestinal-tract -
influence on transit-time exerted by density or diameter of pellets. J. Pharm.
Pharmacol. 30:690-692 (1978).
[147] H. Bechgaard and G.H. Nielsen. Controlled-release multiple-units and single-unit
doses - literature-review. Drug Dev. Ind. Pharm. 4:53-67 (1978).
[148] T. Govender and C.M. Dangor. Formulation and preparation of controlled release
pellets of salbutamol by the air suspension technique. J. Microencapsul. 14:445-455
(1997).
[149] A.D. Reynolds. A new technique for production of spherical particles. Manufacturing
Chemist. 41:40-43 (1970).
[150] J.M. Newton. Extrusion and extruders. In J. Swarbrickand J.C. Boylan (eds.),
Encyclopedia of pharmaceutical technology, Marcel Dekker, New York, 2002, pp.
1220-1236.
[151] D.C. Hicks and H.L. Freese. Extrusion and spheronizing equipment. In I. Ghebre-
Sellassie (ed.), Pharmaceutical pelletization technology, Marcel Dekker, New York,
1989, pp. 71-100.
[152] R.C. Rowe. Spheronization - a novel pill-making process. Pharmacy International.
6:119-123 (1985).
[153] N. Nakahara. US patent, 1966.
References
101
[154] I.M. Jalal, W.E. Smith, and Malinows.Hj. Tablet granulations composed of spherical-
shaped particles. J. Pharm. Sci. 61:1466-1468 (1972).
[155] Malinows.Hj and W.E. Smith. Effects of spheronization process variables on selected
tablet properties. J. Pharm. Sci. 63:285-288 (1974).
[156] C.W. Woodruff and N.O. Nuessle. Effect of processing variables on particles obtained
by extrusion-spheronization processing. J. Pharm. Sci. 61:787-790 (1972).
[157] J.W. Conine and H.R. Hadley. Preparation of small solid pharmaceutical spheres.
Drug & Cosmetic Industry. 106:38-41 (1970).
[158] L. Baert and J.P. Remon. Influence of amount of granulation liquid on the drug-
release rate from pellets made by extrusion spheronization. Int. J. Pharm. 95:135-141
(1993).
[159] P. Kleinebudde and H. Lindner. Experiments with an instrumented twin-screw
extruder using a single-step granulation extrusion process. Int. J. Pharm. 94:49-58
(1993).
[160] G.P. Millili and J.B. Schwartz. The strength of microcrystalline cellulose pellets - the
effect of granulating with water ethanol mixtures. Drug Dev. Ind. Pharm. 16:1411-
1426 (1990).
[161] R.E. Oconnor and J.B. Schwartz. Spheronization .2. Drug release from drug-diluent
mixtures. Drug Dev. Ind. Pharm. 11:1837-1857 (1985).
[162] A.B.B. Bashaiwoldu, F. Podczeck, and M. Newton. A study on the effect of drying
techniques on the mechanical properties of pellets and compacted pellets. Eur. J.
Pharm. Sci. 21:119-129 (2004).
[163] P.J. Harrison, J.M. Newton, and R.C. Rowe. The characterization of wet powder
masses suitable for extrusion spheronization. J. Pharm. Pharmacol. 37:686-691
(1985).
[164] M.R. Harris and I. Ghebre-Sellassie. Formulation variables. In I. Ghebre-Sellassie
(ed.), Pharmaceutical pellitization technology, Vol. 37, Marcel Dekker, New York,
1989, pp. 217-239.
[165] C. Vervaet, L. Baert, and J.P. Remon. Extrusion-spheronisation - a literature-review.
Int. J. Pharm. 116:131-146 (1995).
References
102
[166] J.W. Wallace. Cellulose derivatives and natural products utilized in pharmaceutics. In
J. Swarbrickand J.C. Boylan (eds.), Encyclopedia of pharmaceutical technology, Vol.
2, Marcel Dekker, New York, 1991, pp. 319-337.
[167] K.E. Fielden, J.M. Newton, P. Obrien, and R.C. Rowe. Thermal studies on the
interaction of water and microcrystalline cellulose. J. Pharm. Pharmacol. 40:674-678
(1988).
[168] P. Kleinebudde. The crystallite-gel-model for microcrystalline cellulose in wet-
granulation, extrusion, and spheronization. Pharm. Res. 14:804-809 (1997).
[169] P. Fajer. Electron spin resonance spectroscopy labeling in peptide and protein
analysis. In R. Meyers (ed.), Encyclopedia of analytical chemistry, John Wiley &
Sons, New York, 2000.
[170] K. Mäder, A. Domb, and H.M. Swartz. Gamma-sterilization-induced radicals in
biodegradable drug delivery systems. Appl. Radiat. Isot. 47:1669-1674 (1996).
[171] J. Raffi, S. Gelly, L. Barral, F. Burger, P. Piccerelle, P. Prinderre, M. Baron, and A.
Chamayou. Electron paramagnetic resonance of radicals induced in drugs and
excipients by radiation or mechanical treatments. Spectrochim. Acta Mol. Biomol.
Spectros. 58:1313-1320 (2002).
[172] K. Mäder, H.M. Swartz, R. Stosser, and H.H. Borchert. The application of epr
spectroscopy in the field of pharmacy. Pharmazie. 49:97-101 (1994).
[173] T. Yamaguchi, S. Itai, H. Hayashi, S. Soda, A. Hamada, and H. Utsumi. In vivo esr
studies on pharmacokinetics and metabolism of parenteral lipid emulsion in living
mice. Pharm. Res. 13:729-733 (1996).
[174] M. Petelin, Z. Pavlica, S. Bizimoska, and M. Sentjurc. In vivo study of different
ointments for drug delivery into oral mucosa by epr oximetry. Int. J. Pharm. 270:83-
91 (2004).
[175] R.S. Macomber. Magnetic properties of nuclei. A complete introduction to modern
nmr spectroscopy, John Wiley & Sons, New York, 1998, pp. 6-21.
[176] A. Rübe. Development and physico-chemical characterization of nanocapsules. Ph.D.
thesis, Martin-Luther University, 2006.
[177] D.J. Lurie and K. Mäder. Monitoring drug delivery processes by epr and related
techniques - principles and applications. Adv. Drug Deliv. Rev. 57:1171-1190 (2005).

References
103
[178] M. Hemminga and I. Van den Dries. Spin label applications to food science. In L.J.
Berliner (ed.), Spin labeling, the next millennium, Plenum publishing corporation,
New York 1998.
[179] W.K. Subczynski, J. Wojas, V. Pezeshk, and A. Pezeshk. Partitioning and localization
of spin-labeled amantadine in lipid bilayers: An EPR study. J. Pharm. Sci. 87:1249-
1254 (1998).
[180] K. Jores, W. Mehnert, and K. Mäder. Physicochemical investigations on solid lipid
nanoparticles and on oil-loaded solid lipid nanoparticles: A nuclear magnetic
resonance and electron spin resonance study. Pharm. Res. 20:1274-1283 (2003).
[181] I. Katzhendler, K. Mäder, and M. Friedman. Correlation between drug release kinetics
from proteineous matrix and matrix structure: EPR and NMR study. J. Pharm. Sci.
89:365-381 (2000).
[182] I. Katzhendler, K. Mäder, R. Azoury, and M. Friedman. Investigating the structure and
properties of hydrated hydroxypropyl methylcellulose and egg albumin matrices
containing carbamazepine: EPR and NMR study. Pharm. Res. 17:1299-1308 (2000).
[183] A. Brunner, K. Mäder, and A. Gopferich. pH and osmotic pressure inside
biodegradable microspheres during erosion. Pharm. Res. 16:847-853 (1999).
[184] K. Mäder, B. Bittner, Y. Li, W. Wohlauf, and T. Kissel. Monitoring microviscosity
and microacidity of the albumin microenvironment inside degrading microparticles
from poly(lactide-co-glycolide) (PLG) or ABA-triblock polymers containing
hydrophobic poly(lactide-co-glycolide) A blocks and hydrophilic poly(ethyleneoxide)
B blocks. Pharm. Res. 15:787-793 (1998).
[185] C. Kroll, W. Herrmann, R. Stosser, H.H. Borchert, and K. Mäder. Influence of drug
treatment on the microacidity in rat and human skin - an in vitro electron spin
resonance imaging study. Pharm. Res. 18:525-530 (2001).
[186] C. Tuleu, M. Newton, J. Rose, D. Euler, R. Saklatvala, A. Clarke, and S. Booth.
Comparative bioavailability study in dogs of a self-emulsifying formulation of
progesterone presented in a pellet and liquid form compared with an aqueous
suspension of progesterone. J. Pharm. Sci. 93:1495-1502 (2004).
[187] S.M. Khoo, A.J. Humberstone, C.J.H. Porter, G.A. Edwards, and W.N. Charman.
Formulation design and bioavailability assessment of lipidic self-emulsifying
formulations of halofantrine. Int. J. Pharm. 167:155-164 (1998).

References
104
[188] J. Chatchawalsaisin, F. Podczeck, and J.M. Newton. The preparation by
extrusion/spheronization and the properties of pellets containing drugs,
microcrystalline cellulose and glyceryl monostearate. Eur. J. Pharm. Sci. 24:35-48
(2005).
[189] E. Franceschinis, D. Voinovich, M. Grassi, B. Perissutti, J. Filipovic-Grcic, A.
Martinac, and F. Meriani-Merlo. Self-emulsifying pellets prepared by wet granulation
in high-shear mixer: Influence of formulation variables and preliminary study on the
in vitro absorption. Int. J. Pharm. 291:87-97 (2005).
[190] M. Newton, J. Petersson, F. Podczeck, A. Clarke, and S. Booth. The influence of
formulation variables on the properties of pellets containing a self-emulsifying
mixture. J. Pharm. Sci. 90:987-995 (2001).
[191] A. Besheer, K.M. Wood, N.A. Peppas, and K. Mäder. Loading and mobility of spin-
labeled insulin in physiologically responsive complexation hydrogels intended for oral
administration. J. Control. Release. 111:73-80 (2006).
[192] A. Martin. Physical pharmacy, Lippincott Williams &Wilkins, Maryland, 1993.
[193] A.M. Bouwman, J.C. Bosma, P. Vonk, J.H.A. Wesselingh, and H.W. Frijlink. Which
shape factor(s) best describe granules? Powder Technology. 146:66-72 (2004).
[194] R. Dreu, J. Sirca, K. Pintye-Hodi, T. Burjan, O. Planinsek, and S. Srcic.
Physicochemical properties of granulating liquids and their influence on
microcrystalline cellulose pellets obtained by extrusion-spheronisation technology.
Int. J. Pharm. 291:99-111 (2005).
[195] R. Chopra, F. Podczeck, J.M. Newton, and G. Alderborn. The influence of pellet
shape and film coating on the filling of pellets into hard shell capsules. Eur. J. Pharm.
Biopharm. 53:327-333 (2002).
[196] B.D. Tarr and S.H. Yalkowsky. Enhanced intestinal absorption of cyclosporine in rats
through the reduction of emulsion droplet size. Pharm. Res. 6:40-43 (1989).
[197] J.S. Patton and M.C. Carey. Watching fat digestion. Science. 204:145-148 (1979).
[198] M.C. Carey, D.M. Small, and C.M. Bliss. Lipid digestion and absorption. Annu. Rev.
Physiol. 45:651-677 (1983).
[199] D.G. Fatouros, G.R. Deen, L. Arleth, B. Bergenstahl, F.S. Nielsen, J.S. Pedersen, and
A. Mullertz. Structural development of self nano emulsifying drug delivery systems

References
105
(SNEDDS) during in vitro lipid digestion monitored by small-angle x-ray scattering.
Pharm. Res. 24:1844-1853 (2007).
[200] J.E. Staggers, O. Hernell, R.J. Stafford, and M.C. Carey. Physical-chemical behavior
of dietary and biliary lipids during intestinal digestion and absorption .1. Phase-
behavior and aggregation states of model lipid systems patterned after aqueous
duodenal contents of healthy adult human-beings. Biochemistry. 29:2028-2040 (1990).
[201] M.W. Rigler, R.E. Honkanen, and J.S. Patton. Visualization by freeze-fracture, invitro
and invivo, of the products of fat digestion. J. Lipid Res. 27:836-857 (1986).
[202] G.A. Kossena, W.N. Charman, B.J. Boyd, and C.I.H. Porter. Influence of the
intermediate digestion phases of common formulation lipids on the absorption of a
poorly water-soluble drug. J. Pharm. Sci. 94:481-492 (2005).
[203] C.J.H. Porter, A.M. Kaukonen, A. Taillardat-Bertschinger, B.J. Boyd, J.M. O'Connor,
G.A. Edwards, and W.N. Charman. Use of in vitro lipid digestion data to explain the
in vivo performance of triglyceride-based oral lipid formulations of poorly water-
soluble drugs: Studies with halofantrine. J. Pharm. Sci. 93:1110-1121 (2004).
[204] F.J. Alvarez and V.J. Stella. The role of calcium-ions and bile-salts on the pancreatic
lipase-catalyzed hydrolysis of triglyceride emulsions stabilized with lecithin. Pharm.
Res. 6:449-457 (1989).
[205] N.H. Zangenberg, A. Mullertz, H.G. Kristensen, and L. Hovgaard. A dynamic in vitro
lipolysis model II: Evaluation of the model. Eur. J. Pharm. Sci. 14:237-244 (2001).
[206] N.H. Zangenberg, A. Mullertz, H.G. Kristensen, and L. Hovgaard. A dynamic in vitro
lipolysis model I. Controlling the rate of lipolysis by continuous addition of calcium.
Eur. J. Pharm. Sci. 14:115-122 (2001).
[207] S. Klein. Optimierung eines pankreatin-assays als prädiktives in vitro modell zur
bioverfügbarkeit von wirkstoffformulierungen Vol. Diploma Thesis, Martin Luther
University, 2006.
[208] L. Sek, C.J.H. Porter, and W.N. Charman. Characterisation and quantification of
medium chain and long chain triglycerides and their in vitro digestion products, by
hptlc coupled with in situ densitometric analysis. J. Pharmaceut. Biomed. Anal.
25:651-661 (2001).

References
106
[209] A. Rube, S. Klein, and K. Mäder. Monitoring of in vitro fat digestion by electron
paramagnetic resonance spectroscopy. Pharm. Res. 23:2024-2029 (2006).
[210] A.M. Kaukonen, B.J. Boyd, C.J.H. Porter, and W.N. Charman. Drug solubilization
behavior during in vitro digestion of simple triglyceride lipid solution formulations.
Pharm. Res. 21:245-253 (2004).
[211] O. Hernell, J.E. Staggers, and M.C. Carey. Physical-chemical behavior of dietary and
biliary lipids during intestinal digestion and absorption .2. Phase-analysis and
aggregation states of luminal lipids during duodenal fat digestion in healthy adult
human-beings. Biochemistry. 29:2041-2056 (1990).
[212] S.D. Ladas, P.E.T. Isaacs, G.M. Murphy, and G.E. Sladen. Comparison of the effects
of medium and long-chain triglyceride containing liquid meals on gallbladder and
small intestinal function in normal man. Gut. 25:405-411 (1984).
[213] A.M. Kaukonen, B.J. Boyd, W.N. Charman, and C.J.H. Porter. Drug solubilization
behavior during in vitro digestion of suspension formulations of poorly water-soluble
drugs in triglyceride lipids. Pharm. Res. 21:254-260 (2004).
[214] H.R. Tang, J. Godward, and B. Hills. The distribution of water in native starch
granules - a multinuclear NMR study. Carbohydr. Polymer. 43:375-387 (2000).
[215] E. Chiotelli, G. Pilosio, and M. Le Meste. Effect of sodium chloride on the
gelatinization of starch: A multimeasurement study. Biopolymers. 63:41-58 (2002).
[216] R.R. Li, W.L. Kerr, R.T. Toledo, and J.A. Carpenter. 1H NMR studies of water in
chicken breast marinated with different phosphates. J. Food Sci. 65:575-580 (2000).

Acknowledgments
107
Acknowledgments I would like to take this opportunity with great pleasure to acknowledge and extend
my heartfelt gratitude to the persons who have made the completion of this PhD work
possible.
First, I would like to express my special gratitude to my supervisor Prof. Karsten
Mäder for suggesting this interesting research topic and for continued
encouragement and assistance all the way through the progress of my work. His
assistance and advice have helped me getting over many problems during my
research. He was not only serving as my supervisor but he was always there
whenever I needed help during my stay in Halle.
I would like to acknowledge Dr. Hendrik Metz for conducting the NMR experiments
and for the fruitful and constructive discussion about ESR and NMR results.
I would also like to thank my friend Ahmed Besheer for the help provided in carrying
out the ESR experiments, for assistance in simulating the ESR spectra and for the
positive discussions. I am also grateful to him for helping me adapting to the new
living conditions during my first days in Halle and for the wonderful trips we made
together.
I am also greatly indebted to my friend Martin Bastrop for reviewing the thesis during
writing process and for the needed motivation and helpful discussions.
I would like to thank Mr. Frank Syrowatka for ESEM measurements, Mrs. Sigrid
Todte for conducting the HPLC measurements and to my colleague Sandra Klein for
the help provided in conducting the vitro digestion experiments.
I am deeply grateful to all my colleagues in our working group for creating a friendly
working atmosphere and for helping in solving any problem I faced.
My special gratitude is due to my parents for the unconditional emotional and
financial support and for the encouragement to pursue my educational interests.
Great thanks to my wife Marwa whose patience, love and emotional support enabled
me to complete this work, and to my wonderful son Khaled for his love and for easing
up the time for me.
I thank my sisters for their constant encouragement throughout my life.
Praise be to God, for bestowing his bounties on me in my whole life and for giving me
power to finish this work.
Publications
108
Publications Research articles
Ahmed Abdalla, Karsten Mäder, Preparation and characterization of a self-
emulsifying pellet formulation, Eur. J. Pharm. Biopharm., 66:220-226, 2007.
Ahmed Abdalla, Sandra Klein and Karsten Mäder, A new self-emulsifying drug
delivery system (SEDDS) for poorly soluble drugs: Characterization, dissolution,
in vitro digestion and incorporation into solid pellets, Eur. J. Pharm. Sci., DOI:
10.1016/j.ejps.2008.09.006, 2008.
Ahmed Abdalla and Karsten Mäder, ESR studies on the influence of physiological
dissolution and digestion media on the lipid phase characteristics of SEDDS and
SEDDS pellets, Int. J. Pharm., DOI: 10.1016/j.ijpharm.2008.09.014, 2008.
Ahmed Abdalla, Karsten Mäder, and Hendrik Metz, Characterization of lipid status
in self-emulsifying pellets by bench-top NMR, in process.
Poster and oral presentations
Ahmed Abdalla, Karsten Mäder, Preparation and characterization of a self-
emulsifying pellet formulation, Poster, 33rd Annual Meeting of the controlled
release society, Vienna, 2006.
Ahmed Abdalla, Karsten Mäder, Development and characterization of self-
emulsifying pellet formulations for poorly soluble drugs, oral presentation, Bayer
Bitterfield, 2008.
Ahmed Abdalla, Sandra Klein, Hendrik Metz and Karsten Mäder, Formulation and
characterization of self-emulsifying pellet formulations for poorly soluble drugs,
Poster, 6th World Meeting on Pharmaceutics, Biopharmaceutics and Pharmaceutical
Technology, Barcelona, 2008.

Curriculum vitae
109
Curriculum vitae
PERSONAL INFORMATION
Name Ahmed Mohamed Effat Mohamed Abdalla
Born 08.05.1977 in Riyadh, Saudi-Arabia
Nationality Egyptian
Marital status Married, one child
WORK HISTORY
Jan 2001 - Present Research Pharmacist. Drug Bioavailability Center, Egyptian National Organization For Drug Control and Research, NODCAR, Cairo, Egypt.
Jun 2000 - Oct 2002 Pharmacist. Al-Foutoh public pharmacy, Cairo, Egypt.
EDUCATION AND TRAINING
Sep 1995 - May 2000 Faculty of Pharmacy, Ain Shams University, Cairo, Egypt. B.Sc. in Pharmaceutical Sciences General Grade: Very Good With Honor. Cumulative GPA : 15413 / 19200 ( 3.21 / 4.00)
Aug 1999 - Sep 1999 King Faisal Specialist Hospital & Research center, Riyadh, Saudi Arabia. Training in the Ambulatory Care Pharmacy.
Sep 1999 - Oct 1999 King Faisal Specialist Hospital & Research center, Riyadh, Saudi Arabia. Training in the Production and Quality Control of Radiopharmaceutical Operations in Radio-nuclide & Cyclotron Operation Department.
Sep 2000 - Nov 2000 National Organization For Drug Control & Research, Cairo, Egypt. Training in the Drug Information Center.
Mar 2001 - May 2001 National Organization For Drug Control & Research, Cairo, Egypt. HPLC training course organized by Waters corporation.
Sep 2002 - May 2003 Faculty of Pharmacy, Cairo university. Cairo, Egypt. Pre-Master courses in pharmaceutics General Grade: Very Good.
Sep 2004 – May 2008 Institute of Pharmacy, Martin Luther University, Halle, Germany. PhD Student in the Research Group of the pharmaceutical technology department, under the supervision of Prof. Karsten Mäder.

Selbständigkeitserklärung
110
Erklärung
Hiermit erkläre ich, dass ich mich mit der vorliegenden Arbeit erstmals um die
Erlangung eines Doktorgrades bewerbe.
Ferner erkläre ich, dass ich die vorliegende Arbeit selbstsändig und ohne fremde
Hilfe angefertigt, andere als die von mir angegebenen Quellen und Hilfsmittel nicht
benutzt und die den verwendeten Werken wörtlich oder inhaltlich entnommenen
Stellen als solche kenntlich gemacht habe.
Halle (Saale), June 2008
Ahmed Abdalla