Development and Characterization of 3D-Printed ...
35
ORNL/TM-2020/1450 Development and Characterization of 3D-Printed Cementitious Materials for Innovative Nuclear Systems Yann Le Pape Debalina Ghosh (UTK) Gaurav Sant (UCLA) Catherine Mattus Elena Tajuelo Rodriguez Brian Post March 2020 M3TC-20OR0403012
Transcript of Development and Characterization of 3D-Printed ...
ORNL/TM-2020/1450
Development and Characterization of 3D-Printed Cementitious Materials for Innovative Nuclear Systems
Yann Le Pape Debalina Ghosh (UTK) Gaurav Sant (UCLA) Catherine Mattus Elena Tajuelo Rodriguez Brian Post
March 2020
M3TC-20OR0403012
DOCUMENT AVAILABILITY Reports produced after January 1, 1996, are generally available free via US Department of Energy (DOE) SciTech Connect.
Website www.osti.gov
Reports produced before January 1, 1996, may be purchased by members of the public from the following source:
National Technical Information Service 5285 Port Royal Road Springfield, VA 22161 Telephone 703-605-6000 (1-800-553-6847) TDD 703-487-4639 Fax 703-605-6900 E-mail [email protected] http://classic.ntis.gov/
Reports are available to DOE employees, DOE contractors, Energy Technology Data Exchange representatives, and International Nuclear Information System representatives from the following source:
Office of Scientific and Technical Information PO Box 62 Oak Ridge, TN 37831 Telephone 865-576-8401 Fax 865-576-5728 E-mail [email protected] http://www.osti.gov/contact.html
This report was prepared as an account of work sponsored by an agency of the United States Government. Neither the United States Government nor any agency thereof, nor any of their employees, makes any warranty, express or implied, or assumes any legal liability or responsibility for the accuracy, completeness, or usefulness of any information, apparatus, product, or process disclosed, or represents that its use would not infringe privately owned rights. Reference herein to any specific commercial product, process, or service by trade name, trademark, manufacturer, or otherwise, does not necessarily constitute or imply its endorsement, recommendation, or favoring by the United States Government or any agency thereof. The views and opinions of authors expressed herein do not necessarily state or reflect those of the United States Government or any agency thereof.
ORNL/TM-2020/1450
Transformational Challenge Reactor Reactor and Nuclear Systems Division
DEVELOPMENT AND CHARACTERIZATION OF 3D-PRINTED CEMENTITIOUS SYTEMS FOR INNOVATIVE NUCLEAR SYSTEMS
Yann Le Pape Debalina Ghosh (UTK) Gaurav Sant (UCLA)
Catherine Mattus (ORNL retired) Elena Tajuelo Rodriguez
Brian Post
March 2020
M3TC-20OR0403012
Prepared by OAK RIDGE NATIONAL LABORATORY
Oak Ridge, TN 37831-6283 managed by
UT-BATTELLE, LLC for the
US DEPARTMENT OF ENERGY under contract DE-AC05-00OR22725

iii
CONTENTS
LIST OF FIGURES .......................................................................................................................................v LIST OF TABLES .........................................................................................................................................v ABSTRACT ...................................................................................................................................................1 1. CONTEXT .............................................................................................................................................1
1.1 ADDITIVE MANUFACTURING CONCRETE ........................................................................3 1.2 ADVANCED CONCEPT OF BIOLOGICAL SHIELD .............................................................3
2. TASK 1. CHARACTERIZATION OF 3DPC .......................................................................................4 2.1 CASTED CONCRETE ................................................................................................................4 2.2 TESTING .....................................................................................................................................6
2.2.1 Fresh Concrete properties: ..............................................................................................6 2.2.2 Hardened Concrete properties: ........................................................................................6 2.2.3 Observations ...................................................................................................................8 2.2.4 3DP Concrete Mix Designs ............................................................................................8 1.4.5. Test results and observations ..........................................................................................9
2.3 ALTERNATIVE FRACTURE TESTING ................................................................................11 2.3.1 Test Setup ......................................................................................................................12 2.3.2 Dimension .....................................................................................................................13 2.3.3 Sample Preparation .......................................................................................................14 2.3.4 Experimental Data ........................................................................................................14
3. TASK 2. ALTERNATIVE 3DPC ........................................................................................................15 3.1 CONCEPT .................................................................................................................................15 3.2 GENERAL CONSIDERATIONS .............................................................................................17 3.3 MATERIALS .............................................................................................................................18 3.4 CARBONATION PROCESS ....................................................................................................19 3.5 FABRICATION METHOD .......................................................................................................20 3.6 SHIELDING PROPERTIES ......................................................................................................22 3.7 COSTS .......................................................................................................................................23
4. CONCLUSIONS .................................................................................................................................23 REFERENCES .............................................................................................................................................25

v
LIST OF FIGURES
Figure 1. a) Test setup for center point loading flexural test b) Fiber distribution in concrete mix HM5B. ..............................................................................................................................................7
Figure 2. a) Flexural Strength at 28 days b) Compressive Strength at 28 days. ............................................8 Figure 3. Caption. ...........................................................................................................................................9 Figure 4. Loading directions in a 3DPC sample. .........................................................................................10 Figure 5. Post 3-points bending fracture of a 3DPC containing 1.5% volume of smooth steel fiber
(Dramix©), water to cement ratio 0.27 with silica fumes. .............................................................11 Figure 6. Test setup for compact tension test a) with a tie\-on extensometer b) with a clip on
extensometer ...................................................................................................................................13 Figure 7. Specimen Configuration. ..............................................................................................................13 Figure 8. Load vs. displacement plot for 4B-2 sample. ...............................................................................15 Figure 9. Proposed roadmap for new generation of irradiation-tolerant advanced manufactured
biological shield. .............................................................................................................................17 Figure 10. Carbonation mechanism of cementitious materials proposed by Maries (1985). ......................20 Figure 11. SEM morphology of the magnesium slag before and after CO2 curing. C=calcium
carbonate (Mo et al. 2017). .............................................................................................................21 Figure 12. Optical images of concrete specimens sprayed with phenolphthalein indicator (Mo and
Panesar 2013). .................................................................................................................................22
LIST OF TABLES
Table 1. Properties of steel fibers used in concrete mix. ...............................................................................5 Table 2. Mix designs for casted concrete with steel fibers. ...........................................................................5 Table 3. Mix designs for casted concrete with internal curing microspheres. ...............................................5 Table 4. Summery of stump test data of concrete mix with carbon X fibers and porevar beads. ..................6 Table 5. Summery of hardened concrete properties of casted concrete. ........................................................7 Table 6. Weight proportion of printed concrete. ............................................................................................8 Table 7. Summary of flexural test results of 3DPC samples. ......................................................................10 Table 8. Specimen configuration and dimensions. ......................................................................................14 Table 9. Experimental test results from compact tension test. .....................................................................14 Table 10. Chemical properties required for effective carbonation; collected from (Fernández
Bertos et al. 2004). ..........................................................................................................................18 Table 11. Mechanical performance and efficiency of the materials utilized by carbonation. .....................19 Table 12. Carbonation environment used by different studies. ...................................................................21 Table 13. Production cost of masonry blocks built of traditional cement and carbonation of steel
slag (Mahoutian, Chaallal, and Shao 2018). ...................................................................................23

ACRONYMS
3DCP 3D concrete printing 3DPC 3D printed concrete AM additive manufacturing AMO Additive Manufacturing Office BWR boiling water reactor CCM carbonated cementitious material CNC computer numerical control CRADA cooperative research and development agreement CT compact tension DIC digital image correlation IFCTD Isotope and Fuel Cycle Technology Division LWR light-water reactor MDF Manufacturing Demonstration Facility OPM ordinary Portland cement PWR pressurized water reactor RIVE radiation-induced volumetric expansion RPV reactor pressure vessel SEM scanning electron microscopy SkyBAAM Sky Big Area Additive Manufacturing TCR Transformational Challenge Reactor TGA thermogravimetric analysis VVER water-cooled water-moderated reactor (a PWR of Soviet design) XRD x-ray diffraction
1
ABSTRACT
The Transformational Challenge Reactor (TCR) is being developed to demonstrate a revolutionary approach to deploying new nuclear power systems by building and operating an additively manufactured microreactor. This initiative provides a unique opportunity to investigate the possibility of taking advantage of the recent development of the 3D-printed concrete system using the Sky Big Area Additive Manufacturing (SkyBAAM) printer at the Manufacturing Demonstration Facility (MDF) at Oak Ridge National Laboratory. Two pathways have been pursued in parallel since the end of the second quarter of FY19:
1. Development of methods to characterize the performance of additive manufacturing concrete using traditional Portland-cement based solution, and
2. Investigation of the opportunity to develop innovation of printable materials with higher irradiation-resistance performance using nontraditional concrete solutions in favor of carbonated cementitious materials (CCMs).
This report describes the results achieved to date for both pathways. The main results are listed below.
1. A test protocol has been established to characterize the fracture properties of 3D-printed concrete; this protocol will be used to assess the performance of printed traditional and nontraditional cementitious materials, with a focus on performance of the interfaces inherent to the additive manufacturing process.
2. A state-of-the-art review of the mechanisms, fabrication method, and performance of CCMs was conducted. CCMs appear to be a viable, highly innovative, more performant alternative to Portland-based cementitious solution for the erection of biological shield pending some materials development.
1. CONTEXT
This work is organized in two parallel activities to (1) find adequate characterization methods of the performance of additive manufacturing concrete using traditional Portland-cement based solution, and (2) investigate the opportunity of developing innovating printable materials with higher irradiation-resistance performance.
Concrete is a generic term that covers a large variety of materials which
include a cementitious binder such as ordinary Portland cement (OPC), fly ash, ground-granulated blast-furnace slag, and fillers, as well as water and aggregates that can be light-weight or normal weight materials extracted from natural rock quarries or synthetic or natural heavy-aggregates. Aggregates constitute ~70% of the volume fraction of concrete. To limit transportation cost, local materials are almost always used, so each concrete structure is comprised of unique materials (Le Pape 2020).
In pressurized water reactors (PWRs) and boiling water reactors (BWRs), the biological shield is generally made of a structural normal-weight aggregates concrete comparable to the concrete found in the containment building or the spent-fuel handling building, although the concrete biological shield effectively has a structural function in some PWR designs.

2
The containment’s internal structures in PWR plants tend to be more massive in nature than internal structures in BWR plants because they typically support the reactor pressure vessel (RPV), steam generators, and other large equipment (Le Pape 2015). In a water-cooled water-moderated reactor (VVER – a PWR of Soviet design), the shielding concrete is made of heavy-weight concrete using metal oxides-bearing aggregates such as hematite, ilmenite or magnetite.
the concrete biological shield is not intended to have any structural role in the Transformational Challenge Reactor (TCR). As such, it can be seen as a self-standing structure constructed independently of other main components with the exception of the piping penetrations necessary for reactor operation.
The general dimensions of the TCR biological shield are constrained by the pressure vessel’s outer diameter (~1.5 m) and height (~2.0 m). The dimension of the reactor cavity remains to be determined and will be based on the need for inspection accessibility and to protect against radiation streaming. The thickness of the biological shield will be determined based on radiation transport models and radiological protection specifications. This task is closely associated with the core and pressure vessel design.
As of this writing, capping the biological shield is not under consideration. Therefore, the TCR’s envisioned geometry is currently quite rudimentary and corresponds to a hollow cylinder in a first approximation, pending refinement of the radiation fields calculations. Due to the geometry’s simplicity and the absence of a structural function, along with its integrity under self-weight,1 various construction methods can be envisioned: (1) traditional cast-in-place, (2) modular prefabrication assembled in place, and (3) a 3D-printed solution. If the traditional cast-in-place solution is adopted, then it would likely lead to the biological shield being built before placing the pressure vessel and connecting the piping. It would be quite difficult to fabricate the formwork around the already placed pipe penetrations and to ensure correct placement of the concrete in those areas. Penetrations are known to be areas of difficult placement because of reduced accessibility for vibration and increased reinforcement ratio in light water reactor (LWR) designs). Prefabricated modular elements could alleviate that difficulty, although the junction between prefabricated modules is obtained by a cast-in-place joint. The 3D-printed concrete approach has similar difficulties. The concrete printer, Sky Big Area Additive Manufacturing (SkyBaAM), which his currently available at Oak Ridge National Laboratory (ORNL), is based on a gantry system technology. The printer head is connected to four independent bases by tensioned cables. Erecting a hollow cylindrical structure would require the final volume of the cylinder to be unoccupied at the time of printing to allow the movements of the printer head and its attached cables. Hence, in-situ printing of TCR’s biological shield would need to be finalized before the installation of the pressure vessel and the connected piping. It must also be noted that the fabrication of a structure with a footprint of 2–3 m would require the printed bases to be placed about ~15 m apart. This constraint may not be compatible with the indoor environment considered for the TCR demonstration. Alternatively, 3D-preprinted modules could be a viable technological solution. The rheology controlling the extrudability of additive manufacturing materials can be modified by the temperature and humidity during fabrication. The environment of the Manufacturing Demonstration Facility (MDF) high-bay is relatively stable and should ensure consistent printing for modular fabrication. The modular fabrication can also allow for post-printing curing such as heating (a common practice in the precast industry) or high-pressure carbonation in the case of cementitious carbonated materials (CCMs), as described in the final section of this report.
1 The necessity of including seismic resistance needs to be determined.

3
1.1 ADDITIVE MANUFACTURING OF CONCRETE
In coordination with MDF’s ongoing work, the first objective of this research is to contribute to establishing an adequate test protocol for the characterization and performance demonstration of additive manufacturing (AM) of concrete structures, also known as (3DCP).
3DCP has recently seen a fast rate of development. Rapid infrastructure scale AM is currently being considered for residential and commercial building construction, renewable energy installations, and even hyperloop construction. However,
Disturbances during printing hamper the robustness of 3DCP, a critical milestone for commercial viability, of which rheological properties of 3DCP materials are fundamentally important. It is, however, the hardened properties and conformity to design geometry that give the manufactured component value. (Buswell et al. 2019).
If 3DCP is to become an effective alternative to traditional construction technologies, then the challenge is to maintain constructability, geometric conformity, mechanical performance, and durability.
Geometric conformity is an issue related to material and the printing process. The final hardened material determines the final geometry of the product. While the accuracy of the trajectory of the printer’s head nozzle is critical, the deposited concrete is subject to significant deformation before setting (solid-phase percolation caused by the hydration of cement) caused by the placement of adjacent layers and the gradual weight increase resulting from the vertical erection of the structure. It should also be noted that geometrical defects can potentially accumulate layer after layer, causing a gradual twisting of the printed filament, for example (Bos et al. 2016). While a traditional concrete is not required to provide any mechanical performance while placed in the formwork (typically for 24 hours), 3D-printed concrete must resist and maintain its shape with no small deformations as the printed layers are deposited above. Only a rapid gain of strength can ensure that the structure does not collapse under its own weight (Wolfs and Suiker 2019).
For 3D-printed concrete (3DPC) to become an actual structural material for consideration, its performance must be comparable to or exceed that of existing concretes. Extrudability prevents the use of coarse aggregates, which greatly contribute to the strength of many concretes. Thus, 3DPC must rely on a densification and reinforcement of its microstructure to be competitive. In addition, demonstration of the mechanical and physical performance of the interface between extruded layers must be characterized.
1.2 ADVANCED CONCEPT OF BIOLOGICAL SHIELD
The second objective of this research is to develop an alternative to the silicate-based system for the construction of the concrete biological shield.
The word concrete covers a wide class of composite materials. These materials include a cementitious binder such as ordinary Portland cement (OPC), fly ash, ground-granulated blast-furnace slag, and fillers, as well as water and aggregates that can be light-weight or normal weight materials extracted from natural rock quarries or synthetic or natural heavy-aggregates. Aggregates constitute >~70% of the volume fraction of concrete. To limit transportation cost, local materials are almost always used, so each concrete structure is comprised of unique materials. With nearly 450 commercial nuclear power plants (NPP) in operation worldwide, a wide diversity of concrete constituents - aggregates in particular - are present.
4
In nuclear applications, concrete is used as a shielding material for radiological protection and/or as a structural material. It is generally reinforced with carbon steel corrugated bars (Le Pape 2020).
Irradiation effects on concrete vary based on the nature of the minerals present. Simply stated, there is ample evidence that carbonated mineral forms are more resistant to neutron-irradiation than silicated forms (Pignatelli et al. 2015). More than 90% of minerals present in the Earth’s crust are composed of silicate minerals. The most abundant silicates are feldspar plagioclases (~40%) and alkali feldspars (~10%) (Wedepohl 1971). Other common silicate minerals are quartz (~10%), pyroxenes (~10%), amphiboles (~5%), micas (~5%), and clay minerals (~5%). The remainder of the silicate family comprises 3% of the crust. Only 8% of the crust is composed of nonsilicates: carbonates, oxides, and sulfides.
Silicates can be present in varied forms and contents in the aggregates, depending on the geology of the local source and they are also present in the cement essentially in the form of calcium silicates.
2. TASK 1. CHARACTERIZATION OF 3DPC
Several 3DPC mix designs (<10) were tested, and were samples fabricated by C. Mattus of ORNL’s Isotope and Fuel Cycle Technology Division (IFCTD) in laboratory conditions. One of the designs has already been extruded successfully at the MDF by B. Post using SkyBAAM.
These concretes include varied steel fibers (Dramix©, Helix©) type and dosage to assess the impact on the compressive and flexural strength of concrete. Traditional curing is difficult in 3DPC applications, so internal curing agents such as a post-consumer recycled glass microsphere, Poraver© were also explored. A similar concrete mix design without any fiber was experimentally printed and tested for flexural strength.
The standard mechanical properties (3-point bending and compressive strength) were tested by the University of Tennessee, Knoxville. Preliminary testing (Fig. 1) shows that a mechanical performance comparable to that of structural concrete can be achieved for 3DPC.
2.1 CASTED CONCRETE
Three types of microsteel fibers with different dimensions were used in the concrete mixture. The properties of the fibers are given below in Table 1. Concrete mix designs are presented in Table 2. After casting, all concrete samples were cured in a plastic wrap to retain moisture.
5
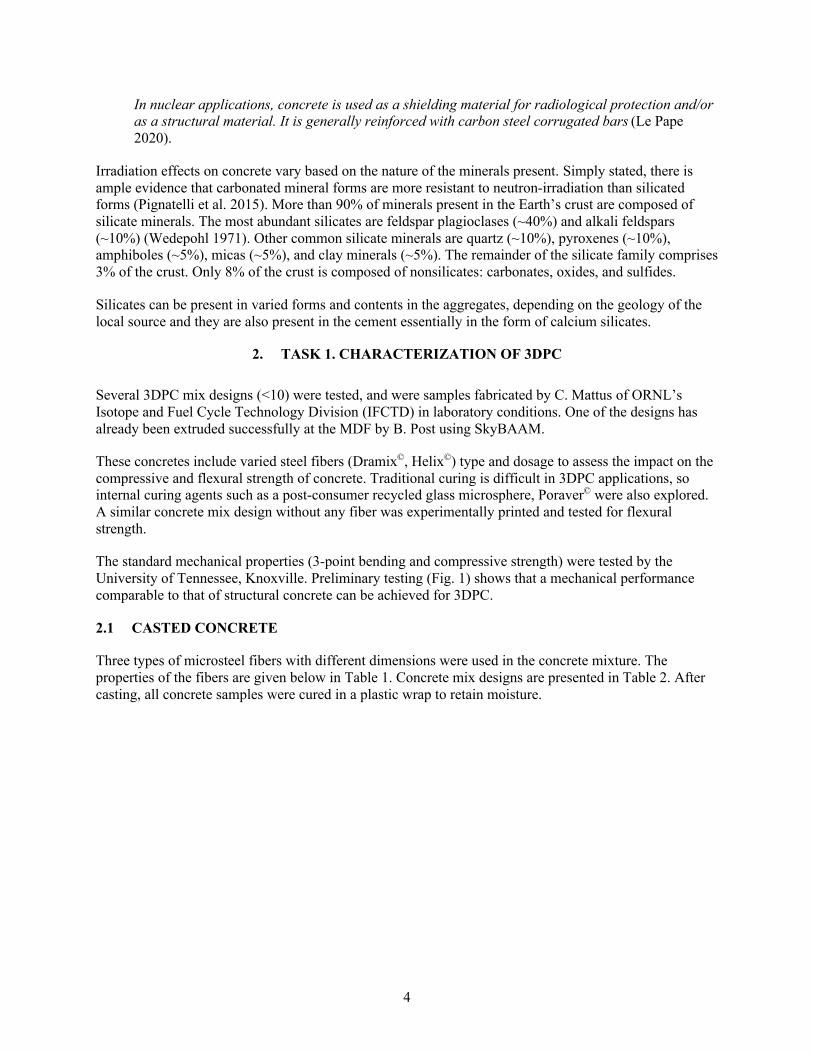
Table 1. Properties of steel fibers used in concrete mix
Fiber types
Length (mm)
Equivalent diameter
(mm)
Aspect ratio Cross section Specific
gravity
Tensile strength (MPa)
Fiber pictures
Dramix 13/0.20 13 0.2 65 Round
straight 7.17 2,600
Helix 13/0.5 13 0.5 26 Round twisted 7.85 1,699
Carbon X 19 0.6 33 Rectangular straight 7.85 758
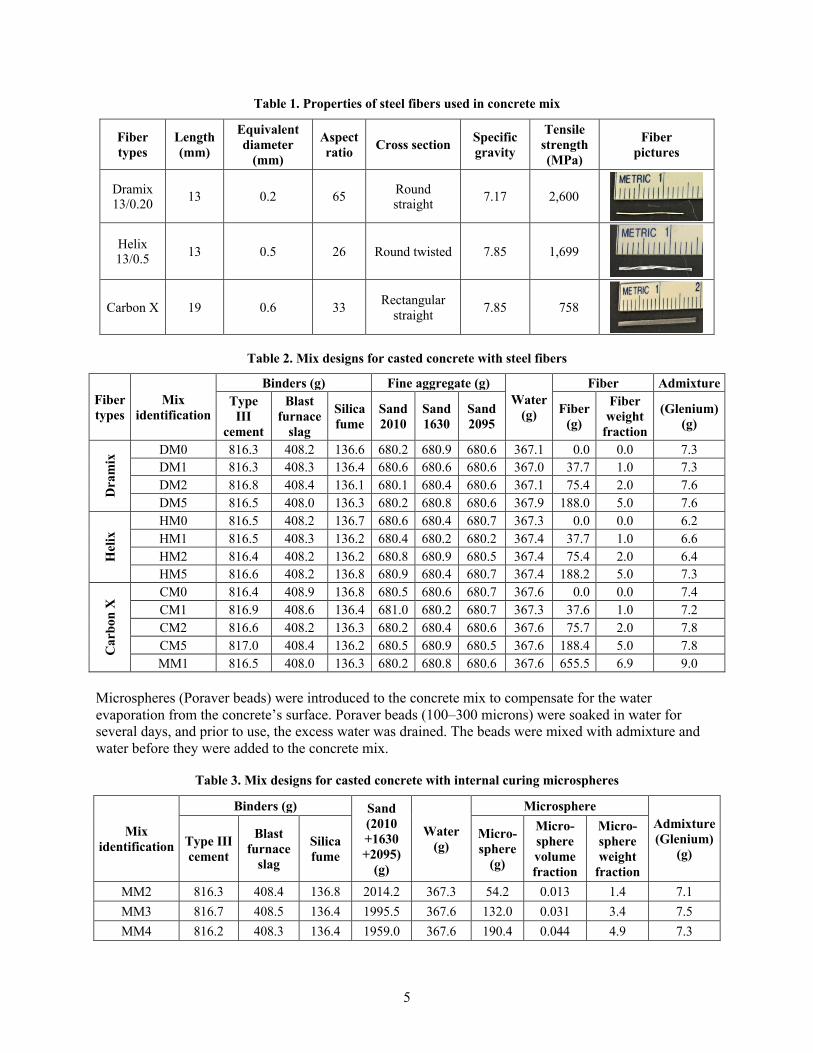
Table 2. Mix designs for casted concrete with steel fibers
Fiber types
Mix identification
Binders (g) Fine aggregate (g) Water
(g)
Fiber Admixture Type III
cement
Blast furnace
slag
Silica fume
Sand 2010
Sand 1630
Sand 2095
Fiber (g)
Fiber weight
fraction
(Glenium) (g)
Dra
mix
DM0 816.3 408.2 136.6 680.2 680.9 680.6 367.1 0.0 0.0 7.3 DM1 816.3 408.3 136.4 680.6 680.6 680.6 367.0 37.7 1.0 7.3 DM2 816.8 408.4 136.1 680.1 680.4 680.6 367.1 75.4 2.0 7.6 DM5 816.5 408.0 136.3 680.2 680.8 680.6 367.9 188.0 5.0 7.6
Hel
ix HM0 816.5 408.2 136.7 680.6 680.4 680.7 367.3 0.0 0.0 6.2
HM1 816.5 408.3 136.2 680.4 680.2 680.2 367.4 37.7 1.0 6.6 HM2 816.4 408.2 136.2 680.8 680.9 680.5 367.4 75.4 2.0 6.4 HM5 816.6 408.2 136.8 680.9 680.4 680.7 367.4 188.2 5.0 7.3
Car
bon
X CM0 816.4 408.9 136.8 680.5 680.6 680.7 367.6 0.0 0.0 7.4
CM1 816.9 408.6 136.4 681.0 680.2 680.7 367.3 37.6 1.0 7.2 CM2 816.6 408.2 136.3 680.2 680.4 680.6 367.6 75.7 2.0 7.8 CM5 817.0 408.4 136.2 680.5 680.9 680.5 367.6 188.4 5.0 7.8 MM1 816.5 408.0 136.3 680.2 680.8 680.6 367.6 655.5 6.9 9.0
Microspheres (Poraver beads) were introduced to the concrete mix to compensate for the water evaporation from the concrete’s surface. Poraver beads (100–300 microns) were soaked in water for several days, and prior to use, the excess water was drained. The beads were mixed with admixture and water before they were added to the concrete mix.
Table 3. Mix designs for casted concrete with internal curing microspheres
Mix identification
Binders (g) Sand (2010 +1630 +2095)
(g)
Water (g)
Microsphere Admixture (Glenium)
(g) Type III cement
Blast furnace
slag
Silica fume
Micro-sphere
(g)
Micro-sphere volume fraction
Micro-sphere weight
fraction MM2 816.3 408.4 136.8 2014.2 367.3 54.2 0.013 1.4 7.1 MM3 816.7 408.5 136.4 1995.5 367.6 132.0 0.031 3.4 7.5 MM4 816.2 408.3 136.4 1959.0 367.6 190.4 0.044 4.9 7.3

6
2.2 TESTING
2.2.1 Fresh Concrete Properties
Slump tests were conducted to determine the workability of concrete mixtures with CarbonX fibers and internal curing microspheres.
Table 4. Summary of slump test data of concrete mix with CarbonX fibers and Poraver beads
Mix identification Additional components Weight fraction Slump (mm)
CM0
CarbonX
0.0 13.5 CM1 1.0 8.8 CM2 2.0 17.6 CM5 5.0 14.3 MM2
Internal curing microspheres
1.4 4.0 MM3 3.4 9.1 MM4 4.9 20.6
2.2.2 Hardened Concrete Properties
32 2 × 2 × 10 in3 (50.8 × 50.8 × 254 mm3) concrete prisms were used for the central loading flexural strength test (ASTM C 348). Two 2 × 2 in3 (50.8 × 50.8 mm3) cubes were cut from failed concrete prisms using a mortar saw. These cubes were subjected to a compressive strength test according to ASTM C349. The loading rate was determined according to ASTM C 109.
7
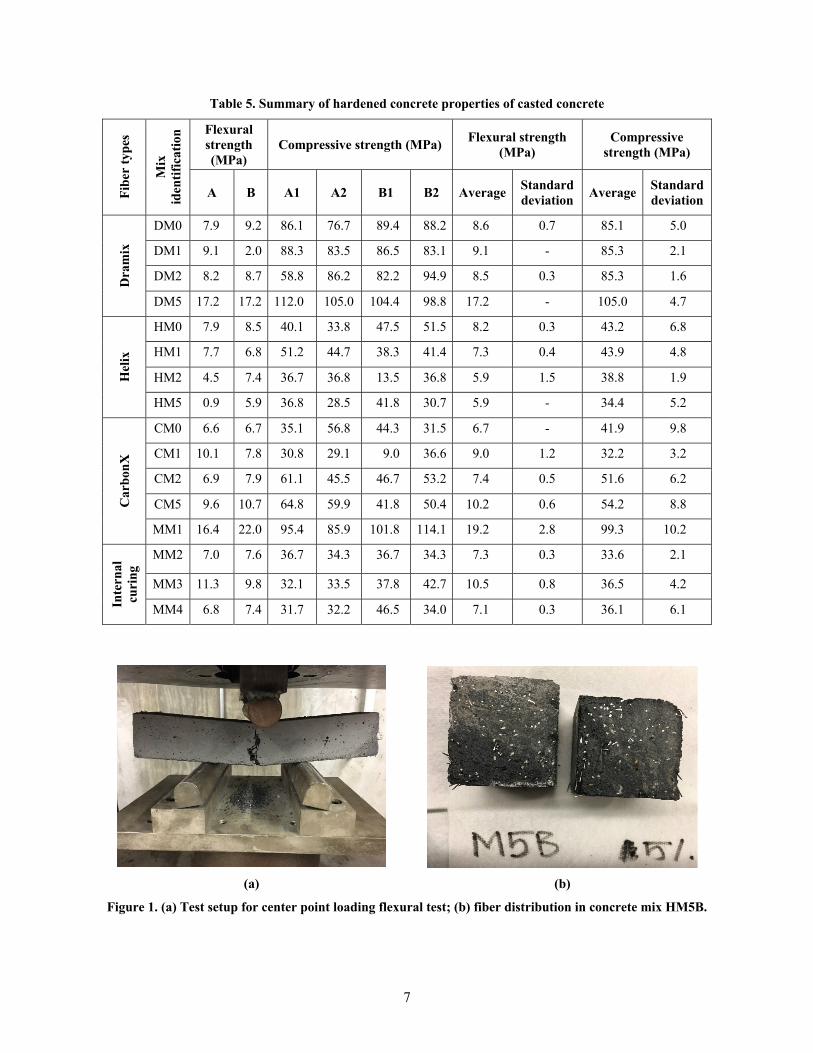
Table 5. Summary of hardened concrete properties of casted concrete Fi
ber
type
s
Mix
id
entif
icat
ion Flexural
strength (MPa)
Compressive strength (MPa) Flexural strength (MPa)
Compressive strength (MPa)
A B A1 A2 B1 B2 Average Standard deviation Average Standard
deviation
Dra
mix
DM0 7.9 9.2 86.1 76.7 89.4 88.2 8.6 0.7 85.1 5.0
DM1 9.1 2.0 88.3 83.5 86.5 83.1 9.1 - 85.3 2.1
DM2 8.2 8.7 58.8 86.2 82.2 94.9 8.5 0.3 85.3 1.6
DM5 17.2 17.2 112.0 105.0 104.4 98.8 17.2 - 105.0 4.7
Hel
ix
HM0 7.9 8.5 40.1 33.8 47.5 51.5 8.2 0.3 43.2 6.8
HM1 7.7 6.8 51.2 44.7 38.3 41.4 7.3 0.4 43.9 4.8
HM2 4.5 7.4 36.7 36.8 13.5 36.8 5.9 1.5 38.8 1.9
HM5 0.9 5.9 36.8 28.5 41.8 30.7 5.9 - 34.4 5.2
Car
bonX
CM0 6.6 6.7 35.1 56.8 44.3 31.5 6.7 - 41.9 9.8
CM1 10.1 7.8 30.8 29.1 9.0 36.6 9.0 1.2 32.2 3.2
CM2 6.9 7.9 61.1 45.5 46.7 53.2 7.4 0.5 51.6 6.2
CM5 9.6 10.7 64.8 59.9 41.8 50.4 10.2 0.6 54.2 8.8
MM1 16.4 22.0 95.4 85.9 101.8 114.1 19.2 2.8 99.3 10.2
Inte
rnal
cu
ring
MM2 7.0 7.6 36.7 34.3 36.7 34.3 7.3 0.3 33.6 2.1
MM3 11.3 9.8 32.1 33.5 37.8 42.7 10.5 0.8 36.5 4.2
MM4 6.8 7.4 31.7 32.2 46.5 34.0 7.1 0.3 36.1 6.1
(a) (b)
Figure 1. (a) Test setup for center point loading flexural test; (b) fiber distribution in concrete mix HM5B.

8
2.2.3 Observations
Figures 2a and 2b present the flexural and compressive strength of concrete at different fiber volume fractions. Fiber reinforcement does not show significant impact on flexural or compressive strength at low volume fraction (<1%). Both mechanical properties increase for concrete reinforced with Dramix and CarbonX fiber at a volume fraction of 1.5% or more.
The compressive strength of the DM series shown in Table 5 is significantly higher than the rest of the concrete batches, although the mortar mix designs for all of the concrete batches were almost the same. The reason behind this anomaly is not yet understood.
(a) (b)
Figure 2. (a) Flexural strength at 28 days; (b) compressive strength at 28 days.
Internal cured concrete specimens did not show any significant increase in compressive and flexural strength. However, microsphere weight fraction positively impacted the concrete slump.
2.2.4 3D-Printed Concrete Mix Designs
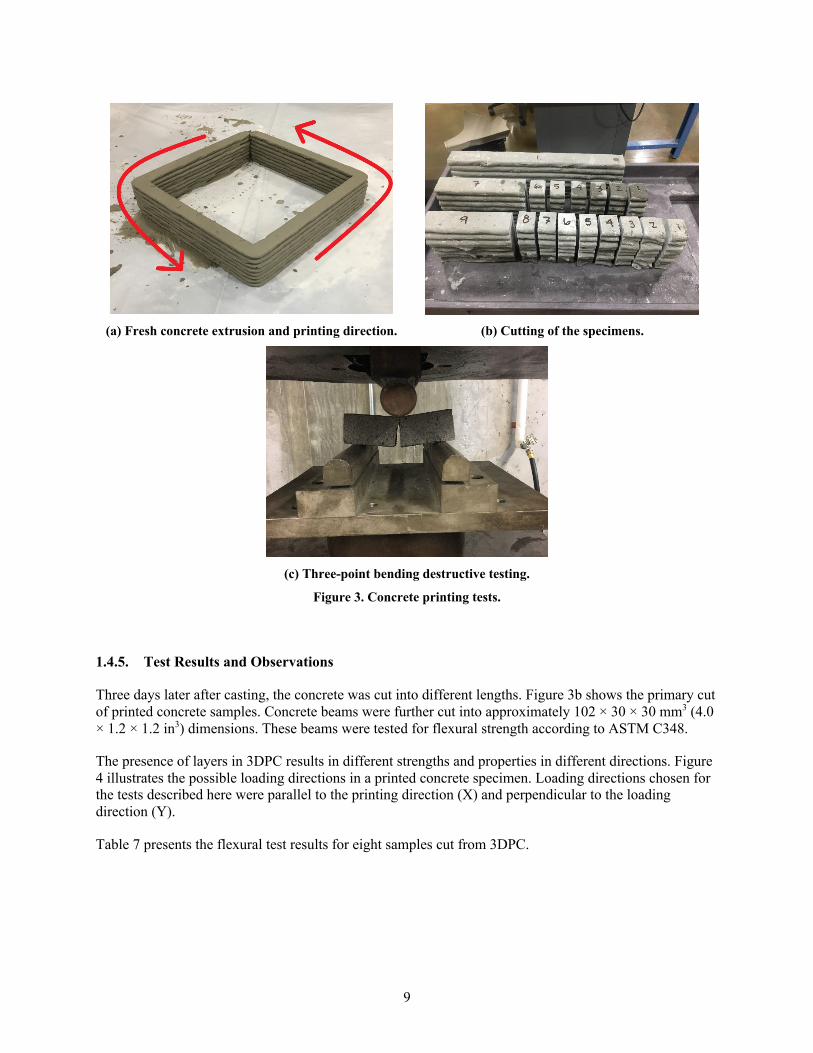
Concrete mixes were printed using a 1.5-inch (38 mm) round nozzle with the horizontal SkyBAAM extruder. Eight layers of concrete, each with a layer height of 0.6 inches (15 mm) were printed. The average time required to complete each layer was 1 minute and 38 seconds. Figure 3a shows the final printed concrete and the print direction. Composition of the matrix structure by weight ratio is presented in Table 6. Printed concrete was cured in a plastic wrap to retain moisture.
Table 6. Weight proportion of printed concrete
Cement (Type III) Silica fume Blast furnace
slag Sand Water Admixture (Glenium)
1.00 0.17 0.5 2.5 0.625 0.0091
0.0
5.0
10.0
15.0
20.0
25.0
0.0 1.0 2.0 3.0 4.0 5.0 6.0
Flex
ural
Str
engt
h (M
Pa)
Fiber Volume FractionDramix Fiber Helix Fiber Carbon X
0.0
20.0
40.0
60.0
80.0
100.0
120.0
0.0 2.0 4.0 6.0Com
pres
sive
Stre
ngth
(MPa
)
Fiber Volume FractionDramix Fiber Helix Fiber Carbon X
9
(a) Fresh concrete extrusion and printing direction. (b) Cutting of the specimens.
(c) Three-point bending destructive testing.
Figure 3. Concrete printing tests.
1.4.5. Test Results and Observations
Three days later after casting, the concrete was cut into different lengths. Figure 3b shows the primary cut of printed concrete samples. Concrete beams were further cut into approximately 102 × 30 × 30 mm3 (4.0 × 1.2 × 1.2 in3) dimensions. These beams were tested for flexural strength according to ASTM C348.
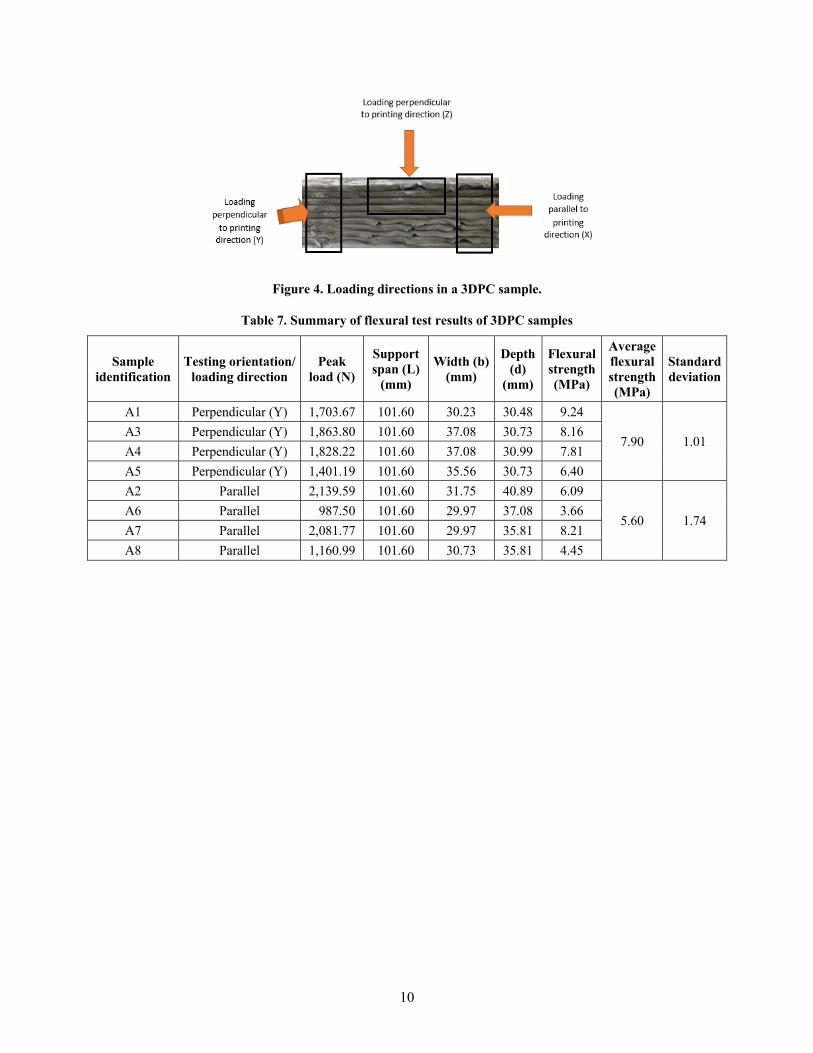
The presence of layers in 3DPC results in different strengths and properties in different directions. Figure 4 illustrates the possible loading directions in a printed concrete specimen. Loading directions chosen for the tests described here were parallel to the printing direction (X) and perpendicular to the loading direction (Y).
Table 7 presents the flexural test results for eight samples cut from 3DPC.
10
Figure 4. Loading directions in a 3DPC sample.
Table 7. Summary of flexural test results of 3DPC samples
Sample identification
Testing orientation/ loading direction
Peak load (N)
Support span (L)
(mm)
Width (b) (mm)
Depth (d)
(mm)
Flexural strength (MPa)
Average flexural strength (MPa)
Standard deviation
A1 Perpendicular (Y) 1,703.67 101.60 30.23 30.48 9.24
7.90 1.01 A3 Perpendicular (Y) 1,863.80 101.60 37.08 30.73 8.16 A4 Perpendicular (Y) 1,828.22 101.60 37.08 30.99 7.81 A5 Perpendicular (Y) 1,401.19 101.60 35.56 30.73 6.40 A2 Parallel 2,139.59 101.60 31.75 40.89 6.09
5.60 1.74 A6 Parallel 987.50 101.60 29.97 37.08 3.66 A7 Parallel 2,081.77 101.60 29.97 35.81 8.21 A8 Parallel 1,160.99 101.60 30.73 35.81 4.45
11
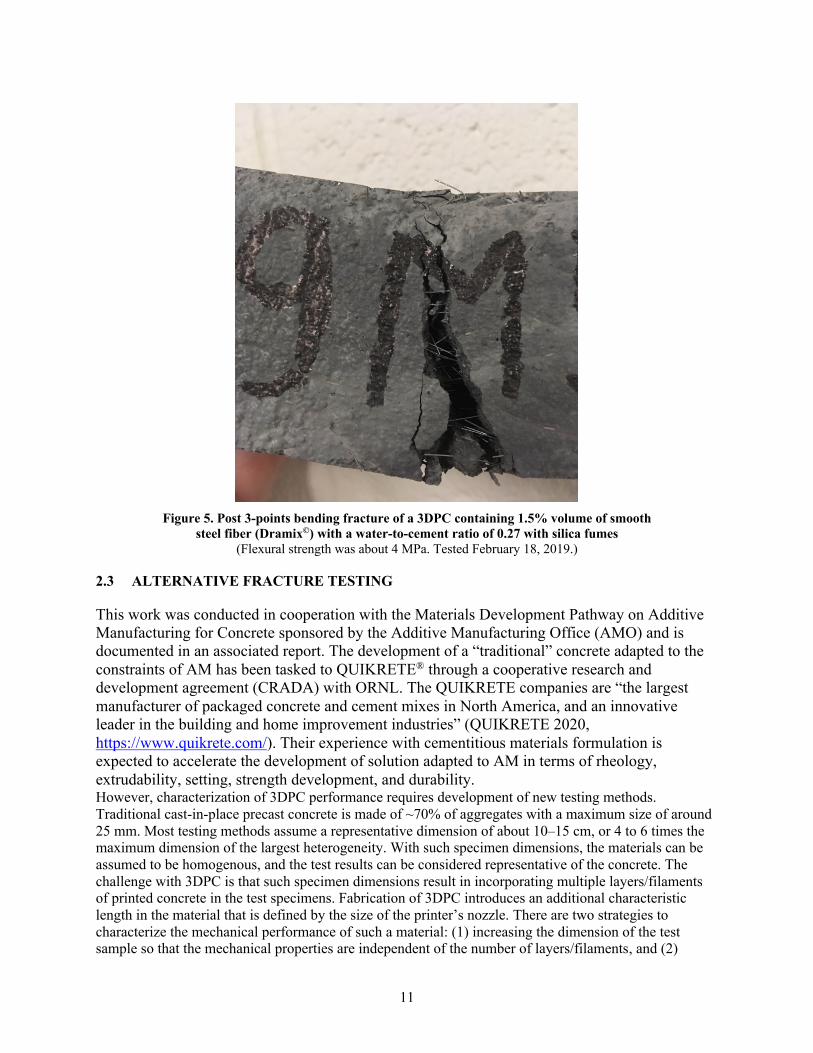
Figure 5. Post 3-points bending fracture of a 3DPC containing 1.5% volume of smooth
steel fiber (Dramix©) with a water-to-cement ratio of 0.27 with silica fumes (Flexural strength was about 4 MPa. Tested February 18, 2019.)
2.3 ALTERNATIVE FRACTURE TESTING
This work was conducted in cooperation with the Materials Development Pathway on Additive Manufacturing for Concrete sponsored by the Additive Manufacturing Office (AMO) and is documented in an associated report. The development of a “traditional” concrete adapted to the constraints of AM has been tasked to QUIKRETE® through a cooperative research and development agreement (CRADA) with ORNL. The QUIKRETE companies are “the largest manufacturer of packaged concrete and cement mixes in North America, and an innovative leader in the building and home improvement industries” (QUIKRETE 2020, https://www.quikrete.com/). Their experience with cementitious materials formulation is expected to accelerate the development of solution adapted to AM in terms of rheology, extrudability, setting, strength development, and durability. However, characterization of 3DPC performance requires development of new testing methods. Traditional cast-in-place precast concrete is made of ~70% of aggregates with a maximum size of around 25 mm. Most testing methods assume a representative dimension of about 10–15 cm, or 4 to 6 times the maximum dimension of the largest heterogeneity. With such specimen dimensions, the materials can be assumed to be homogenous, and the test results can be considered representative of the concrete. The challenge with 3DPC is that such specimen dimensions result in incorporating multiple layers/filaments of printed concrete in the test specimens. Fabrication of 3DPC introduces an additional characteristic length in the material that is defined by the size of the printer’s nozzle. There are two strategies to characterize the mechanical performance of such a material: (1) increasing the dimension of the test sample so that the mechanical properties are independent of the number of layers/filaments, and (2)
12
limiting the size of the test specimens to a couple of layers/filaments to isolate the effect of the interface created by the printing. Both approaches are complimentary. The first approach is currently under development at the Virginia Polytechnic Institute and State University (Virginia Tech). ORNL is focusing on the second approach because it is quite evident that the weak element of the materials resides in the layer/filament interface. It is deemed important to develop a testing method capable of characterizing the effects of the concrete formulation (e.g., presence/absence of fiber-reinforcement), the adhesion properties influenced by the delay time between two layers/filaments prints, the humidity of the interface, and the stitching of the interface if a viable technological solution emerges in the near future. The current work focuses on developing a mechanical test adapted to characterize the performance of 3DPC.
The work plan is as follows:
1. Establish a mechanical test protocol adapting a compact tension (CT) test typically used for metals to characterize the fracture properties of plain concrete (no interface) between two layer/filament prints.
2. Validate that the mechanical properties derived from the fracture test are coherent with other testing methods such as the 3-points bending test on notched bars.
3. Develop a laboratory fabrication protocol to create bilayered concrete, allowing for accurate location of the position of the interface.
4. Test the effects of a casting delay between two layers on the fracture properties of the interface.
5. Test the fracture properties of concrete (QUIKRETE formulations) printed at the MDF using the SkyBAAM system.
At the time of this report, Phase 1 has been completed and is documented in the next section. Work continues to improve the test instrumentation by adding ladder gauges to improve tracking of the fracture propagation and deploying digital image correlation (DIC) to obtain the surface strain field during testing. Preliminary results on Phase 2 provide good confidence on the quality of the test protocol. Phase 5 has been initiated by collecting large samples cut from recent prints made at the MDF. Work also continues to determine the most appropriate method to prepare CT specimens extracted form large printed samples.
The next section is also documented in the quarterly report (FY19 Q1) on materials development for 3DPC-like systems. It is reproduced here for the sake of completeness.
2.3.1 Test Setup
The test was conducted based on ASTM E 399 (Standard Test Method for Linear-Elastic Plane-Strain Fracture Toughness KIC of Metallic Materials).
• Load cell capacity: 2 kips • Loading rate: 0.0003 in/sec

13
Figure 6. Test setup for CT test (a) with a tie-on extensometer, and (b) with a clip-on extensometer.
2.3.2 Dimensions
A few trial CT specimens with varied dimensions were tested before a configuration was selected to use for the remainder of the specimens. The specimen dimensions of the CT samples are shown in Figure 7 and Table 8 below. Preliminary tests showed that, due to the width of the notch, the fracture initiated is one angle of the notch tip which could result in an initial crack orientation not aligned with the plane of the notch. Hence, a thinner secondary notch was added to the original design to force the crack initiation direction. This secondary notch was created using a wire saw.
Figure 7. Specimen configuration.

14
Table 8. Specimen configuration and dimensions
Dimension SI (mm) Imperial (inch) SI (mm) Imperial (inch)
Without second notch With second notch Diameter (D) 9.53 0.375 (12/32) 9.53 0.375 (12/32)
dd 30.48 0.5 (1) 30.48 0.5 (1) Length of first notch(L) 22.23 0.875 (28/32) 17.46 0.6875 (22/32) Length of second notch - - 4.76 0.1875 (6/32)
Width of crack ~1.58 ~0.063 (2/32) ~1.58 ~0.063 (2/32) Min. cover (Top) (CTop) 7.94 0.313 (10/32) 7.94 0.313 (10/32) Min. cover (Side) (Cside) 7.94 0.31” (10/32) 7.94 0.313 (10/32)
Width (B) 19.8 0.781 (25/32) 19.8 0.781 (25/32)
2.3.3 Sample Preparation
Concrete samples were cast in 2 × 2 × 11 prisms and demolded after 24 hours. Specimens were prepared from the prisms, using a computer numerical control (CNC) machine to slice, grind, and core drill. The machining procedure followed is given below:
1. Diamond grinding wheel (220 grit) 3,500 rpm, down feed of .0005inches per pass. 2. Diamond slicing wheel (100 grit) 3,500 rpm, down feed of .0005 inches per pass. 3. Diamond core drill (120 grit) 1,000 rpm, down feed 0.3 inches per minute.
2.3.4 Experimental Data
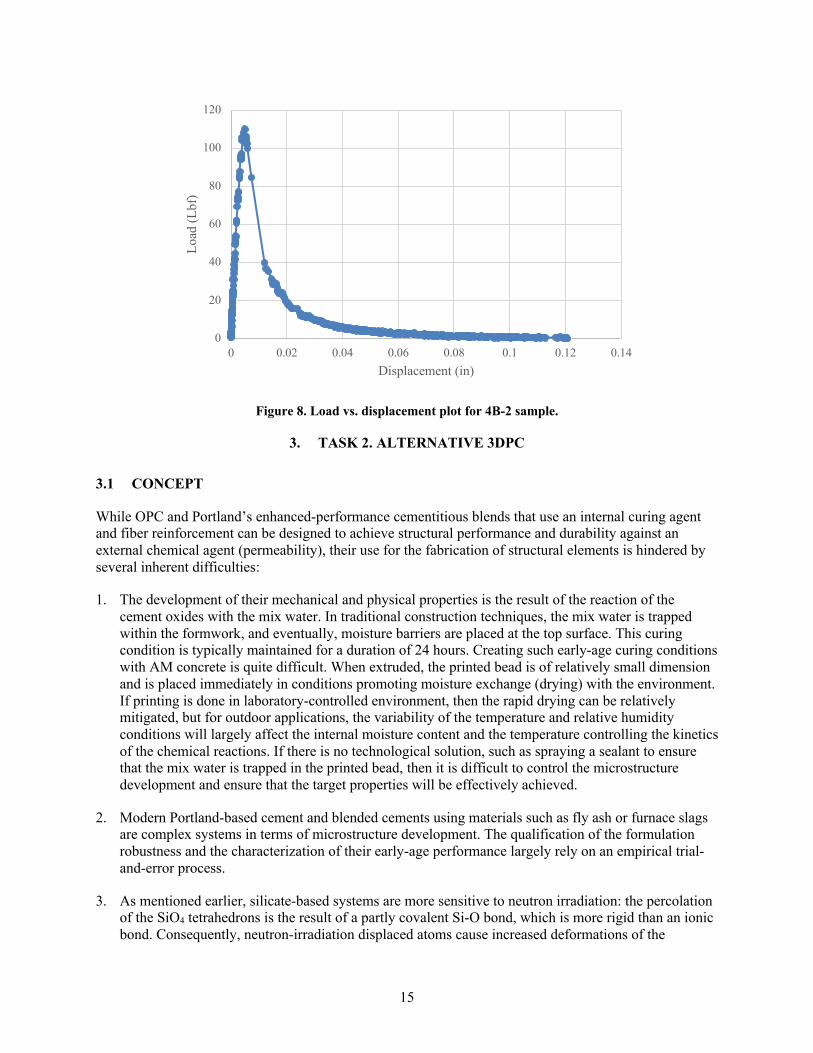
Two types of concrete mix designs were used to prepare the samples for CT tests. 4B specimens were used for the CT test 8 months after casting, whereas CT2 specimens were used 15 days after casting. A summary of the test results is presented in Table 7. Figure 8 presents a typical load-displacement curve obtained during a CT test. The loading rate (0.0003 in./sec) is sufficiently low to capture the post-peak behavior, which is difficult to obtain because of the quasi-brittleness of unreinforced cementitious materials.
Table 9. Experimental test results from CT test
Sample identification
Compressive strength at 28
days (psi) Notch length Extensometer Peak load
(Lbf) Loading
rate (in/sec) KQ
ksi√in
4B-1 5,231 0.875 inches (22.23 mm)
Clip on 152 0.0003 0.935
CT2-1 8,953 0.875 inches (22.23 mm)
None 122.7 0.0003 0.755
CT2-2 8,953 0.875 inches (22.23 mm)
None 122.25 0.0003 0.752
CT2-3 8,953 0.875 inches (22.23 mm)
None 141.8 0.0003 0.873
4B-2 5,231 1.06 inches (26.99 mm)
Tie on 109.8 0.0003 0.677
15
Figure 8. Load vs. displacement plot for 4B-2 sample.
3. TASK 2. ALTERNATIVE 3DPC
3.1 CONCEPT
While OPC and Portland’s enhanced-performance cementitious blends that use an internal curing agent and fiber reinforcement can be designed to achieve structural performance and durability against an external chemical agent (permeability), their use for the fabrication of structural elements is hindered by several inherent difficulties:
1. The development of their mechanical and physical properties is the result of the reaction of the cement oxides with the mix water. In traditional construction techniques, the mix water is trapped within the formwork, and eventually, moisture barriers are placed at the top surface. This curing condition is typically maintained for a duration of 24 hours. Creating such early-age curing conditions with AM concrete is quite difficult. When extruded, the printed bead is of relatively small dimension and is placed immediately in conditions promoting moisture exchange (drying) with the environment. If printing is done in laboratory-controlled environment, then the rapid drying can be relatively mitigated, but for outdoor applications, the variability of the temperature and relative humidity conditions will largely affect the internal moisture content and the temperature controlling the kinetics of the chemical reactions. If there is no technological solution, such as spraying a sealant to ensure that the mix water is trapped in the printed bead, then it is difficult to control the microstructure development and ensure that the target properties will be effectively achieved.
2. Modern Portland-based cement and blended cements using materials such as fly ash or furnace slags are complex systems in terms of microstructure development. The qualification of the formulation robustness and the characterization of their early-age performance largely rely on an empirical trial-and-error process.
3. As mentioned earlier, silicate-based systems are more sensitive to neutron irradiation: the percolation of the SiO4 tetrahedrons is the result of a partly covalent Si-O bond, which is more rigid than an ionic bond. Consequently, neutron-irradiation displaced atoms cause increased deformations of the
0
20
40
60
80
100
120
0 0.02 0.04 0.06 0.08 0.1 0.12 0.14
Load
(Lbf
)
Displacement (in)

16
crystalline network, leading to greater damage and expansion. Carbonated minerals (calcite, dolomite, ankerite, vaterite, etc.) are quite insensitive to irradiation-induced expansion.
To overcome those inherent difficulties, a radically different approach based on carbonated systems has been developed in cooperation with Pr. Gaurav Sant at UCLA. Historically, decarbonated limestone was used to create slacked lime, which was used in the form of slurries for mortar joints in the construction of stone buildings such as medieval cathedrals. The general principle is based on the cycle of limestone:
1. a. Limestone (CaCO3) is decarbonated at 800°C to create calcium oxide (CaO)
2. The latter is mixed with water to create calcium hydroxides slurries—Ca(OH)2,
3. One placed, the slurry gradually recovers its original stable mineral forms as calcite (CaCO3) by reaction with the carbon dioxide present in the atmosphere and releasing water.
This process occurs slowly in normal atmospheric conditions (temperature, pressure, and CO2
concentration), so it is not a viable solution for early-age structural performance. However, when conditions are improved, recent literature provides evidence of performance comparable to hydrated cements.
Two approaches can be considered to fabricate performant elements: (1) creating pre-cast modular elements in a high-pressure CO2 chamber, and (2) injecting trapped CO2 in the printed bead during the AM fabrication.
Given the simplicity of the chemical system, the microstructure development is expected to be controlled by the specific surface of the calcium hydroxide particles, the carbon dioxide concentration initially present in the system, and its permeability. Printability properties will primarily be governed by the slurry rheology.
The advantages of this alternative approach using carbonated cement materials are:
1. Improved control of the microstructure development
2. Continued improvement of performance over time through the natural intake of atmospheric CO2
3. Neutral CO2 emission (in 2016, world cement production generated around 2.2 billion tons of CO2, which is equivalent to 8% of the global total)
4. Lower energy requirement for the fabrication of calcium hydroxide (800°C) than cement (1,450°C)
5. Intrinsically insensitive to neutron-irradiation effects (low swelling at high exposure) and gamma-irradiation-induced radiolysis
A roadmap proposal has been developed to achieve the fabrication of a large-scale 3D-printed CCM-based biological shield (see figure below).
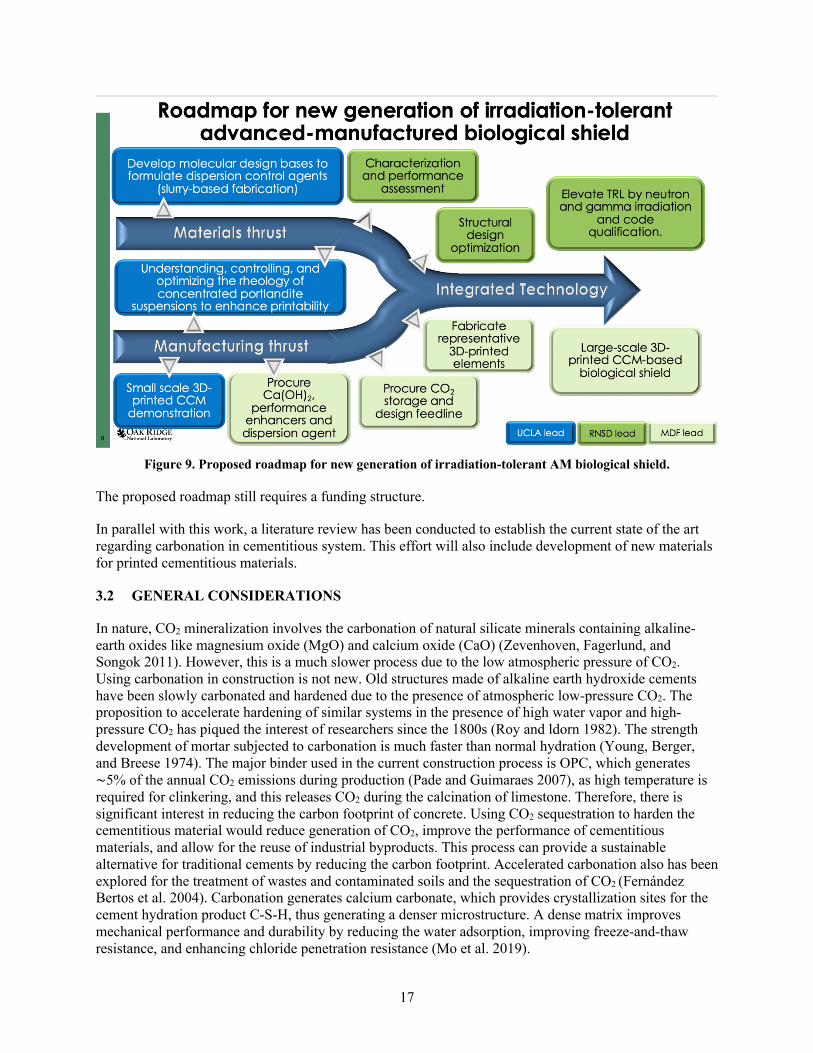
17
Figure 9. Proposed roadmap for new generation of irradiation-tolerant AM biological shield.
The proposed roadmap still requires a funding structure.
In parallel with this work, a literature review has been conducted to establish the current state of the art regarding carbonation in cementitious system. This effort will also include development of new materials for printed cementitious materials.
3.2 GENERAL CONSIDERATIONS
In nature, CO2 mineralization involves the carbonation of natural silicate minerals containing alkaline-earth oxides like magnesium oxide (MgO) and calcium oxide (CaO) (Zevenhoven, Fagerlund, and Songok 2011). However, this is a much slower process due to the low atmospheric pressure of CO2. Using carbonation in construction is not new. Old structures made of alkaline earth hydroxide cements have been slowly carbonated and hardened due to the presence of atmospheric low-pressure CO2. The proposition to accelerate hardening of similar systems in the presence of high water vapor and high-pressure CO2 has piqued the interest of researchers since the 1800s (Roy and ldorn 1982). The strength development of mortar subjected to carbonation is much faster than normal hydration (Young, Berger, and Breese 1974). The major binder used in the current construction process is OPC, which generates ∼5% of the annual CO2 emissions during production (Pade and Guimaraes 2007), as high temperature is required for clinkering, and this releases CO2 during the calcination of limestone. Therefore, there is significant interest in reducing the carbon footprint of concrete. Using CO2 sequestration to harden the cementitious material would reduce generation of CO2, improve the performance of cementitious materials, and allow for the reuse of industrial byproducts. This process can provide a sustainable alternative for traditional cements by reducing the carbon footprint. Accelerated carbonation also has been explored for the treatment of wastes and contaminated soils and the sequestration of CO2 (Fernández Bertos et al. 2004). Carbonation generates calcium carbonate, which provides crystallization sites for the cement hydration product C-S-H, thus generating a denser microstructure. A dense matrix improves mechanical performance and durability by reducing the water adsorption, improving freeze-and-thaw resistance, and enhancing chloride penetration resistance (Mo et al. 2019).
18
As the carbonation of cementitious material accelerates the strength gain of cementitious materials without depending solely on the water/binder ratio, it can be beneficial for AM of concrete. The water/binder ratio can be used to control a fresh property like extrudability, and carbonation can be used to control early strength gain and buildability. Evaporation of water during printing is a concern during 3D printing of concrete. However, this effect can work in favor of carbonation. Water evaporation will lead to less pore block and better diffusion of CO2 during carbonation. Carbonation is a diffusion-controlled reaction, so the effective area of carbonation can be selective. Introducing CO2 near the filament joining points for 3DPC can improve interlayer bonding.
3.3 MATERIALS
The chemical composition of the solid and the environment both affect CO2 reactivity. The material properties required for effective carbonation are shown in Table 10.
Table 10. Chemical properties required for effective carbonation (Fernández Bertos et al. 2004).
Property Requirements Solid composition Inorganic material containing hydraulic, pozzolanic, lime-bearing or other CO2-reactive
calcium and/or silicon salts pH The alkaline environment of the solid is needed for the metal hydroxides to form carbonates
in the presence of CO2 Ca content A higher concentration of available Ca in the material results in better carbonation (Johnson
2000) Ca/Si ratio The higher the ratio, the higher the degree of carbonation (Hills, Sweeney, and Buenfeld
1999) Free water content Although water is necessary to initiate the CO2 dissolution, an excess of water limits the rate
of carbonation by hindering the diffusion Microstructure Higher microporosity of the hydration products allows better dispersion of CO2, thus better
carbonation Specific surface area
Materials with lower surface are need less water to have optimum carbonation (Johannesson and Utgenannt 2001), while higher surface area increases reactivity (Huijgen, Witkamp, and Comans 2005)
Different types of alkaline industrial waste with high Ca and Mg contents are intensively studied by researchers to be used as raw materials for carbonation due to their easy abundance and favorable chemical compositions. Carbonation of calcium (Ca) or magnesium (Mg) from silicate minerals mimics the naturally occurring process and can result in carbonation at very low concentrations of CO2 (Humbert and Castro-Gomes 2019, Vance et al. 2015, Ebrahimi et al. 2017). Table 11 shows the materials studied for carbonation with and without OPC.
19
Table 11. Mechanical performance and efficiency of the materials utilized by carbonation
Reference Raw materials Compressive strength MPa
CO2 uptake End product
(Ghouleh, Guthrie, and Shao 2015) KOBM steel slag 110.6 0-13.22 C-S-H CaCO3
(Mahoutian, Ghouleh, and Shao 2014)
Ladle slag 39.5 4.0-12.8 C-S-H C-A-H CaCO3
(Mahoutian et al. 2015) EAF Steel slag 20.1 1.7-4.6 C-S-H CaCO3 Ca(OH)
(Mahoutian, Chaallal, and Shao 2018)
Steel slag 35.9 3.3-4.8 C-S-H CaCO3 Ca(OH)
(Mo, Zhang, and Deng 2016) Steel slag + PC 61.3 - CaCO3
(Moon and Choi 2018) Steel slag 29.1 13-17 CaCO3
Mo et al. 2019 Magnesium slag 119.5 13.4-15.2 CaCO3
Steel slag is not used in construction due to its lack of hydraulic of pozzolanic properties. However, high reactivity to CO2 makes it a suitable option for carbon-cured cementitious material. Di-calcium silicates in the slag react with CO2 to form nonhydraulic calcium–silicate–hydrates and calcium carbonates (Ghouleh, Guthrie, and Shao 2015). Mo et al. (2017) studied grounded steel slag and steel slag aggregate (coarse and fine), which showed higher compressive strength compared to concrete with natural aggregates. The interface between slag aggregate and binder was improved by carbonation.
Magnesium slag is composed of approximately 7% MgO and 54% CaO. Although MgO is difficult to carbonate and remains in the matrix in the form of periclase, the presence of Mg2+ promotes the connectivity and agglomeration of the calcium carbonate. This yields a denser matrix and a higher mechanical strength (Mo et al. 2019). Work by Mo and Panesar (2013) indicates that involvement of reactive MgO percentage does not improve CO2 uptake.
A different approach was considered by Calera co. (Monteiro et al. 2013) in which carbonated precipitate, vaterite, calcite, and another amorphous phase of calcite were mixed with Portland cement, followed by a traditional curing process. Samples with 20% calcite precipitate showed slightly higher compressive strength for up to 7 days. Ebrahimi et al. (2017) partially replaced the OPC with carbonated slurry of fly ash, which resulted in lower strength in 100% OPC samples.
3.4 CARBONATION PROCESS
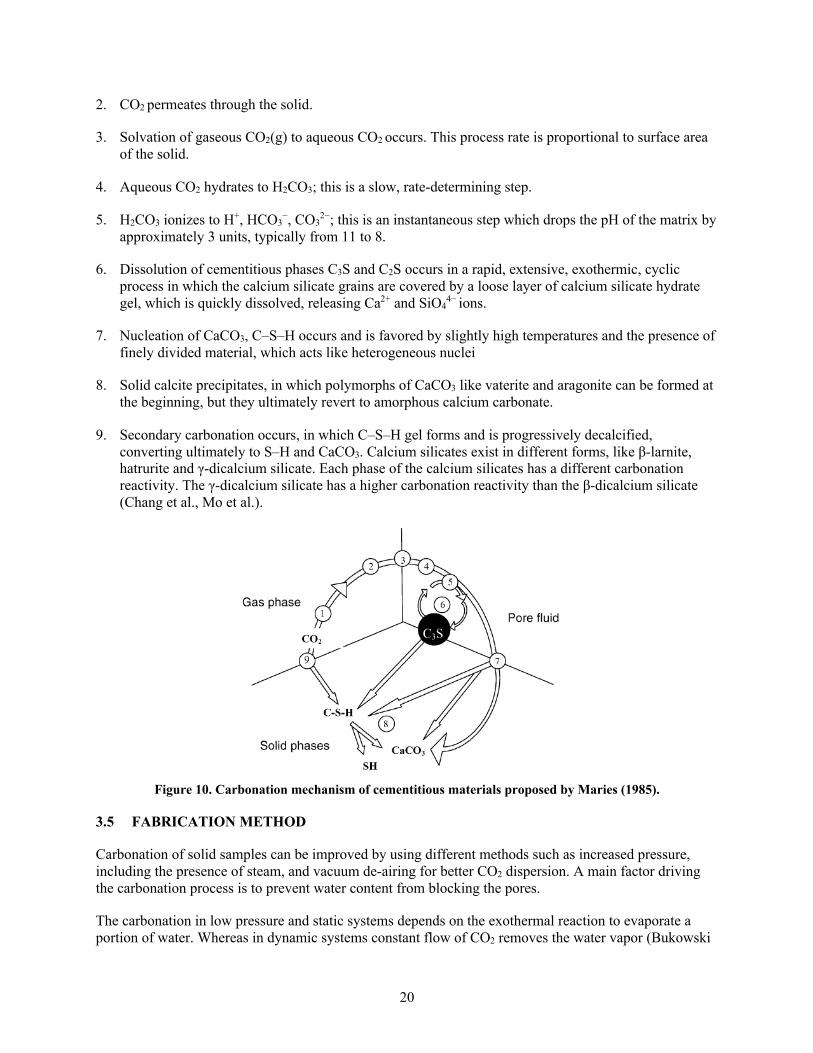
Carbonation requires the presence of water in the form of vapor or liquid to be adsorbed on the solid to initiate the reaction. Once initiated, the reaction is self-sustaining, as the chemical transformation from portlandite to calcite releases water (Vance et al. 2015). Most calcium silicate minerals react readily with CO2, which results in the production of monolithic materials. The carbonation of calcium oxides undergoes the dissolution-precipitation process. Figure 2 illustrates the reaction mechanism of cementitious material carbonation (Fernández Bertos et al. 2004). The individual steps of the reaction are:
1. CO2 diffuses in air.
20
2. CO2 permeates through the solid.
3. Solvation of gaseous CO2(g) to aqueous CO2 occurs. This process rate is proportional to surface area of the solid.
4. Aqueous CO2 hydrates to H2CO3; this is a slow, rate-determining step.
5. H2CO3 ionizes to H+, HCO3−, CO3
2−; this is an instantaneous step which drops the pH of the matrix by approximately 3 units, typically from 11 to 8.
6. Dissolution of cementitious phases C3S and C2S occurs in a rapid, extensive, exothermic, cyclic process in which the calcium silicate grains are covered by a loose layer of calcium silicate hydrate gel, which is quickly dissolved, releasing Ca2+ and SiO4
4− ions.
7. Nucleation of CaCO3, C–S–H occurs and is favored by slightly high temperatures and the presence of finely divided material, which acts like heterogeneous nuclei
8. Solid calcite precipitates, in which polymorphs of CaCO3 like vaterite and aragonite can be formed at the beginning, but they ultimately revert to amorphous calcium carbonate.
9. Secondary carbonation occurs, in which C–S–H gel forms and is progressively decalcified, converting ultimately to S–H and CaCO3. Calcium silicates exist in different forms, like β-larnite, hatrurite and γ-dicalcium silicate. Each phase of the calcium silicates has a different carbonation reactivity. The γ-dicalcium silicate has a higher carbonation reactivity than the β-dicalcium silicate (Chang et al., Mo et al.).
Figure 10. Carbonation mechanism of cementitious materials proposed by Maries (1985).
3.5 FABRICATION METHOD
Carbonation of solid samples can be improved by using different methods such as increased pressure, including the presence of steam, and vacuum de-airing for better CO2 dispersion. A main factor driving the carbonation process is to prevent water content from blocking the pores.
The carbonation in low pressure and static systems depends on the exothermal reaction to evaporate a portion of water. Whereas in dynamic systems constant flow of CO2 removes the water vapor (Bukowski
21
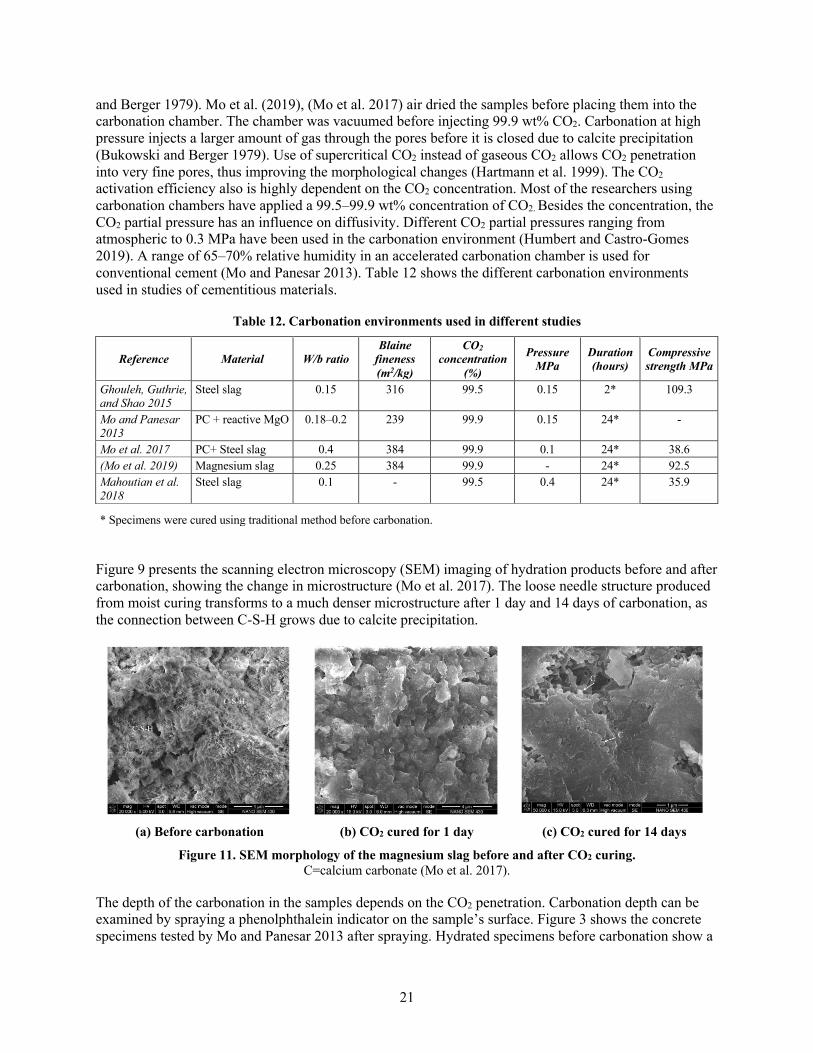
and Berger 1979). Mo et al. (2019), (Mo et al. 2017) air dried the samples before placing them into the carbonation chamber. The chamber was vacuumed before injecting 99.9 wt% CO2. Carbonation at high pressure injects a larger amount of gas through the pores before it is closed due to calcite precipitation (Bukowski and Berger 1979). Use of supercritical CO2 instead of gaseous CO2 allows CO2 penetration into very fine pores, thus improving the morphological changes (Hartmann et al. 1999). The CO2 activation efficiency also is highly dependent on the CO2 concentration. Most of the researchers using carbonation chambers have applied a 99.5–99.9 wt% concentration of CO2. Besides the concentration, the CO2 partial pressure has an influence on diffusivity. Different CO2 partial pressures ranging from atmospheric to 0.3 MPa have been used in the carbonation environment (Humbert and Castro-Gomes 2019). A range of 65–70% relative humidity in an accelerated carbonation chamber is used for conventional cement (Mo and Panesar 2013). Table 12 shows the different carbonation environments used in studies of cementitious materials.
Table 12. Carbonation environments used in different studies
Reference Material W/b ratio Blaine
fineness (m2/kg)
CO2 concentration
(%)
Pressure MPa
Duration (hours)
Compressive strength MPa
Ghouleh, Guthrie, and Shao 2015
Steel slag 0.15 316 99.5 0.15 2* 109.3
Mo and Panesar 2013
PC + reactive MgO 0.18–0.2 239 99.9 0.15 24* -
Mo et al. 2017 PC+ Steel slag 0.4 384 99.9 0.1 24* 38.6 (Mo et al. 2019) Magnesium slag 0.25 384 99.9 - 24* 92.5 Mahoutian et al. 2018
Steel slag 0.1 - 99.5 0.4 24* 35.9
* Specimens were cured using traditional method before carbonation.
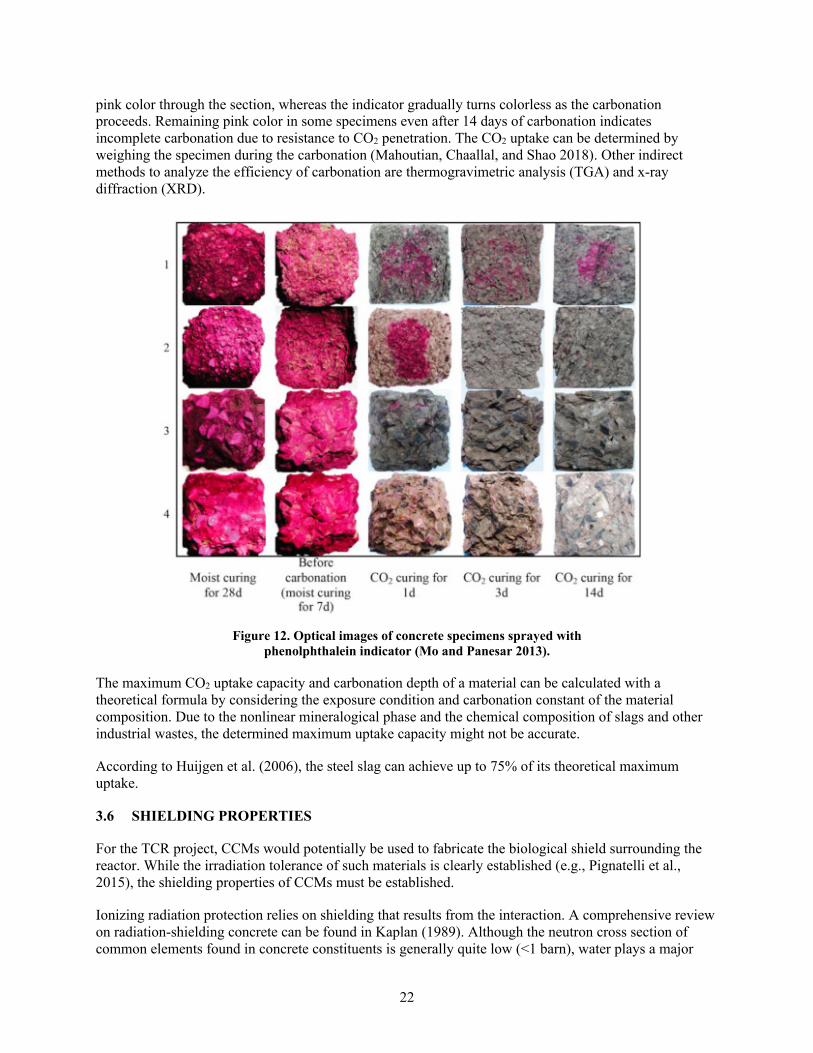
Figure 9 presents the scanning electron microscopy (SEM) imaging of hydration products before and after carbonation, showing the change in microstructure (Mo et al. 2017). The loose needle structure produced from moist curing transforms to a much denser microstructure after 1 day and 14 days of carbonation, as the connection between C-S-H grows due to calcite precipitation.
(a) Before carbonation (b) CO2 cured for 1 day (c) CO2 cured for 14 days
Figure 11. SEM morphology of the magnesium slag before and after CO2 curing. C=calcium carbonate (Mo et al. 2017).
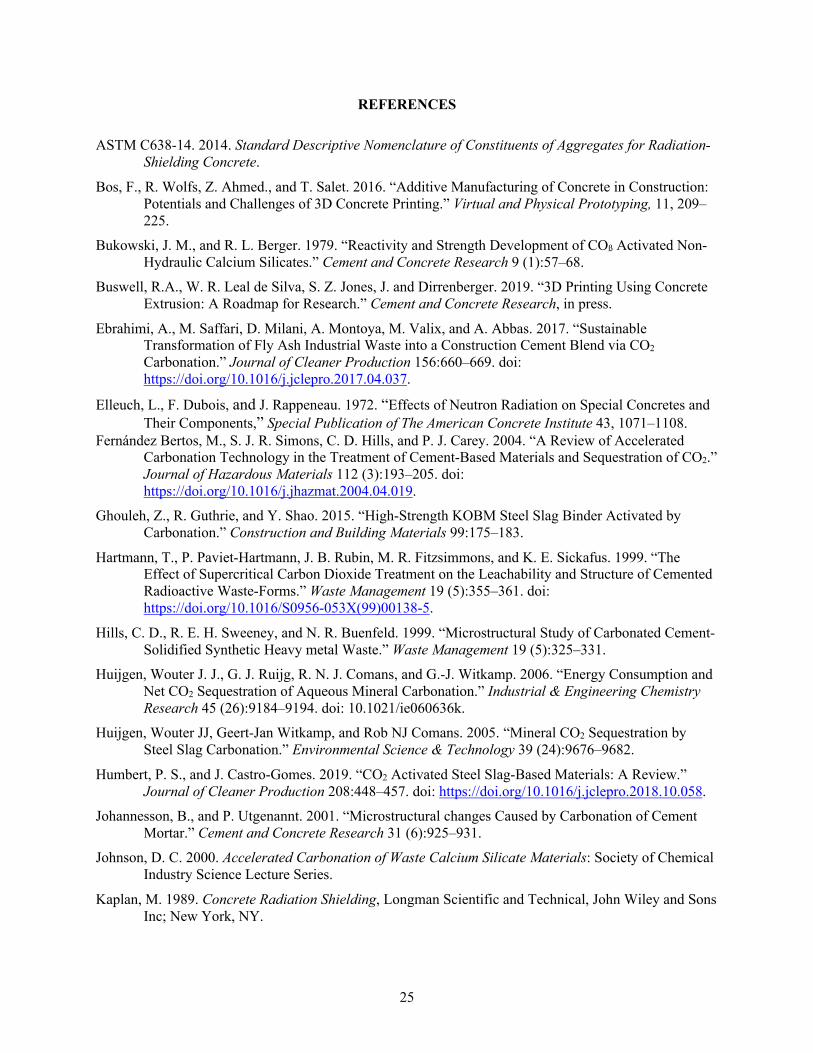
The depth of the carbonation in the samples depends on the CO2 penetration. Carbonation depth can be examined by spraying a phenolphthalein indicator on the sample’s surface. Figure 3 shows the concrete specimens tested by Mo and Panesar 2013 after spraying. Hydrated specimens before carbonation show a
22
pink color through the section, whereas the indicator gradually turns colorless as the carbonation proceeds. Remaining pink color in some specimens even after 14 days of carbonation indicates incomplete carbonation due to resistance to CO2 penetration. The CO2 uptake can be determined by weighing the specimen during the carbonation (Mahoutian, Chaallal, and Shao 2018). Other indirect methods to analyze the efficiency of carbonation are thermogravimetric analysis (TGA) and x-ray diffraction (XRD).
Figure 12. Optical images of concrete specimens sprayed with
phenolphthalein indicator (Mo and Panesar 2013).
The maximum CO2 uptake capacity and carbonation depth of a material can be calculated with a theoretical formula by considering the exposure condition and carbonation constant of the material composition. Due to the nonlinear mineralogical phase and the chemical composition of slags and other industrial wastes, the determined maximum uptake capacity might not be accurate.
According to Huijgen et al. (2006), the steel slag can achieve up to 75% of its theoretical maximum uptake.
3.6 SHIELDING PROPERTIES
For the TCR project, CCMs would potentially be used to fabricate the biological shield surrounding the reactor. While the irradiation tolerance of such materials is clearly established (e.g., Pignatelli et al., 2015), the shielding properties of CCMs must be established.
Ionizing radiation protection relies on shielding that results from the interaction. A comprehensive review on radiation-shielding concrete can be found in Kaplan (1989). Although the neutron cross section of common elements found in concrete constituents is generally quite low (<1 barn), water plays a major

23
role in the effective fast-neutrons’ mass removal cross section. Because CCM microstructure development relies on the gradual release of water to the benefit to the CO2 uptake, it appears necessary to include in the mix high-shielding materials.
Shielding is generally achieved by using normal weight/structural aggregates (Kaplan 1989) given adequate depth of the shield wall (e.g., ~1.0–1.5 m in commercial LWRs). However, stronger attenuation can be obtained using special aggregates such as natural heavy aggregates (r > 4 g.cm-3), which are rich if they are metal oxides such as barite (BaSO4), hematite (Fe2O3), illemnite (TiO3), or magnetite (Fe3O4), as well as hydrous aggregates such as serpentine (3MgO.2SiO2.2H2O), which can exhibit large radiation-induced volumetric expansion (RIVE) (Elleuch et al. 1972), limonite (2Fe2O3.3H2O) or manufactured high density aggregates such as ferrophosphorus and boron frit (ASTM C638-14) (Le Pape 2020). Magnetite and hematite exhibits RIVE on the order of ~0.4%, which is comparable and hence compatible with calcium carbonates (Le Pape et al. 2018). In terms of elevated temperature stability, most non-siliceous aggregates are stable up to about 600°C. At higher temperatures, calcareous aggregates (calcite – CaCO3), magnesite (MgCO3), and dolomite (MgCO3/CaCO3) dissociate into an oxide and CO2 (CaO + CO2). Calcium carbonate dissociates completely at 1 atm pressure at 898°C, with partial dissociation occurring at temperatures as low as 700°C (Naus 2010). As such, the thermal performance of CCMs is expected to be higher than OPC-based concrete.
3.7 COSTS
Mahoutian, Chaallal, and Shao (2018) did a cost assessment for the production of carbonated steel slag block compared to traditional cement block. Estimated cost for carbonated steel slag block production was almost 1/10 of the traditional cement block. Table 13 shows the cost ($/t) estimation for each production step.
Table 13. Production cost of masonry blocks built of traditional cement and carbonation of steel slag (Mahoutian, Chaallal, and Shao 2018).
Traditional cement blocks ($K) Carbonated steel slag blocks ($K) Cement 100 Raw steel slag 3 Steam curing 19 Cost of grinding 3
Cost CO2 gas 6 Total cost 119 Total cost 12
4. CONCLUSIONS
Although carbonation in traditional concrete structures is usually considered detrimental because of its lower pH causing the depassivation of embedded steel, controlled carbonation of OPC and other cementitious materials can be beneficial. Carbonation can also reduce the matrix pH, which can initiate corrosion in the reinforcement. To prevent the reinforcements from corroding, the reaction should be stopped at a pH of 10.5.
• Material compatible with carbonation can produce a dense microstructure which can improve the compressive strength, freeze-thaw performance, water permeability, and durability.
• Industrial byproducts like steel slag, which does not exhibit hydraulic properties, can be used for construction if it is carbonation active.

24
• Accelerated hydration due to carbonation can help in cold weather construction and AM of concrete.
• Use of industrial byproducts as raw materials can reduce the production cost (Mahoutian, Chaallal, and Shao 2018).
Further research is needed to incorporate the advantages of carbonation of cementitious materials into 3D printing. Most carbonation studies have been conducted in carbonation chambers, which might be a limiting factor for AM. A nondestructive test method needs to be explored for quantitative assessment of carbonation depth in specimens.
25
REFERENCES
ASTM C638-14. 2014. Standard Descriptive Nomenclature of Constituents of Aggregates for Radiation-Shielding Concrete.
Bos, F., R. Wolfs, Z. Ahmed., and T. Salet. 2016. “Additive Manufacturing of Concrete in Construction: Potentials and Challenges of 3D Concrete Printing.” Virtual and Physical Prototyping, 11, 209–225.
Bukowski, J. M., and R. L. Berger. 1979. “Reactivity and Strength Development of COß Activated Non-Hydraulic Calcium Silicates.” Cement and Concrete Research 9 (1):57–68.
Buswell, R.A., W. R. Leal de Silva, S. Z. Jones, J. and Dirrenberger. 2019. “3D Printing Using Concrete Extrusion: A Roadmap for Research.” Cement and Concrete Research, in press.
Ebrahimi, A., M. Saffari, D. Milani, A. Montoya, M. Valix, and A. Abbas. 2017. “Sustainable Transformation of Fly Ash Industrial Waste into a Construction Cement Blend via CO2 Carbonation.” Journal of Cleaner Production 156:660–669. doi: https://doi.org/10.1016/j.jclepro.2017.04.037.
Elleuch, L., F. Dubois, and J. Rappeneau. 1972. “Effects of Neutron Radiation on Special Concretes and Their Components,” Special Publication of The American Concrete Institute 43, 1071–1108.
Fernández Bertos, M., S. J. R. Simons, C. D. Hills, and P. J. Carey. 2004. “A Review of Accelerated Carbonation Technology in the Treatment of Cement-Based Materials and Sequestration of CO2.” Journal of Hazardous Materials 112 (3):193–205. doi: https://doi.org/10.1016/j.jhazmat.2004.04.019.
Ghouleh, Z., R. Guthrie, and Y. Shao. 2015. “High-Strength KOBM Steel Slag Binder Activated by Carbonation.” Construction and Building Materials 99:175–183.
Hartmann, T., P. Paviet-Hartmann, J. B. Rubin, M. R. Fitzsimmons, and K. E. Sickafus. 1999. “The Effect of Supercritical Carbon Dioxide Treatment on the Leachability and Structure of Cemented Radioactive Waste-Forms.” Waste Management 19 (5):355–361. doi: https://doi.org/10.1016/S0956-053X(99)00138-5.
Hills, C. D., R. E. H. Sweeney, and N. R. Buenfeld. 1999. “Microstructural Study of Carbonated Cement-Solidified Synthetic Heavy metal Waste.” Waste Management 19 (5):325–331.
Huijgen, Wouter J. J., G. J. Ruijg, R. N. J. Comans, and G.-J. Witkamp. 2006. “Energy Consumption and Net CO2 Sequestration of Aqueous Mineral Carbonation.” Industrial & Engineering Chemistry Research 45 (26):9184–9194. doi: 10.1021/ie060636k.
Huijgen, Wouter JJ, Geert-Jan Witkamp, and Rob NJ Comans. 2005. “Mineral CO2 Sequestration by Steel Slag Carbonation.” Environmental Science & Technology 39 (24):9676–9682.
Humbert, P. S., and J. Castro-Gomes. 2019. “CO2 Activated Steel Slag-Based Materials: A Review.” Journal of Cleaner Production 208:448–457. doi: https://doi.org/10.1016/j.jclepro.2018.10.058.
Johannesson, B., and P. Utgenannt. 2001. “Microstructural changes Caused by Carbonation of Cement Mortar.” Cement and Concrete Research 31 (6):925–931.
Johnson, D. C. 2000. Accelerated Carbonation of Waste Calcium Silicate Materials: Society of Chemical Industry Science Lecture Series.
Kaplan, M. 1989. Concrete Radiation Shielding, Longman Scientific and Technical, John Wiley and Sons Inc; New York, NY.
26
Le Pape, Y. “Radiation Effects in Concrete for Nuclear Systems.” Comprehensive Nuclear Materials, Elsevier, 2020.
Le Pape, Y., M. Alsaid, and A. Giorla. 2018. “Rock-Forming Minerals Radiation-Induced Volumetric Expansion - Revisiting the Literature Data.” Journal of Advanced Concrete Technology 16, 191–209.
Le Pape, Y. 2015. “Structural Effects of Radiation-Induced Volumetric Expansion on Unreinforced Concrete Biological Shields.” Nuclear Engineering and Design, 295, 534–548
Mahoutian, M., O. Chaallal, and Y. Shao. 2018. “Pilot Production of Steel Slag Masonry Blocks.” Canadian Journal of Civil Engineering 45 (7):537–546. doi: 10.1139/cjce-2017-0603.
Mahoutian, M., Z. Ghouleh, and Y. Shao. 2014. “Carbon Dioxide Activated Ladle Slag Binder.” Construction and Building Materials 66:214–221.
Mahoutian, M., Y. Shao, A. Mucci, and B. Fournier. 2015. “Carbonation and Hydration Behavior of EAF and BOF Steel Slag Binders.” Materials and Structures 48 (9):3075–3085.
Maries, A. 1985. “The Activation of Portland Cement by Carbon Dioxide.” Conference in Cement and Concrete Science.” Oxford, UK.
Mo, L., Y. Hao, Y. Liu, F. Wang, and M. Deng. 2019. “Preparation of calcium Carbonate Binders via CO2 Activation of Magnesium Slag.” Cement and Concrete Research 121:81–90. doi: https://doi.org/10.1016/j.cemconres.2019.04.005.
Mo, Liwu, and D. K. Panesar. 2013. “Accelerated Carbonation – A Potential Approach to Sequester CO2 in Cement Paste Containing Slag and Reactive MgO.” Cement and Concrete Composites 43:69–77. doi: https://doi.org/10.1016/j.cemconcomp.2013.07.001.
Mo, L., F. Zhang, and M. Deng. 2016. “Mechanical Performance and Microstructure of the Calcium Carbonate Binders Produced by Carbonating Steel Slag Paste under CO2 Curing.” Cement and Concrete Research 88:217–226.
Mo, L., F. Zhang, M. Deng, F. Jin, A. Al-Tabbaa, and A. Wang. 2017.“Accelerated Carbonation and Performance of Concrete Made with Steel Slag as Binding Materials and Aggregates.” Cement and Concrete Composites 83:138–145. doi: https://doi.org/10.1016/j.cemconcomp.2017.07.018.
Monteiro, P. J. M., L. Clodic, F. Battocchio, W. Kanitpanyacharoen, S. R. Chae, J. Ha, and H.-R. Wenk. 2013. “Incorporating Carbon Sequestration Materials in Civil Infrastructure: A Micro and Nano-Structural Analysis.” Cement and Concrete Composites 40:14–20. doi: https://doi.org/10.1016/j.cemconcomp.2013.03.013.
Moon, Eun-Jin, and Young Cheol Choi. 2018. “Development of Carbon-Capture Binder Using Stainless Steel Argon Oxygen Decarburization Slag Activated by Carbonation.” Journal of Cleaner Production 180:642–654.
Naus, Dan. 2010. A Compilation of Elevated Temperature Concrete Material Property Data and Information for Use in Assessments of Nuclear Power Plant Reinforced Concrete Structures, NUREG/CR-7031, Oak Ridge National Laboratory.
Pade, C., and M. Guimaraes. 2007. “The CO2 Uptake of Concrete in a 100 Year Perspective.” Cement and Concrete Research 37 (9):1348–1356. doi: https://doi.org/10.1016/j.cemconres.2007.06.009.
Pignatelli, I., A. Kumar, K. Field, B. Wang, Y. Yu, Y. Le Pape, M. Bauchy, and G. Sant. 2016. “Direct Experimental Evidence for Differing Reactivity Alterations of Minerals Following Irradiation: The Case of Calcite and Quartz.” Scientific Reports—Nature, 6(20155), 1–10.
27
Roy, D. M., and G. M. ldorn. 1982. “Hydration, Structure, and Properties of Blast Furnace Slag Cements, Mortars, and Concrete.” Journal Proceedings 79 (6). doi: 10.14359/10919.
Vance, K., G. Falzone, I. Pignatelli, M. Bauchy, M. Balonis, and G. Sant. 2015. “Direct Carbonation of Ca(OH)2 Using Liquid and Supercritical CO2: Implications for Carbon-Neutral Cementation.” Industrial & Engineering Chemistry Research 54 (36):8908-8918. doi: 10.1021/acs.iecr.5b02356.
Wedepohl, K. H. Geochemistry. Holt, Reinhart and Winston, 1971
Wolfs, R. and Suiker, A. “Structural Failure during Extrusion-Based 3D Printing Processes. International Journal of Advanced Manufacturing Technology, 2019, 104, 565-584
Young, JF, RL Berger, and J Breese. 1974. “Accelerated Curing of Compacted Calcium Silicate Mortars on Exposure to CO2.” Journal of the american ceramic society 57 (9):394-397.
Zevenhoven, Ron, Johan Fagerlund, and Joel Kibiwot Songok. 2011. “CO2 Mineral Sequestration: Developments toward Large‐Scale Application.” Greenhouse Gases: Science and Technology 1 (1):48-57.