Developing Educational Computer Animation Based on Human Personality Types
20
European Journal of Contemporary Education, 2015, Vol.(11), Is. 1 52 Copyright © 2015 by Academic Publishing House Researcher All rights reserved. Published in the Russian Federation European Journal of Contemporary Education ISSN 2219-8229 E-ISSN 2224-0136 Vol. 11, Is. 1, pp. 52-71, 2015 DOI: 10.13187/ejced.2015.11.52 www.ejournal1.com WARNING! Article copyright. Copying, reproduction, distribution, republication (in whole or in part), or otherwise commercial use of the violation of the author(s) rights will be pursued on the basis of Russian and international legislation. Using the hyperlinks to the article is not considered a violation of copyright. UDC 004.5: 004.9: 37 Developing Educational Computer Animation Based on Human Personality Types 1 Sajid Musa 2 Rushan Ziatdinov 3 Omer Faruk Sozcu 4 Carol Griffiths 1-3 Department of Computer and Instructional Technologies, Fatih University, Turkey 34500 Buyukcekmece, Istanbul 1 E-mail: [email protected] 2 E-mail: [email protected] 3 E-mail: [email protected] 4 Department of Foreign Language Education, Fatih University, Turkey Istanbul, Buyukcekmece, 34500 E-mail: [email protected] Abstract Computer animation in the past decade has become one of the most noticeable features of technology-based learning environments. By its definition, it refers to simulated motion pictures showing movement of drawn objects, and is often defined as the art in movement. Its educational application known as educational computer animation is considered to be one of the most elegant ways for preparing materials for teaching, and its importance in assisting learners to process, understand and remember information efficiently has vastly grown since the advent of powerful graphics-oriented computers era. Based on theories and facts of psychology, colour science, computer animation, geometric modelling and technical aesthetics, this study intends to establish an inter-disciplinary area of research towards a greater educational effectiveness. With today‟s high Corresponding author. Tel.: (+90) 212-866-3300/2834; fax: (+90) 212-8663-364. During this research, the author was a visiting Professor in the Department of Fine Arts and Costume Art, Ufa State University of Economics and Service, 450078 Ufa, Russia, and in the Computer Aided Design and Information Technologies Laboratory at Seoul National University, Republic of Korea, and in the Realistic Modelling Laboratory at National University Corporation - Shizuoka University, Hamamatsu, Japan.
-
Upload
rushan-ziatdinov -
Category
Education
-
view
63 -
download
2
Transcript of Developing Educational Computer Animation Based on Human Personality Types

European Journal of Contemporary Education, 2015, Vol.(11), Is. 1
52
Copyright © 2015 by Academic Publishing House
Researcher
All rights reserved.
Published in the Russian Federation
European Journal of Contemporary Education
ISSN 2219-8229
E-ISSN 2224-0136
Vol. 11, Is. 1, pp. 52-71, 2015
DOI: 10.13187/ejced.2015.11.52
www.ejournal1.com
WARNING! Article copyright. Copying,
reproduction, distribution, republication (in whole
or in part), or otherwise commercial use of the
violation of the author(s) rights will be pursued on
the basis of Russian and international legislation.
Using the hyperlinks to the article is not considered
a violation of copyright. UDC 004.5: 004.9: 37
Developing Educational Computer Animation Based on Human Personality Types
1 Sajid Musa 2 Rushan Ziatdinov 3 Omer Faruk Sozcu
4 Carol Griffiths
1-3 Department of Computer and Instructional Technologies, Fatih University, Turkey 34500 Buyukcekmece, Istanbul 1 E-mail: [email protected] 2 E-mail: [email protected] 3 E-mail: [email protected] 4 Department of Foreign Language Education, Fatih University, Turkey Istanbul, Buyukcekmece, 34500 E-mail: [email protected]
Abstract Computer animation in the past decade has become one of the most noticeable features of
technology-based learning environments. By its definition, it refers to simulated motion pictures showing movement of drawn objects, and is often defined as the art in movement. Its educational application known as educational computer animation is considered to be one of the most elegant ways for preparing materials for teaching, and its importance in assisting learners to process, understand and remember information efficiently has vastly grown since the advent of powerful graphics-oriented computers era. Based on theories and facts of psychology, colour science, computer animation, geometric modelling and technical aesthetics, this study intends to establish an inter-disciplinary area of research towards a greater educational effectiveness. With today‟s high
Corresponding author. Tel.: (+90) 212-866-3300/2834; fax: (+90) 212-8663-364. During this research, the author was a visiting
Professor in the Department of Fine Arts and Costume Art, Ufa State University of Economics and Service, 450078 Ufa, Russia, and
in the Computer Aided Design and Information Technologies Laboratory at Seoul National University, Republic of Korea, and in the
Realistic Modelling Laboratory at National University Corporation - Shizuoka University, Hamamatsu, Japan.
European Journal of Contemporary Education, 2015, Vol.(11), Is. 1
53
educational demands as well as the lack of time provided for certain courses, classical educational methods have shown deficiencies in keeping up with the drastic changes observed in the digital era. Generally speaking, without taking into account various significant factors as, for instance, gender, age, level of interest and memory level, educational animations may turn out to be insufficient for learners or fail to meet their needs. Though, we have noticed that the applications of animation for education have been given only inadequate attention, and students‟ personality types of temperaments (sanguine, choleric, melancholic, phlegmatic, etc.) have never been taken into account. We suggest there is an interesting relationship here, and propose essential factors in creating educational animations based on students‟ personality types. Particularly, we study how information in computer animation may be presented in a more preferable way based on font types and their families, colours and colour schemes, emphasizing texts, shapes of characters designed by planar quadratic Bernstein-Bézier curves. The study has found out that both choleric-melancholic and phlegmatic-sanguine gained the lowest and the highest percentages in selection of different colour groups as cool, warm, and achromatic. We have experimentally confirmed the theory of Nabiyev & Ziatdinov (2014) which reports that planar quadratic Bernstein-Bézier curves with monotonic curvature function may be not aesthetic. Finally, based on the survey results, we have clarified how school students understand the fundamental principles of computer animation. We look forward that this study is likely to have wide benefits in the field of education. Developing educational materials with the aid of obtained empirical results, while considering the personality types of students‟ temperament, seems to be a promising avenue to improve, enrich and deepen the learning process in order to achieve its maximum effectiveness.
Keywords: Computer animation; personality type; computer-assisted education; educational psychology; Bernstein-Bézier curve; colour theory.
Introduction Recent lectures and talks by this manuscript‟s authors (Musa et al., 2013) in the Catholic
University of Ružomberok in Slovakia have shown that there is a certain interest in educational computer animation from various scientific and educational schools of Europe. Computer animation which is one of the highly-recommended ways of explaining models and processes in natural science education has spread its influence on learning and instruction in areas like economy, industry, medical tourism and their educational aspects. Before we discuss computer animation itself, we review its history.
It has been twenty years since animation became the most notable feature of the technology-based learning environment (Dundar, 1993). Mayer and Moreno (2002) defined animation as a form of pictorial presentation, referring to computer-generated moving pictures showing associations among drawn figures. Motion, picture and simulation correspond to this idea. Videos and illustrations are motion pictures portraying movement of real objects.
Verbal forms of teaching have been augmented by pictorial forms of teaching (Lowe, 2004; Lasseter, 1987; Pailliotet & Mosenthal, 2000). Although it is undeniable that verbal modes of presentation have long reigned supreme in education, the addition of visual forms of presentation have enhanced students‟ understanding (Mayer, 1999; Sweller, 1999). As a matter of fact, animation or graphic illustration is preferred to verbal or numerical presentation by most university students when dealing with dynamic subject matter (Lowe, 2004).
Nevertheless, Lowe (2004), Lasseter (1987), and Pailliotet et al. (2000) note that the creation of multimedia instructional environments – holding potential for enhancing learner‟s way of learning – has created much debate. It is evident that animation presentations are less useful than was expected. In addition, there is inadequate knowledge about how to create animation in order to aid learning (Plötzner & Lowe, 2004) and some create it for the sole purpose of gaining aesthetic attraction. According to Lowe (2004), some who work in the entertainment industry tend to create characters just for entertainment, rather than using it as a bridge which would help to build coherent understanding using their work.
Several cases have shown that animation can even hold back rather than improve learning (Campbell et al., 2005) depending on how it is used (Mayer & Moreno, 2002). Besides, cognitive connection can be lost since animation imposes greater cognitive processing demands compared to static visuals since the information drastically changes (Hasler, 2007).

European Journal of Contemporary Education, 2015, Vol.(11), Is. 1
54
According to Mayer (2005), “The current emphasis on ways of improving animations implicitly assumes a bottom-up model animation comprehension… Comprehension is primarily a process of encoding the information in the external display, so that improving that display necessarily improves understanding”. The role of animation in multimedia learning examined by Mayer and Moreno (2000) showed a cognitive theory of multimedia learning. They were able to name seven principles for the application of animation in multimedia instruction. To name one of them, according to the multimedia principle, students absorb more when both narration and animation are used rather than using just one or the other. When these two are presented together, learners can easily create mental connections between corresponding words and pictures. According to the coherence principle, learners learn productively both from animation and narration especially when unnecessary words, sounds (even music) and videos are not present. The reason behind this is the trouble the learners experience when creating mental connections due to fewer cognitive resources between relevant portions of the narration and animations (Plötzner & Lowe, 2004).
Educational computer animation also plays an important role in assisting language teaching and learning (Bikchentaeva & Ziatdinov, 2012; Musa et al., 2013). The effect of learner controlled progress was examined by Hasler (2007) regarding educational animation on instructional effectiveness. Referring to her findings, to teach the determinants of day and night to primary school students, three audio-visual computer animations and narration-based presentations were used. Moreover, Hasler (2007) noted that two of the groups displayed higher test performance compared with the other, based on the results of the experiment.
Taking into account the limitations of the studies discussed above, we raise the research question, “what is the connection between human personality types and their preferences in selecting the fundamental elements (variables) and understanding the principles of computer animation?” All these are important for better understanding of human psychology in order to find yet unknown methods for influencing human‟s visual perception, as well as their use for educational purposes.
Main results In this paper, we discuss theoretical aspects of creating educational computer animations
based on psychological characteristics of human personality types. Particularly, we study how information in computer animation may be presented in more efficient ways based on font types and their families, colours and colour schemes, emphasizing texts, shapes of planar quadratic Bernstein-Bézier curves. We analysed how tested students understand the fundamental principles of traditional computer animation, and question whether these principles should or should not be followed for developing educational computer animations for use in high schools of Turkey, where computer science or informatics classes may not even exist.
Our work has the following novelties:
For the first time in computer-assisted learning we have proposed a way for developing educational computer animations based on fundamental personality types of human temperament;
We have experimentally analysed how fundamental principles of traditional computer animation are understood by school students;
We examined the relationship between personality type and preference for popular fonts and font families, text emphasis, colour and shape, which are known as the fundamental elements of a computer animation.
Temperament based learning In this section, we discuss the work which has been done in this field. The influence of
temperament mainly within the context of the family and school on the development of school-age children was examined by McClowry (1992). In line with this, she presented examples of how nurses may use temperament theory when advising caretakers. Temperament theory (McClowry, 1992) serves as a guide for the nurses in assessing children‟s behaviour.
Graham (1995) offered recommendations in carrying out temperament-based intervention for parents alone or for both the parents and teachers. She concluded that “acknowledging

European Journal of Contemporary Education, 2015, Vol.(11), Is. 1
55
temperament-based guidance would show that each child has a particular behavioural style that contributes to his or her development and to the social environment”.
Jong et al. (2013) stated that the posture and muscle loading of the body is significantly affected by various different interactive gaming controllers. It has been argued that the period of exposure to the interactive gaming controllers affects the success in using the game for the purposes of learning. Jong et al. (2013) aimed to explore the different behavioural responses based on the different temperaments regarding mathematical game play by comparing the touch-based and gesture-based interactive devices among 119 kindergarten participants. The results indicated that the touch-based interaction (TBI) group compared to the gesture-based interaction (GBI) group performed better with respect to numerical counting in both games. It also showed that with all the dimensions of temperaments, persistence was the only one which had positive correlation to TBI. In other words, TBI was more favoured over GBI for kindergarten children. Jong et al. (2013) added that more emphasis on TBI would be a great move for e-learning designers.
Recently, Ali (2007, 2008) discussed the development of software tools for online teaching that enables a tutor to control the psychological state of students in the process of testing, and developed the mathematical model of a dual system of testing consisting of three parts: lectures, tests, and teaching program. This shows that a temperament-based teaching approach finds some applications in e-learning.
Li et al. (2007), adopting the Eysenck Personality Questionnaire (EPQ) (Eysenck, 1958), conducted a survey with 1620 student participants. Students were categorized based on their year level respectively: primary 5, junior secondary 2 and senior secondary 2. They found a significant correlation between personality types according to the EPQ and maths achievement. Both psychological factors and mathematics achievement have become a major area of study, and the relationship between them is strong. Although there are some scholars who think that personality does not have a great impact on academic achievement of students (Gao, 1994), others believe that temperament is an important factor (e.g. Li, 1994, 1996, Qiaorongning, 2003, Li et al., 2004) Li et al. (2007) defined superior and inferior temperaments in terms of achievement in maths. Superior temperament-based students are those who have sanguine, sanguine-phlegmatic and phlegmatic types of temperament; they are the ones who benefit from learning mathematics. Benefitting refers to how students learn mathematics easily. Students who are choleric, choleric-melancholic and melancholic which are considered inferior temperaments do not benefit from learning mathematics. Li et al. (2007) stated that in mathematics education, one should recognize students‟ temperament differences which indeed affect learning mathematics.
The four temperament types In this section, we discuss the four temperament types shortly. We compare temperament
types by their general descriptions, wonderful characteristics and unpleasant traits. Direct discussion of the temperament types without looking at their roots would be a great
mistake. Thus we would like to shortly describe how today‟s temperament types came to be. Technically, “temperament” from the Latin word “temperare” meaning “to mix” has a long history, from the ancient time of Greek physician Hippocrates (460-370). Galen (AD 131-200) pioneered the first typology of temperament and gave the names “sanguine”, “choleric”, “melancholic” and “phlegmatic”. These four were the temperamental categories named after bodily humours. We can easily see and understand these four temperaments by looking at Table 1 and their emotional representation shown in Fig. 1.

European Journal of Contemporary Education, 2015, Vol.(11), Is. 1
56
Fig. 1. Emoticon representation of the four temperament types. From left to right: sanguine and
choleric (emotionally unstable), phlegmatic and melancholic (emotionally stable) Hans Eysenck initially theorized personality as two dichotomies; extraversion/introversion
and neuroticism/stability. Extraversion/Introversion Assertive, outgoing, sociable and talkative are only a few characteristics of extraversion.
Based on Eysenck‟s arousal theory of extraversion, performance failure is due to one‟s inability to meet the ideal (optimal) level of cortical arousal. The person who does less or more than the desired optimal level ends up with under-performance. Brain waves, skin conductance or even sweating is used to measure arousal. Performance is low when the levels of arousal are very low and very high, however, performance is maximized at a more optimal mid-level of arousal. Therefore, according to Eysenck‟s theory, extraverts are chronically under-aroused and bored. In line with this, for extraverts to bring out the optimal level of performance, external stimulation is needed. Conversely, introverts are in need of peace and calmness to bring out the optimal level of performance. They are chronically over-aroused and nervous: that is why they need to be content from inside.
Neuroticism/Stability Depression and anxiety are high levels of negative affect which define neuroticism or
emotionality. Based on Eysenck‟s theory, the activation threshold of the visceral part of the brain or the sympathetic nervous system is neuroticism. The part of the brain tasked for the fight-or-flight response in case of danger is the sympathetic nervous system. Blood pressure, cold hands, heart rate, muscular tension and sweating measure the activation. A negative effect of fight-or-flight is experienced by those who have low activation thresholds in the case of minor stressors. In addition, since they are unable to inhibit their emotional reactions, they are easily nervous or saddened. These people are the neurotic ones. In the case of those who have high activation thresholds, they are the ones who have good emotional control. They are emotionally stable people. Nevertheless, when faced with very major stressors, they experience negative effects.
These two initial concepts, define four quadrants; stable extraverts, unstable extraverts, stable introverts, and unstable introverts. Human temperaments fall into these quadrants.
Moving on to the main discussion, there are four temperament types, namely: sanguine, choleric, melancholic and phlegmatic (Tab. 1). Each of the four types of humour is matched to a different personality type.
Table 1. Short summary of the four temperament types.
Temperament General Description Wonderful Characteristics Unpleasant Traits
Sanguine
easily-influenced; moody; optimistic; rarely internalizes.
compassionate; friendly; humane; strong-willed; virtuous.
flirt; inner self-conflict; jealous; poor-decision maker; self-complacency; vain
European Journal of Contemporary Education, 2015, Vol.(11), Is. 1
57
Choleric
dreamer; dominator; enthusiastic; perfectionist; success-hungry.
clever; diligent; great rhetorical skills; leader.
hard-headed; prideful; talkative; belittle others; self-praised.
Melancholic
low rhetorical skills; strong principles; passive; self-reflection; serious; silent; thinker.
genuine; great adviser; loves solitude; successful; trustworthy; willing to sacrifice for others;
despairing; unforgiving; pessimistic; self-pity.
Phlegmatic
careless; feels emptiness; moves at a slow-pace.
contented in life; maintains composure; persevering; practical judgments; not easily offended.
lazy; no aspirations; takes things for granted.
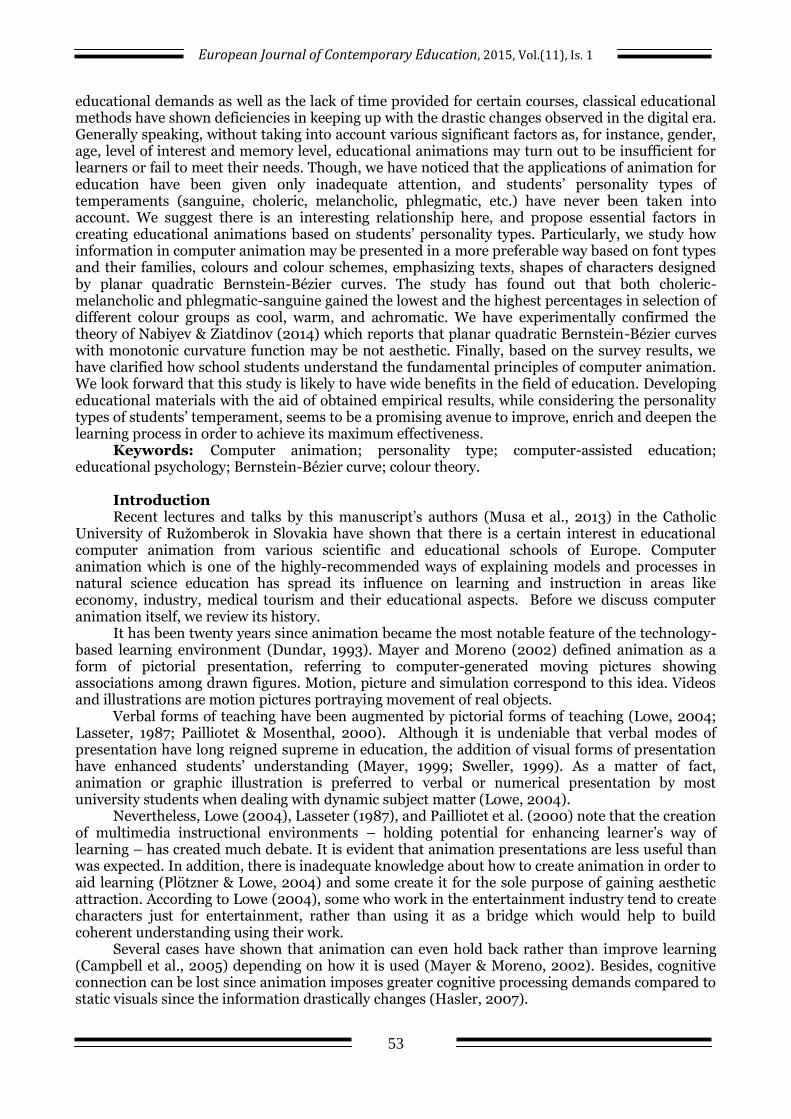
Methods Research design The experimental part of this research was conducted in Yaşar Acar Science High School,
Beylikdüzü, Istanbul, Turkey. The participants were 240 students: 111 male and 129 female students between 14–17 years old [mean (M) = 15.53, standard deviation (SD) = 1.31]. The data was collected through a survey which consists of three parts. The first part is demographic information, the second part is the Eysenck Personality Questionnaire (EPQ), and the third part includes principles of animation.
Data Collection Surveys were applied to 252 volunteer students in December, 2013, and were administered to
students in one class period and it took approximately 20 minutes. After data were collected, it was determined that 12 students‟ surveys were incomplete or answered without reading carefully. Thus, these data were excluded from the study.
Participants The participants‟ demographic information is given in Table 2 below:
Table 2. Demographic analysis of data.
Frequency Percent
Gender Female 129 53.75
Male 111 46.25
Age 14 39 16.25
15 86 35.83
16 65 27.09
17 50 20.83
Class 9 102 42.50
10 56 23.33
11 82 34.17
Having PC or tablet
Yes 206 85.83
No 34 14.17
Best Reading
Font
Baskerville Old Face
12 5.00
Tahoma 21 8.75

European Journal of Contemporary Education, 2015, Vol.(11), Is. 1
58
Cambria 30 12.50 Garamond 16 6.67
Batang 3 1.25
Bookman Old Style
21 8.75
Times New Roman
69 28.75
Verdana 15 6.25 Calibri 35 14.58
Gill Sans MT 18 7.50
Font Style
Bold 150 62.50
Italic 43 17.91
Highlighted 34 14.17
Underline 13 5.42
Total 240 100.00
Analysis of data Purpose and frequency of computer use Table 3 below shows the results gathered partly from the survey regarding how frequently the
students use computers and for what purpose. Working with 2D/3D animation programs, working on programming language, working with different software are only a few of the selections given to the students. Then they were given choices such as very often, often, sometimes, seldom and never to indicate how frequently they do this. The results are as follows: 65% connect to the internet, 38.34% listen to music and 5.84% work with different software very often. 37.50% examine educational materials, 37.08% study and do homework sometimes. They rarely use computers to develop projects (31.76%) or play games (22.10%). The rest (28.75%) never use computers to develop projects, don‟t work with any different software (31.76%), programming language (69.16%), or animation software (73.75%).
Table 3. For which purposes and how frequently do students use computers.
Never Seldom Sometimes Often
Very often
X SD
Working with 2D/3D animation programs
F 177 25 23 9 6
% 73.75 10.42 9.58 3.75 2.50 1.51 0.98 Working on
programming language
F 166 33 22 7 12
% 69.16 13.75 9.17 2.92 5 1.61 1.09
Working with different software
F 92 57 57 20 14
% 38.33 23.75 23.75 8.33 5.84 2.20 1.20
Developing projects F 69 76 63 20 12
% 28.75 31.67 26.25 8.33 5 2.29 1.12
Playing games F 37 53 48 51 51
% 15.40 22.10 20 21.25 21.25 3.11 1.37
Examining educational
materials
F 22 42 90 54 32
% 9.17 17.50 37.50 22.50 13.33 3.13 1.13
Studying and doing homework
F 4 24 89 86 37
% 1.67 10 37.08 35.83 15.42 3.53 0.92
Watching movies F 12 30 42 72 84
% 5 12.50 17.50 30 35 3.78 1.19

European Journal of Contemporary Education, 2015, Vol.(11), Is. 1
59
Listening to music F 20 32 39 57 92
% 8.33 13.33 16.25 23.75 38.34 3.70 1.32
Connecting to the Internet
F 2 6 18 58 156
% 0.83 2.50 7.50 24.17 65 4.50 0.80 When we examine the means of students‟ answers, it is seen that working with 2D and 3D
animation software (𝑋 =1.51) and programming languages (𝑋 =1.61) have the lowest means. Connecting to the Internet (𝑋 =4.5) has the highest mean. In this sense, it is seen that students use the Internet for different purposes rather than developing their computer skills.
When we categorize items under three aspects as research, acquisition of information and games-entertainment, it can be seen that games-entertainment category (𝑋 =3.53) has the highest mean (Table 4). The lowest mean belongs to the category of using computers to acquire information (𝑋 =2.67).
Pearson Chi-Square significance value (2χ ) was 0.440 for font preference between genders.
According to this result, there isn‟t a statistically significant difference among most preferred fonts by
students according to gender. The font style preference between genders was 2χ 0.140, this means
that there isn‟t a statistically significant difference among the most preferred font styles according
gender. The font preference based on computer education was 2χ 0.825, so there isn‟t a statistically
significant difference in the distribution of the most preferred fonts according to whether students had computer education or not. The font style preference between whether students had computer
education or not was 2χ 0.438, so there isn‟t a statistically significant difference in the distribution of
font style preference according to whether students had computer education or not. The font preference
between having a computer or not was 2χ 0.468, this means, there isn‟t a statistically significant
difference in the distribution of the most preferred fonts according to whether students had a computer
or tablet or not. The style preference between having a computer or not was 2χ 0.414, this means
there isn‟t a statistically significant difference in the distribution of most preferred styles according to whether students had a computer, tablet or not.
Participants’ personality types In this sub-section, we analyze our data according to personality types of human
temperament. Computations were done in MS Excel 2007 (Liengme, 2009) and where necessary SPSS (Griffith, 2010) was used.
Table 4. Participants‟ views on using of information technologies according to different aspects.
Getting
Information Research Analysis
Game and Entertainment
Mean 2.67% 3.30% 3.53%

European Journal of Contemporary Education, 2015, Vol.(11), Is. 1
60
Fig. 2. Temperament types in percentage Fig. 3. Temperament types in pie chart The number of participants in this study is 240. After completing a survey partly based on
Eysenck Personality Questionnaire (EPQ), the results are shown in Fig. 2 and Fig. 3. Looking at Fig. 2, 27% percent of the participants have a sanguine type of personality which is obviously the highest of them all. While on the other hand, a choleric-sanguine type of personality has the fewest students (1% only). The frequencies of other personality types are shown in Table 5.
Moreover, mixed types of temperaments (i.e. choleric-melancholic, phlegmatic-sanguine,
melancholic-phlegmatic and choleric-sanguine) are fewer compared with the main type of temperaments (i.e. sanguine, phlegmatic, melancholic and choleric) as illustrated in Fig. 2. Therefore, there are only a few of the participants who fall into the mixed types of temperaments. According to our analysis of the 240 participants, 52.50% are emotionally stable, 43.33% are emotionally unstable, while the rest (4.17%) are neutral. The grade point average (GPA) of all the students in relation to temperament is shown in Table 5. Participants‟ GPA ranges from 67 to 94 (mean = 83.28, SD= 5.31) and 88 % of the students have a GPA of at least 80.
While Li et al. (2007) was defining sanguine, phlegmatic and phlegmatic-sanguine students as superior types in studying mathematics, our research shows that in general education all the personality types have approximately equal academic achievements*.
Fig. 4. Emotional stability. Fig. 5. Emotional stability as a pie chart.
* Here, we do not take into account the only student with choleric-sanguine personality type.
Table 5. Temperament Types Overall Result.
Sanguine Phlegmatic Melancholic Choleric Choleric-
Melancholic
Phlegmatic-Sanguine
Melancholic-Phlegmatic
Choleric-Sanguine Sum
64 50 48 43 13 12 9 1 240
26.67% 20.83% 20.00% 17.92% 5.42% 5.00% 3.75% 0.42% 100%
Grade Point Average (GPA) Average
83.63 82.55 85.36 80.79 83.08 83.78 81.63 78.00 83.10

European Journal of Contemporary Education, 2015, Vol.(11), Is. 1
61
With the findings of emotional stability, the extraversion and introversion of participants were studied. These terms are clearly discussed in the third section of this manuscript. Looking at data gathered (Figs. 6-7) the percentage of extraverts (45.50%) and introverts (43.33%) slightly differ. 4.17% of the studied students are found to be neutral.
Fig. 6. Extraversion/Introversion. Fig. 7. Extraversion/Introversion as a pie
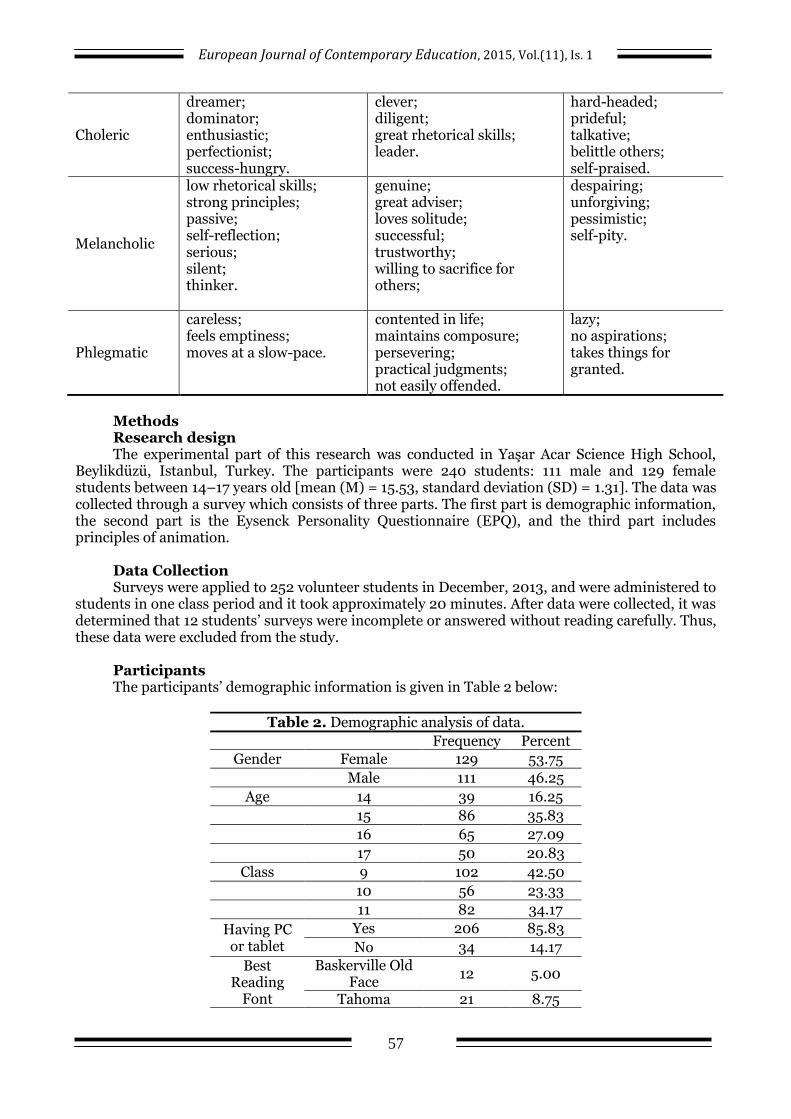
chart. Font and emphasis comprehension In this sub-section, the font and emphasis comprehension result is studied. The results were
obtained from a survey partly based on the students‟ choice of favourite fonts (here we only focus on some of popular fonts) and emphasis on the text, and the results are shown in Table 6 and Figs 8-9. Fonts, as is commonly known, are divided into two main families: sans serif and sans. The results shown in Table 7 illustrate that sans serif and sans slightly differ.
Table 6. Favourite font selection.
Font Font Family Frequency % Times New Roman Sans serif 69 28.87%
Calibri Sans 34 14.23% Cambria Sans 30 12.55% Tahoma Sans 21 8.79%
Bookman Old Style Sans serif 21 8.79% Gill Sans MT Sans 18 7.53%
Garamond Sans serif 16 6.69% Verdana Sans 15 6.28%
Baskerville Old Face Sans serif 12 5.02% Batang Sans serif 3 1.26% Total 239 100.00%
Among the given choices of fonts in the survey, Times New Roman, Calibri and Cambria are
the three most frequently fonts. Times New Roman, belonging to Sans serif family, received 28.87% while Calibri and Cambria, both from Sans families received 14.23% and 12.55% respectively. Our result has shown that Sans serif family fonts have a total of 50.63% percentage of choice, and the Sans family has 49.37%. In conclusion, Sans serif and Sans are used almost equally in our research.
The emphasis of texts is sub-divided into bold, italic, highlight and underline. The results have shown that out of 240 students, a majority of them favoured bold with 62.50%, while italic 17.92% and highlight 14.17 % were less favoured. Underline accounts for 5.42%. Figs. 8-9 show the results of both font choice and text emphasis.
European Journal of Contemporary Education, 2015, Vol.(11), Is. 1
62
Fig. 8. Font choice. Fig. 9. Text emphasis.
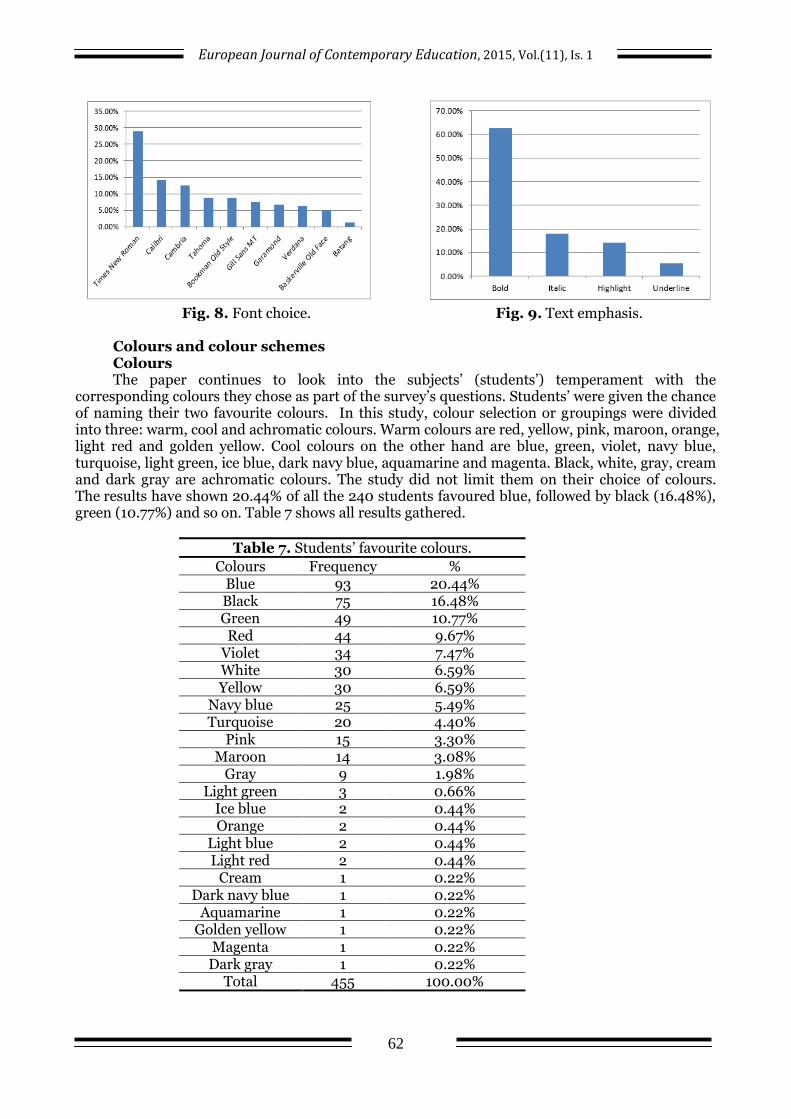
Colours and colour schemes Colours The paper continues to look into the subjects‟ (students‟) temperament with the
corresponding colours they chose as part of the survey‟s questions. Students‟ were given the chance of naming their two favourite colours. In this study, colour selection or groupings were divided into three: warm, cool and achromatic colours. Warm colours are red, yellow, pink, maroon, orange, light red and golden yellow. Cool colours on the other hand are blue, green, violet, navy blue, turquoise, light green, ice blue, dark navy blue, aquamarine and magenta. Black, white, gray, cream and dark gray are achromatic colours. The study did not limit them on their choice of colours. The results have shown 20.44% of all the 240 students favoured blue, followed by black (16.48%), green (10.77%) and so on. Table 7 shows all results gathered.
Table 7. Students‟ favourite colours.
Colours Frequency % Blue 93 20.44% Black 75 16.48% Green 49 10.77% Red 44 9.67%
Violet 34 7.47% White 30 6.59% Yellow 30 6.59%
Navy blue 25 5.49% Turquoise 20 4.40%
Pink 15 3.30% Maroon 14 3.08%
Gray 9 1.98% Light green 3 0.66%
Ice blue 2 0.44% Orange 2 0.44%
Light blue 2 0.44% Light red 2 0.44%
Cream 1 0.22% Dark navy blue 1 0.22%
Aquamarine 1 0.22% Golden yellow 1 0.22%
Magenta 1 0.22% Dark gray 1 0.22%
Total 455 100.00%

European Journal of Contemporary Education, 2015, Vol.(11), Is. 1
63
Overall results shown in Table 7 illustrate the percentage of warm (23.47%) and achromatic (25.49%) colours slightly differ. The sum of warm and achromatic colours was almost equal to the percentage of cool colours (50.77%). Fig. 10 gives another view of the obtained results.
Fig. 10. Overall colour selection.
Colours and personality types Additionally, the study compared the percentage of cool, warm and achromatic colours with
the respective temperaments. Table 8 shows how each personality type has chosen the colour groups.
Table 8. Personality types with colour groups.
Personality type Cool colours Warm colours Achromatic Total Sanguine 49.14% 24.14% 26.72% 100.00%
Phlegmatic 53.06% 22.45% 24.49% 100.00% Melancholic 54.95% 20.88% 24.18% 100.00%
Choleric 44.71% 28.24% 27.06% 100.00% Choleric-
Melancholic 39.31% 30.43% 30.43% 100.00%
Phlegmatic-Sanguine
60.87% 17.39% 21.74% 100.00%
Melancholic-Phlegmatic
52.94% 23.53% 23.53% 100.00%
Choleric-Sanguine* Not computed Not computer Not computed Not computed
Analyzing the maximum and minimum percentage of colour groups pertaining to the
personality types has shown the following results: for cool colours, the maximum percentage is 30.43% (choleric-melancholic) and the minimum percentage is 17.39% (phlegmatic-sanguine). For warm colours the maximum percentage is 60.87% (phlegmatic-sanguine) while the minimum percentage is 39.31% (choleric-melancholic). The maximum percentage in achromatic colours is 30.43% (choleric-melancholic) and the minimum percentage is 21.74% (phlegmatic-sanguine). Based on the above results, both choleric-melancholic and phlegmatic-sanguine gained the lowest and highest percentages in different colour groups.
Tables 9-15 show the results of different personality types based on colour selection. We restrict the result by frequency >5%.
* Since we had only student with this personality type, we could not compute corresponding cells.

European Journal of Contemporary Education, 2015, Vol.(11), Is. 1
64
Table 9. Sanguine.
Colours Blue Black Green Red White Yellow Violet Turquoise Percentage 19.01% 14.88% 13.22% 10.74% 8.26% 8.26% 5.79% 5.79%
Table 10. Phlegmatic.
Colours Blue Black Green Red White Yellow Navy blue
Turquoise Violet
Percentage 21.43% 16.33% 10.20% 9.18% 7.14% 7.14% 7.14% 7.14% 5.10%
Table 11. Melancholic.
Colours Blue Black Violet Green Red Yellow Navy blue Percentage 27.47% 17.58% 10.99% 9.89% 8.79% 5.49% 5.49%
Table 12. Choleric.
Colours Black Blue Violet Red Green Yellow Pink Percentage 20.73% 14.63% 10.98% 8.54% 7.32% 7.32% 6.10%
Table 13. Choleric-Melancholic.
Colours Black Green Maroon Blue Red White Pink Percentage 17.39% 13.04% 13.04% 8.70% 8.70% 8.70% 8.70%
Table 14. Phlegmatic-Sanguine.
Colours Blue Green Red White Navy blue Black Percentage 30.43% 13.04% 13.04% 13.04% 13.04% 8.70%
Table 15. Melancholic-Phlegmatic. Colours Blue Black Green Red Turquoise Violet White Yellow Navy
blue Pink Gray
Percentage 17.65% 11.76% 11.76% 11.76% 11.76% 5.88% 5.88% 5.88% 5.88% 5.88% 5.88%
The results have shown that, blue is the most chosen colour by most of the personality types
followed by black and green. Colours schemes After the tested students wrote their two favourite colours, we analyzed them based on
different colour schemes, namely: complement, triadic, analogous and split-complementary colour schemes (Williams, 2012). The tested students selected 23 different colours in total. This means, that following well-known rules of combinatorics (Brualdi, 2010) we can consider
2
23
23!253
2!(23 2)!C
complementary colour schemes. Using the same formula for computing the number of combinations we get the number of complementary, triadic, analogous and split-complementary colour schemes:
3
23
23!3542
3!(23 3)!C
.
Our results have shown that for sanguine students who like blue and green, red can be added, in order to achieve a triadic colour scheme and visual harmony. Out of the 3542 possible combinations computed in CAS Maple for the triadic, analogous and split-complementary colour schemes our data have shown only one combination (i.e. blue, green, and red) present in the sanguine personality type. For the other personality types, none of the mentioned colour schemes exist. For two colours, on the other hand, with 253 possible combinations, our data have shown the
European Journal of Contemporary Education, 2015, Vol.(11), Is. 1
65
same complementary colours – blue and yellow, green and violet. In regard to mixed temperaments, complementary colour schemes were not found.
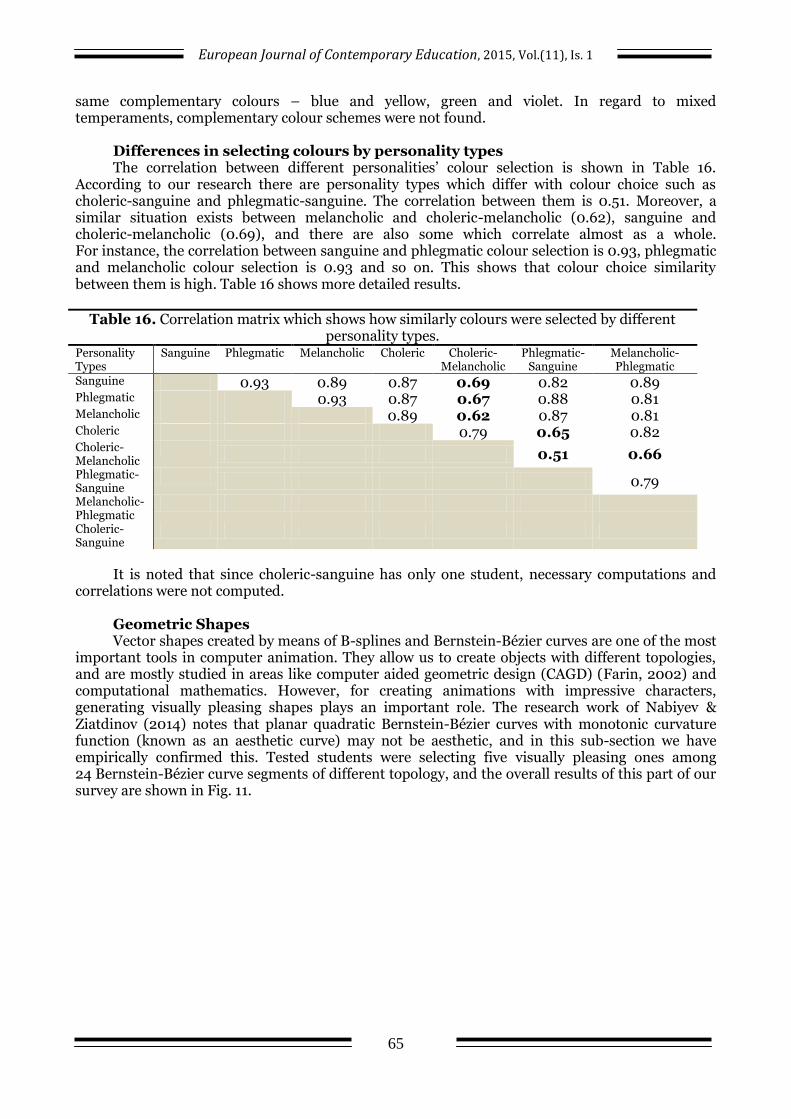
Differences in selecting colours by personality types The correlation between different personalities‟ colour selection is shown in Table 16.
According to our research there are personality types which differ with colour choice such as choleric-sanguine and phlegmatic-sanguine. The correlation between them is 0.51. Moreover, a similar situation exists between melancholic and choleric-melancholic (0.62), sanguine and choleric-melancholic (0.69), and there are also some which correlate almost as a whole. For instance, the correlation between sanguine and phlegmatic colour selection is 0.93, phlegmatic and melancholic colour selection is 0.93 and so on. This shows that colour choice similarity between them is high. Table 16 shows more detailed results.
Table 16. Correlation matrix which shows how similarly colours were selected by different personality types.
Personality Types
Sanguine Phlegmatic Melancholic Choleric Choleric-Melancholic
Phlegmatic-Sanguine
Melancholic-Phlegmatic
Sanguine 0.93 0.89 0.87 0.69 0.82 0.89 Phlegmatic 0.93 0.87 0.67 0.88 0.81 Melancholic 0.89 0.62 0.87 0.81 Choleric 0.79 0.65 0.82 Choleric-Melancholic
0.51 0.66
Phlegmatic-Sanguine
0.79
Melancholic-Phlegmatic
Choleric-Sanguine
It is noted that since choleric-sanguine has only one student, necessary computations and
correlations were not computed. Geometric Shapes Vector shapes created by means of B-splines and Bernstein-Bézier curves are one of the most
important tools in computer animation. They allow us to create objects with different topologies, and are mostly studied in areas like computer aided geometric design (CAGD) (Farin, 2002) and computational mathematics. However, for creating animations with impressive characters, generating visually pleasing shapes plays an important role. The research work of Nabiyev & Ziatdinov (2014) notes that planar quadratic Bernstein-Bézier curves with monotonic curvature function (known as an aesthetic curve) may not be aesthetic, and in this sub-section we have empirically confirmed this. Tested students were selecting five visually pleasing ones among 24 Bernstein-Bézier curve segments of different topology, and the overall results of this part of our survey are shown in Fig. 11.

European Journal of Contemporary Education, 2015, Vol.(11), Is. 1
66
Fig. 11. Overall shape selection (numbers under polygons mean the name of jpg file and are not
connected to any values here) In our survey, students were asked to choose five curve segments out of 24. All planar curves
were divided into three different types: MC-curves (Ziatdinov et al., 2013), curves with central symmetry, and other Bernstein-Bézier curves. The colours of the graph represent the three curves respectively: red for the MC-curves, green for curves with central symmetry and blue for other curves. The results in Fig. 11 have shown polygon 54, belonging to the curves with central symmetry, has the highest percentage of 8.67%. Polygon 14 with other curves followed having 7.90%. While polygon 31 belonging to MC-curve gathered only 4%. With an overall computation, MC-curves were selected 22%, while curves with central symmetry, 21%, and other curves were selected with 57%. Here, we can conclude that monotonicity of a curvature function as in MC-curves does not guarantee that a curve segment is visually pleasing. However, the situation may be a bit different, if we differentiate among personality types. Figures 12-19 and Table 17 show these cases.
Fig. 12. Sanguine. Fig. 13. Phlegmatic.
0.00%
1.00%
2.00%
3.00%
4.00%
5.00%
6.00%
7.00%
8.00%
9.00%
10.00%
54 14 44 04 24 34 51 33 53 31 03 13 32 43 52 11 23 41 21 22 02 12 42 01
0.00%
2.00%
4.00%
6.00%
8.00%
10.00%
12.00%
54 04 24 03 32 51 53 41 23 12 42 22
0.00%
2.00%
4.00%
6.00%
8.00%
10.00%
54 04 34 44 03 52 22 53 32 23 42 41
European Journal of Contemporary Education, 2015, Vol.(11), Is. 1
67
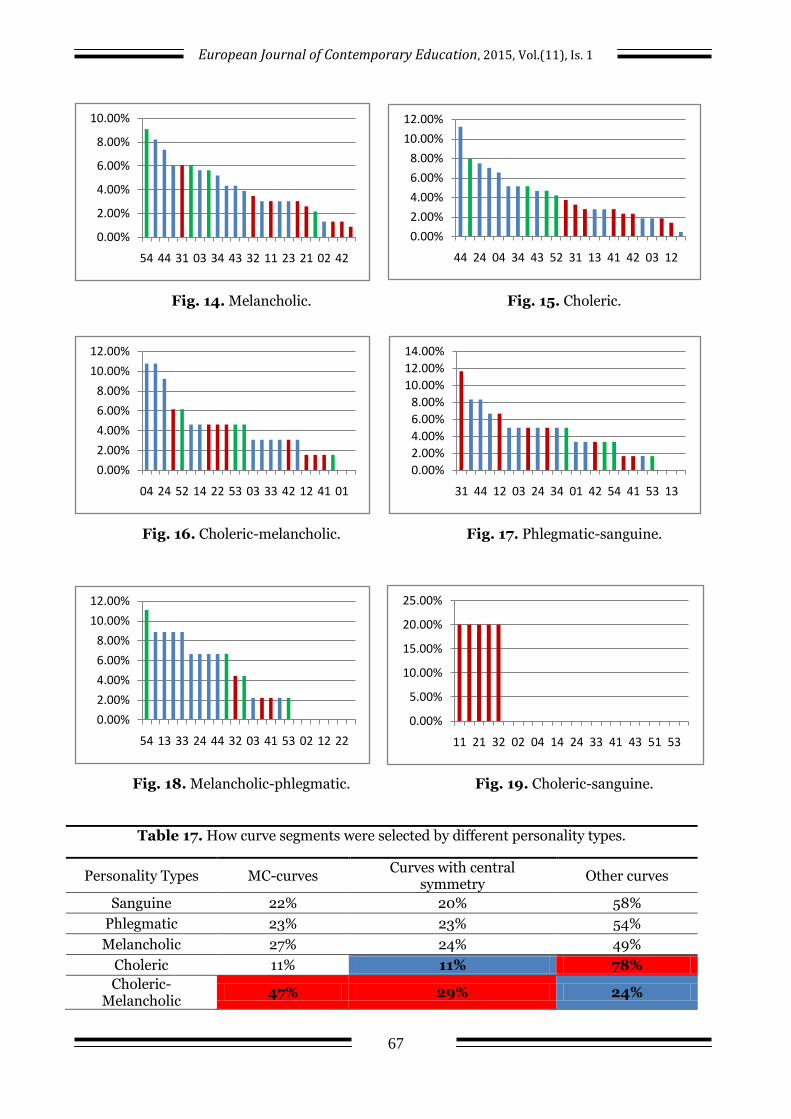
Fig. 14. Melancholic. Fig. 15. Choleric.
Fig. 16. Choleric-melancholic. Fig. 17. Phlegmatic-sanguine.
Fig. 18. Melancholic-phlegmatic. Fig. 19. Choleric-sanguine.
Table 17. How curve segments were selected by different personality types.
Personality Types MC-curves Curves with central
symmetry Other curves
Sanguine 22% 20% 58%
Phlegmatic 23% 23% 54%
Melancholic 27% 24% 49%
Choleric 11% 11% 78%
Choleric-Melancholic
47% 29% 24%
0.00%
2.00%
4.00%
6.00%
8.00%
10.00%
54 44 31 03 34 43 32 11 23 21 02 42
0.00%
2.00%
4.00%
6.00%
8.00%
10.00%
12.00%
44 24 04 34 43 52 31 13 41 42 03 12
0.00%
2.00%
4.00%
6.00%
8.00%
10.00%
12.00%
04 24 52 14 22 53 03 33 42 12 41 01
0.00%
2.00%
4.00%
6.00%
8.00%
10.00%
12.00%
14.00%
31 44 12 03 24 34 01 42 54 41 53 13
0.00%
2.00%
4.00%
6.00%
8.00%
10.00%
12.00%
54 13 33 24 44 32 03 41 53 02 12 22
0.00%
5.00%
10.00%
15.00%
20.00%
25.00%
11 21 32 02 04 14 24 33 41 43 51 53

European Journal of Contemporary Education, 2015, Vol.(11), Is. 1
68
Phlegmatic-Sanguine
37% 14% 49%
Melancholic-Phlegmatic
10% 28% 63%
Average 22% 21% 57%
It is noted that since choleric-sanguine has only one student, necessary computations were
not carried out. In Table 17 it is shown that the difference between the frequency of MC-curves selected by
choleric (11%) and melancholic-phlegmatic (10%) is only one percent and it‟s not significant. Obtained results suggest that choleric-melancholic students are attracted most by MC-curves and curves with central symmetry among all the personality types, but choleric students show opposite results. The cells filled with red are the maximum frequency of the selected curve. While those which are filled with blue are the minimum.
Computer animation principles This sub-section analyses the results gathered from the last part of the survey regarding the
eleven principles of traditional computer animation (Lasseter, 1987): squash and stretch, timing, anticipation, staging, follow through and overlapping action, straight ahead action and pose-to-pose action, show in and out, arcs, exaggeration, secondary action and appeal. Students were asked eleven multiple type questions, and the following results were obtained.
Table 18. How animation principles were answered by different personality types.
Question No.
Personality types Average by questi
on
Sanguine
Phlegmatic
Melancholic
Choleric
Choleric-
Melancholic
Phlegmatic-
Sanguine
Melancholic-
Phlegmatic
Choleric-
Sanguine
1. 30% 14% 29% 19% 31% 25% 33% 0% 25% 2. 66% 59% 74% 60% 77% 83% 56% 0% 66% 3. 44% 44% 23% 30% 31% 27% 11% 0% 34% 4. 63% 60% 53% 65% 42% 67% 67% 0% 60% 5. 38% 26% 29% 30% 46% 25% 33% 100 32% 6. 75% 70% 69% 72% 77% 75% 44% 0% 71% 7. 56% 58% 48% 60% 46% 67% 33% 0% 54% 8. 54% 23% 43% 49% 31% 50% 33% 0% 47% 9. 19% 28% 19% 14% 31% 8% 0% 0% 19% 10. 55% 59% 52% 37% 42% 50% 44% 0% 50% 11. 81% 80% 69% 65% 69% 92% 67% 100% 75%
Average
52,82%
47,36% 46,18% 45,55
% 47,55% 51,73% 38,27%
44,42%
Average for main and mixed personality types Main Temperaments Mixed Temperaments 47,97% 45,85%
Table 18 shows that the maximum and minimum frequencies of correctly selected questions
correspond to mixed personality types (except for choleric-sanguine as it was mentioned in previous sections). At the age of 14-17 school students are not aware of the fundamental principles of computer animation, so obviously, these questions were answered by their own logical understanding. The overall average frequency of correct answers was 44,42%. The results shown in Table 18 of overall frequencies of correctly selected questions illustrate sanguine (52.82%) as the highest temperament type while melancholic-phlegmatic (38.27%) on the other hand has the least. Among all the studied personality types, melancholic-phlegmatic students have shown the least readiness in understanding the fundamental principles for creating computer animations, on the

European Journal of Contemporary Education, 2015, Vol.(11), Is. 1
69
other hand sanguine and phlegmatic-sanguine students were the best. In general, main and mixed personality types were giving correct answers similarly. There are some aspects like exaggeration in computer animation, and only 19 % of students were able to understand it.
Limitations
The results of our survey have shown that we had only one choleric-sanguine personality, so this mixed personality type was not studied in as much detail as others;
We have not studied in detail how different personality types prefer an object to be moved on their screens, and what should be the topology of used paths. This would be a very important variable since animation is known as the art of movement.
We believe that these remarks should be taken into account in our future work or by other researchers who find them important to be considered in temperament-based learning.
Conclusion and future work The aim of the current work was to establish an inter-disciplinary field of research towards
greater educational effectiveness where psychology, colour science, computer animation, geometric modelling and technical aesthetics intersect. Our research was based on a survey which was conducted among school students aged 14-17. For the first time in computer-assisted learning we have proposed a way for developing educational computer animation based on fundamental personality types of human temperament. Our experimental analysis has shown how fundamental principles of traditional computer animation are understood by school students. In addition, we have found that both choleric-melancholic and phlegmatic-sanguine students gained the lowest and highest percentages in selection of different groups of students' favourite colours (warm, cool, and achromatic). The students‟ choices of aesthetic shapes used in computer animation were used to experimentally confirm the theory of Nabiyev and Ziatdinov (2014) which reports that planar quadratic Bernstein-Bézier curves with monotonic curvature function may not be aesthetic. Finally, we have shown that choleric-melancholic students are attracted most by MC-curves and curves with central symmetry among all the personality types, but choleric students are attracted by other Bernstein-Bézier curves. The present study believes that it is likely to have wide benefits in the field of education. Considering the personality types of students‟ temperament in designing educational computer animations with the aid of gathered empirical results might be a promising avenue to enhance the learning process.
We envisage potential applications of our findings in learning graphic design. Our research has shown that different personality types perceive the shapes in different ways, and this can be used as a tool to communicate pictorial messages to the audience in a more efficient way. One of the other future directions can be studying relationships between personality types and their achievement in social sciences and arts. All these questions will be studied in our future manuscripts.
Acknowledgement We would like to thank Dr. Rifkat I. Nabiyev (Ufa State Aviation Technical University, Ufa,
Russia) for his valuable comments, and Huseyin Kinay (Fatih University, Istanbul, Turkey) for his assistance during this research. The first author of this work was supported by the Scientific Research Fund of Fatih University under the project number P55011301_Y (3141).
The second author is very grateful to Prof. Kenjiro T. Miura (Shizuoka University, Hamamatsu, Japan) and his Realistic Modelling Lab. members for discussion on monotone-curvature curves.
References: 1. Ali, Kh. K. (2007). Mathematical model of dual system of testing in the e-learning mode.
Bulletin of Tupolev Kazan State Technical University, No. 4, 65-69 (in Russian). 2. Ali, Kh. K. (2008). Dual testing system based on a personality type of temperament. In
International scientific-practical conference "New Information Technologies in Education" (pp. 107-108). Yekaterinburg, Russia: AMB (in Russian).

European Journal of Contemporary Education, 2015, Vol.(11), Is. 1
70
3. Bikchentaeva, R., & Ziatdinov, R. (2012). The use of computer animation in teaching Korean language to the students of journalism majors. Materials of international conference "Multimedia journalism Eurasia-2012", Kazan Federal University, Russia (in Russian). Brualdi, R.A. (2010). Introductory combinatorics (5th ed.), Pearson Prentice Hall.
4. Dunbar, K. (1993). Concept discovery in a scientific domain. Cognitive Science, 17: 397-434. 5. Eysenck, H. J. & Eysenck, M.W. (1958). Personality and Individual Differences. Plenum
Publishing. 6. Farin, G. E. (2002). Curves and surfaces for CAGD: a practical guide. Morgan Kaufmann. 7. Griffith, A. (2010). SPSS for Dummies. 2nd Edition. Indianapolis, Indiana: Wiley
Publishing Inc. 8. Gao, Y. (1994). Personality Psychology. Beijing: Beijin Normal University Publishers,
165-170. 9. Hasler, B. S. (2007). Leaner Control, Cognitive Load and Instructional Animation. Appl.
Cognit. Psychol. 21: 713-729. Zurich, Switzerland. 10. Jong, J.T., Hong, J.C., & Yen, C. Y. (2013). Persistence temperament associated with
children playing math games between touch panel and embodied interaction. Computer Assisted Learning, 29(6), 569-578.
11. Lasseter, J. (1987). Principles of Traditional Animation Applied to 3D Computer Animation, SIGGRAPH ‟87 Proceedings of the 14th annual conference on Computer graphics and interactive techniques, pp. 35-44, New York, NY, USA.
12. Li, M., Song, N., & Pang, K. (2007). A Study on the Relationship between Temperament and Mathematics Academic Achievement. Research in Mathematical Education, 11(3), 197-207.
13. Liengme, B. (2009). A guide to Microsoft Excel for Scientists and Engineers. San Diego, California, USA: Academic Press.
14. Lowe, R. (2008). Learning from Animation: Where to Look, When to Look. In R. Lowe and W. Schnotz (Eds.). Learning with Animation. Research Implications for Design. (1st ed., pp 49-71). Cambridge, University Press. New York, USA.
15. Li, X. & Li, W. (2004). Relation between junior students' mathematics achievement motivation and self-adjustment learning and academic achievement. Journal of Mathematics Education, 13 (2), 52-54.
16. Lowe, R.K. (2004). Animation and learning: Value for money? In R. Atkinson, C. McBeath, D. Jonas-Dwyer & R. Phillips (Eds.), Beyond the comfort zone: Proceedings of the 21st ASCILITE Conference (pp. 558-561). Perth, December 5-8.
17. Mayer, R. E. (1999). Multimedia aids to problem-solving transfer. Int. J. Educ. Res. 31: 661-624.
18. Mayer, R. E., & Moreno, R. (2002). Animation as an aid to multimedia learning. Educational Psychology Review, 14(1), 87-99.
19. Mayer, R. E., Mayer, M., Mayer, S., & Campbell, J. (2005). When static media promote active learning: Annotated illustrations versus narrated animations in multimedia instructions. Journal of Educational Psychology: Applied, 11, 256-265.
20. McClowry, S. G. (1992). Temperament theory and research. Image: Journal of Nursing Scholarship, 24, 319-325.
21. McClowry, S. G. (1995). The influence of temperament on development during middle childhood. Journal of pediatric nursing, 10 (3), 160-165.
22. Musa, S., Ziatdinov, R., & Griffiths, C. (2013). Introduction to computer animation and its possible educational applications. In M. Gallová, J. Gunčaga, Z. Chanasová, M.M. Chovancová (Eds.), New Challenges in Education. Retrospection of history of education to the future in the interdisciplinary dialogue among didactics of various school subjects (1st ed., pp. 177-205). Ružomberok, Slovakia: VERBUM – vydavateľstvo Katolíckej univerzity v Ružomberku.
23. Musa, S., Ziatdinov, R., Nabiyev, R. I., & Hemenway, D. (2013). Introduction to computer animation. I. Character design with Anime Studio 6. Ufa, Russia: Ufa State University of Economics and Service.
24. Nabiyev, R. I. & Ziatdinov, R. (2014). A mathematical design and evaluation of Bernstein-Bézier curves‟ shape features using the laws of technical aesthetics. Mathematical Design & Technical Aesthetics 2(1), 6-13.

European Journal of Contemporary Education, 2015, Vol.(11), Is. 1
71
25. Nabiyev, R. I., Nabiyev, I. H., & Ziatdinov, R. (2013). Introduction to the artistic design and Bernstein-Bezier curve and surface theory in preparation of a fashion designer. Ufa, Russia: Ufa State University of Economics and Service.
26. Pailliotet, A. W., & Mosenthal, P. B. (Eds). (2000). Reconceptualising Literacy in the Age of Media, Multimedia, and Hypermedia, JAI/Ablex, Norwood, NJ.
27. Plötzner, R., & Lowe, R. (2004). Dynamic visualizations and learning. Learning and Instruction, 14, 235-240.
28. Qiaorongning, F. (2003). Relations between senior students' scores and their emotional barrier in mathematics class. Journal of Mathematics Education, 12(3), 60-63.
29. Sweller, J. (1999). Instructional designs in technical areas. Melbourne: ACER Press. 30. Williams, R. (2012). The Non-Designer‟s Design Book. Berkeley, California, USA:
Peachpit Press. 31. Ziatdinov, R., Nabiyev, R. I., & Miura, K.T. (2013). On some families of planar curves
with monotonic curvature function, their aesthetic measures and applications in industrial design. Bulletin of Moscow Aviation Institute (National Research University) 20(2), 209-218.
32. Ziatdinov, R., Nabiyev, R. I., & Miura, K.T. (2013). MC-curves and aesthetic measurements for pseudospiral curve segments. Mathematical Design & Technical Aesthetics 1(1), 6-17.