DEVELOPING AND TESTING AN INTEGRATIVE …teep.tamu.edu/Npmrc/Fernandez.pdf3 Introduction Few topics...
43
DEVELOPING AND TESTING AN INTEGRATIVE FRAMEWORK OF PUBLIC SECTOR MANAGERIAL LEADERSHIP: EVIDENCE FROM THE PUBLIC EDUCATION ARENA. Sergio Fernandez University of Georgia School of Public and International Affairs Department of Public Administration and Policy 104 Baldwin Hall Athens, GA 30602-1615 (706) 542-6609 Paper presented at the 7 th National Public Management Research Conference, Washington, D.C., October 9-11, 2003. I would like to thank Dr. Hal G. Rainey, Dr. Laurence J. O’Toole, Jr., and Dr. Kenneth J. Meier for their comments and suggestions. The author is solely responsible for the contents.
Transcript of DEVELOPING AND TESTING AN INTEGRATIVE …teep.tamu.edu/Npmrc/Fernandez.pdf3 Introduction Few topics...

DEVELOPING AND TESTING AN INTEGRATIVE FRAMEWORK OF
PUBLIC SECTOR MANAGERIAL LEADERSHIP:
EVIDENCE FROM THE PUBLIC EDUCATION ARENA.
Sergio FernandezUniversity of Georgia
School of Public and International AffairsDepartment of Public Administration and Policy
104 Baldwin HallAthens, GA 30602-1615
(706) 542-6609
Paper presented at the 7th National Public Management ResearchConference, Washington, D.C., October 9-11, 2003. I would like to thankDr. Hal G. Rainey, Dr. Laurence J. O’Toole, Jr., and Dr. Kenneth J. Meierfor their comments and suggestions. The author is solely responsible for thecontents.

2
Abstract
In an effort to bring some order to the leadership literature and integrate existing
knowledge on the topic of leadership, some scholars have begun recently to develop
integrative frameworks of leadership. These frameworks incorporate multiple skills, traits,
behaviors, leadership styles and situational variables in a single theoretical model to
explain a leader’s impact on organizational performance. This study advances that line of
research by developing an integrative framework of public sector leadership and testing the
framework using different quantitative techniques and a large-N dataset from the public
education arena. Six of nine hypotheses derived from the leadership literature are
supported empirically. Moreover, the framework explains over half of the variance in
organizational performance, with the leadership variables accounting for over two-thirds of
the explained variance.

3
Introduction
Few topics in organization theory and organizational behavior have garnered more
attention than managerial leadership. For more than half a century, experts have been
laboring to understand managerial leadership, particularly the paths by which successful
leaders exercise their influence over individuals and organizations and the impact of
managerial leadership on performance. A vast body of empirical and theoretical work has
accumulated over time, yet as one leading expert asserts, “leadership is one of the most
observed and least understood phenomena on earth” (Burns 1978, p. 3). The leadership
literature is plagued by weak, inconsistent and contradictory findings. Moreover, no
dominant theory of leadership has emerged. Instead, the literature remains balkanized into
several clusters of competing theories and approaches, each emphasizing different aspects
of leadership. In a recent effort to move beyond this apparent disarray, some researchers
have begun to develop and test integrative frameworks of leadership (Yukl 2002; Yukl, et
al 2002). Integrative frameworks incorporate multiple skills, traits, behaviors, leadership
styles and situational variables in a single theoretical model to explain leadership
effectiveness. As such, they offer perhaps the best opportunity for explaining the impact
of leadership on subordinate and organizational performance.
Some of the leading students of public sector leadership, including Doig and
Hargrove (1990), Riccucci (1994) and Svara (1994), have also undertaken studies based on
theoretical frameworks that resemble integrative frameworks of leadership. Previous
efforts to validate these frameworks, however, have been limited to qualitative analyses of
a small number of cases. This paper will try to advance this line of research by developing
4
an integrative framework of public sector leadership and testing the framework using
different quantitative techniques and a large-N dataset from the public education arena.1 In
addition to testing various theoretical propositions about leadership, the aim is to
demonstrate the potential that integrative frameworks hold for explaining a leader’s impact
on public organizational performance, and to show how existing large-N datasets can be
used to develop and test such frameworks.
After a brief review of the theoretical and empirical literature on leadership, this
paper presents an integrative framework of public sector leadership developed inductively
from the generic management and public management literatures. Although many of the
concepts addressed in the vast literature are not captured directly by the dataset used for
this analysis, the dataset includes indicators that will be used to measure certain traits,
behaviors and styles of a leader, as well as situational variables. The discussion will then
turn to an empirical test of the framework using different regression techniques. The paper
will conclude with a brief discussion of the limitations of the study and implications for
future research on public sector leadership.
The literature on leadership
As mentioned earlier, leadership experts lament our weak understanding of
leadership and the fact that no dominant theory of leadership has emerged. Instead, the
leadership literature is characterized by several clusters of competing theories and
approaches emphasizing different aspects of leadership. Some of the leading ones include
traits and skills theories; leadership behavior approaches; research on power and influence;
1 I would like to thank Laurence J. O’Toole and Kenneth J. Meier for allowing me access to their dataset forthis study.

5
situational and contingency theories; dyadic theories; and research on charismatic and
transformational leadership (Yukl 2002). Space constraints preclude a comprehensive
review of the leadership literature, but the following discussion illustrates the diversity of
theories and approaches for explaining leadership effectiveness, as well as the difficulties
researchers have encountered in their efforts to validate leadership theories.
Research on leadership traits and skills represents one of the earliest attempts by
scholars to understand effective leadership. Studies by Stogdill (1948), McClelland (1965;
1985), Boyatzis (1982) and others tried to identify the traits and skills of successful
leaders. Although a variety of different traits were found to be related to different aspects
of leadership effectiveness, the links between individual traits and effectiveness were often
weak (Yukl 2002). Moreover, traits and skills research failed to identify a set of traits that
all successful leaders must possess.
The leadership behavior approach also has a long tradition, including such seminal
studies as the Ohio State leadership studies and Michigan leadership studies, as well as
Blake and Mouton’s (1964) managerial grid, which evolved from the first two studies.
Two broad categories of task-oriented and relations-oriented behaviors were identified by
the Ohio State and Michigan studies. Several more recent studies undertaken by
Scandinavian researchers over the last decade identified a third dimension of leadership
behavior, development-oriented behaviors that encourage innovation, experimentation and
change (Ekvall and Arvonen 1991; Lindell and Rosenqvist 1992). Overall, however,
leadership behavior research has enjoyed only modest success linking individual behaviors
to leadership effectiveness, and researchers have failed to identify a definitive set of
6
essential leadership behaviors. The role of situational variables in explaining leadership
effectiveness has also been somewhat overlooked in these behavioral approach studies.
The power and influence approach includes numerous studies aimed at explaining
leadership effectiveness in terms of the amount and type of power a leader possesses and
the manner in which that power is exercised. Most studies have found that expert and
referent power are positively correlated with subordinate satisfaction and performance;
however, the impact of legitimate, reward and coercive power has not been well
established. Other power and influence research has focused on participative leadership,
delegation and empowerment, but the findings from these studies by and large have been
mixed or inconclusive (Yukl 2002).
Researchers have developed situational and contingency theories of leadership to
explain leadership effectiveness under varying conditions. The more influential ones
include Fiedler’s (1967) LPC contingency model; the path-goal theory of leadership
(House 1971); cognitive resources theory (Fiedler 1986; Fiedler and Garcia 1987); the
multiple linkage model (Yukl 1989); and leadership substitute theory (Kerr and Jermier
1978). Overall, empirical research has failed to provide strong validation of the various
contingency and situational theories of leadership. According Yukl (2002), leadership
substitute theory and cognitive resources theory have not been rigorously tested, and
studies of the other theories have failed to yield strong, consistent findings. Nonetheless,
contingency and situational theories have shed light on the influence of situational
variables on a leader’s effectiveness and have helped pave the way for researchers to
develop integrative frameworks of leadership.

7
Dyadic theories of leadership, such as the various versions of Leader-member
exchange (LMX) theory, have examined the vertical relationship that develops between the
leader and the follower. LMX theory postulates that leaders develop one of two types of
exchange relationships with each individual subordinate: a high-exchange relationship,
which is mutually beneficial, or a low-exchange relationship characterized by a relatively
low level of mutual influence (Dansereau, Graen, and Haga 1975). Various studies have
found that high-exchange relationships are related to higher levels of support for the leader,
enhanced mutual communication, and higher subordinate commitment and performance
(Gerstner and Day 1997; Schriesheim, et al. 1999). However, LMX theory is still plagued
by several conceptual weaknesses: situational variables have been largely overlooked; it is
not yet clear how a leader’s many dyadic relationships affect each other and the overall
performance of the group; and LMX theory has been applied almost exclusively to vertical
dyadic relationships (Yukl 2002; Schriesheim, et al. 1999).
While most other leadership theories and approaches have focused on the rational
processes at play between leaders and followers, charismatic and transformational theories
of leadership have focused instead on the role of emotions and symbols. Influenced by the
earlier work of Weber on charismatic leaders and Burns’ (1978) distinction between
transactional and transforming leadership, this cluster of theories and approaches now
includes attribution and self-concept theories of leadership and subsequent refinements to
transformational leadership theory by Bennis and Nanus (1985) and Bass (1985), among
other works. The results of some empirical research have been promising. However,
charismatic and transformational theories continue to be hindered by various conceptual

8
problems, including concepts that are difficult to operationalize, causal paths that remain
unclear, and the need to assess the impact of these leadership approaches under varying
situations or conditions (Bryman 1993; Yukl 1999).
The leadership literature remains largely balkanized into these various clusters of
competing theories and approaches, and up until very recently, there were few attempts at
integration. Some researchers now are beginning to pursue two different strategies for
bringing some order to the literature and integrating existing knowledge. A few scholars
such as Klenke (1993) have started using meta-analytic techniques to cumulate the results
of a large number of leadership studies, with the aim of building a suitable base of
knowledge from which to build new leadership theory.
A second strategy has been to develop and test integrative frameworks of
leadership. Integrative frameworks of leadership incorporate multiple skills, traits,
behaviors, leadership styles and situational variables in a single theoretical model to
explain the effectiveness of a leader. Yukl (2002) and Yukl, et al. (2002) have developed
generic integrative frameworks of leadership, and a preliminary empirical test of the latter
using confirmatory factor analysis found some support for it.
Van Wart (2003) has recently asserted that while the mainstream leadership
literature has exhibited a shift towards synthesis and the development of integrated models
since the 1990s, such attempts are largely lacking in the public sector literature. In order
to advance our understanding of public sector leadership, Van Wart argues, public
administration scholars should begin to develop comprehensive leadership models that
integrate transactional and transformational elements and that account for various
9
situational variables inherent in the public context, and then subject these models to
rigorous empirical testing (pp. 225). Some of the leading students of public sector
leadership, including Doig and Hargrove (1990), Riccucci (1994) and Svara (1994), have,
in fact, undertaken studies based on theoretical frameworks that resemble integrative
frameworks of leadership. However, efforts to validate these public sector leadership
frameworks have been limited to case studies of a small number of public sector leaders.
Doig and Hargrove (1990) found that a leader’s skills, abilities, personality and style
interacted with situational variables to determine success. Specifically, skills and abilities
had to match the task at hand and had to be complemented by favorable conditions (i.e.,
favorable public opinion, political support, and public demand). According to Riccucci
(1995), political, managerial and leadership skills, experience, technical expertise, style
and personality all helped to make leaders more effective. However, leaders were most
effective when they also received strong political support, were provided with ample
resources, and were assigned a task that matched their skills and abilities. Svara (1994) set
out to develop and test a framework of facilitative mayoral leadership in a council-manager
form of government. His framework, which was also supported by qualitative evidence
from multiple case studies, attempted to explain a leader’s effectiveness in terms of his or
her personal attributes, characteristics and skills, resources, roles, favorable relationships
with key actors, and favorable environmental conditions (i.e., political support, congruence
of goals, a homogeneous community and a supportive political environment).
These three works are important contributions to our understanding of public sector
leadership, inasmuch as they represent the first efforts by public management scholars to

10
integrate elements of different theories and approaches in a single leadership framework.
However, several methodological and conceptual limitations may have weakened the
validity of these studies. While the three frameworks appear to be well-specified, they are
not modeled explicitly and the causal paths between variables are not always entirely clear.
The studies also seem to suffer from the “too many variables/too few cases” dilemma so
common in policy implementation research, which makes it difficult to assess the causal
impact of a particular independent variable on leadership effectiveness. More importantly,
selection bias in the choice of cases seems to be a concern. In all three studies, the
researchers only selected examples of effective leaders to test their frameworks; there were
no cases of unsuccessful leaders examined in the studies. If researchers hope to explain
variation in a dependent variable, such as why some public sector leaders are effective
while others are not, the choice of cases must allow for variation in the dependent variable.
As King, et al. (1994) indicate, “how can we explain variations on a dependent variable if
it does not vary?” (p. 129). In order to address these limitations and build on the important
work by these scholars, I will develop an integrative framework of public sector leadership
that is explicitly modeled and then test the framework using different quantitative
techniques and five years of pooled data from a Texas public education dataset with over
2,000 cases.
An Integrative Framework of Public Sector Leadership
Many of the concepts addressed in the literature are not captured directly by the
Texas dataset used for this analysis. However, the dataset includes indicators that can be
used to measure certain traits, behaviors and styles of a leader, as well as situational

11
variables. In the following analysis, indicators from the dataset are used to measure eight
variables drawn from the leadership literature: the amount of time spent managing the
organization’s internal activities and its external environment; two forms of political
support; the level of task difficulty encountered by the organization; a leader’s experience;
a delegative leadership style that gives greater discretion to subordinates; and a leadership
style that actively promotes change.
Below is the integrative framework of public sector leadership developed and
tested in the study:
O = M1 + M2 + P1 + P2 + T + (E)(T) + (S)(T) + C, where
O = educational performance
M1 = time spent managing the organization’s internal activities
M2 = time spent managing the organization’s external environment
P1 = political support from the school board
P2 = political support from the community
T = task difficulty
E = superintendent experience
S = a leadership style that gives subordinates greater discretion
C = a leadership style that actively promotes change
Performance
O represents performance in the framework. Performance is measured using the
overall pass rate on the Texas Assessment of Academic Skills exam (TAAS), the
standardized test used in Texas public schools. This indicator measures only one aspect of

12
performance and fails to capture other dimensions of organizational effectiveness such as
top management’s ability to secure important resources for the organization or stakeholder
satisfaction. However, raising the overall pass rate on TAAS is a key goal of these
organizations, making this indicator a valuable measure of performance.
Managing the organization’s internal activities
An indicator of the amount of time a superintendent spends managing the school
district serves as the measure for M1. This indicator alone does not capture the richness
and complexity of a leader’s internal management function, which includes various tasks
such as structuring the organization’s work, motivating subordinates, managing culture,
and engaging in planning and decision-making. However, other indicators associated with
internal management activities are included in the model below.
H1: Time spent managing the organization’s internal activities will be positively
correlated with performance.
Managing the organization’s external environment
The importance of managing an organization’s external environment is stressed by
generic management experts and public management scholars alike. Public organizations,
in particular, operate in an environment that places a large number of constraints and
pressures (Rainey 1997; Rainey and Bozeman 2000). As a result, public managers
typically spend a considerable amount of time scanning their organization’s environment
for threats and opportunities and dealing with external actors to gain information and
political support. Wilson (2000) explains that new executives in the federal government
often complain about the amount of time spent trying to satisfy the demands and needs of

13
external actors and groups and how this takes time away from the agency’s work. He
argues, however, that an executive’s primary source of political power is a constituency
and that “the real work of the government executive is to curry favor and placate critics”
(p. 204). Meier and O’Toole (2003) found that network management (i.e., the frequency
with which superintendents interacted with certain key external stakeholders) had a
positive impact on program performance, even when an autoregressive term was included
in their model.2
The same indicator used by Meier and O’Toole (2003), the amount of time a
superintendent spends interacting with six different types of external stakeholders, serves
as the measure for managing the external environment. This indicator measures only the
extent of interaction with these stakeholders and does not account for the quality or style of
interaction or characteristics and traits of the superintendent that may facilitate networking.
However, given that it has been used successfully in the past, it is chosen for this study.
H2. Time spent managing the organization’s external environment will be
positively correlated with performance.
Political support
Political support is an essential ingredient of effective leadership in the public
sector and an important source of bureaucratic power (Meier 2000; Rainey 1997).
According to Meier, public agencies develop political support in response to certain
conditions in the public sector environment. For instance, due to fragmentation in the
2 They also found that network management interacted with resources and constraints. Superintendents whonetworked at higher levels were more successful at exploiting resources (i.e., more networking increased theimpact of resources) and were more successful at mitigating constraints (i.e., more networking reduced theimpact of constraints).
14
American governmental system, neither Congress nor the president can provide agencies
with sufficient political support to impose their will on clientele, thus forcing agencies to
deal and bargain with their clientele. Administrative discretion exercised by agencies can
also be used as a lever to develop political support. Doig and Hargrove (1990) argue that
one of the keys to successful entrepreneurial leadership in government is to develop and
nourish external constituencies who support new programs and goals and to neutralize
opposition to the leader’s decisions and initiatives. Riccucci (1995) also discovered that
the success of federal executives often hinged on a favorable political environment,
including strong support from superiors and key political actors in the public arena.
Political support for a public agency can range from diffuse public opinion support
to more specific support from political elites (Meier 2000). Thus, two political support
variables are included in the model. P1 measures the level of support from the school
board, a direct source of political support. P2 measures the level of support from the
community, which is a more diffuse form of political support.
H3a: The level of political support from the school board will be positively
correlated with performance.
H3b: The level of political support from the community will be positively correlated
with performance.
Task difficulty
The difficulty of the task performed by an organization’s members can be a major
constraint on organizational performance. In the area of education, research indicates that
race and poverty can make the task of educating some students more difficult (Jencks and

15
Phillips 1998). The measure for T in the model, therefore, is a factor score derived from a
factor analysis of three indicators related to student race and poverty: the percentage of
students in a school who are black; the percentage of students in a school who are
Hispanic; and the percentage of students in a school who are low income. This measure is
also used to test for two interactions involving the next two variables in the framework.
H4: Task difficulty will be negatively correlated with performance.
Delegation and discretion
A significant amount of research on leadership behavior has focused on delegation.
Delegation entails assigning new responsibilities to subordinates and affording them the
authority and discretion to carry them out. Delegation of authority to subordinates can
offer various advantages to leaders. Yukl and Fu (1999) surveyed managers to identify
reasons why they delegate to subordinates. Among the most important reasons for
delegating authority were developing subordinate skills and confidence, enabling
subordinates to deal with problems more quickly, and improving decision-making by
affording employees closer to the action the discretion to make decisions. Thus, delegation
can be expected to enhance the effectiveness of subordinates who are directly involved in
solving organizational problems, particularly when the problems are complex and rapidly
changing. Studies examining the relationship between the extent of delegation and
performance have found a positive correlation between the two factors (Bauer and Green
1996; Schriesheim, Neider and Scandura 1998; Peters and Waterman 1982). However, the
direction of causality has not been well established by these studies.

16
Some implementation scholars, particularly those writing from a bottom-up
perspective, have also argued that giving greater discretion to subordinates contributes to
successful implementation of policies and programs. At the center of the top-down,
bottom-up debate in the implementation literature is the question of how much discretion
to give street-level bureaucrats. Top-down analysts such as Mazmanian and Sabatier
(1989) argue that discretion should lie in the hands of upper-level decision-makers who
craft the formal policy. They advocate the use of clear and consistent statutory language,
hierarchical integration among implementing actors and effective use of sanctions to affect
compliance by local implementers. Bottom-uppers, such as Hjern (1982), Berman (1982),
and Majone and Wildavsky (1979), see adaptation as the central problem of
implementation. For local implementers to effectively adapt a policy or program to its
environment and to overcome unforeseen problems, they must be afforded considerable
discretion. Majone and Wildavsky (1979) even argue that successful implementation often
requires a faithless interpretation of the original policy. That is, implementers at the
bottom must have the discretion to “straighten out logical defects and/or alter elements so
that the consequences were more desirable than those in the original plan” (p. 178).
Implementation analysts advocating a contingency approach to implementation suggest
that a bottom-up approach that gives discretion to local implementers is best when
problems are more complex and solutions ambiguous (Berman 1980; Matland 1995).
S represents a leadership style that gives greater discretion to subordinates. It is
measured using an indicator of the extent to which a superintendent gives principals
discretion.
17
H5: A managerial style that gives greater discretion to subordinates will have a
greater positive impact on performance when task difficulty is high than when task
difficulty is low.
Experience
Many studies of leadership have looked at a leader’s experience as a determinant of
his or her effectiveness. Riccucci (1995) argues that in a politically complex and volatile
setting, experience in government has a positive impact on a leader’s effectiveness.
Experience helps leaders develop technical expertise and allows them to cope with difficult
situations more aptly. Many of the successful leaders in her book, as well as many of those
in Doig and Hargrove’s analysis, possessed extensive experience in government.
Cognitive resources theory, developed by Fiedler (1986) and Fiedler and Garcia
(1987), is probably the best-known work on leadership that incorporates intelligence,
experience, and situational variables in a single theory. The theory examines the
relationship between a directive leader’s cognitive resources (intelligence and experience)
and group performance, with interpersonal stress acting as a moderating factor. It
postulates that intelligence will contribute more to effectiveness when interpersonal stress
is low than when it is high, and that experience will have a greater impact on effectiveness
when stress is high than when it is low.
Variable E in the model, representing a leader’s experience, is measured using an
indicator of total years of experience as a school superintendent.3 Insofar as task difficulty
can be a significant source of stress, the following hypothesis is proposed:
3 Unfortunately, the dataset does not contain a valid measure of a superintendent’s level of intelligence,which could be used to test cognitive resource theory in full.
18
H6: Experience will be positively correlated with performance when task difficulty
is high, but will not be related to performance when task difficulty is low.
Promoting change
A leader’s role in organizational change is another area in the study of leadership
that has garnered considerable attention from scholars. Leaders often play a variety of
seminal roles in the process of planned change, from articulating a vision of the need for
change to actions that facilitate the implementation of change (Rainey and Rainey 1986;
Greiner 1967; Kotter 1995; Armenakis and Bedeian 1999). Variable C, a leadership style
that actively promotes change, is measured using an indicator of the extent to which the
superintendent sees his or her role as that of a change agent.
According to the structural inertia model of organizational change, major changes
in organizations are generally difficult to implement and can be disruptive to organizations
(Hannan and Freeman 1977). Scholars also have documented numerous reasons for why
employees resist change and why it is often so difficult to implement change successfully.
Under what conditions, then, will a leadership style that actively promotes change have its
greatest positive impact on performance? The literature seems to offer two divergent
answers to this question. Intuitively, we could posit that promoting change when
organizational performance is low would have a greater positive effect on performance
than doing so when organizations are performing at higher levels, given how a major
change can disrupt the internal equilibrium among sub-systems in a well-running
organization. According to teleological models of change, change should be pursued when
an opportunity or threat presents itself, such as steeply declining performance or market

19
share. Such circumstances can make it easier to persuade organizational members to adopt
a change. Indeed, Thompson and Fulla’s (2001) study of organizational change at the
federal level strongly suggests that change is more likely to be adopted when a crisis is
present (see also DeVries and Balazs 1999). Hence, the first hypothesis:
H7a: A leadership style that actively promotes change in the organization will have a
greater impact on performance when an organization is performing at a lower level
than when an organization is performing at a higher level.
Other literature, however, indicates the need to continuously promote change within
organizations. Even high performing organizations need to constantly adapt to their
environment and may need to continuous improve their performance to survive. Weick
and Quinn (1999) argue that organizations contain pockets of continuous change, each
with its own pace and responding to the environment in different ways. These pockets of
continuous change can spawn innovations that can then be implemented throughout the
whole organization. This argument echoes Kanter’s (1983) earlier observation that macro-
level change in organizations often evolves from successful micro-level innovations or
“departures from tradition,” that is, from successful experimentations at the bottom of the
organization that offer the promise of success if implemented organization-wide. This
literature, therefore, suggests that leaders should continuously play an active role in
promoting change by various means such as creating a culture that encourages
experimentation and encouraging employee participation in the implementation of
changes. Thus, the following rival hypothesis is proposed:
20
H7b: A leadership style that actively promotes change in the organization will be
positively correlated with performance across all levels of performance.
Control variables
Five measures of resources available to school districts are included as control
variables in the study: average teacher salary; average class size; average years of teacher
experience; percentage of noncertified teachers; and percentage of funds from state
government.
Source of data
The data used to test the framework comes from a previously collected dataset of
Texas public schools developed for purposes other than this study. The unit of analysis is
the superintendent and his or her school district. Most of the data comes from the Texas
Education Agency, and the remainder was collected by Meier and O’Toole (2001) through
a survey of all school district superintendents that asked them about their management
styles, goals, and manner in which they allocate time. The data is pooled over a five-year
period (1995-1999) and dummy variables for the years are used in the analysis.
Analysis and Discussion
Additive model
In this first part of the analysis, OLS regression is used to test the additive version
of the model and the first five hypotheses, as well as the last hypothesis. The results are in
Table 1. Hypothesis 5, 6 and 7a involve interactions and will be tested separately in the
following section using a different regression technique.

21
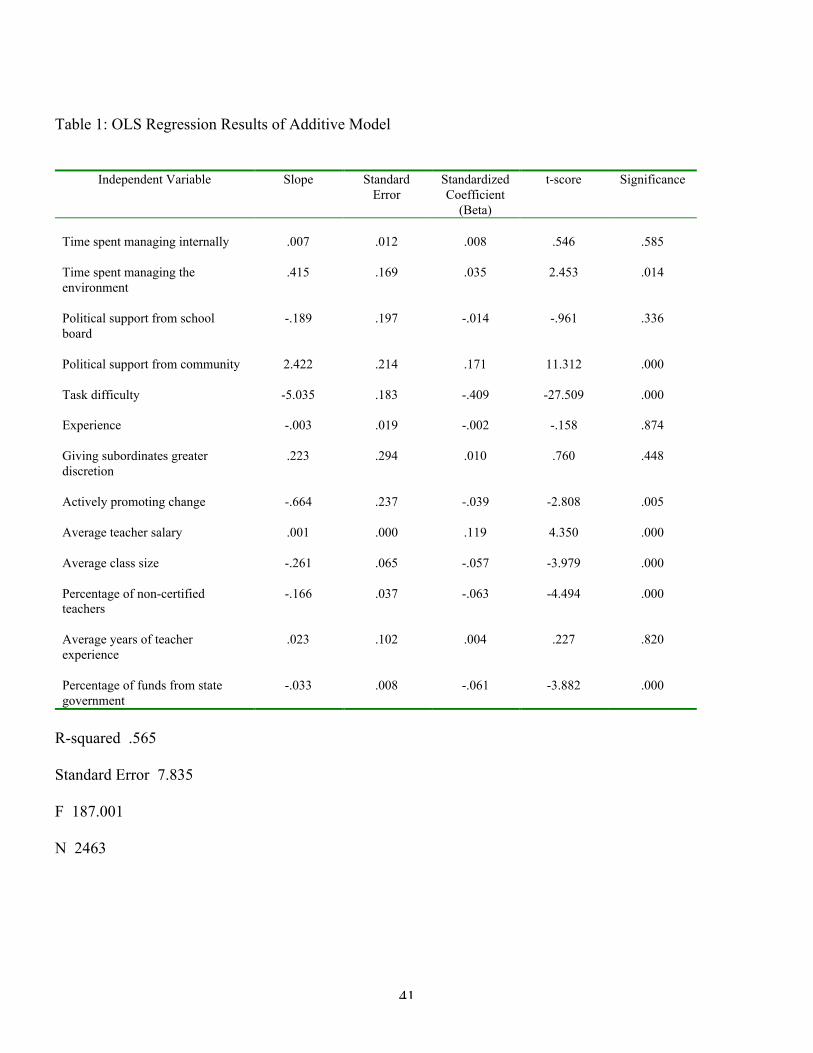
The R2 is .565, indicating that over half of the variance in the overall pass rate on
the TAAS exam is accounted for by the variables in the model. The standard error is
7.835. M1, time spent managing the organization’s internal activities, has a coefficient of
.007 with a low t-score of .546, thereby rejecting Hypothesis 1.4 M2, time spent managing
the external environment, has a coefficient of .415 that is statistically significant at the .02
level. This result supports Hypothesis 2. The actual impact of M2 may be as high as a 2.2-
point increase on the TAAS.5 Interestingly, political support from the school board, P1,
which is a specific and direct source of support, seems to have little impact on
performance. The variable has a coefficient of -.189 with a t-score of only -.961, a finding
that fails to support Hypothesis 3a. On the other hand, the coefficient for diffuse political
support from the community, P2, has a coefficient of 2.422 that is statistically significant at
the .00 level, thus supporting Hypothesis 3b. The actual impact of P2 may be as high as a
9.7-point increase on the TAAS. The factor score for task difficulty, T, is negatively
correlated with performance, with a coefficient of –5.035 that is statistically significant at
the .00 level, thus supporting Hypothesis 4. T’s actual impact may be as high as an 11.5-
point drop on the TAAS.
The coefficient for C is negative and statistically significant at the .01 level. This
indicates that a leadership style that actively promotes change has a negative impact on
performance overall across all cases, and therefore across all levels of performance, a
finding that rejects Hypothesis 7b. At first, this finding may seem somewhat surprising,
4 To test for multicollinearity, each independent variable was regressed on all the other independentvariables. The finding showed a very low degree of multicollinearity.5 The substantive significance of independent variables was estimated by multiplying their coefficients by thehighest and lowest value in their distributions and subtracting the two values.

22
given the abundance of literature pointing to the need for organizations to change
continually in order to survive in a dynamic and rapidly changing world. However, there
are two factors that might account for this result. As Hannan and Freeman (1977),
Amburgey, et al. (1999) and others have argued, change in organizations seems to disrupt
organizational processes and can hurt performance, particularly in the short run, until new
processes and technologies are learned and new routines developed. The negative
coefficient, therefore, is not entirely unexpected. Also, organizational changes must be
implemented effectively if the organization is to adapt to new contingencies and enhance
its performance. The independent variable used in the analysis, however, fails to account
for factors related to successful implementation of organizational changes.
Variables E, superintendent experience, and S, a leadership style that gives
subordinates greater discretion, have coefficients of -.003 and .223, respectively, and both
have very low t-scores. Four of the five control variables for resources available to school
districts are statistically significant at the .00 level with coefficients in the anticipated
direction, except for average teacher experience in years, which has a low t-score of .227.
Examining the standardized regression coefficients reveals which variables in the
model account for more of the variance in performance. As the results in Table 1 indicate,
P2, support from the community, and T, the task difficulty factor score, account for the
largest share of the variance in performance, followed by four of the five control variables.
Other leadership variables that account for a noticeable portion of the variance are M2, time
spent managing the external environment and C, a leadership style that actively promotes
change. Together, the seven leadership variables, minus the task difficulty variable,
23
account for about as much of the variance in performance explained by the model as the set
of five control variables. When task difficulty is treated as a leadership variable, the
leadership variables account for over two-thirds of the variance in performance explained
by the model. The model, therefore, is not driven by the control variables but by
theoretically relevant leadership variables. This finding strongly suggests that integrative
leadership frameworks are a promising approach for explaining a leader’s impact on public
sector performance, even a framework with a limited number of leadership variables like
this one. Datasets collected specifically for the purpose of studying a leader’s impact on
organizational performance and that capture additional variables from the leadership
literature should explain an even greater share of the variance in performance.
In sum, the first set of results from the unweighted additive model supports three of
the six hypotheses tested. Greater emphasis on managing the environment, M2, and a
higher level of political support from the community, P2, both seem to contribute to higher
performance, as suggested by the literature on public sector leadership, while greater task
difficulty hinders performance. Interestingly, M2 and P2 are correlated at less than .14.
This means that their combined impact on performance may be as high as an 11.9-point
increase in the overall pass rate on the TAAS exam. The low correlation between these
two variables may also indicate that superintendents network with external stakeholders for
various reasons other than merely to build political support (e.g., to exchange information
or to work together to tackle emerging problems). Support from the school board, P1, and
the extent to which a superintendent spends his time managing internally, M1, have little

24
impact on performance. Finally, a leadership style that actively promotes change has a
negative impact on performance.
SWAT analysis with an exogenous variable
Substantively Weighted Analytical Techniques (SWAT) is a new methodological
approach that uses weighted regression to analyze subgroups of cases in order to identify
differences between groups that are important for performance. As Meier and Gill (2000)
argue, to identify those factors governments can manipulate to produce better results,
analysts should examine not the typical case but the high performing ones to see how they
manage differently. SWAT typically involves running a series of least squares regressions
that give increasingly greater weight to high performing cases (e.g., those with Studentized
residuals greater than 0.7) relative to the average or low performing cases. This SWAT
technique will be used last to test Hypothesis 7a. SWAT with an exogenous variable,
another version of Substantively Weighted Analytical Techniques that is useful for testing
interactions between exogenous variables, is used next to test Hypotheses 5 and 6.
First, SWAT with an exogenous variable (task difficulty) is used to test for the
impact of the (E)(T) and (S)(T) interactive terms in the model. The aim is to examine how
the coefficients for experience, E, and a leadership style that gives greater discretion to
subordinates, S, behave at high and low levels of task difficulty. Three weighted
regressions were run giving greater weight to cases with the highest 30% task difficulty
scores, with the highest 20% task difficulty scores, and with highest 10% task difficulty
scores.6 The results of these three weighted regressions for high levels of task difficulty
6 For each weighted regression, the weighting was done by assigning cases that met the threshold (e.g., thecases with the highest 30% task difficulty factor scores) a weight of 1.0, with all other cases weighted at .05.

25
are in the last three columns of Table 2. Then, three additional regressions were run giving
greater weight to cases with the lowest 30% task difficulty scores, with the lowest 20%
task difficulty scores, and with the lowest 10% task difficulty scores. The results of this
second set of three weighted regressions for low levels of task difficulty are in the first
three columns of Table 2.
According to Hypothesis 5, a leadership style that gives greater discretion to
subordinates will have a greater positive impact on performance when task difficulty is
high than when task difficulty is low. At low levels of task difficulty, two of the three
coefficients for S are negative and statistically significant. In contrast, when task difficulty
is at its highest level in the SWAT analysis, the coefficient for S is 1.049 with a t-score of
3.366. This supports the argument that when organizations are faced with very difficult
tasks, leaders should give greater discretion, or delegate authority, to subordinates closer to
the problem who can act quickly to adapt a policy to extant conditions or make necessary
adjustments to means so that organizational objectives can be met. These findings provide
support for Hypothesis 5.
It was also hypothesized that a leader’s experience will be positively correlated
with performance when task difficulty is high, but will not be related to performance when
task difficulty is low. The results of the SWAT analysis provide very strong support for
this hypothesis and offer some support for Fiedler’s cognitive resources theory.7 The
coefficients for E, superintendent experience, are statistically insignificant in the SWAT
7 It should be noted, however, that this theory postulates that a leader’s experience will have a positiveimpact on performance when task difficulty is high and when the leader’s style is directive (rather thanparticipative). However, a directive leadership style is not accounted for in the model, nor is the intelligencecomponent of cognitive resources theory.
26
analysis for low levels of task difficulty. However, when the level of task difficulty is
high, superintendent experience has a positive impact on performance. Moreover, as the
level of task difficulty increases, so does the impact of experience on performance. When
the threshold for weighting is set at the highest 30% task difficulty scores, the coefficient
for E is .057. When the threshold is then raised to the highest 20% task difficulty scores,
the coefficient is .073, an increase of over 28%. When the threshold is raised again to the
highest 10% task difficulty scores, the coefficient is .143, a 96% increase.
Variables M1, M2, P1 and P2 exhibit interesting patterns at higher and lower levels
of task difficulty that are worth discussing, even though they were not hypothesized to
interact with task difficulty (see Table 2). Time spent managing the external environment,
M2, generally has positive and statistically significant coefficients across the various levels
of task difficulty, although it has a larger impact on performance at higher levels of task
difficulty than at lower levels. Time spent managing internally, M1, has a positive and
statistically significant coefficient at the highest level of task difficulty but little impact at
other levels (except at the 30% lowest task difficulty threshold, where the coefficient for
M1 is negative and statistically significant). These findings suggest that time spent
managing the external environment overall contributes more to performance than time
spent managing the organization’s internal activities, even when tasks are moderately
difficult. The only exception is at a very high level of task difficulty, where the challenge
posed by the task apparently places a premium on the amount of time spent managing the

27
organization’s internal activities.8 Interestingly, it is also at this highest level of task
difficulty that giving greater discretion to subordinates has its largest positive impact on
performance. How then might spending more time managing internally contribute to
performance when tasks are very difficult? Perhaps greater discretion or delegation to
subordinates under these circumstances allows leaders to dedicate more time to internal
activities aimed at improving human relations within the organization, such as motivating
employees or providing frequent feedback, or other internal activities such as strategic
planning and decision-making that do not entail closely directing and monitoring
subordinates.
The two coefficients for political support also exhibit interesting patterns in this
SWAT analysis. Although support from the school district, P1, has little impact on
performance across all cases in the unweighted model, at high and low levels of task
difficulty, the coefficients are negative and statistically significant, a very surprising
finding. One possible explanation is that greater support from the school board at higher
and lower levels of task difficulty may lead superintendents to promote programs that
divert funding from core educational functions, thereby having a negative impact on
performance. For instance, superintendents in districts that are more white and affluent
(i.e., those with lower task difficulty) may receive more support from the school board to
spend funds on extra-curricular programs rather than on teacher salaries and other
8 Only at the highest level of task difficulty does M1 explain more of the variance in performance than M2 (astandardized coefficient of .076 for M1 compared to .038 for M2). E and S also have larger standardizedcoefficients at the highest level of task difficulty than M2.
28
resources that can have a greater influence on standardized test scores.9 Support from the
community, P2, has positive and statistically significant coefficients at both high and low
levels of task difficulty. However, this second type of political support has a greater
impact on performance when tasks are simple than when they are more difficult.
The last hypothesis to test is Hypothesis 7a. It was previously found that C, a
leadership style that actively promotes change, is negatively correlated with performance
across all cases. However, to determine whether the relationship between this leadership
style and performance varies according to the level of performance, a different SWAT
analysis is. Four weighted regressions were run giving greater weight to cases within each
of the upper four deciles of scores on performance, and then four other weighted
regressions were run giving greater weight to cases within each of the lower four deciles of
scores on performance.10 The results for these various levels of performance are in Table
3.
While actively promoting change by and large seems to cause some disruption in
organizational processes that brings down the level of performance, the results in Table 3
reveal that this pattern does not hold among the worst performing organizations. The
coefficients for the two lowest deciles of performance scores are not statistically significant
at the .05 level, indicating that a leader who actively promotes change appears to have no
negative impact on performance when the organization is performing at very low levels.
9 Another possibility, given that the dependent variable is not lagged, is that causality is working in theopposite direction. That is, when tasks are either difficult or simple, lower scores on the standardized testinduce school board members to be more supportive of the superintendent.10 For each of these eight weighted regressions, the weighting was done by assigning cases that met thethreshold (e.g., cases with the highest 10% performance scores) a weight of 1.0, with all other cases weightedat .05.

29
What might explain this pattern? Perhaps any immediate disruption caused by changes
within the organization serves to break old patterns of ineffective behavior that were
causing the organization to perform so poorly. Also, at these low levels of performance,
the organization’s members may welcome a change agent at the top, be more receptive to
new ideas, and adopt and implement some changes more quickly. However, the results in
Table 3 show that as performance increases, the impact of this leadership style on
performance becomes negative and progressively larger. These findings therefore support
Hypothesis 7a rather than Hypothesis 7b.
Discussion and Implications for Future Research
Public sector leadership frameworks resembling integrative frameworks of
leadership have been around for over a decade, but until now, no effort has been made to
test them empirically using quantitative techniques and a large-N dataset. Are integrative
frameworks a promising avenue for bringing some order to the leadership literature and
explaining a leader’s impact on organizational performance? In spite of the limitations
imposed by a dataset collected for the purpose of assessing educational performance and
not for the study of leadership, the findings of this study indicate that indeed they are.
Nine hypotheses derived from the vast leadership literature were tested empirically,
with the results supporting six of them. The amount of time spent managing the
organization’s external environment (i.e., networking) has a consistently positive impact
on performance across all levels of task difficulty, with its impact increasing as tasks
become progressively more difficult. Networking with key external stakeholders therefore
is an important determinant of success. The amount of time spent managing the

30
organization’s internal activities, on the other hand, contributes little to performance except
when tasks are highly difficult. In short, time spent managing internally seems to
contribute less to performance than time spent managing the external environment, but
leaders should not neglect the former, especially when the task undertaken by the
organization becomes extremely demanding.
Political support from the public and the level of task complexity both have a
significant effect on organizational performance. Support from the public is positively
correlated with performance, while higher complexity serves to weaken performance. A
leader’s experience also has a positive impact on performance at higher levels of task
difficulty, and its contribution to performance increases as tasks become increasingly more
difficult. A leadership style that gives greater discretion to subordinates is negatively
correlated with performance when task difficulty is low, but has a positive impact on
performance when tasks become very difficult. Finally, the evidence suggests that overall,
a leadership style that actively promotes change can have a negative impact on
performance. However, among the poorest performing organizations, a leader who
actively promotes change has no negative impact on performance, despite any disruptions
to the organization that may be caused by changes.
Perhaps more important than any of the above findings is the explanatory power of
the model and the share of the explained variance accounted for by the variables drawn
from the leadership literature. The additive version of the model explains over half of the
variance in performance, with the leadership variables accounting for over two-thirds of
the explained variance if task difficulty is treated as a leadership variable. This is a

31
significant finding given that the dataset precludes the inclusion of many other
theoretically relevant leadership variables. The explanatory power of the leadership
variables in this model strongly suggests that the leadership literature is in no way a
theoretical wasteland but rather a reservoir of valuable knowledge that can be tapped by
researchers to explain a leader’s impact on organizational performance. Nevertheless, the
integrative framework tested in this analysis is underspecified in light of the vast
leadership literature, and there are many other variables that should be included in future
efforts to develop integrative frameworks of public sector leadership.
The framework developed and tested in this analysis includes only one leadership
trait (experience) and four leadership behaviors and managerial styles. An effort was made
to capture other leadership skills and traits of superintendents (e.g., a leader’s intelligence),
but the dataset simply did not contain any other valid measures of such concepts. More
robust integrative frameworks of public sector leadership should include additional traits
and skills, such as a leader’s locus of control, power orientation, need for achievement and
affiliation, and other cognitive and interpersonal skills. They should also account for other
types of leadership behaviors, such as reliance on different decision-making approaches,
goal-setting and other strategic activities, the use of different intrinsic and extrinsic
motivational tools, efforts to manage the organization’s culture, and steps taken to
encourage entrepreneurial and innovative behavior by subordinates. The inclusion of
different types of power exercised by the leader, their impact on performance under
varying conditions, and the impact of different combinations of power on organizational
32
performance would also serve to enhance future integrative frameworks of public sector
leadership.
Finally, the framework in this study included only one situational variable (task
complexity), although this variable had a considerable influence on the behavior of other
variables in the model, as the findings demonstrated. Many other leadership studies also
point to a contingency approach to leadership. This strongly suggests that sophisticated
integrative frameworks should be interactive rather than additive and should include
additional situational variables addressed in the literature, including the level of support
from subordinates, the degree of autonomy from external interference enjoyed by the
leader, the degree to which the task is structured, the position power of the leader, the level
of group cohesion, and the type of interdependence among work units.
This study focused strictly on public sector leadership in the educational arena,
only one of many one public management settings. Thus, another question that could be
raised about this study is how generalizeable are the findings to the public sector, overall?
Organizational or program performance in other service areas like human services may not
be as readily measurable as educational performance, and it may not be as easy to hire or
fire a leader based on his or her performance. Also, local public school districts are
relatively simple structures in the sense that only a small portion of implementation is
carried out by private or non-profit third parties; public programs and policies at the state
and federal level are often implemented through more elaborate hierarchical structures and
with extensive involvement by private and non-profit contractors. These characteristics,
however, are not unique to public education. For instance, at the federal level, there are
33
various organizations that operate more like businesses and that have measurable outputs,
some of which have been transformed into performance-based organizations, like the
Student Financial Assistance agency. At the local level, elected officials can also take into
consideration various indicators of a community’s health or of a local government’s
performance, such as the level of fiscal stress, and easily compare it to other communities
when choosing a professional manager. Also, although at the federal level a majority of
policies appear to be implemented through multi-actor implementation structures (Hall and
O’Toole 2000), many public policies continue to be implemented through single-actor
arrangements, particularly at the local and state levels. It can be reasonably argued,
therefore, that the findings of this study are generalizeable to some extent. Nevertheless,
future efforts to develop and test integrative frameworks of public sector leadership would
be more generalizeable if based on empirical evidence from a variety of public
management settings and from multiple managerial levels, rather than previous
frameworks that have focused on high level policy management in federal or local
government.
34
Works Cited
Amburgey, T. L., Kelly, D. and W. P. Barnett. 1999. “Resetting the Clock: The
Dynamics of Organizational Change and Failure.” Administrative Science Quarterly, 38:
51-73.
Armenakis, A. A. and A. G. Bedeian. 1999. “Organizational Change: A Review of
Theory and Research in the 1990s.” Journal of Management, 25: 293-315.
Bass, B. M. 1985. Leadership and Performance Beyond Expectations. New York:
Free Press.
Bauer, T. N. and S. G. Green. 1996. “The Development of Leader-Member
Exchange: A Longitudinal Test.” Academy of Management Journal, 39: 538-567.
Bennis. W. G. and B. Nanus. 1985. Leaders: The Strategies for Taking Charge.
New York: Harper and Row.
Berman, P. 1980. “Thinking About Programmed and Adaptive Implementation:
Matching Strategies to Situations.” In Ingram, H. and D. Mann. (Eds.). Why Policies
Succeed or Fail. Beverly Hills, CA: Sage.
Blake, R. R. and J. S. Mouton. 1964. The Managerial Grid. Houston: Gulf
Publishing.
Boyatzis, R. E. 1982. The Competent Manager. New York: John Wiley.
Bryman, A. 1993. “Charismatic Leadership in Business Organizations: Some
Neglected Issues.” Leadership Quarterly, 4: 289-304.
Burns, J. M. 1978. Leadership. New York: Harper and Row.
35
Dansereau, F., Jr., Graen, G. and W. J. Haga. 1975. “A Vertical Dyad Linkage
Approach to Leadership Within Formal Organizations: A Longitudinal Investigation of the
Role Making Process.” Organizational Behavior and Human Performance, 13: 46-78.
De Vries, K., Manfred, F. R. and K. Balazs. 1999. “Transforming the Mind-set of
the Organization.” Administration and Society, 30: 640-675.
Doig, W. and E. C. Hargrove. (Eds.). 1990. Leadership and Innovation:
Entrepreneurs in Government. Abridged Edition. Baltimore: Johns Hopkins University
Press.
Ekvall, G. and J. Arvonen. 1991. “Change-centered Leadership: An Extension of
the Two-dimensional Model.” Scandinavian Journal of Management, 7: 15-26.
Fiedler, F. E. 1967. A Theory of Leadership Effectiveness. New York: McGraw-
Hill.
Fiedler, F. E. 1986. “The Contribution of Cognitive Resources to Leadership
Performance.” Journal of Applied Social Psychology, 16: 532-48.
Fiedler, F. E. and J. E. Garcia. 1987. New Approaches to Leadership: Cognitive
Resources and Organizational Performance. New York: John Wiley.
Gerstner, C. R. and D. V. Day. 1994. “Cross-cultural Comparisons of Leadership
Prototypes.” Leadership Quarterly, 2: 121-134.
Greiner, L. E. 1967. “Patterns of Organizational Change.” Harvard Business
Review, 45: 119-28.

36
Hall, T. E. and L. O’Toole. 2000. “Structures for Policy Implementation: An
Analysis of National Legislation, 1965-1966 and 1993-1994.” Administration and Society,
31: 667-686.
Hannan, M. T. and J. Freeman. 1975. “The Population Ecology of Organizations.”
American Journal of Sociology, 8: 929-964.
Hjern, B. 1982. “Implementation Research - The Link Gone Missing.” Journal of
Public Policy, 2: 301-08.
House, R. J. 1971. “A Path-goal Theory of Leadership Effectiveness.”
Administrative Science Quarterly, 16: 321-39.
Jencks, C. and M. Phillips. (Eds.). 1998. The Black-White Test Score Gap.
Washington, D.C.: Brookings.
Kanter, R. M. 1983. The Change Masters. New York: Simon and Schuster, Inc.
Kerr, S. and J. M. Jermier. 1978. ‘Substitutes for Leadership: Their Meaning and
Measurement.” Organizational Behavior and Human Performance, 22: 375-403.
King, G., Keohane, R. O., and S. Verba. 1994. Designing Social Inquiry:
Scientific Inference in Qualitative Research. Princeton, NJ: Princeton University Press.
Klenke, K. 1993. “Meta-analytic Studies of Leadership: Added Insights or Added
Paradoxes?” Current Psychology, 12: 326-343.
Kotter, J. P. 1995. ‘Leading Change: Why Transformation Efforts Fail.” Harvard
Business Review, Mar.-April: 59-67.
Lindell, M. and G. Rosenqvist. 1992. “Management Behavior Dimensions and
Development Orientation.” Leadership Quarterly, Winter: 355-77.

37
Majone, G. and A. Wildavsky. 1979. “Implementation as Evolution.” In
Pressman, J. L. and A. Wildavsky. Implementation. Second Edition. Berkeley:
University of California Press.
Matland, R. E. 1995. “Synthesizing the Implementation Literature: The
Ambiguity-Conflict Model of Policy Implementation.” Journal of Public Administration
Research and Theory, 5: 145-74.
Mazmanian, D. A. and P. A. Sabatier. 1989. Implementation and Public Policy:
With a New Postscript. Latham, MD: University Press of America.
McClelland, D. C. 1965. “N-achievement and Entrepreneurship: A Longitudinal
Study.” Journal of Personality and Social Psychology, 1: 389-92.
McClelland, D. C. 1985. Human Motivation. Glenview, IL: Scott Foresman.
Meier, K. J. 2000. Politics and the Bureaucracy: Policymaking in the Fourth
Branch of Government. Fourth Edition. Forth Worth: Harcourt College Publishers.
Meier, K. J. and J. Gill. 2000. What Works: A New Approach to Program and
Policy Analysis. Boulder: Westview Press.
Meier, K. J. and L. J. O’Toole. 2002. "Public Management and Organizational
Performance: The Effect of Managerial Quality.” Journal of Policy Analysis and
Management, 21: 629-643.
Meier, K. J. and L. J. O’Toole. 2003 forthcoming. "Public Management and
Educational Performance: The Impact of Managerial Networking.” Public Administration
Review.
38
O’Toole, L. J. and K. J. Meier. 1999. “Modeling the Impact of Public
Management: Implications of Structural Context.” Journal of Public Administration
Research and Theory, 9: 505-26.
Perry, J. L and K. L. Kraemer. 1983. Public Management: Public and Private
Perspectives. Palo Alto, CA: Mayfield Publishing Company.
Peters, T. J. and R. H. Waterman, Jr. 1982. In Search of Excellence: Lessons from
America’s Best Run Companies. New York: Harper and Row.
Rainey, H. G. 1997. Understanding and Managing Public Organizations. Second
Edition. San Francisco: Jossey-Bass.
Rainey, H. G. and B. Bozeman. 2000. “Comparing Public and Private
Organizations: Empirical Research and the Power of the a Priori.” Journal of Public
Administration Research and Theory, 10: 447-469.
Rainey, G. W. and H. G. Rainey. 1986. “Breaching the Hierarchical Imperative:
The Modularization of the Social Security Claims Process.” In D. J. Calista. (Ed.).
Bureaucratic and Governmental Reform. Greenwich, CT: JAI Press.
Riccucci, N. M. 1995. Unsung Heroes: Federal Execucrats Making a Difference.
Washington, DC: Georgetown University Press.
Schriesheim, C. A., Castro, S. and C. C. Cogliser. 1999. “Leader-member
Exchange Research: A Comprehensive Review of Theory, Measurement, and Data-
analytic Techniques.” Leadership Quarterly, 10: 63-113.

39
Schriesheim, C. A., Neider, L. L. and T. A. Scandura. 1998. “Delegation and
Leader-member Exchange: Main Effects, Moderators, and Measurement Issues.” Academy
of Management Journal, 41: 298-318.
Stogdill, R. M. 1948. “Personal Factors Associated with Leadership.” Journal of
Psychology, 25: 35-71.
Svara, J. H. 1994. Facilitative Leadership in Local Government: Lessons from
Successful Mayors and Chairpersons. San Francisco: Jossey-Bass.
Thompson, J. R. and S. L. Fulla. 2001. “Effecting Change in a Reform Context:
The National Performance Review and the Contingencies of ‘Microlevel’ Reform
Implementation.” Public Performance and Management Review, 25: 155-175.
Van Wart, M. 2003. “Public-Sector Leadership Theory: An Assessment.” Public
Administration Review, 63: 214-228.
Weick, K. E. and R. E. Quinn. 1999. “Organizational Change and Development.”
Annual Review of Psychology, 50: 361-86.
Wilson, J. Q. 2000. Bureaucracy: What Government Agencies Do and Why They
Do It. New York: Basic Books.
Yukl, G. 1989. Leadership in Organizations. Second Edition. Englewood Cliffs,
NJ: Prentice Hall.
Yukl, G. 1999. “An Evaluation of Conceptual Weaknesses in Transformational
and Charismatic Leadership Theories.” Leadership Quarterly, 10: 285-305.
Yukl, G. 2002. Leadership in Organizations. Fifth Edition. Upper Saddle River,
NJ: Prentice Hall.

40
Yukl, G. and P. Fu. 1999. “Determinants of Delegation and Consultation by
Managers.” Journal of Organizational Behavior, 20: 219-32.
Yukl, G., A. Gordon and T. Taber. 2002. “A Hierarchical Taxonomy of
Leadership Behavior: Integrating a Half Century of Behavior Research.” Journal of
Leadership and Organizational Studies, 9: 15-32.
41
Table 1: OLS Regression Results of Additive Model
Independent Variable Slope StandardError
StandardizedCoefficient
(Beta)
t-score Significance
Time spent managing internally .007 .012 .008 .546 .585
Time spent managing theenvironment
.415 .169 .035 2.453 .014
Political support from schoolboard
-.189 .197 -.014 -.961 .336
Political support from community 2.422 .214 .171 11.312 .000
Task difficulty -5.035 .183 -.409 -27.509 .000
Experience -.003 .019 -.002 -.158 .874
Giving subordinates greaterdiscretion
.223 .294 .010 .760 .448
Actively promoting change -.664 .237 -.039 -2.808 .005
Average teacher salary .001 .000 .119 4.350 .000
Average class size -.261 .065 -.057 -3.979 .000
Percentage of non-certifiedteachers
-.166 .037 -.063 -4.494 .000
Average years of teacherexperience
.023 .102 .004 .227 .820
Percentage of funds from stategovernment
-.033 .008 -.061 -3.882 .000
R-squared .565
Standard Error 7.835
F 187.001
N 2463

42
Table 2: Regression Coefficients by Level of Task Difficulty (Using SWAT Regression)
Lowest10% TaskDifficulty
Lowest20% TaskDifficulty
Lowest30% TaskDifficulty
Un-weighted
Highest30% TaskDifficulty
Highest20% TaskDifficulty
Highest10% TaskDifficulty
Time spent managinginternally
-.008(-.777)
-.018(-1.636)
-.025(-2.396)
.007(.546)
.007(.595)
.020(1.775)
.071(5.502)
Time spent managing theenvironment
.230(1.407)
.334(2.154)
.416(2.800)
.415(2.453)
.633(3.320)
.520(2.645)
.568(2.722)
Political support fromschool board
-1.860(-10.208)
-1.086(-6.093)
-.723(-3.926)
-.189(-.961)
-.411(-2.094)
-.483(-2.367)
-1.168(-4.934)
Political support fromcommunity
3.603(17.858)
3.429(17.520)
2.739(14.729)
2.422(11.312)
2.600(11.949)
2.605(11.727)
1.495(5.991)
Task difficulty -5.141(-28.064)
-5.237(-22.846)
-5.287(-19.295)
-5.035(-27.509)
-3.890(-17.866)
-4.151(-20.341)
-4.375(-25.151)
Experience -.002(-.097)
-.018(-1.093)
-.016(-.923)
-.003(-.158)
.057(3.028)
.073(3.842)
.143(7.544)
Giving subordinates greaterdiscretion
-.680(-2.555)
-.607(-2.322)
-.235(-.859)
.223(.760)
.440(1.425)
-.292(-.923)
1.049(3.366)
Actively promoting change -.145(-.637)
-.269(-1.208)
-.332(-1.506)
-.664(-2.808)
-.974(-3.834)
-.918(-3.615)
-2.173(-8.162)
t-scores are in parentheses
Note: Each column represents a separate weighted regression at a certain level of task difficulty. Tosee how a variable’s impact on organizational performance changes across different levels of taskdifficulty, examine the changes in a variable’s coefficients across columns.

43
Table 3: Regression Coefficients for Actively Promoting Change (C) by Level of Performance
(Using SWAT Regression)
10% Lowest Performing Cases -.170(-.636)
20% Lowest Performing Cases -.297(-1.643)
30% Lowest Performing Cases -.497(-2.813)
40% Lowest Performing Cases -.395(-2.346)
t-scores in parentheses
Note: Each row represents the regression coefficient for a leadership style that actively promoteschange (C) at a certain level of performance. To see how this variable’s impact on organizationalperformance changes across different levels of performance, examine the changes in the coefficientsfrom one row to the next.
40% Highest Performing Cases -.881(-5.211)
30% Highest Performing Cases -.922(-5.138)
20% Highest Performing Cases -.953(-4.716)
10% Highest Performing Cases -1.048(-3.970)