nonalcoholic fatty liver diseases Alcoholic liver diseases Acute liver failure

UvA-DARE is a service provided by the library of the University of Amsterdam (http://dare.uva.nl)
UvA-DARE (Digital Academic Repository)
Acute liver failure and acute kidney injury: Definitions, prognosis, and outcome
Wodzimirow, K.A.
Link to publication
Citation for published version (APA):Wodzimirow, K. A. (2013). Acute liver failure and acute kidney injury: Definitions, prognosis, and outcome
General rightsIt is not permitted to download or to forward/distribute the text or part of it without the consent of the author(s) and/or copyright holder(s),other than for strictly personal, individual use, unless the work is under an open content license (like Creative Commons).
Disclaimer/Complaints regulationsIf you believe that digital publication of certain material infringes any of your rights or (privacy) interests, please let the Library know, statingyour reasons. In case of a legitimate complaint, the Library will make the material inaccessible and/or remove it from the website. Please Askthe Library: http://uba.uva.nl/en/contact, or a letter to: Library of the University of Amsterdam, Secretariat, Singel 425, 1012 WP Amsterdam,The Netherlands. You will be contacted as soon as possible.
Download date: 28 Jul 2018

- 127 -
Chapter 7
Exhaled breath analysis with electronic nose
technology for detection of acute liver failure in
rats
K.A. Wlodzimirow, A. Abu-Hanna, M.J. Schultz, M.A.W. Maas, L.D.J. Bos, P.J. Sterk, H.H. Knobel, R.J.T. Soers, Robert A.F.M. Chamuleau
Submitted for publication
- 128 -
Abstract
Background & Aim: Exhaled breath analysis using electronic nose (e-Nose) technology is
potentially useful in clinical diagnostics and monitoring because of the real time and non-
invasive measurement. The aim of this study was to assess the classification accuracy of an
e-Nose in detecting acute liver failure (ALF) in rats.
Methods: Exhaled breath from 14 rats was repeatedly sampled by e-Nose (8 sensors) and
an additional external CO2 sensor at three stages: healthy period; portacaval shunt; and
during the development of ALF due to surgically induced complete liver ischemia. We
performed principal component analysis (PCA) on the (grouped) sensor data in each stage
and the classification accuracy of the first two principal components was assessed by the
leave-one-out approach. In addition we performed gas chromatography - mass spectrometry
(GC-MS) analysis of the exhaled breath from 3 rats.
Results: The first and second principal components from the PCA analysis of e-Nose data
accounted for more than 95% variance in the data. Measurements in the ALF stage were
contrasted with the measurements in the control stage. Leave-one-out validation showed
classification accuracy of 96%. This accuracy was reached after 3 hours of ALF
development, and was reached already after 2 hours when data of an external CO2 sensor
were also included. GC-MS identified 2-butanol, 2-butanone, 2-pentanone and 1-propanol as
most elevated in the ALF stage.
Conclusion: This is the first study to demonstrate that ALF in rats can be detected by e-
Nose data analysis of the exhaled breath. Confirmation of these results in humans will be an
important step forward in the non-invasive diagnosis of ALF.

- 129 -
Introduction
Acute liver failure (ALF) is a syndrome with a high mortality estimated 60 to 80% 1. In most
cases the only life saving treatment for ALF is liver transplantation (LT). An early and exact
diagnosis of ALF together with a prediction of its further development is crucial in order to
determine the further management and prevent a delay of listing the patients for LT.
A number of prognostic criteria have been proposed for ALF. However, they do not
have sufficient predictive performance capacities 2 and the search for alternative methods
continues. Current prognostic criteria are mostly based on blood biochemical analysis. Ideally
a predictive method should be non-invasive, available at the bed-site, cheap, and providing
real-time results.
In recent years, exhaled breath analysis has been increasingly studied as an
alternative to the invasive method of blood testing. In clinical practice they have been
performed mainly by gas chromatography and mass spectrometry (GC/MS) 3, 4. These
methods, however, do not find widespread application due to their expensiveness, time
consuming measurement and requirement of high expertise for the interpretation of the
results 5.
To overcome this, the electronic nose (e-Nose) – a device to mimic the discrimination
of the mammalian olfactory system for smells – was introduced in 1982 6. E-Nose technology
has become commercially available and is potentially useful in clinical medicine because of
the non-invasive testing, real-time, rapid results and portability. The underlying technology
varies among the e-Noses 7 but the general principle is based on pattern recognition of
complex mixtures, which is comparable to smelling by the human nose.
Human breath is largely composed of nitrogen, oxygen, carbon dioxide, water vapour
and additionally carbon monoxide, nitric oxide and nobel gases (ppm’s) and of very little
amounts of numerous volatile organic compounds (VOCs (ppb’s)) 8. Generally an e-Nose is
built of an array of chemical sensors that react to the different fractions of the VOCs. When
these sensor responses are combined, so-called ‘‘breath print’’ specific for a disease can be
sought and be useful for diagnostic and monitoring purposes. When using GC-MS in parallel,
identification of individual VOCs may allow exploration of the underlying pathophysiological
pathways.
VOCs can give different odour to the breath. Specific VOCs have been characterised
for gastrointestinal and liver diseases 3, 4, 9-12. Recently, e-Nose has gradually been used in
medicine for the diagnosis of diabetes 13-15, renal disease 15-17, urinary track infections 18,
asthma and chronic obstructive pulmonary disease 19-22, pneumonia 23, 24, Alzheimer and
Parkinson disease 25, lung cancer 21, 26-28 breast, colorectal, prostate cancers 29 and others 5, 7.

- 130 -
Our hypothesis is that e-Nose is able to detect ALF in early stage. We assume that
ALF features a distinguishable “breath print” derived from principal components of e-Nose
sensor data. The objective of this study is to assess the classification accuracy of using such
principal components for distinguishing ALF measurements from other measurements. As
proof of concept an established animal model of ALF in rats was studied in which each rat
was its own control. Finally, GC-MS of exhaled air was used to explore which VOCs might
contribute to the ALF breath prints.
Methods
Experiment
All procedures were conducted in accordance with the institutional guidelines of the Animal
Ethical Committee of the AMC (protocol number BEX 102522) for supervision of animal
experiments and all efforts were made to minimize suffering. The experiment was performed
in a rat-model developed for the purpose of this study (Figure 1). A picture of our
experimental set-up is presented in Supplement Figure 1. In our model the rats served as
their own control. 14 male Wistar rats (Charles Rivers), weighing 250-280 g were used. They
were kept in a temperature-controlled room and fed standard rat chow and water ad libitum.
Figure 1. A schematic presentation of the experimental set-up

- 131 -
Induction of ALF
To resemble the clinical ALF characterized by complete loss of liver function and massive
liver cell necrosis, complete liver ischemia (LIS) was obtained in a 2-steps procedure
(adapted from 30). In the first step at day 3 pre-LIS an end-to-side portacaval shunt was
performed between the portal vein and the inferior caval vein (PCS). For this purpose, rats
were anesthetized with isoflurane 2-3% and O2/air 1:1 and buprenorfine (Temgesic)
0.03mg/kg and placed on a temperature-regulated table (37 °C) to maintain the body
temperature. Rats were allowed to recover for 3 days to exclude bleeding from the shunt
anastomosis. In the second step complete ischemia of the liver was performed by ligation of
the hepatic artery and common bile duct. For this purpose, rats were anesthetized with
isoflurane 2-3% and O2/air 1:1 and placed on a temperature-regulated table (37 °C). Both
procedures were conducted through a midabdominal incision. During the LIS period, if
necessary, 5% glucose mixture was applied intraperitoneally in a dosage depending on the
blood glucose level. Following the surgical procedures, rats were allowed to recover in their
cages. During the LIS period severity of hepatic encephalopathy (HE) was assessed for each
rat (Table 1) 31.
Table 1. Clinical grading score of hepatic encephalopathy. Score Description
0 Normal behaviour 1 Mild lethargy 2 Poor posture control; decreased motor activity 3 No spontaneous righting reflex; severe ataxia; diminished response to pain 4 No righting reflex on pain stimulus 5 Deep coma; no reaction on pain stimulus 6 Death
Blood collection
Blood samples were collected from the rat tail vein during the LIS period every two hours for
glucose maintenance and at three time points (at the start, after 2 hours and at the end) for
ammonia measurement. Rats at stage 5 of HE were sacrificed under isoflurane by heart
puncture and blood was collected for aspartate aminotransferase (ASAT) and alanine
aminotransferase (ALAT).
Breath collection
An electronic nose (e-Nose) (Comon Invent, The Netherlands), a handheld portable
continuous chemical vapour analyzer of semiconductor gas sensors was used. Breath
samples were collected for 15 minutes. The raw data are stored as the changes in electrical
resistance of each of the 8 sensors in the on-board database, copied into an offline database
and used for further analysis.

- 132 -
Along with e-Nose measurement, the CO2 sensor (Agilent M1460A, Germany) was used for
continuous CO2 monitoring. To perform CO2 measurement the CO2 sensor was placed on
the “breath path” between a rat and the e-Nose (Figure 1).
In addition, exhaled air was captured from 3 rats to examine whether it included
specific breath compounds that might potentially be useful for diagnosis and prediction of
ALF. First, breath was captured from 3 healthy rats. Second, breath was captured from the
same 2 rats (one rat died during PCS procedure) once in the PCS period (‘PCS’). Third,
breath from the same 2 rats was captured two times in the LIS period, once at 2nd grade of
HE and once at 4th grade of HE. GC-MS samples were obtained directly after the sample
collection by the e-Nose while the rat remained in the tube for another 10 minutes. The
exhaled breath was led through absorption tubes filled with Tenax GR® (Supelco,
Zwijndrecht, The Netherlands) placed in the “breath path” so the breath could pass through
the sorbent to capture VOCs (Figure 1). Additionally, in a separate situation, air flowing
through the empty system (without a rat) was sampled to analyze the VOC's coming out of
tubing and connectors (‘blank’ measurement). Sorbent tubes for GC-MS analysis were sent
to Philips (Eindhoven), and upon arrival they were stored at 6-8°C.
Design
Rats were divided into following subgroups:
1. In the first days (3-5 days) the exhaled breath of healthy rats was measured twice a day.
These measurements constitute the “healthy group” (of measurements).
2. In the next 3 days, after the PCS procedure, the exhaled breath of PCS rats was measured
twice a day. Those measurements constitute the “PCS group”.
3. In the next day the exhaled breath of rats, after the LIS procedure, was measured every
hour till the rat was sacrificed. These measurements constitute the “LIS group”.
To capture a potential confounding effect of PCS and LIS operations, two sham operations
were performed in 3 rats, one instead of PCS operation and one instead of LIS operation.
Measurements in these rats constitute the “sham1” and “sham2 groups”, respectively.
“Sham1” rats were subjected to anaesthesia once and “sham2” rats two times.
Measurements from the “healthy”, “PCS” and “sham groups” formed one combined group
called hereafter “control”.
Although the rats were their own controls we subcategorised them into above mentioned
subgroups to assure clarity in the study.

- 133 -
Blood analysis
Blood samples were directly used for determination of glucose (Ascensia ELITE, Bayer
Corporation, USA) and ammonia (Ammonia Checker II AA-4120, Kyoto Daiichi Kagaku Co
Ltd, Japan) levels. Plasma ASAT and ALAT were analysed spectrophotometrically according
to standard clinical chemistry.
Analysis of e-Nose data
We performed PCA analyses on the data of the 8 sensors of e-Nose with and without the
data obtained from the 9th external CO2 sensor. PCA reduces the dimensionality (number of
sensors in our case) of the data by identifying principal components. The first principal
component is the linear combination of the sensor values representing the maximum
variance of the data. The second principal component is orthogonal to the first and captures
the maximum variance remaining after removing the first component, etc. One usually
selects a small number of the principal components obtained in this manner for further
analysis. For each rat and for each sequence of measurements the differences in the
sensors’ responses were calculated according to the equation:
∆ij (delta) = max(Xij) – min(Xij), where Xij is ith response of jth sensor.
A delta value is hence the difference between the maximum and minimum resistance values
for each sensor. These deltas were taken for further analysis. The median values of deltas in
each group (for control and for LIS) were calculated for each rat and formed the starting point
for PCA analysis, for example if a rat had 4 measurements in the healthy and PCS periods
then the median of these deltas was obtained. To compare the differences between
measurement stages the paired t-test was used.
PCA analyses were additionally performed for short duration of ALF, i.e. till 1, 2, 3 and 4
hours of LIS period duration.
For classifying a given (new) set of sensor measurements (in effect their deltas), i.e.
predicting the group to which the given new set of sensor measurements belongs, we used
the methods defined in Table 2.
Table 2. Classification methods Method Description PC1 threshold
The new point is classified based on whether its PC1 value is above or below a given threshold on PC1. The threshold is chosen to minimize classification error in the “training” measurements (without any information about the new point).
Average distance
The new point is classified as belonging to the closest group in the sense that the average Euclidian distance (in the PC1-PC2 space) to each point of the group is less than to the other group.
3 neighbours The new point is classified as belonging to the majority group of its 3 nearest neighbours (3 closest points based on the Euclidian distance).
5 neighbours The new point is classified as belonging to the majority group of its 5 nearest neighbours (5 closest points based on the Euclidian distance).
- 134 -
The idea is that the PC1 and PC2 values of the set of measurements are first calculated and
then a decision is made on the group (control or LIS) to which this set belongs. We selected
four ways to make this decision (each based on a different criterion), as described in Table 2.
The analysis was performed in the statistical environment R version 2.15.1 32.
Validation
In order to have an unbiased estimate of classification performance we used the leave-one-
out validation design. It allows classifying the rat’s group for a specific measurement based of
all the other measurements. This means that in each step one rat was excluded from the
analysis, and classified by the PCA function.
We assessed the accuracy of this classification by methods described in Table 2. In each
method points were scored as follows: for each correct prediction of a rat being both in LIS
and control group 1 point was given; for correct prediction of a rat being in only one of the
groups (e.g. control or LIS) but wrongly predicted when a rat was in the other group 0.5 point
was given; for wrong prediction of a rat in both groups (control and LIS) 0 points were given.
For rats which were only in control and never in LIS group points were scored as follows: 1
point for correct prediction and 0 points for wrong prediction. For correct prediction of all rats
in both groups 14 points could be maximally scored.
Statistical significance was calculated with two-tailed binomial test.
Statistical measures of the performance were expressed in terms of sensitivity, specificity,
positive predictive value (PPV), negative predictive value (NPV) and classification accuracy.
Breath analysis by GC-MS
To investigate specific breath compounds of ALF we also performed GC-MS analysis of
exhaled air from 3 rats, as described 19. Sorbent tubes were thermically desorbed at 250°C
(TDSA, Gerstel, Mülheim an der Ruhr, Germany). Solvent venting mode was used to transfer
the sample without loss to the packed liner (filled with Tenax TA), held at 0 °C which was
subsequently heated to 300°C in splitless mode. A cold trap (CTS2, Gerstel, Mülheim an der
Ruhr, Germany) was used to minimize band broadening (initial temp –150°C, after 2 min
heated to 250°C). A gas chromatograph (6890N GC, Agilent, Santa Clara, CA, USA)
equipped with a VF1-MS column (30m*0.25mm, film thickness 1 μm, 100% dimethyl
polysiloxane, Varian Chrompack, Middelburg, The Netherlands) was used with the following
temperature program: 40 °C isothermal during 5 minutes, raised with 10 °C/minute until 310
°C, held isothermal for 5 minutes. Helium was used as a carrier gas with a column flow of
1ml/minute. A quadrupole mass spectrometer (5975 MSD, Agilent, Santa Clara, CA, USA)
was used in electron ionization mode at 70eV, with a scan range of m/z 29-450 Da. Gaseous

- 135 -
calibration standards (10 ppmv acetone-D8, hexane-D16, toluene-D8 and xylene-D14 in
nitrogen, Air Products, Amsterdam, The Netherlands) were made by use of a home built
dilution system and loaded on adsorption tubes to check the sensitivity of the system. Agilent
Chemstation (Agilent, Santa Clara, CA) was used for collection and integration of the data.
Peak identification was done using a NIST mass spectral database (NIST version 2.0,
National Institute for Standards and Technology, USA).
Because of the small sample size of the data taken to GC-MS analysis (3 healthy and 2
PCS/LIS rats) statistical significance calculation was not attempted.
Results
Mean survival time of ALF rats was 8 hours and median 7.5 hours (range 5-10 hours). Grade
of HE assessed during LIS period is presented in Supplement Figure 2.
Biochemical analysis
Blood glucose levels were maintained between 5 and 10 mM in all rats by intraperitoneal
injection of 3-5mL of 5% glucose. Progress of ALF was observed by rising trend of ammonia
level. Means ± sd values of ammonia at the start of LIS, after two hours and at the end were
65±20, 599±290 and 1191±546µM, respectively. High levels of ASAT and ALAT measured in
blood samples taken at the end of life confirmed presence of ALF. Means ± sd values were
20331±7948 and 15421±5714 U/L, respectively.
Analysis of e-Nose data
Figure 2 shows the median (with interquartile range) changes in electrical resistance on each
of the 8 e-Nose sensors and external CO2 sensor.
PCA analysis of the data from 8 sensors of the e-Nose for “healthy” versus “PCS” rats
showed some overlap of these two groups (Supplement Figure 3; left plot), and for “healthy”
versus “LIS” showed clear separation (Supplement Figure 3; right plot). The statistical
comparison of the sensor responses in “healthy”, ”PCS”, ”sham1” and “sham2” groups
revealed no significant differences. For this reason we combined those 4 initial groups into
one “control” group and conducted further analysis comparing control and LIS groups.

- 136 -
Figure 2. Electrical resistance on the sensors for each rats’ group
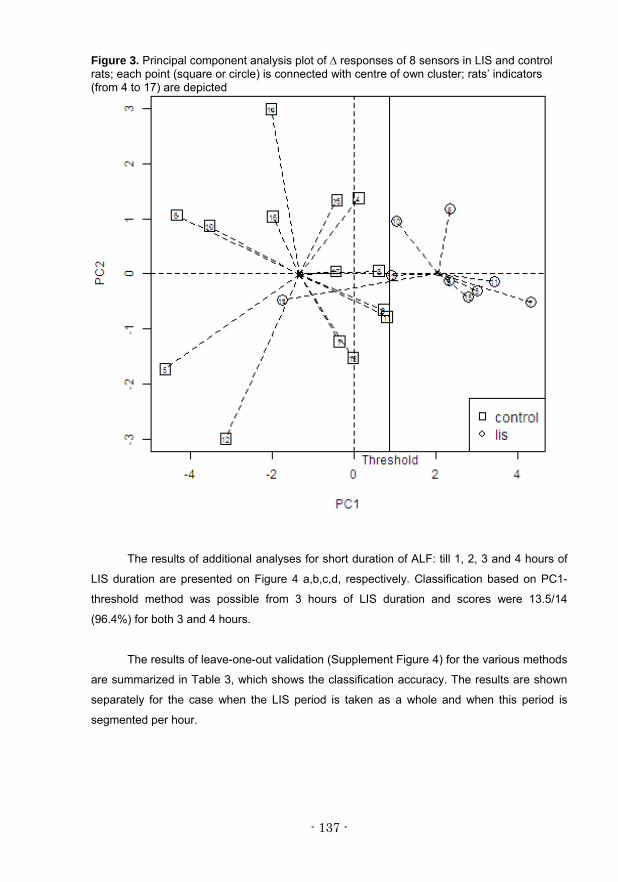
PCA analysis of the data from 8 sensors of the e-Nose showed that the first three PCs
explained 73.7, 21.5 and 4.2% of the data, respectively. Figure 3 shows the 14 control
measurements (squares) and 9 LIS measurements (circles) of the 14 rats in the PC1-PC2
plain. Indicator of rats’ identities (from 4 to 17) is depicted above each point. Also shown is
the threshold on PC1 (for the first classification method in Table 2) that minimizes
classification error. Notably, the discrimination could be easily achieved by PC1 threshold.
There is only one measurement, the LIS measurement of rat “14”, which is incorrectly
classified (its other control measurement is correctly classified) and hence the threshold-
based classification method scores 13.5/14 (96.4%) on the whole dataset.
- 137 -
Figure 3. Principal component analysis plot of ∆ responses of 8 sensors in LIS and control rats; each point (square or circle) is connected with centre of own cluster; rats’ indicators (from 4 to 17) are depicted
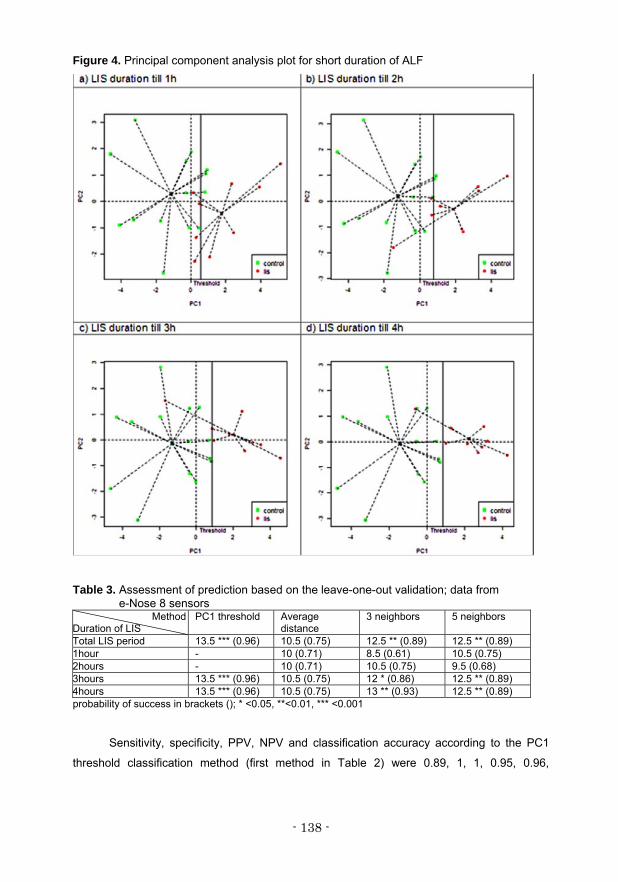
The results of additional analyses for short duration of ALF: till 1, 2, 3 and 4 hours of
LIS duration are presented on Figure 4 a,b,c,d, respectively. Classification based on PC1-
threshold method was possible from 3 hours of LIS duration and scores were 13.5/14
(96.4%) for both 3 and 4 hours.
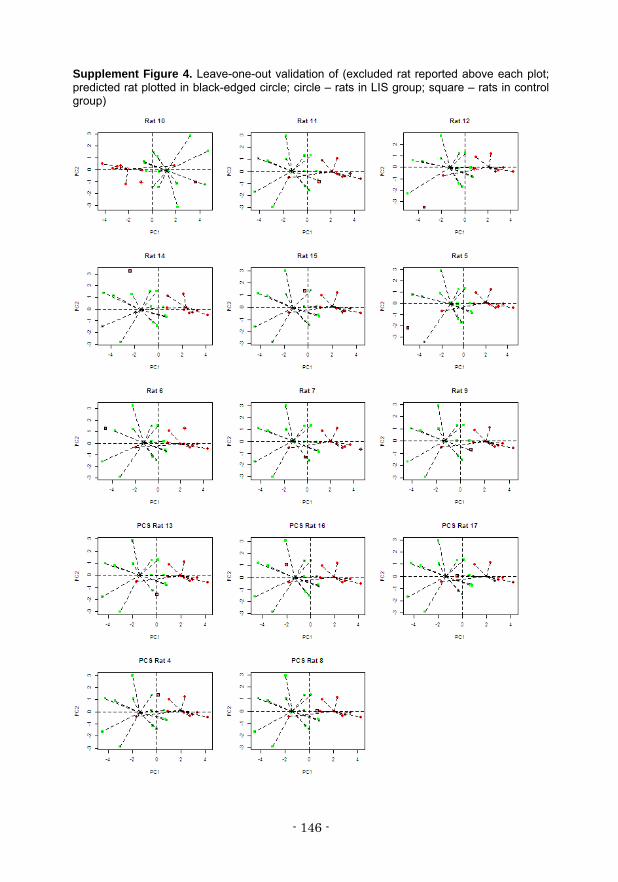
The results of leave-one-out validation (Supplement Figure 4) for the various methods
are summarized in Table 3, which shows the classification accuracy. The results are shown
separately for the case when the LIS period is taken as a whole and when this period is
segmented per hour.
- 138 -
Figure 4. Principal component analysis plot for short duration of ALF
Table 3. Assessment of prediction based on the leave-one-out validation; data from e-Nose 8 sensors
MethodDuration of LIS
PC1 threshold Average distance
3 neighbors 5 neighbors
Total LIS period 13.5 *** (0.96) 10.5 (0.75) 12.5 ** (0.89) 12.5 ** (0.89) 1hour - 10 (0.71) 8.5 (0.61) 10.5 (0.75) 2hours - 10 (0.71) 10.5 (0.75) 9.5 (0.68) 3hours 13.5 *** (0.96) 10.5 (0.75) 12 * (0.86) 12.5 ** (0.89) 4hours 13.5 *** (0.96) 10.5 (0.75) 13 ** (0.93) 12.5 ** (0.89) probability of success in brackets (); * <0.05, **<0.01, *** <0.001
Sensitivity, specificity, PPV, NPV and classification accuracy according to the PC1
threshold classification method (first method in Table 2) were 0.89, 1, 1, 0.95, 0.96,
- 139 -
respectively. These performance measures based on average distance (2nd method in Table
2) were: 0.89, 0.68, 0.57, 0.93, 0.75, and for both methods “3 neighbours” and “5 neighbours”
(3rd and 4th methods in Table 2) were as follows: 0.67, 1, 1, 0.86, 0.89.
Additionally, we inspected the classification accuracy when considering any
combination of only two e-Nose sensors. The best leave-one-out estimate of a sensor pair
was achieved for combination with sensor 6, 7 or 8 (Supplement Table 1). Notably, those
sensors were among others sensitive to carbon monoxide (CO).
In the next step, PCA analysis was performed with the data from 9 sensors: 8 sensors
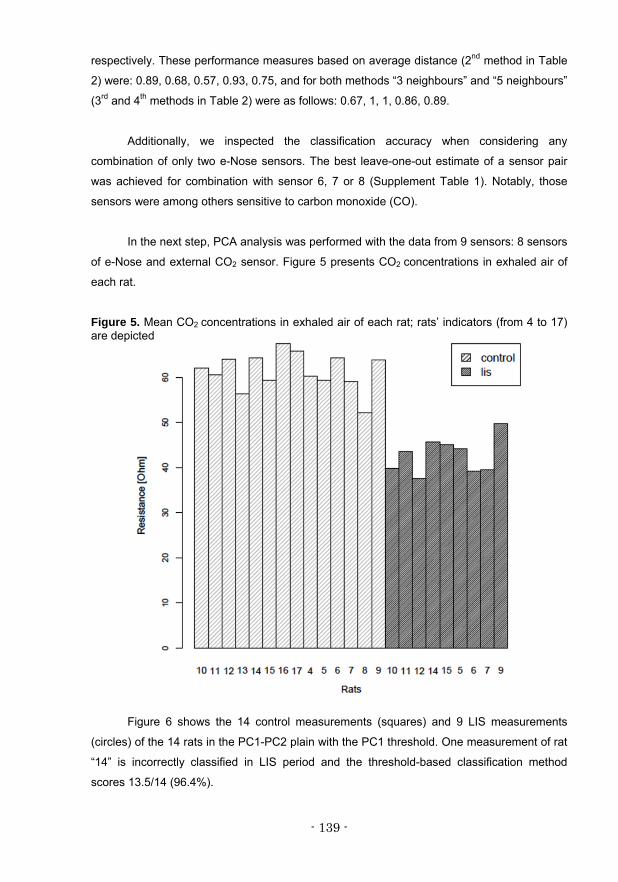
of e-Nose and external CO2 sensor. Figure 5 presents CO2 concentrations in exhaled air of
each rat.
Figure 5. Mean CO2 concentrations in exhaled air of each rat; rats’ indicators (from 4 to 17) are depicted
Figure 6 shows the 14 control measurements (squares) and 9 LIS measurements
(circles) of the 14 rats in the PC1-PC2 plain with the PC1 threshold. One measurement of rat
“14” is incorrectly classified in LIS period and the threshold-based classification method
scores 13.5/14 (96.4%).

- 140 -
Figure 6. Principal component analysis plot of ∆ responses of 9 sensors in LIS and control rats; each point (square or circle) is connected with centre of own cluster; rats’ indicators (from 4 to 17) are depicted
The results of PCA analyses of 9 sensors for short duration of ALF, till 1, 2, 3 and 4
hours of LIS duration are presented in Supplement Figure 5 a,b,c,d, respectively.
Classification based on PC1-threshold method was possible from 2 hours of LIS duration and
scores were 13.5/14 (96.4%) for 2, 3 and 4 hours.
The results of leave-one-out validation (Supplement Figure 6) for the various methods
are summarized in Table 4. The results are shown separately for the case when the LIS
period is taken as a whole and when this period is segmented per hour.
Table 4. Assessment of prediction based on the leave-one-out validation; data from
e-Nose 8 sensors + external CO2 sensor Method
Duration of LIS PC1 threshold Average
distance 3 neighbors 5 neighbors
Total LIS period 13.5 *** (0.96) 11.5 (0.83) 13 *** (0.93) 13 ** (0.93) 1hour - 11 (0.79) 10 (0.71) 11 (0.79) 2hours 13.5 *** (0.96) 11 (0.79) 11.5 * (0.83) 10 (0.71) 3hours 13.5 *** (0.96) 11 (0.79) 12.5 ** (0.89) 11.5 * (0.83) 4hours 13.5 *** (0.96) 12 (0.86) 13.5 *** (0.96) 13.5 *** (0.96) probability of success in brackets (); * <0.05, **<0.01, *** <0.001
- 141 -
Sensitivity, specificity, PPV, NPV, and classification accuracy according to the PC1
threshold classification method (first method in Table 2) were 0.89, 1, 1, 0.95, 0.96,
respectively. These performance measures based on average distance (2nd method in Table
2) were: 0.89, 0.79, 0.67, 0.94, 0.82; for “3 neighbours” (3rd method in Table 2) were: 0.67, 1,
1, 0.86, 0.89 and for “5 neighbours” (4th method in Table 2) were: 0.78, 1, 1, 0.90, 0.93.
Breath analysis using GC-MS
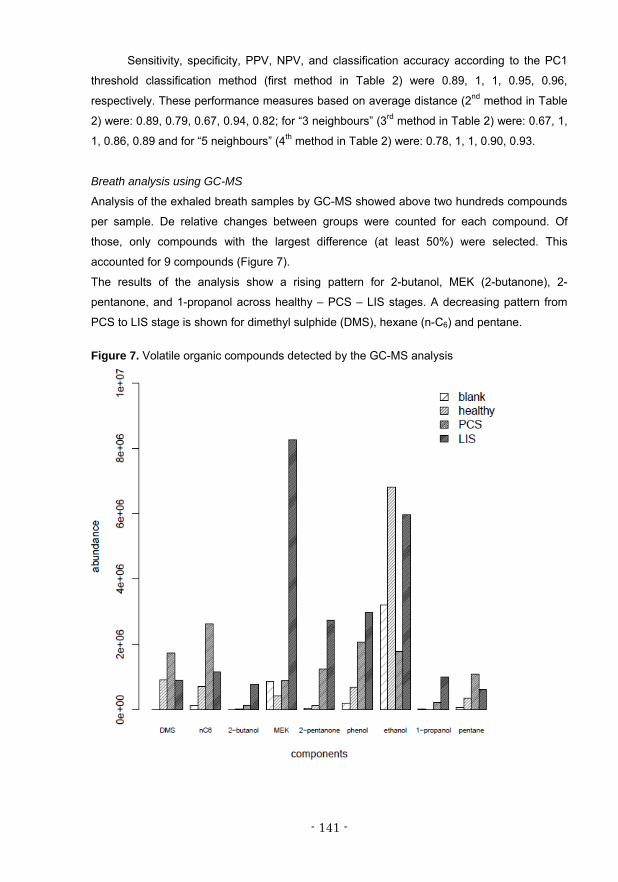
Analysis of the exhaled breath samples by GC-MS showed above two hundreds compounds
per sample. De relative changes between groups were counted for each compound. Of
those, only compounds with the largest difference (at least 50%) were selected. This
accounted for 9 compounds (Figure 7).
The results of the analysis show a rising pattern for 2-butanol, MEK (2-butanone), 2-
pentanone, and 1-propanol across healthy – PCS – LIS stages. A decreasing pattern from
PCS to LIS stage is shown for dimethyl sulphide (DMS), hexane (n-C6) and pentane.
Figure 7. Volatile organic compounds detected by the GC-MS analysis
- 142 -
Discussion
To our knowledge the present study is the first that investigates breath prints by e-Nose
technology as a non-invasive test for ALF.
We report the results of the breath analysis of rats developing ALF due to surgically induced
complete liver ischemia in a relatively short period. This model has two advantages: one - to
study possible changes in breath prints due to PCS, second - to study progression of ALF in
one and the same rat, which is its own control. Using the rat-model rather than human breath
allows one better control of the experimental conditions.
Our study shows that the e-Nose can discriminate exhaled breath of control rats from
rats developing ALF, indicating that the composition of exhaled VOCs is different in healthy
and ALF subjects. The results of leave-one-out validation revealed e-Nose as a good
discrimination tool. The e-Nose had high classification accuracy already within 3 hours after
induction of complete liver ischemia. Different combinations of two e-Nose sensors show also
good discrimination when one of the sensors was among others sensitive to CO.
Simultaneous monitoring of CO2 during the measurements, performed by an external sensor
achieved high classification accuracy even earlier: already within 2 hours.
Breath analyses of patients with liver disease were performed in cirrhosis of various
degrees and etiologies 3, 10, 33, 34, alcoholic and non-alcoholic fatty liver disease 35, alcoholic
and non-alcoholic hepatitis 36. Breath analysis by GC–MS made it possible to discriminate
patients with malodorous breath related to hepatic pathologies 3, 4, 33. Recently, breath
analysis by proton transfer reaction time-of-flight mass spectrometry was able to distinguish
cirrhotic patients from healthy subjects and to discriminate between different severity stages 34.
Interestingly, 2-butanone and 2-pentanone were reported to be increased in breath of
cirrhotic patients 3, 33, 34, like in our study. Increased ketone formation is a consequence of
increased insulin resistance and lipolysis when glycogen stores in the liver have run out and
the body switches to fat metabolism for energy production 5. It has been reported that in
cirrhotic patients 1-propanol decreased and DMS increased 3, 33, in contrast to our study.
This is unexpected since DMS has been reported in breath of patients in hepatic coma 4. A
possible explanation could be the fact that our Tenax trapping of DMS was insufficient for
these VOCs. Phenol has been reported to decrease 3, 33 in breath of patients with cirrhosis.
Our results do not allow firm conclusions about the effect of ALF on exhaled phenol because
the empty system showed already the presence of phenol. Another animal study 16 on rats
with renal failure showed presence of phenol and ethanol in exhaled air. Since ALF results
often in multi organ failure like kidney failure, respiratory distress syndrome, etc 37, these

- 143 -
VOC's will contribute to the breath prints. In our model this was less evident, possibly due to
the relatively short period in which ALF developed.
Another important observation from this study is that already in an early stage of ALF
development (3-4 hours) when HE is usually not higher than grade 2, the breath prints of
control rats became different from ALF rats, without a major change to the end stage. This
indicates that the observed changes in the exhaled breath can be predictive for a fatal
outcome.
Surprisingly the features of the ALF breath print could already be monitored by only 2
sensors of which one detects CO or CO2. This was probably due to the fact that mean CO2
concentrations in exhaled air were significantly lower (p<0.0001) in ALF rats (42.3±3.2 ppm)
compared to healthy subjects (61.1±4.6) (see Figure 5). A lower output of CO2 might be
caused by hyperventilation probably combined with less aerobic metabolism due to complete
liver ischemia. As a consequence increased lactate production occurs and finally respiratory
compensation of metabolic acidosis. However, clinically we did not observe manifest
hyperventilation by the rats when they were outside the e-Nose circuit, but we may have
missed that.
This study shows that e-Nose breath prints can adequately and rapidly distinguish
between control and ALF rats. This technique combines the non-invasive measurement with
real-time analysis of the broad spectrum of VOCs. Our results raise expectations for e-Nose
as a tool for diagnosis of developing ALF in humans. Confirmation of these results in a
clinical study will be an important step forward in the non-invasive diagnosis of ALF. In
particular, it has the potential to recognize ALF early and to list the patient for transplantation
timely 38 and to speed up the therapeutic measures, by which the rate of recovery can be
improved and consequently costs for the health care system can be saved.
- 144 -
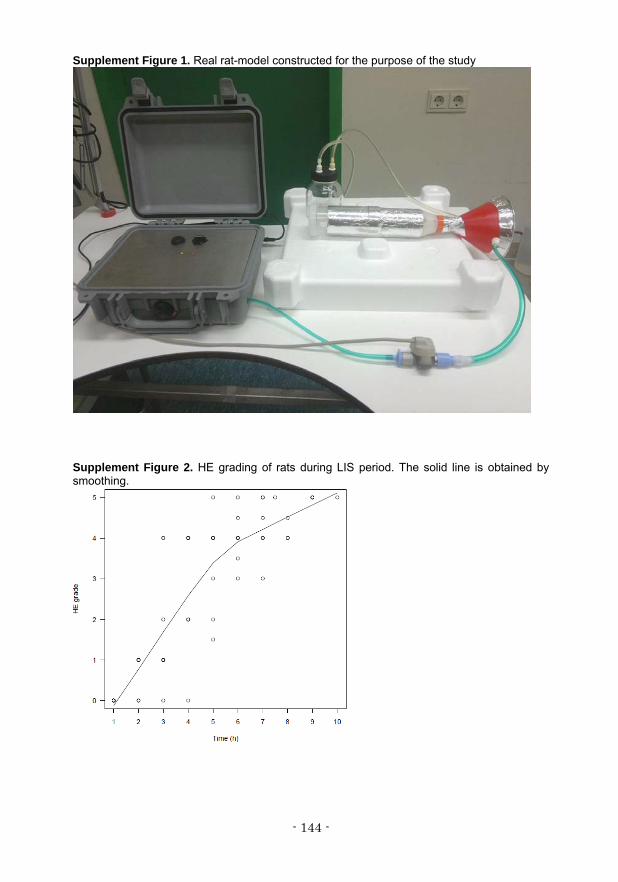
Supplement Figure 1. Real rat-model constructed for the purpose of the study
Supplement Figure 2. HE grading of rats during LIS period. The solid line is obtained by smoothing.

- 145 -
Supplement Figure 3. Results of principal component analysis between two groups: healthy vs. PCS (left), healthy vs. LIS (right)
Supplement Figure 5. Principal component analysis plot
- 146 -
Supplement Figure 4. Leave-one-out validation of (excluded rat reported above each plot; predicted rat plotted in black-edged circle; circle – rats in LIS group; square – rats in control group)

- 147 -
Supplement Figure 6. Leave-one-out validation (excluded rat reported above each plot; predicted rat plotted in black-edged circle; circle – rats in LIS group; square – rats in control group)
- 148 -
References (1) Dabos KJ, Newsome PN, Parkinson JA et al.
Biochemical prognostic markers of outcome in non-paracetamol-induced fulminant hepatic failure. Transplantation 2004;77:200-205.
(2) Wlodzimirow KA, Eslami S, Chamuleau RA et al. Prediction of poor outcome in patients with acute liver failure-systematic review of prediction models. PLoS One 2012;7:e50952.
(3) Van den Velde S, Nevens F, Van HP et al. GC-MS analysis of breath odor compounds in liver patients. J Chromatogr B Analyt Technol Biomed Life Sci 2008;875:344-348.
(4) Probert CS, Ahmed I, Khalid T et al. Volatile organic compounds as diagnostic biomarkers in gastrointestinal and liver diseases. J Gastrointestin Liver Dis 2009;18:337-343.
(5) Wilson AD, Baietto M. Advances in electronic-nose technologies developed for biomedical applications. Sensors (Basel) 2011;11:1105-1176.
(6) Persaud K, Dodd G. Analysis of discrimination mechanisms in the mammalian olfactory system using a model nose. Nature 1982;299:352-355.
(7) Rock F, Barsan N, Weimar U. Electronic nose: current status and future trends. Chem Rev 2008;108:705-25.
(8) Cao W, Duan Y. Current Status of Methods and Techniques for Breath Analysis. Critical Reviews in Analytical Chemistry 2007;37.
(9) Amal H, Ding L, Liu BB et al. The scent fingerprint of hepatocarcinoma: in-vitro metastasis prediction with volatile organic compounds (VOCs). Int J Nanomedicine 2012;7:4135-4146.
(10) Sehnert SS, Jiang L, Burdick JF et al. Breath biomarkers for detection of human liver diseases: preliminary study. Biomarkers 2002;7:174-187.
(11) Shimamoto C, Hirata I, Katsu K. Breath and blood ammonia in liver cirrhosis. Hepatogastroenterology 2000;47:443-445.
(12) Verdam FJ, Dallinga JW, Driessen A et al. Non-alcoholic steatohepatitis: A non-invasive diagnosis by analysis of exhaled breath. J Hepatol 2012.
(13) Ping W, Yi T, Haibao X et al. A novel method for diabetes diagnosis based on electronic nose. Biosensors and Bioelectronics 1997;12:1031-1036.
(14) Yu JB, Byun HG, So MS et al. Analysis of diabetic patient`s breath with conducting polymer sensor array. Sensors and Actuators B 2005;108:305-308.
(15) Guo D, Zhang D, Li N et al. A Novel Breath Analysis System Based on Electronic Olfaction. IEEE Trans Biomed Eng 2010.
(16) Haick H, Hakim M, Patrascu M et al. Sniffing chronic renal failure in rat model by an array of random networks of single-walled carbon nanotubes. ACS Nano 2009;3:1258-1266.
(17) Lin YJ, Guo HR, Chang YH et al. Application of the electronic nose for uremia diagnosis. Sensors and Actuators B 2001;76:177-180.
(18) Pavlou AK, Magan N, McNulty C et al. Use of an electronic nose system for diagnoses of urinary tract infections. Biosens Bioelectron 2002;17:893-899.
(19) Fens N, Zwinderman AH, van der Schee MP et al. Exhaled breath profiling enables discrimination of chronic obstructive pulmonary disease and asthma. Am J Respir Crit Care Med 2009;180:1076-1082.
(20) Dragonieri S, Schot R, Mertens BJ et al. An electronic nose in the discrimination of patients with asthma and controls. J Allergy Clin Immunol 2007;120:856-862.
(21) Dragonieri S, Annema JT, Schot R et al. An electronic nose in the discrimination of patients with non-small cell lung cancer and COPD. Lung Cancer 2009;64:166-170.
(22) Lazar Z, Fens N, van der Maten J et al. Electronic nose breathprints are independent of acute changes in airway caliber in asthma. Sensors (Basel) 2010;10:9127-9138.
(23) Hanson CW, III, Thaler ER. Electronic nose prediction of a clinical pneumonia score: biosensors and microbes. Anesthesiology 2005;102:63-68.
(24) Hockstein NG, Thaler ER, Torigian D et al. Diagnosis of pneumonia with an electronic nose: correlation of vapor signature with chest computed tomography scan findings. Laryngoscope 2004;114:1701-1705.
(25) Tisch U, Schlesinger I, Ionescu R et al. Detection of Alzheimer's and Parkinson's disease from exhaled breath using nanomaterial-based sensors. Nanomedicine (Lond) 2013;8:43-56.
(26) Mazzone PJ, Hammel J, Dweik R et al. Diagnosis of lung cancer by the analysis of exhaled breath with a colorimetric sensor array. Thorax 2007;62:565-568.
(27) Blatt R, Bonarini A, Calabro E et al. Lung cancer identification by an electronic nose based on an array of MOS sensors. International Joint Conference on Neutral Networks, 2007.
(28) Di Natale C, Macagnano A, Martinelli E et al. Lung cancer identification by the analysis of breath by means of an array of non-selective gas sensors. Biosens Bioelectron 2003;18:1209-1218.
(29) Peng G, Hakim M, Broza YY et al. Detection of lung, breast, colorectal, and prostate cancers from exhaled breath using a single array of nanosensors. Br J Cancer 2010;103:542-551.
(30) Flendrig LM, Chamuleau RA, Maas MA et al. Evaluation of a novel bioartificial liver in rats with complete liver ischemia: treatment efficacy and species-specific alpha-GST detection to monitor hepatocyte viability. J Hepatol 1999;30:311-320.
(31) Nibourg GA, Chamuleau RA, van der Hoeven TV et al. Liver progenitor cell line HepaRG differentiated in a bioartificial liver effectively supplies liver support to rats with acute liver failure. PLoS One 2012;7:e38778.
(32) R Development Core Team. R: A language and environment for statistical computing. Vienna, Austria: R Foundation for Statistical Computing, 2008.
(33) Dadamio J, Van den Velde S, Laleman W et al. Breath biomarkers of liver cirrhosis. J Chromatogr B Analyt Technol Biomed Life Sci 2012;905:17-22.
(34) Morisco F, Aprea E, Lembo V et al. Rapid "Breath-Print" of Liver Cirrhosis by Proton Transfer Reaction Time-of-Flight Mass Spectrometry. A Pilot Study. PLoS One 2013;8:e59658.
(35) Netzer M, Millonig G, Osl M et al. A new ensemble-based algorithm for identifying breath gas marker candidates in liver disease using ion molecule reaction mass spectrometry. Bioinformatics 2009;25:941-947.
(36) Letteron P, Duchatelle V, Berson A et al. Increased ethane exhalation, an in vivo index of lipid peroxidation, in alcohol-abusers. Gut 1993;34:409-14.
(37) Jalan R. Acute liver failure: current management and future prospects. J Hepatol 2005;42 Suppl:S115-S123.
(38) Polson J, Lee WM. AASLD position paper: the management of acute liver failure. Hepatology 2005;41:1179-1197.


![[Lecture] Acute Liver Failure](https://static.fdocuments.us/doc/165x107/577cd6c11a28ab9e789d2879/lecture-acute-liver-failure.jpg)