Cost Control and the Menu—Determining Selling Prices and Product Mix
Aswath Damodaran 1
Determining Optimal Financing Mix:Approaches and Alternatives
Aswath Damodaran 2
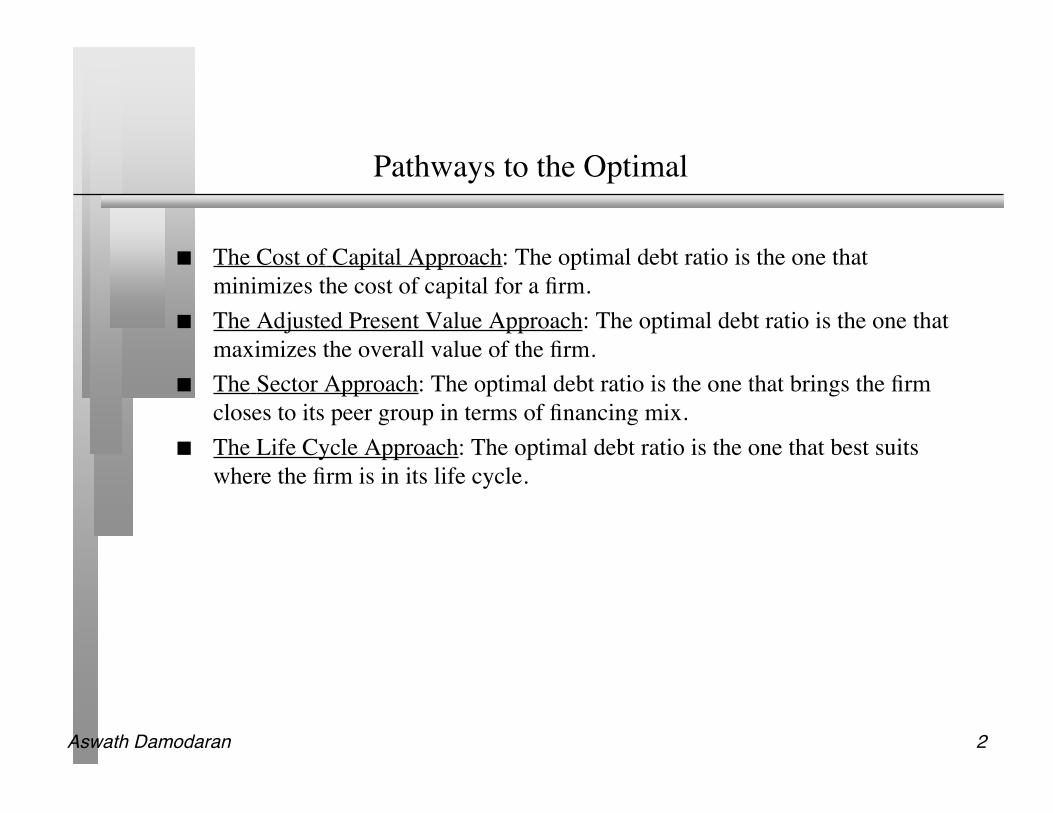
Pathways to the Optimal
The Cost of Capital Approach: The optimal debt ratio is the one thatminimizes the cost of capital for a firm.
The Adjusted Present Value Approach: The optimal debt ratio is the one thatmaximizes the overall value of the firm.
The Sector Approach: The optimal debt ratio is the one that brings the firmcloses to its peer group in terms of financing mix.
The Life Cycle Approach: The optimal debt ratio is the one that best suitswhere the firm is in its life cycle.
Aswath Damodaran 3
I. The Cost of Capital Approach
Value of a Firm = Present Value of Cash Flows to the Firm, discounted backat the cost of capital.
If the cash flows to the firm are held constant, and the cost of capital isminimized, the value of the firm will be maximized.
Aswath Damodaran 4
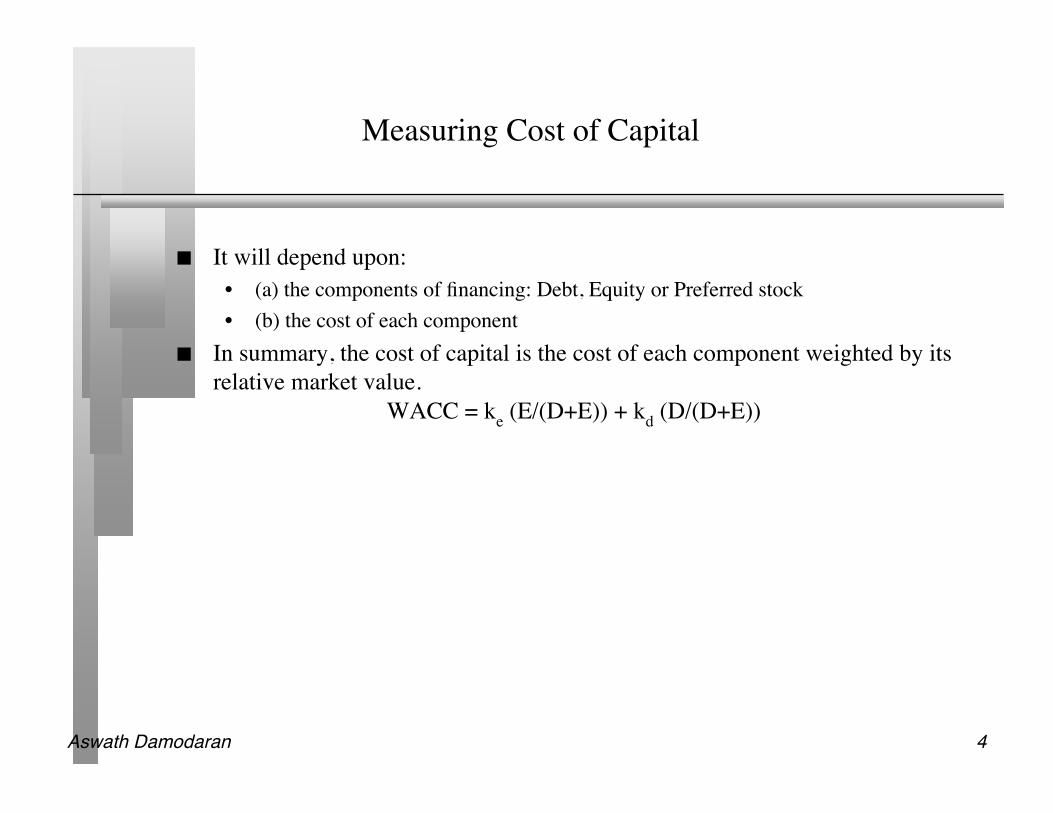
Measuring Cost of Capital
It will depend upon:• (a) the components of financing: Debt, Equity or Preferred stock• (b) the cost of each component
In summary, the cost of capital is the cost of each component weighted by itsrelative market value.
WACC = ke (E/(D+E)) + kd (D/(D+E))
Aswath Damodaran 5
Recapping the Measurement of cost of capital
The cost of debt is the market interest rate that the firm has to pay on itsborrowing. It will depend upon three components
(a) The general level of interest rates(b) The default premium(c) The firm's tax rate
The cost of equity is1. the required rate of return given the risk2. inclusive of both dividend yield and price appreciation
The weights attached to debt and equity have to be market value weights, notbook value weights.
Aswath Damodaran 6
Costs of Debt & Equity
A recent article in an Asian business magazine argued that equity was cheaperthan debt, because dividend yields are much lower than interest rates on debt.Do you agree with this statement
Yes NoCan equity ever be cheaper than debt? Yes No
Aswath Damodaran 7
Fallacies about Book Value
1. People will not lend on the basis of market value.2. Book Value is more reliable than Market Value because it does not change as
much.
Aswath Damodaran 8
Issue: Use of Book Value
Many CFOs argue that using book value is more conservative than using marketvalue, because the market value of equity is usually much higher than bookvalue. Is this statement true, from a cost of capital perspective? (Will you geta more conservative estimate of cost of capital using book value rather thanmarket value?)
Yes No
Aswath Damodaran 9
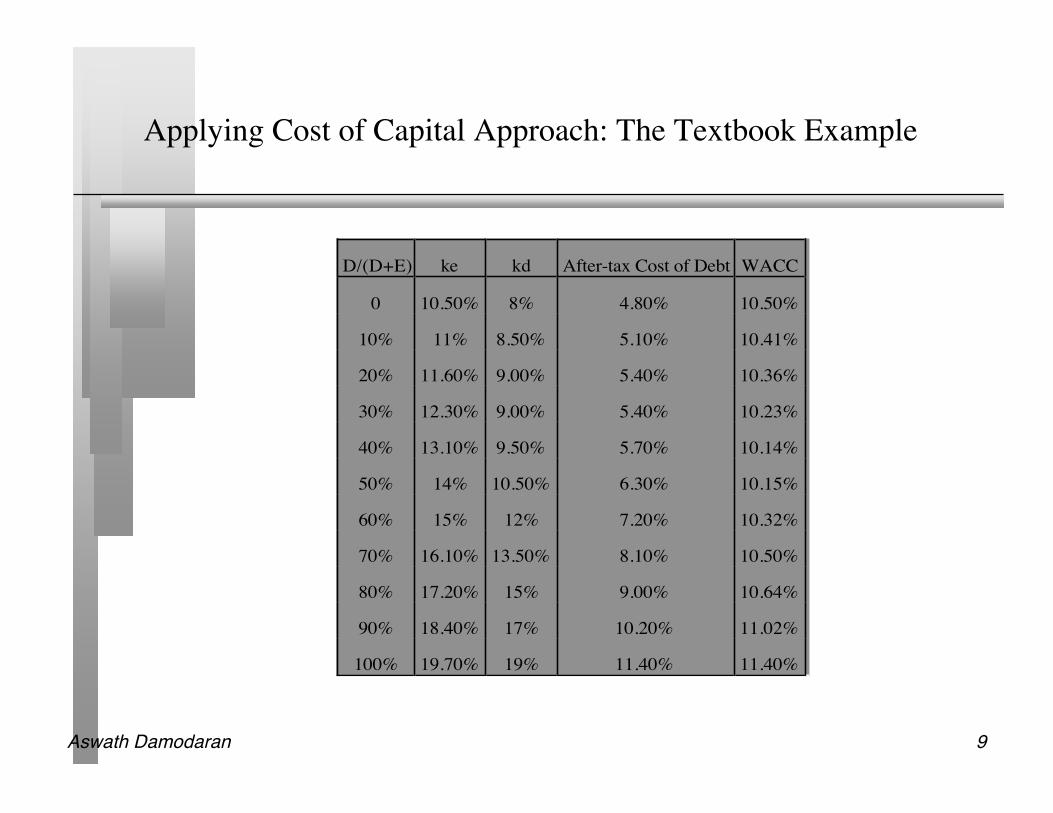
Applying Cost of Capital Approach: The Textbook Example
D/(D+E) ke kd After-tax Cost of Debt WACC
0 10.50% 8% 4.80% 10.50%
10% 11% 8.50% 5.10% 10.41%
20% 11.60% 9.00% 5.40% 10.36%
30% 12.30% 9.00% 5.40% 10.23%
40% 13.10% 9.50% 5.70% 10.14%
50% 14% 10.50% 6.30% 10.15%
60% 15% 12% 7.20% 10.32%
70% 16.10% 13.50% 8.10% 10.50%
80% 17.20% 15% 9.00% 10.64%
90% 18.40% 17% 10.20% 11.02%
100% 19.70% 19% 11.40% 11.40%
Aswath Damodaran 10
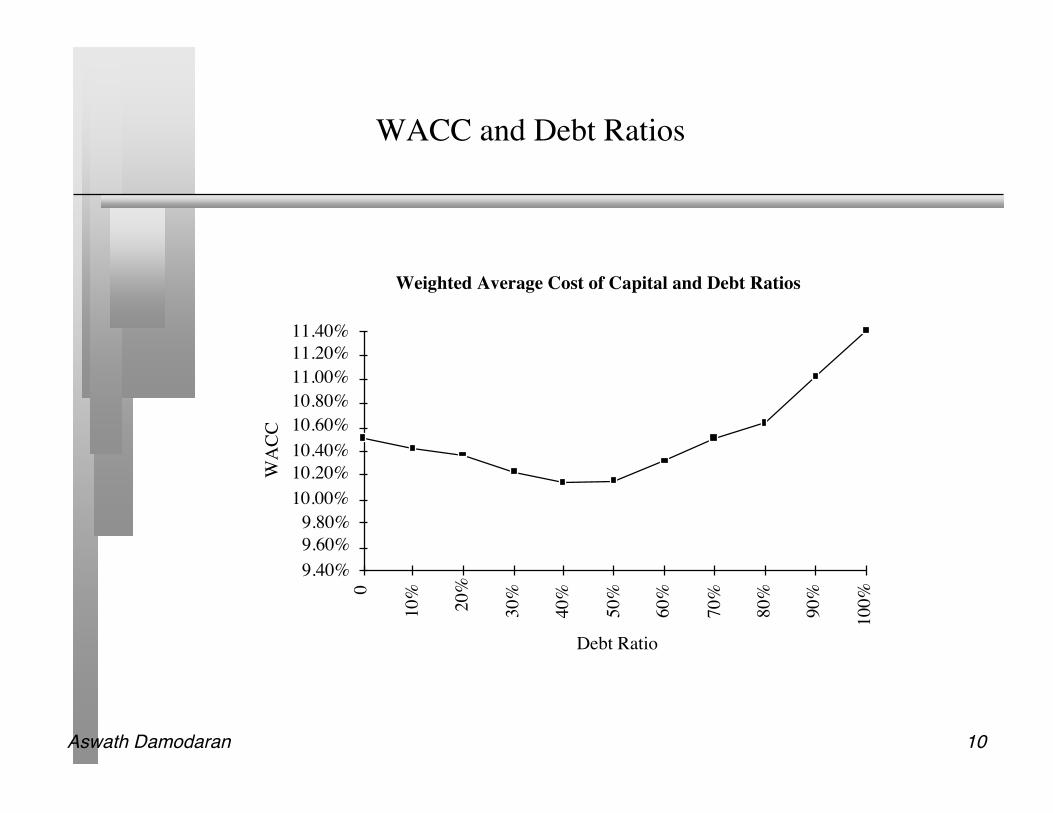
WACC and Debt Ratios
Weighted Average Cost of Capital and Debt Ratios
Debt Ratio
WA
CC
9.40%9.60%9.80%
10.00%10.20%10.40%10.60%10.80%11.00%11.20%11.40%
0
10% 20%
30%
40%
50%
60%
70%
80%
90%
100%
Aswath Damodaran 11
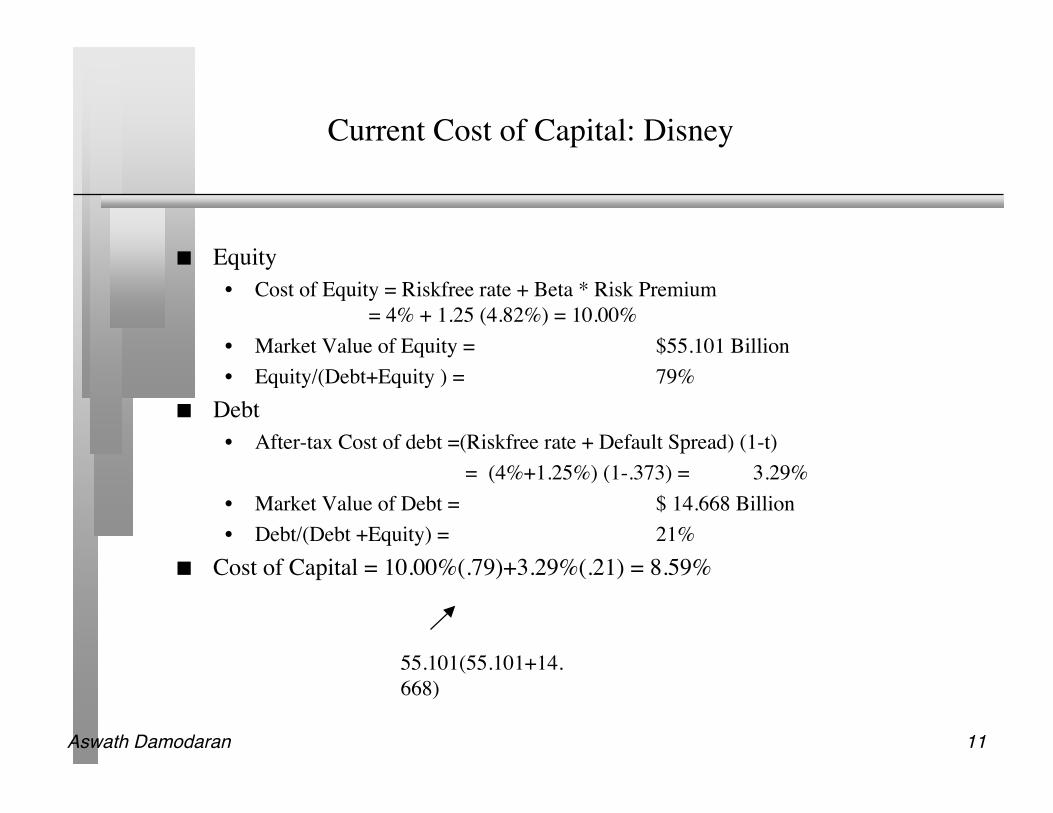
Current Cost of Capital: Disney
Equity• Cost of Equity = Riskfree rate + Beta * Risk Premium
= 4% + 1.25 (4.82%) = 10.00%• Market Value of Equity = $55.101 Billion• Equity/(Debt+Equity ) = 79%
Debt• After-tax Cost of debt =(Riskfree rate + Default Spread) (1-t)
= (4%+1.25%) (1-.373) = 3.29%• Market Value of Debt = $ 14.668 Billion• Debt/(Debt +Equity) = 21%
Cost of Capital = 10.00%(.79)+3.29%(.21) = 8.59%
55.101(55.101+14.668)
Aswath Damodaran 12
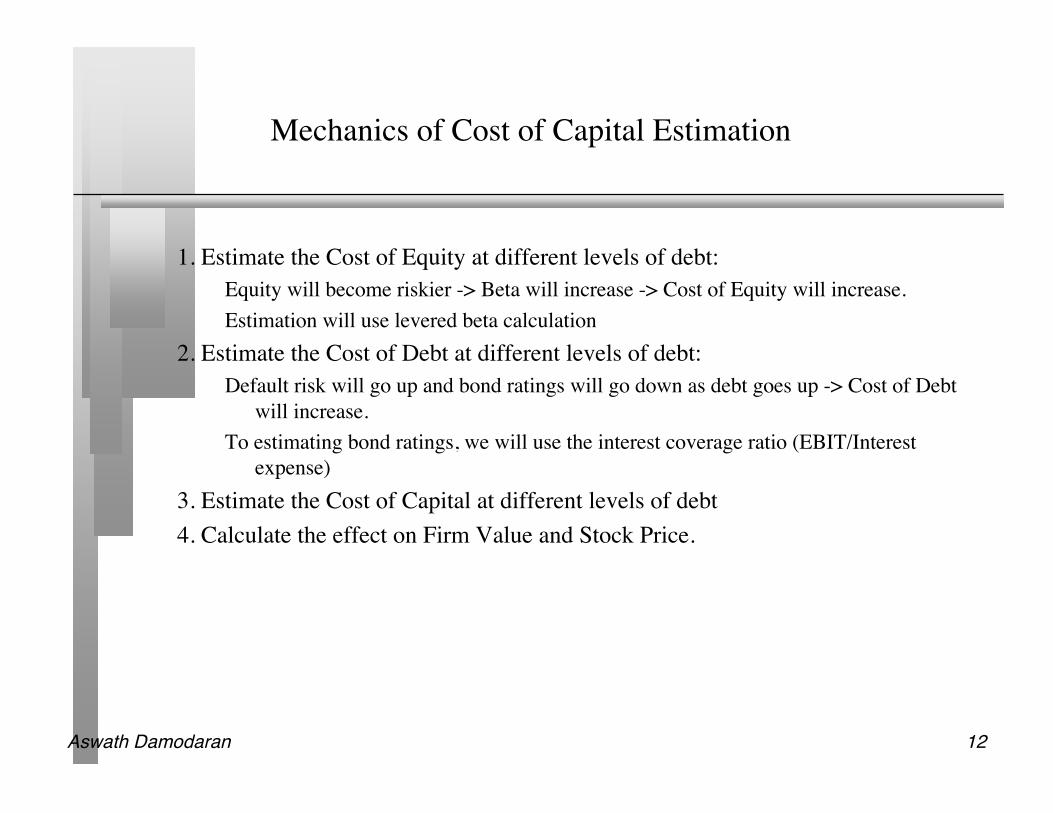
Mechanics of Cost of Capital Estimation
1. Estimate the Cost of Equity at different levels of debt:Equity will become riskier -> Beta will increase -> Cost of Equity will increase.Estimation will use levered beta calculation
2. Estimate the Cost of Debt at different levels of debt:Default risk will go up and bond ratings will go down as debt goes up -> Cost of Debt
will increase.To estimating bond ratings, we will use the interest coverage ratio (EBIT/Interest
expense)3. Estimate the Cost of Capital at different levels of debt4. Calculate the effect on Firm Value and Stock Price.
Aswath Damodaran 13
Process of Ratings and Rate Estimation
We use the median interest coverage ratios for large manufacturing firms todevelop “interest coverage ratio” ranges for each rating class.
We then estimate a spread over the long term bond rate for each ratings class,based upon yields at which these bonds trade in the market place.
Aswath Damodaran 14
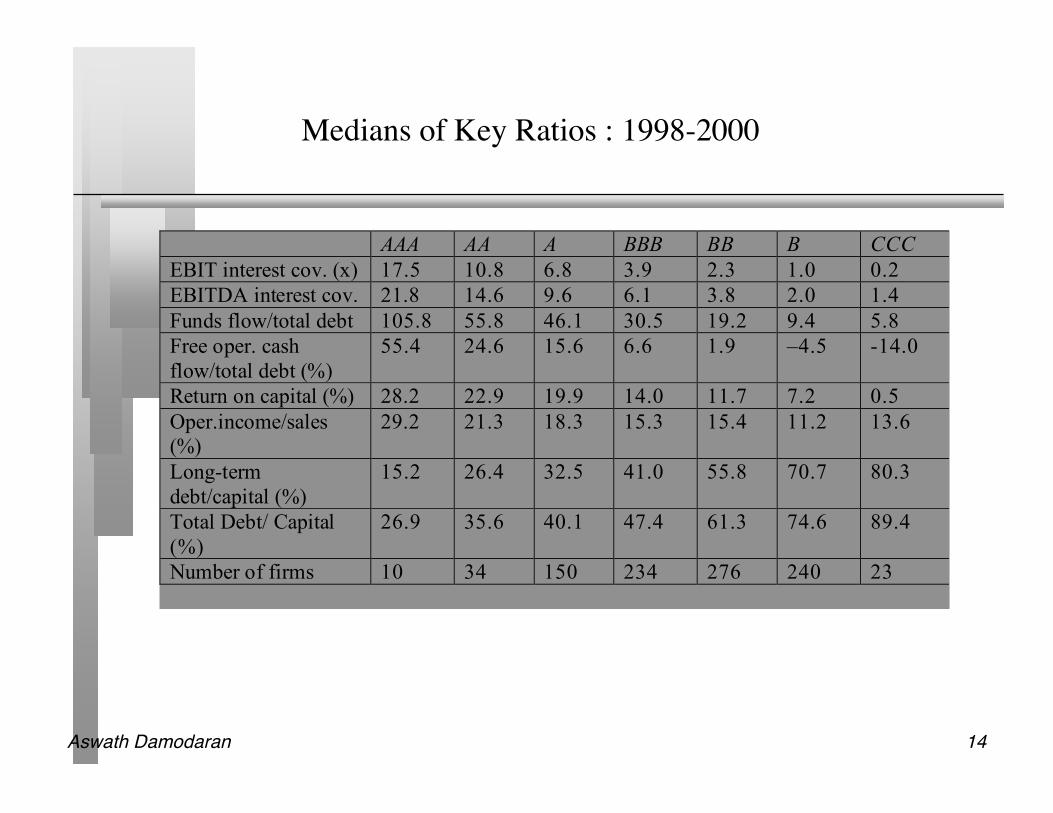
Medians of Key Ratios : 1998-2000
AAA AA A BBB BB B CCC
EBIT interest cov. (x) 17.5 10.8 6.8 3.9 2.3 1.0 0.2
EBITDA interest cov. 21.8 14.6 9.6 6.1 3.8 2.0 1.4
Funds flow/total debt 105.8 55.8 46.1 30.5 19.2 9.4 5.8
Free oper. cash
flow/total debt (%)
55.4 24.6 15.6 6.6 1.9 –4.5 -14.0
Return on capital (%) 28.2 22.9 19.9 14.0 11.7 7.2 0.5
Oper.income/sales
(%)
29.2 21.3 18.3 15.3 15.4 11.2 13.6
Long-term
debt/capital (%)
15.2 26.4 32.5 41.0 55.8 70.7 80.3
Total Debt/ Capital
(%)
26.9 35.6 40.1 47.4 61.3 74.6 89.4
Number of firms 10 34 150 234 276 240 23
Aswath Damodaran 15
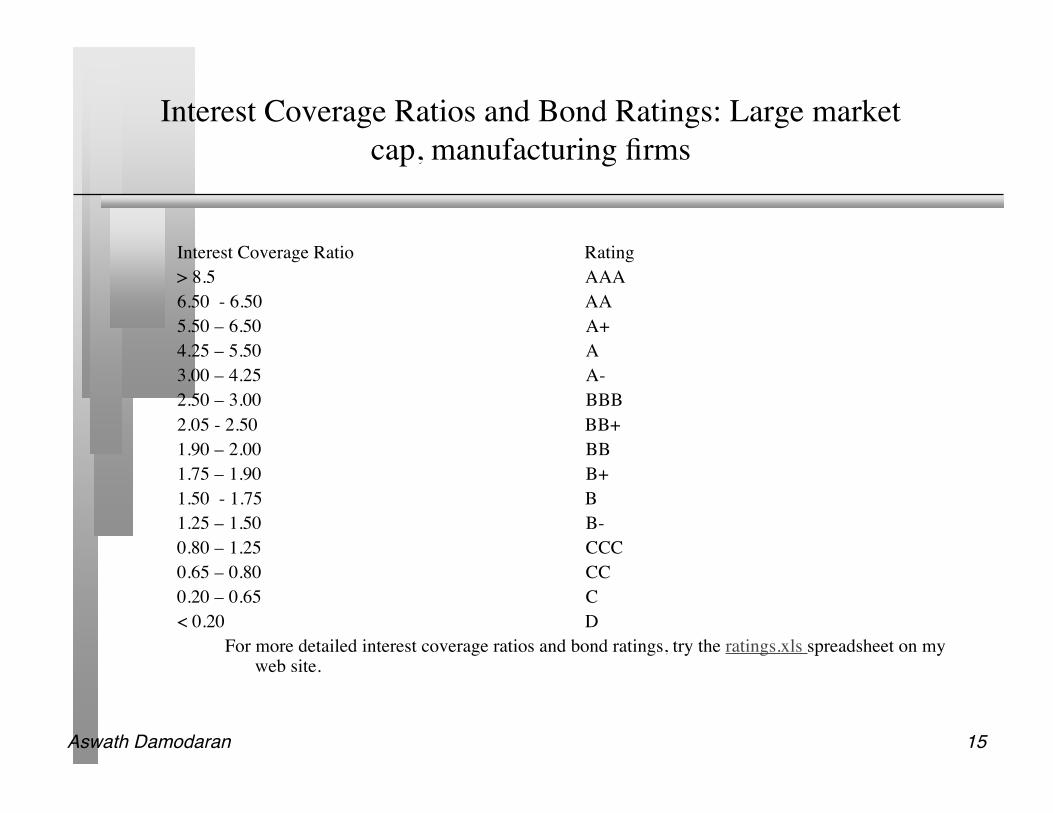
Interest Coverage Ratios and Bond Ratings: Large marketcap, manufacturing firms
Interest Coverage Ratio Rating> 8.5 AAA6.50 - 6.50 AA5.50 – 6.50 A+4.25 – 5.50 A3.00 – 4.25 A-2.50 – 3.00 BBB2.05 - 2.50 BB+1.90 – 2.00 BB1.75 – 1.90 B+1.50 - 1.75 B1.25 – 1.50 B-0.80 – 1.25 CCC0.65 – 0.80 CC0.20 – 0.65 C< 0.20 D
For more detailed interest coverage ratios and bond ratings, try the ratings.xls spreadsheet on myweb site.
Aswath Damodaran 16
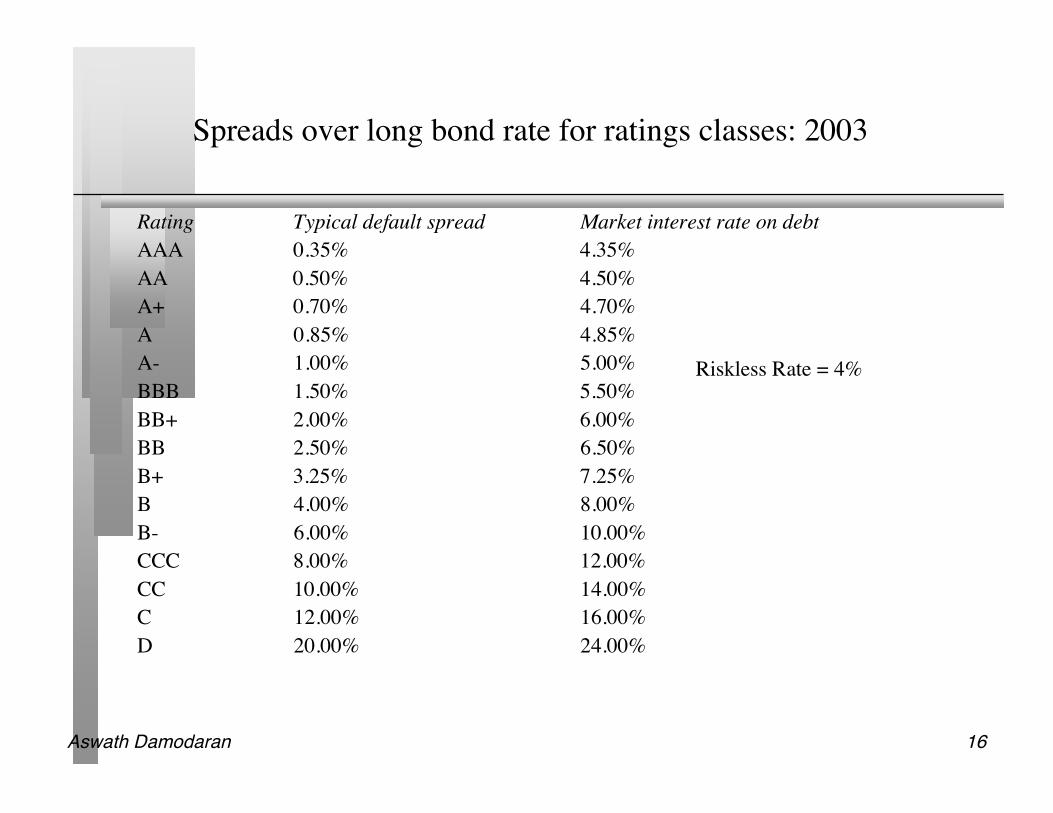
Spreads over long bond rate for ratings classes: 2003
Rating Typical default spread Market interest rate on debtAAA 0.35% 4.35%AA 0.50% 4.50%A+ 0.70% 4.70%A 0.85% 4.85%A- 1.00% 5.00%BBB 1.50% 5.50%BB+ 2.00% 6.00%BB 2.50% 6.50%B+ 3.25% 7.25%B 4.00% 8.00%B- 6.00% 10.00%CCC 8.00% 12.00%CC 10.00% 14.00%C 12.00% 16.00%D 20.00% 24.00%
Riskless Rate = 4%
Aswath Damodaran 17
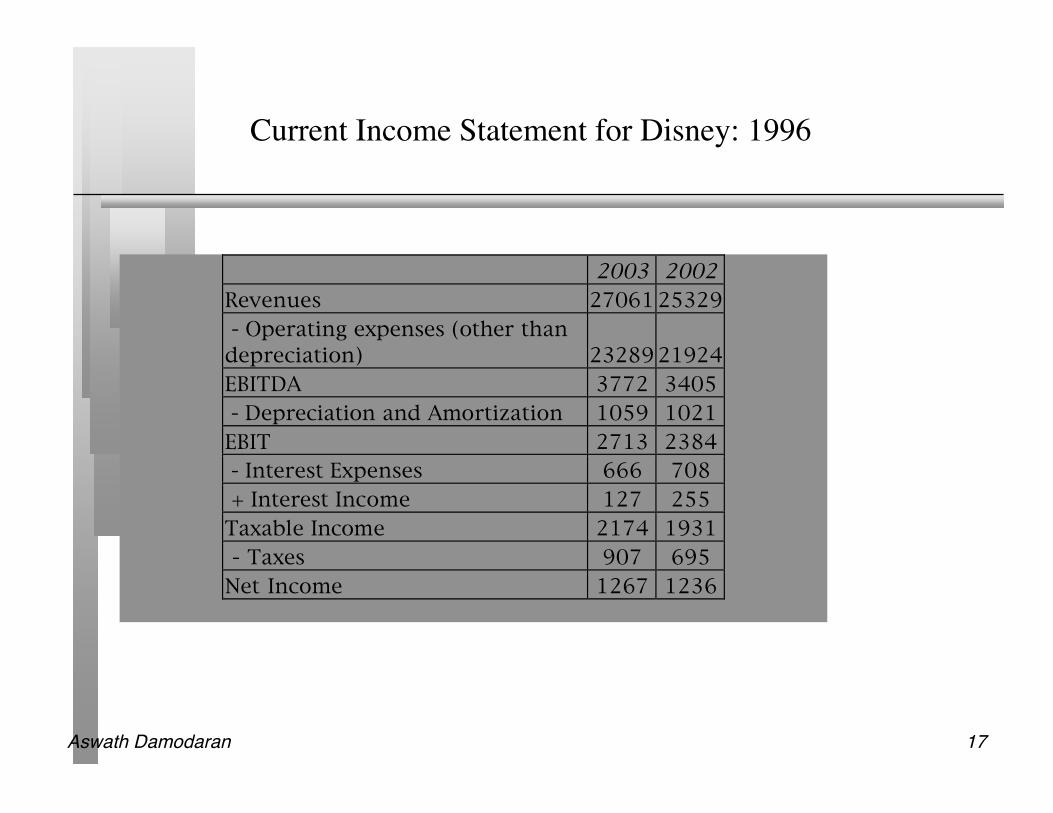
Current Income Statement for Disney: 1996
2003 2002
Revenues 27061 25329
- Operating expenses (other than
depreciation) 23289 21924
EBITDA 3772 3405
- Depreciation and Amortization 1059 1021
EBIT 2713 2384
- Interest Expenses 666 708
+ Interest Income 127 255
Taxable Income 2174 1931
- Taxes 907 695
Net Income 1267 1236
Aswath Damodaran 18
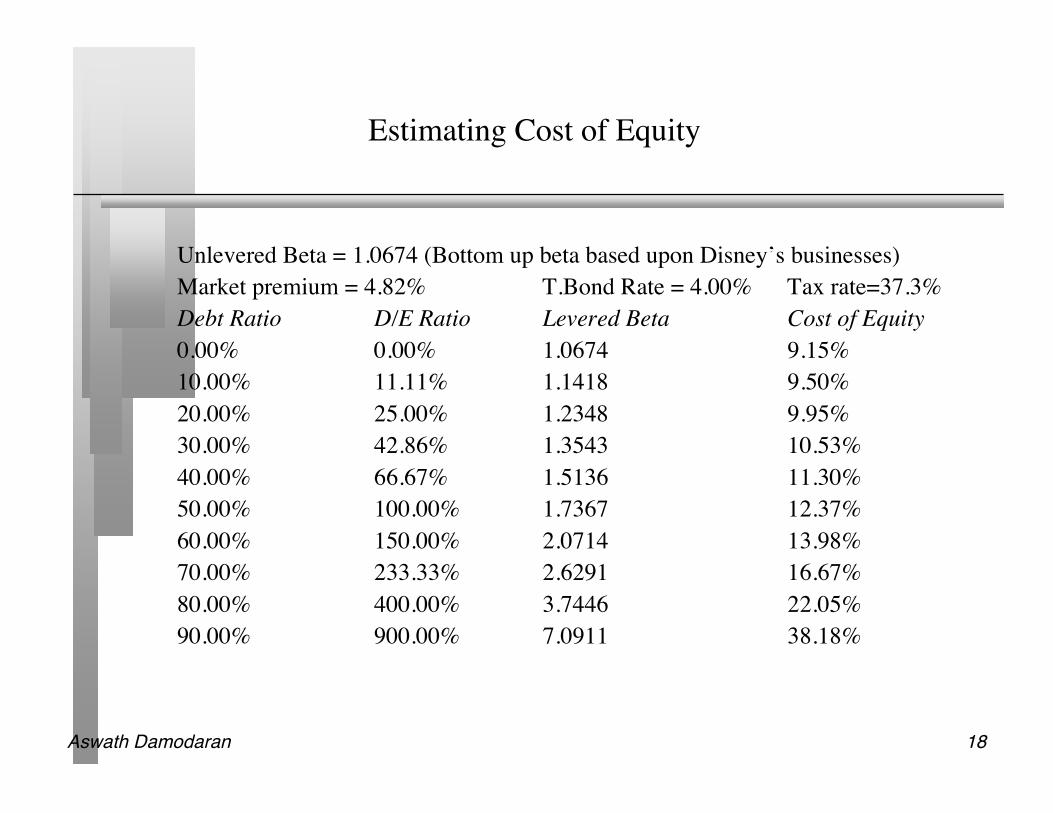
Estimating Cost of Equity
Unlevered Beta = 1.0674 (Bottom up beta based upon Disney’s businesses)Market premium = 4.82% T.Bond Rate = 4.00% Tax rate=37.3%Debt Ratio D/E Ratio Levered Beta Cost of Equity0.00% 0.00% 1.0674 9.15%10.00% 11.11% 1.1418 9.50%20.00% 25.00% 1.2348 9.95%30.00% 42.86% 1.3543 10.53%40.00% 66.67% 1.5136 11.30%50.00% 100.00% 1.7367 12.37%60.00% 150.00% 2.0714 13.98%70.00% 233.33% 2.6291 16.67%80.00% 400.00% 3.7446 22.05%90.00% 900.00% 7.0911 38.18%
Aswath Damodaran 19
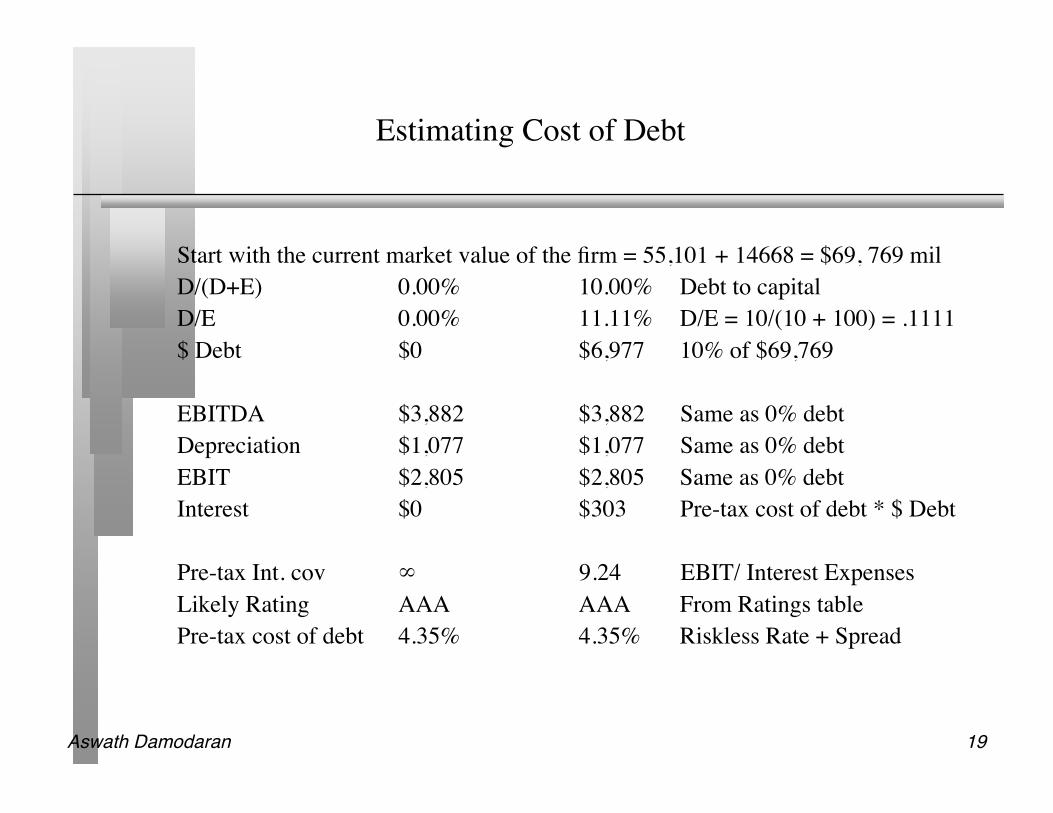
Estimating Cost of Debt
Start with the current market value of the firm = 55,101 + 14668 = $69, 769 milD/(D+E) 0.00% 10.00% Debt to capitalD/E 0.00% 11.11% D/E = 10/(10 + 100) = .1111$ Debt $0 $6,977 10% of $69,769 EBITDA $3,882 $3,882 Same as 0% debtDepreciation $1,077 $1,077 Same as 0% debtEBIT $2,805 $2,805 Same as 0% debtInterest $0 $303 Pre-tax cost of debt * $ Debt Pre-tax Int. cov ∞ 9.24 EBIT/ Interest ExpensesLikely Rating AAA AAA From Ratings tablePre-tax cost of debt 4.35% 4.35% Riskless Rate + Spread
Aswath Damodaran 20
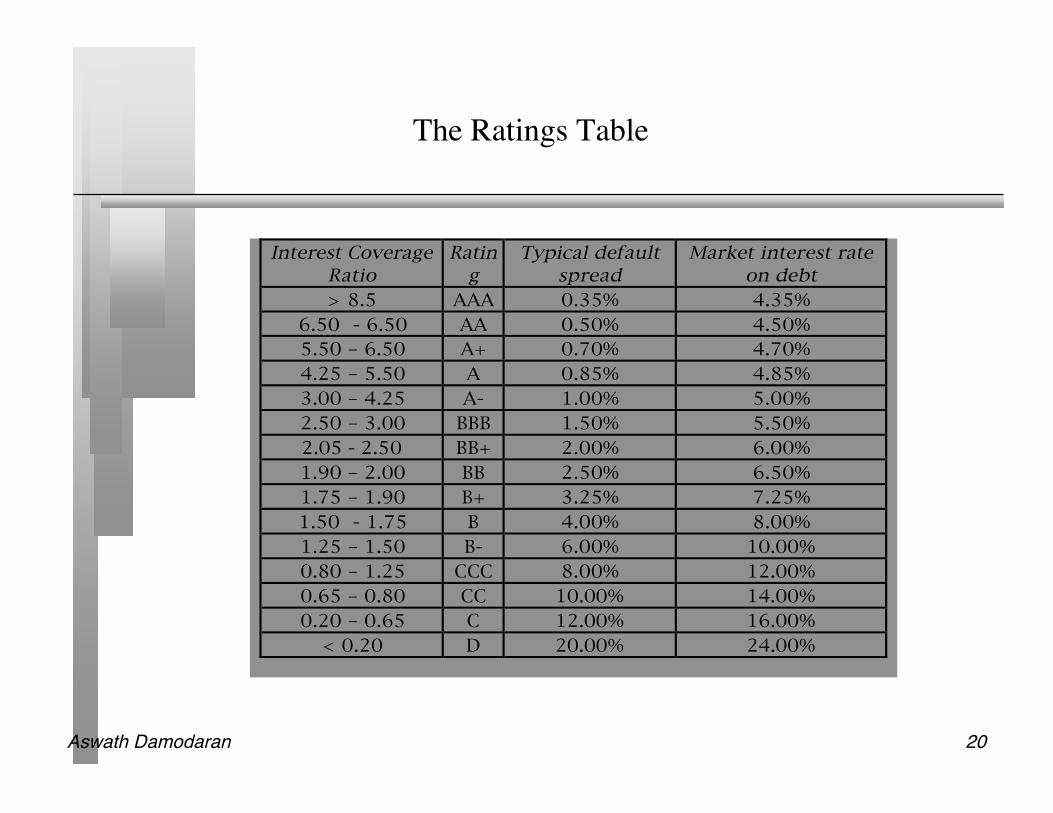
The Ratings Table
Interest Coverage
Ratio
Ratin
g
Typical default
spread
Market interest rate
on debt
> 8.5 AAA 0.35% 4.35%
6.50 - 6.50 AA 0.50% 4.50%
5.50 – 6.50 A+ 0.70% 4.70%
4.25 – 5.50 A 0.85% 4.85%
3.00 – 4.25 A- 1.00% 5.00%
2.50 – 3.00 BBB 1.50% 5.50%
2.05 - 2.50 BB+ 2.00% 6.00%
1.90 – 2.00 BB 2.50% 6.50%
1.75 – 1.90 B+ 3.25% 7.25%
1.50 - 1.75 B 4.00% 8.00%
1.25 – 1.50 B- 6.00% 10.00%
0.80 – 1.25 CCC 8.00% 12.00%
0.65 – 0.80 CC 10.00% 14.00%
0.20 – 0.65 C 12.00% 16.00%
< 0.20 D 20.00% 24.00%
Aswath Damodaran 21
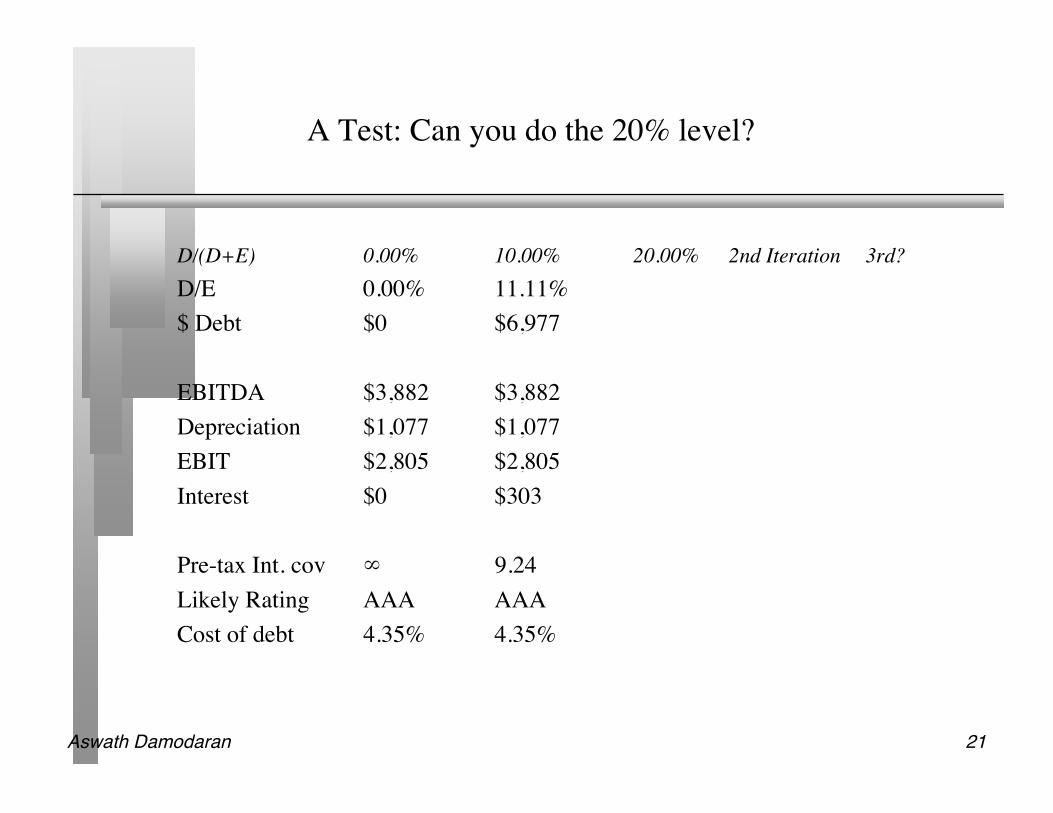
A Test: Can you do the 20% level?
D/(D+E) 0.00% 10.00% 20.00% 2nd Iteration 3rd?D/E 0.00% 11.11%$ Debt $0 $6,977 EBITDA $3,882 $3,882 Depreciation $1,077 $1,077 EBIT $2,805 $2,805 Interest $0 $303 Pre-tax Int. cov ∞ 9.24Likely Rating AAA AAACost of debt 4.35% 4.35%
Aswath Damodaran 22
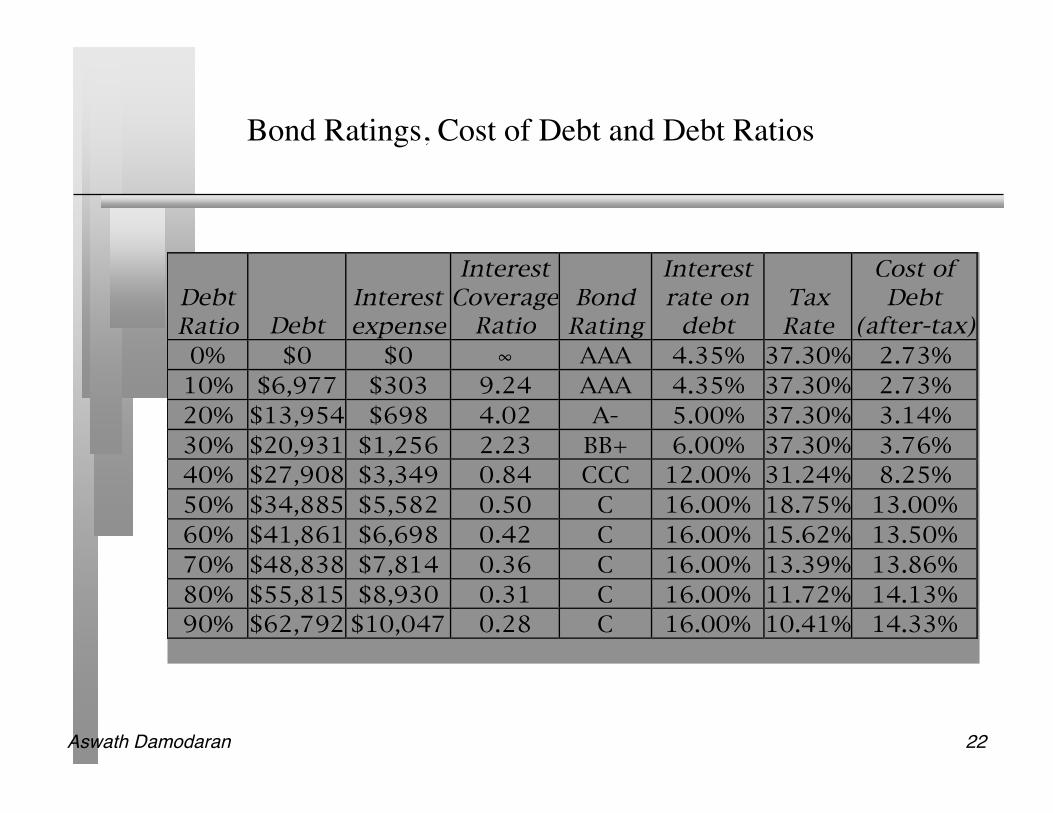
Bond Ratings, Cost of Debt and Debt Ratios
Debt Ratio Debt
Interest expense
Interest Coverage
Ratio Bond
Rating
Interest rate on
debt Tax Rate
Cost of Debt
(after-tax)
0% $0 $0 ! AAA 4.35% 37.30% 2.73%
10% $6,977 $303 9.24 AAA 4.35% 37.30% 2.73%
20% $13,954 $698 4.02 A- 5.00% 37.30% 3.14%
30% $20,931 $1,256 2.23 BB+ 6.00% 37.30% 3.76%
40% $27,908 $3,349 0.84 CCC 12.00% 31.24% 8.25%
50% $34,885 $5,582 0.50 C 16.00% 18.75% 13.00%
60% $41,861 $6,698 0.42 C 16.00% 15.62% 13.50%
70% $48,838 $7,814 0.36 C 16.00% 13.39% 13.86%
80% $55,815 $8,930 0.31 C 16.00% 11.72% 14.13%
90% $62,792 $10,047 0.28 C 16.00% 10.41% 14.33%
Aswath Damodaran 23
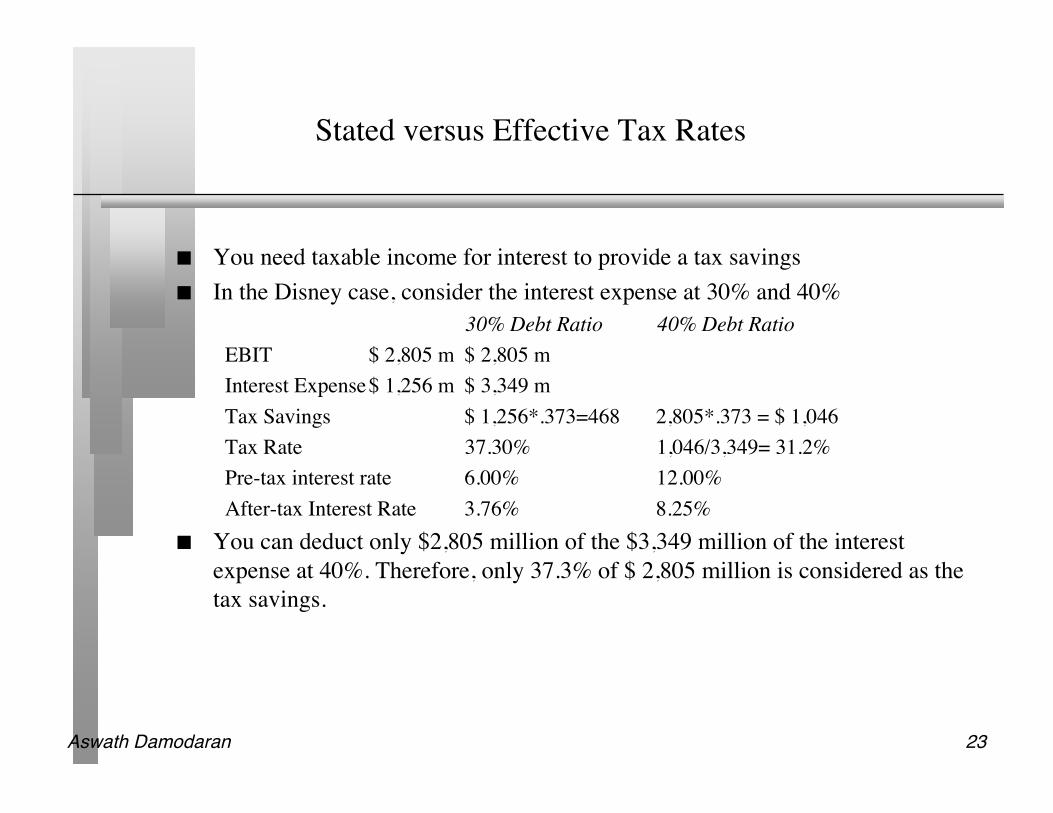
Stated versus Effective Tax Rates
You need taxable income for interest to provide a tax savings In the Disney case, consider the interest expense at 30% and 40%
30% Debt Ratio 40% Debt RatioEBIT $ 2,805 m $ 2,805 mInterest Expense$ 1,256 m $ 3,349 mTax Savings $ 1,256*.373=468 2,805*.373 = $ 1,046Tax Rate 37.30% 1,046/3,349= 31.2%Pre-tax interest rate 6.00% 12.00%After-tax Interest Rate 3.76% 8.25%
You can deduct only $2,805 million of the $3,349 million of the interestexpense at 40%. Therefore, only 37.3% of $ 2,805 million is considered as thetax savings.
Aswath Damodaran 24
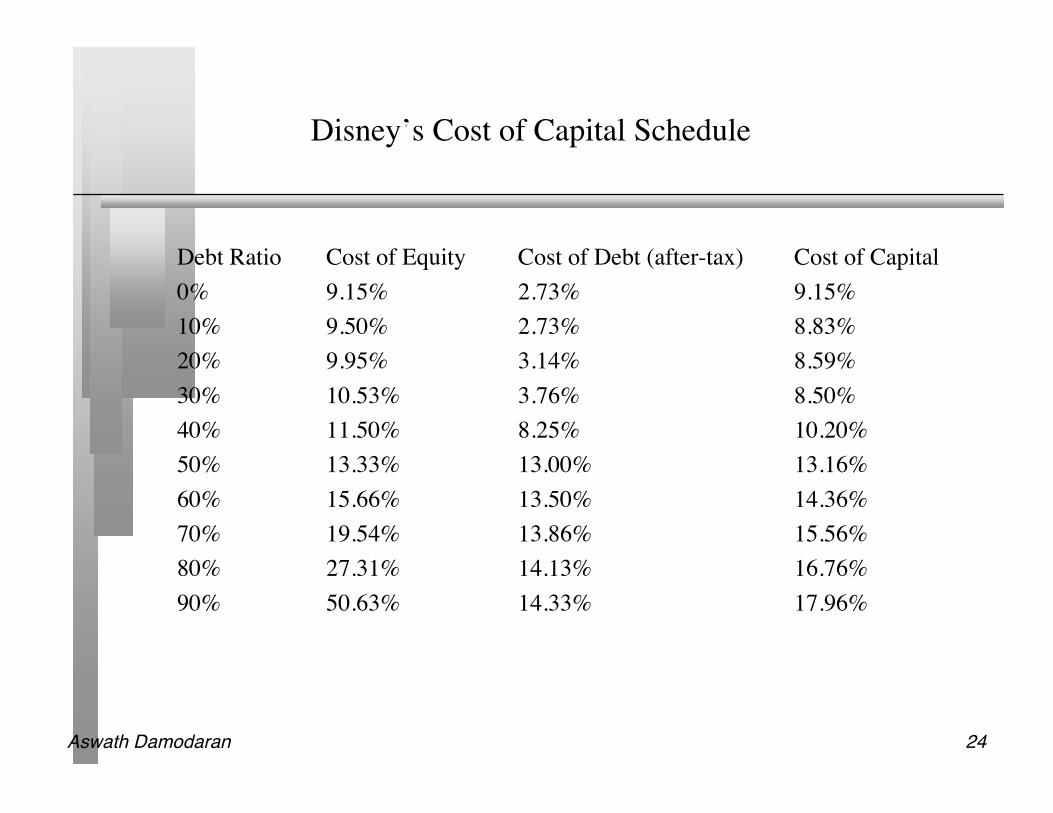
Disney’s Cost of Capital Schedule
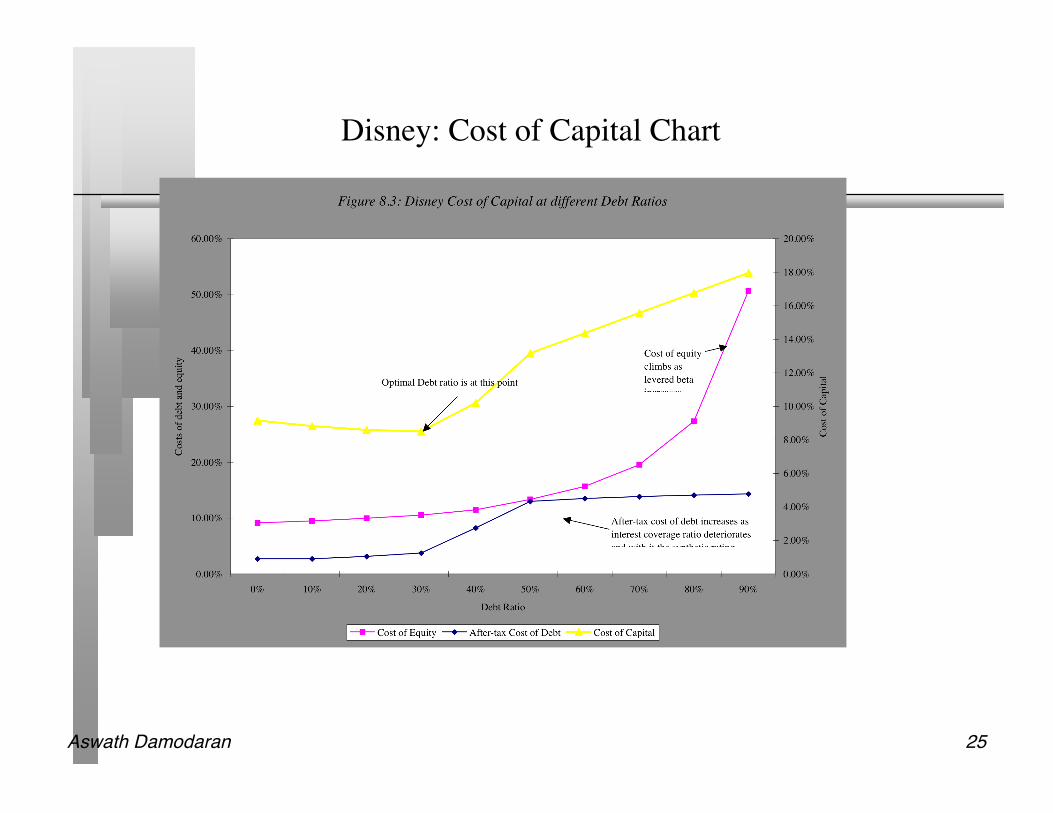
Debt Ratio Cost of Equity Cost of Debt (after-tax) Cost of Capital0% 9.15% 2.73% 9.15%10% 9.50% 2.73% 8.83%20% 9.95% 3.14% 8.59%30% 10.53% 3.76% 8.50%40% 11.50% 8.25% 10.20%50% 13.33% 13.00% 13.16%60% 15.66% 13.50% 14.36%70% 19.54% 13.86% 15.56%80% 27.31% 14.13% 16.76%90% 50.63% 14.33% 17.96%
Aswath Damodaran 25
Disney: Cost of Capital Chart
Aswath Damodaran 26
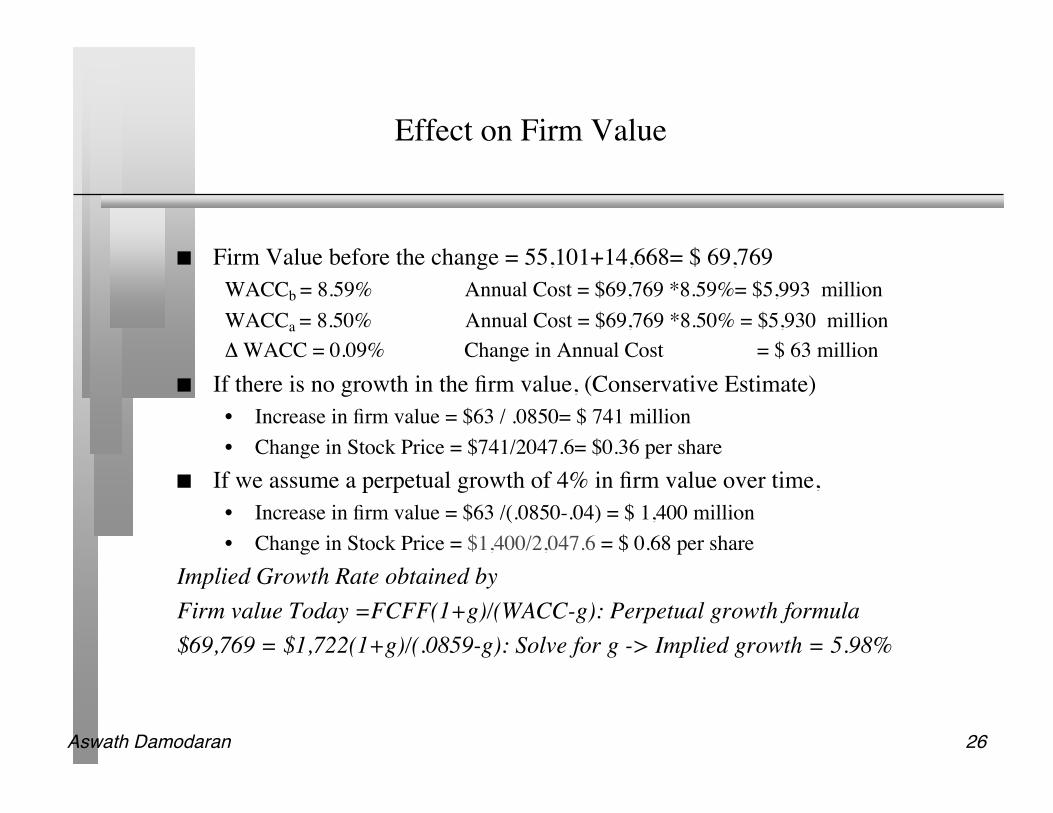
Effect on Firm Value
Firm Value before the change = 55,101+14,668= $ 69,769WACCb = 8.59% Annual Cost = $69,769 *8.59%= $5,993 millionWACCa = 8.50% Annual Cost = $69,769 *8.50% = $5,930 millionΔ WACC = 0.09% Change in Annual Cost = $ 63 million
If there is no growth in the firm value, (Conservative Estimate)• Increase in firm value = $63 / .0850= $ 741 million• Change in Stock Price = $741/2047.6= $0.36 per share
If we assume a perpetual growth of 4% in firm value over time,• Increase in firm value = $63 /(.0850-.04) = $ 1,400 million• Change in Stock Price = $1,400/2,047.6 = $ 0.68 per share
Implied Growth Rate obtained byFirm value Today =FCFF(1+g)/(WACC-g): Perpetual growth formula$69,769 = $1,722(1+g)/(.0859-g): Solve for g -> Implied growth = 5.98%
Aswath Damodaran 27
A Test: The Repurchase Price
Let us suppose that the CFO of Disney approached you about buying backstock. He wants to know the maximum price that he should be willing to payon the stock buyback. (The current price is $ 26.91) Assuming that firm valuewill grow by 4% a year, estimate the maximum price.
What would happen to the stock price after the buyback if you were able tobuy stock back at $ 26.91?
Aswath Damodaran 28
Buybacks and Stock Prices
Assume that Disney does make a tender offer for it’s shares but pays $28 pershare. What will happen to the value per share for the shareholders who donot sell back?
a. The share price will drop below the pre-announcement price of $26.91b. The share price will be between $26.91 and the estimated value (above) or $27.59c. The share price will be higher than $27.59
Aswath Damodaran 29
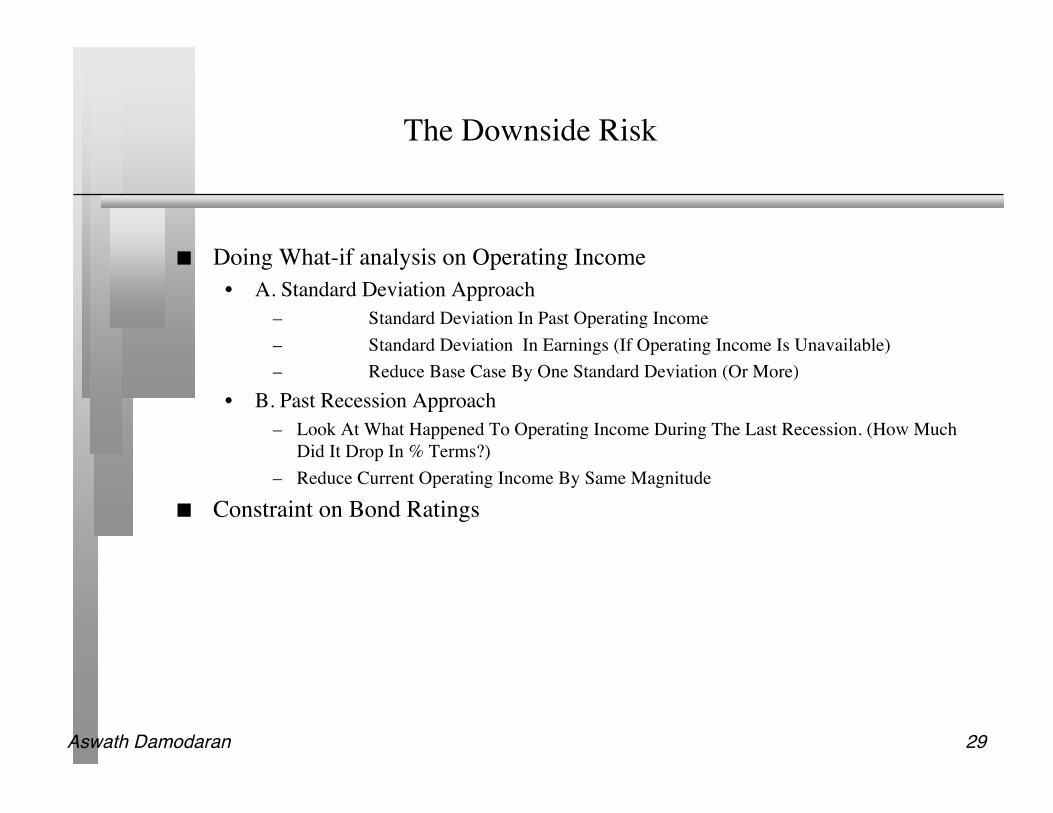
The Downside Risk
Doing What-if analysis on Operating Income• A. Standard Deviation Approach
– Standard Deviation In Past Operating Income– Standard Deviation In Earnings (If Operating Income Is Unavailable)– Reduce Base Case By One Standard Deviation (Or More)
• B. Past Recession Approach– Look At What Happened To Operating Income During The Last Recession. (How Much
Did It Drop In % Terms?)– Reduce Current Operating Income By Same Magnitude
Constraint on Bond Ratings
Aswath Damodaran 30
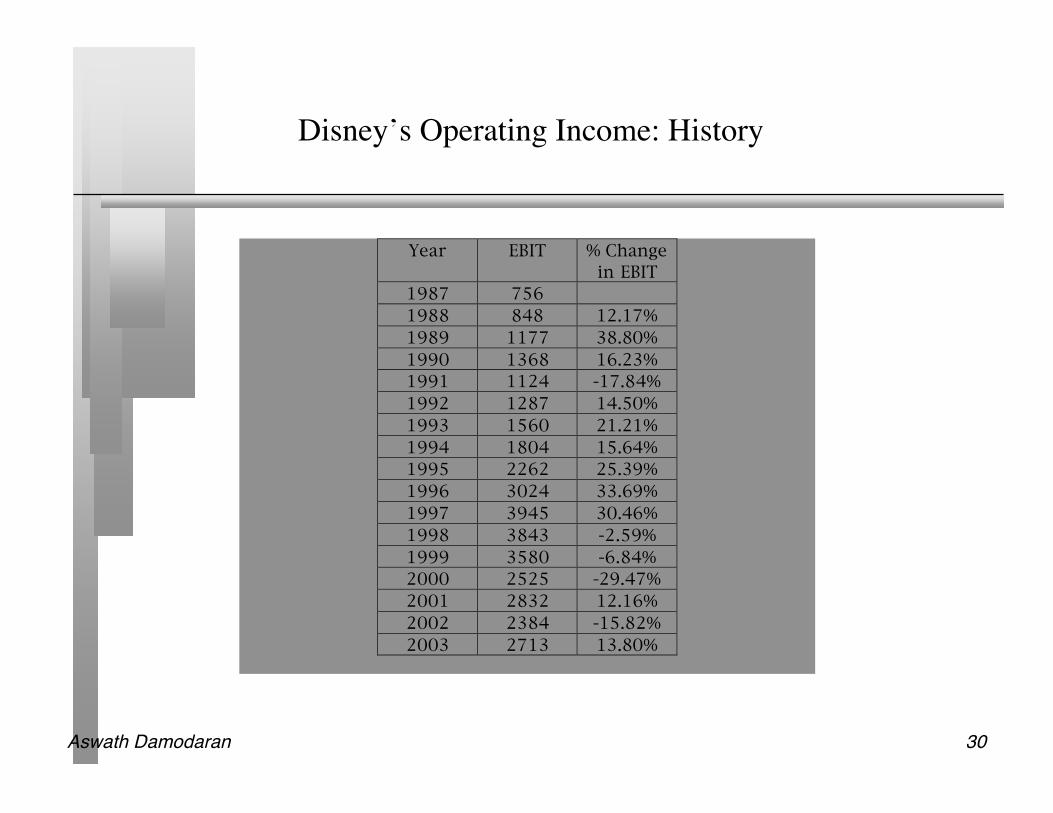
Disney’s Operating Income: History
Year EBIT % Change
in EBIT
1987 756
1988 848 12.17%
1989 1177 38.80%
1990 1368 16.23%
1991 1124 -17.84%
1992 1287 14.50%
1993 1560 21.21%
1994 1804 15.64%
1995 2262 25.39%
1996 3024 33.69%
1997 3945 30.46%
1998 3843 -2.59%
1999 3580 -6.84%
2000 2525 -29.47%
2001 2832 12.16%
2002 2384 -15.82%
2003 2713 13.80%
Aswath Damodaran 31
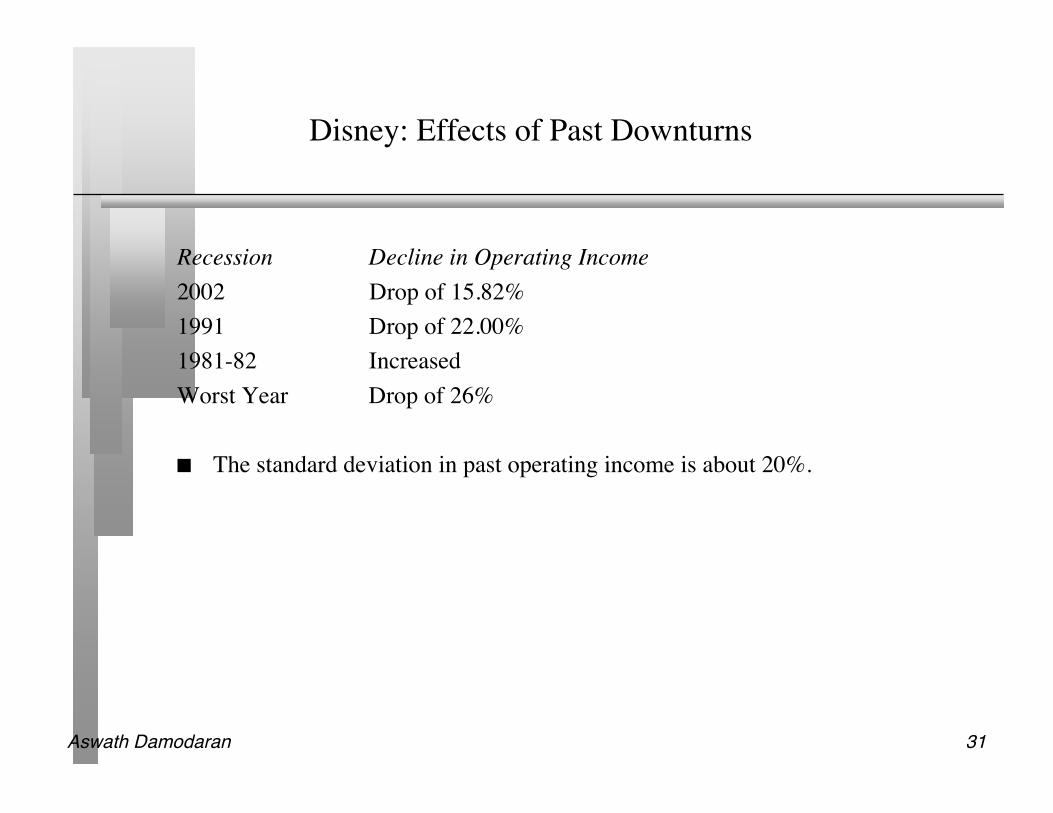
Disney: Effects of Past Downturns
Recession Decline in Operating Income2002 Drop of 15.82%1991 Drop of 22.00%1981-82 IncreasedWorst Year Drop of 26%
The standard deviation in past operating income is about 20%.
Aswath Damodaran 32
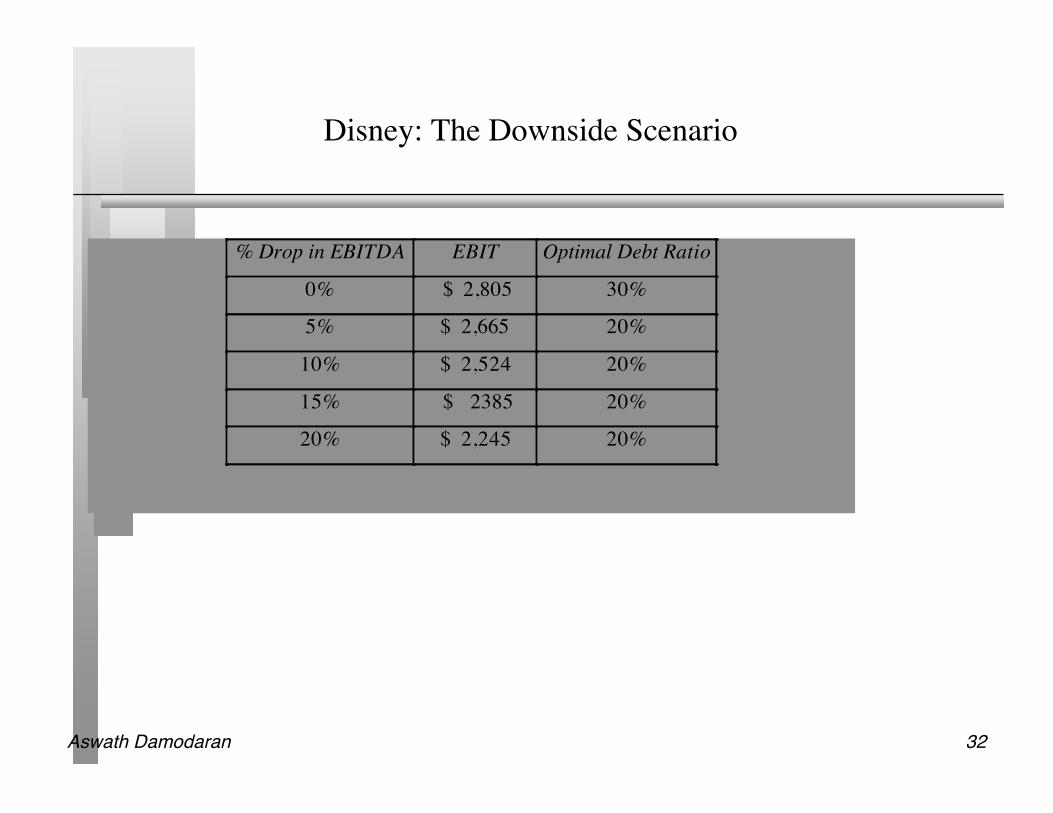
Disney: The Downside Scenario
% Drop in EBITDA EBIT Optimal Debt Ratio
0% $ 2,805 30%
5% $ 2,665 20%
10% $ 2,524 20%
15% $ 2385 20%
20% $ 2,245 20%
Aswath Damodaran 33
Constraints on Ratings
Management often specifies a 'desired Rating' below which they do not wantto fall.
The rating constraint is driven by three factors• it is one way of protecting against downside risk in operating income (so do not do
both)• a drop in ratings might affect operating income• there is an ego factor associated with high ratings
Caveat: Every Rating Constraint Has A Cost.• Provide Management With A Clear Estimate Of How Much The Rating Constraint
Costs By Calculating The Value Of The Firm Without The Rating Constraint AndComparing To The Value Of The Firm With The Rating Constraint.
Aswath Damodaran 34
Ratings Constraints for Disney
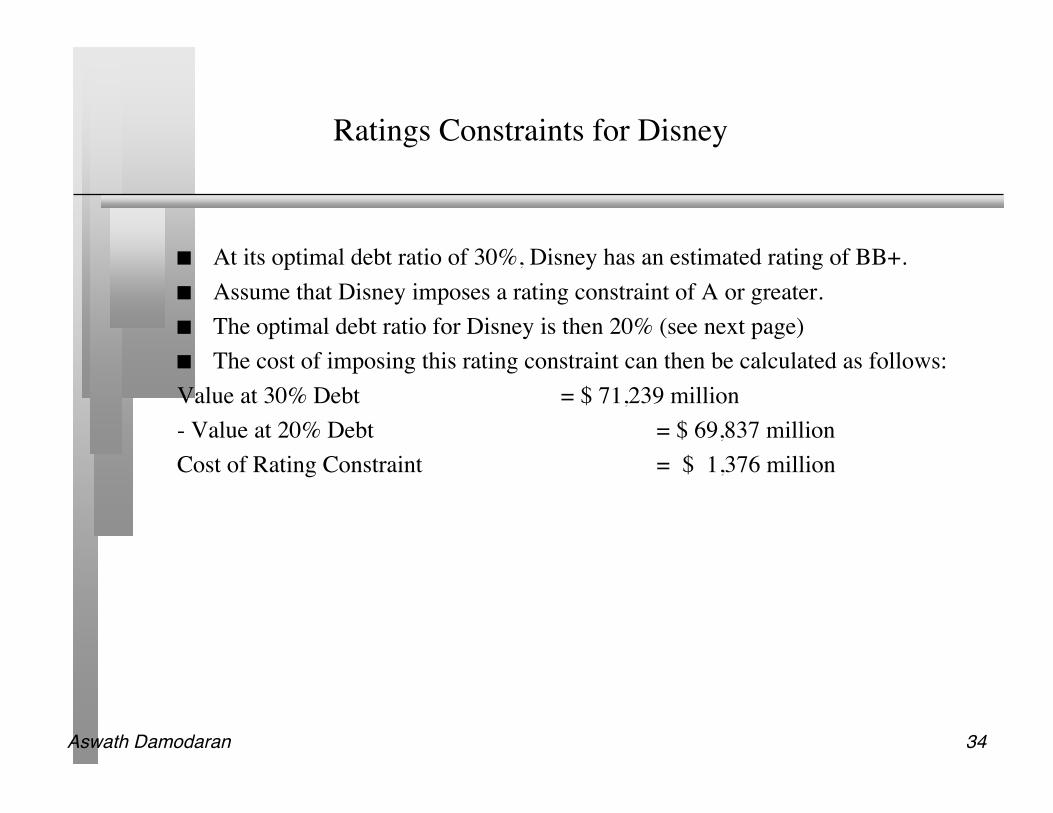
At its optimal debt ratio of 30%, Disney has an estimated rating of BB+. Assume that Disney imposes a rating constraint of A or greater. The optimal debt ratio for Disney is then 20% (see next page) The cost of imposing this rating constraint can then be calculated as follows:Value at 30% Debt = $ 71,239 million- Value at 20% Debt = $ 69,837 millionCost of Rating Constraint = $ 1,376 million
Aswath Damodaran 35
Effect of Ratings Constraints: Disney
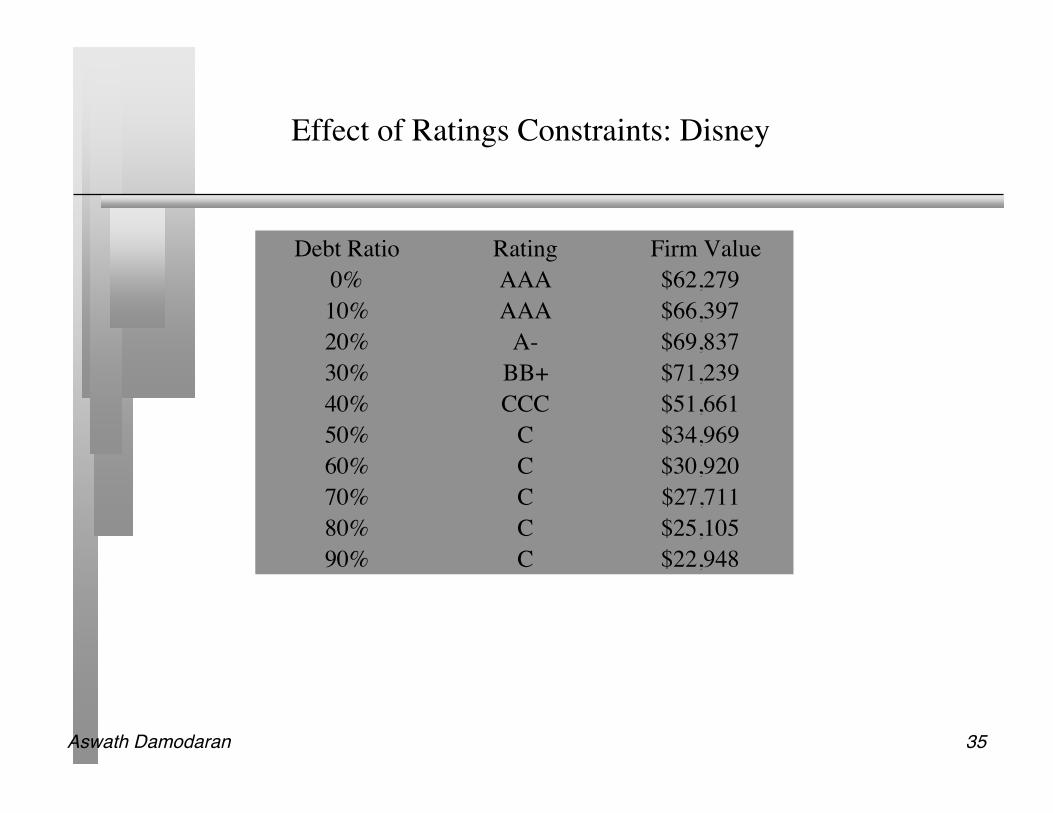
Debt Ratio Rating Firm Value
0% AAA $62,279
10% AAA $66,397
20% A- $69,837
30% BB+ $71,239
40% CCC $51,661
50% C $34,969
60% C $30,920
70% C $27,711
80% C $25,105
90% C $22,948
Aswath Damodaran 36
What if you do not buy back stock..
The optimal debt ratio is ultimately a function of the underlying riskiness ofthe business in which you operate and your tax rate.
Will the optimal be different if you invested in projects instead of buyingback stock?
• No. As long as the projects financed are in the same business mix that thecompany has always been in and your tax rate does not change significantly.
• Yes, if the projects are in entirely different types of businesses or if the tax rate issignificantly different.
Aswath Damodaran 37
Analyzing Financial Service Firms
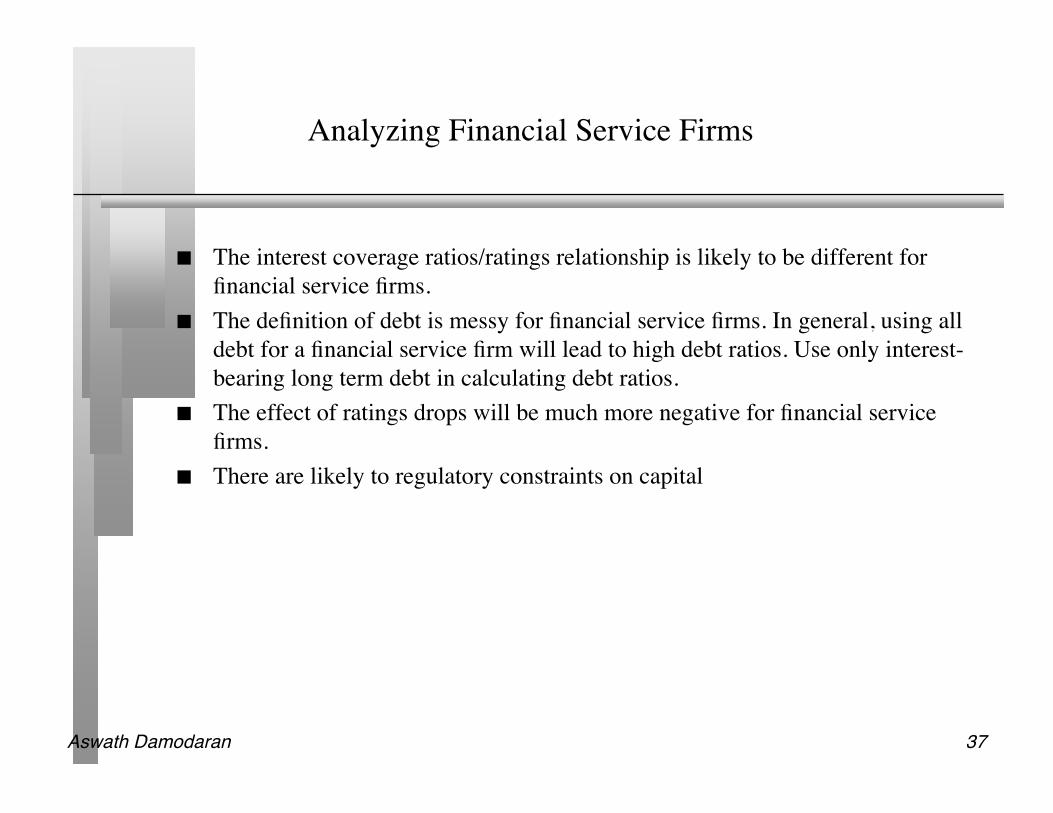
The interest coverage ratios/ratings relationship is likely to be different forfinancial service firms.
The definition of debt is messy for financial service firms. In general, using alldebt for a financial service firm will lead to high debt ratios. Use only interest-bearing long term debt in calculating debt ratios.
The effect of ratings drops will be much more negative for financial servicefirms.
There are likely to regulatory constraints on capital
Aswath Damodaran 38
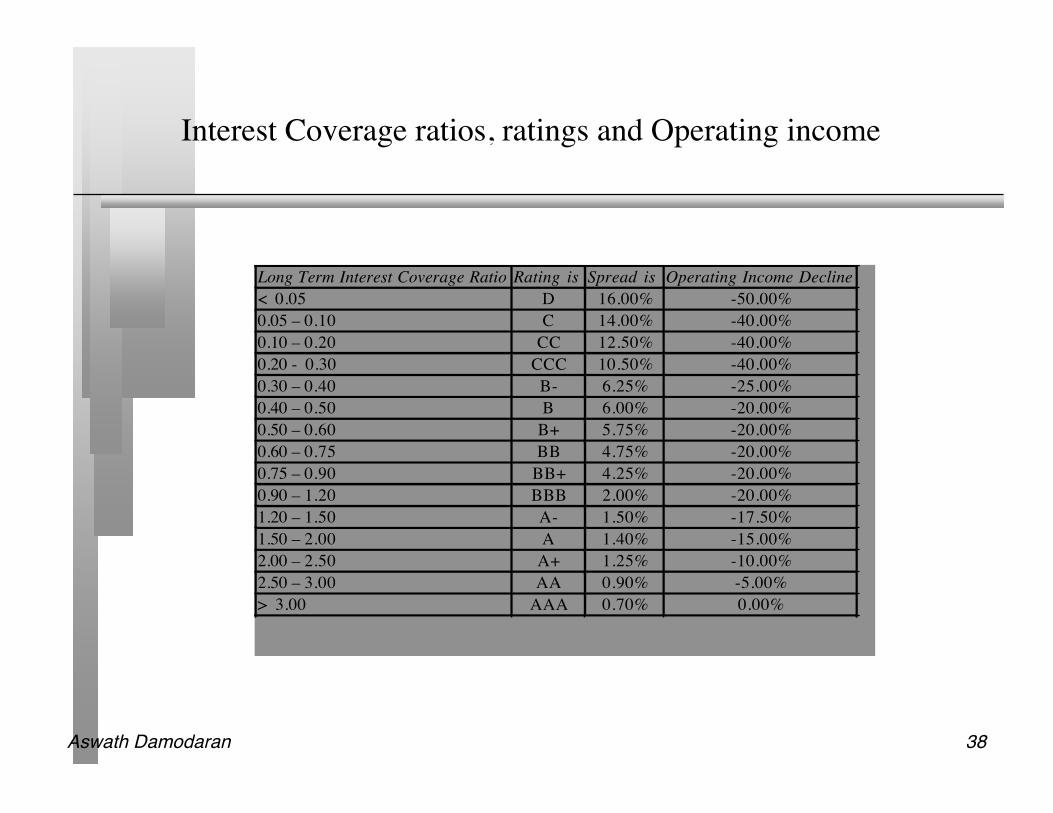
Interest Coverage ratios, ratings and Operating income
Long Term Interest Coverage Ratio Rating is Spread is Operating Income Decline
< 0.05 D 16.00% -50.00%
0.05 – 0.10 C 14.00% -40.00%
0.10 – 0.20 CC 12.50% -40.00%
0.20 - 0.30 CCC 10.50% -40.00%
0.30 – 0.40 B- 6.25% -25.00%
0.40 – 0.50 B 6.00% -20.00%
0.50 – 0.60 B+ 5.75% -20.00%
0.60 – 0.75 BB 4.75% -20.00%
0.75 – 0.90 BB+ 4.25% -20.00%
0.90 – 1.20 BBB 2.00% -20.00%
1.20 – 1.50 A- 1.50% -17.50%
1.50 – 2.00 A 1.40% -15.00%
2.00 – 2.50 A+ 1.25% -10.00%
2.50 – 3.00 AA 0.90% -5.00%
> 3.00 AAA 0.70% 0.00%
Aswath Damodaran 39
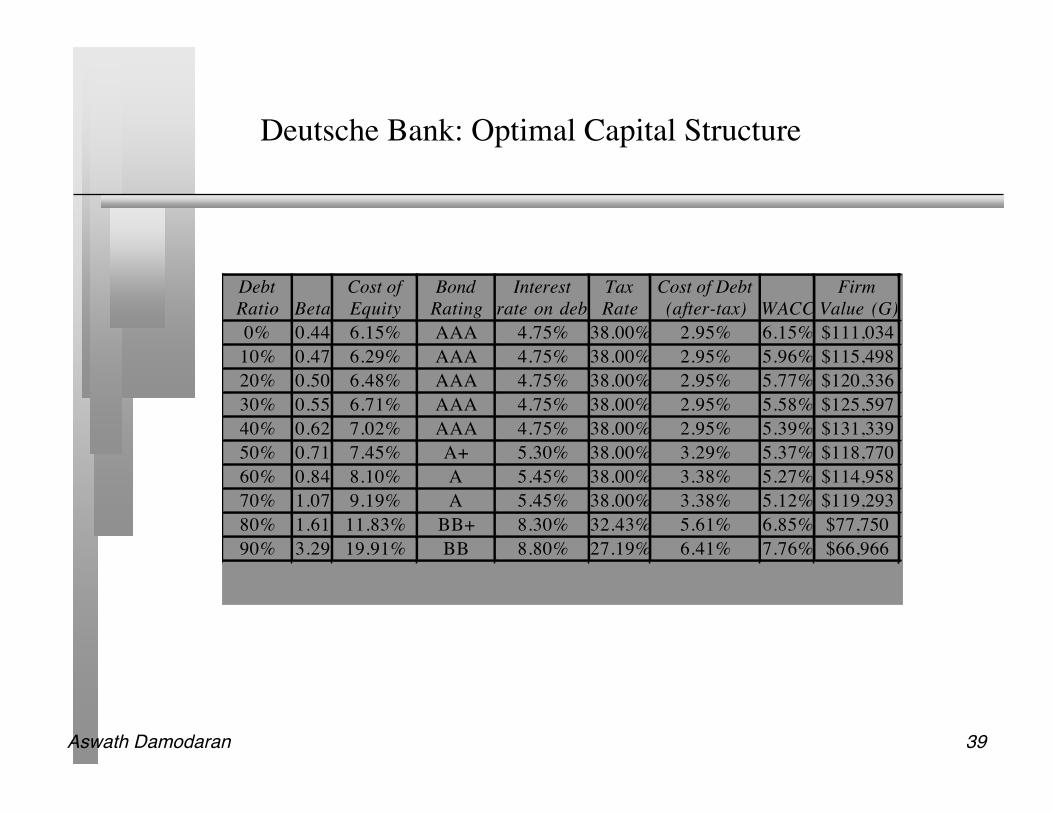
Deutsche Bank: Optimal Capital Structure
Debt
Ratio Beta
Cost of
Equity
Bond
Rating
Interest
rate on debt
Tax
Rate
Cost of Debt
(after-tax) WACC
Firm
Value (G)
0% 0.44 6.15% AAA 4.75% 38.00% 2.95% 6.15% $111,034
10% 0.47 6.29% AAA 4.75% 38.00% 2.95% 5.96% $115,498
20% 0.50 6.48% AAA 4.75% 38.00% 2.95% 5.77% $120,336
30% 0.55 6.71% AAA 4.75% 38.00% 2.95% 5.58% $125,597
40% 0.62 7.02% AAA 4.75% 38.00% 2.95% 5.39% $131,339
50% 0.71 7.45% A+ 5.30% 38.00% 3.29% 5.37% $118,770
60% 0.84 8.10% A 5.45% 38.00% 3.38% 5.27% $114,958
70% 1.07 9.19% A 5.45% 38.00% 3.38% 5.12% $119,293
80% 1.61 11.83% BB+ 8.30% 32.43% 5.61% 6.85% $77,750
90% 3.29 19.91% BB 8.80% 27.19% 6.41% 7.76% $66,966
Aswath Damodaran 40
Analyzing Companies after Abnormal Years
The operating income that should be used to arrive at an optimal debt ratio isa “normalized” operating income
A normalized operating income is the income that this firm would make in anormal year.
• For a cyclical firm, this may mean using the average operating income over aneconomic cycle rather than the latest year’s income
• For a firm which has had an exceptionally bad or good year (due to some firm-specific event), this may mean using industry average returns on capital to arrive atan optimal or looking at past years
• For any firm, this will mean not counting one time charges or profits
Aswath Damodaran 41
Analyzing Aracruz Cellulose’s Optimal Debt Ratio
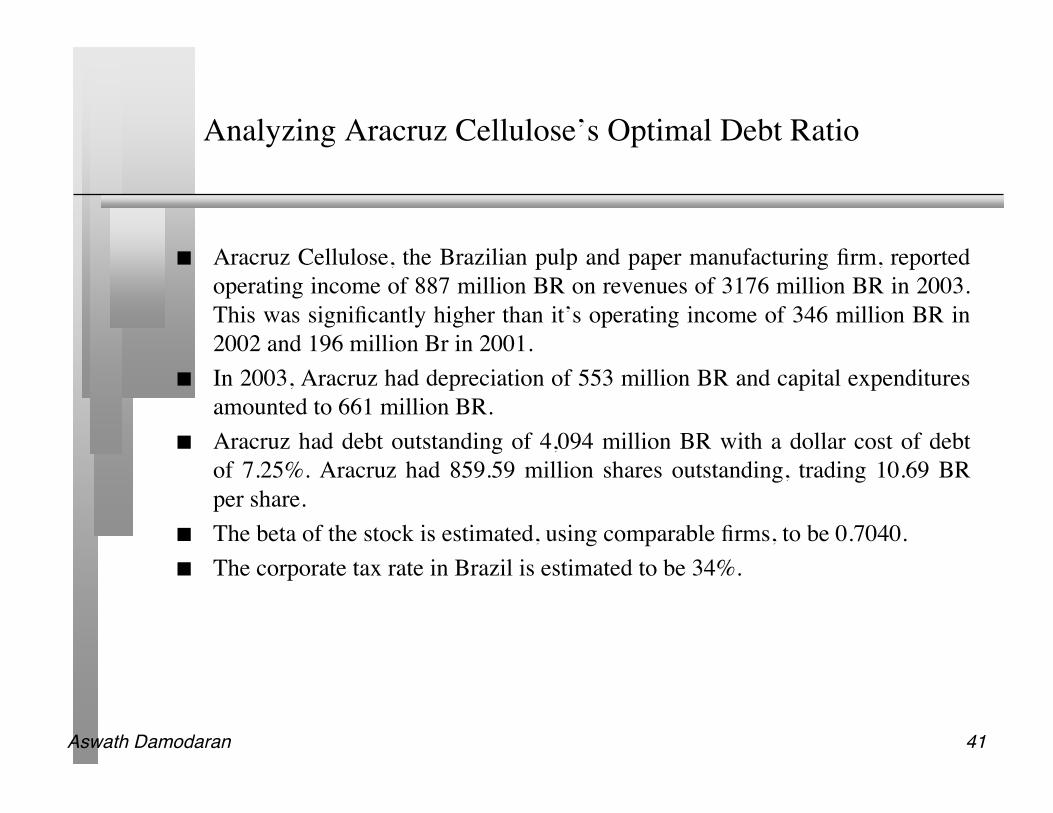
Aracruz Cellulose, the Brazilian pulp and paper manufacturing firm, reportedoperating income of 887 million BR on revenues of 3176 million BR in 2003.This was significantly higher than it’s operating income of 346 million BR in2002 and 196 million Br in 2001.
In 2003, Aracruz had depreciation of 553 million BR and capital expendituresamounted to 661 million BR.
Aracruz had debt outstanding of 4,094 million BR with a dollar cost of debtof 7.25%. Aracruz had 859.59 million shares outstanding, trading 10.69 BRper share.
The beta of the stock is estimated, using comparable firms, to be 0.7040. The corporate tax rate in Brazil is estimated to be 34%.
Aswath Damodaran 42
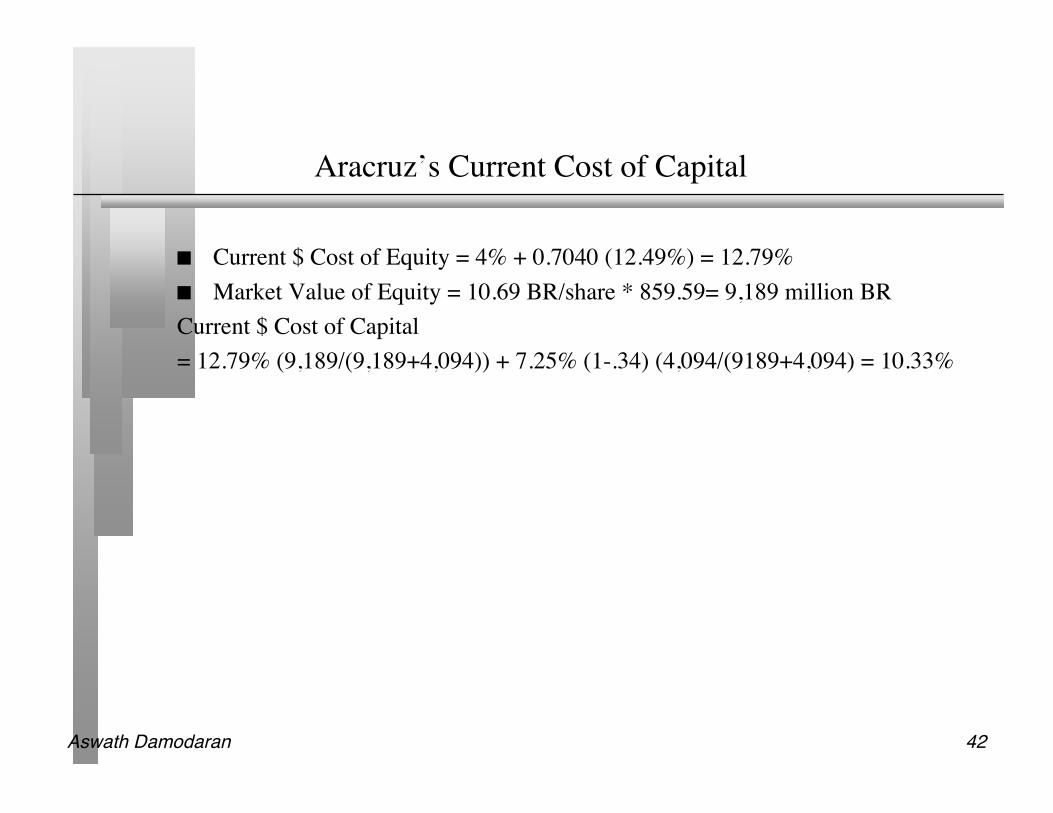
Aracruz’s Current Cost of Capital
Current $ Cost of Equity = 4% + 0.7040 (12.49%) = 12.79% Market Value of Equity = 10.69 BR/share * 859.59= 9,189 million BRCurrent $ Cost of Capital= 12.79% (9,189/(9,189+4,094)) + 7.25% (1-.34) (4,094/(9189+4,094) = 10.33%
Aswath Damodaran 43
Modifying the Cost of Capital Approach for Aracruz
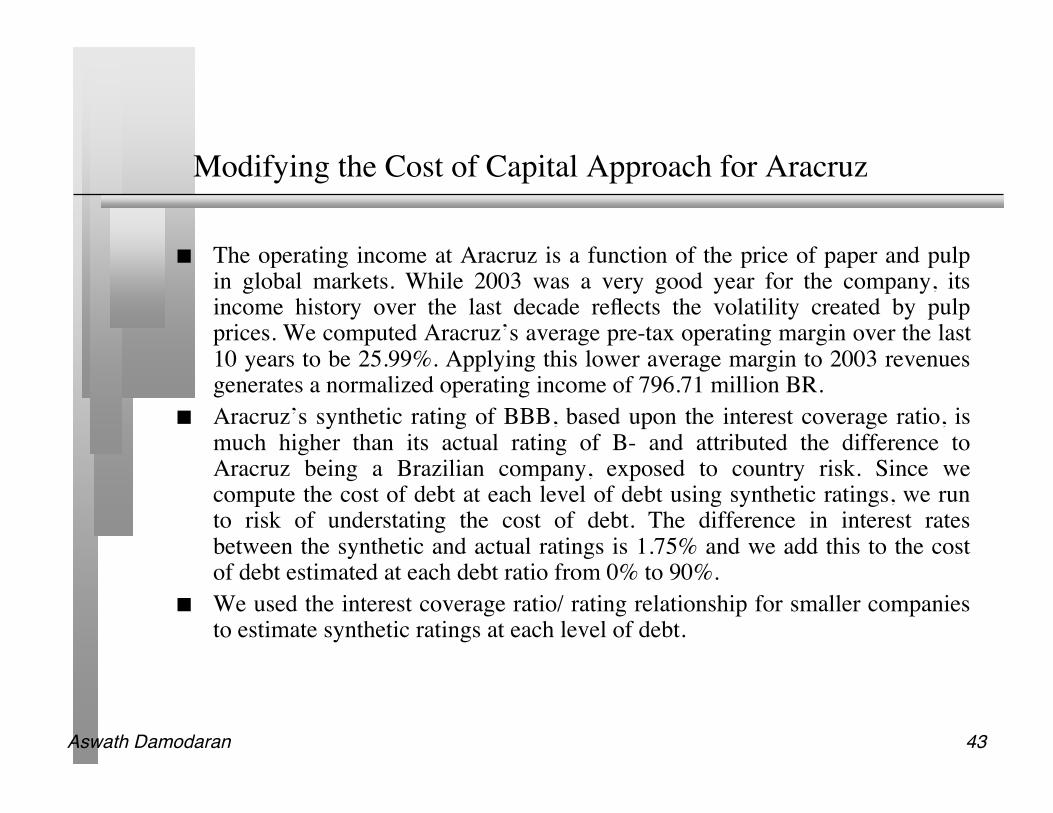
The operating income at Aracruz is a function of the price of paper and pulpin global markets. While 2003 was a very good year for the company, itsincome history over the last decade reflects the volatility created by pulpprices. We computed Aracruz’s average pre-tax operating margin over the last10 years to be 25.99%. Applying this lower average margin to 2003 revenuesgenerates a normalized operating income of 796.71 million BR.
Aracruz’s synthetic rating of BBB, based upon the interest coverage ratio, ismuch higher than its actual rating of B- and attributed the difference toAracruz being a Brazilian company, exposed to country risk. Since wecompute the cost of debt at each level of debt using synthetic ratings, we runto risk of understating the cost of debt. The difference in interest ratesbetween the synthetic and actual ratings is 1.75% and we add this to the costof debt estimated at each debt ratio from 0% to 90%.
We used the interest coverage ratio/ rating relationship for smaller companiesto estimate synthetic ratings at each level of debt.

Aswath Damodaran 44
Aracruz’s Optimal Debt Ratio
Debt
Ratio Beta
Cost of
Equity
Bond
Rating
Interest
rate on debt
Tax
Rate
Cost of
Debt (after-
tax) WACC
Firm
Value in BR
0% 0.54 10.80% AAA 6.10% 34.00% 4.03% 10.80% 12,364
10% 0.58 11.29% AAA 6.10% 34.00% 4.03% 10.57% 12,794
20% 0.63 11.92% A 6.60% 34.00% 4.36% 10.40% 13,118
30% 0.70 12.72% BBB 7.25% 34.00% 4.79% 10.34% 13,256
40% 0.78 13.78% CCC 13.75% 34.00% 9.08% 11.90% 10,633
50% 0.93 15.57% CCC 13.75% 29.66% 9.67% 12.62% 9,743
60% 1.20 19.04% C 17.75% 19.15% 14.35% 16.23% 6,872
70% 1.61 24.05% C 17.75% 16.41% 14.84% 17.60% 6,177
80% 2.41 34.07% C 17.75% 14.36% 15.20% 18.98% 5,610
90% 4.82 64.14% C 17.75% 12.77% 15.48% 20.35% 5,138
Aswath Damodaran 45
Analyzing a Private Firm
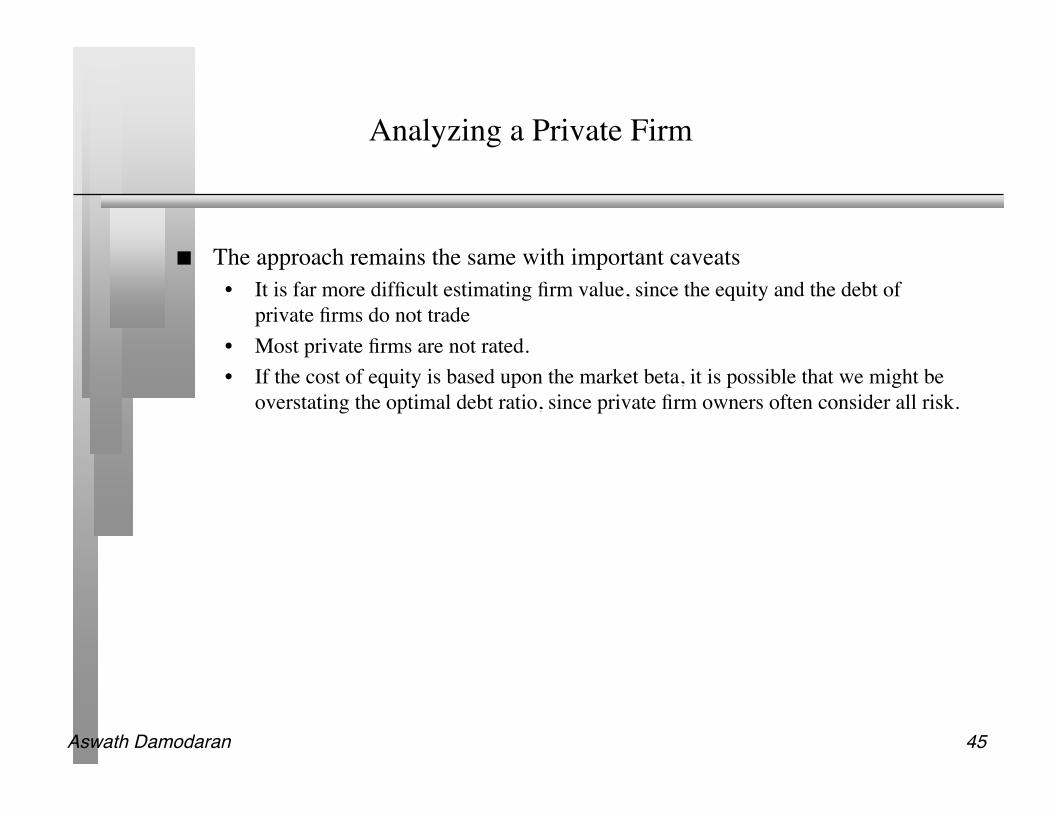
The approach remains the same with important caveats• It is far more difficult estimating firm value, since the equity and the debt of
private firms do not trade• Most private firms are not rated.• If the cost of equity is based upon the market beta, it is possible that we might be
overstating the optimal debt ratio, since private firm owners often consider all risk.
Aswath Damodaran 46
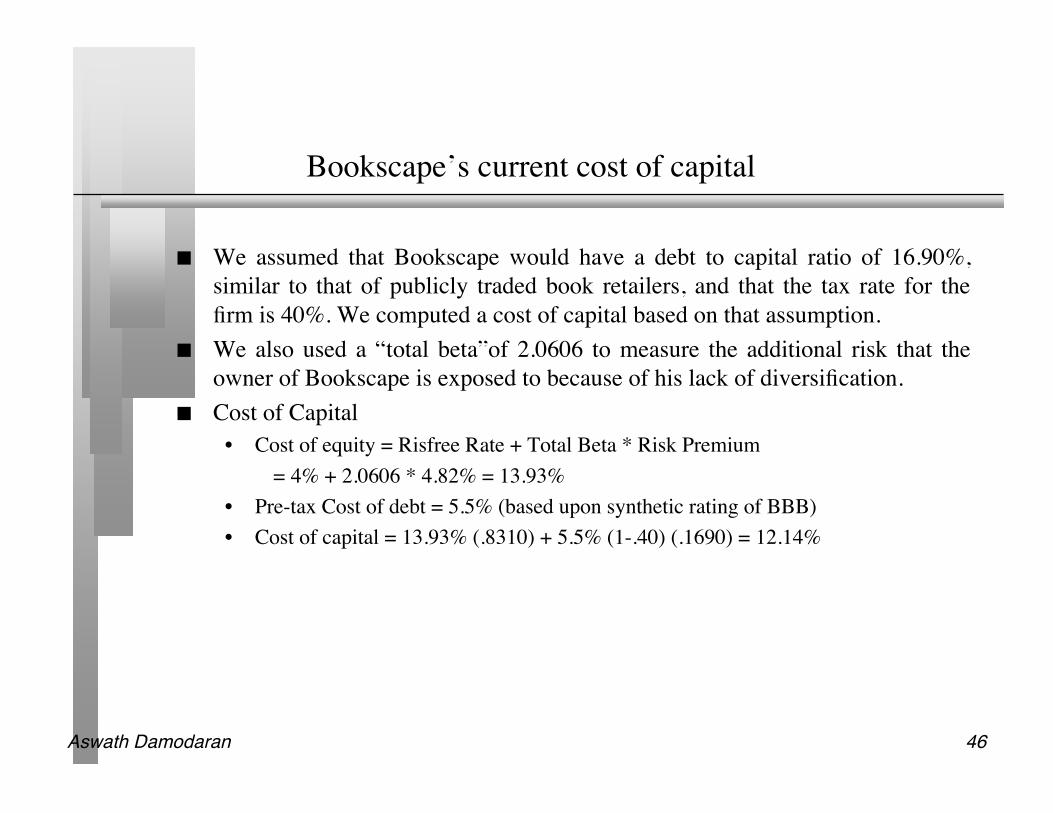
Bookscape’s current cost of capital
We assumed that Bookscape would have a debt to capital ratio of 16.90%,similar to that of publicly traded book retailers, and that the tax rate for thefirm is 40%. We computed a cost of capital based on that assumption.
We also used a “total beta”of 2.0606 to measure the additional risk that theowner of Bookscape is exposed to because of his lack of diversification.
Cost of Capital• Cost of equity = Risfree Rate + Total Beta * Risk Premium
= 4% + 2.0606 * 4.82% = 13.93%• Pre-tax Cost of debt = 5.5% (based upon synthetic rating of BBB)• Cost of capital = 13.93% (.8310) + 5.5% (1-.40) (.1690) = 12.14%
Aswath Damodaran 47
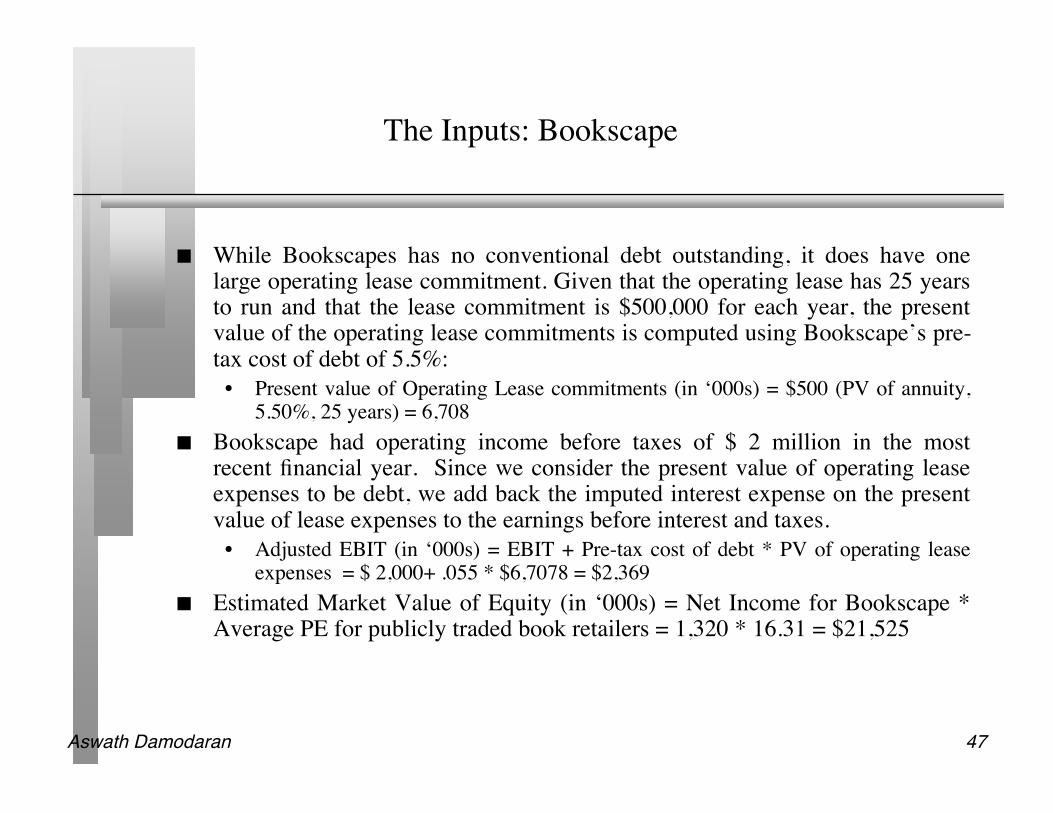
The Inputs: Bookscape
While Bookscapes has no conventional debt outstanding, it does have onelarge operating lease commitment. Given that the operating lease has 25 yearsto run and that the lease commitment is $500,000 for each year, the presentvalue of the operating lease commitments is computed using Bookscape’s pre-tax cost of debt of 5.5%:
• Present value of Operating Lease commitments (in ‘000s) = $500 (PV of annuity,5.50%, 25 years) = 6,708
Bookscape had operating income before taxes of $ 2 million in the mostrecent financial year. Since we consider the present value of operating leaseexpenses to be debt, we add back the imputed interest expense on the presentvalue of lease expenses to the earnings before interest and taxes.
• Adjusted EBIT (in ‘000s) = EBIT + Pre-tax cost of debt * PV of operating leaseexpenses = $ 2,000+ .055 * $6,7078 = $2,369
Estimated Market Value of Equity (in ‘000s) = Net Income for Bookscape *Average PE for publicly traded book retailers = 1,320 * 16.31 = $21,525
Aswath Damodaran 48
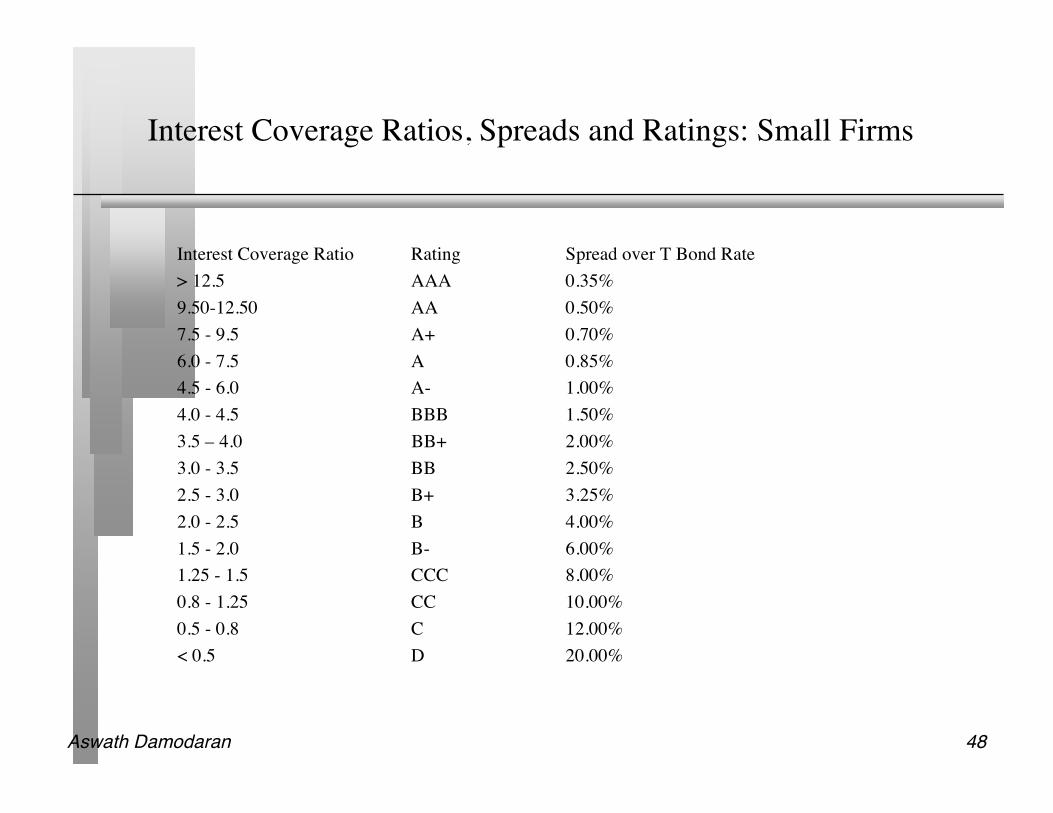
Interest Coverage Ratios, Spreads and Ratings: Small Firms
Interest Coverage Ratio Rating Spread over T Bond Rate> 12.5 AAA 0.35%9.50-12.50 AA 0.50%7.5 - 9.5 A+ 0.70%6.0 - 7.5 A 0.85%4.5 - 6.0 A- 1.00%4.0 - 4.5 BBB 1.50%3.5 – 4.0 BB+ 2.00%3.0 - 3.5 BB 2.50%2.5 - 3.0 B+ 3.25%2.0 - 2.5 B 4.00%1.5 - 2.0 B- 6.00%1.25 - 1.5 CCC 8.00%0.8 - 1.25 CC 10.00%0.5 - 0.8 C 12.00%< 0.5 D 20.00%
Aswath Damodaran 49
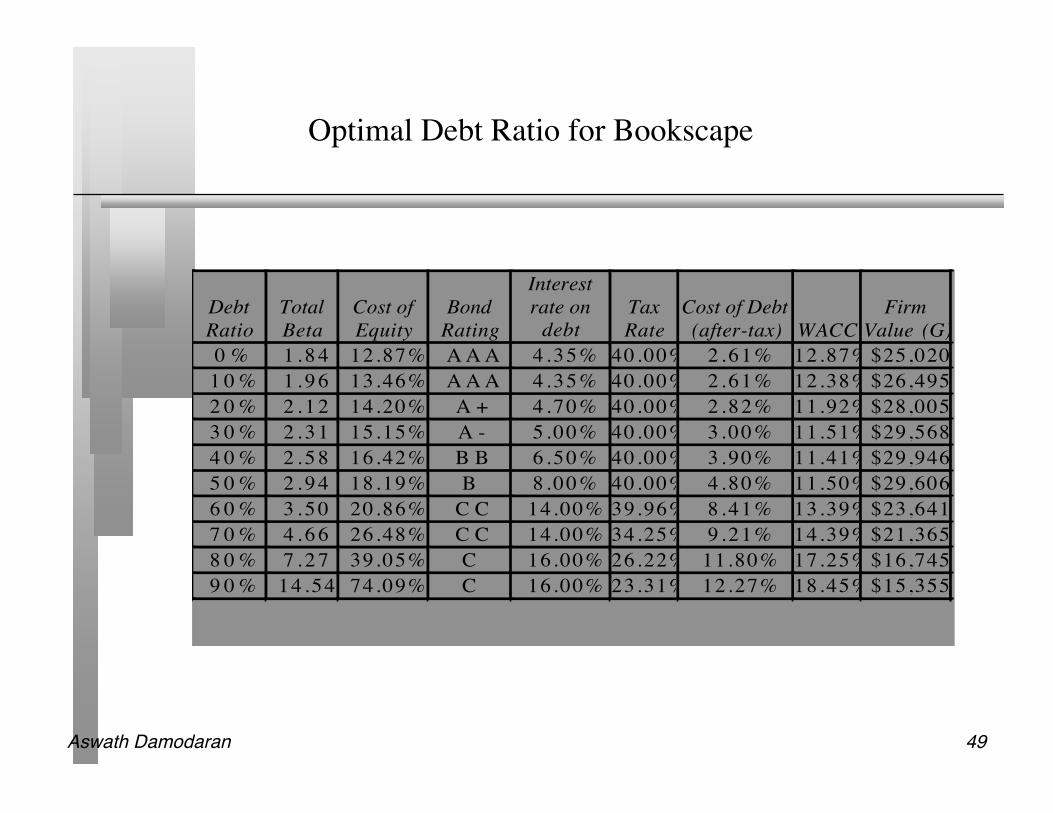
Optimal Debt Ratio for Bookscape
Debt
Ratio
Total
Beta
Cost of
Equity
Bond
Rating
Interest
rate on
debt
Tax
Rate
Cost of Debt
(after-tax) WACC
Firm
Value (G)
0 % 1 . 8 4 12.87% A A A 4 .35% 40.00% 2 .61% 12.87% $25,020
1 0 % 1 . 9 6 13.46% A A A 4 .35% 40.00% 2 .61% 12.38% $26,495
2 0 % 2 . 1 2 14.20% A + 4 .70% 40.00% 2 .82% 11.92% $28,005
3 0 % 2 . 3 1 15.15% A - 5 .00% 40.00% 3 .00% 11.51% $29,568
4 0 % 2 . 5 8 16.42% B B 6 .50% 40.00% 3 .90% 11.41% $29,946
5 0 % 2 . 9 4 18.19% B 8 .00% 40.00% 4 .80% 11.50% $29,606
6 0 % 3 . 5 0 20.86% C C 14.00% 39.96% 8 .41% 13.39% $23,641
7 0 % 4 . 6 6 26.48% C C 14.00% 34.25% 9 .21% 14.39% $21,365
8 0 % 7 . 2 7 39.05% C 16.00% 26.22% 11.80% 17.25% $16,745
9 0 % 14.54 74.09% C 16.00% 23.31% 12.27% 18.45% $15,355
Aswath Damodaran 50
Determinants of Optimal Debt Ratios
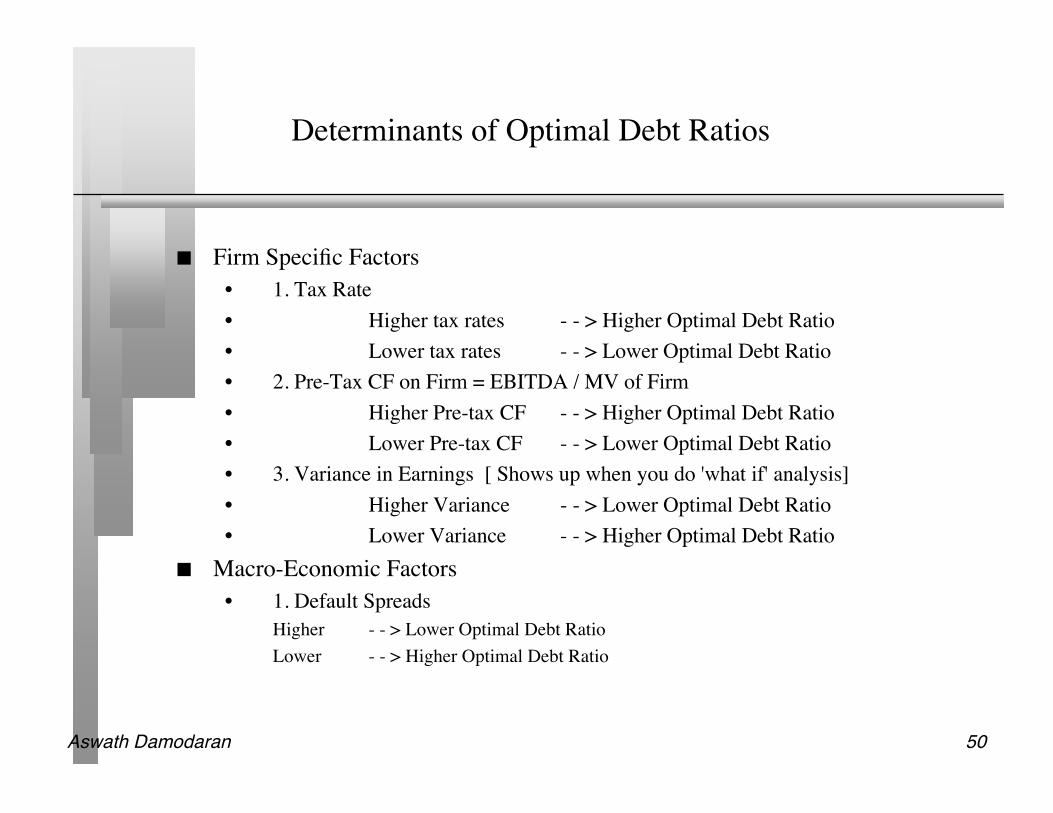
Firm Specific Factors• 1. Tax Rate• Higher tax rates - - > Higher Optimal Debt Ratio• Lower tax rates - - > Lower Optimal Debt Ratio• 2. Pre-Tax CF on Firm = EBITDA / MV of Firm• Higher Pre-tax CF - - > Higher Optimal Debt Ratio• Lower Pre-tax CF - - > Lower Optimal Debt Ratio• 3. Variance in Earnings [ Shows up when you do 'what if' analysis]• Higher Variance - - > Lower Optimal Debt Ratio• Lower Variance - - > Higher Optimal Debt Ratio
Macro-Economic Factors• 1. Default Spreads
Higher - - > Lower Optimal Debt RatioLower - - > Higher Optimal Debt Ratio
Aswath Damodaran 51
Application Test: Your firm’s optimal financing mix
Using the optimal capital structure spreadsheet provided:• Estimate the optimal debt ratio for your firm• Estimate the new cost of capital at the optimal• Estimate the effect of the change in the cost of capital on firm value• Estimate the effect on the stock price
In terms of the mechanics, what would you need to do to get to the optimalimmediately?
Aswath Damodaran 52
II. The APV Approach to Optimal Capital Structure
In the adjusted present value approach, the value of the firm is written as thesum of the value of the firm without debt (the unlevered firm) and the effectof debt on firm value
Firm Value = Unlevered Firm Value + (Tax Benefits of Debt - ExpectedBankruptcy Cost from the Debt)
The optimal dollar debt level is the one that maximizes firm value
Aswath Damodaran 53
Implementing the APV Approach
Step 1: Estimate the unlevered firm value. This can be done in one of twoways:1. Estimating the unlevered beta, a cost of equity based upon the unlevered beta and
valuing the firm using this cost of equity (which will also be the cost of capital,with an unlevered firm)
2. Alternatively, Unlevered Firm Value = Current Market Value of Firm - TaxBenefits of Debt (Current) + Expected Bankruptcy cost from Debt
Step 2: Estimate the tax benefits at different levels of debt. The simplestassumption to make is that the savings are perpetual, in which case• Tax benefits = Dollar Debt * Tax Rate
Step 3: Estimate a probability of bankruptcy at each debt level, and multiplyby the cost of bankruptcy (including both direct and indirect costs) toestimate the expected bankruptcy cost.
Aswath Damodaran 54
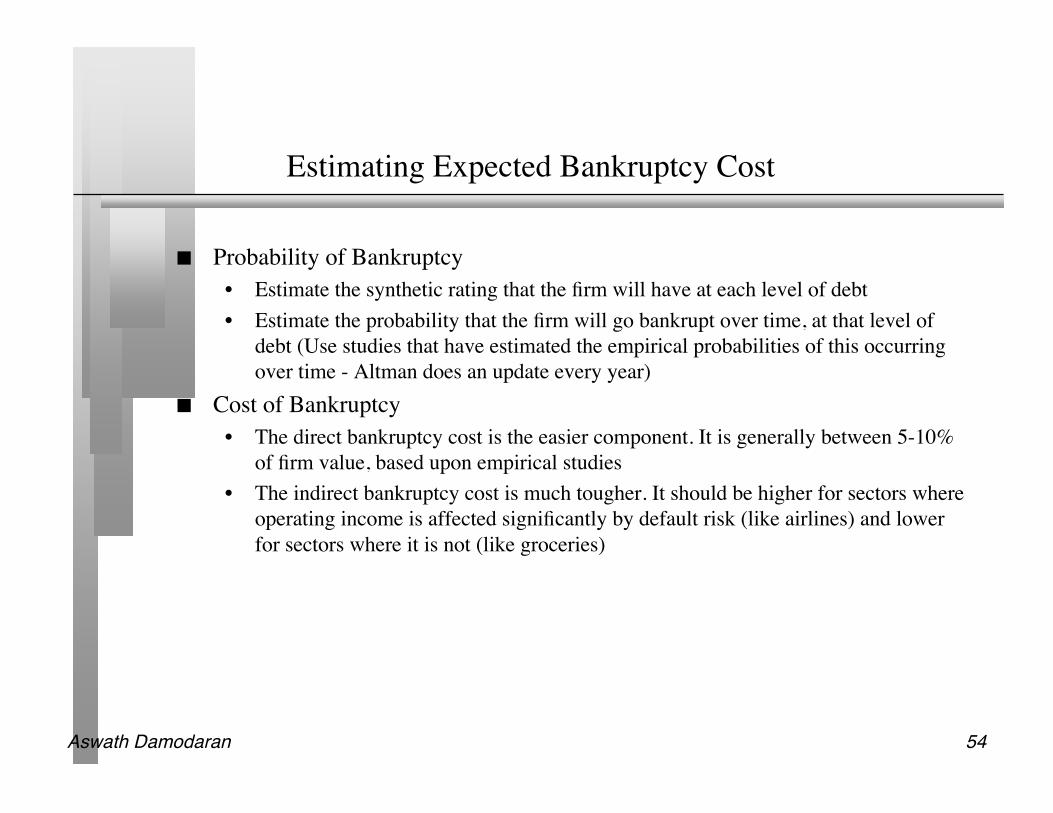
Estimating Expected Bankruptcy Cost
Probability of Bankruptcy• Estimate the synthetic rating that the firm will have at each level of debt• Estimate the probability that the firm will go bankrupt over time, at that level of
debt (Use studies that have estimated the empirical probabilities of this occurringover time - Altman does an update every year)
Cost of Bankruptcy• The direct bankruptcy cost is the easier component. It is generally between 5-10%
of firm value, based upon empirical studies• The indirect bankruptcy cost is much tougher. It should be higher for sectors where
operating income is affected significantly by default risk (like airlines) and lowerfor sectors where it is not (like groceries)
Aswath Damodaran 55
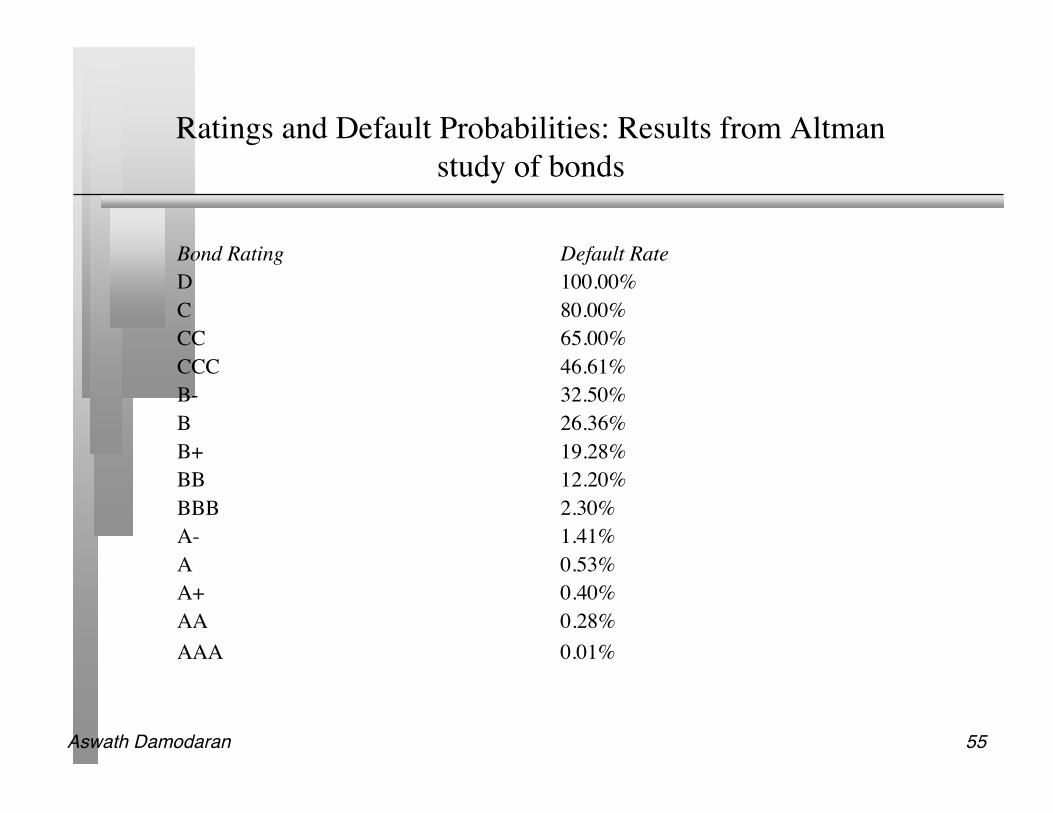
Ratings and Default Probabilities: Results from Altmanstudy of bonds
Bond Rating Default RateD 100.00%C 80.00%CC 65.00%CCC 46.61%B- 32.50%B 26.36%B+ 19.28%BB 12.20%BBB 2.30%A- 1.41%A 0.53%A+ 0.40%AA 0.28%AAA 0.01%
Aswath Damodaran 56
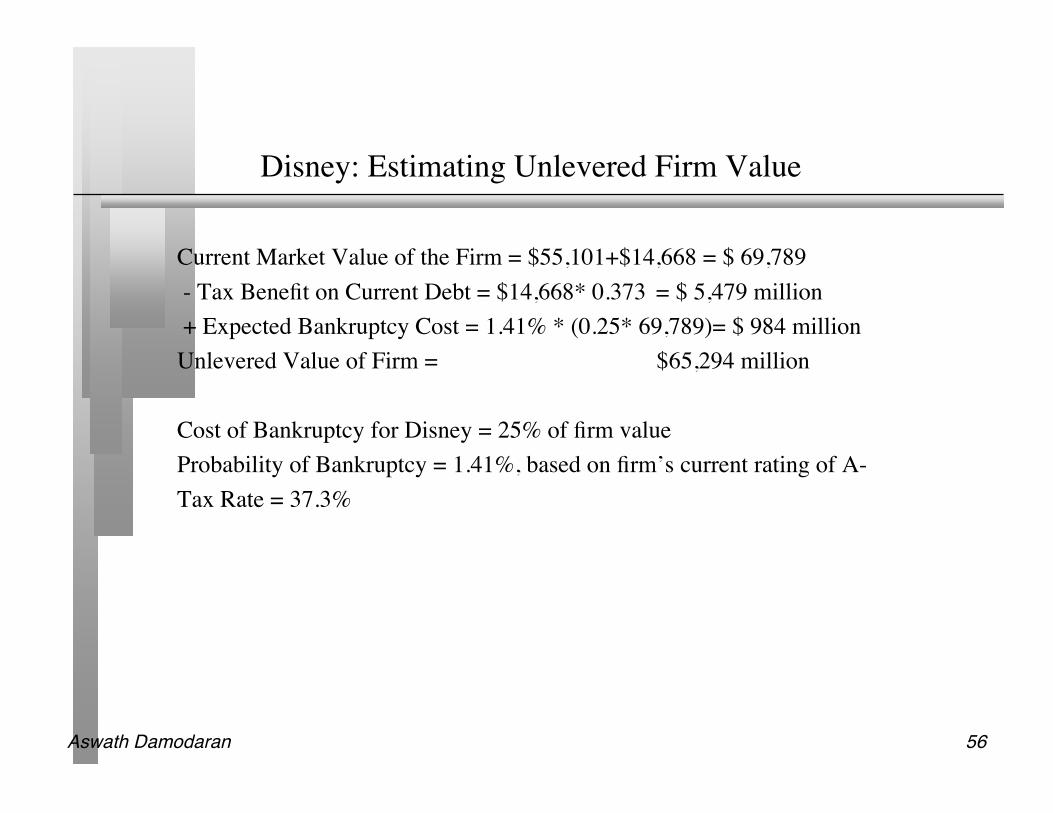
Disney: Estimating Unlevered Firm Value
Current Market Value of the Firm = $55,101+$14,668 = $ 69,789 - Tax Benefit on Current Debt = $14,668* 0.373 = $ 5,479 million + Expected Bankruptcy Cost = 1.41% * (0.25* 69,789)= $ 984 millionUnlevered Value of Firm = $65,294 million
Cost of Bankruptcy for Disney = 25% of firm valueProbability of Bankruptcy = 1.41%, based on firm’s current rating of A-Tax Rate = 37.3%
Aswath Damodaran 57
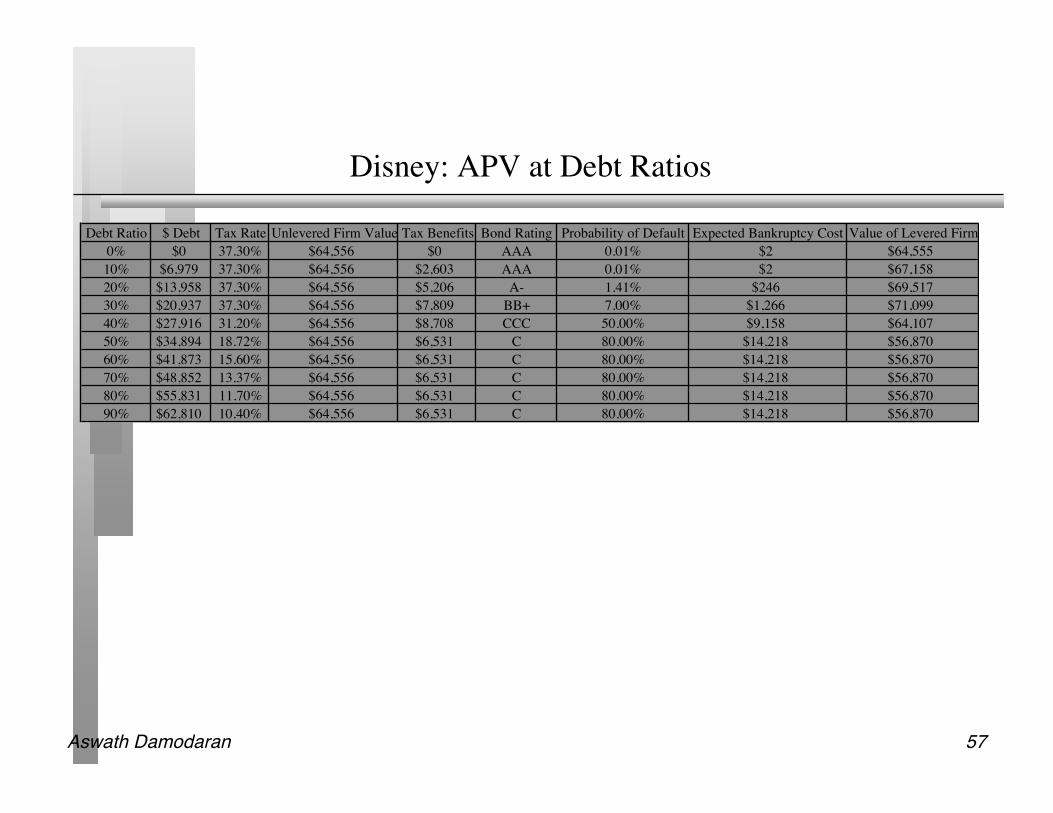
Disney: APV at Debt Ratios
Debt Ratio $ Debt Tax Rate Unlevered Firm Value Tax Benefits Bond Rating Probability of Default Expected Bankruptcy Cost Value of Levered Firm
0% $0 37.30% $64,556 $0 AAA 0.01% $2 $64,555
10% $6,979 37.30% $64,556 $2,603 AAA 0.01% $2 $67,158
20% $13,958 37.30% $64,556 $5,206 A- 1.41% $246 $69,517
30% $20,937 37.30% $64,556 $7,809 BB+ 7.00% $1,266 $71,099
40% $27,916 31.20% $64,556 $8,708 CCC 50.00% $9,158 $64,107
50% $34,894 18.72% $64,556 $6,531 C 80.00% $14,218 $56,870
60% $41,873 15.60% $64,556 $6,531 C 80.00% $14,218 $56,870
70% $48,852 13.37% $64,556 $6,531 C 80.00% $14,218 $56,870
80% $55,831 11.70% $64,556 $6,531 C 80.00% $14,218 $56,870
90% $62,810 10.40% $64,556 $6,531 C 80.00% $14,218 $56,870
Aswath Damodaran 58
III. Relative Analysis
I. Industry Average with Subjective Adjustments The “safest” place for any firm to be is close to the industry average Subjective adjustments can be made to these averages to arrive at the right
debt ratio.• Higher tax rates -> Higher debt ratios (Tax benefits)• Lower insider ownership -> Higher debt ratios (Greater discipline)• More stable income -> Higher debt ratios (Lower bankruptcy costs)• More intangible assets -> Lower debt ratios (More agency problems)
Aswath Damodaran 59
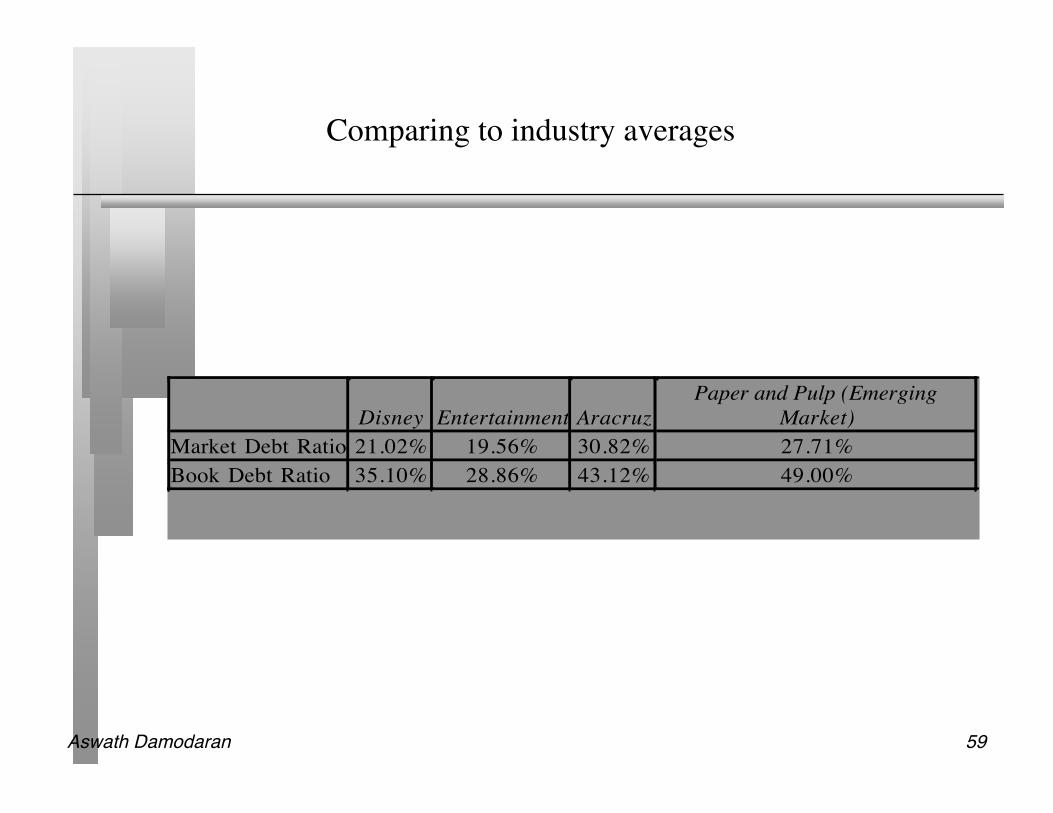
Comparing to industry averages
Disney Entertainment Aracruz
Paper and Pulp (Emerging
Market)
Market Debt Ratio 21.02% 19.56% 30.82% 27.71%
Book Debt Ratio 35.10% 28.86% 43.12% 49.00%
Aswath Damodaran 60
Getting past simple averages: Using Statistics
Step 1: Run a regression of debt ratios on the variables that you believedetermine debt ratios in the sector. For example,Debt Ratio = a + b (Tax rate) + c (Earnings Variability) + d (EBITDA/FirmValue)
Step 2: Estimate the proxies for the firm under consideration. Plugging intothe cross sectional regression, we can obtain an estimate of predicted debtratio.
Step 3: Compare the actual debt ratio to the predicted debt ratio.
Aswath Damodaran 61
Applying the Regression Methodology: Entertainment Firms
Using a sample of entertainment firms, we arrived at the following regression:Debt/Capital = 0.2156 - 0.1826 (Sales Growth) + 0.6797 (EBITDA/ Value)
(4.91) (1.91) (2.05) The R squared of the regression is 14%. This regression can be used to arrive
at a predicted value for Disney of:Predicted Debt Ratio = 0.2156 - 0.1826 (.0668) + 0.6797 (.0767) = 0.2555 or
25.55%Based upon the capital structure of other firms in the entertainment industry,
Disney should have a market value debt ratio of 25.55%.
Aswath Damodaran 62
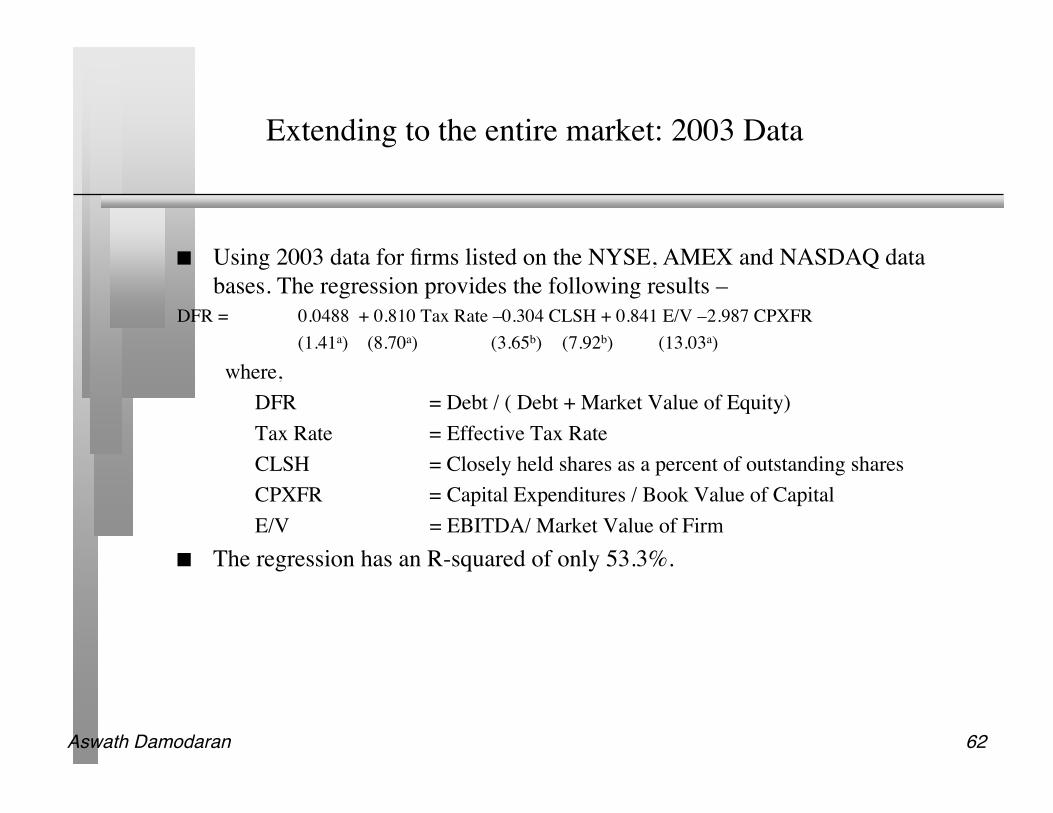
Extending to the entire market: 2003 Data
Using 2003 data for firms listed on the NYSE, AMEX and NASDAQ databases. The regression provides the following results –
DFR = 0.0488 + 0.810 Tax Rate –0.304 CLSH + 0.841 E/V –2.987 CPXFR(1.41a) (8.70a) (3.65b) (7.92b) (13.03a)
where,DFR = Debt / ( Debt + Market Value of Equity)Tax Rate = Effective Tax RateCLSH = Closely held shares as a percent of outstanding sharesCPXFR = Capital Expenditures / Book Value of CapitalE/V = EBITDA/ Market Value of Firm
The regression has an R-squared of only 53.3%.
Aswath Damodaran 63
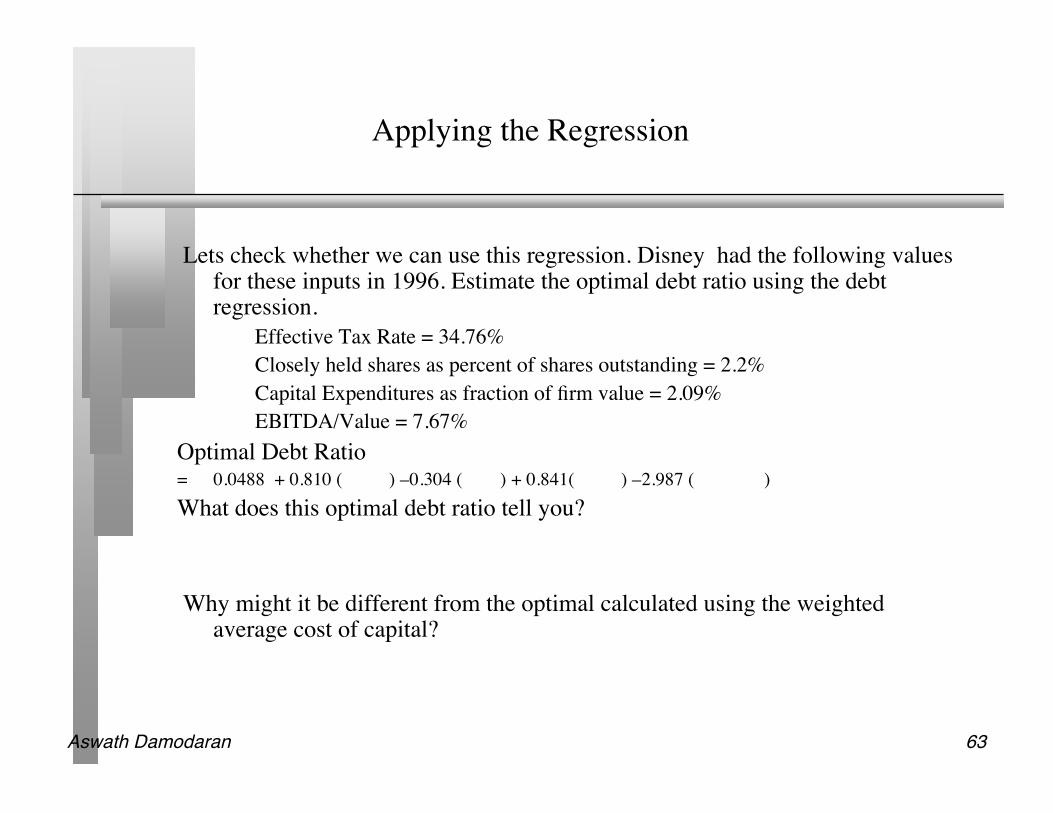
Applying the Regression
Lets check whether we can use this regression. Disney had the following valuesfor these inputs in 1996. Estimate the optimal debt ratio using the debtregression.
Effective Tax Rate = 34.76%Closely held shares as percent of shares outstanding = 2.2%Capital Expenditures as fraction of firm value = 2.09%EBITDA/Value = 7.67%
Optimal Debt Ratio= 0.0488 + 0.810 ( ) –0.304 ( ) + 0.841( ) –2.987 ( )What does this optimal debt ratio tell you?
Why might it be different from the optimal calculated using the weightedaverage cost of capital?
Aswath Damodaran 64
Stage 2
Rapid Expansion
Stage 1
Start-up
Stage 4
Mature Growth
Stage 5
Decline
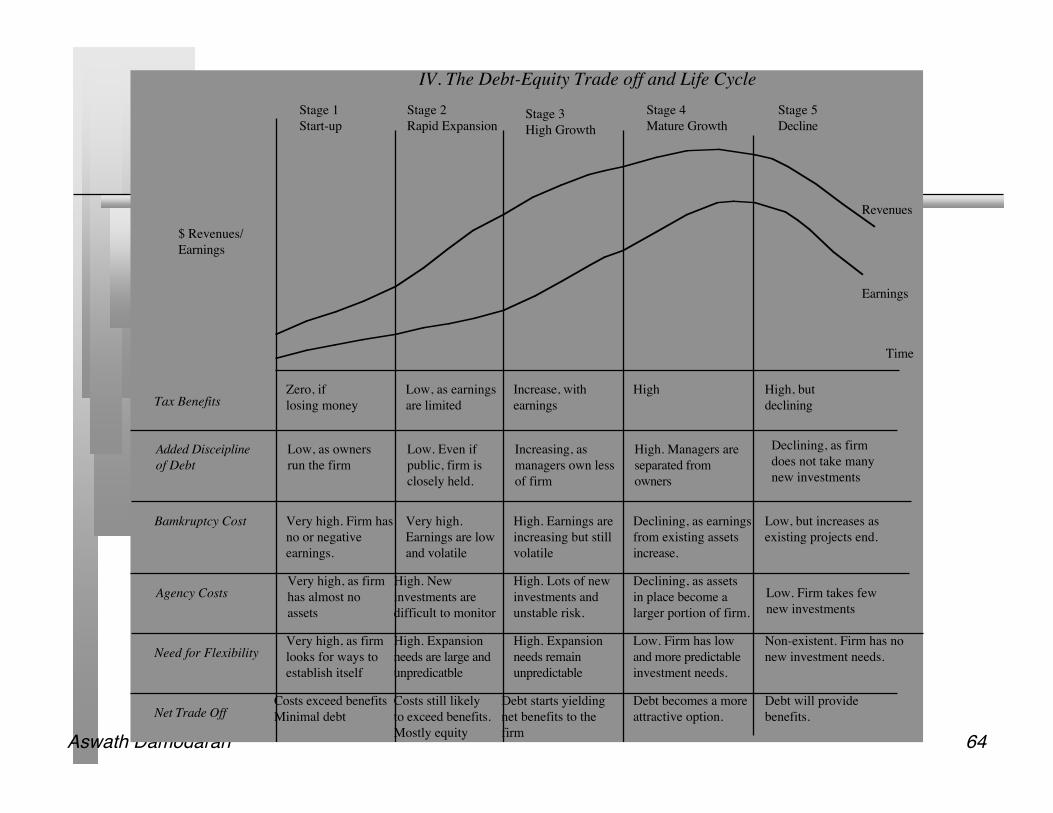
IV. The Debt-Equity Trade off and Life Cycle
Time
Agency Costs
Revenues
Earnings
Very high, as firm
has almost no
assets
Low. Firm takes few
new investments
Added Disceipline
of Debt
Low, as owners
run the firm
Low. Even if
public, firm is
closely held.
Increasing, as
managers own less
of firm
High. Managers are
separated from
owners
Bamkruptcy Cost
Declining, as firm
does not take many
new investments
Stage 3
High Growth
Net Trade Off
Need for Flexibility
$ Revenues/
Earnings
Tax BenefitsZero, if
losing money
Low, as earnings
are limited
Increase, with
earnings
High High, but
declining
Very high. Firm has
no or negative
earnings.
Very high.
Earnings are low
and volatile
High. Earnings are
increasing but still
volatile
Declining, as earnings
from existing assets
increase.
Low, but increases as
existing projects end.
High. New
investments are
difficult to monitor
High. Lots of new
investments and
unstable risk.
Declining, as assets
in place become a
larger portion of firm.
Very high, as firm
looks for ways to
establish itself
High. Expansion
needs are large and
unpredicatble
High. Expansion
needs remain
unpredictable
Low. Firm has low
and more predictable
investment needs.
Non-existent. Firm has no
new investment needs.
Costs exceed benefits
Minimal debt
Costs still likely
to exceed benefits.
Mostly equity
Debt starts yielding
net benefits to the
firm
Debt becomes a more
attractive option.
Debt will provide
benefits.
Aswath Damodaran 65
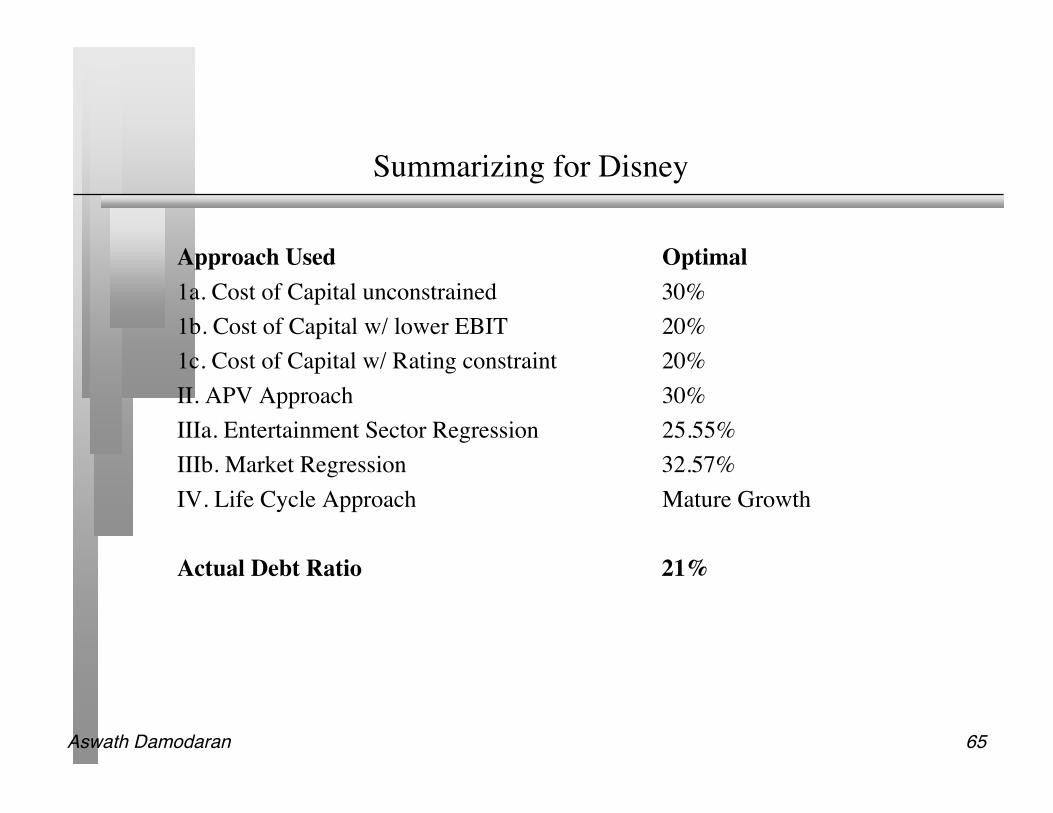
Summarizing for Disney
Approach Used Optimal1a. Cost of Capital unconstrained 30%1b. Cost of Capital w/ lower EBIT 20%1c. Cost of Capital w/ Rating constraint 20%II. APV Approach 30%IIIa. Entertainment Sector Regression 25.55%IIIb. Market Regression 32.57%IV. Life Cycle Approach Mature Growth
Actual Debt Ratio 21%
Aswath Damodaran 66
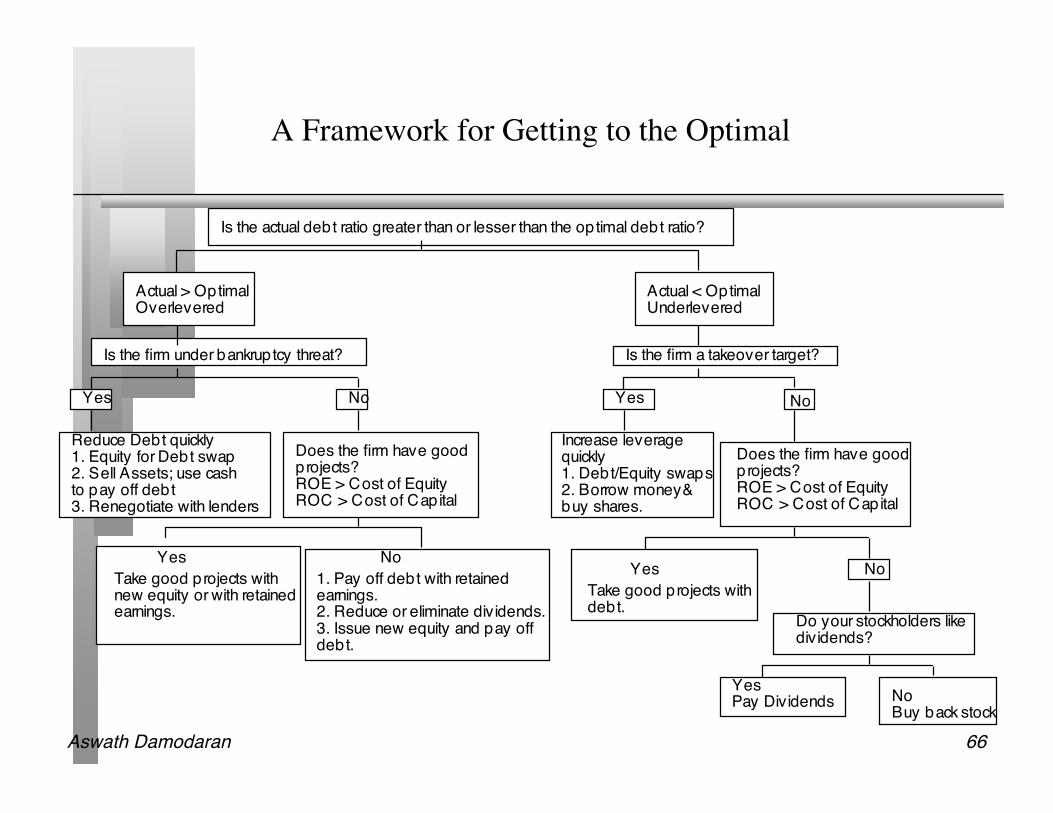
A Framework for Getting to the Optimal
Is the actual debt ratio greater than or lesser than the optimal debt ratio?
Actual > OptimalOverlevered
Actual < OptimalUnderlevered
Is the firm under bankruptcy threat? Is the firm a takeover target?
Yes No
Reduce Debt quickly1. Equity for Debt swap2. Sell Assets; use cashto pay off debt3. Renegotiate with lenders
Does the firm have good projects?ROE > Cost of EquityROC > Cost of Capital
YesTake good projects withnew equity or with retainedearnings.
No1. Pay off debt with retainedearnings.2. Reduce or eliminate dividends.3. Issue new equity and pay off debt.
Yes No
Does the firm have good projects?ROE > Cost of EquityROC > Cost of Capital
YesTake good projects withdebt.
No
Do your stockholders likedividends?
YesPay Dividends No
Buy back stock
Increase leveragequickly1. Debt/Equity swaps2. Borrow money&buy shares.
Aswath Damodaran 67
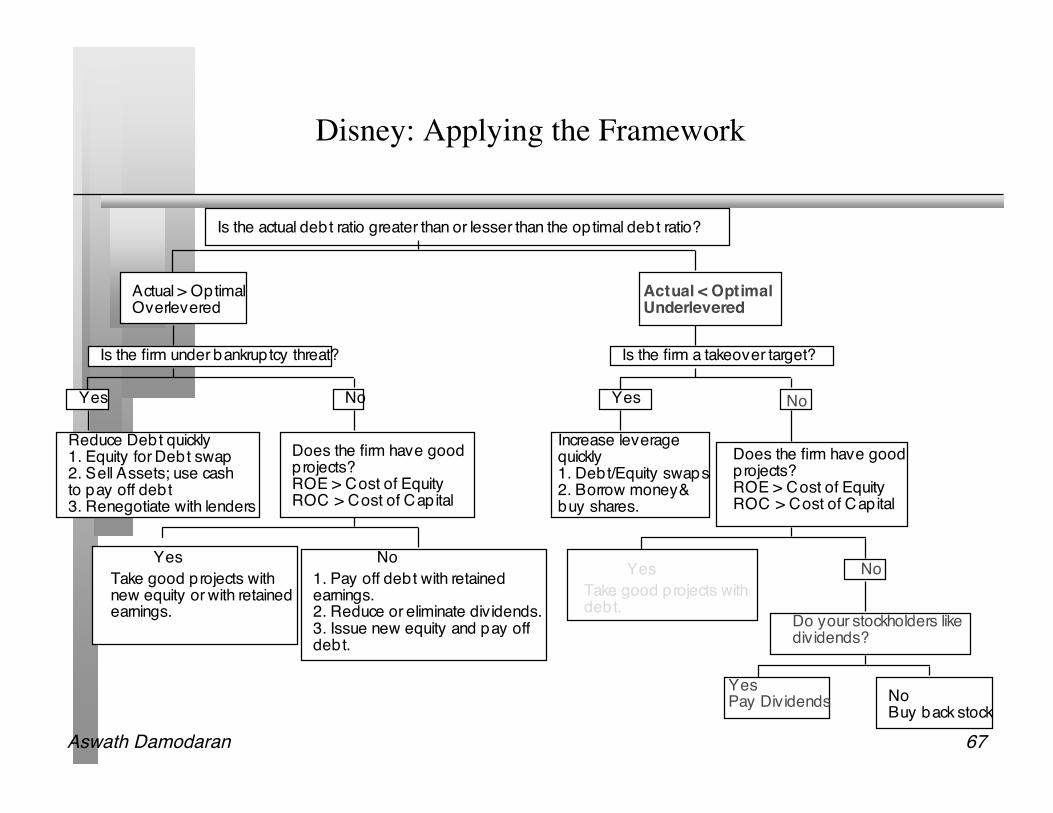
Disney: Applying the Framework
Is the actual debt ratio greater than or lesser than the optimal debt ratio?
Actual > OptimalOverlevered
Actual < OptimalUnderlevered
Is the firm under bankruptcy threat? Is the firm a takeover target?
Yes No
Reduce Debt quickly1. Equity for Debt swap2. Sell Assets; use cashto pay off debt3. Renegotiate with lenders
Does the firm have good projects?ROE > Cost of EquityROC > Cost of Capital
YesTake good projects withnew equity or with retainedearnings.
No1. Pay off debt with retainedearnings.2. Reduce or eliminate dividends.3. Issue new equity and pay off debt.
Yes No
Does the firm have good projects?ROE > Cost of EquityROC > Cost of Capital
YesTake good projects withdebt.
No
Do your stockholders likedividends?
YesPay Dividends No
Buy back stock
Increase leveragequickly1. Debt/Equity swaps2. Borrow money&buy shares.
Aswath Damodaran 68
Application Test: Getting to the Optimal
Based upon your analysis of both the firm’s capital structure and investmentrecord, what path would you map out for the firm?
Immediate change in leverage Gradual change in leverage No change in leverage Would you recommend that the firm change its financing mix by Paying off debt/Buying back equity Take projects with equity/debt