Finding the Right Financing Mix: The Capital Structure ...adamodar/pdfiles/cfovhds/capstrN.pdf ·...
125
Aswath Damodaran 2 Finding the Right Financing Mix: The Capital Structure Decision
Transcript of Finding the Right Financing Mix: The Capital Structure ...adamodar/pdfiles/cfovhds/capstrN.pdf ·...

Aswath Damodaran 2
Finding the Right Financing Mix: TheCapital Structure Decision
Aswath Damodaran 3
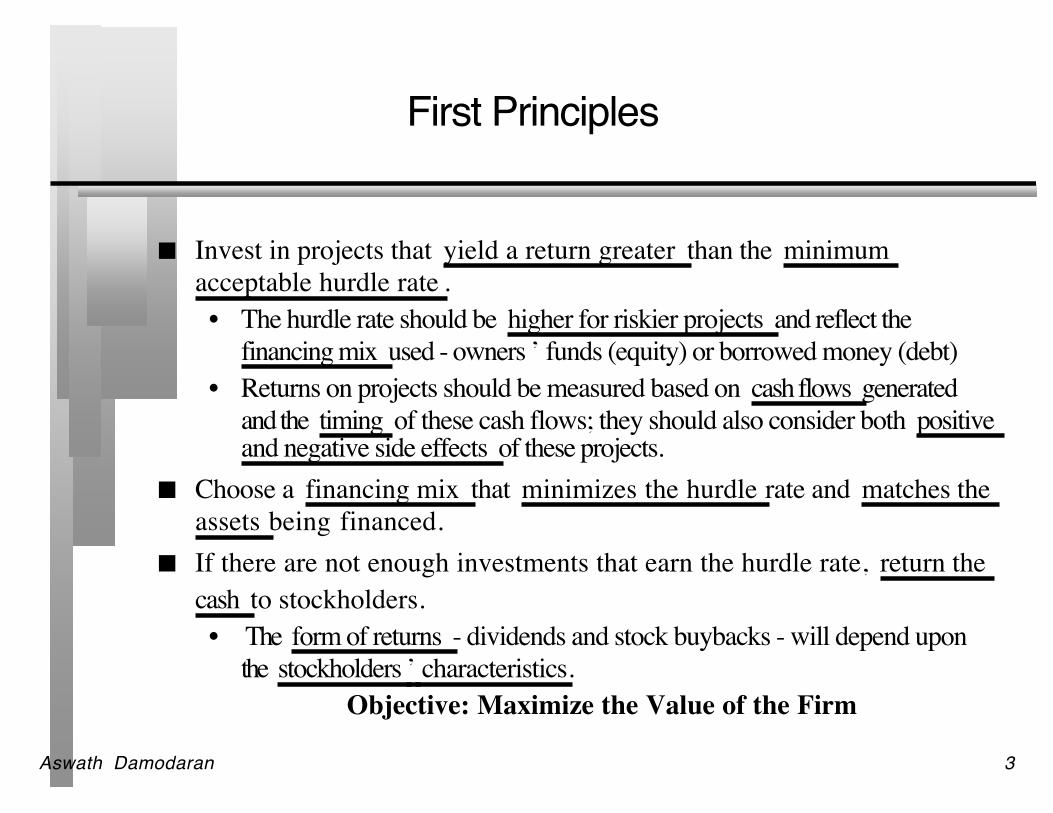
First Principles
Invest in projects that yield a return greater than the minimumacceptable hurdle rate .• The hurdle rate should be higher for riskier projects and reflect the
financing mix used - owners ’ funds (equity) or borrowed money (debt)• Returns on projects should be measured based on cash flows generated
and the timing of these cash flows; they should also consider both positiveand negative side effects of these projects.
Choose a financing mix that minimizes the hurdle rate and matches theassets being financed.
If there are not enough investments that earn the hurdle rate, return thecash to stockholders.• The form of returns - dividends and stock buybacks - will depend upon
the stockholders ’ characteristics.Objective: Maximize the Value of the Firm
Aswath Damodaran 4
The Choices in Financing
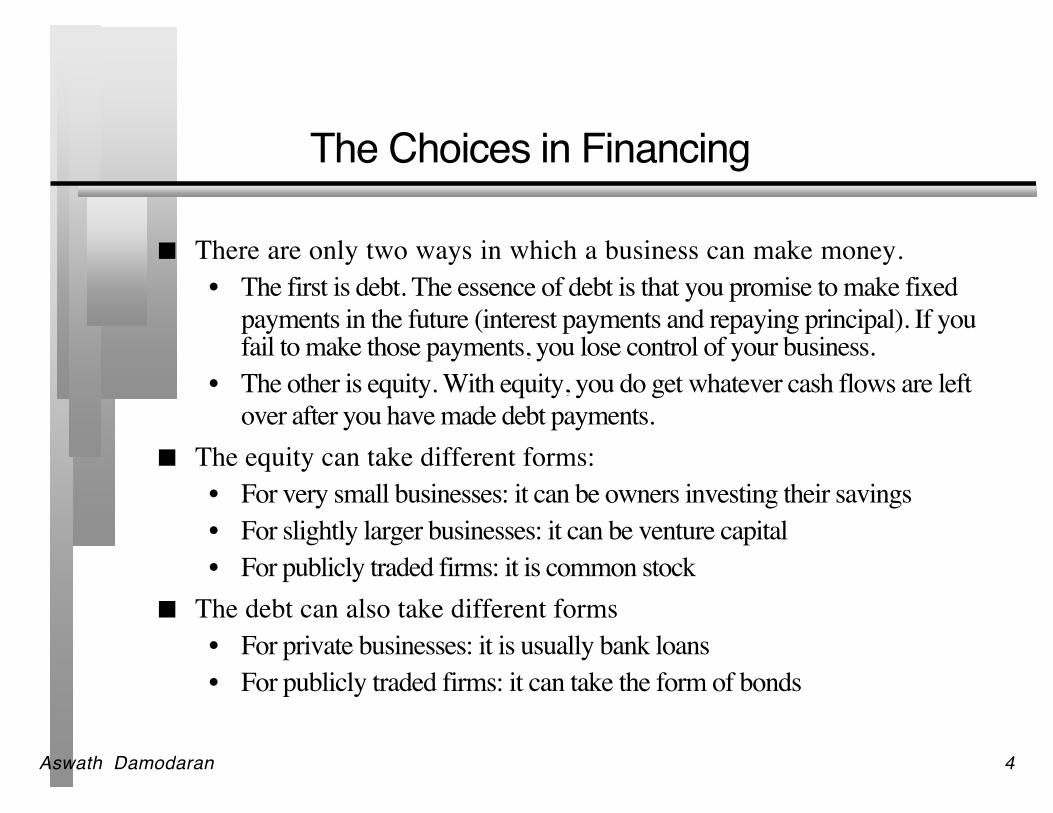
There are only two ways in which a business can make money.• The first is debt. The essence of debt is that you promise to make fixed
payments in the future (interest payments and repaying principal). If youfail to make those payments, you lose control of your business.
• The other is equity. With equity, you do get whatever cash flows are leftover after you have made debt payments.
The equity can take different forms:• For very small businesses: it can be owners investing their savings• For slightly larger businesses: it can be venture capital• For publicly traded firms: it is common stock
The debt can also take different forms• For private businesses: it is usually bank loans• For publicly traded firms: it can take the form of bonds
Aswath Damodaran 5
The Financing Mix Question
In deciding to raise financing for a business, is there an optimal mix ofdebt and equity?• If yes, what is the trade off that lets us determine this optimal mix?• If not, why not?
Aswath Damodaran 6
Measuring a firm’s financing mix
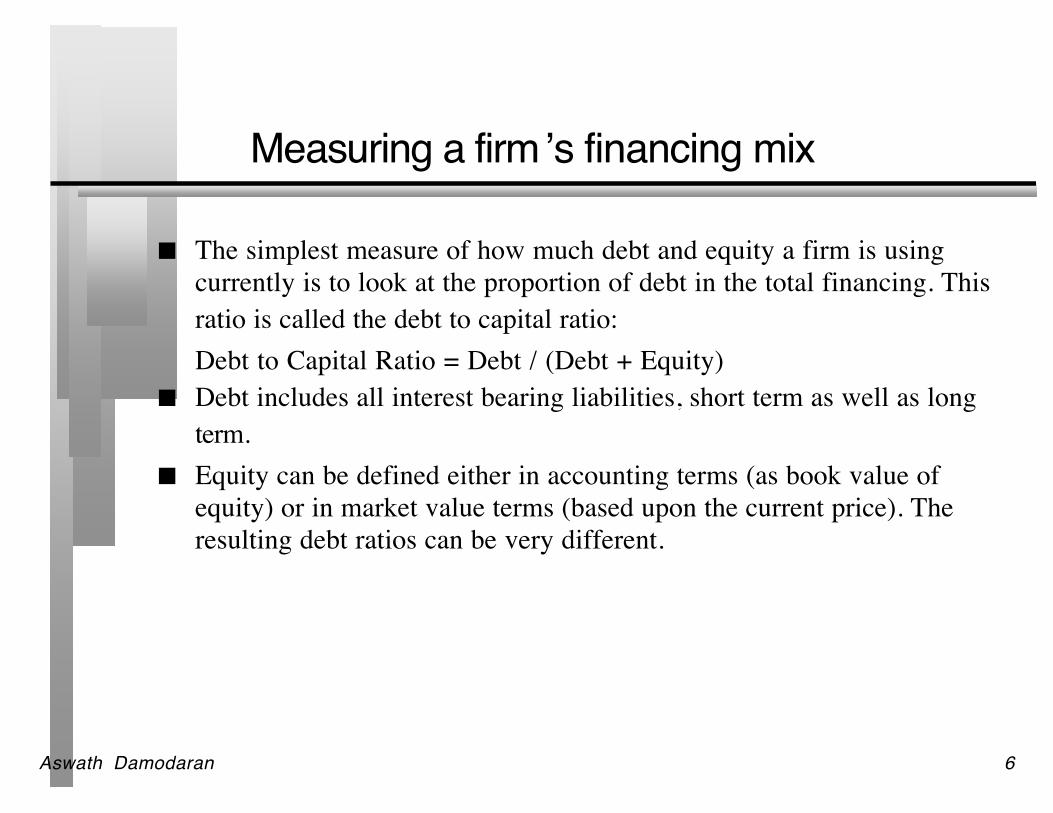
The simplest measure of how much debt and equity a firm is usingcurrently is to look at the proportion of debt in the total financing. Thisratio is called the debt to capital ratio:Debt to Capital Ratio = Debt / (Debt + Equity)
Debt includes all interest bearing liabilities, short term as well as longterm.
Equity can be defined either in accounting terms (as book value ofequity) or in market value terms (based upon the current price). Theresulting debt ratios can be very different.

Aswath Damodaran 7
Costs and Benefits of Debt
Benefits of Debt• Tax Benefits• Adds discipline to management
Costs of Debt• Bankruptcy Costs• Agency Costs• Loss of Future Flexibility
Aswath Damodaran 8
Tax Benefits of Debt
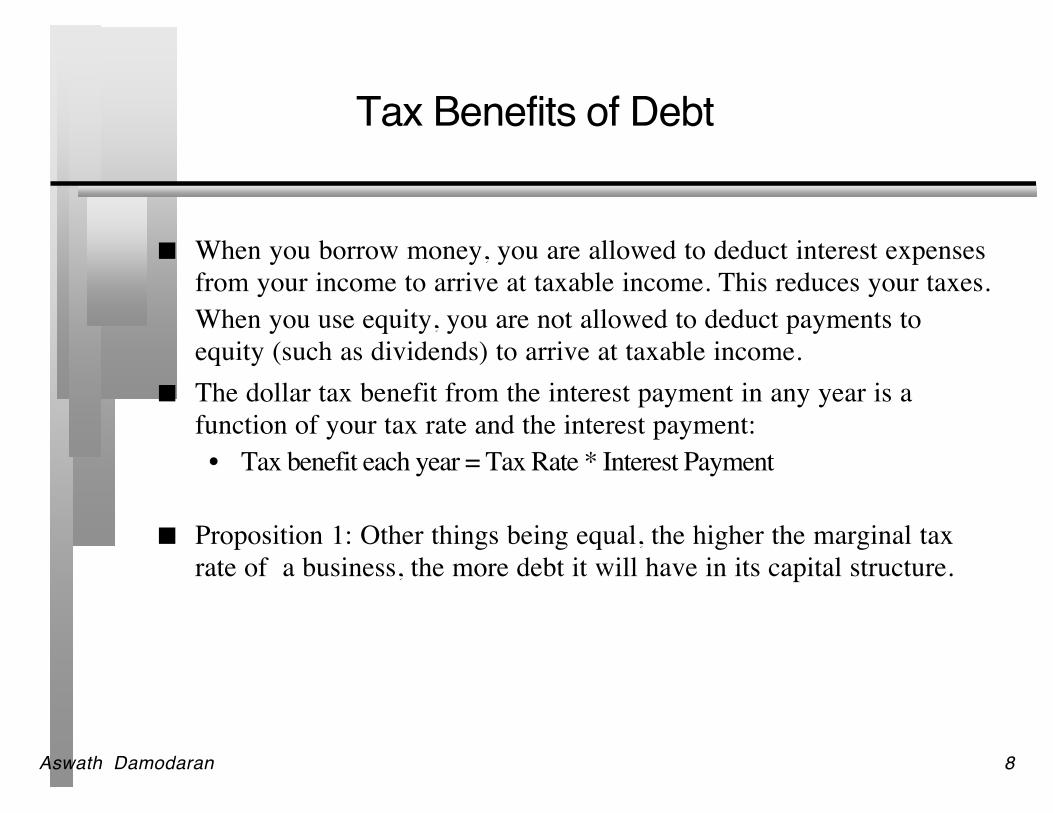
When you borrow money, you are allowed to deduct interest expensesfrom your income to arrive at taxable income. This reduces your taxes.When you use equity, you are not allowed to deduct payments toequity (such as dividends) to arrive at taxable income.
The dollar tax benefit from the interest payment in any year is afunction of your tax rate and the interest payment:• Tax benefit each year = Tax Rate * Interest Payment
Proposition 1: Other things being equal, the higher the marginal taxrate of a business, the more debt it will have in its capital structure.
Aswath Damodaran 9
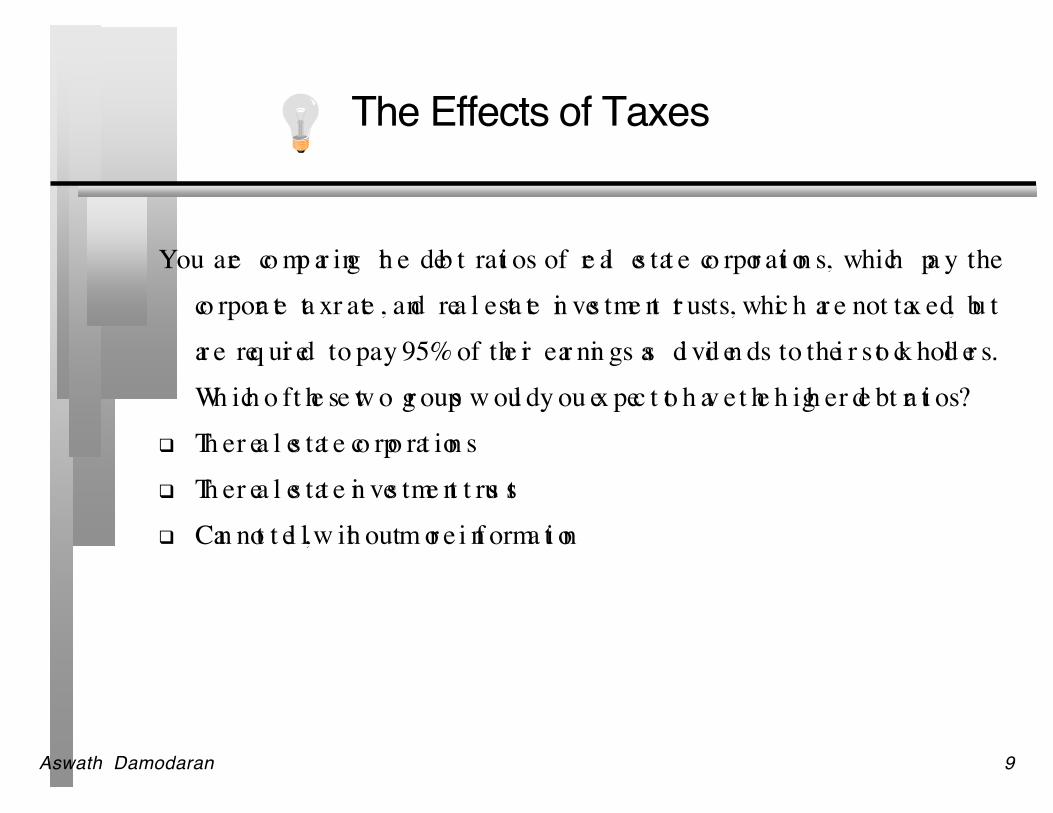
The Effects of Taxes
You are co mp ar ing th e deb t rati os of re al es tat e co rpor ati on s, which pa y theco rpora te ta x r ate , and rea l esta te in ves tme nt tr usts, whic h ar e not tax ed, bu tar e req uir ed to pay 95% of the ir ear nin gs as di vid en ds to thei r s to ck hold er s.Wh ich o f t he se tw o gr oups w oul d y ou ex pec t to h av e t he h igh er de bt ra ti os?
Th e r ea l es tat e co rpo rat ion s Th e r ea l es tat e in ves tme nt t rus ts Can not t el l, w ith out m or e i nf orma ti on
Aswath Damodaran 10
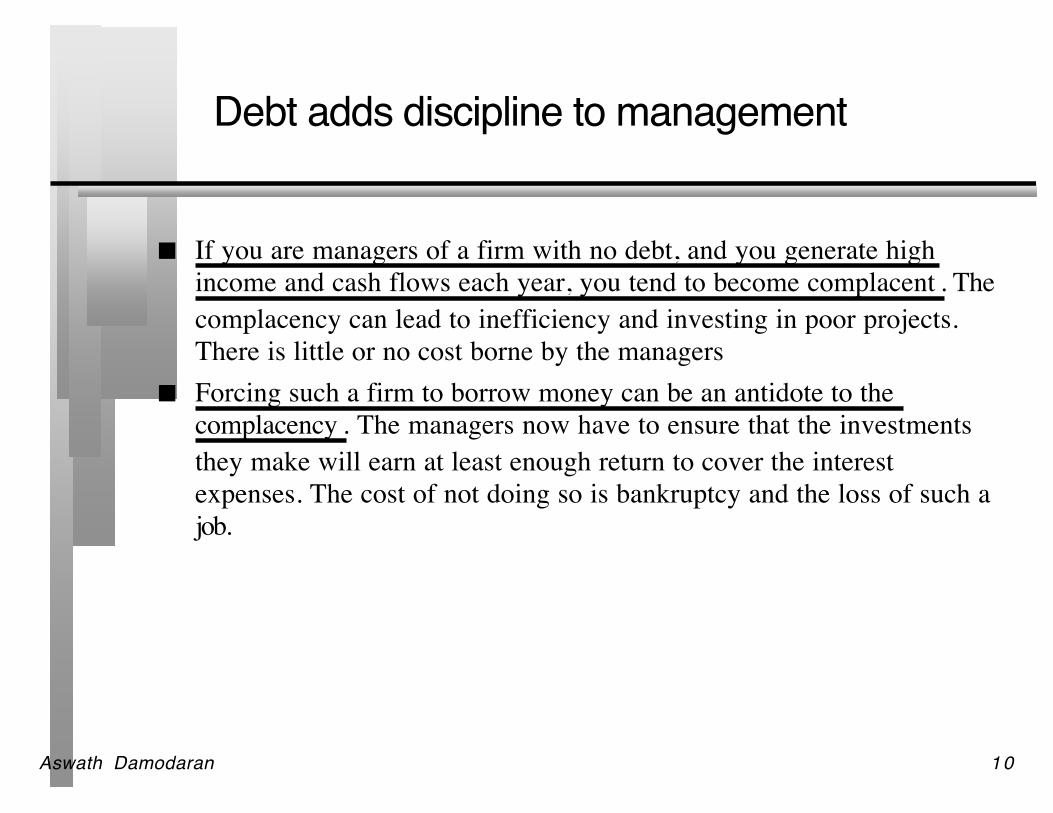
Debt adds discipline to management
If you are managers of a firm with no debt, and you generate highincome and cash flows each year, you tend to become complacent . Thecomplacency can lead to inefficiency and investing in poor projects.There is little or no cost borne by the managers
Forcing such a firm to borrow money can be an antidote to thecomplacency . The managers now have to ensure that the investmentsthey make will earn at least enough return to cover the interestexpenses. The cost of not doing so is bankruptcy and the loss of such ajob.
Aswath Damodaran 11
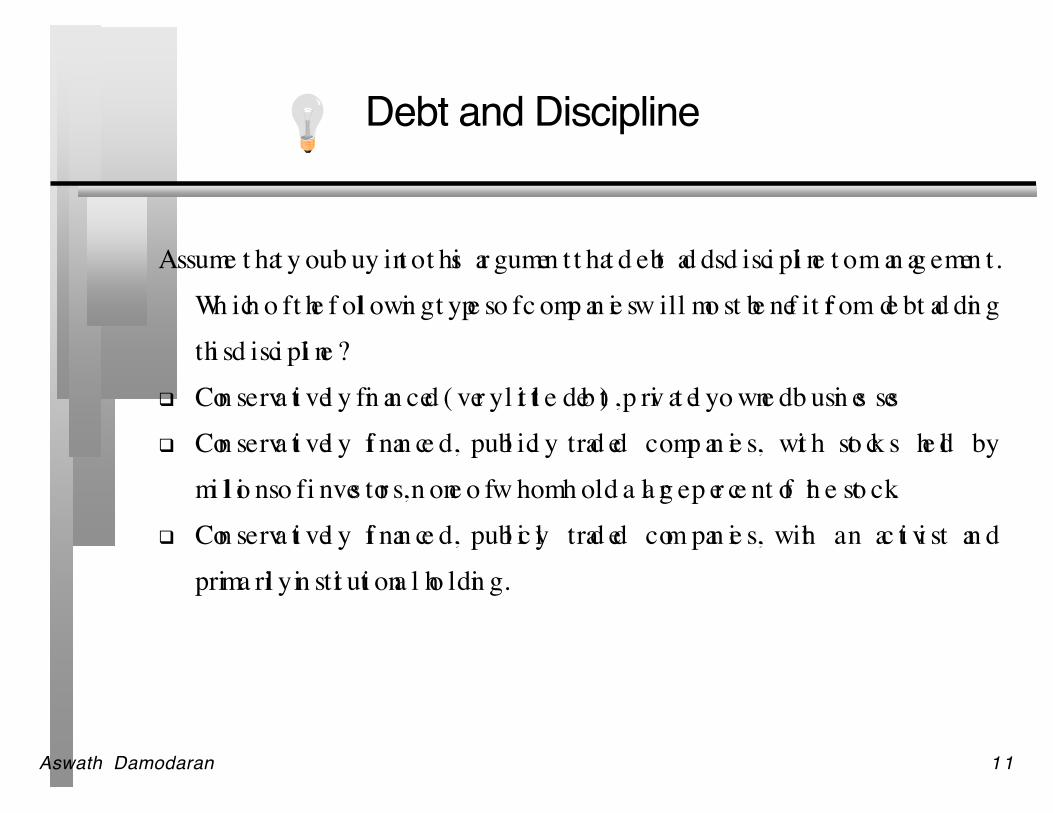
Debt and Discipline
Assume t hat y ou b uy int o t his ar gumen t t hat d ebt ad ds d isci pli ne t o m an ag emen t.Wh ich o f t he f oll owin g t ype s o f c omp an ie s w ill mo st be nef it fr om de bt ad din gthi s d isci pli ne ?
Con serva ti vel y fin an ced ( ver y l it tl e deb t) , p riv at el y o wne d b usin es ses Con serva ti vel y fi nan ce d, publ icl y trad ed comp an ie s, wit h sto ck s he ld by
mi ll io ns o f i nves tor s, n one o f w hom h old a la rg e p er ce nt of th e sto ck. Con serva ti vel y fi nan ce d, publ ic ly trad ed com pan ie s, with an ac ti vi st an d
prima ril y in stit uti ona l ho ldin g.

Aswath Damodaran 12
Bankruptcy Cost
The expected bankruptcy cost is a function of two variables--• the cost of going bankrupt
– direct costs: Legal and other Deadweight Costs– indirect costs: Costs arising because people perceive you to be in financial
trouble• the probability of bankruptcy, which will depend upon how uncertain you
are about future cash flows As you borrow more, you increase the probability of bankruptcy and
hence the expected bankruptcy cost.
Aswath Damodaran 13
The Bankruptcy Cost Proposition
Proposition 2: Other things being equal, the greater the indirectbankruptcy cost and/or probability of bankruptcy in the operatingcashflows of the firm, the less debt the firm can afford to use.
Aswath Damodaran 14
Debt & Bankruptcy Cost
Ran k t he f oll owin g c om pan ie s o n t he mag nit ude o f b ank ruptc y co sts f rom m ost to
leas t, ta kin g i nt o a cco unt bo th ex pli ci t an d i mp li ci t co sts:
A G roce ry Sto re
An A irpl an e Man ufact urer
High T ec hn olog y c om pa ny
Aswath Damodaran 15
Agency Cost
An agency cost arises whenever you hire someone else to do something foryou. It arises because your interests(as the principal) may deviate from thoseof the person you hired (as the agent).
When you lend money to a business, you are allowing the stockholders to usethat money in the course of running that business. Stockholders interests aredifferent from your interests, because
• You (as lender) are interested in getting your money back• Stockholders are interested in maximizing your wealth
In some cases, the clash of interests can lead to stockholders• Investing in riskier projects than you would want them to• Paying themselves large dividends when you would rather have them keep the cash
in the business. Proposition 3: Other things being equal, the greater the agency problems
associated with lending to a firm, the less debt the firm can afford to use.
Aswath Damodaran 16
Debt and Agency Costs
As sume that you are a bank . Which of the follo wing bus inesses would
you perce ive t he g reate st ag ency co s ts ?
A Lar ge Pharmace utic al c ompan y
A Lar ge Regula ted E lec tric Utili ty
Why?
Aswath Damodaran 17
Loss of future financing flexibility
When a firm borrows up to its capacity, it loses the flexibility offinancing future projects with debt.
Proposition 4: Other things remaining equal, the more uncertain a firmis about its future financing requirements and projects, the less debt thefirm will use for financing current projects.
Aswath Damodaran 18
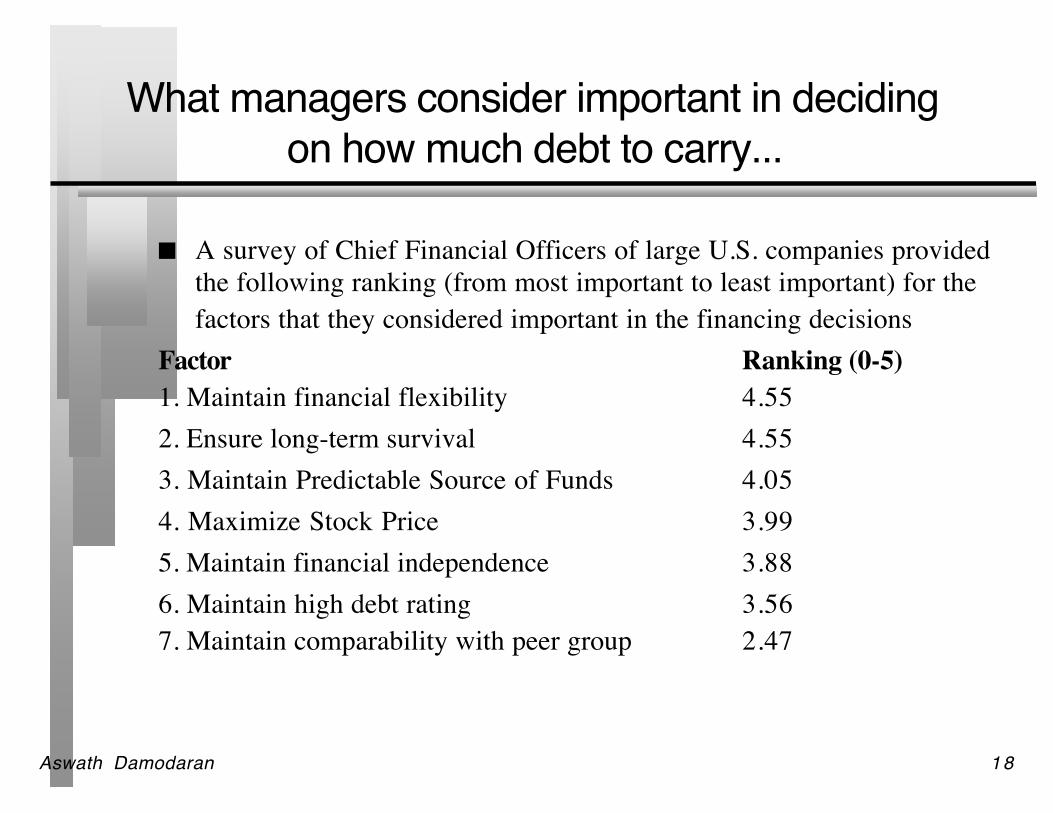
What managers consider important in decidingon how much debt to carry...
A survey of Chief Financial Officers of large U.S. companies providedthe following ranking (from most important to least important) for thefactors that they considered important in the financing decisions
Factor Ranking (0-5)1. Maintain financial flexibility 4.552. Ensure long-term survival 4.553. Maintain Predictable Source of Funds 4.054. Maximize Stock Price 3.995. Maintain financial independence 3.886. Maintain high debt rating 3.567. Maintain comparability with peer group 2.47
Aswath Damodaran 19
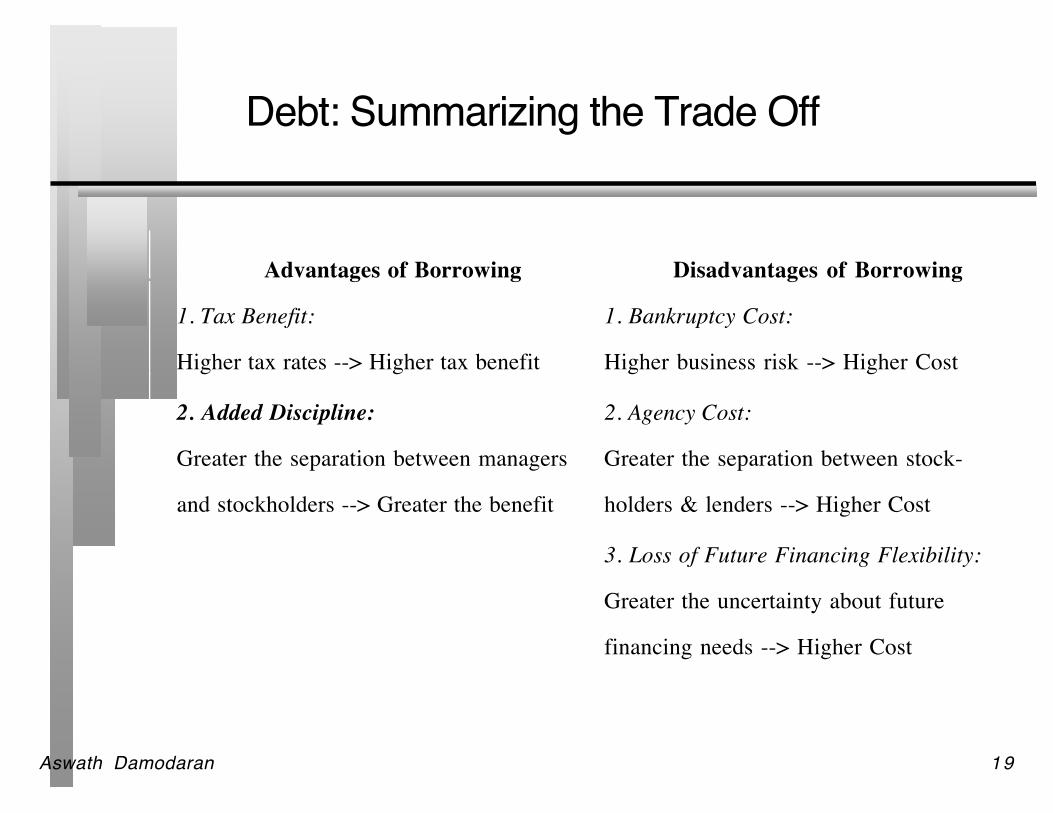
Debt: Summarizing the Trade Off
Advantages of Borrowing Disadvantages of Borrowing
1. Tax Benefit:
Higher tax rates --> Higher tax benefit
1. Bankruptcy Cost:
Higher business risk --> Higher Cost
2. Added Discipline:
Greater the separation between managers
and stockholders --> Greater the benefit
2. Agency Cost:
Greater the separation between stock-
holders & lenders --> Higher Cost
3. Loss of Future Financing Flexibility:
Greater the uncertainty about future
financing needs --> Higher Cost
Aswath Damodaran 20
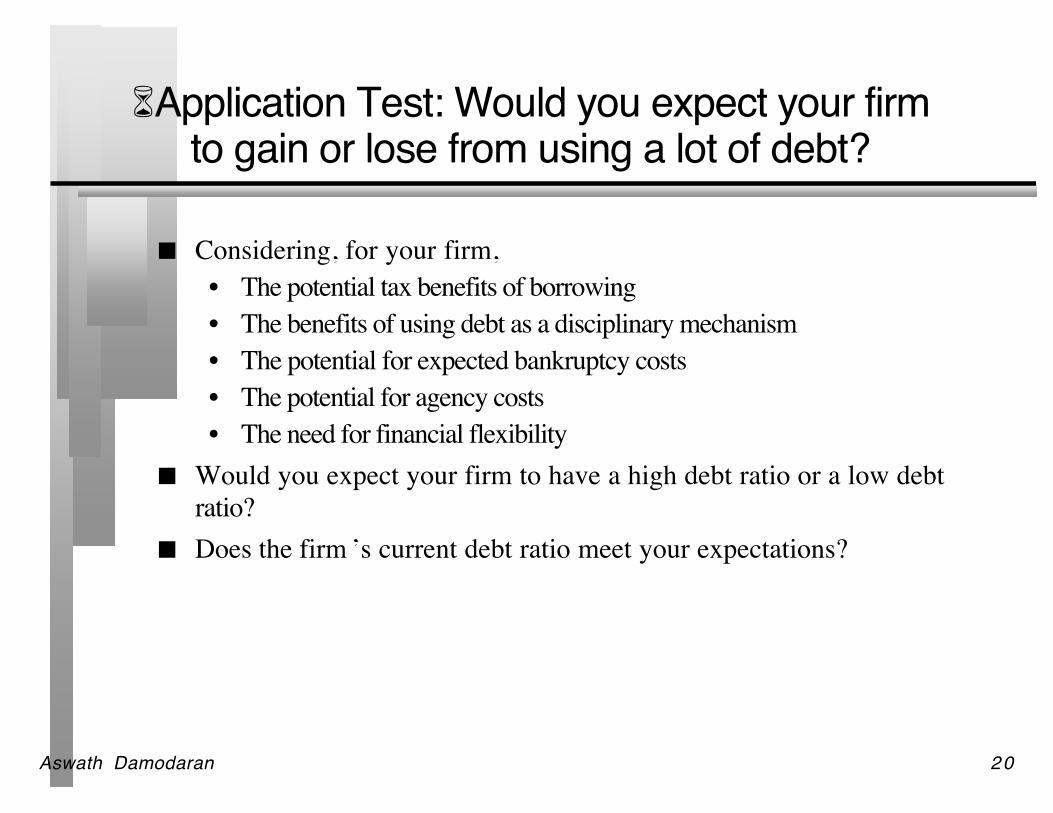
Application Test: Would you expect your firmto gain or lose from using a lot of debt?
Considering, for your firm,• The potential tax benefits of borrowing• The benefits of using debt as a disciplinary mechanism• The potential for expected bankruptcy costs• The potential for agency costs• The need for financial flexibility
Would you expect your firm to have a high debt ratio or a low debtratio?
Does the firm ’s current debt ratio meet your expectations?
Aswath Damodaran 21
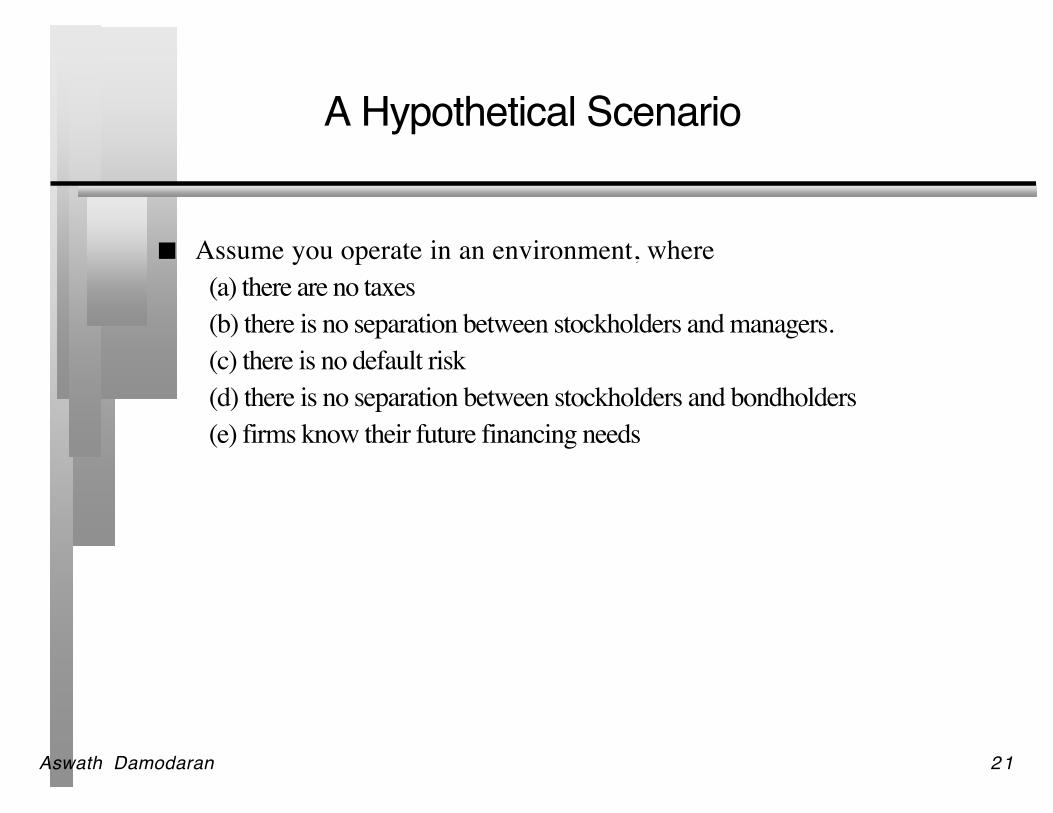
A Hypothetical Scenario
Assume you operate in an environment, where(a) there are no taxes(b) there is no separation between stockholders and managers.(c) there is no default risk(d) there is no separation between stockholders and bondholders(e) firms know their future financing needs
Aswath Damodaran 22
The Miller-Modigliani Theorem
In an environment, where there are no taxes, default risk or agencycosts, capital structure is irrelevant.
The value of a firm is independent of its debt ratio.
Aswath Damodaran 23
Implications of MM Theorem
Leverage is irrelevant. A firm's value will be determined by its projectcash flows.
The cost of capital of the firm will not change with leverage. As a firmincreases its leverage, the cost of equity will increase just enough tooffset any gains to the leverage
Aswath Damodaran 24
What do firms look at in financing?
Is there a financing hierarchy? Argument:
• There are some who argue that firms follow a financing hierarchy, withretained earnings being the most preferred choice for financing, followedby debt and that new equity is the least preferred choice.
Aswath Damodaran 25
Rationale for Financing Hierarchy
Managers value flexibility. External financing reduces flexibility morethan internal financing.
Managers value control. Issuing new equity weakens control and newdebt creates bond covenants.
Aswath Damodaran 26
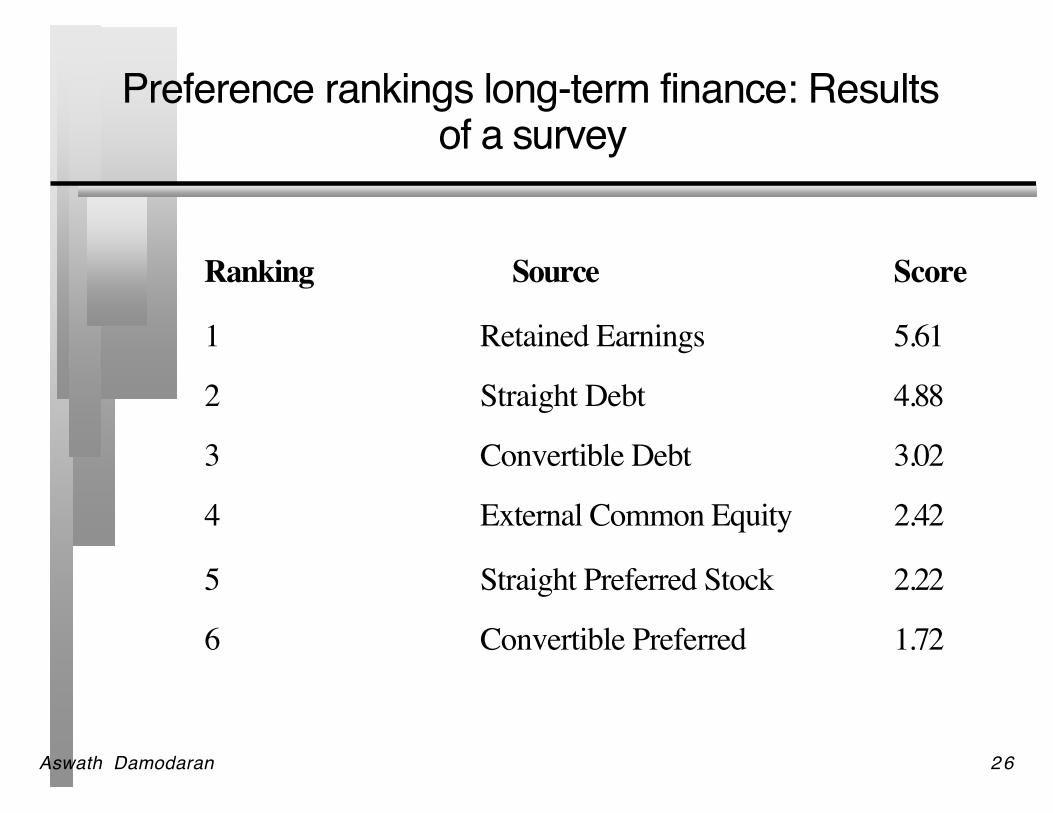
Preference rankings long-term finance: Resultsof a survey
Ranking Source Score
1 Retained Earnings 5.61
2 Straight Debt 4.88
3 Convertible Debt 3.02
4 External Common Equity 2.42
5 Straight Preferred Stock 2.22
6 Convertible Preferred 1.72

Aswath Damodaran 27
Financing Choices
You ar e r ea din g t he W al l Str eet J ourna l an d n oti ce a t omb sto ne ad f or a c omp an y,offe rin g t o sel l co nver ti ble p ref err ed stoc k. W ha t wou ld y ou hy poth es iz e a bou tthe h ea lt h o f t he c om pa ny is sui ng th ese sec ur iti es ?
Noth ing Hea lt hie r th an th e av era ge fi rm In mu ch mo re f inan ci al t ro uble t ha n t he a ve rag e fir m
Aswath Damodaran 28
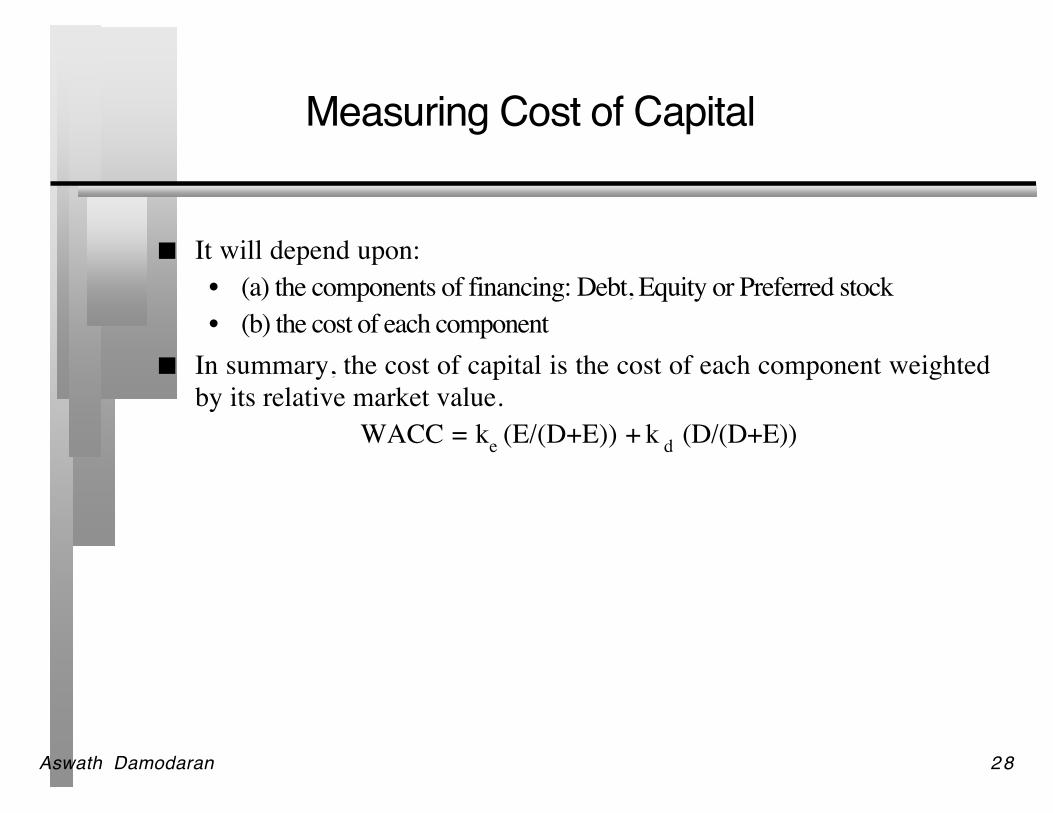
Measuring Cost of Capital
It will depend upon:• (a) the components of financing: Debt, Equity or Preferred stock• (b) the cost of each component
In summary, the cost of capital is the cost of each component weightedby its relative market value.
WACC = ke (E/(D+E)) + k d (D/(D+E))
Aswath Damodaran 29
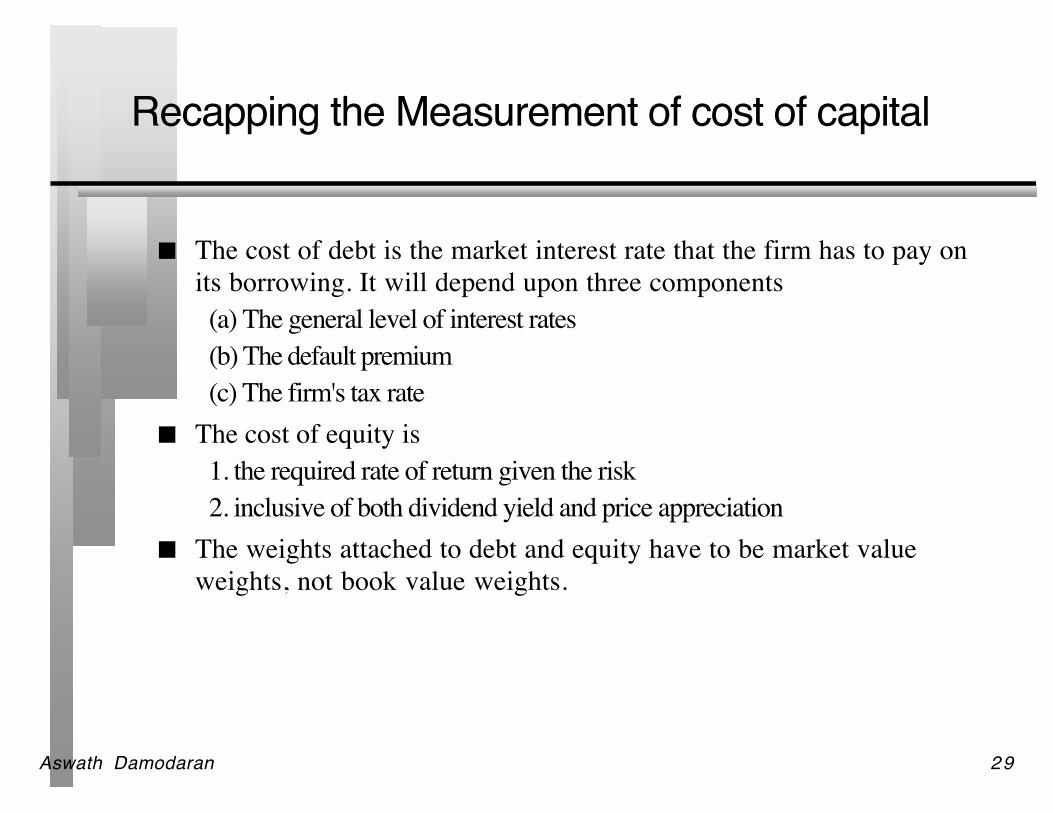
Recapping the Measurement of cost of capital
The cost of debt is the market interest rate that the firm has to pay onits borrowing. It will depend upon three components(a) The general level of interest rates(b) The default premium(c) The firm's tax rate
The cost of equity is1. the required rate of return given the risk2. inclusive of both dividend yield and price appreciation
The weights attached to debt and equity have to be market valueweights, not book value weights.
Aswath Damodaran 30
Costs of Debt & Equity
A rec en t ar tic le in an Asia n bus in es s ma ga zi ne arg ued that eq uit y was ch eap ertha n d eb t, be ca use div id end yie ld s ar e mu ch low er t han in te res t r ate s on deb t.Do y ou ag ree w ith t his sta te me nt
Yes NoCan e qui ty e ver b e ch eap er th an d ebt ? Yes No
Aswath Damodaran 31
Fallacies about Book Value
1. People will not lend on the basis of market value.2. Book Value is more reliable than Market Value because it does not
change as much.3. Using book value is more conservative than using market value.
Aswath Damodaran 32
Issue: Use of Book Value
Many CFOs a rgue that us in g boo k val ue is more conser vativ e than usingmar ket valu e, because the market value of equity is us ually muchhigher than book value. Is this s ta teme nt true, f rom a cost of capita lperspective? (Will you get a mo re conservative estimate of cost ofcap it al using book v al ue r ather t han m arket val ue?)
Yes No
Aswath Damodaran 33
Why does the cost of capital matter?
Value of a Firm = Present Value of Cash Flows to the Firm,discounted back at the cost of capital.
If the cash flows to the firm are held constant, and the cost of capital isminimized, the value of the firm will be maximized.

Aswath Damodaran 34
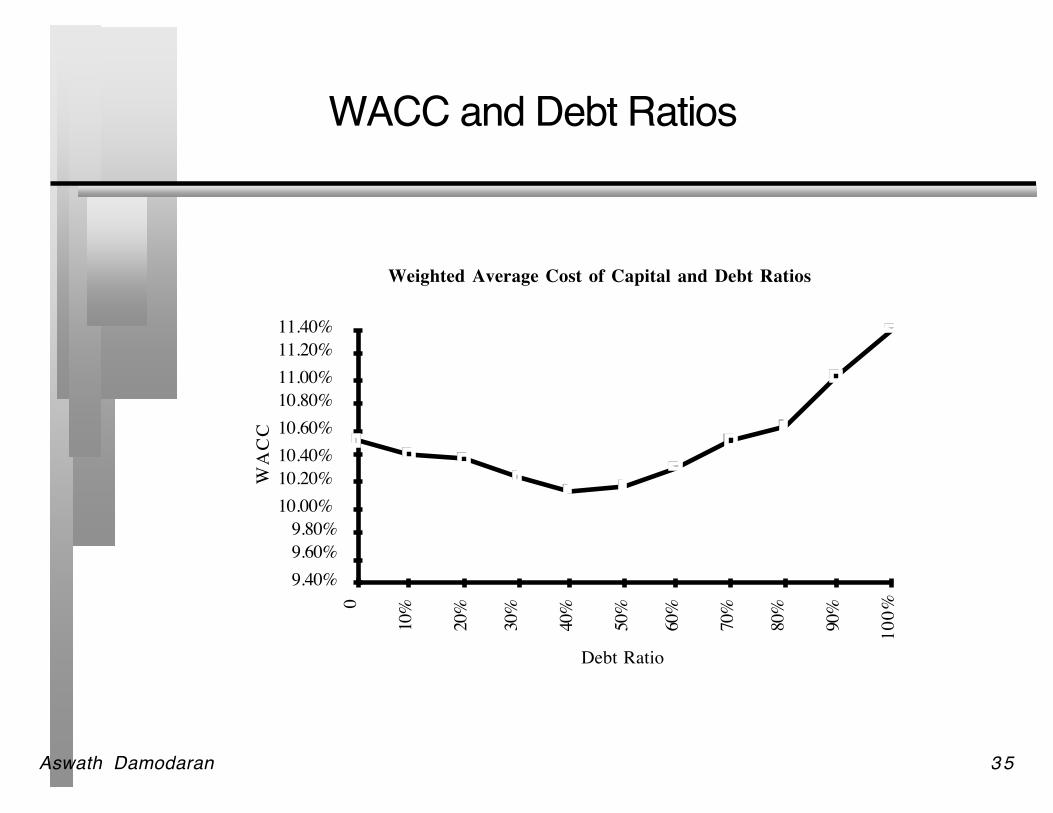
Applying Approach: The Textbook Example
D/(D+E) ke kd After-tax Cost of Debt WACC
0 10.50% 8% 4.80% 10.50%
10% 11% 8.50% 5.10% 10.41%
20% 11.60% 9.00% 5.40% 10.36%
30% 12.30% 9.00% 5.40% 10.23%
40% 13.10% 9.50% 5.70% 10.14%
50% 14% 10.50% 6.30% 10.15%
60% 15% 12% 7.20% 10.32%
70% 16.10% 13.50% 8.10% 10.50%
80% 17.20% 15% 9.00% 10.64%
90% 18.40% 17% 10.20% 11.02%
100% 19.70% 19% 11.40% 11.40%
Aswath Damodaran 35
WACC and Debt Ratios
Weighted Average Cost of Capital and Debt Ratios
Debt Ratio
WA
CC
9.40%9.60%9.80%
10.00%10.20%10.40%10.60%10.80%11.00%11.20%11.40%
0
10%
20%
30%
40%
50%
60%
70%
80%
90%
100%
Aswath Damodaran 36
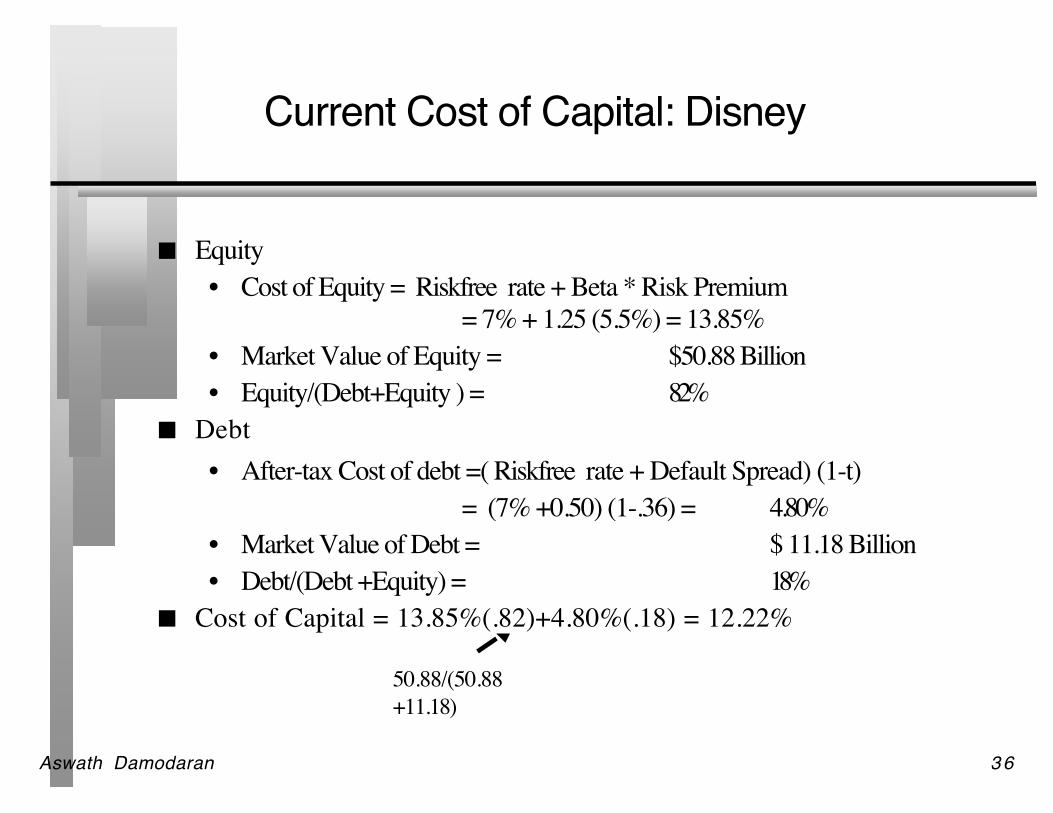
Current Cost of Capital: Disney
Equity• Cost of Equity = Riskfree rate + Beta * Risk Premium
= 7% + 1.25 (5.5%) = 13.85%• Market Value of Equity = $50.88 Billion• Equity/(Debt+Equity ) = 82%
Debt• After-tax Cost of debt =( Riskfree rate + Default Spread) (1-t)
= (7% +0.50) (1-.36) = 4.80%• Market Value of Debt = $ 11.18 Billion• Debt/(Debt +Equity) = 18%
Cost of Capital = 13.85%(.82)+4.80%(.18) = 12.22%
50.88/(50.88+11.18)
Aswath Damodaran 37
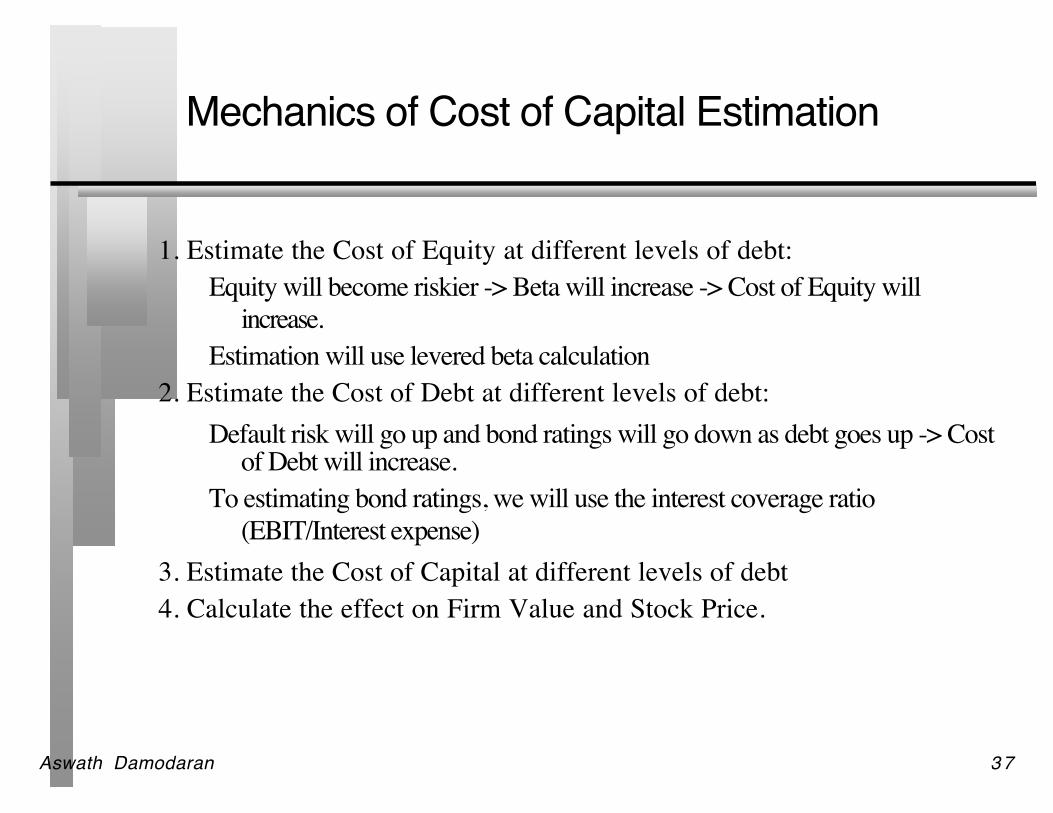
Mechanics of Cost of Capital Estimation
1. Estimate the Cost of Equity at different levels of debt:Equity will become riskier -> Beta will increase -> Cost of Equity will
increase.Estimation will use levered beta calculation
2. Estimate the Cost of Debt at different levels of debt:Default risk will go up and bond ratings will go down as debt goes up -> Cost
of Debt will increase.To estimating bond ratings, we will use the interest coverage ratio
(EBIT/Interest expense)3. Estimate the Cost of Capital at different levels of debt4. Calculate the effect on Firm Value and Stock Price.
Aswath Damodaran 38
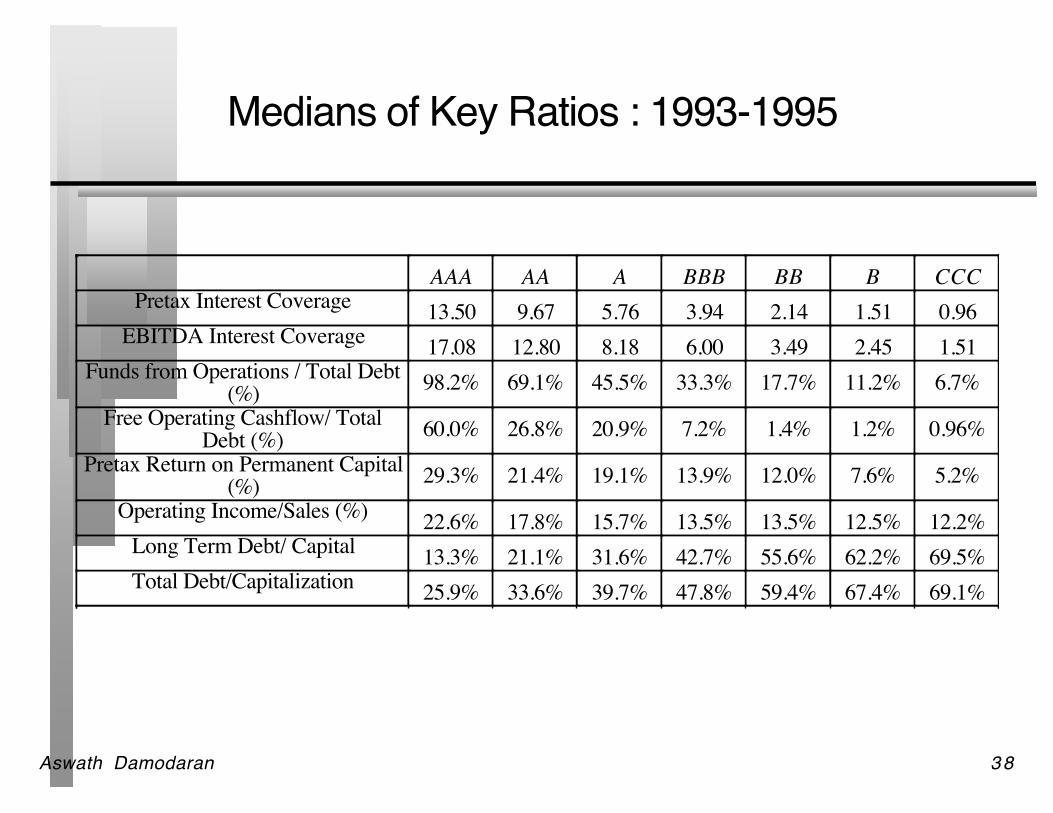
Medians of Key Ratios : 1993-1995
AAA AA A BBB BB B CCCPretax Interest Coverage 13.50 9.67 5.76 3.94 2.14 1.51 0.96
EBITDA Interest Coverage 17.08 12.80 8.18 6.00 3.49 2.45 1.51Funds from Operations / Total Debt
(%) 98.2% 69.1% 45.5% 33.3% 17.7% 11.2% 6.7%Free Operating Cashflow/ Total
Debt (%) 60.0% 26.8% 20.9% 7.2% 1.4% 1.2% 0.96%Pretax Return on Permanent Capital
(%) 29.3% 21.4% 19.1% 13.9% 12.0% 7.6% 5.2%Operating Income/Sales (%) 22.6% 17.8% 15.7% 13.5% 13.5% 12.5% 12.2%
Long Term Debt/ Capital 13.3% 21.1% 31.6% 42.7% 55.6% 62.2% 69.5%Total Debt/Capitalization 25.9% 33.6% 39.7% 47.8% 59.4% 67.4% 69.1%
Aswath Damodaran 39
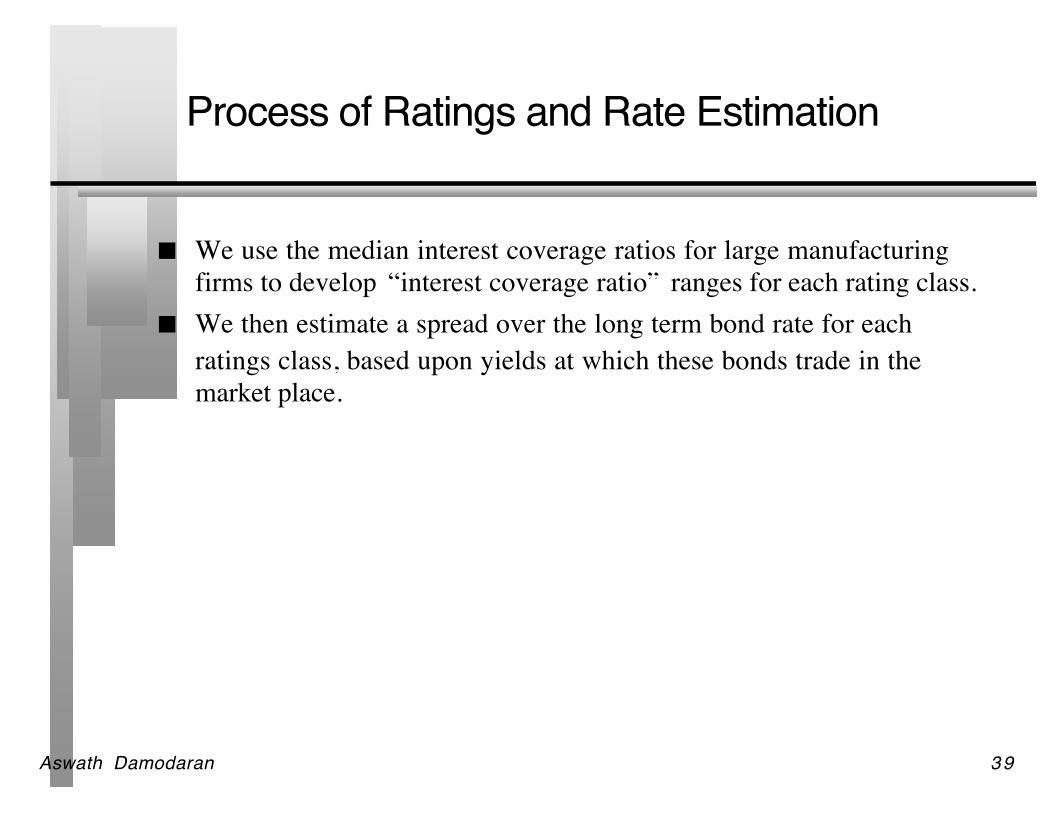
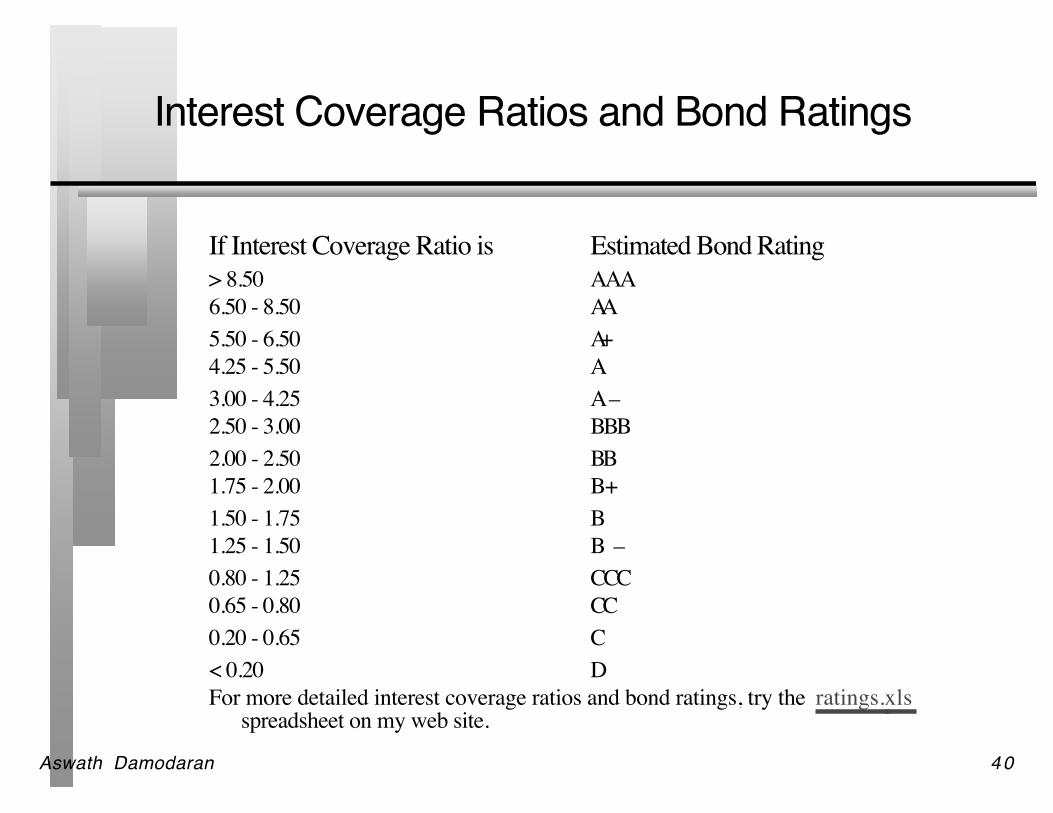
Process of Ratings and Rate Estimation
We use the median interest coverage ratios for large manufacturingfirms to develop “interest coverage ratio” ranges for each rating class.
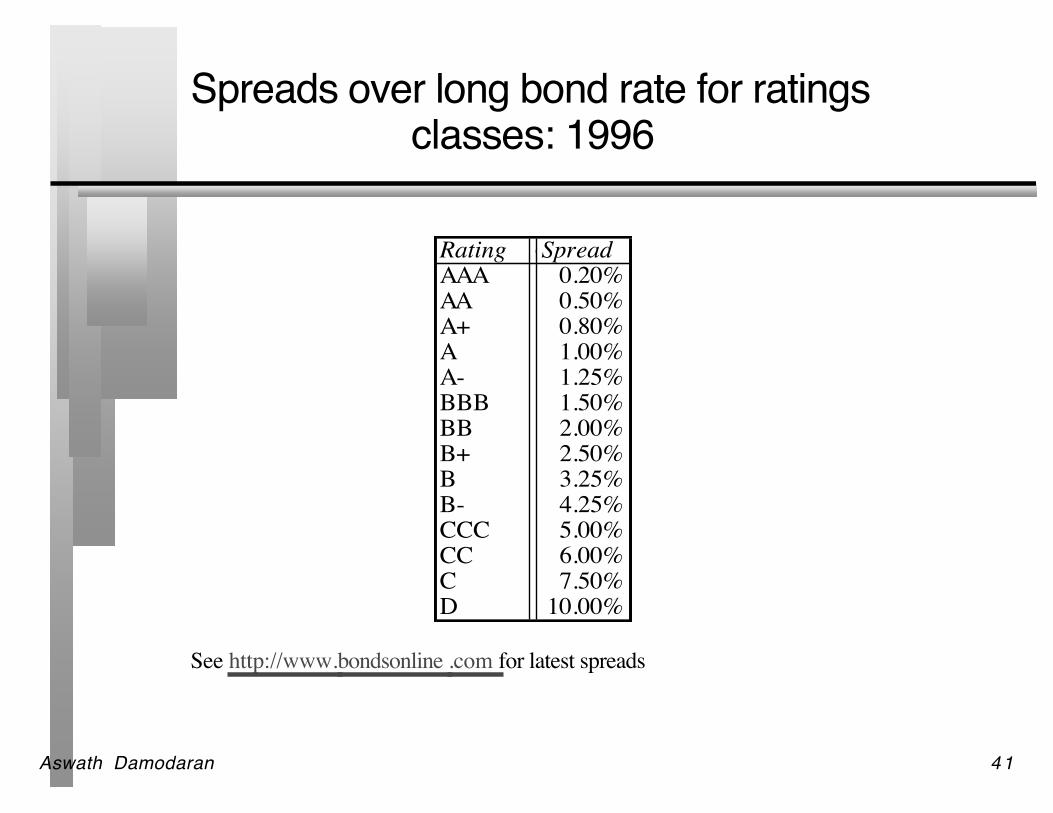
We then estimate a spread over the long term bond rate for eachratings class, based upon yields at which these bonds trade in themarket place.
Aswath Damodaran 40
Interest Coverage Ratios and Bond Ratings
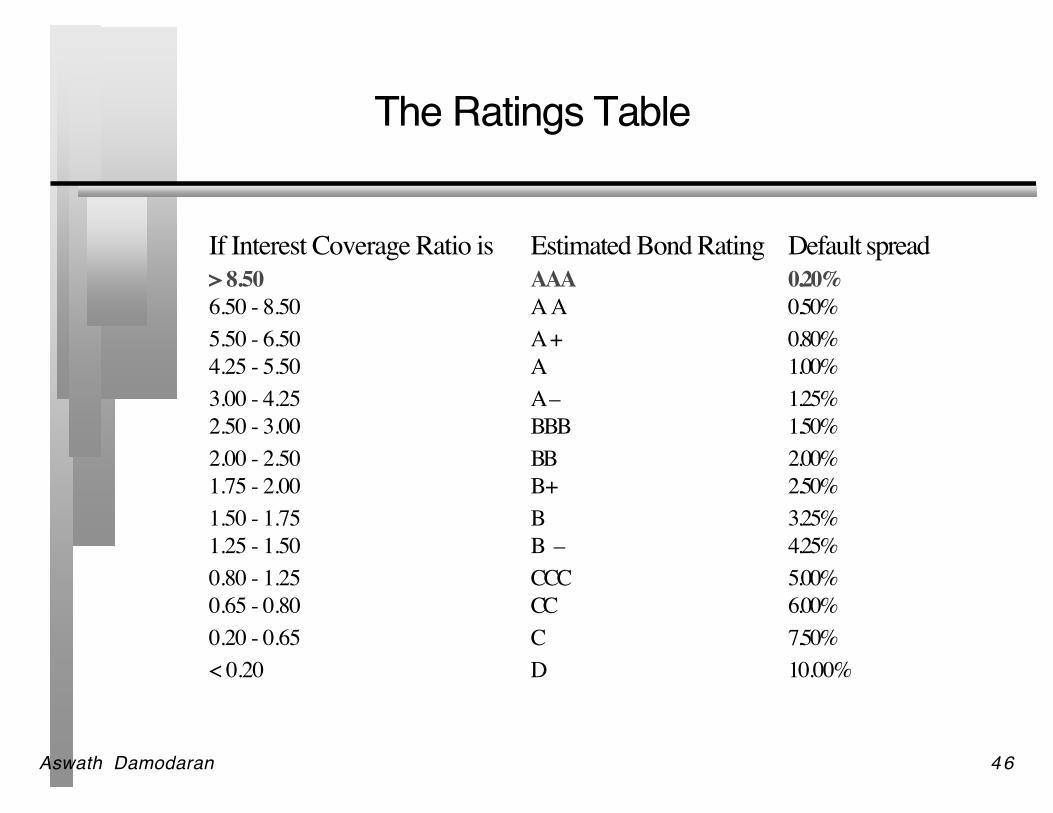
If Interest Coverage Ratio is Estimated Bond Rating> 8.50 AAA6.50 - 8.50 AA5.50 - 6.50 A+4.25 - 5.50 A3.00 - 4.25 A–2.50 - 3.00 BBB2.00 - 2.50 BB1.75 - 2.00 B+1.50 - 1.75 B1.25 - 1.50 B –0.80 - 1.25 CCC0.65 - 0.80 CC0.20 - 0.65 C< 0.20 DFor more detailed interest coverage ratios and bond ratings, try the ratings.xls
spreadsheet on my web site.
Aswath Damodaran 41
Spreads over long bond rate for ratingsclasses: 1996
Rating Coverage gtSpreadAAA 0.20%AA 0.50%A+ 0.80%A 1.00%A- 1.25%BBB 1.50%BB 2.00%B+ 2.50%B 3.25%B- 4.25%CCC 5.00%CC 6.00%C 7.50%D 10.00%
See http://www.bondsonline .com for latest spreads
Aswath Damodaran 42
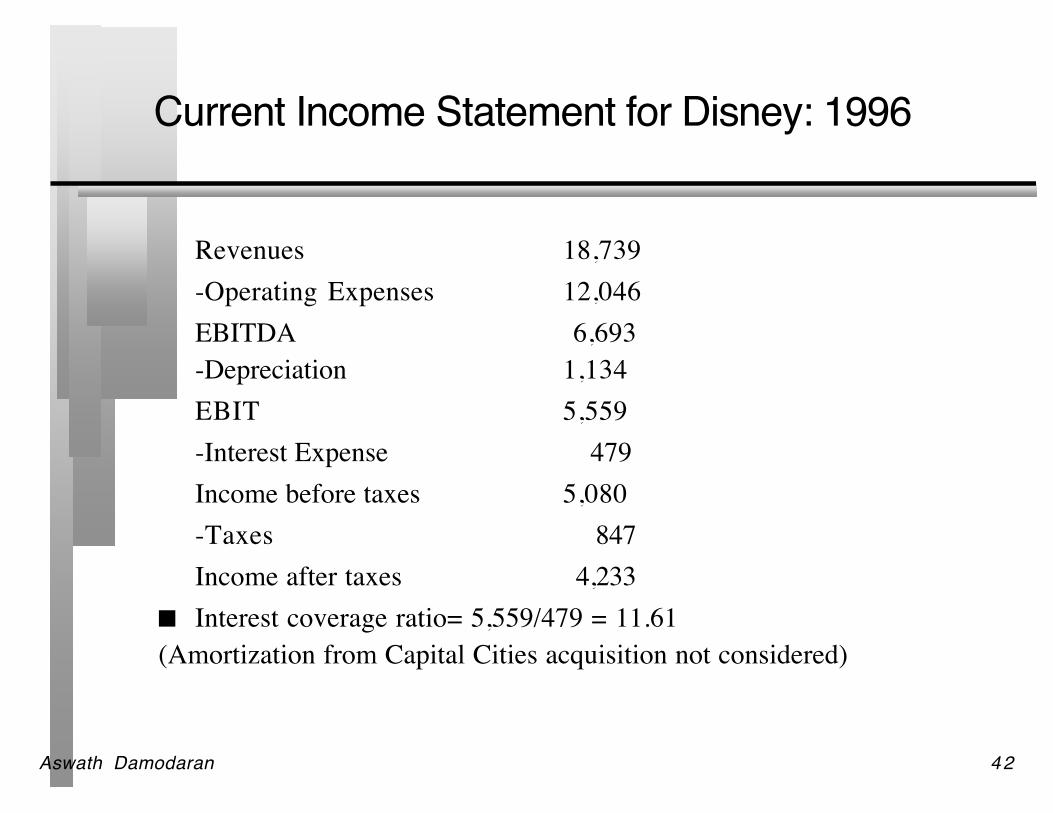
Current Income Statement for Disney: 1996
Revenues 18,739-Operating Expenses 12,046EBITDA 6,693-Depreciation 1,134EBIT 5,559-Interest Expense 479Income before taxes 5,080-Taxes 847Income after taxes 4,233
Interest coverage ratio= 5,559/479 = 11.61(Amortization from Capital Cities acquisition not considered)
Aswath Damodaran 43
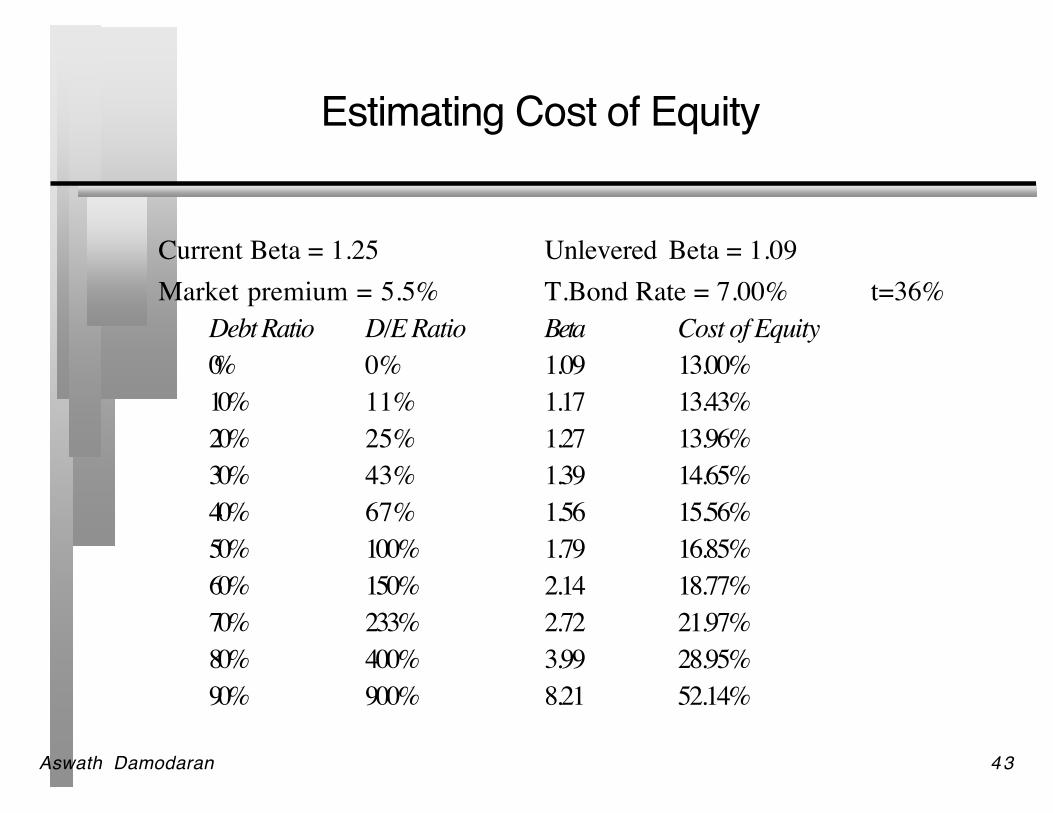
Estimating Cost of Equity
Current Beta = 1.25 Unlevered Beta = 1.09Market premium = 5.5% T.Bond Rate = 7.00% t=36%
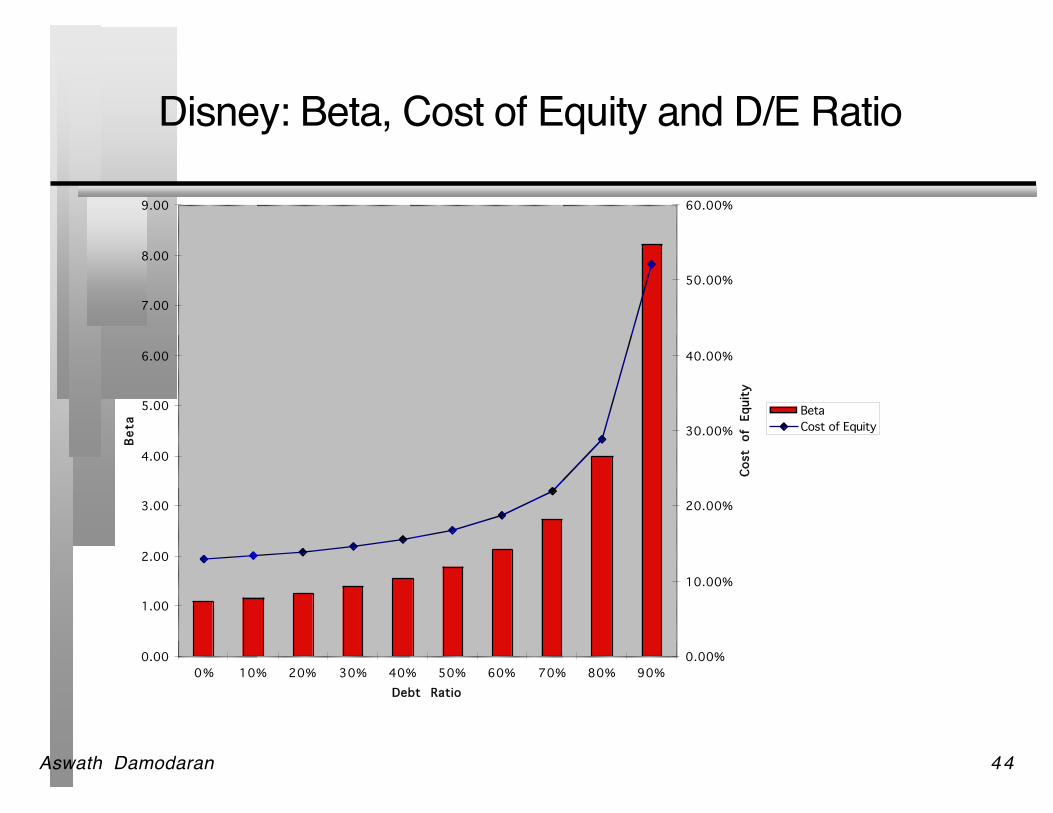
Debt Ratio D/E Ratio Beta Cost of Equity0% 0% 1.09 13.00%10% 11% 1.17 13.43%20% 25% 1.27 13.96%30% 43% 1.39 14.65%40% 67% 1.56 15.56%50% 100% 1.79 16.85%60% 150% 2.14 18.77%70% 233% 2.72 21.97%80% 400% 3.99 28.95%90% 900% 8.21 52.14%
Aswath Damodaran 44
Disney: Beta, Cost of Equity and D/E Ratio
0.00
1.00
2.00
3.00
4.00
5.00
6.00
7.00
8.00
9.00
0% 10% 20% 30% 40% 50% 60% 70% 80% 90%Debt Ratio
Bet
a
0.00%
10.00%
20.00%
30.00%
40.00%
50.00%
60.00%
Cost
of
Equi
ty
BetaCost of Equity
Aswath Damodaran 45
Estimating Cost of Debt
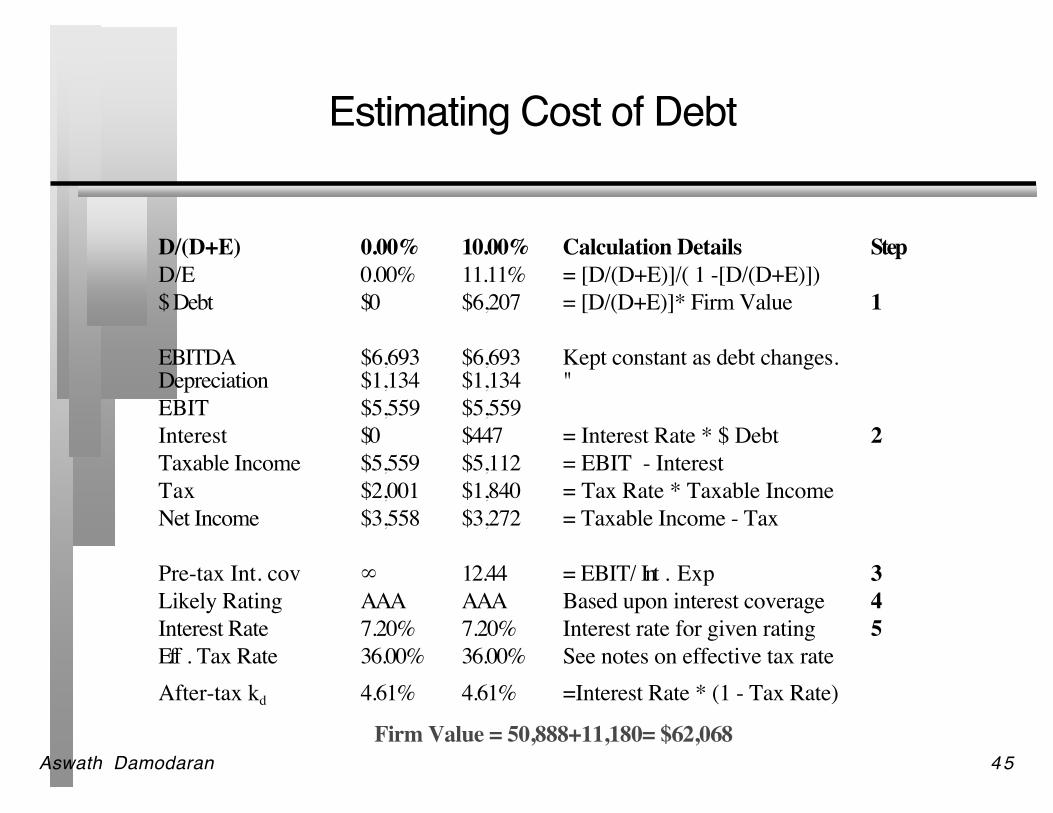
D/(D+E) 0.00% 10.00% Calculation Details StepD/E 0.00% 11.11% = [D/(D+E)]/( 1 -[D/(D+E)])$ Debt $0 $6,207 = [D/(D+E)]* Firm Value 1
EBITDA $6,693 $6,693 Kept constant as debt changes.Depreciation $1,134 $1,134 "EBIT $5,559 $5,559Interest $0 $447 = Interest Rate * $ Debt 2Taxable Income $5,559 $5,112 = EBIT - InterestTax $2,001 $1,840 = Tax Rate * Taxable IncomeNet Income $3,558 $3,272 = Taxable Income - Tax
Pre-tax Int. cov ∞ 12.44 = EBIT/ Int . Exp 3Likely Rating AAA AAA Based upon interest coverage 4Interest Rate 7.20% 7.20% Interest rate for given rating 5Eff . Tax Rate 36.00% 36.00% See notes on effective tax rateAfter-tax kd 4.61% 4.61% =Interest Rate * (1 - Tax Rate)
Firm Value = 50,888+11,180= $62,068
Aswath Damodaran 46
The Ratings Table
If Interest Coverage Ratio is Estimated Bond Rating Default spread> 8.50 AAA 0.20%6.50 - 8.50 A A 0.50%5.50 - 6.50 A+ 0.80%4.25 - 5.50 A 1.00%3.00 - 4.25 A– 1.25%2.50 - 3.00 BBB 1.50%2.00 - 2.50 BB 2.00%1.75 - 2.00 B+ 2.50%1.50 - 1.75 B 3.25%1.25 - 1.50 B – 4.25%0.80 - 1.25 CCC 5.00%0.65 - 0.80 CC 6.00%0.20 - 0.65 C 7.50%< 0.20 D 10.00%
Aswath Damodaran 47
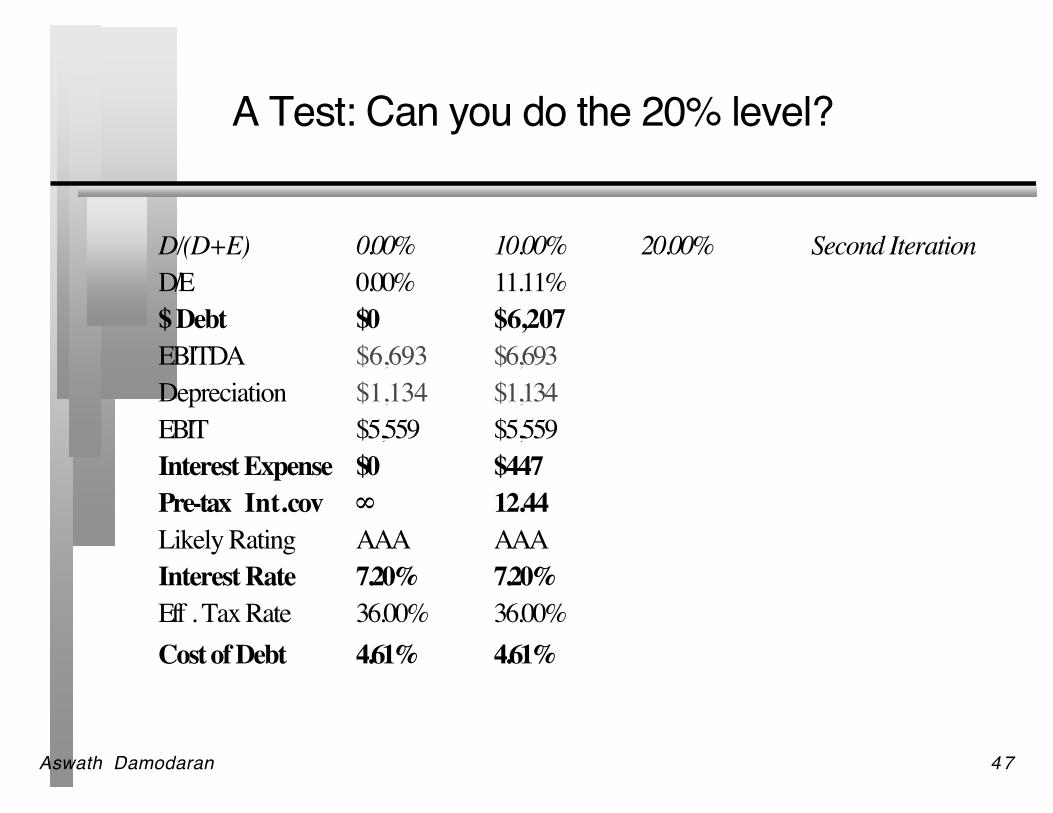
A Test: Can you do the 20% level?
D/(D+E) 0.00% 10.00% 20.00% Second IterationD/E 0.00% 11.11%$ Debt $0 $6,207 EBITDA $6,693 $6,693 Depreciation $1,134 $1,134 EBIT $5,559 $5,559Interest Expense $0 $447 Pre-tax Int. cov ∞ 12.44Likely Rating AAA AAAInterest Rate 7.20% 7.20%Eff . Tax Rate 36.00% 36.00%Cost of Debt 4.61% 4.61%
Aswath Damodaran 48
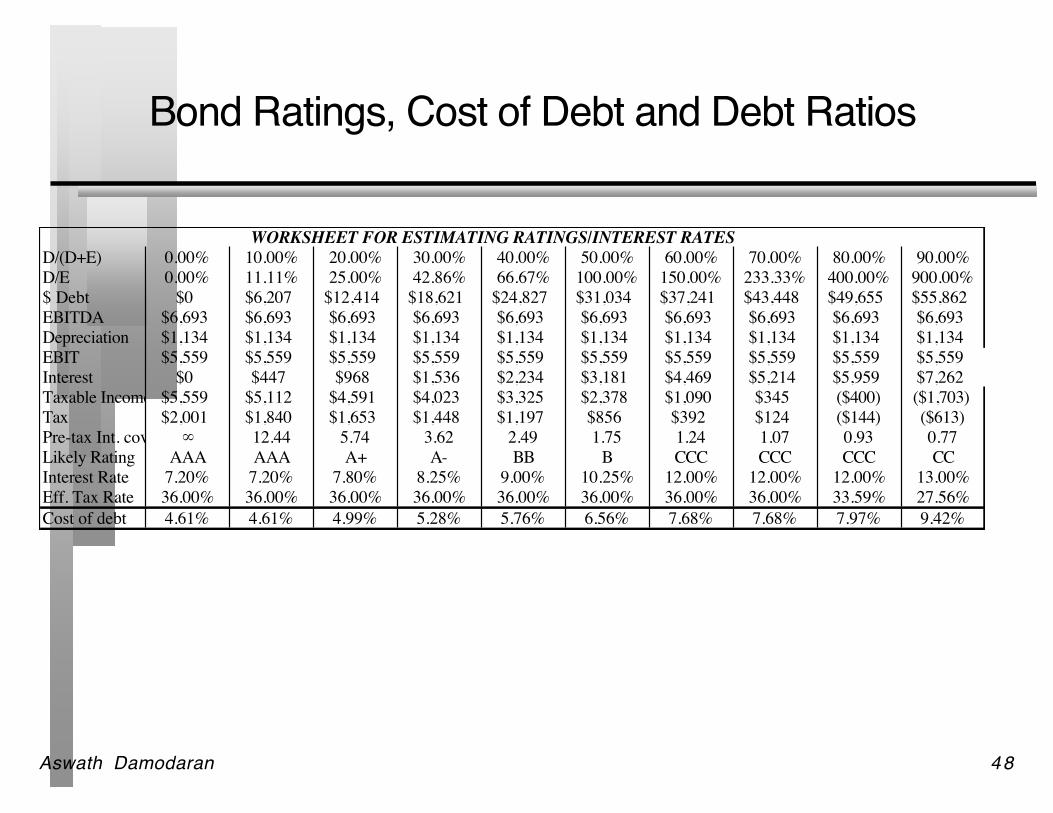
Bond Ratings, Cost of Debt and Debt Ratios
WORKSHEET FOR ESTIMATING RATINGS/INTEREST RATESD/(D+E) 0.00% 10.00% 20.00% 30.00% 40.00% 50.00% 60.00% 70.00% 80.00% 90.00%D/E 0.00% 11.11% 25.00% 42.86% 66.67% 100.00% 150.00% 233.33% 400.00% 900.00%$ Debt $0 $6,207 $12,414 $18,621 $24,827 $31,034 $37,241 $43,448 $49,655 $55,862EBITDA $6,693 $6,693 $6,693 $6,693 $6,693 $6,693 $6,693 $6,693 $6,693 $6,693Depreciation $1,134 $1,134 $1,134 $1,134 $1,134 $1,134 $1,134 $1,134 $1,134 $1,134EBIT $5,559 $5,559 $5,559 $5,559 $5,559 $5,559 $5,559 $5,559 $5,559 $5,559Interest $0 $447 $968 $1,536 $2,234 $3,181 $4,469 $5,214 $5,959 $7,262Taxable Income $5,559 $5,112 $4,591 $4,023 $3,325 $2,378 $1,090 $345 ($400) ($1,703)Tax $2,001 $1,840 $1,653 $1,448 $1,197 $856 $392 $124 ($144) ($613)Pre-tax Int. cov ∞ 12.44 5.74 3.62 2.49 1.75 1.24 1.07 0.93 0.77Likely Rating AAA AAA A+ A- BB B CCC CCC CCC CCInterest Rate 7.20% 7.20% 7.80% 8.25% 9.00% 10.25% 12.00% 12.00% 12.00% 13.00%Eff. Tax Rate 36.00% 36.00% 36.00% 36.00% 36.00% 36.00% 36.00% 36.00% 33.59% 27.56%Cost of debt 4.61% 4.61% 4.99% 5.28% 5.76% 6.56% 7.68% 7.68% 7.97% 9.42%
Aswath Damodaran 49
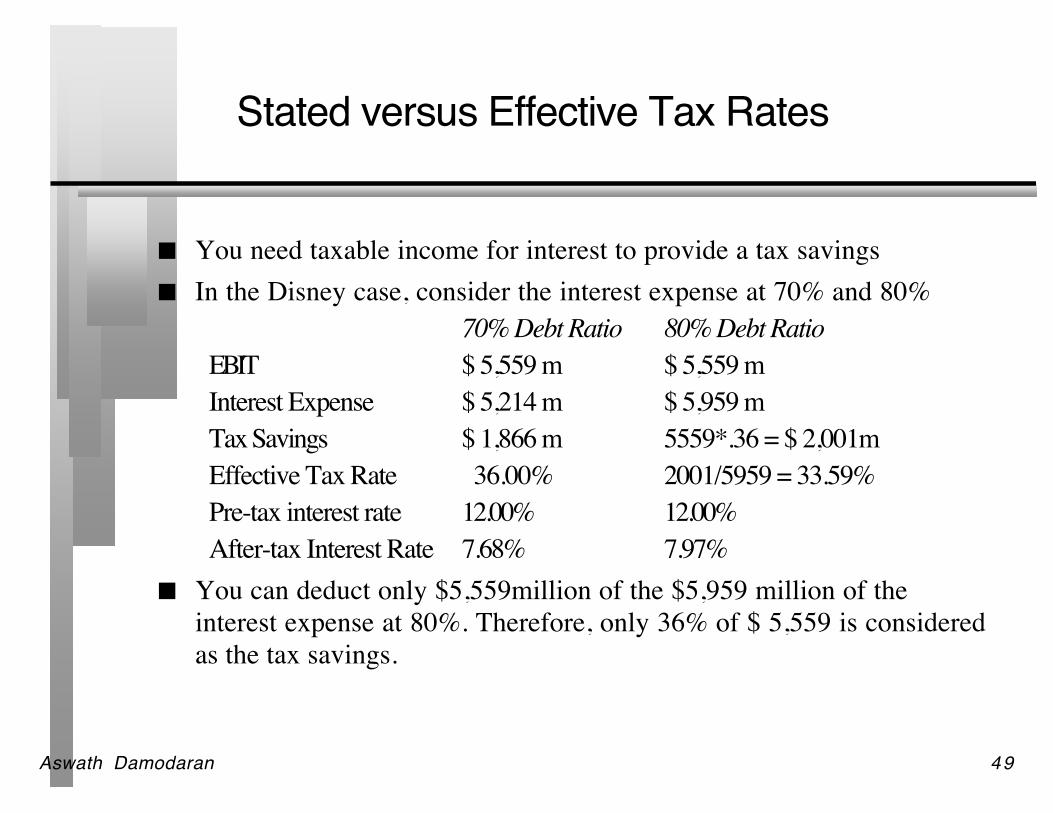
Stated versus Effective Tax Rates
You need taxable income for interest to provide a tax savings In the Disney case, consider the interest expense at 70% and 80%
70% Debt Ratio 80% Debt RatioEBIT $ 5,559 m $ 5,559 mInterest Expense $ 5,214 m $ 5,959 mTax Savings $ 1,866 m 5559*.36 = $ 2,001mEffective Tax Rate 36.00% 2001/5959 = 33.59%Pre-tax interest rate 12.00% 12.00%After-tax Interest Rate 7.68% 7.97%
You can deduct only $5,559million of the $5,959 million of theinterest expense at 80%. Therefore, only 36% of $ 5,559 is consideredas the tax savings.
Aswath Damodaran 50
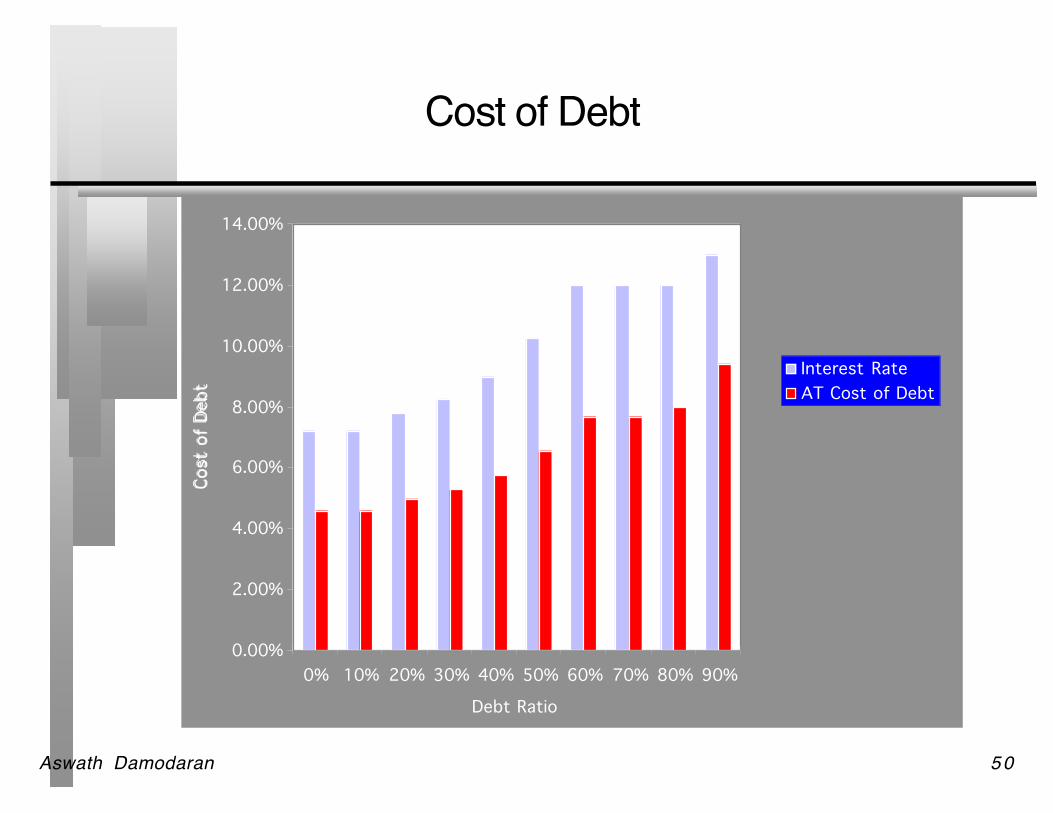
Cost of Debt
0.00%
2.00%
4.00%
6.00%
8.00%
10.00%
12.00%
14.00%
0% 10% 20% 30% 40% 50% 60% 70% 80% 90%
Debt Ratio
Cost
of
Debt
Interest RateAT Cost of Debt
Aswath Damodaran 51
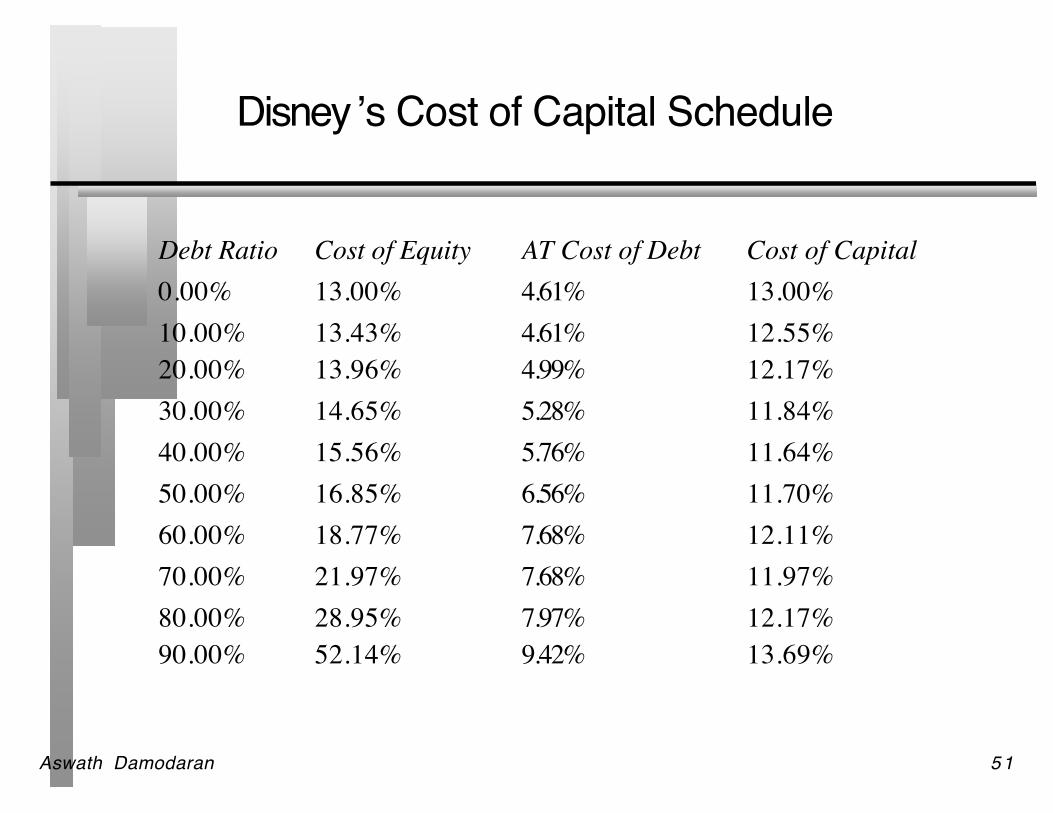
Disney ’s Cost of Capital Schedule
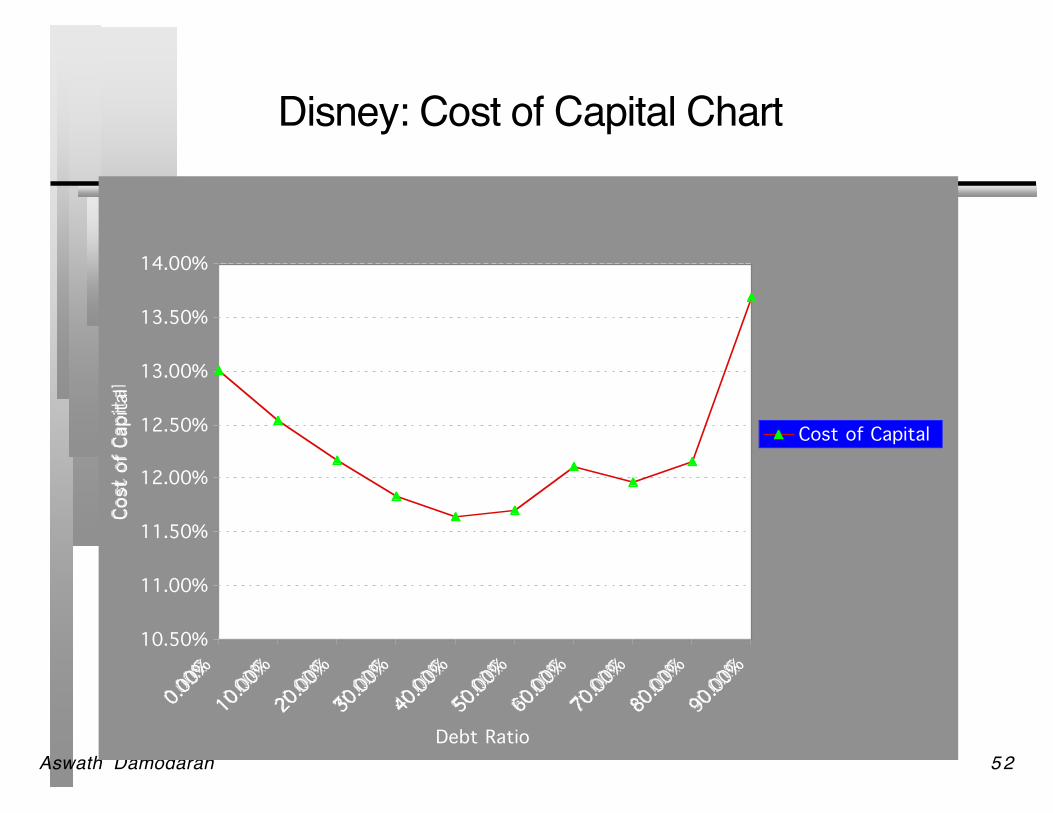
Debt Ratio Cost of Equity AT Cost of Debt Cost of Capital0.00% 13.00% 4.61% 13.00%10.00% 13.43% 4.61% 12.55%20.00% 13.96% 4.99% 12.17%30.00% 14.65% 5.28% 11.84%40.00% 15.56% 5.76% 11.64%50.00% 16.85% 6.56% 11.70%60.00% 18.77% 7.68% 12.11%70.00% 21.97% 7.68% 11.97%80.00% 28.95% 7.97% 12.17%90.00% 52.14% 9.42% 13.69%
Aswath Damodaran 52
Disney: Cost of Capital Chart
10.50%
11.00%
11.50%
12.00%
12.50%
13.00%
13.50%
14.00%
0.00%
10.00
%
20.00
%
30.00
%
40.00
%
50.00
%
60.00
%
70.00
%
80.00
%
90.00
%
Debt Ratio
Cost
of
Capi
tal
Cost of Capital

Aswath Damodaran 53
Effect on Firm Value
Firm Value before the change = 50,888+11,180= $ 62,068WACC b = 12.22% Annual Cost = $62,068 *12.22%= $7,583 millionWACC a = 11.64% Annual Cost = $62,068 *11.64% = $7,226 millionΔ WACC = 0.58% Change in Annual Cost = $ 357 million
If there is no growth in the firm value, (Conservative Estimate)• Increase in firm value = $357 / .1164 = $3,065 million• Change in Stock Price = $3,065/675.13= $4.54 per share
If there is growth (of 7.13%) in firm value over time,• Increase in firm value = $357 * 1.0713 /(.1164-.0713) = $ 8,474• Change in Stock Price = $8,474/675.13 = $12.55 per share
Implied Growth Rate obtained byFirm value Today =FCFF(1+g)/(WACC-g): Perpetual growth formula$62,068 = $2,947(1+g)/(.1222-g): Solve for g
Aswath Damodaran 54
A Test: The Repurchase Price
Let us suppose that the CFO of Disney approached you about buyingback stock. He wants to know the maximum price that he should bewilling to pay on the stock buyback. (The current price is $ 75.38)Assuming that firm value will grow by 7.13% a year, estimate themaximum price.
What would happen to the stock price after the buyback if you wereable to buy stock back at $ 75.38?
Aswath Damodaran 55
The Downside Risk
Doing What-if analysis on Operating Income• A. Standard Deviation Approach
– Standard Deviation In Past Operating Income– Standard Deviation In Earnings (If Operating Income Is Unavailable)– Reduce Base Case By One Standard Deviation (Or More)
• B. Past Recession Approach– Look At What Happened To Operating Income During The Last Recession.
(How Much Did It Drop In % Terms?)– Reduce Current Operating Income By Same Magnitude
Constraint on Bond Ratings
Aswath Damodaran 56
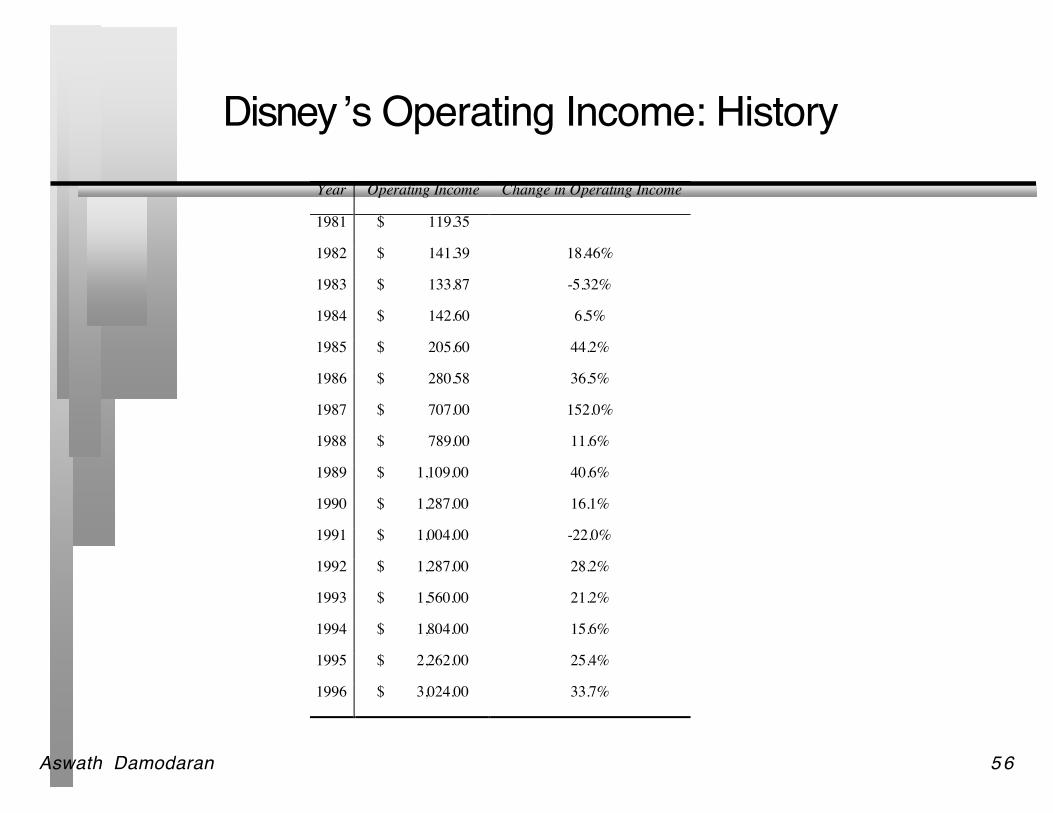
Disney ’s Operating Income: HistoryYear Operating Income Change in Operating Income
1981 $ 119.35
1982 $ 141.39 18.46%
1983 $ 133.87 -5.32%
1984 $ 142.60 6.5%
1985 $ 205.60 44.2%
1986 $ 280.58 36.5%
1987 $ 707.00 152.0%
1988 $ 789.00 11.6%
1989 $ 1,109.00 40.6%
1990 $ 1,287.00 16.1%
1991 $ 1,004.00 -22.0%
1992 $ 1,287.00 28.2%
1993 $ 1,560.00 21.2%
1994 $ 1,804.00 15.6%
1995 $ 2,262.00 25.4%
1996 $ 3,024.00 33.7%
Aswath Damodaran 57
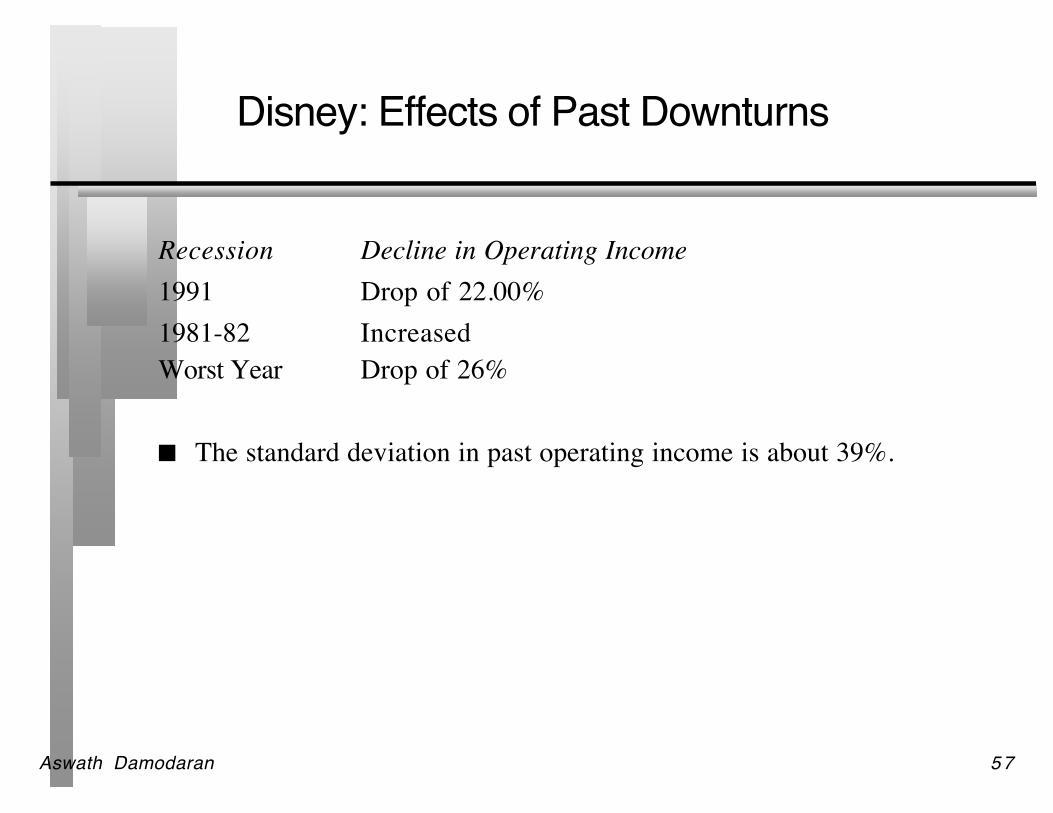
Disney: Effects of Past Downturns
Recession Decline in Operating Income1991 Drop of 22.00%1981-82 IncreasedWorst Year Drop of 26%
The standard deviation in past operating income is about 39%.
Aswath Damodaran 58
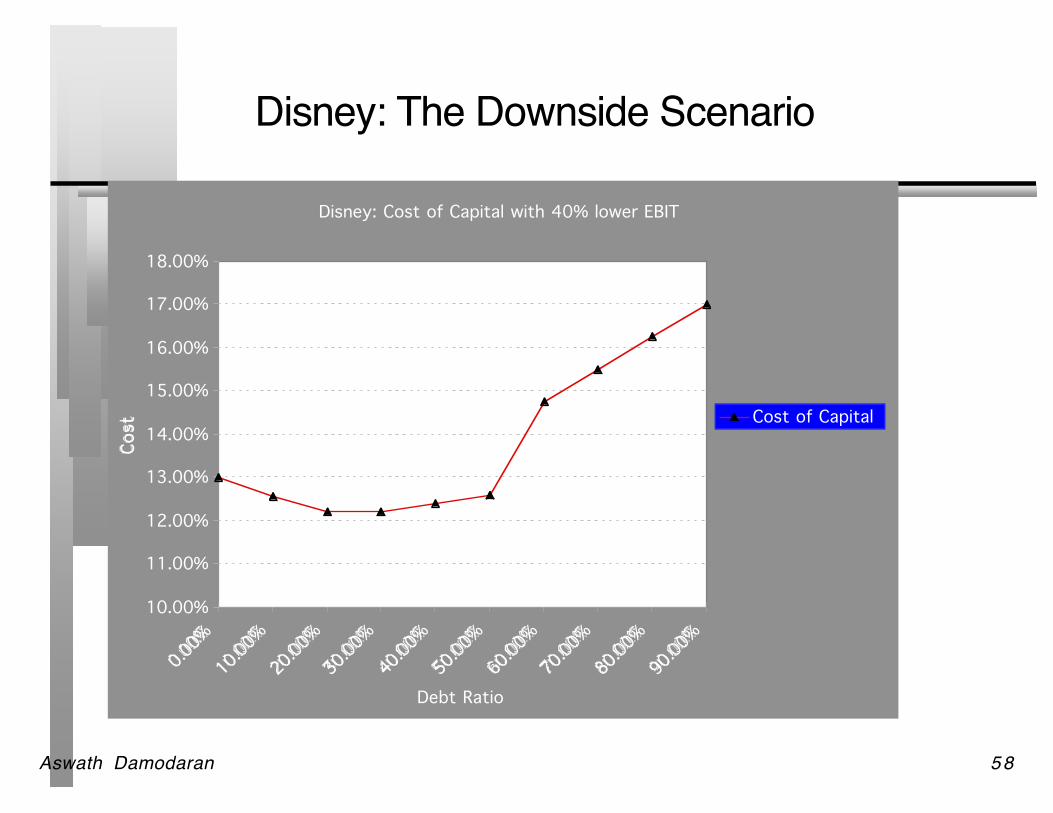
Disney: The Downside Scenario
Disney: Cost of Capital with 40% lower EBIT
10.00%
11.00%
12.00%
13.00%
14.00%
15.00%
16.00%
17.00%
18.00%
0.00%
10.00
%
20.00
%
30.00
%
40.00
%
50.00
%
60.00
%
70.00
%
80.00
%
90.00
%
Debt Ratio
Cost Cost of Capital

Aswath Damodaran 59
Constraints on Ratings
Management often specifies a 'desired Rating' below which they donot want to fall.
The rating constraint is driven by three factors• it is one way of protecting against downside risk in operating income (so
do not do both)• a drop in ratings might affect operating income• there is an ego factor associated with high ratings
Caveat: Every Rating Constraint Has A Cost.• Provide Management With A Clear Estimate Of How Much The Rating
Constraint Costs By Calculating The Value Of The Firm Without TheRating Constraint And Comparing To The Value Of The Firm With TheRating Constraint.
Aswath Damodaran 60
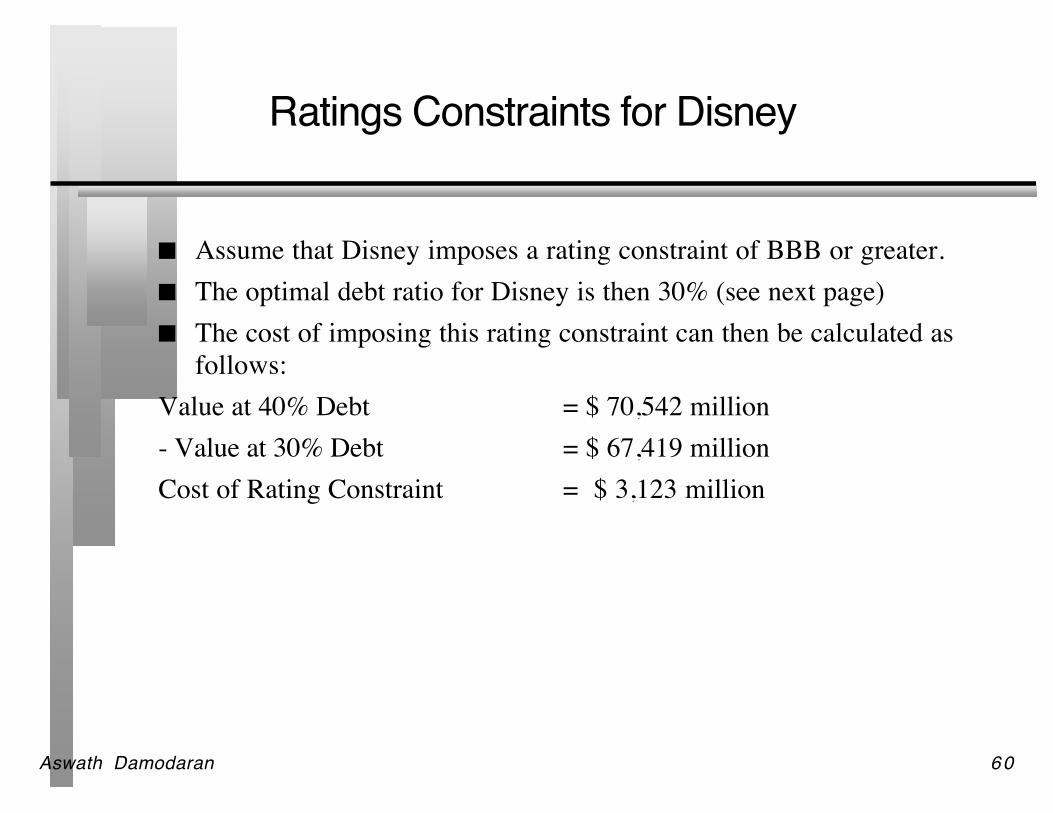
Ratings Constraints for Disney
Assume that Disney imposes a rating constraint of BBB or greater. The optimal debt ratio for Disney is then 30% (see next page) The cost of imposing this rating constraint can then be calculated as
follows:Value at 40% Debt = $ 70,542 million- Value at 30% Debt = $ 67,419 millionCost of Rating Constraint = $ 3,123 million
Aswath Damodaran 61
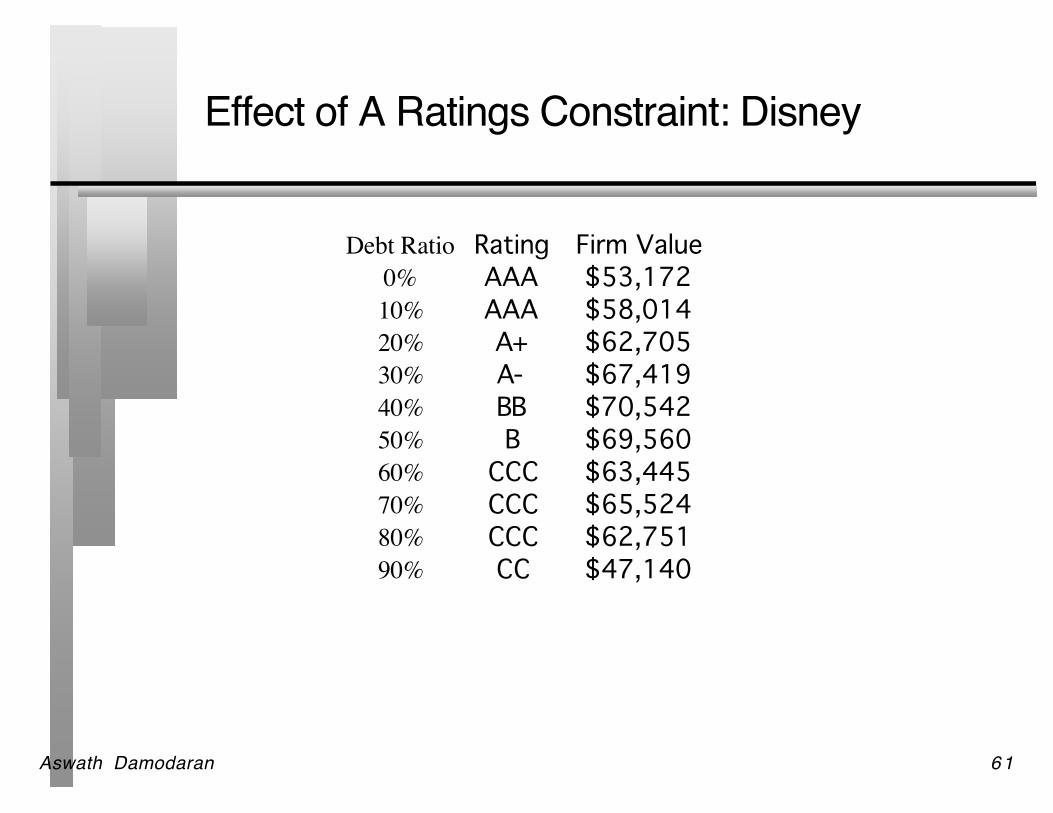
Effect of A Ratings Constraint: Disney
Debt Ratio Rating Firm Value0% AAA $53,17210% AAA $58,01420% A+ $62,70530% A- $67,41940% BB $70,54250% B $69,56060% CCC $63,44570% CCC $65,52480% CCC $62,75190% CC $47,140
Aswath Damodaran 62
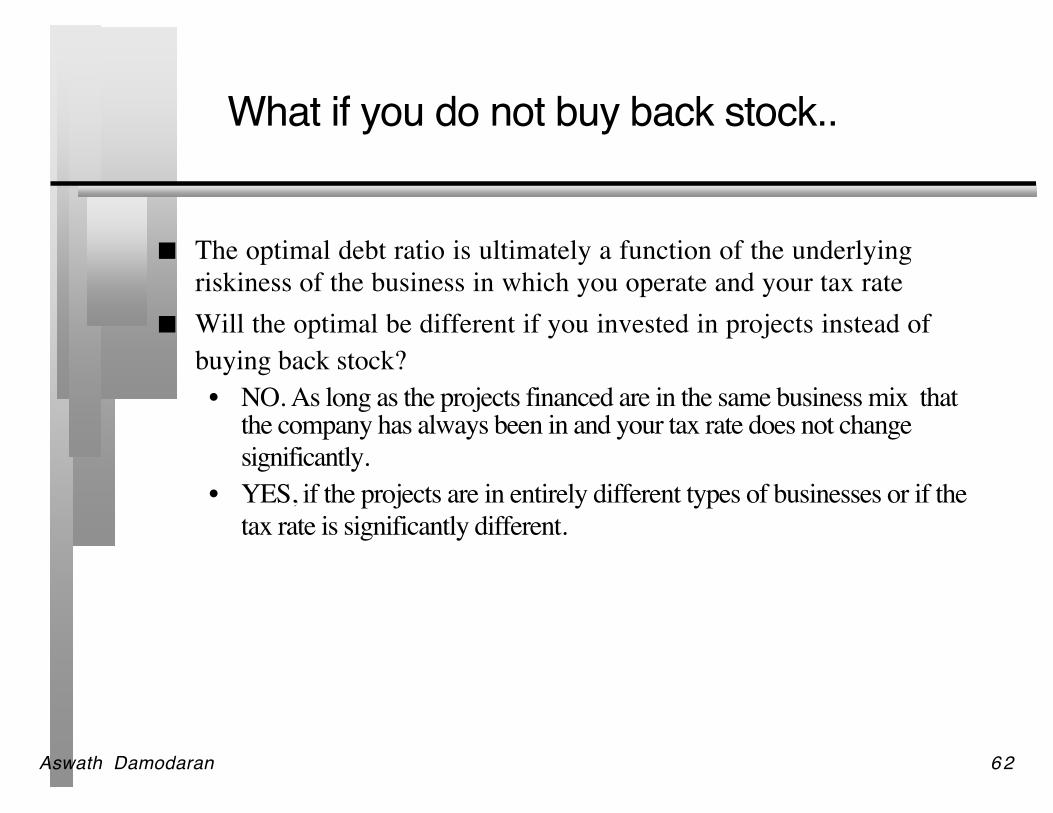
What if you do not buy back stock..
The optimal debt ratio is ultimately a function of the underlyingriskiness of the business in which you operate and your tax rate
Will the optimal be different if you invested in projects instead ofbuying back stock?• NO. As long as the projects financed are in the same business mix that
the company has always been in and your tax rate does not changesignificantly.
• YES, if the projects are in entirely different types of businesses or if thetax rate is significantly different.
Aswath Damodaran 63
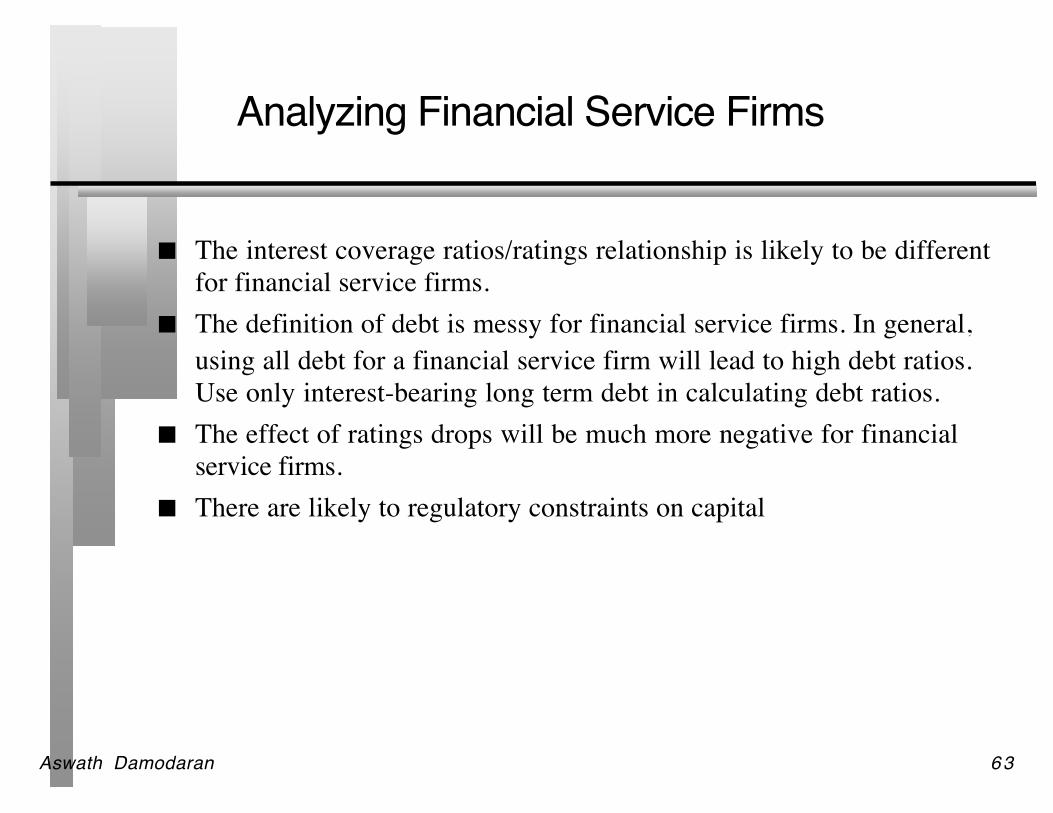
Analyzing Financial Service Firms
The interest coverage ratios/ratings relationship is likely to be differentfor financial service firms.
The definition of debt is messy for financial service firms. In general,using all debt for a financial service firm will lead to high debt ratios.Use only interest-bearing long term debt in calculating debt ratios.
The effect of ratings drops will be much more negative for financialservice firms.
There are likely to regulatory constraints on capital
Aswath Damodaran 64
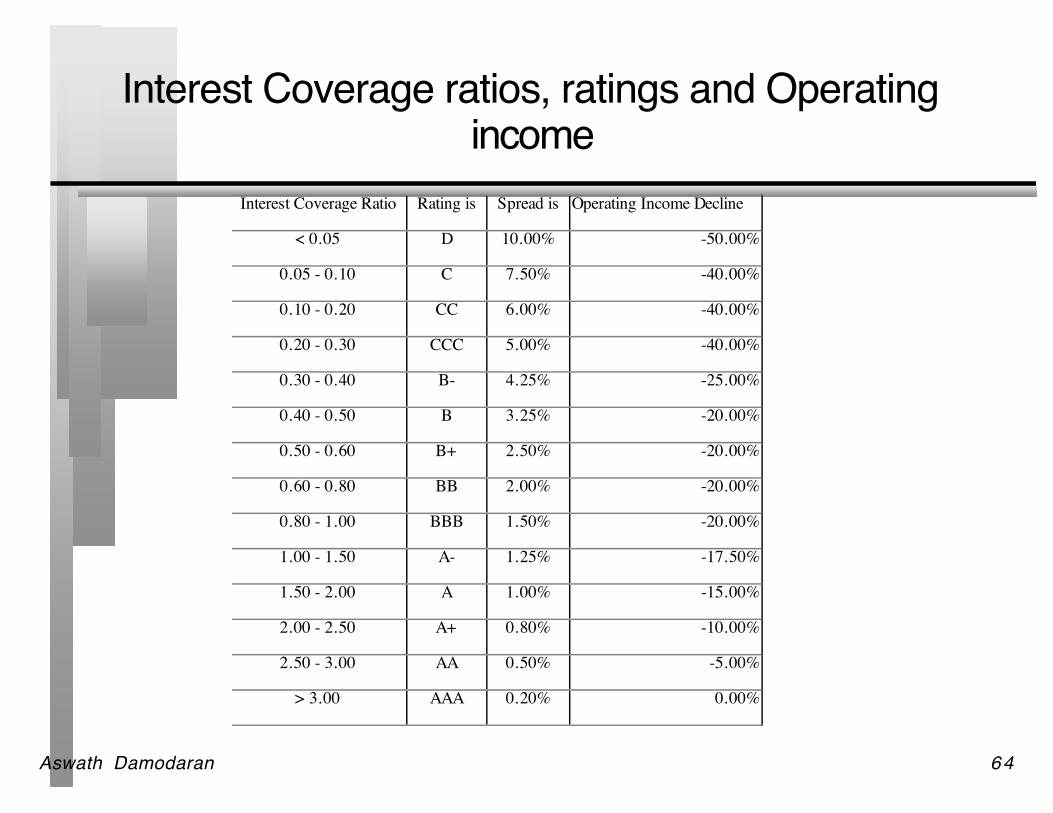
Interest Coverage ratios, ratings and Operatingincome
Interest Coverage Ratio Rating is Spread is Operating Income Decline
< 0.05 D 10.00% -50.00%
0.05 - 0.10 C 7.50% -40.00%
0.10 - 0.20 CC 6.00% -40.00%
0.20 - 0.30 CCC 5.00% -40.00%
0.30 - 0.40 B- 4.25% -25.00%
0.40 - 0.50 B 3.25% -20.00%
0.50 - 0.60 B+ 2.50% -20.00%
0.60 - 0.80 BB 2.00% -20.00%
0.80 - 1.00 BBB 1.50% -20.00%
1.00 - 1.50 A- 1.25% -17.50%
1.50 - 2.00 A 1.00% -15.00%
2.00 - 2.50 A+ 0.80% -10.00%
2.50 - 3.00 AA 0.50% -5.00%
> 3.00 AAA 0.20% 0.00%
Aswath Damodaran 65
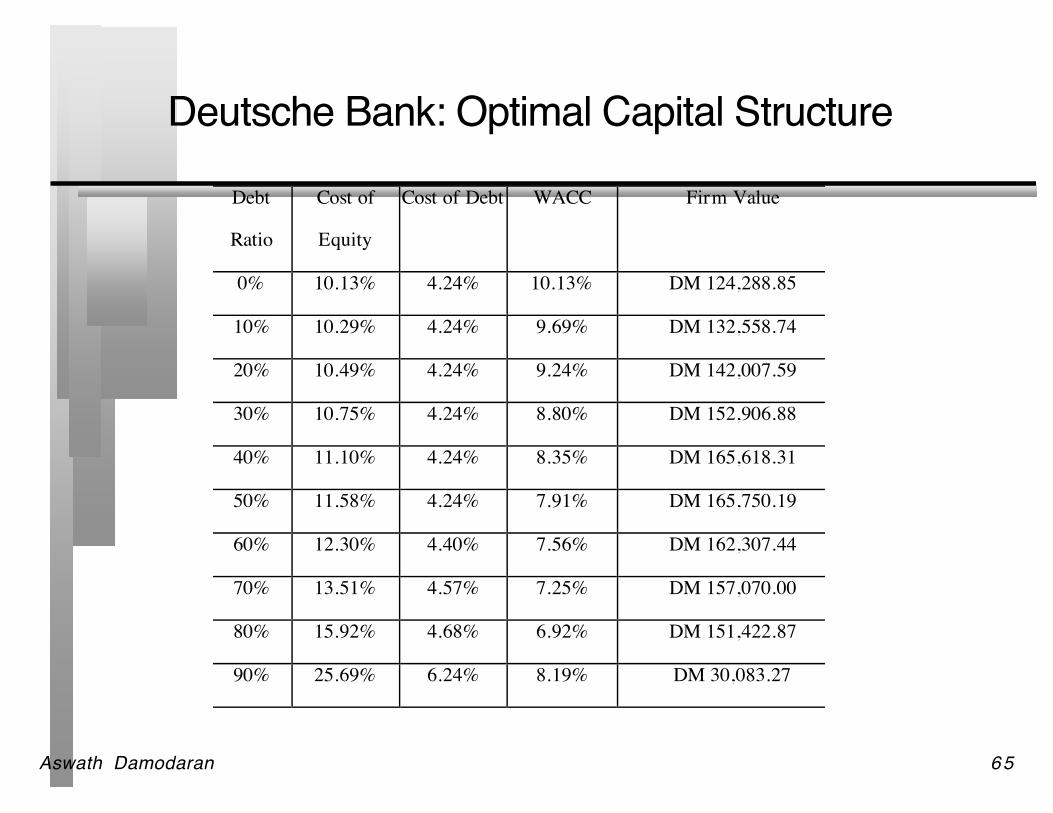
Deutsche Bank: Optimal Capital Structure
Debt
Ratio
Cost of
Equity
Cost of Debt WACC Firm Value
0% 10.13% 4.24% 10.13% DM 124,288.85
10% 10.29% 4.24% 9.69% DM 132,558.74
20% 10.49% 4.24% 9.24% DM 142,007.59
30% 10.75% 4.24% 8.80% DM 152,906.88
40% 11.10% 4.24% 8.35% DM 165,618.31
50% 11.58% 4.24% 7.91% DM 165,750.19
60% 12.30% 4.40% 7.56% DM 162,307.44
70% 13.51% 4.57% 7.25% DM 157,070.00
80% 15.92% 4.68% 6.92% DM 151,422.87
90% 25.69% 6.24% 8.19% DM 30,083.27
Aswath Damodaran 66
Analyzing Companies after Abnormal Years
The operating income that should be used to arrive at an optimal debtratio is a “normalized ” operating income
A normalized operating income is the income that this firm wouldmake in a normal year.• For a cyclical firm, this may mean using the average operating income
over an economic cycle rather than the latest year ’s income• For a firm which has had an exceptionally bad or good year (due to some
firm-specific event), this may mean using industry average returns oncapital to arrive at an optimal or looking at past years
• For any firm, this will mean not counting one time charges or profits
Aswath Damodaran 67
Analyzing Aracruz Cellulose ’s Optimal DebtRatio
In 1996, Aracruz had earnings before interest and taxes of only 15million BR, and claimed depreciation of 190 million Br. Capitalexpenditures amounted to 250 million BR.
Aracruz had debt outstanding of 1520 million BR. While the nominalrate on this debt, especially the portion that is in Brazilian Real, ishigh, we will continue to do the analysis in real terms, and use acurrent real cost of debt of 5.5%, which is based upon a real riskfreerate of 5% and a default spread of 0.5%.
The corporate tax rate in Brazil is estimated to be 32%. Aracruz had 976.10 million shares outstanding, trading 2.05 BR per
share. The beta of the stock is estimated, using comparable firms, to be0.71.
Aswath Damodaran 68
Setting up for the Analysis
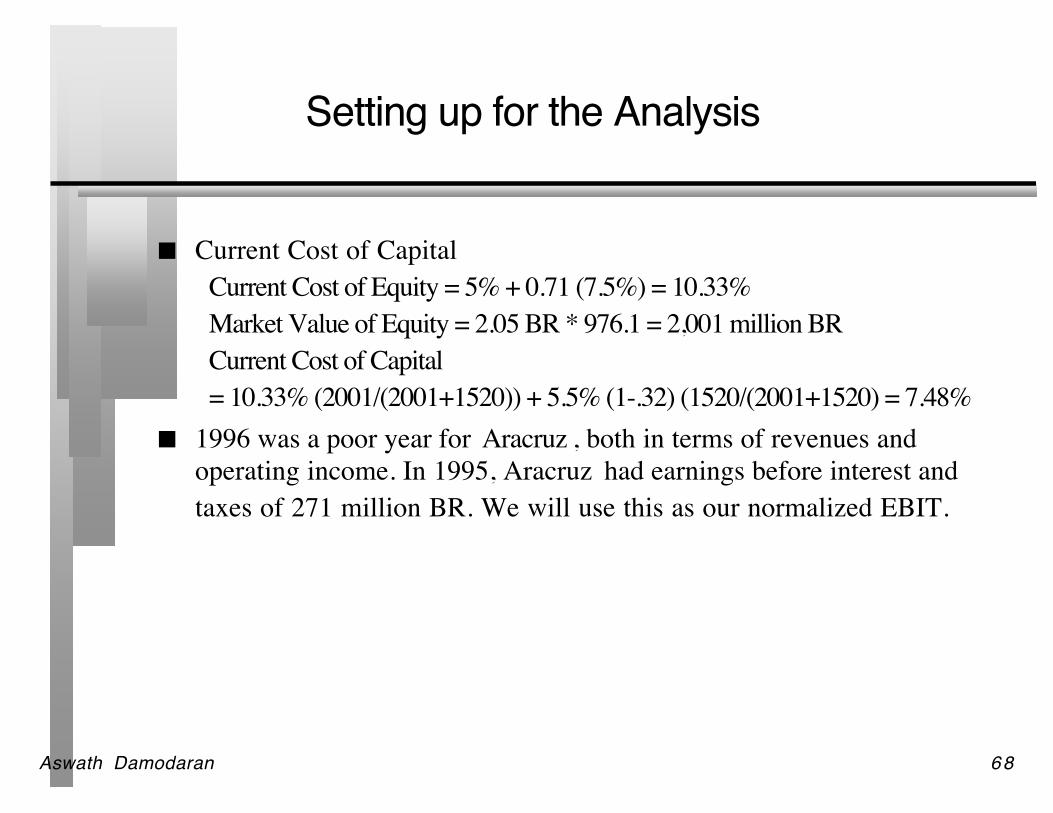
Current Cost of CapitalCurrent Cost of Equity = 5% + 0.71 (7.5%) = 10.33%Market Value of Equity = 2.05 BR * 976.1 = 2,001 million BRCurrent Cost of Capital= 10.33% (2001/(2001+1520)) + 5.5% (1-.32) (1520/(2001+1520) = 7.48%
1996 was a poor year for Aracruz , both in terms of revenues andoperating income. In 1995, Aracruz had earnings before interest andtaxes of 271 million BR. We will use this as our normalized EBIT.
Aswath Damodaran 69
Aracruz’s Optimal Debt Ratio
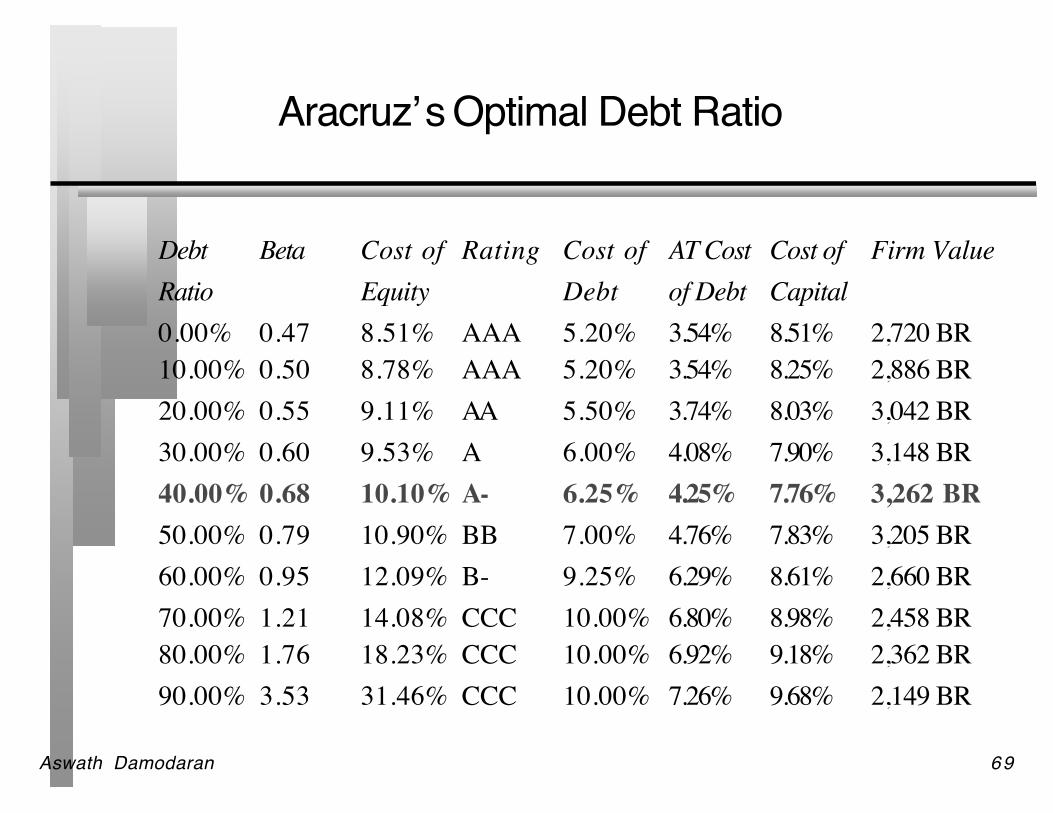
Debt Beta Cost of Rating Cost of AT Cost Cost of Firm ValueRatio Equity Debt of Debt Capital0.00% 0.47 8.51% AAA 5.20% 3.54% 8.51% 2,720 BR10.00% 0.50 8.78% AAA 5.20% 3.54% 8.25% 2,886 BR20.00% 0.55 9.11% AA 5.50% 3.74% 8.03% 3,042 BR30.00% 0.60 9.53% A 6.00% 4.08% 7.90% 3,148 BR40.00% 0.68 10.10% A- 6.25% 4.25% 7.76% 3,262 BR50.00% 0.79 10.90% BB 7.00% 4.76% 7.83% 3,205 BR60.00% 0.95 12.09% B- 9.25% 6.29% 8.61% 2,660 BR70.00% 1.21 14.08% CCC 10.00% 6.80% 8.98% 2,458 BR80.00% 1.76 18.23% CCC 10.00% 6.92% 9.18% 2,362 BR90.00% 3.53 31.46% CCC 10.00% 7.26% 9.68% 2,149 BR
Aswath Damodaran 70
Analyzing a Private Firm
The approach remains the same with important caveats• It is far more difficult estimating firm value, since the equity and the debt
of private firms do not trade• Most private firms are not rated.• If the cost of equity is based upon the market beta, it is possible that we
might be overstating the optimal debt ratio, since private firm ownersoften consider all risk.

Aswath Damodaran 71
Estimating the Optimal Debt Ratio for a PrivateBookstore
Adjusted EBIT = EBIT + Imputed Interest on Op. Lease Exp.= $ 2,000,000 + $ 252,000 = $ 2,252,000
While Bookscape has no debt outstanding, the present value of theoperating lease expenses of $ 3.36 million is considered as debt.
To estimate the market value of equity, we use a multiple of 22.41times of net income. This multiple is the average multiple at whichcomparable firms which are publicly traded are valued.
Estimated Market Value of Equity = Net Income * Average PE = 1,160,000* 22.41 = 26,000,000 The interest rates at different levels of debt will be estimated based
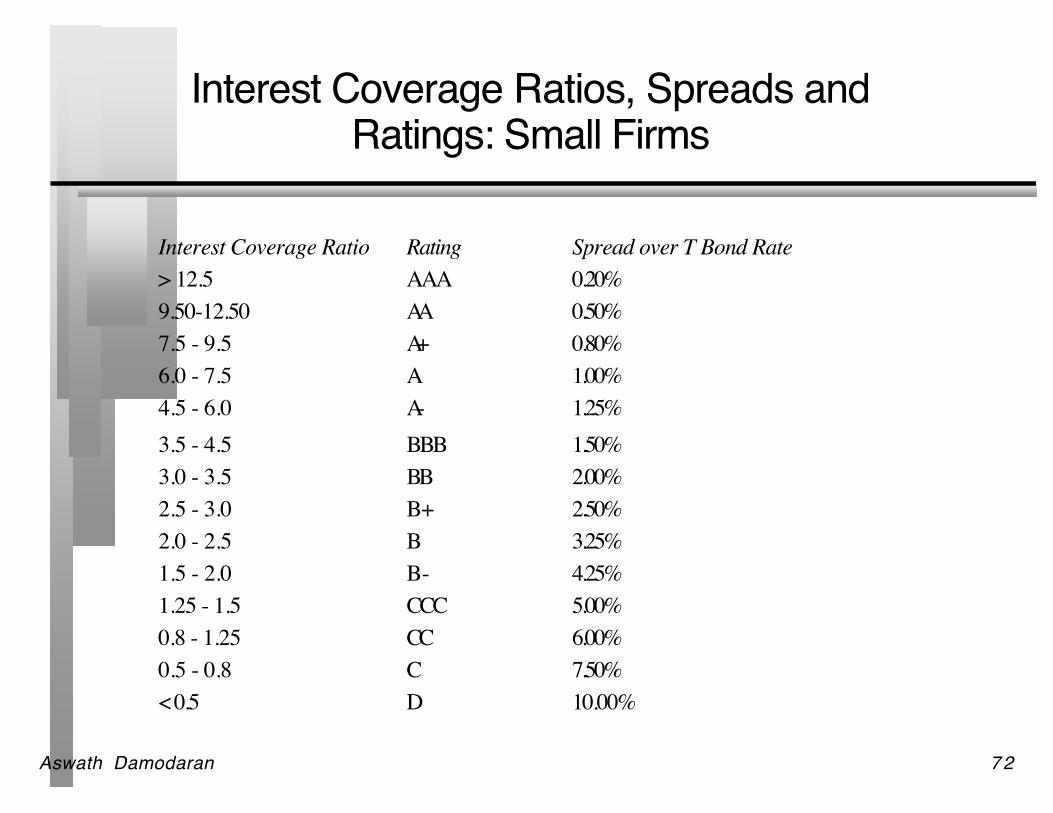
upon a “synthetic ” bond rating. This rating will be assessed usinginterest coverage ratios for small firms which are rated by S&P.
Aswath Damodaran 72
Interest Coverage Ratios, Spreads andRatings: Small Firms
Interest Coverage Ratio Rating Spread over T Bond Rate> 12.5 AAA 0.20%9.50-12.50 AA 0.50%7.5 - 9.5 A+ 0.80%6.0 - 7.5 A 1.00%4.5 - 6.0 A- 1.25%3.5 - 4.5 BBB 1.50%3.0 - 3.5 BB 2.00%2.5 - 3.0 B+ 2.50%2.0 - 2.5 B 3.25%1.5 - 2.0 B- 4.25%1.25 - 1.5 CCC 5.00%0.8 - 1.25 CC 6.00%0.5 - 0.8 C 7.50%< 0.5 D 10.00%

Aswath Damodaran 73
Optimal Debt Ratio for Bookscape
Debt Ratio Beta Cost of Equity Bond Rating Interest Rate AT Cost of Debt Cost of Capital Firm Value0% 1.03 12.65% AA 7.50% 4.35% 12.65% $26,78110% 1.09 13.01% AA 7.50% 4.35% 12.15% $29,11220% 1.18 13.47% BBB 8.50% 4.93% 11.76% $31,18230% 1.28 14.05% B+ 9.50% 5.51% 11.49% $32,80340% 1.42 14.83% B- 11.25% 6.53% 11.51% $32,67950% 1.62 15.93% CC 13.00% 7.54% 11.73% $31,34160% 1.97 17.84% CC 13.00% 7.96% 11.91% $30,33370% 2.71 21.91% C 14.50% 10.18% 13.70% $22,89180% 4.07 29.36% C 14.50% 10.72% 14.45% $20,70390% 8.13 51.72% C 14.50% 11.14% 15.20% $18,872
Aswath Damodaran 74
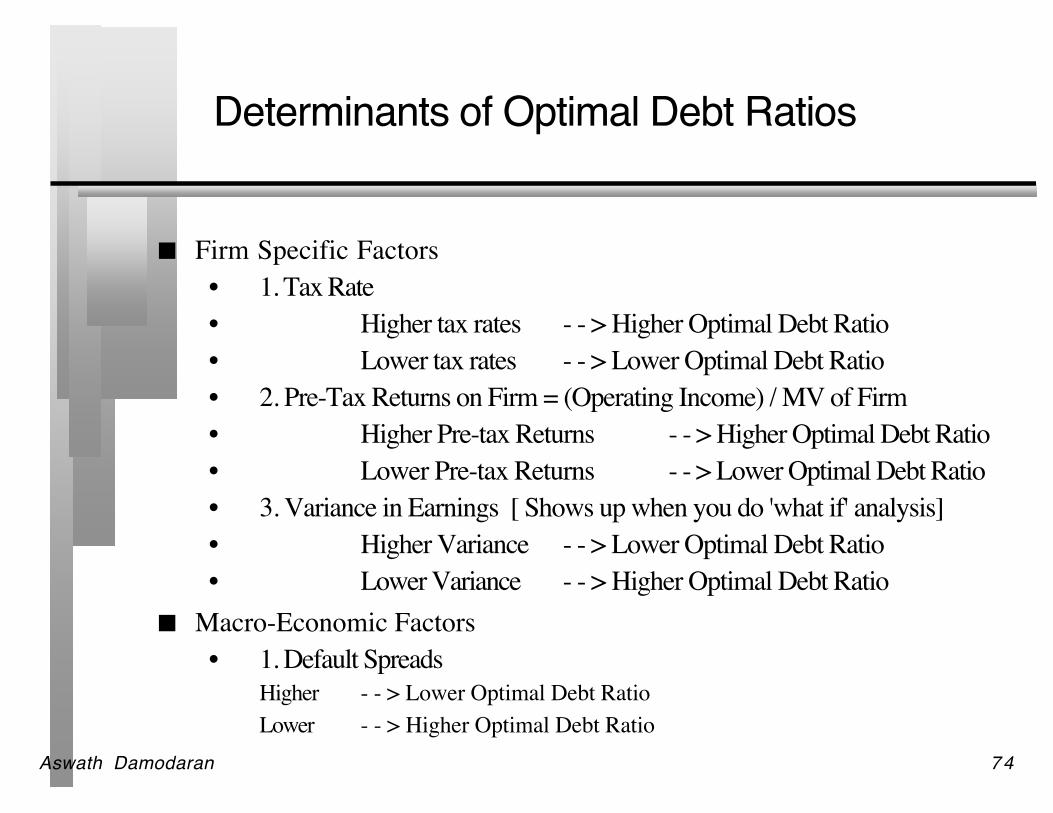
Determinants of Optimal Debt Ratios
Firm Specific Factors• 1. Tax Rate• Higher tax rates - - > Higher Optimal Debt Ratio• Lower tax rates - - > Lower Optimal Debt Ratio• 2. Pre-Tax Returns on Firm = (Operating Income) / MV of Firm• Higher Pre-tax Returns - - > Higher Optimal Debt Ratio• Lower Pre-tax Returns - - > Lower Optimal Debt Ratio• 3. Variance in Earnings [ Shows up when you do 'what if' analysis]• Higher Variance - - > Lower Optimal Debt Ratio• Lower Variance - - > Higher Optimal Debt Ratio
Macro-Economic Factors• 1. Default Spreads
Higher - - > Lower Optimal Debt RatioLower - - > Higher Optimal Debt Ratio
Aswath Damodaran 75
Application Test: Your firm’s optimalfinancing mix
Using the optimal capital structure spreadsheet provided:• Estimate the optimal debt ratio for your firm• Estimate the new cost of capital at the optimal• Estimate the effect of the change in the cost of capital on firm value• Estimate the effect on the stock price
In terms of the mechanics, what would you need to do to get to theoptimal immediately?
Aswath Damodaran 76
The APV Approach to Optimal CapitalStructure
In the adjusted present value approach, the value of the firm is writtenas the sum of the value of the firm without debt (the unlevered firm)and the effect of debt on firm value
Firm Value = Unlevered Firm Value + (Tax Benefits of Debt -Expected Bankruptcy Cost from the Debt)
The optimal dollar debt level is the one that maximizes firm value
Aswath Damodaran 77
Implementing the APV Approach
Step 1: Estimate the unlevered firm value. This can be done in one oftwo ways:• Estimating the unlevered beta, a cost of equity based upon the unlevered
beta and valuing the firm using this cost of equity (which will also be thecost of capital, with an unlevered firm)
• Alternatively, Unlevered Firm Value = Current Market Value of Firm -Tax Benefits of Debt (Current) + Expected Bankruptcy cost from Debt
Step 2: Estimate the tax benefits at different levels of debt. Thesimplest assumption to make is that the savings are perpetual, in whichcase• Tax benefits = Dollar Debt * Tax Rate
Step 3: Estimate a probability of bankruptcy at each debt level, andmultiply by the cost of bankruptcy (including both direct and indirectcosts) to estimate the expected bankruptcy cost.
Aswath Damodaran 78
Estimating Expected Bankruptcy Cost
Probability of Bankruptcy• Estimate the synthetic rating that the firm will have at each level of debt• Estimate the probability that the firm will go bankrupt over time, at that
level of debt (Use studies that have estimated the empirical probabilitiesof this occurring over time - Altman does an update every year)
Cost of Bankruptcy• The direct bankruptcy cost is the easier component. It is generally
between 5-10% of firm value, based upon empirical studies• The indirect bankruptcy cost is much tougher. It should be higher for
sectors where operating income is affected significantly by default risk(like airlines) and lower for sectors where it is not (like groceries)
Aswath Damodaran 79
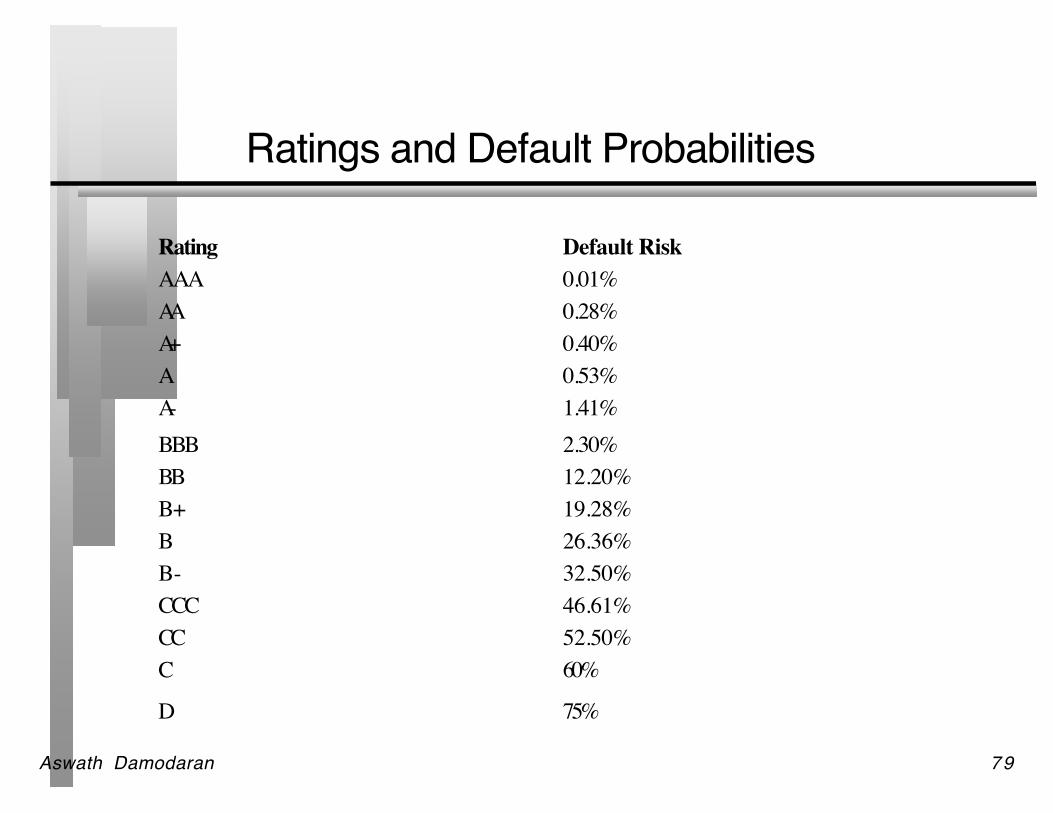
Ratings and Default Probabilities
Rating Default RiskAAA 0.01%AA 0.28%A+ 0.40%A 0.53%A- 1.41%BBB 2.30%BB 12.20%B+ 19.28%B 26.36%B- 32.50%CCC 46.61%CC 52.50%C 60%
D 75%
Aswath Damodaran 80
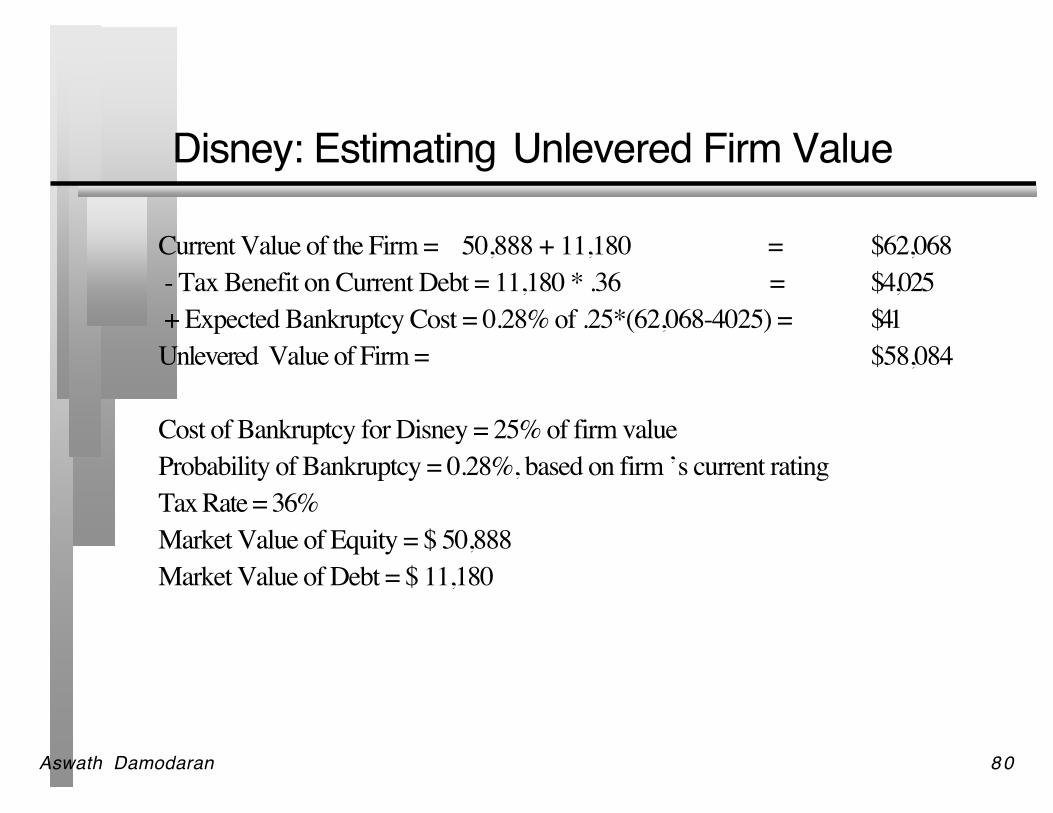
Disney: Estimating Unlevered Firm Value
Current Value of the Firm = 50,888 + 11,180 = $62,068 - Tax Benefit on Current Debt = 11,180 * .36 = $4,025 + Expected Bankruptcy Cost = 0.28% of .25*(62,068-4025) = $41 Unlevered Value of Firm = $58,084
Cost of Bankruptcy for Disney = 25% of firm valueProbability of Bankruptcy = 0.28%, based on firm ’s current ratingTax Rate = 36%Market Value of Equity = $ 50,888Market Value of Debt = $ 11,180
Aswath Damodaran 81
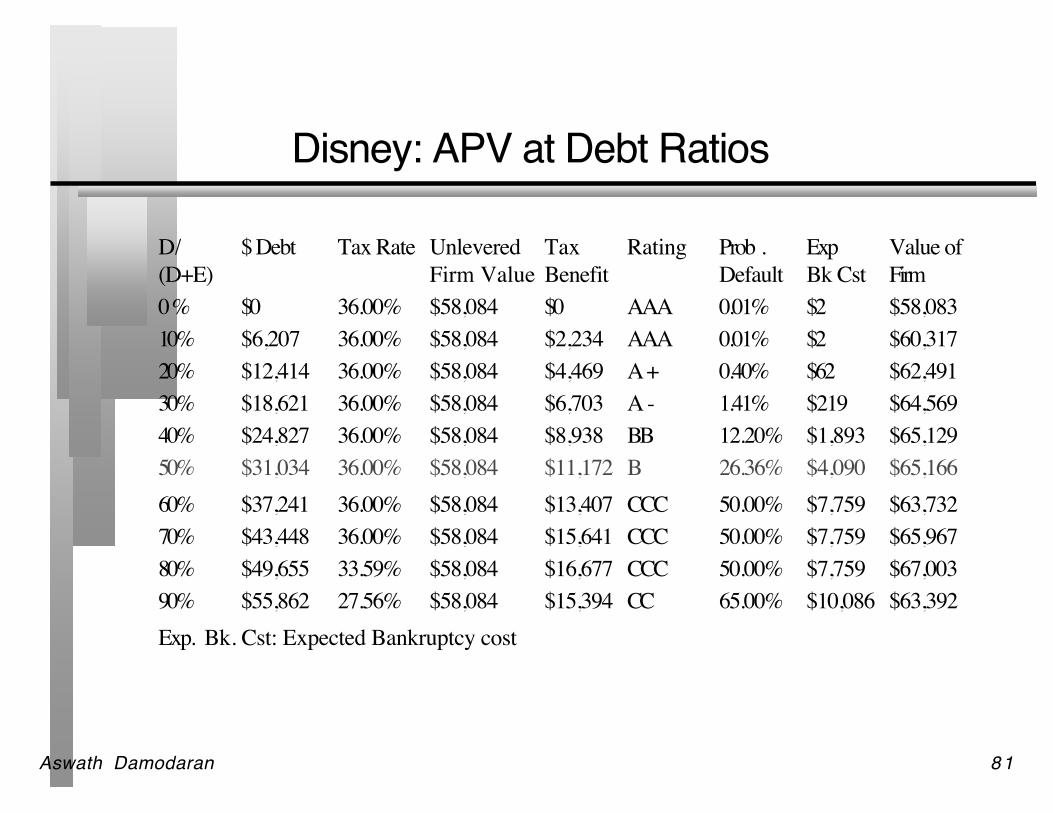
Disney: APV at Debt Ratios
D/ $ Debt Tax Rate Unlevered Tax Rating Prob . Exp Value of(D+E) Firm Value Benefit Default Bk Cst Firm0% $0 36.00% $58,084 $0 AAA 0.01% $2 $58,083 10% $6,207 36.00% $58,084 $2,234 AAA 0.01% $2 $60,317 20% $12,414 36.00% $58,084 $4,469 A+ 0.40% $62 $62,491 30% $18,621 36.00% $58,084 $6,703 A - 1.41% $219 $64,569 40% $24,827 36.00% $58,084 $8,938 BB 12.20% $1,893 $65,129 50% $31,034 36.00% $58,084 $11,172 B 26.36% $4,090 $65,166 60% $37,241 36.00% $58,084 $13,407 CCC 50.00% $7,759 $63,732 70% $43,448 36.00% $58,084 $15,641 CCC 50.00% $7,759 $65,967 80% $49,655 33.59% $58,084 $16,677 CCC 50.00% $7,759 $67,003 90% $55,862 27.56% $58,084 $15,394 CC 65.00% $10,086 $63,392Exp. Bk. Cst: Expected Bankruptcy cost
Aswath Damodaran 82
Relative Analysis
I. Industry Average with Subjective Adjustments The “safest” place for any firm to be is close to the industry average Subjective adjustments can be made to these averages to arrive at the
right debt ratio.• Higher tax rates -> Higher debt ratios (Tax benefits)• Lower insider ownership -> Higher debt ratios (Greater discipline)• More stable income -> Higher debt ratios (Lower bankruptcy costs)• More intangible assets -> Lower debt ratios (More agency problems)
Aswath Damodaran 83
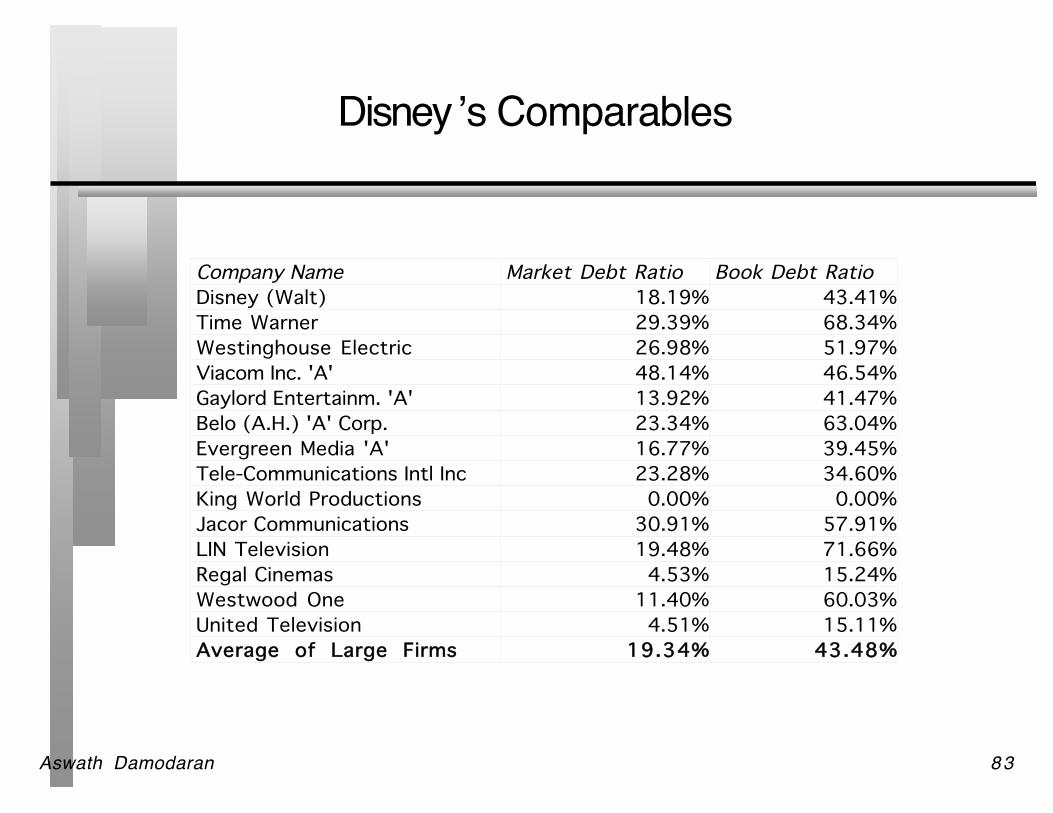
Disney ’s Comparables
Company Name Market Debt Ratio Book Debt RatioDisney (Walt) 18.19% 43.41%Time Warner 29.39% 68.34%Westinghouse Electric 26.98% 51.97%Viacom Inc. 'A' 48.14% 46.54%Gaylord Entertainm. 'A' 13.92% 41.47%Belo (A.H.) 'A' Corp. 23.34% 63.04%Evergreen Media 'A' 16.77% 39.45%Tele-Communications Intl Inc 23.28% 34.60%King World Productions 0.00% 0.00%Jacor Communications 30.91% 57.91%LIN Television 19.48% 71.66%Regal Cinemas 4.53% 15.24%Westwood One 11.40% 60.03%United Television 4.51% 15.11%Average of Large Firms 19.34% 43.48%
Aswath Damodaran 84
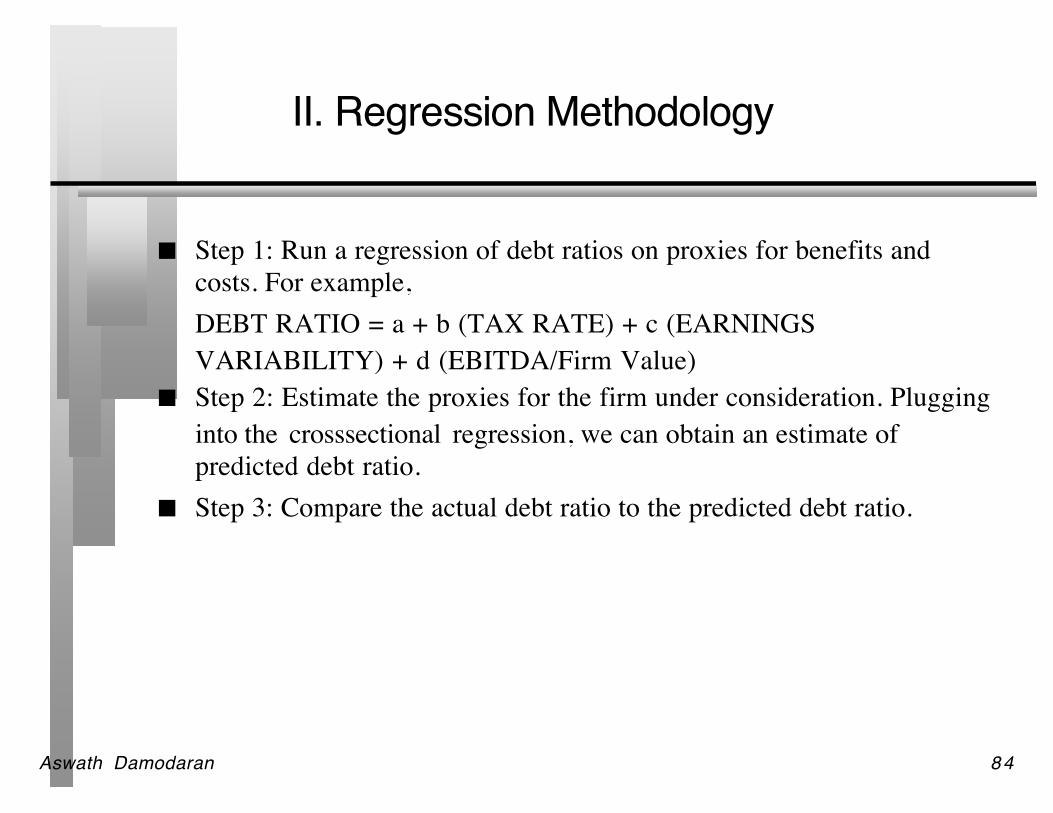
II. Regression Methodology
Step 1: Run a regression of debt ratios on proxies for benefits andcosts. For example,DEBT RATIO = a + b (TAX RATE) + c (EARNINGSVARIABILITY) + d (EBITDA/Firm Value)
Step 2: Estimate the proxies for the firm under consideration. Plugginginto the crosssectional regression, we can obtain an estimate ofpredicted debt ratio.
Step 3: Compare the actual debt ratio to the predicted debt ratio.
Aswath Damodaran 85
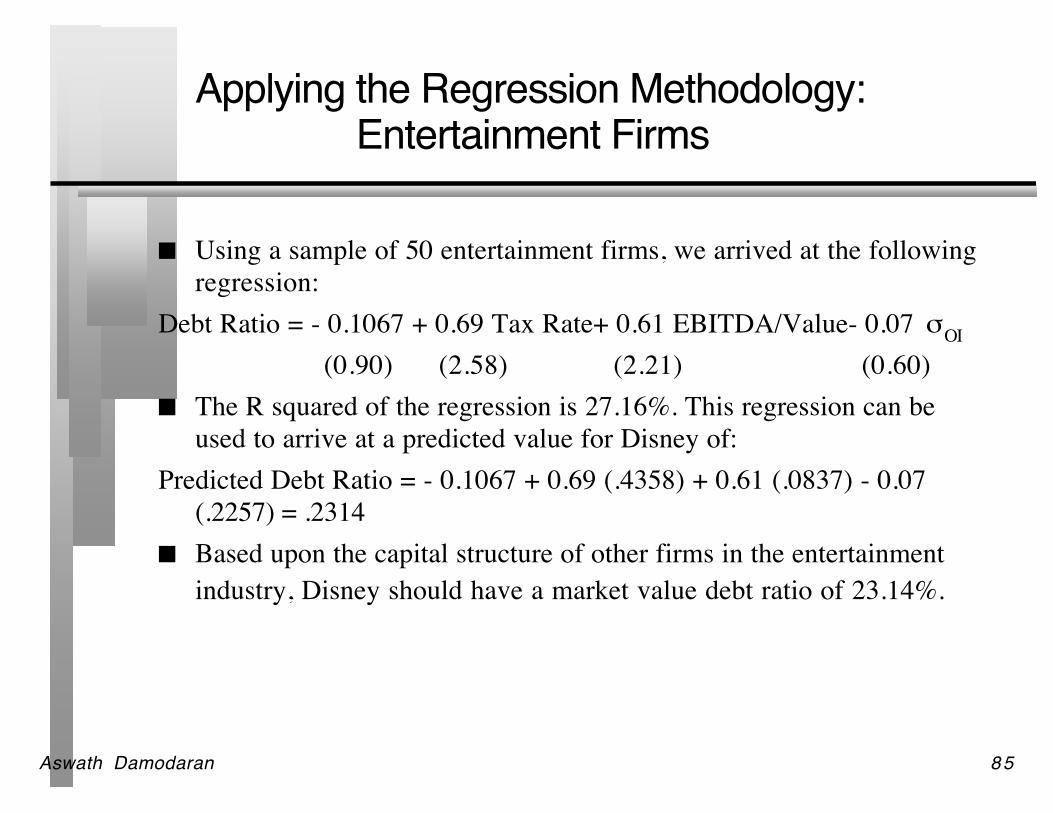
Applying the Regression Methodology:Entertainment Firms
Using a sample of 50 entertainment firms, we arrived at the followingregression:
Debt Ratio = - 0.1067 + 0.69 Tax Rate+ 0.61 EBITDA/Value- 0.07 σOI
(0.90) (2.58) (2.21) (0.60) The R squared of the regression is 27.16%. This regression can be
used to arrive at a predicted value for Disney of:Predicted Debt Ratio = - 0.1067 + 0.69 (.4358) + 0.61 (.0837) - 0.07
(.2257) = .2314 Based upon the capital structure of other firms in the entertainment
industry, Disney should have a market value debt ratio of 23.14%.
Aswath Damodaran 86
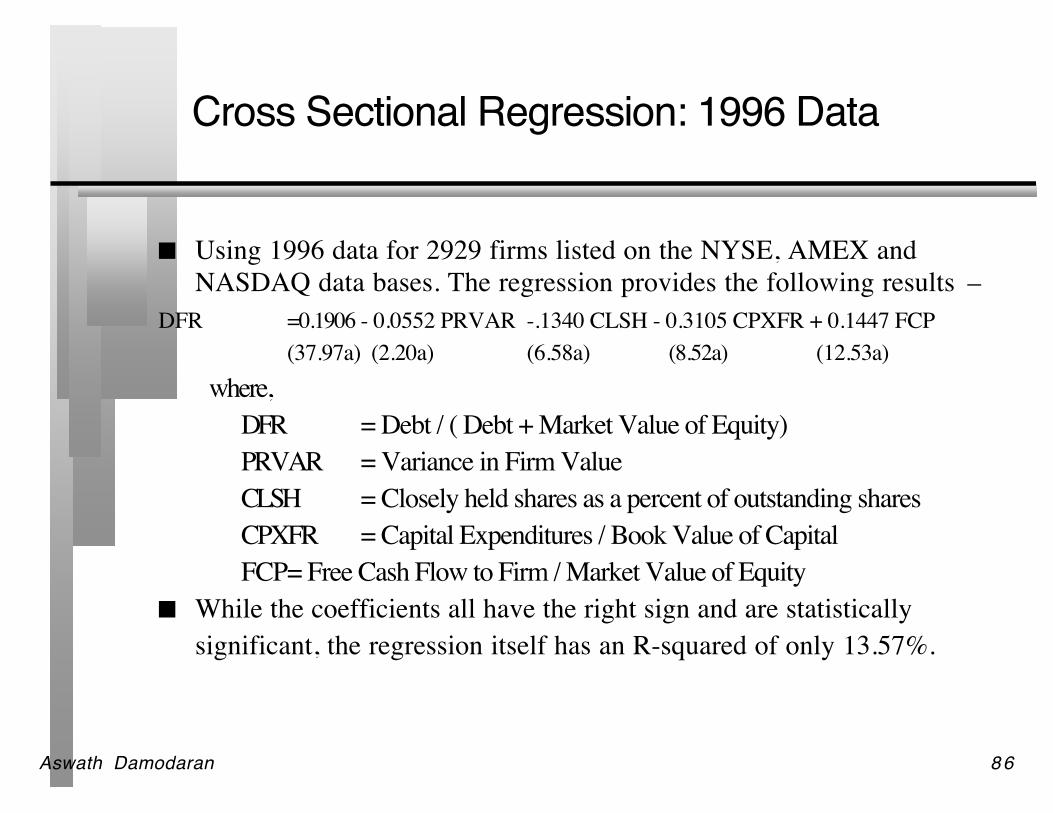
Cross Sectional Regression: 1996 Data
Using 1996 data for 2929 firms listed on the NYSE, AMEX andNASDAQ data bases. The regression provides the following results –
DFR =0.1906 - 0.0552 PRVAR -.1340 CLSH - 0.3105 CPXFR + 0.1447 FCP(37.97a) (2.20a) (6.58a) (8.52a) (12.53a)
where,DFR = Debt / ( Debt + Market Value of Equity)PRVAR = Variance in Firm ValueCLSH = Closely held shares as a percent of outstanding sharesCPXFR = Capital Expenditures / Book Value of CapitalFCP= Free Cash Flow to Firm / Market Value of Equity
While the coefficients all have the right sign and are statisticallysignificant, the regression itself has an R-squared of only 13.57%.
Aswath Damodaran 87
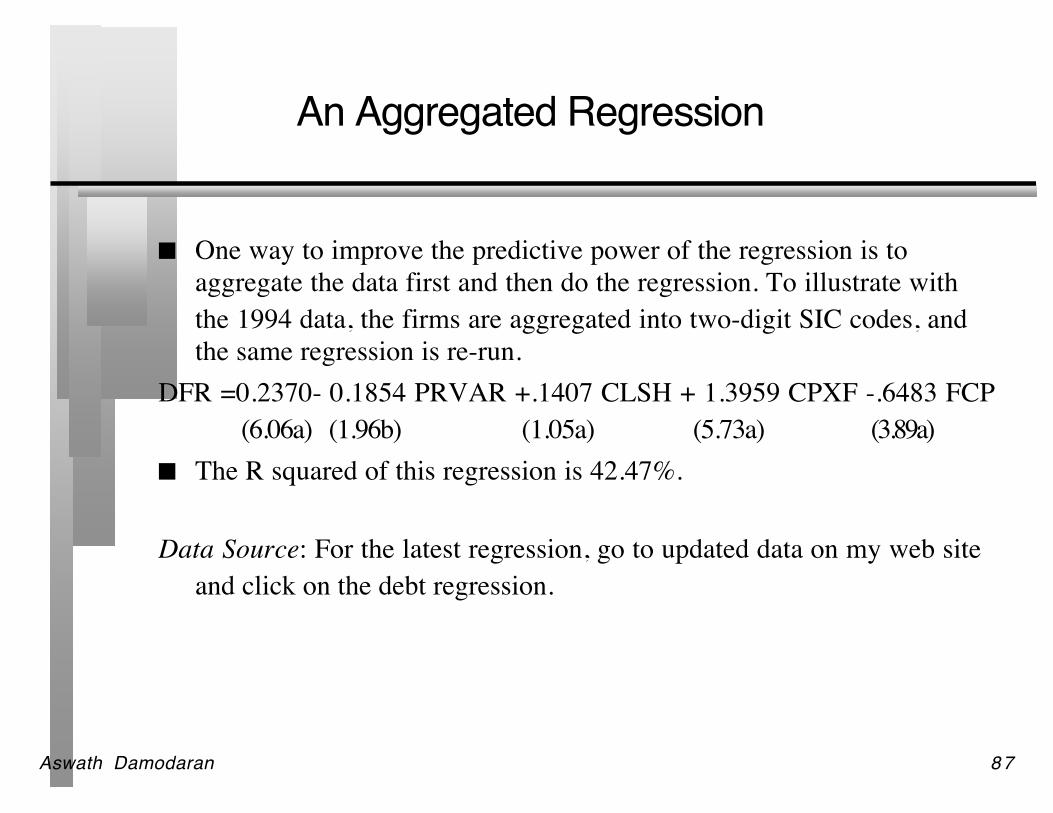
An Aggregated Regression
One way to improve the predictive power of the regression is toaggregate the data first and then do the regression. To illustrate withthe 1994 data, the firms are aggregated into two-digit SIC codes, andthe same regression is re-run.
DFR =0.2370- 0.1854 PRVAR +.1407 CLSH + 1.3959 CPXF -.6483 FCP(6.06a) (1.96b) (1.05a) (5.73a) (3.89a)
The R squared of this regression is 42.47%.
Data Source: For the latest regression, go to updated data on my web siteand click on the debt regression.
Aswath Damodaran 88
Applying the Regression
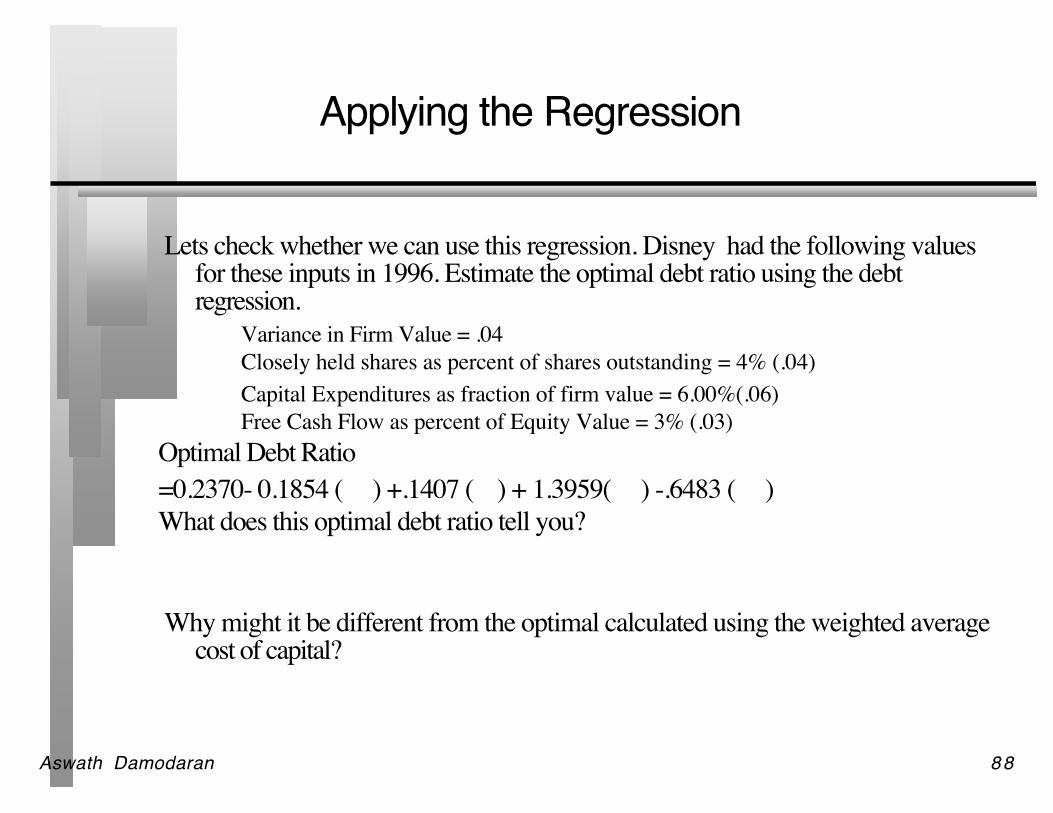
Lets check whether we can use this regression. Disney had the following valuesfor these inputs in 1996. Estimate the optimal debt ratio using the debtregression.
Variance in Firm Value = .04Closely held shares as percent of shares outstanding = 4% (.04)Capital Expenditures as fraction of firm value = 6.00%(.06)Free Cash Flow as percent of Equity Value = 3% (.03)
Optimal Debt Ratio=0.2370- 0.1854 ( ) +.1407 ( ) + 1.3959( ) -.6483 ( )What does this optimal debt ratio tell you?
Why might it be different from the optimal calculated using the weighted averagecost of capital?
Aswath Damodaran 89
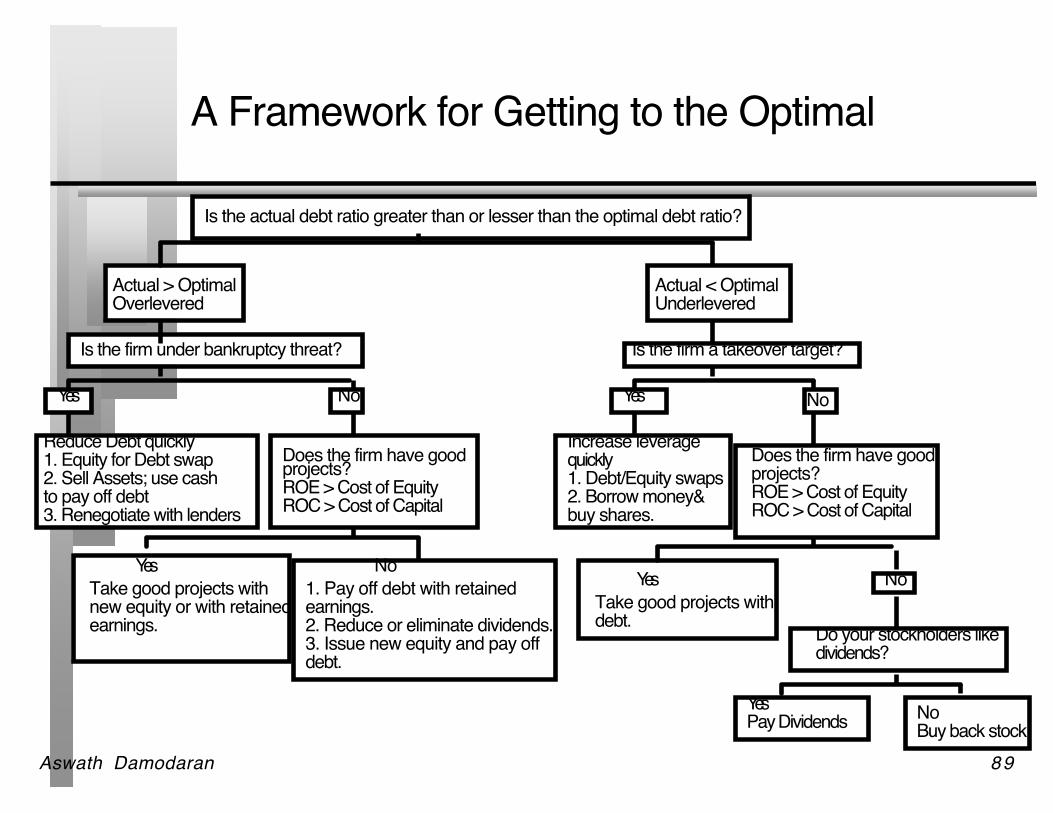
A Framework for Getting to the Optimal
Is the actual debt ratio greater than or lesser than the optimal debt ratio?
Actual > OptimalOverlevered
Actual < OptimalUnderlevered
Is the firm under bankruptcy threat? Is the firm a takeover target?
Yes No
Reduce Debt quickly1. Equity for Debt swap2. Sell Assets; use cashto pay off debt3. Renegotiate with lenders
Does the firm have good projects?ROE > Cost of EquityROC > Cost of Capital
YesTake good projects withnew equity or with retainedearnings.
No1. Pay off debt with retainedearnings.2. Reduce or eliminate dividends.3. Issue new equity and pay off debt.
Yes No
Does the firm have good projects?ROE > Cost of EquityROC > Cost of Capital
YesTake good projects withdebt.
No
Do your stockholders likedividends?
YesPay Dividends No
Buy back stock
Increase leveragequickly1. Debt/Equity swaps2. Borrow money&buy shares.
Aswath Damodaran 90
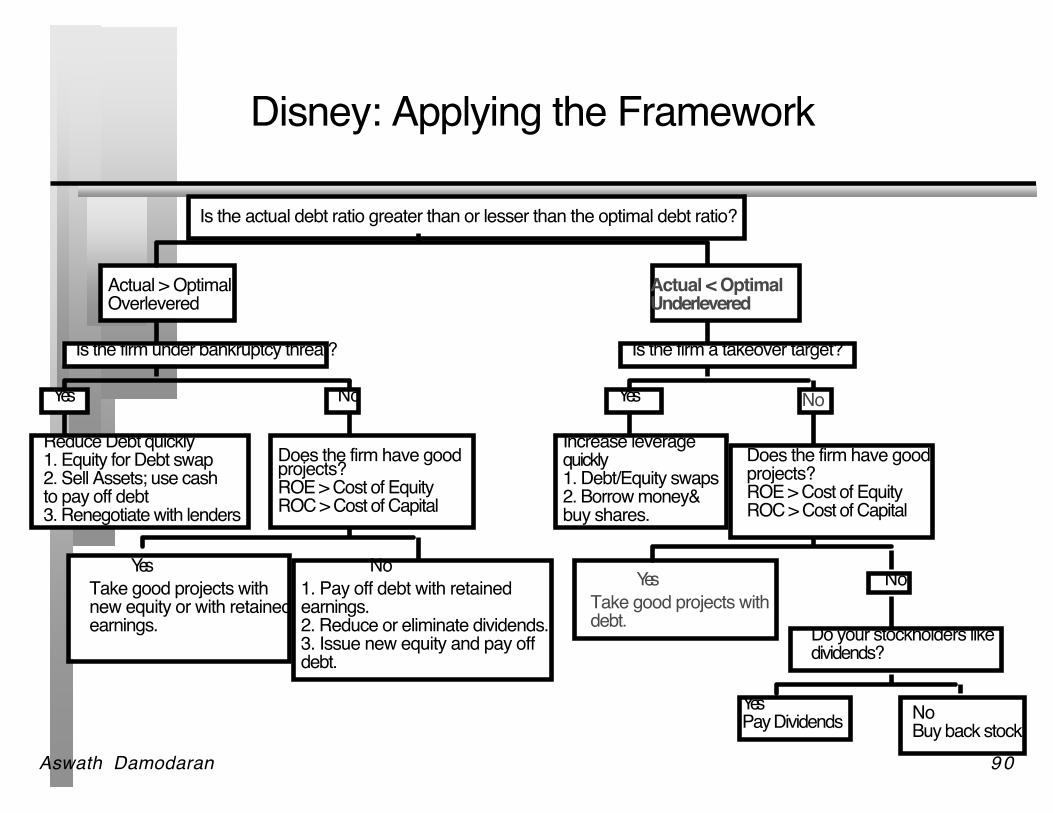
Disney: Applying the Framework
Is the actual debt ratio greater than or lesser than the optimal debt ratio?
Actual > OptimalOverlevered
Actual < OptimalUnderlevered
Is the firm under bankruptcy threat? Is the firm a takeover target?
Yes No
Reduce Debt quickly1. Equity for Debt swap2. Sell Assets; use cashto pay off debt3. Renegotiate with lenders
Does the firm have good projects?ROE > Cost of EquityROC > Cost of Capital
YesTake good projects withnew equity or with retainedearnings.
No1. Pay off debt with retainedearnings.2. Reduce or eliminate dividends.3. Issue new equity and pay off debt.
Yes No
Does the firm have good projects?ROE > Cost of EquityROC > Cost of Capital
YesTake good projects withdebt.
No
Do your stockholders likedividends?
YesPay Dividends No
Buy back stock
Increase leveragequickly1. Debt/Equity swaps2. Borrow money&buy shares.
Aswath Damodaran 91
Application Test: Getting to the Optimal
Based upon your analysis of both the firm ’s capital structure andinvestment record, what path would you map out for the firm?
Immediate change in leverage Gradual change in leverage No change in leverage Would you recommend that the firm change its financing mix by Paying off debt/Buying back equity Take projects with equity/debt
Aswath Damodaran 92
Designing Debt: The Fundamental Principle
The objective in designing debt is to make the cash flows on debtmatch up as closely as possible with the cash flows that the firm makeson its assets.
By doing so, we reduce our risk of default, increase debt capacity andincrease firm value.
Aswath Damodaran 93
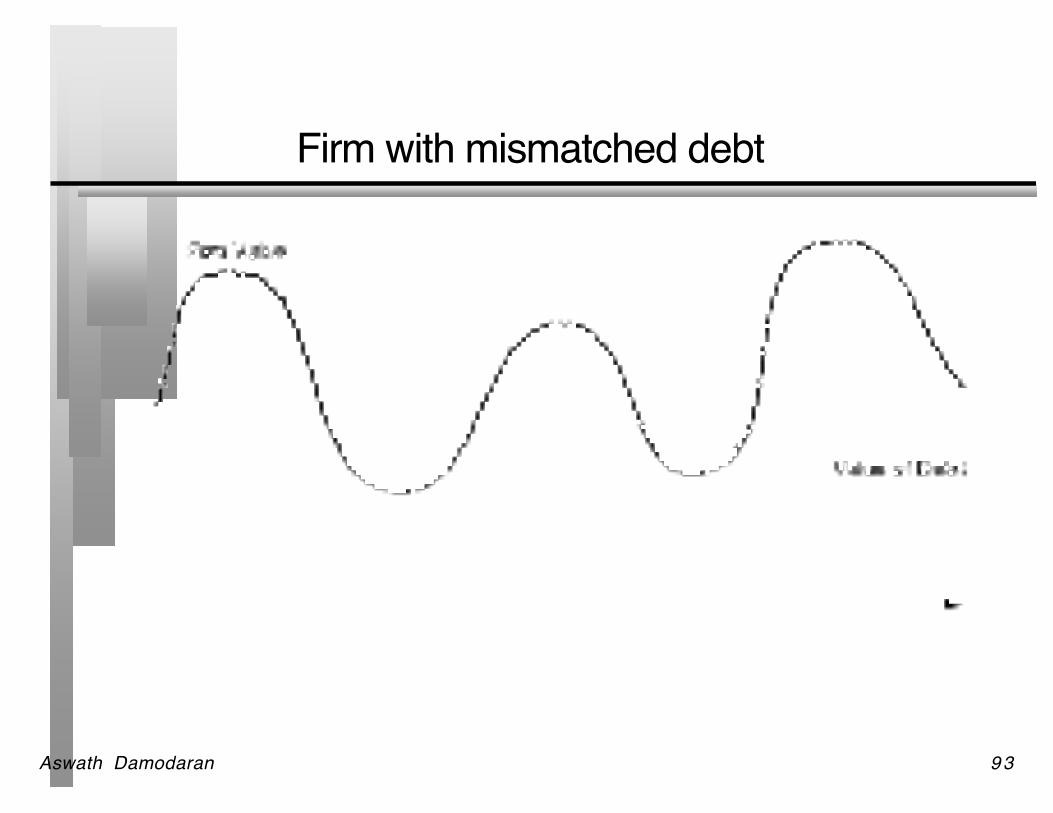
Firm with mismatched debt
Aswath Damodaran 94
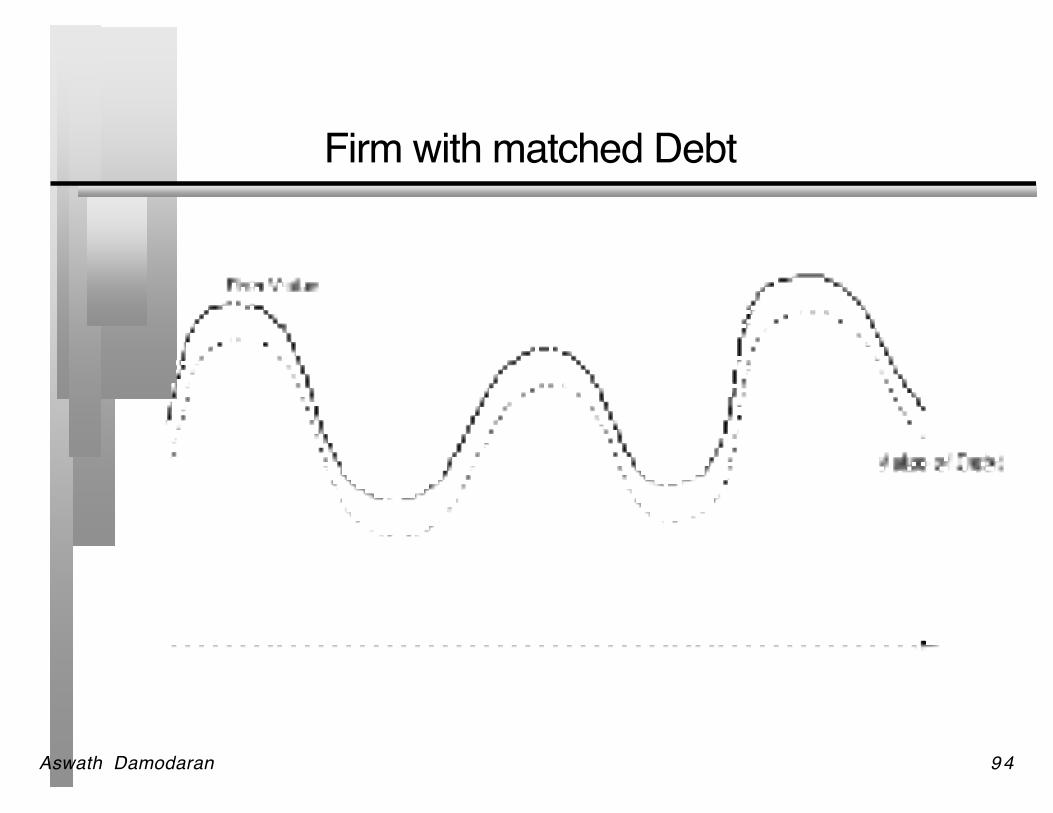
Firm with matched Debt
Aswath Damodaran 95
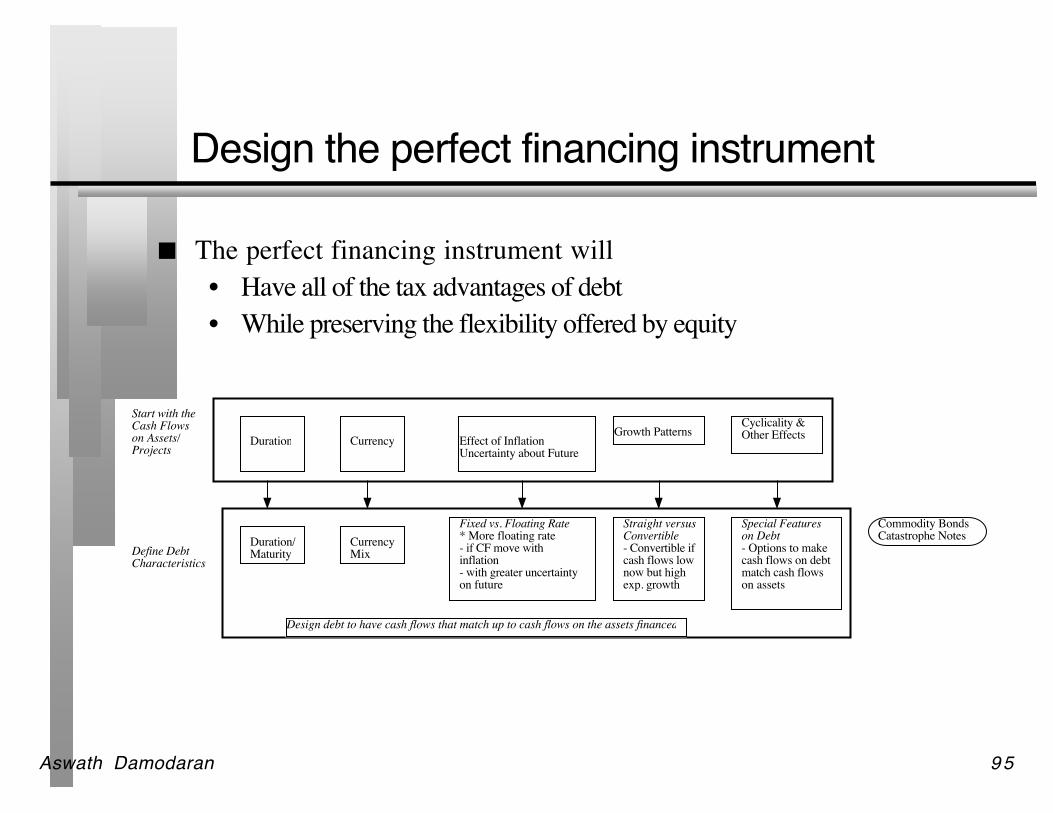
Design the perfect financing instrument
The perfect financing instrument will• Have all of the tax advantages of debt• While preserving the flexibility offered by equity
Duration Currency Effect of InflationUncertainty about Future
Growth PatternsCyclicality &Other Effects
Define DebtCharacteristics
Duration/Maturity
CurrencyMix
Fixed vs. Floating Rate* More floating rate - if CF move with inflation- with greater uncertainty on future
Straight versusConvertible- Convertible ifcash flows low now but highexp. growth
Special Featureson Debt- Options to make cash flows on debt match cash flows on assets
Start with the Cash Flowson Assets/Projects
Commodity BondsCatastrophe Notes
Design debt to have cash flows that match up to cash flows on the assets financed
Aswath Damodaran 96
Ensuring that you have not crossed the linedrawn by the tax code
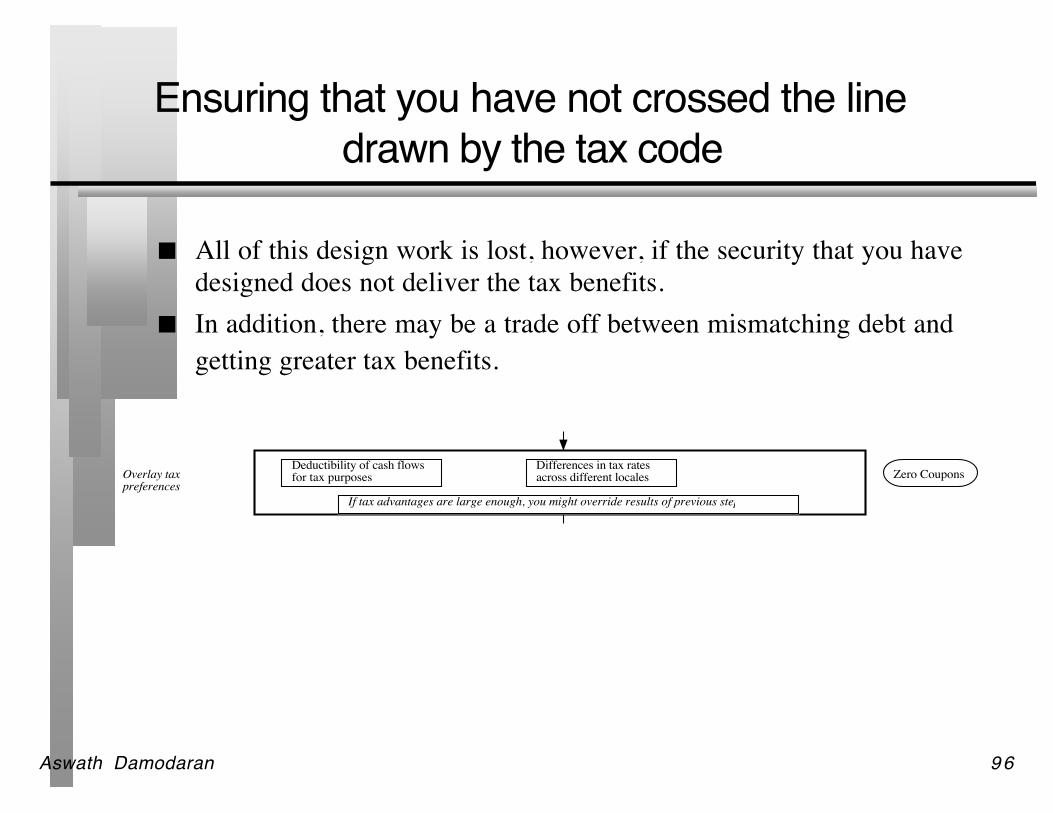
All of this design work is lost, however, if the security that you havedesigned does not deliver the tax benefits.
In addition, there may be a trade off between mismatching debt andgetting greater tax benefits.
Overlay taxpreferences
Deductibility of cash flowsfor tax purposes
Differences in tax ratesacross different locales
If tax advantages are large enough, you might override results of previous step
Zero Coupons
Aswath Damodaran 97
While keeping equity research analysts, ratingsagencies and regulators applauding
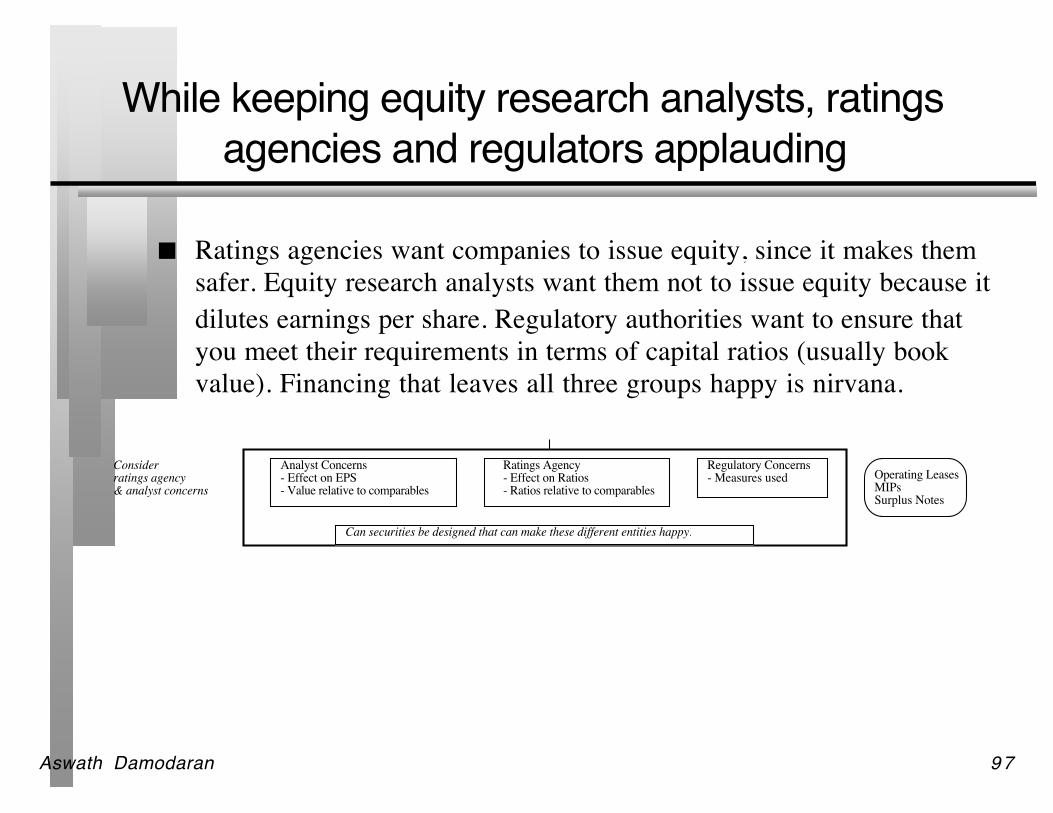
Ratings agencies want companies to issue equity, since it makes themsafer. Equity research analysts want them not to issue equity because itdilutes earnings per share. Regulatory authorities want to ensure thatyou meet their requirements in terms of capital ratios (usually bookvalue). Financing that leaves all three groups happy is nirvana.
Consider ratings agency& analyst concerns
Analyst Concerns- Effect on EPS- Value relative to comparables
Ratings Agency- Effect on Ratios- Ratios relative to comparables
Regulatory Concerns- Measures used
Can securities be designed that can make these different entities happy?
Operating LeasesMIPsSurplus Notes
Aswath Damodaran 98
Debt or Equity: The Strange Case of TrustPreferred
Trust preferred stock has• A fixed dividend payment, specified at the time of the issue• That is tax deductible• And failing to make the payment can cause ? (Can it cause default?)
When trust preferred was first created, ratings agencies treated it asequity. As they have become more savvy, ratings agencies have startedgiving firms only partial equity credit for trust preferred.
Aswath Damodaran 99
Debt, Equity and Quasi Equity
Assuming that trust preferred stock gets treated as equity by ratingsagencies, which of the following firms is the most appropriate firm tobe issuing it?
A firm that is under levered, but has a rating constraint that would beviolated if it moved to its optimal
A firm that is over levered that is unable to issue debt because of therating agency concerns.
Aswath Damodaran 100
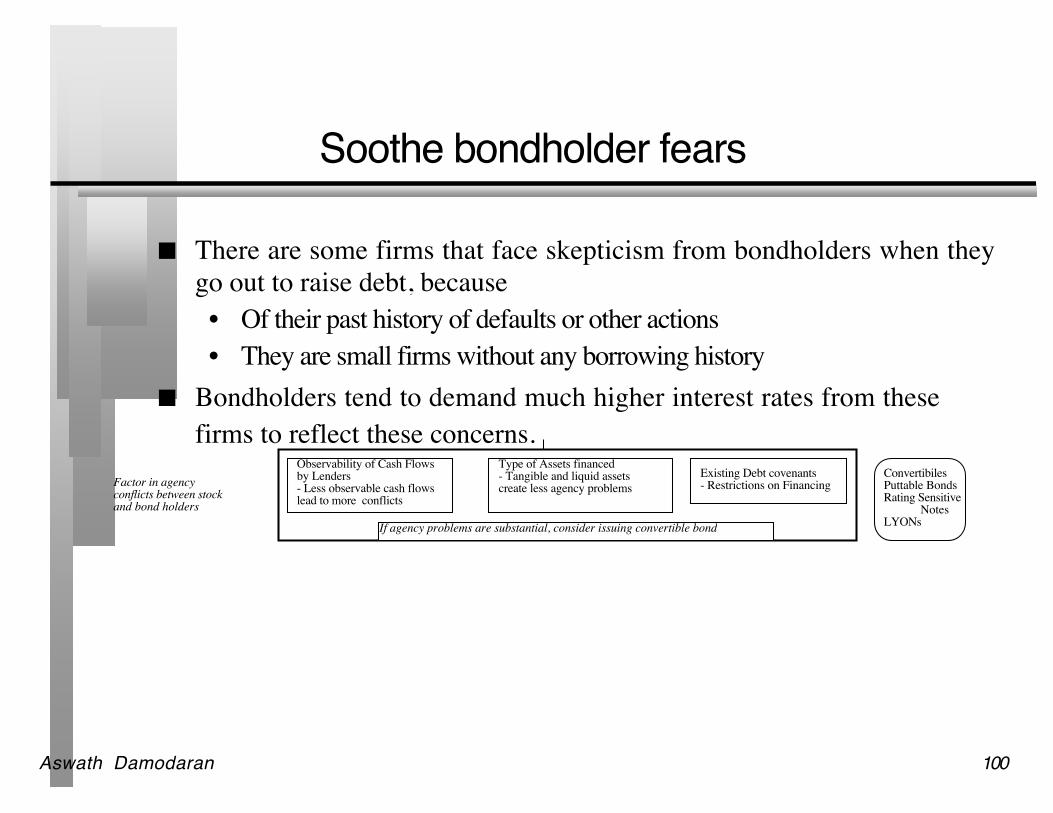
Soothe bondholder fears
There are some firms that face skepticism from bondholders when theygo out to raise debt, because• Of their past history of defaults or other actions• They are small firms without any borrowing history
Bondholders tend to demand much higher interest rates from thesefirms to reflect these concerns.
Factor in agencyconflicts between stockand bond holders
Observability of Cash Flowsby Lenders- Less observable cash flows lead to more conflicts
Type of Assets financed- Tangible and liquid assets create less agency problems
Existing Debt covenants- Restrictions on Financing
If agency problems are substantial, consider issuing convertible bonds
ConvertibilesPuttable BondsRating Sensitive
NotesLYONs
Aswath Damodaran 101
And do not lock in market mistakes that workagainst you
Ratings agencies can sometimes under rate a firm, and markets canunder price a firm ’s stock or bonds. If this occurs, firms should notlock in these mistakes by issuing securities for the long term. Inparticular,• Issuing equity or equity based products (including convertibles), when
equity is under priced transfers wealth from existing stockholders to thenew stockholders
• Issuing long term debt when a firm is under rated locks in rates at levelsthat are far too high, given the firm ’s default risk.
What is the solution• If you need to use equity?• If you need to use debt?

Aswath Damodaran 102
Designing Debt: Bringing it all together
Duration Currency Effect of InflationUncertainty about FutureGrowth Patterns Cyclicality &Other Effects
Define DebtCharacteristicsDuration/Maturity CurrencyMix
Fixed vs. Floating Rate* More floating rate - if CF move with inflation- with greater uncertainty on future
Straight versusConvertible- Convertible ifcash flows low now but highexp. growth
Special Featureson Debt- Options to make cash flows on debt match cash flows on assets
Start with the Cash Flowson Assets/Projects
Overlay taxpreferencesDeductibility of cash flowsfor tax purposes Differences in tax ratesacross different locales
Consider ratings agency& analyst concerns
Analyst Concerns- Effect on EPS- Value relative to comparables
Ratings Agency- Effect on Ratios- Ratios relative to comparables
Regulatory Concerns- Measures used
Factor in agencyconflicts between stockand bond holders
Observability of Cash Flowsby Lenders- Less observable cash flows lead to more conflicts
Type of Assets financed- Tangible and liquid assets create less agency problems
Existing Debt covenants- Restrictions on Financing
Consider Information Asymmetries
Uncertainty about Future Cashflows- When there is more uncertainty, itmay be better to use short term debt
Credibility & Quality of the Firm- Firms with credibility problemswill issue more short term debt
If agency problems are substantial, consider issuing convertible bonds
Can securities be designed that can make these different entities happy?
If tax advantages are large enough, you might override results of previous stepZero Coupons
Operating LeasesMIPsSurplus Notes
ConvertibilesPuttable BondsRating SensitiveNotesLYONs
Commodity BondsCatastrophe Notes
Design debt to have cash flows that match up to cash flows on the assets financed
Aswath Damodaran 103
Approaches for evaluating Asset Cash Flows
I. Intuitive Approach• Are the projects typically long term or short term? What is the cash flow
pattern on projects?• How much growth potential does the firm have relative to current
projects?• How cyclical are the cash flows? What specific factors determine the cash
flows on projects? II. Project Cash Flow Approach
• Project cash flows on a typical project for the firm• Do scenario analyses on these cash flows, based upon different macro
economic scenarios III. Historical Data
• Operating Cash Flows• Firm Value
Aswath Damodaran 104
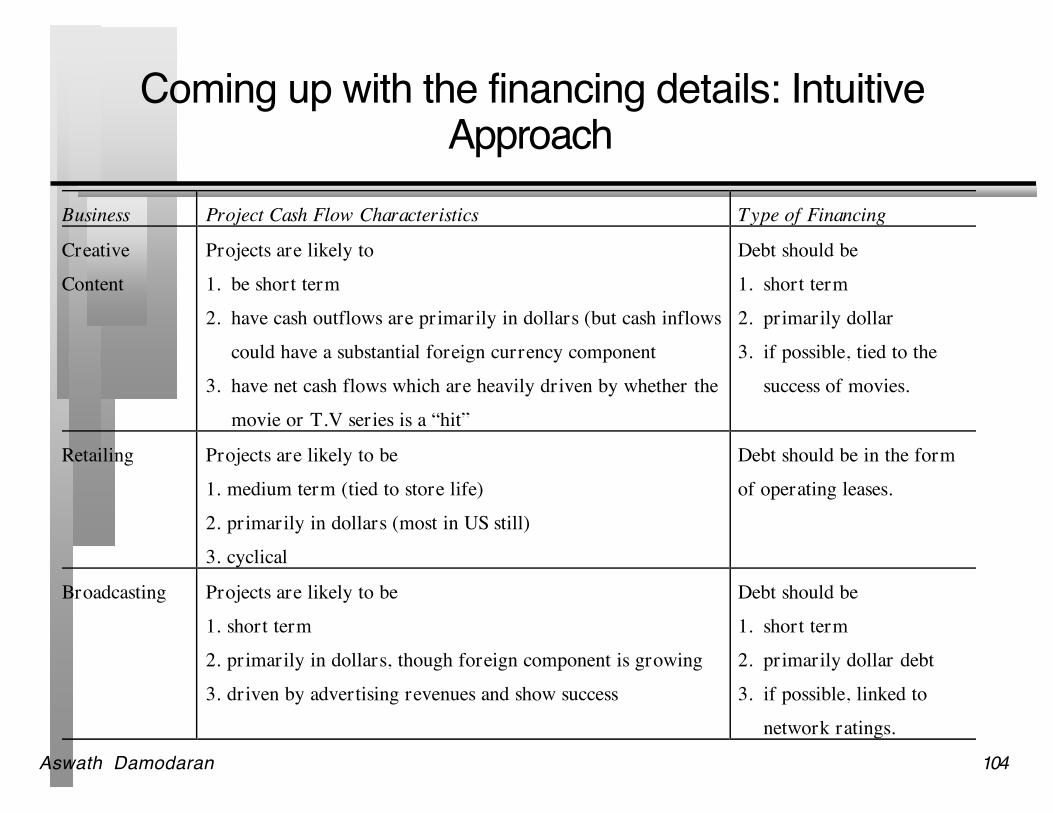
Coming up with the financing details: IntuitiveApproach
Business Project Cash Flow Characteristics Type of Financing
CreativeContent
Projects are likely to1. be short term2. have cash outflows are primarily in dollars (but cash inflows
could have a substantial foreign currency component3. have net cash flows which are heavily driven by whether the
movie or T.V series is a “hit”
Debt should be1. short term2. primarily dollar3. if possible, tied to the
success of movies.
Retailing Projects are likely to be1. medium term (tied to store life)2. primarily in dollars (most in US still)3. cyclical
Debt should be in the formof operating leases.
Broadcasting Projects are likely to be1. short term2. primarily in dollars, though foreign component is growing3. driven by advertising revenues and show success
Debt should be1. short term2. primarily dollar debt3. if possible, linked to
network ratings.
Aswath Damodaran 105
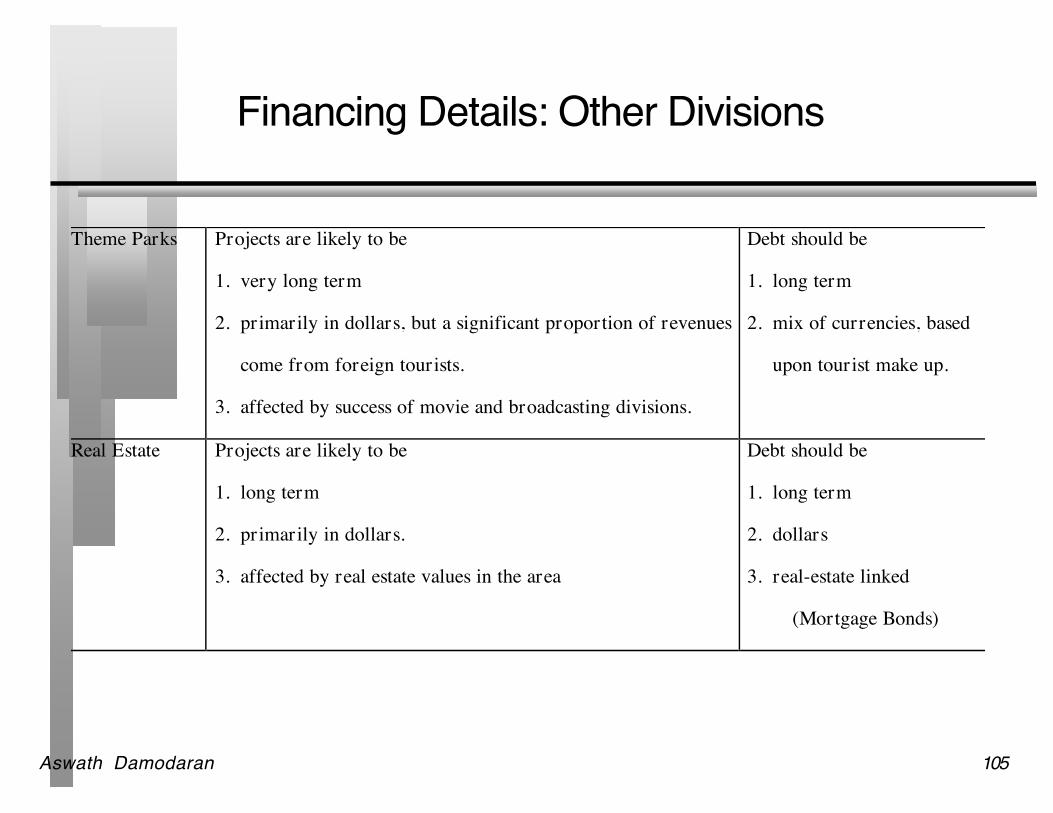
Financing Details: Other Divisions
Theme Parks Projects are likely to be
1. very long term
2. primarily in dollars, but a significant proportion of revenues
come from foreign tourists.
3. affected by success of movie and broadcasting divisions.
Debt should be
1. long term
2. mix of currencies, based
upon tourist make up.
Real Estate Projects are likely to be
1. long term
2. primarily in dollars.
3. affected by real estate values in the area
Debt should be
1. long term
2. dollars
3. real-estate linked
(Mortgage Bonds)

Aswath Damodaran 106
Application Test: Choosing your FinancingType
Based upon the business that your firm is in, and the typicalinvestments that it makes, what kind of financing would you expectyour firm to use in terms of• Duration (long term or short term)• Currency• Fixed or Floating rate• Straight or Convertible
Aswath Damodaran 107
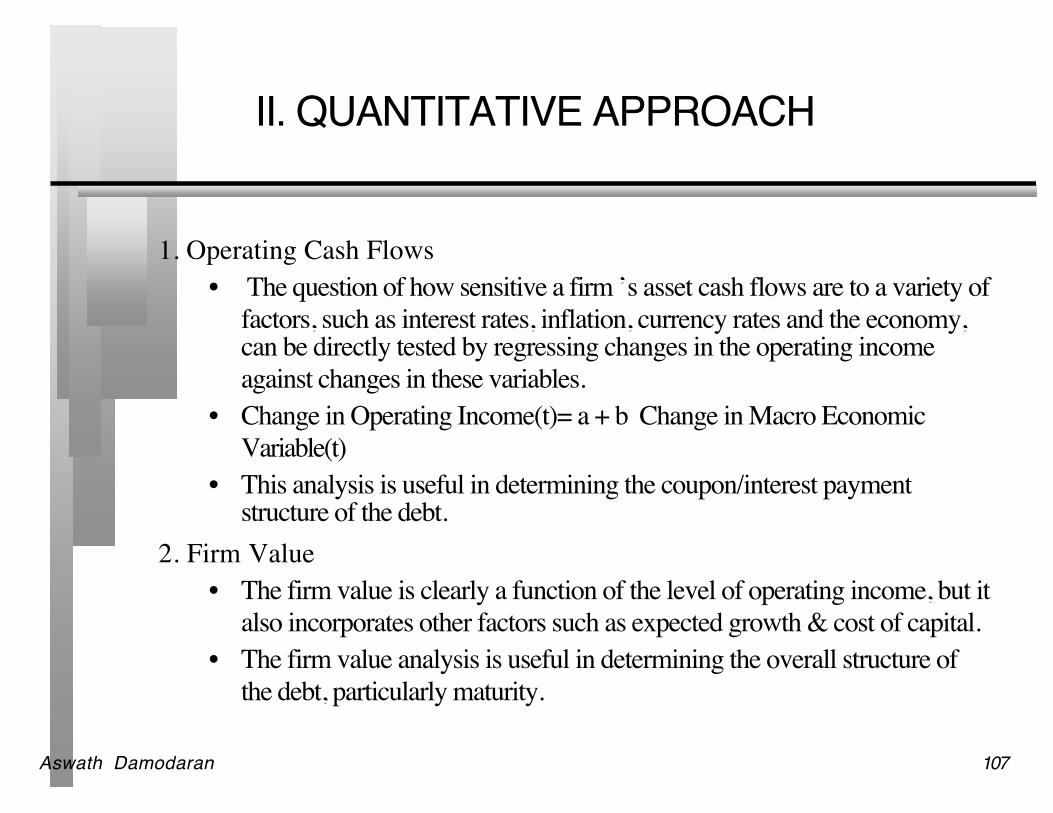
II. QUANTITATIVE APPROACH
1. Operating Cash Flows• The question of how sensitive a firm ’s asset cash flows are to a variety of
factors, such as interest rates, inflation, currency rates and the economy,can be directly tested by regressing changes in the operating incomeagainst changes in these variables.
• Change in Operating Income(t)= a + b Change in Macro EconomicVariable(t)
• This analysis is useful in determining the coupon/interest paymentstructure of the debt.
2. Firm Value• The firm value is clearly a function of the level of operating income, but it
also incorporates other factors such as expected growth & cost of capital.• The firm value analysis is useful in determining the overall structure of
the debt, particularly maturity.
Aswath Damodaran 108
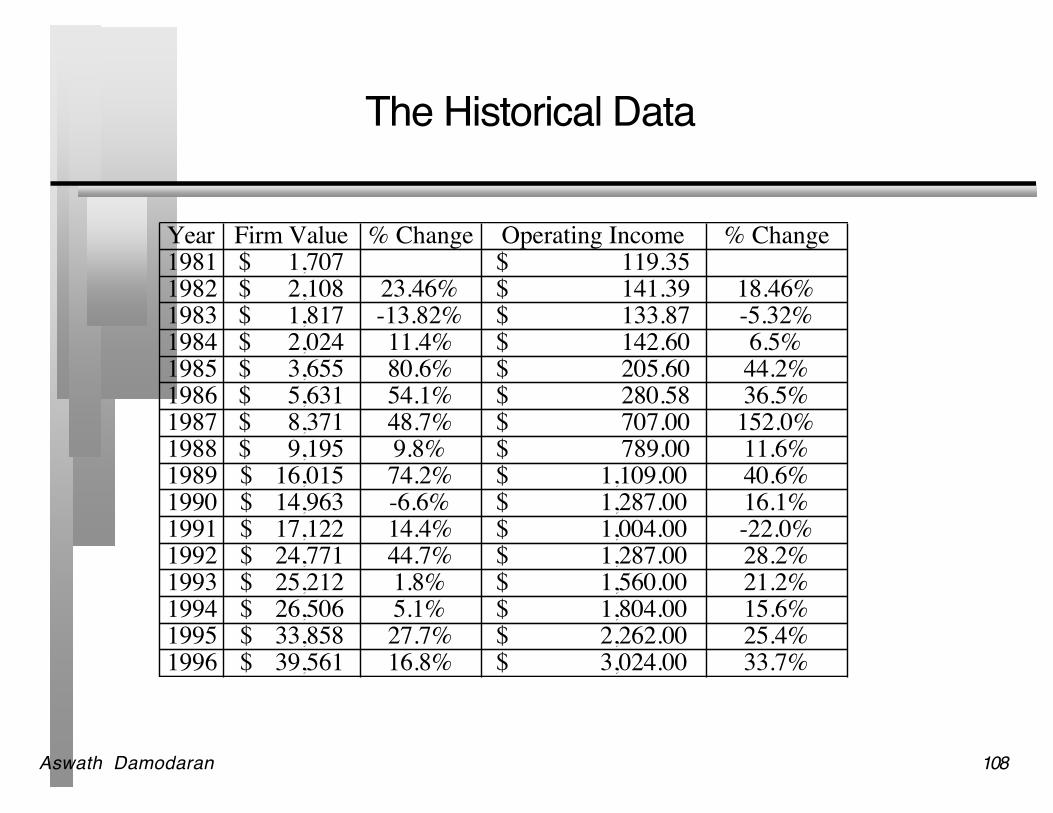
The Historical Data
Year Firm Value % Change Operating Income % Change1981 1,707$ 119.35$ 1982 2,108$ 23.46% 141.39$ 18.46%1983 1,817$ -13.82% 133.87$ -5.32%1984 2,024$ 11.4% 142.60$ 6.5%1985 3,655$ 80.6% 205.60$ 44.2%1986 5,631$ 54.1% 280.58$ 36.5%1987 8,371$ 48.7% 707.00$ 152.0%1988 9,195$ 9.8% 789.00$ 11.6%1989 16,015$ 74.2% 1,109.00$ 40.6%1990 14,963$ -6.6% 1,287.00$ 16.1%1991 17,122$ 14.4% 1,004.00$ -22.0%1992 24,771$ 44.7% 1,287.00$ 28.2%1993 25,212$ 1.8% 1,560.00$ 21.2%1994 26,506$ 5.1% 1,804.00$ 15.6%1995 33,858$ 27.7% 2,262.00$ 25.4%1996 39,561$ 16.8% 3,024.00$ 33.7%
Aswath Damodaran 109
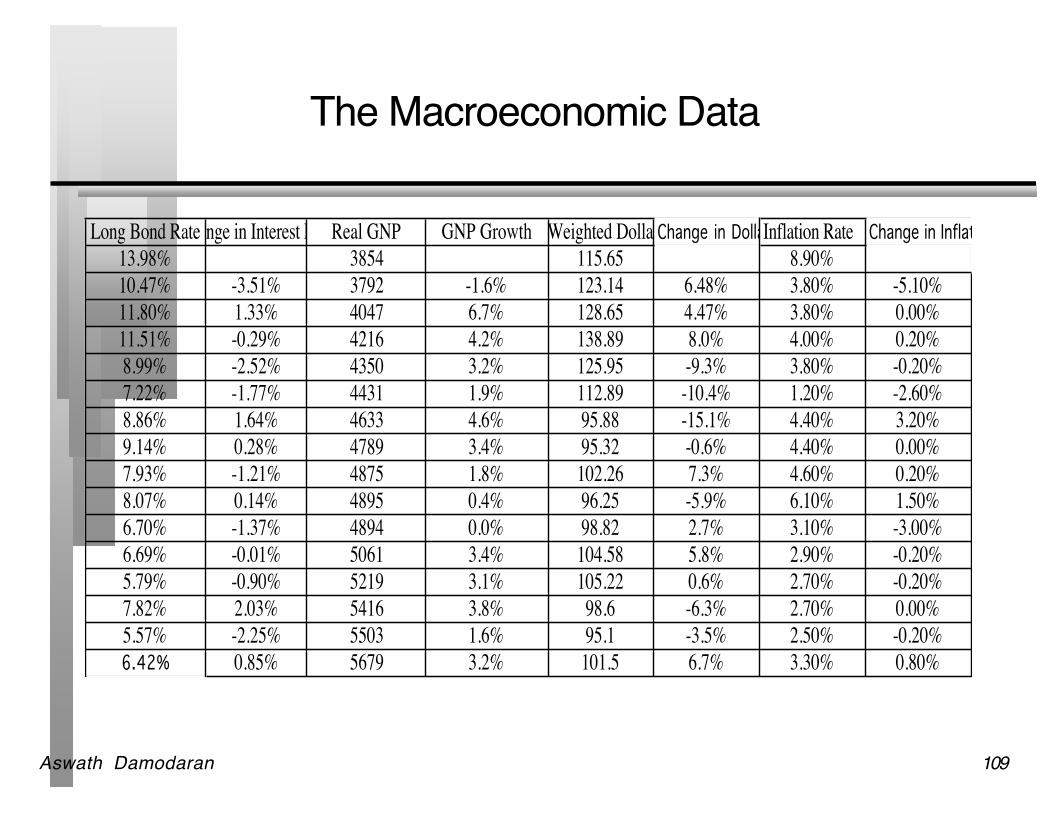
The Macroeconomic Data
Long Bond RateChange in Interest RateReal GNP GNP Growth Weighted DollarChange in DollarInflation Rate Change in Inflation Rate13.98% 3854 115.65 8.90%10.47% -3.51% 3792 -1.6% 123.14 6.48% 3.80% -5.10%11.80% 1.33% 4047 6.7% 128.65 4.47% 3.80% 0.00%11.51% -0.29% 4216 4.2% 138.89 8.0% 4.00% 0.20%8.99% -2.52% 4350 3.2% 125.95 -9.3% 3.80% -0.20%7.22% -1.77% 4431 1.9% 112.89 -10.4% 1.20% -2.60%8.86% 1.64% 4633 4.6% 95.88 -15.1% 4.40% 3.20%9.14% 0.28% 4789 3.4% 95.32 -0.6% 4.40% 0.00%7.93% -1.21% 4875 1.8% 102.26 7.3% 4.60% 0.20%8.07% 0.14% 4895 0.4% 96.25 -5.9% 6.10% 1.50%6.70% -1.37% 4894 0.0% 98.82 2.7% 3.10% -3.00%6.69% -0.01% 5061 3.4% 104.58 5.8% 2.90% -0.20%5.79% -0.90% 5219 3.1% 105.22 0.6% 2.70% -0.20%7.82% 2.03% 5416 3.8% 98.6 -6.3% 2.70% 0.00%5.57% -2.25% 5503 1.6% 95.1 -3.5% 2.50% -0.20%6.42% 0.85% 5679 3.2% 101.5 6.7% 3.30% 0.80%
Aswath Damodaran 110
Sensitivity to Interest Rate Changes
The answer to this question is important because it• it provides a measure of the duration of the firm ’s projects• it provides insight into whether the firm should be using fixed or floating
rate debt.
Aswath Damodaran 111
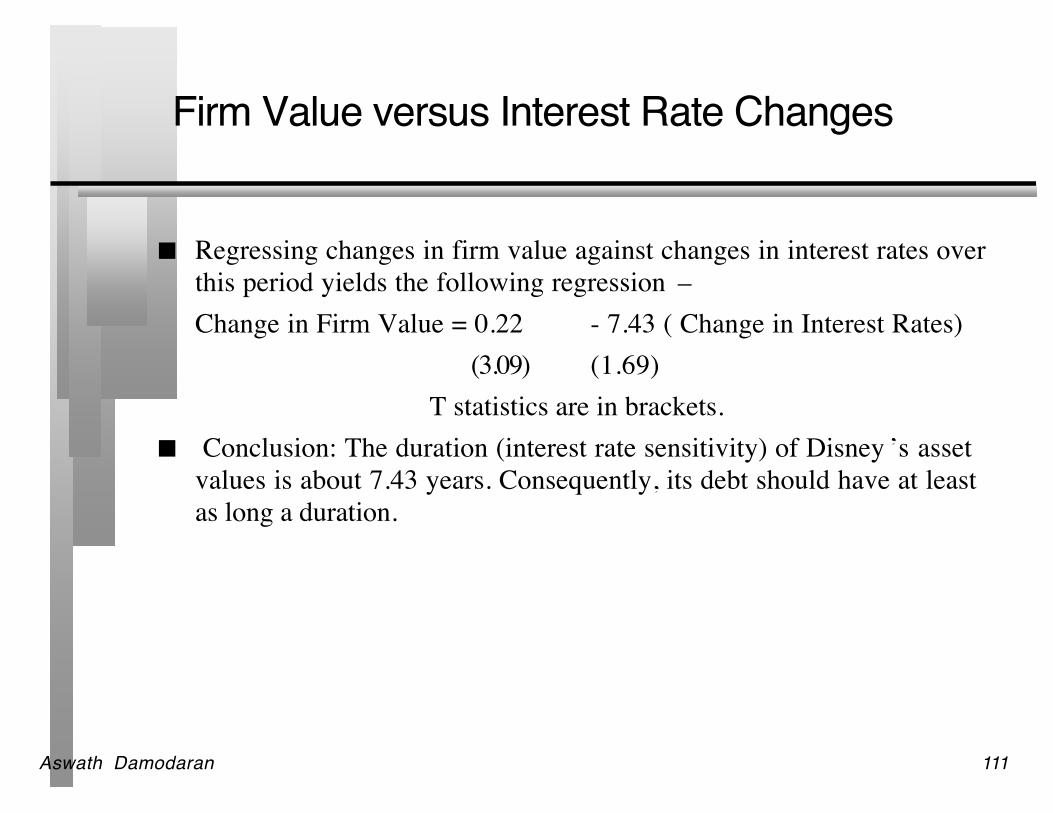
Firm Value versus Interest Rate Changes
Regressing changes in firm value against changes in interest rates overthis period yields the following regression –Change in Firm Value = 0.22 - 7.43 ( Change in Interest Rates)
(3.09) (1.69)T statistics are in brackets.
Conclusion: The duration (interest rate sensitivity) of Disney ’s assetvalues is about 7.43 years. Consequently, its debt should have at leastas long a duration.
Aswath Damodaran 112
Regression Constraints
Which of the following aspects of this regression would bother you themost?
The low R-squared of only 10% The fact that Disney today is a very different firm from the firm
captured in the data from 1981 to 1996 Both Neither
Aswath Damodaran 113
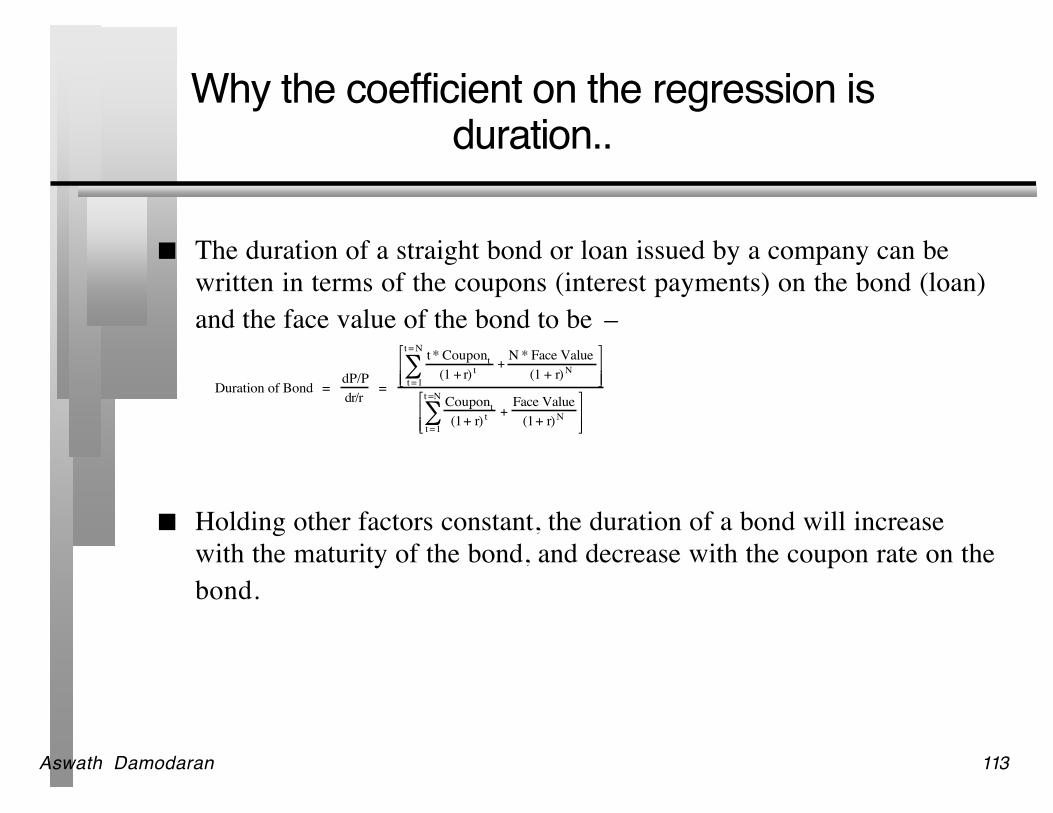
Why the coefficient on the regression isduration..
The duration of a straight bond or loan issued by a company can bewritten in terms of the coupons (interest payments) on the bond (loan)and the face value of the bond to be –
Holding other factors constant, the duration of a bond will increasewith the maturity of the bond, and decrease with the coupon rate on thebond.
Duration of Bond = dP/Pdr/r
=
t * Coupont(1 + r) t
t =1
t = N
∑ +N * Face Value
(1 + r)N
Coupont(1+ r) t
t =1
t =N
∑ +Face Value
(1+ r)N
Aswath Damodaran 114
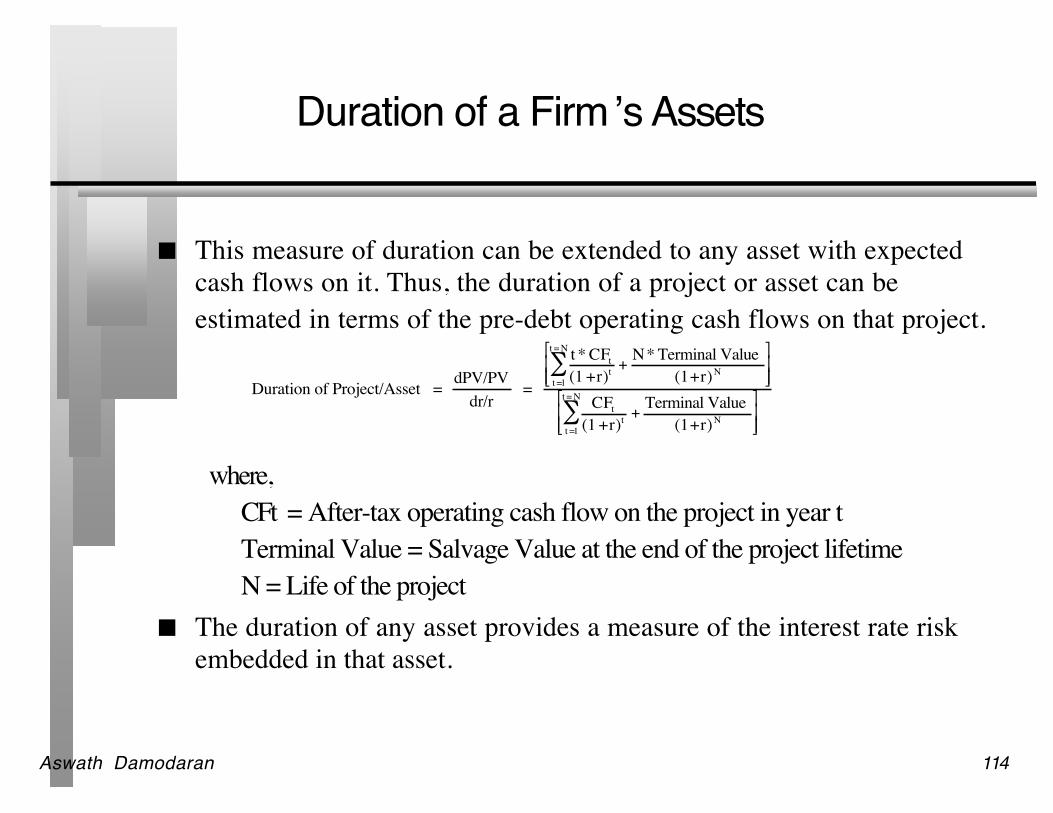
Duration of a Firm’s Assets
This measure of duration can be extended to any asset with expectedcash flows on it. Thus, the duration of a project or asset can beestimated in terms of the pre-debt operating cash flows on that project.
where,CFt = After-tax operating cash flow on the project in year tTerminal Value = Salvage Value at the end of the project lifetimeN = Life of the project
The duration of any asset provides a measure of the interest rate riskembedded in that asset.
€
Duration of Project/Asset = dPV/PVdr/r
=
t * CFt
(1 +r)tt =1
t = N
∑ +N* Terminal Value
(1+r)N
CFt
(1 +r)tt =1
t = N
∑ +Terminal Value
(1+r)N
Aswath Damodaran 115
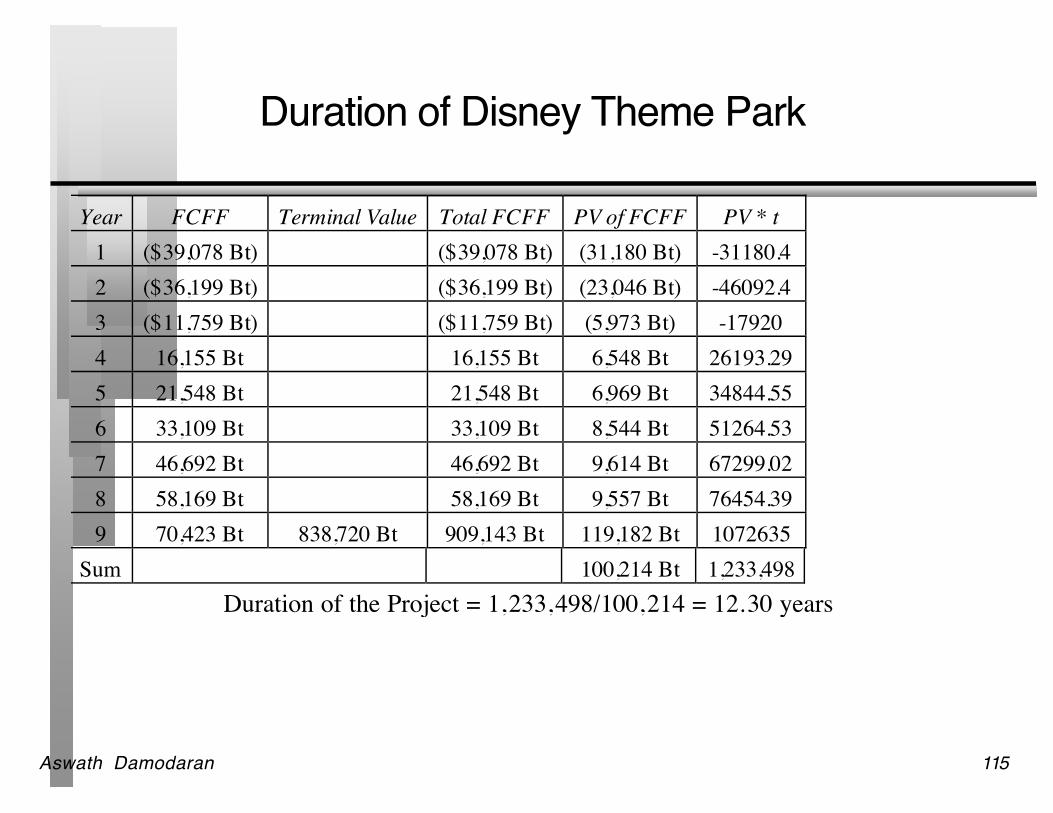
Duration of Disney Theme Park
Year FCFF Terminal Value Total FCFF PV of FCFF PV * t1 ($39,078 Bt) ($39,078 Bt) (31,180 Bt) -31180.42 ($36,199 Bt) ($36,199 Bt) (23,046 Bt) -46092.43 ($11,759 Bt) ($11,759 Bt) (5,973 Bt) -179204 16,155 Bt 16,155 Bt 6,548 Bt 26193.295 21,548 Bt 21,548 Bt 6,969 Bt 34844.556 33,109 Bt 33,109 Bt 8,544 Bt 51264.537 46,692 Bt 46,692 Bt 9,614 Bt 67299.028 58,169 Bt 58,169 Bt 9,557 Bt 76454.399 70,423 Bt 838,720 Bt 909,143 Bt 119,182 Bt 1072635
Sum 100,214 Bt 1,233,498Duration of the Project = 1,233,498/100,214 = 12.30 years
Aswath Damodaran 116
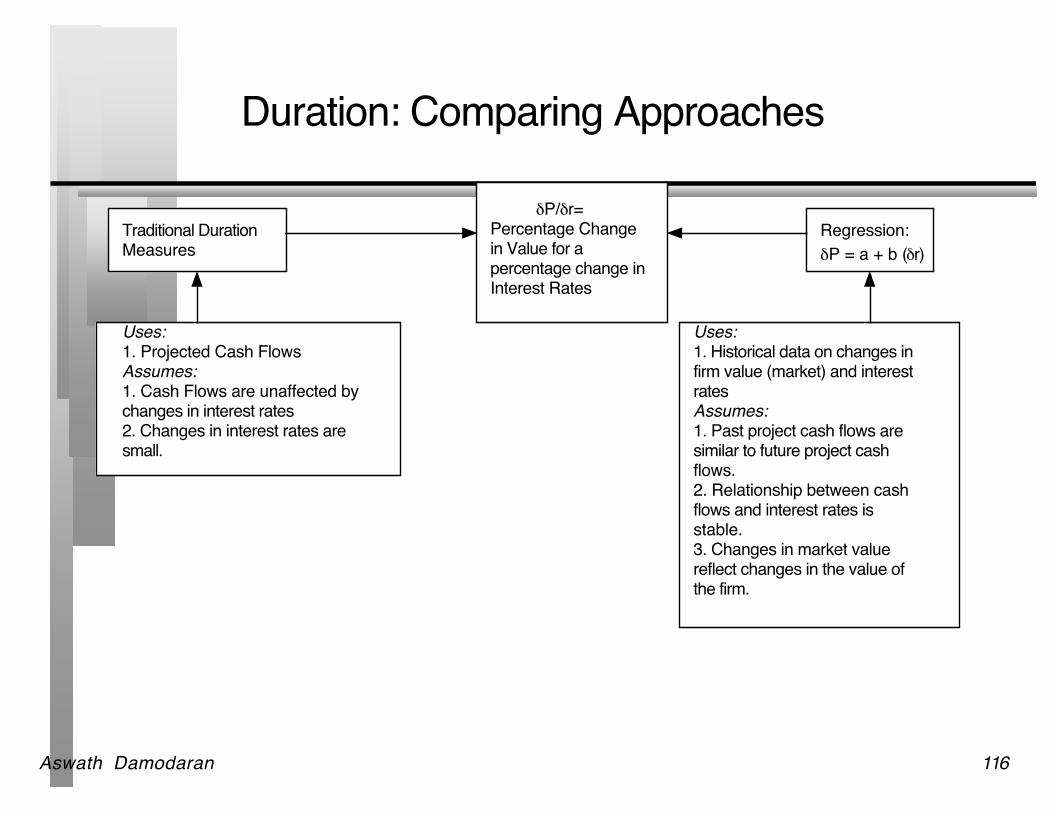
Duration: Comparing Approaches
δP/δr=Percentage Change in Value for apercentage change in Interest Rates
Traditional DurationMeasures
Regression:δP = a + b (δr)
Uses:1. Projected Cash FlowsAssumes:1. Cash Flows are unaffected by changes in interest rates2. Changes in interest rates are small.
Uses:1. Historical data on changes in firm value (market) and interest ratesAssumes:1. Past project cash flows are similar to future project cash flows.2. Relationship between cash flows and interest rates is stable.3. Changes in market value reflect changes in the value of the firm.
Aswath Damodaran 117
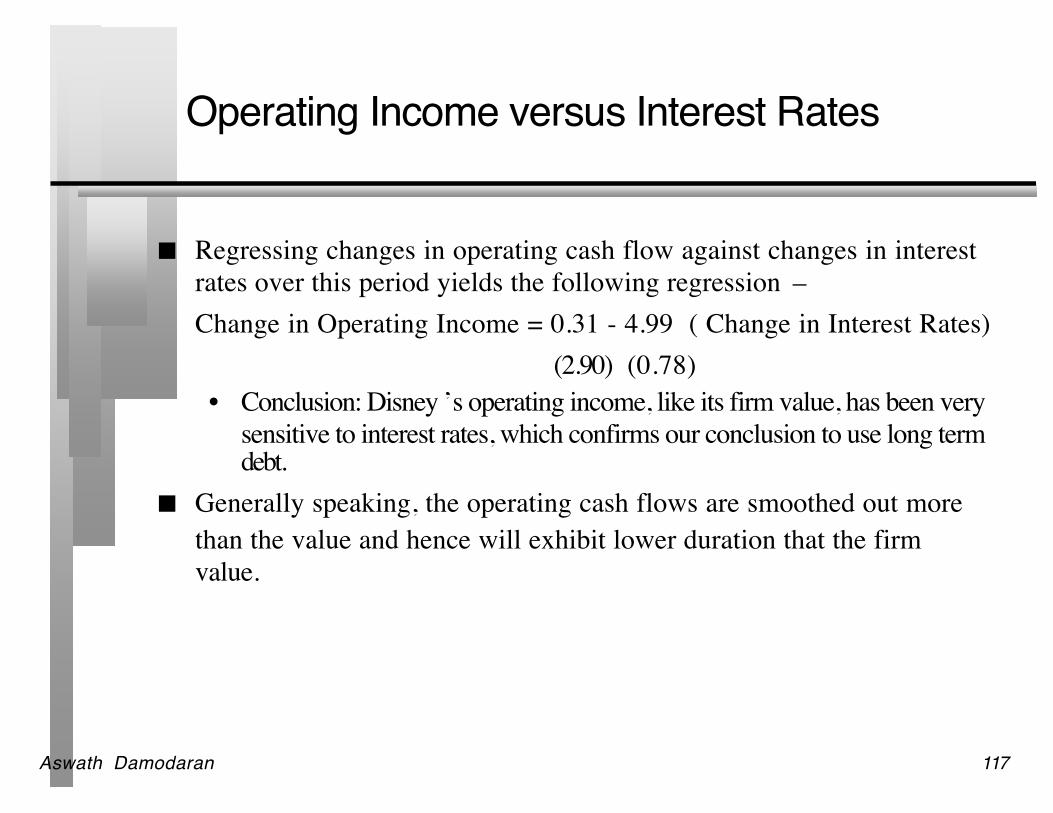
Operating Income versus Interest Rates
Regressing changes in operating cash flow against changes in interestrates over this period yields the following regression –Change in Operating Income = 0.31 - 4.99 ( Change in Interest Rates)
(2.90) (0.78)• Conclusion: Disney ’s operating income, like its firm value, has been very
sensitive to interest rates, which confirms our conclusion to use long termdebt.
Generally speaking, the operating cash flows are smoothed out morethan the value and hence will exhibit lower duration that the firmvalue.
Aswath Damodaran 118
Sensitivity to Changes in GNP
The answer to this question is important because• it provides insight into whether the firm ’s cash flows are cyclical and• whether the cash flows on the firm ’s debt should be designed to protect
against cyclical factors. If the cash flows and firm value are sensitive to movements in the
economy, the firm will either have to issue less debt overall, or addspecial features to the debt to tie cash flows on the debt to the firm’ scash flows.
Aswath Damodaran 119
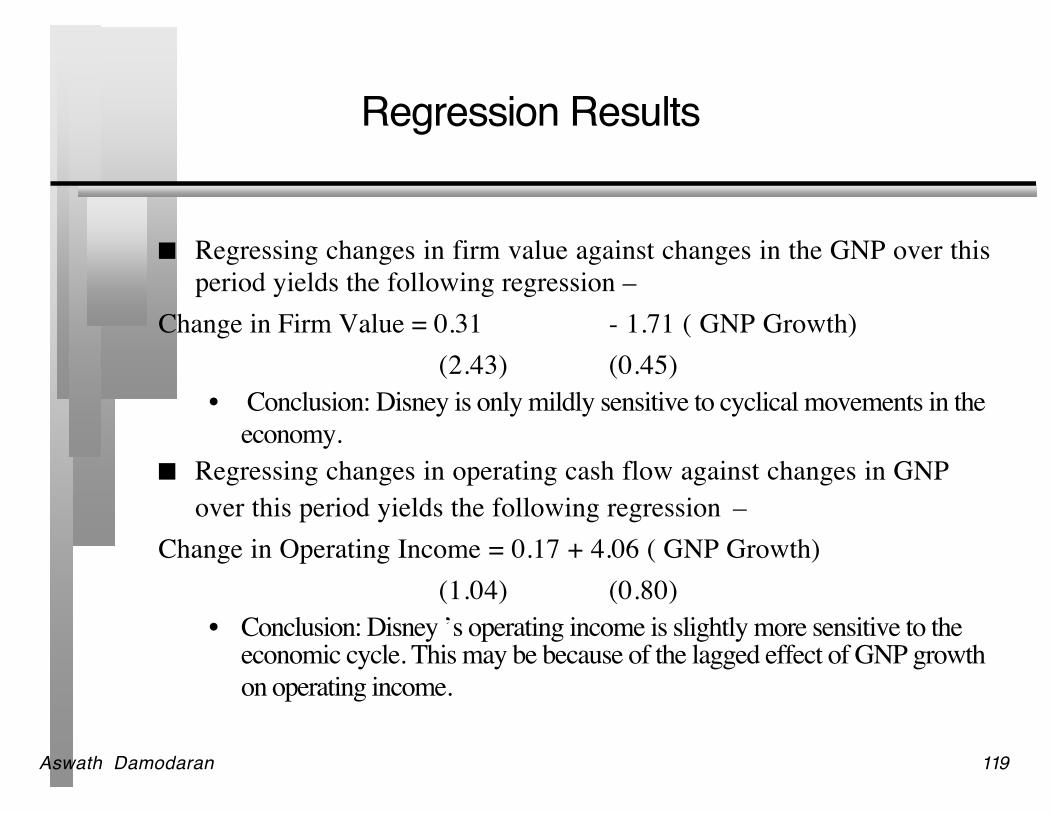
Regression Results
Regressing changes in firm value against changes in the GNP over thisperiod yields the following regression –
Change in Firm Value = 0.31 - 1.71 ( GNP Growth)(2.43) (0.45)
• Conclusion: Disney is only mildly sensitive to cyclical movements in theeconomy.
Regressing changes in operating cash flow against changes in GNPover this period yields the following regression –
Change in Operating Income = 0.17 + 4.06 ( GNP Growth)(1.04) (0.80)
• Conclusion: Disney ’s operating income is slightly more sensitive to theeconomic cycle. This may be because of the lagged effect of GNP growthon operating income.
Aswath Damodaran 120
Sensitivity to Currency Changes
The answer to this question is important, because• it provides a measure of how sensitive cash flows and firm value are to
changes in the currency• it provides guidance on whether the firm should issue debt in another
currency that it may be exposed to. If cash flows and firm value are sensitive to changes in the dollar, the
firm should• figure out which currency its cash flows are in;• and issued some debt in that currency
Aswath Damodaran 121
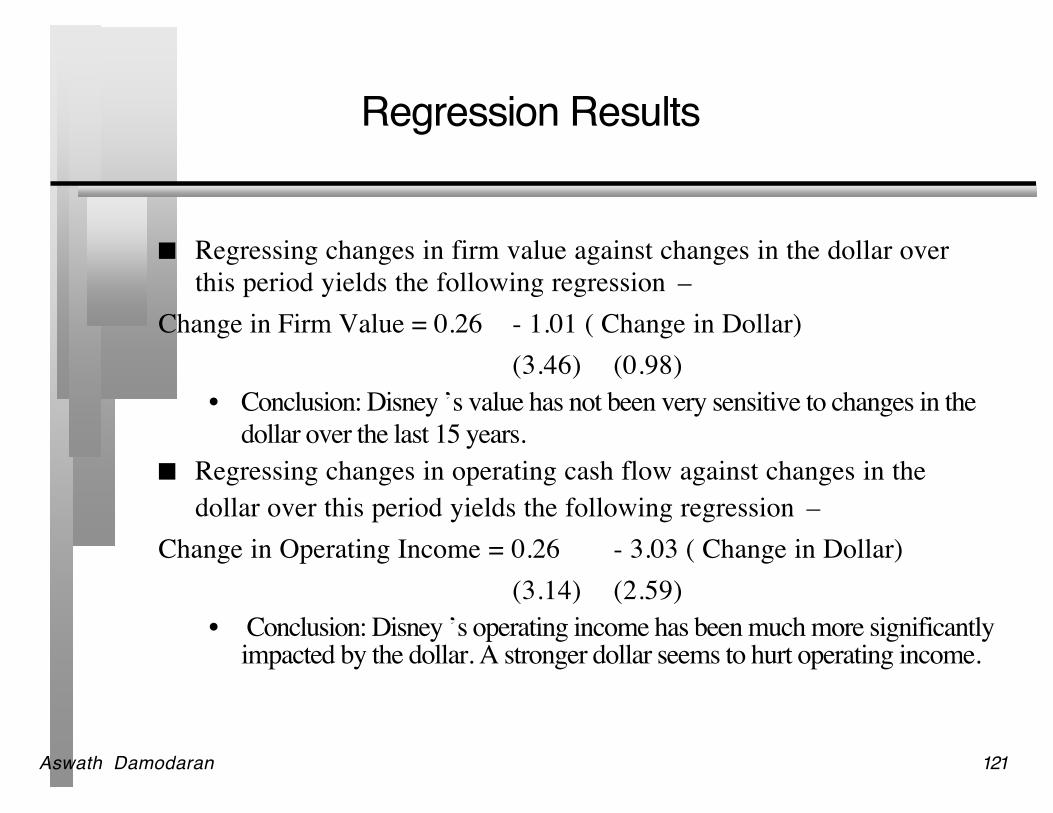
Regression Results
Regressing changes in firm value against changes in the dollar overthis period yields the following regression –
Change in Firm Value = 0.26 - 1.01 ( Change in Dollar)(3.46) (0.98)
• Conclusion: Disney ’s value has not been very sensitive to changes in thedollar over the last 15 years.
Regressing changes in operating cash flow against changes in thedollar over this period yields the following regression –
Change in Operating Income = 0.26 - 3.03 ( Change in Dollar)(3.14) (2.59)
• Conclusion: Disney ’s operating income has been much more significantlyimpacted by the dollar. A stronger dollar seems to hurt operating income.
Aswath Damodaran 122
Sensitivity to Inflation
The answer to this question is important, because• it provides a measure of whether cash flows are positively or negatively
impacted by inflation.• it then helps in the design of debt; whether the debt should be fixed or
floating rate debt. If cash flows move with inflation, increasing (decreasing) as inflation
increases (decreases), the debt should have a larger floating ratecomponent.

Aswath Damodaran 123
Regression Results
Regressing changes in firm value against changes in inflation over thisperiod yields the following regression –
Change in Firm Value = 0.26 - 0.22 (Change in Inflation Rate)(3.36) (0.05)
• Conclusion: Disney ’s firm value does not seem to be affected too muchby changes in the inflation rate.
Regressing changes in operating cash flow against changes in inflationover this period yields the following regression –
Change in Operating Income = 0.32 + 10.51 ( Change in Inflation Rate) (3.61) (2.27)
• Conclusion: Disney ’s operating income seems to increase in periods wheninflation increases. However, this increase in operating income seems tobe offset by the increase in discount rates leading to a much more mutedeffect on value.

Aswath Damodaran 124
Bottom-up Estimates
Business Comparable Firms Division Weight Duration Cyclicality Inflation CurrencyCreative Content Motion Picture and TV program producers 35.71% -3.34 1.39 2.30 -1.86Retailing High End Specialty Retailers 3.57% -5.50 2.63 2.10 -0.75Broadcasting TV Broadcasting companies 30.36% -4.50 0.70 3.03 -1.15Theme Parks Theme Park and Entertainment Complexes 26.79% -10.47 0.22 0.72 -2.54Real Estate REITs specializing in hotel and vacation propertiers 3.57% -8.46 0.89 -0.08 0.97
100.00% -5.86 0.89 2.00 -1.69D i s ney
Aswath Damodaran 125
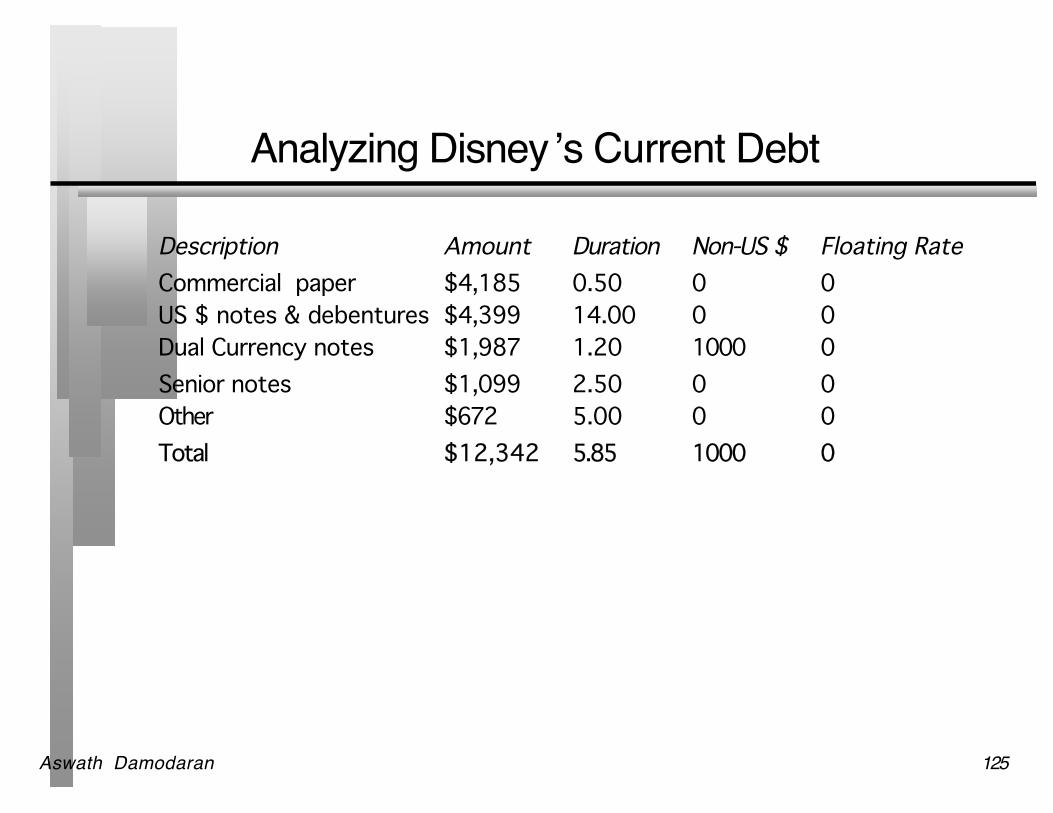
Analyzing Disney ’s Current Debt
Description Amount Duration Non-US $ Floating RateCommercial paper $4,185 0.50 0 0US $ notes & debentures $4,399 14.00 0 0Dual Currency notes $1,987 1.20 1000 0Senior notes $1,099 2.50 0 0Other $672 5.00 0 0Total $12,342 5.85 1000 0
Aswath Damodaran 126
Financing Recommendations
The duration of the debt is almost exactly the duration estimated usingthe bottom-up approach, though it is lower than the duration estimatedfrom the firm-specific regression.
Less than 10% of the debt is non-dollar debt and it is primarily inJapanese yen, Australian dollars and Italian lire, and little of the debt isfloating rate debt.
Based on our analysis, we would recommend more non-dollar debtissues, with a shift towards floating rate debt, at least in those sectorswhere Disney retains significant pricing power.