Determining of Aircraft Engine Greenhouse Gas (CO2, CH4 ...
12
BEÜ Fen Bilimleri Dergisi BEU Journal of Science 10 (3), 1140-1151, 2021 10 (3), 1140-1151, 2021 1140 Araştırma Makalesi / Research Article Determining of Aircraft Engine Greenhouse Gas (CO2, CH4 and N2O) Emissions from the Landing and Take-Off Operations Around the Airport Area Halil Yalçın AKDENİZ * Eskişehir Osmangazi Üniversitesi, Eskişehir Meslek Yüksekokulu, Makine ve Metal Teknolojileri Bölümü, Eskişehir (ORCID: 0000-0003-2101-6151) Abstract Recently, environmental concerns arising from aviation activities have increased, and studies on the environmental aspect of aircraft operations within the concept of sustainable and cleaner aviation have become one of the important research topics. In this study, the greenhouse gas (GHG) Emissions, namely CO2, CH4, and N2O pollutants emitted to the environment during the landing and take-off operations in the International Eskisehir Hasan Polatkan Airport (LTBY) of aircraft engines were analyzed with the help of predictive approaches. Additionally, the average jet-fuel consumptions of these aircraft were determined. Calculations were performed in point of the method of the Intergovernmental Panel on Climate Change (IPCC) and performed with the Tier-2 predictive approach. According to results, it has been obtained that the Airbus 321 (A-321) series aircraft has the highest pollution with a value of 762495 kg/y of GHG. Furthermore, it has been observed that approximately 1127710 kg/y of CO2, 48.14 kg/year of CH4, and 39.77 kg/y of N2O were released into the environment. On the other hand, the total value of jet-fuel consumption during the landing and take-off operations of these aircraft is calculated to be an average of 357500 kg/y. In this regard, it has been determined that the Boeing B767-300 series aircraft (B763) is the most inefficient type of aircraft depending on the fuel consumption by performing a correlation between the parameters of average jet-fuel consumption and total landing and take-off count. Keywords: Aircraft Engines, Aviation Emissions, Greenhouse Gases (GHG), Landing-Take-Off Cycle, Environmental Impact, Sustainable Aviation. Havalimanı Bölgesinde İniş ve Kalkış Operasyonlarından Kaynaklanan Uçak Motoru Sera Gazı (CO2, CH4 ve N2O) Emisyonlarının Belirlenmesi Öz Son zamanlarda havacılık faaliyetlerinden kaynaklanan çevresel kaygılar artmış ve sürdürülebilir ve daha temiz havacılık konsepti içerisinde havacılığın çevresel boyutuna yönelik olarak yapılan çalışmalar önemli araştırma konularından birisi haline gelmiştir. Bu çalışmada, Uluslararası Eskişehir Hasan Polatkan Havalimanı'nda (LTBY) iniş ve kalkış operasyonları sırasında uçak motorlarından çevreye yayılan ve sera gazı emisyonları olarak bilinen CO2, CH4 ve N2O kirleticileri, tahmin yaklaşımları yardımıyla analiz edilmiştir. Ek olarak, incelemeye konu uçakların uçuşun bu fazında toplamda yaklaşık jet yakıtı tüketim değerleri incelenmiştir. Hesaplamalar, IPCC (Hükümetler arası İklim Değişikliği Paneli) yöntemi ışığında ve Tier-2 tahmin yaklaşımıyla gerçekleştirilmiştir. Elde edilen sonuçlara göre Airbus 321 (A-321) serisi uçakların toplamda 762495 kg/yıl sera gazı emisyonu salınım değeri ile en yüksek kirliliğe sahip olduğu ortaya çıkmıştır. Ayrıca incelemeye konu uçaklardan iniş ve kalkış operasyonları neticesinde çevreye yaklaşık olarak 1127710 kg/yıl karbondioksit (CO2), 48.14 kg/yıl metan (CH4) ve 39.77 kg/yıl diazot monoksit (N2O) salındığı görülmüştür. Öte yandan bu uçakların iniş-kalkış operasyonları sırasında jet yakıtı tüketiminin toplam değeri yaklaşık olarak 357 ton/yıl olarak hesaplanmıştır. Bu bağlamda, ortalama Jet yakıtı tüketimi ile toplam iniş kalkış operasyonu sayıları arasında korelasyon kurularak Boeing B767-300 (B763) serisi uçağın hesaplanmış olan yakıt tüketim performansına bağlı olarak en verimsiz uçak tipi olduğu tespit edilmiştir. Anahtar kelimeler: Uçak Motorları, Havacılık Emisyonları, Sera Gazları, İniş-Kalkış Döngüsü, Çevresel Etki, Sürdürülebilir Havacılık. * Corresponding author: [email protected] Received: 30.04.2021, Accepted: 02.07.2021
Transcript of Determining of Aircraft Engine Greenhouse Gas (CO2, CH4 ...

BEÜ Fen Bilimleri Dergisi BEU Journal of Science
10 (3), 1140-1151, 2021 10 (3), 1140-1151, 2021
1140
Araştırma Makalesi / Research Article
Determining of Aircraft Engine Greenhouse Gas (CO2, CH4 and N2O)
Emissions from the Landing and Take-Off Operations Around the Airport
Area
Halil Yalçın AKDENİZ*
Eskişehir Osmangazi Üniversitesi, Eskişehir Meslek Yüksekokulu, Makine ve Metal Teknolojileri Bölümü,
Eskişehir
(ORCID: 0000-0003-2101-6151)
Abstract
Recently, environmental concerns arising from aviation activities have increased, and studies on the environmental aspect of aircraft operations within the concept of sustainable and cleaner aviation have become one of the important
research topics. In this study, the greenhouse gas (GHG) Emissions, namely CO2, CH4, and N2O pollutants emitted to the environment during the landing and take-off operations in the International Eskisehir Hasan Polatkan Airport (LTBY)
of aircraft engines were analyzed with the help of predictive approaches. Additionally, the average jet-fuel consumptions of these aircraft were determined. Calculations were performed in point of the method of the Intergovernmental Panel
on Climate Change (IPCC) and performed with the Tier-2 predictive approach. According to results, it has been obtained that the Airbus 321 (A-321) series aircraft has the highest pollution with a value of 762495 kg/y of GHG. Furthermore,
it has been observed that approximately 1127710 kg/y of CO2, 48.14 kg/year of CH4, and 39.77 kg/y of N2O were released into the environment. On the other hand, the total value of jet-fuel consumption during the landing and take-off
operations of these aircraft is calculated to be an average of 357500 kg/y. In this regard, it has been determined that the Boeing B767-300 series aircraft (B763) is the most inefficient type of aircraft depending on the fuel consumption by
performing a correlation between the parameters of average jet-fuel consumption and total landing and take-off count.
Keywords: Aircraft Engines, Aviation Emissions, Greenhouse Gases (GHG), Landing-Take-Off Cycle, Environmental Impact, Sustainable Aviation.
Havalimanı Bölgesinde İniş ve Kalkış Operasyonlarından Kaynaklanan
Uçak Motoru Sera Gazı (CO2, CH4 ve N2O) Emisyonlarının Belirlenmesi
Öz
Son zamanlarda havacılık faaliyetlerinden kaynaklanan çevresel kaygılar artmış ve sürdürülebilir ve daha temiz havacılık konsepti içerisinde havacılığın çevresel boyutuna yönelik olarak yapılan çalışmalar önemli araştırma
konularından birisi haline gelmiştir. Bu çalışmada, Uluslararası Eskişehir Hasan Polatkan Havalimanı'nda (LTBY) iniş ve kalkış operasyonları sırasında uçak motorlarından çevreye yayılan ve sera gazı emisyonları olarak bilinen CO2, CH4
ve N2O kirleticileri, tahmin yaklaşımları yardımıyla analiz edilmiştir. Ek olarak, incelemeye konu uçakların uçuşun bu fazında toplamda yaklaşık jet yakıtı tüketim değerleri incelenmiştir. Hesaplamalar, IPCC (Hükümetler arası İklim
Değişikliği Paneli) yöntemi ışığında ve Tier-2 tahmin yaklaşımıyla gerçekleştirilmiştir. Elde edilen sonuçlara göre Airbus 321 (A-321) serisi uçakların toplamda 762495 kg/yıl sera gazı emisyonu salınım değeri ile en yüksek kirliliğe
sahip olduğu ortaya çıkmıştır. Ayrıca incelemeye konu uçaklardan iniş ve kalkış operasyonları neticesinde çevreye yaklaşık olarak 1127710 kg/yıl karbondioksit (CO2), 48.14 kg/yıl metan (CH4) ve 39.77 kg/yıl diazot monoksit (N2O)
salındığı görülmüştür. Öte yandan bu uçakların iniş-kalkış operasyonları sırasında jet yakıtı tüketiminin toplam değeri yaklaşık olarak 357 ton/yıl olarak hesaplanmıştır. Bu bağlamda, ortalama Jet yakıtı tüketimi ile toplam iniş kalkış
operasyonu sayıları arasında korelasyon kurularak Boeing B767-300 (B763) serisi uçağın hesaplanmış olan yakıt tüketim performansına bağlı olarak en verimsiz uçak tipi olduğu tespit edilmiştir.
Anahtar kelimeler: Uçak Motorları, Havacılık Emisyonları, Sera Gazları, İniş-Kalkış Döngüsü, Çevresel Etki,
Sürdürülebilir Havacılık.
*Corresponding author: [email protected]
Received: 30.04.2021, Accepted: 02.07.2021

H.Y. Akdeniz / BEÜ Fen Bilimleri Dergisi 10 (3), 1140-1151, 2021
1141
1. Introduction
In recent years, the share of the aviation industry in the world economy has increased and airline traffic has increased significantly. For example, in the period between 1989 and 2009, the total planned airline
traffic grew by an annual average of 4.4%. In 2009, approximately 2.3 billion passengers and 38 million
tons of cargo were transported by airlines around the world [1, 2]. It is known that approximately 32 million people are working in the aviation sector in the world, and the aviation industry has a size of 3.6
billion dollars [3,4]. The aviation industry accounts for 2% of overall CO2 pollutants, also it is predicted
that this value will reach 3% by 2050 [4, 5]. In addition to some negative environmental effects brought
about by this growth in the aviation sector, it also has several adverse effects on human health, directly or indirectly. Concepts such as emission and noise can be given as examples [6, 7].
The environmental impacts of aircraft-induced emissions are categorized in two different ways.
One of them is the landing and take-off cycle called LTO. The landing and take-off cycle includes four phases of flight. These are taxi, take-off, climb and approach phases. This cycle includes aircraft
movements up to 915 meters above the ground. The effect of emissions from aircraft around the airports
is largely due to this cycle. Another way to examine the environmental impact of aircraft emissions is the cruise phase of flight. Cruise is a flat flight mode that takes place above 915 meters altitude. Cruise
emissions directly cause climate change, stratospheric ozone, which is one of the layers of the
atmosphere, and UV radiations [8-10]. Different types of exhaust emissions and pollutants are released
into the atmosphere during the landing and take-off cycle from aircraft. It is known as CO2, H2O, NOX, SOX, CO, HC, VOC, NMVOC, and other gases and particulates. CO2, CH4 N2O gases, which are called
greenhouse gas emissions, are among the gases released [11-15].
In the literature, it has been observed that studies on aircraft emissions have become widespread in recent years. Kaygusuz [16] has identified in his 2001 study of air for his release during take-off and
landing cycle emissions of NOX and CO emissions that form part 0.25%-0.3% of total emissions in
Turkey.
Tokuslu [17] estimated NOx, CO, and HC pollutants at Tbilisi International Airport in Georgia from aircraft during the LTO cycles for the year 2018. The author used the International Civil Aviation
Organization (ICAO) engine exhaust emission databank to calculate aircraft-induced emissions in his
study. According to the results of the study, the total aircraft emissions during the LTO cycle were estimated to be 428.78 t/year (20.24 t/year for HC, 161.21 t/year for CO, and 247.33 t/year for NOx,) at
the airport examined. The author argued that the international flight operations were made up of 99% of
all flights in terms of total LTO emissions. Pecorari et al. [14] analyzed the CO, HC, and NOX emissions from aircraft with the help of the
Lagrangian particle method. Uygur and Ozgunoglu [15] examined the CO2, NMVOC, CH4 N2O, NOX,
CO, and SO2 gaseous generated during the LTO cycles of aircrafts at Kahramanmaraş Airport in 2016.
According to the results of the examination, they determined that the type of aircraft that generates the most emission is Airbus 320 (A320). Kumas et al. [18] determined the CO2 emission amount for 2017
at Muğla Dalaman Airport as 93410.750 tons per year as a result of their calculations. Yılmaz [19]
calculated the NOX, HC, and CO emissions at Kayseri Airport during the landing and take-off cycles of the aircraft in 2010 in parallel with the emission inventory of ICAO and stated that a total of 177.90 tons
of emission was emitted to the environment in 2010.
Rismann et al. [20] analyzed by using the model of Advanced Transportation Modeling System, Emission, Response and Reactions of Atmospheric Matter (AMSTERDAM), to analyze the emissions
resulting from the landing and take-off cycle at Atlanta Airport (USA).
Dong et al. [21] assessed whether flight frequency has substantial effects on air pollution
depending on the monthly data of aircraft movements from 59 airports in China for about 4 years by using the two-way fixed effects model.
In another paper, Phoenix et al. [22] evaluated the global effects of aviation non-LTO emissions
on surface air quality for present-day and mid-century (2050) using the Community Atmosphere Model with Chemistry, version 5 (CAM5). Besides, they examined the aviation effect at mid-century with two
fuel scenarios, a biofuel, and a fossil fuel. Yang et al. [23] estimated the emissions of air pollutants from
aircraft and other sources at Beijing Capital International Airport using aircraft using meteorological
data.

H.Y. Akdeniz / BEÜ Fen Bilimleri Dergisi 10 (3), 1140-1151, 2021
1142
In the study, the emitted GHG emissions to the environment during the landing and take-off cycle
of the aircraft with used jet-fuel at International Eskisehir Hasan Polatkan Airport (LTBY) are analyzed
with the help of predictive approaches. Thirteen different types of aircraft are examined in the analyses. Also, the total average jet-fuel consumptions of these thirteen different types of aircraft are determined.
Additionally, by correlating the count of LTO cycles and total fuel consumption, the aircraft type that is
the most efficient and inefficient in fuel consumption is determined among the analyzed aircraft types. In this study, different from some previous studies, it is aimed to analyze aviation-induced emissions by
considering the more diversity of different types of aircraft. In this manner, it is purposed to make a
helpful contribution to the aviation-induced emission literature in terms of different aircraft types.
Besides, international flights are also analyzed in addition to the emission evaluations of local-scale flight operations at an airport.
2. Material and Method
2.1. The LTO Cycle and GHG Emissions
An aircraft maintains its flight in two general modes. One of them is the landing-take-off cycle that takes
place below 915 meters (3000 feet) and includes taxi, take-off, climb, and landing phases, while the
other is the cruise mode, which is called flat flight and is outside the landing-take-off cycle above 915
meters [4, 24]. A visualized information about the landing and take-off cycle of flight, which includes various maneuvers of an aircraft, is given in Figure 1.
Figure 1. LTO cycle of flight [25].
Approximately 10% of all aircraft emissions, excluding HC and CO2 emissions, are emitted at ground level and during the LTO cycle. Almost 30% of the total HC and CO2 emissions emitted by the
aircraft are emitted in this cycle [4, 26].
Greenhouse gases (GHG) compose a group of gases leading to climate change and global warming. The Kyoto Protocol, an environmental agreement signed by many parties to the United
Nations Framework Convention on Climate Change (UNFCCC) in 1997 to curb global warming,
includes six greenhouse gases: nitrous oxide (N2O), methane (CH4), carbon dioxide (CO2), and sulphur
hexafluoride (SF6). It is possible to compare them and to determine their individual and total contribution to global warming by converting them to carbon dioxide (or CO2) equivalents [27].
2.2. Method and Analyses
The approach of IPCC, which are concepts that called the Tier methodologies in the assessment of the
parameters such as combustion technology, conditions of combustion, standards of emissions resulting from combustion, characteristics of the fuel used in combustion, in emission calculations related to the
transportation sector. In the methodology of Tier-1, the emission generated by aircraft landing-take-off
and cruise activities in aviation is obtained by multiplying the amount of fuel consumed by aircraft with
average emission factors. The equation for the related calculation method is given in Equation (1) [15, 28].
𝐸𝑚𝑖𝑠𝑠𝑖𝑜𝑛 𝐴𝑚𝑜𝑢𝑛𝑡 (𝑦) = 𝐸𝐼 × 𝐹𝐶 (1)
H.Y. Akdeniz / BEÜ Fen Bilimleri Dergisi 10 (3), 1140-1151, 2021
1143
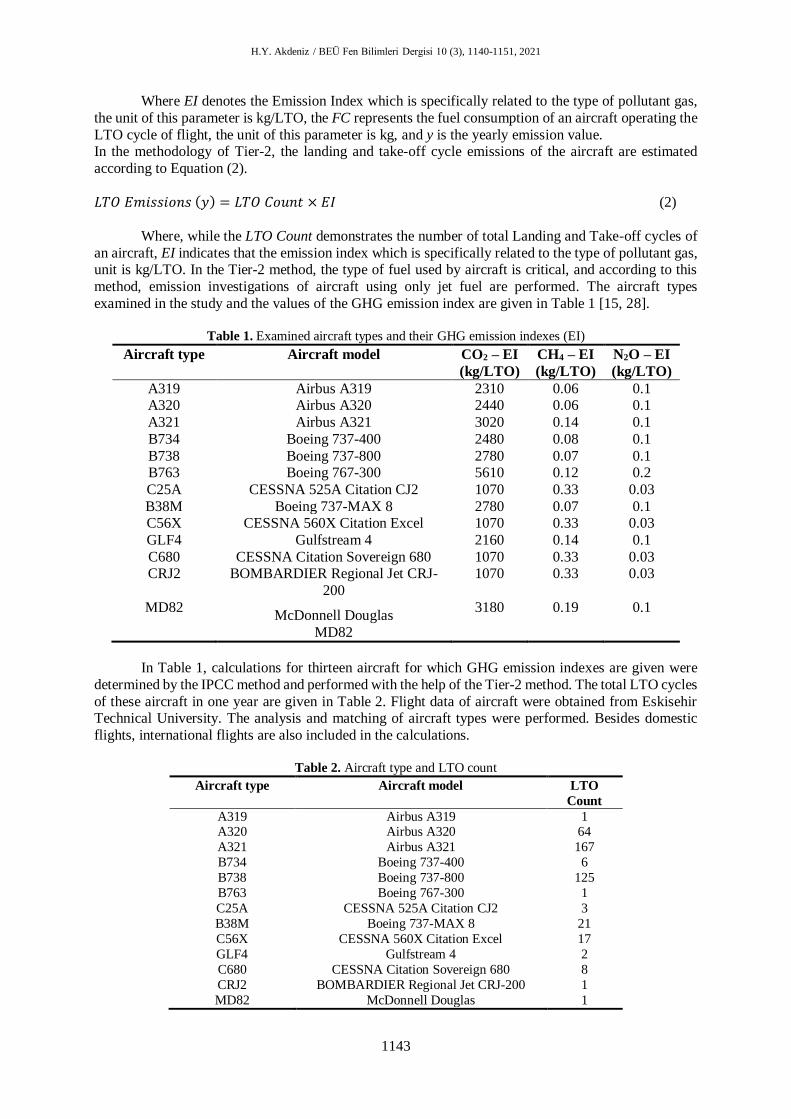
Where EI denotes the Emission Index which is specifically related to the type of pollutant gas,
the unit of this parameter is kg/LTO, the FC represents the fuel consumption of an aircraft operating the
LTO cycle of flight, the unit of this parameter is kg, and y is the yearly emission value. In the methodology of Tier-2, the landing and take-off cycle emissions of the aircraft are estimated
according to Equation (2).
𝐿𝑇𝑂 𝐸𝑚𝑖𝑠𝑠𝑖𝑜𝑛𝑠 (𝑦) = 𝐿𝑇𝑂 𝐶𝑜𝑢𝑛𝑡 × 𝐸𝐼 (2)
Where, while the LTO Count demonstrates the number of total Landing and Take-off cycles of
an aircraft, EI indicates that the emission index which is specifically related to the type of pollutant gas, unit is kg/LTO. In the Tier-2 method, the type of fuel used by aircraft is critical, and according to this
method, emission investigations of aircraft using only jet fuel are performed. The aircraft types
examined in the study and the values of the GHG emission index are given in Table 1 [15, 28].
Table 1. Examined aircraft types and their GHG emission indexes (EI)
Aircraft type Aircraft model CO2 – EI
(kg/LTO)
CH4 – EI
(kg/LTO)
N2O – EI
(kg/LTO)
A319 Airbus A319 2310 0.06 0.1 A320 Airbus A320 2440 0.06 0.1
A321 Airbus A321 3020 0.14 0.1
B734 Boeing 737-400 2480 0.08 0.1
B738 Boeing 737-800 2780 0.07 0.1 B763 Boeing 767-300 5610 0.12 0.2
C25A CESSNA 525A Citation CJ2 1070 0.33 0.03
B38M Boeing 737-MAX 8 2780 0.07 0.1 C56X CESSNA 560X Citation Excel 1070 0.33 0.03
GLF4 Gulfstream 4 2160 0.14 0.1
C680 CESSNA Citation Sovereign 680 1070 0.33 0.03 CRJ2 BOMBARDIER Regional Jet CRJ-
200
1070 0.33 0.03
MD82 McDonnell Douglas
MD82
3180 0.19 0.1
In Table 1, calculations for thirteen aircraft for which GHG emission indexes are given were
determined by the IPCC method and performed with the help of the Tier-2 method. The total LTO cycles
of these aircraft in one year are given in Table 2. Flight data of aircraft were obtained from Eskisehir Technical University. The analysis and matching of aircraft types were performed. Besides domestic
flights, international flights are also included in the calculations.
Table 2. Aircraft type and LTO count
Aircraft type Aircraft model LTO
Count
A319 Airbus A319 1 A320 Airbus A320 64
A321 Airbus A321 167
B734 Boeing 737-400 6
B738 Boeing 737-800 125
B763 Boeing 767-300 1
C25A CESSNA 525A Citation CJ2 3
B38M Boeing 737-MAX 8 21
C56X CESSNA 560X Citation Excel 17
GLF4 Gulfstream 4 2
C680 CESSNA Citation Sovereign 680 8
CRJ2 BOMBARDIER Regional Jet CRJ-200 1
MD82 McDonnell Douglas 1

H.Y. Akdeniz / BEÜ Fen Bilimleri Dergisi 10 (3), 1140-1151, 2021
1144
3. Results and Discussion
The estimated GHG emission results with the aid of the Tier-2 method are given in Tables 3-5. Accordingly, the obtained yearly CO2 emissions based on the aircraft types and their LTO cycles are
given in Table 3.
Table 3. Results of emitted CO2 emissions
Aircraft type Aircraft model LTO Count CO2 (kg/y)
A319 Airbus A319 1 2310
A320 Airbus A320 64 156160 A321 Airbus A321 167 504340
B734 Boeing 737-400 6 14880
B738 Boeing 737-800 125 347500
B763 Boeing 767-300 1 5610
C25A CESSNA 525A Citation CJ2 3 3210
B38M Boeing 737-MAX 8 21 58380
C56X CESSNA 560X Citation Excel 17 18190
GLF4 Gulfstream 4 2 4320
C680 CESSNA Citation Sovereign
680
8 8560
CRJ2 BOMBARDIER Regional Jet CRJ-200
1 1070
MD82 McDonnell Douglas 1 3180
According to Table 3, the amount of the CO2 emissions are estimated to be 156160 kg/y for the
A320, 504340 kg/y for the A321, 14880 kg/y for the B734, 347500 kg/y for the B738, 58380 kg/y for
the B38M, and 18190 kg/y for the C56X types of aircraft. Also, it is revealed that these aircrafts have the major portion of CO2 emission amount of total amount.
The variation of total CO2 values by aircraft types is plotted in Figure 2.
Figure 2. Decomposition of CO2 emissions based on the aircraft types

H.Y. Akdeniz / BEÜ Fen Bilimleri Dergisi 10 (3), 1140-1151, 2021
1145
According to the plotted graph in Figure 2, the total CO2 emissions in the period examined are
found to be 1127710 kg/y. The highest CO2 emissions are found to be 504340 kg/y for A321 series
aircraft. One of the main reasons for this can be considered to have the maximum LTO count with a value of 167 of A321 series aircraft. Also, the CRJ2 series aircraft has the minimum CO2 emissions
among the other ones with a value of 1070 kg/y.
The obtained yearly CH4 emissions based on the aircraft types and their LTO cycles are presented in Table 4.
Table 4. Results of emitted CH4 emissions
Aircraft type Aircraft model LTO Count CH4 (kg/y)
A319 Airbus A319 1 0.06
A320 Airbus A320 64 3.84
A321 Airbus A321 167 23.38
B734 Boeing 737-400 6 0.48
B738 Boeing 737-800 125 8.75
B763 Boeing 767-300 1 0.12
C25A CESSNA 525A Citation CJ2 3 0.99
B38M Boeing 737-MAX 8 21 1.47
C56X CESSNA 560X Citation Excel 17 5.61
GLF4 Gulfstream 4 2 0.28 C680 CESSNA Citation Sovereign
680
8 2.64
CRJ2 BOMBARDIER Regional Jet
CRJ-200
1 0.33
MD82 McDonnell Douglas 1 0.19
According to Table 4, the CH4 emissions are calculated to be 3.84 kg/y for the A320, 23.38 kg/y
for the A321, 0.48 kg/y for the B734, 8.75 kg/y for the B738, 1.47 kg/y for the B38M, 5.61 kg/y for the C56X, and 2.64 kg/y for the C680 types of aircraft.
The variation of total CH4 emissions by aircraft types is graphed in Figure 3.
Figure 3. Decomposition of CH4 emissions based on the aircraft types
Figure 3 denotes that as expected, the A321 series aircraft emitted the most CH4 emissions with a value of 23.38 kg/y due to the maximum LTO count. The total CH4 emission in the period examined

H.Y. Akdeniz / BEÜ Fen Bilimleri Dergisi 10 (3), 1140-1151, 2021
1146
is found to be 48.14 kg/y. Besides, the A319 series aircraft has the minimum emitted CH4 emissions
among the other ones with a value of 0.06 kg/y.
The obtained yearly N2O emissions based on the aircraft types and their LTO cycles are demonstrated in Table 5.
Table 5. Results of emitted N2O emissions
Aircraft type Aircraft model LTO Count N2O (kg/y)
A319 Airbus A319 1 0.1
A320 Airbus A320 64 6.4
A321 Airbus A321 167 16.7
B734 Boeing 737-400 6 0.6
B738 Boeing 737-800 125 12.5 B763 Boeing 767-300 1 0.2
C25A CESSNA 525A Citation CJ2 3 0.09
B38M Boeing 737-MAX 8 21 2.1
C56X CESSNA 560X Citation Excel 17 0.51
GLF4 Gulfstream 4 2 0.2
C680 CESSNA Citation Sovereign 680 8 0.24
CRJ2 BOMBARDIER Regional Jet CRJ-200 1 0.03
MD82 McDonnell Douglas 1 0.1
According to Table 5, the N2O emissions are computed to be 6.4 kg/y for the A320, 16.7 kg/y for the A321, 12.5 kg/y for the B738, 2.1 kg/y for the B38M types of aircraft.
The variation of total N2O emissions by aircraft types is graphed in Figure 4.
Figure 4. Decomposition of N2O emissions based on the aircraft types

H.Y. Akdeniz / BEÜ Fen Bilimleri Dergisi 10 (3), 1140-1151, 2021
1147
Figure 4 specifies that when the LTO count is maximum, the A321 series aircraft peaks in terms
of N2O emissions, as with the CO2 and CH4 change trend. The A321 series aircraft emitted 16.4 kg/y of
N2O. It is followed by B738 series aircraft with a value of 12.5 kg/y and A320 series aircraft with a value of 6.4 kg/y, respectively. Moreover, the CRJ2 series aircraft has the minimum N2O emissions
among the other ones with a value of 0.03 kg/y. The total N2O emissions in the period examined are
found to be 39.77 kg/y. When the overall results are reviewed, whereas the MD82 series aircraft has the lowest LTO
count, the aircraft emitted a relatively high rate of GHG emissions. One of the main reasons for this can
be considered to have the high rate GHG emission indexes with a value of 3180 for CO2, 0.19 for CH4,
and 0.1 for N2O of MD82 series aircraft. Similarly, while the CO2, CH4, and N2O emission indexes relatively lower than the Boeing 763 and MD82 series aircraft, the A321 is the highest pollutant aircraft
in the period examined because the aircraft has a maximum LTO count. Besides, local and small scale
Since the examined airport is local and small in scale and the movement counts of the aircraft are relatively low, the emission values are lower than the other airports in this sense. However, the
sustainability of these results and even their reduction is very important in terms of the environmental
dimension of aviation. On the other hand, the total jet-fuel consumption of these aircraft from LTO operations in the
period examined was found to be approximately 357500 kg/y. The decompositions of total jet-fuel
consumption by aircraft types are given in Table 6 and Figure 5.
Table 6. The variation of Jet fuel consumption values
Aircraft type Aircraft model Jet-Fuel Consumption
(kg/y)
A319 Airbus A319 730
A320 Airbus A320 49280
A321 Airbus A321 160320
B734 Boeing 737-400 4680
B738 Boeing 737-800 110000
B763 Boeing 767-300 1780
C25A CESSNA 525A Citation CJ2 1020
B38M Boeing 737-MAX 8 18480
C56X CESSNA 560X Citation Excel 5780
GLF4 Gulfstream 4 1360 C680 CESSNA Citation Sovereign 680 2720
CRJ2 BOMBARDIER Regional Jet CRJ-200 340
MD82 McDonnell Douglas 1010
Figure 5 indicates that the A321 series aircraft burned 160320 kg/y of jet fuel. It is followed by
B738 series aircraft with a value of 110000 kg/y and A320 series aircraft with a value of 49280 kg/y,
respectively. Also, in this period, the jet fuel consumption of B38M, C56X, B734, C680, and MD82 aircrafts are calculated as 18480 kg/y, 5780 kg/y, 4680 kg/y, 2720 kg/y, and 1010 kg/y, respectively.
As can be clearly seen that the A321 series aircraft is the most fuel-consuming aircraft among the other
ones. One of the main reasons for this result is that the aircraft has 167 LTO. Average jet-fuel consumption efficiencies are estimated for each of these aircraft based on the
LTO operations and calculated jet-fuel consumption values. Average Jet-fuel consumption efficiencies
of the aircraft types under-investigated are graphed in Figure 6.

H.Y. Akdeniz / BEÜ Fen Bilimleri Dergisi 10 (3), 1140-1151, 2021
1148
Figure 5. Jet-fuel consumption based on the aircraft types of under-investigated period
Figure 6. Aircraft engine fuel efficiencies based on the correlation between the count of LTO cycles and total
fuel consumption values

H.Y. Akdeniz / BEÜ Fen Bilimleri Dergisi 10 (3), 1140-1151, 2021
1149
According to the plotted graph in Figure 6, for the specified parameter which is the ratio of
average jet-fuel consumption to LTO count, the B767-300 series aircraft (B763) is the most inefficient
aircraft in terms of fuel consumption efficiency at the end of LTO operations in the period examined and among the aircraft types examined. This is followed by the MD82 series aircraft. Contrary to this
trend, it can be concluded that although the B763 has low LTO, the C680, CRJ2, C25A and C56X
aircraft are more fuel efficient at almost similar LTOs in view of only this parameter.
4. Conclusion
In the present research, the GHG emissions gases emitted to the atmosphere from the landing and take-off cycle operations of thirteen different types of aircraft at a small-scale airport operating international
flights were investigated. The main results of the current study can be summarized as follows:
It was revealed that Airbus 321 (A321) was the highest GHG generating aircraft type in the
period examined. Although the A321's CO2, N2O, and CH4 emission indexes are lower than the Boeing 763 (B763) series and MD82 type aircraft, the A321's maximum LTO count has led to this result. It has
been found that the aircraft, whose emissions are examined, burned approximately 357500 kg/y of jet
fuel in this period.
Finally, for the specified parameter which is the ratio of average jet-fuel consumption to LTO
count, the B767-300 series aircraft (B763) is the most inefficient aircraft in terms of fuel consumption
efficiency at the end of LTO operations in the period examined and among the aircraft types examined.
In the coming years, with the increasing of yearly operations at airports worldwide, greenhouse
gaseous are expected to rise. It is necessary to take measures to the regulations that prioritize issues such as the gradual decrease of fossil fuels and global climate change, to spread more electric or fully electric
aircraft with hybrid propulsion systems, and to minimize both fuel efficiency and environmental impact
of aircraft. In this study, real-time values were used for all computations. The current study and its results
will be a key reference for future implementations of aviation-induced emission estimation procedures.
Also, for a future study, the author suggests and considers detailed investigating the potential environmental, economical, ecological-cost effects of aviation-induced emissions.
Authors’ Contributions
All contributions belong to the author in this paper.
Statement of Conflicts of Interest
There is no conflict of interest among the authors.
Statement of Research and Publication Ethics
The author declares that this study complies with Research and Publication Ethics.
References
[1] Yilmaz I., Ilbas M., Tastan M., Tarhan C. 2012. Investigation of hydrogen usage in the aviation
industry. Energy Conversion and Management, 63: 63-69. [2] Balli O., Hepbasli A. 2013. Energetic and exergetic analyses of a T56 turboprop engine. Energy
Conversion and Management, 73: 106-120.
[3] Álvarez M.J.G., Yan W. 2013. Is Environmental Innovation Worth It? The Case of the Civil
Aviation Industry of Emerging Markets. In: Advances in Production Management Systems. Innovative and Knowledge-Based Production Management in a Global-Local World, 415: 294-
301.
[4] Norton T.M. 2014. Aircraft Greenhouse Gas Emissions during the Landing and Takeoff Cycle at Bay Area Airports. Master’s dissertation, University of San Francisco, San Fransisco, 1-45.

H.Y. Akdeniz / BEÜ Fen Bilimleri Dergisi 10 (3), 1140-1151, 2021
1150
[5] Metz B., Davidson O., Swart R., Pan J. 2001. Climate Change 2001: Mitigation, Contribution of
Working Group III to the Third Assessment [TAR] Report of the Intergovernmental Panel on
Climate Change (IPCC), New York: Cambridge University Press. [6] Waitz I., Townsend J, Cutcher-Gershenfeld J., Greitzer E., Kerrebrock J. 2004. Aviation and the
environment: A national vision statement, the framework for goals and recommended actions.
Partnership for AiR transportation noise and emissions reduction. Massachusetts Institue Technology, 03-C-NE-MIT, 2004.
[7] Mahashabde A., Wolfe P., Ashok A., Dorbian C., He Q., Fan A., Lukachko S., Mozdzanowska
A., Wollersheim C., Barrett S.R.H., Locke M., Waitz I.A. 2011. Assessing the environmental
impacts of aircraft noise and emissions. Progress in Aerospace Sciences, 47: 15-52. [8] Kurniawan J.S., Khardi S. 2011. 2011. Comparison of methodologies estimating emissions of
aircraft pollutants, environmental impact assessment around airports. Environmental Impact
Assessment Review, 31: 240-252. [9] Ekici S., Yalin G., Altuntas O., Karakoc T.H. 2013. Calculation of HC, CO, and NOx from civil
aviation in Turkey in 2012. International Journal of Environmental Pollution, 53: 232-244.
[10] Altuntas O. 2014. Calculation of domestic flight-caused global warming potential from aircraft emissions in Turkish airports. International Journal of Global Warming, 6: 367-379.
[11] Kesgin U. 2006. Aircraft emissions at Turkish airports. Energy, 31: 372-384.
[12] Unger N., Zhao Y., Dang H. 2013. Mid-21st century chemical forcing of climate by the civil
aviation sector: Future Aviatıon Chemical Climate Forcing. Geophysical Research Letters, 40: 641-645.
[13] Song S.-K., Shon Z.-H., Kang Y.-H. 2015. Comparison of impacts of aircraft emissions within
the boundary layer on the regional ozone in South Korea. Atmospheric Environment, 117: 169-179.
[14] Pecorari E., Mantovani A., Franceschini C., Bassano D., Palmeri L., Rampazzo G. 2016. Analysis
of the effects of meteorology on aircraft exhaust dispersion and deposition using a Lagrangian
particle model. Sciences Total Environment, 541: 839-856. [15] Babaoglu N., Ozgunoglu K. 2017. Kahramanmaraş Havalimanı İçin Uçaklardan Kaynaklanan
Emisyonların Belirlenmesi. Kahramanmaraş Sütçü İmam Üniversitesi Mühendislik Bilimleri
Dergisi, 20: 24-30. [16] Kaygusuz K. 2003. Energy policy and climate change in Turkey. Energy Conversion and
Management, 44: 1671-1688.
[17] Tokuslu A. 2020. Estimation of aircraft emissions at Georgian international airport. Energy, 206: 118-219.
[18] Akyuz A.Ö., Kumas K., Inan O., Gungor A. 2019. Muğla Hava Trafiğinin Karbon Ayak İzi
Açısından İncelenmesi. Academic Platform Journal of Engineering and Sciences, 7: 291-297.
[19] Yilmaz I. 2017. Emissions from passenger aircraft at Kayseri Airport, Turkey. Journal of Air Transport Management, 58: 176-182.
[20] Rissman J., Arunachalam S., BenDor T., West J.J. 2013. Equity and health impacts of aircraft
emissions at the Hartsfield-Jackson Atlanta International Airport. Landscape and Urban Planning, 120: 234-247.
[21] Dong Q., Chen F., Chen Z. 2020. Airports and air pollutions: Empirical evidence from China.
Transport Policy, 99: 385-395. [22] Phoenix D., Khodayari A., Wuebbles D., Stewart K. 2019. Aviation impact on air quality present-
day and mid-century simulated in the Community Atmosphere Model (CAM). Atmospheric
Environment, 196: 125-132.
[23] Yang X., Cheng S., Lang J., Xu R., Lv Z. 2018. Characterization of aircraft emissions and air quality impacts of an international airport. Journal of Environmental Sciences, 72: 198-207.
[24] Altuntas O., Karakoc T.H. 2011. Türkiye’deki Bazı Hava Alanlarında İç Hat Uçuşları İçin Uçak
Seçiminde Çevresel Etkilerin Göz Önünde Bulundurulmasının İncelenmesi. Havacılık ve Uzay Teknolojileri Dergisi, 5: 11-18.
[25] Kafali, H. and Altuntas, O. 2020. The analysis of emission values from commercial flights at
Dalaman international airport Turkey. Aircraft Engineering and Aerospace Technology, 92 (10):
1451-1457.

H.Y. Akdeniz / BEÜ Fen Bilimleri Dergisi 10 (3), 1140-1151, 2021
1151
[26] FAA. 2005. Aviation and Emissions: Office of Environment and Energy. Federal Aviation
Administration, FAA.
[27] EC. 2021. European Commission: Shedding Light on Energy on the EU. [28] Eggleston S., Buendia L., Miawa K., Ngara T., Tanabe K. 2006. Intergovernmental Panel on
Climate Change, National Greenhouse Gas Inventories Programme. 2006 IPCC guidelines for
national greenhouse gas inventories, IGES Publishers, Japan, 1-1988.