Determination of loperamide in human plasma and saliva by liquid chromatography–tandem mass...
8
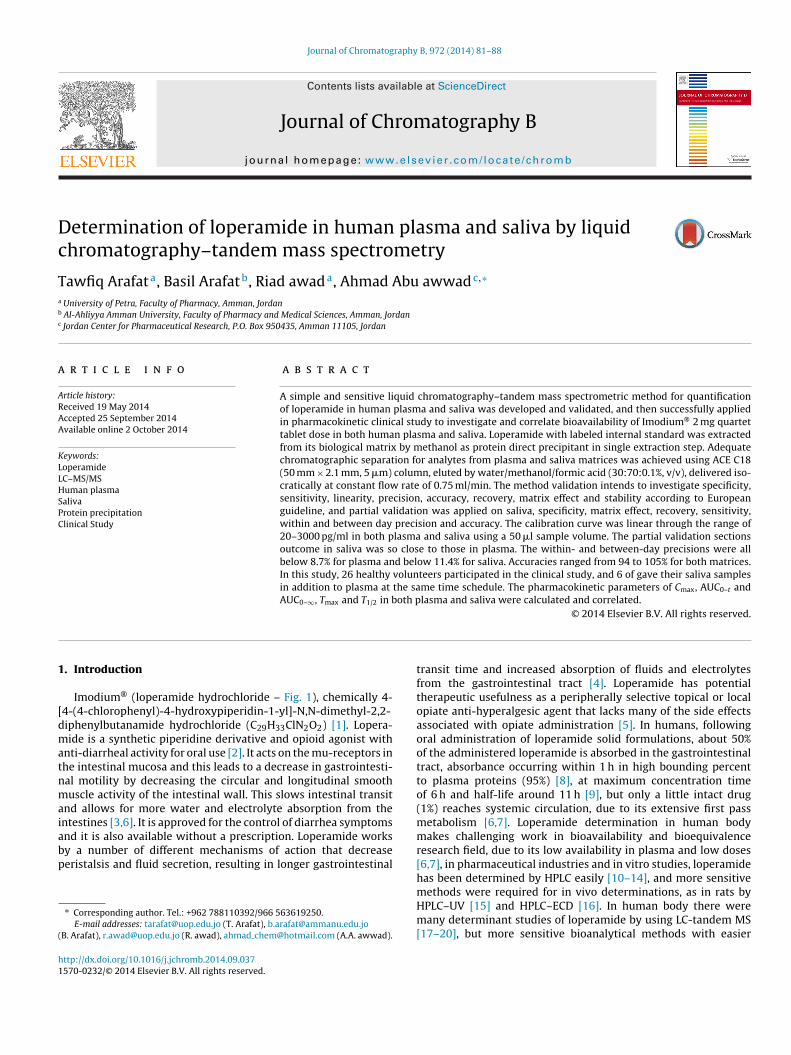
Journal of Chromatography B, 972 (2014) 81–88 Contents lists available at ScienceDirect Journal of Chromatography B jou rn al hom ep age: www.elsevier.com/locate/chromb Determination of loperamide in human plasma and saliva by liquid chromatography–tandem mass spectrometry Tawfiq Arafat a , Basil Arafat b , Riad awad a , Ahmad Abu awwad c,∗ a University of Petra, Faculty of Pharmacy, Amman, Jordan b Al-Ahliyya Amman University, Faculty of Pharmacy and Medical Sciences, Amman, Jordan c Jordan Center for Pharmaceutical Research, P.O. Box 950435, Amman 11105, Jordan a r t i c l e i n f o Article history: Received 19 May 2014 Accepted 25 September 2014 Available online 2 October 2014 Keywords: Loperamide LC–MS/MS Human plasma Saliva Protein precipitation Clinical Study a b s t r a c t A simple and sensitive liquid chromatography–tandem mass spectrometric method for quantification of loperamide in human plasma and saliva was developed and validated, and then successfully applied in pharmacokinetic clinical study to investigate and correlate bioavailability of Imodium ® 2 mg quartet tablet dose in both human plasma and saliva. Loperamide with labeled internal standard was extracted from its biological matrix by methanol as protein direct precipitant in single extraction step. Adequate chromatographic separation for analytes from plasma and saliva matrices was achieved using ACE C18 (50 mm × 2.1 mm, 5 m) column, eluted by water/methanol/formic acid (30:70:0.1%, v/v), delivered iso- cratically at constant flow rate of 0.75 ml/min. The method validation intends to investigate specificity, sensitivity, linearity, precision, accuracy, recovery, matrix effect and stability according to European guideline, and partial validation was applied on saliva, specificity, matrix effect, recovery, sensitivity, within and between day precision and accuracy. The calibration curve was linear through the range of 20–3000 pg/ml in both plasma and saliva using a 50 l sample volume. The partial validation sections outcome in saliva was so close to those in plasma. The within- and between-day precisions were all below 8.7% for plasma and below 11.4% for saliva. Accuracies ranged from 94 to 105% for both matrices. In this study, 26 healthy volunteers participated in the clinical study, and 6 of gave their saliva samples in addition to plasma at the same time schedule. The pharmacokinetic parameters of C max , AUC 0–t and AUC 0–∞ , T max and T 1/2 in both plasma and saliva were calculated and correlated. © 2014 Elsevier B.V. All rights reserved. 1. Introduction Imodium ® (loperamide hydrochloride – Fig. 1), chemically 4- [4-(4-chlorophenyl)-4-hydroxypiperidin-1-yl]-N,N-dimethyl-2,2- diphenylbutanamide hydrochloride (C 29 H 33 ClN 2 O 2 ) [1]. Lopera- mide is a synthetic piperidine derivative and opioid agonist with anti-diarrheal activity for oral use [2]. It acts on the mu-receptors in the intestinal mucosa and this leads to a decrease in gastrointesti- nal motility by decreasing the circular and longitudinal smooth muscle activity of the intestinal wall. This slows intestinal transit and allows for more water and electrolyte absorption from the intestines [3,6]. It is approved for the control of diarrhea symptoms and it is also available without a prescription. Loperamide works by a number of different mechanisms of action that decrease peristalsis and fluid secretion, resulting in longer gastrointestinal ∗ Corresponding author. Tel.: +962 788110392/966 563619250. E-mail addresses: [email protected] (T. Arafat), [email protected] (B. Arafat), [email protected] (R. awad), ahmad [email protected] (A.A. awwad). transit time and increased absorption of fluids and electrolytes from the gastrointestinal tract [4]. Loperamide has potential therapeutic usefulness as a peripherally selective topical or local opiate anti-hyperalgesic agent that lacks many of the side effects associated with opiate administration [5]. In humans, following oral administration of loperamide solid formulations, about 50% of the administered loperamide is absorbed in the gastrointestinal tract, absorbance occurring within 1 h in high bounding percent to plasma proteins (95%) [8], at maximum concentration time of 6 h and half-life around 11 h [9], but only a little intact drug (1%) reaches systemic circulation, due to its extensive first pass metabolism [6,7]. Loperamide determination in human body makes challenging work in bioavailability and bioequivalence research field, due to its low availability in plasma and low doses [6,7], in pharmaceutical industries and in vitro studies, loperamide has been determined by HPLC easily [10–14], and more sensitive methods were required for in vivo determinations, as in rats by HPLC–UV [15] and HPLC–ECD [16]. In human body there were many determinant studies of loperamide by using LC-tandem MS [17–20], but more sensitive bioanalytical methods with easier http://dx.doi.org/10.1016/j.jchromb.2014.09.037 1570-0232/© 2014 Elsevier B.V. All rights reserved.
Transcript of Determination of loperamide in human plasma and saliva by liquid chromatography–tandem mass...
Dc
Ta
b
c
a
ARAA
KLLHSPC
1
[dmatnmaiabp
(
h1
Journal of Chromatography B, 972 (2014) 81–88
Contents lists available at ScienceDirect
Journal of Chromatography B
jou rn al hom ep age: www.elsev ier .com/ locate /chromb
etermination of loperamide in human plasma and saliva by liquidhromatography–tandem mass spectrometry
awfiq Arafata, Basil Arafatb, Riad awada, Ahmad Abu awwadc,∗
University of Petra, Faculty of Pharmacy, Amman, JordanAl-Ahliyya Amman University, Faculty of Pharmacy and Medical Sciences, Amman, JordanJordan Center for Pharmaceutical Research, P.O. Box 950435, Amman 11105, Jordan
r t i c l e i n f o
rticle history:eceived 19 May 2014ccepted 25 September 2014vailable online 2 October 2014
eywords:operamideC–MS/MSuman plasmaalivarotein precipitationlinical Study
a b s t r a c t
A simple and sensitive liquid chromatography–tandem mass spectrometric method for quantificationof loperamide in human plasma and saliva was developed and validated, and then successfully appliedin pharmacokinetic clinical study to investigate and correlate bioavailability of Imodium® 2 mg quartettablet dose in both human plasma and saliva. Loperamide with labeled internal standard was extractedfrom its biological matrix by methanol as protein direct precipitant in single extraction step. Adequatechromatographic separation for analytes from plasma and saliva matrices was achieved using ACE C18(50 mm × 2.1 mm, 5 �m) column, eluted by water/methanol/formic acid (30:70:0.1%, v/v), delivered iso-cratically at constant flow rate of 0.75 ml/min. The method validation intends to investigate specificity,sensitivity, linearity, precision, accuracy, recovery, matrix effect and stability according to Europeanguideline, and partial validation was applied on saliva, specificity, matrix effect, recovery, sensitivity,within and between day precision and accuracy. The calibration curve was linear through the range of20–3000 pg/ml in both plasma and saliva using a 50 �l sample volume. The partial validation sections
outcome in saliva was so close to those in plasma. The within- and between-day precisions were allbelow 8.7% for plasma and below 11.4% for saliva. Accuracies ranged from 94 to 105% for both matrices.In this study, 26 healthy volunteers participated in the clinical study, and 6 of gave their saliva samplesin addition to plasma at the same time schedule. The pharmacokinetic parameters of Cmax, AUC0–t andAUC0–∞, Tmax and T1/2 in both plasma and saliva were calculated and correlated.. Introduction
Imodium® (loperamide hydrochloride – Fig. 1), chemically 4-4-(4-chlorophenyl)-4-hydroxypiperidin-1-yl]-N,N-dimethyl-2,2-iphenylbutanamide hydrochloride (C29H33ClN2O2) [1]. Lopera-ide is a synthetic piperidine derivative and opioid agonist with
nti-diarrheal activity for oral use [2]. It acts on the mu-receptors inhe intestinal mucosa and this leads to a decrease in gastrointesti-al motility by decreasing the circular and longitudinal smoothuscle activity of the intestinal wall. This slows intestinal transit
nd allows for more water and electrolyte absorption from thentestines [3,6]. It is approved for the control of diarrhea symptoms
nd it is also available without a prescription. Loperamide worksy a number of different mechanisms of action that decreaseeristalsis and fluid secretion, resulting in longer gastrointestinal∗ Corresponding author. Tel.: +962 788110392/966 563619250.E-mail addresses: [email protected] (T. Arafat), [email protected]
B. Arafat), [email protected] (R. awad), ahmad [email protected] (A.A. awwad).
ttp://dx.doi.org/10.1016/j.jchromb.2014.09.037570-0232/© 2014 Elsevier B.V. All rights reserved.
© 2014 Elsevier B.V. All rights reserved.
transit time and increased absorption of fluids and electrolytesfrom the gastrointestinal tract [4]. Loperamide has potentialtherapeutic usefulness as a peripherally selective topical or localopiate anti-hyperalgesic agent that lacks many of the side effectsassociated with opiate administration [5]. In humans, followingoral administration of loperamide solid formulations, about 50%of the administered loperamide is absorbed in the gastrointestinaltract, absorbance occurring within 1 h in high bounding percentto plasma proteins (95%) [8], at maximum concentration timeof 6 h and half-life around 11 h [9], but only a little intact drug(1%) reaches systemic circulation, due to its extensive first passmetabolism [6,7]. Loperamide determination in human bodymakes challenging work in bioavailability and bioequivalenceresearch field, due to its low availability in plasma and low doses[6,7], in pharmaceutical industries and in vitro studies, loperamidehas been determined by HPLC easily [10–14], and more sensitive
methods were required for in vivo determinations, as in rats byHPLC–UV [15] and HPLC–ECD [16]. In human body there weremany determinant studies of loperamide by using LC-tandem MS[17–20], but more sensitive bioanalytical methods with easier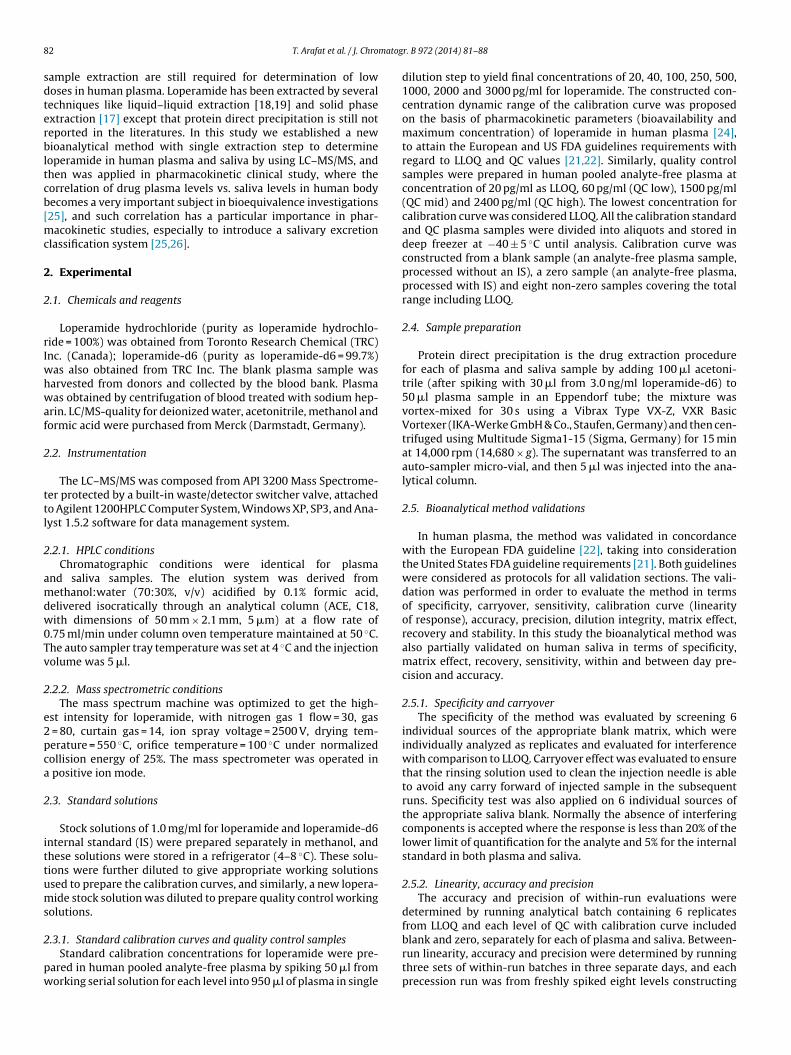
8 matog
sdterbltcb[mc
2
2
rIwhwaf
2
ttl
2
amdw0Tv
2
e2pca
2
ittums
2
pw
2 T. Arafat et al. / J. Chro
ample extraction are still required for determination of lowoses in human plasma. Loperamide has been extracted by severalechniques like liquid–liquid extraction [18,19] and solid phasextraction [17] except that protein direct precipitation is still noteported in the literatures. In this study we established a newioanalytical method with single extraction step to determine
operamide in human plasma and saliva by using LC–MS/MS, andhen was applied in pharmacokinetic clinical study, where theorrelation of drug plasma levels vs. saliva levels in human bodyecomes a very important subject in bioequivalence investigations25], and such correlation has a particular importance in phar-
acokinetic studies, especially to introduce a salivary excretionlassification system [25,26].
. Experimental
.1. Chemicals and reagents
Loperamide hydrochloride (purity as loperamide hydrochlo-ide = 100%) was obtained from Toronto Research Chemical (TRC)nc. (Canada); loperamide-d6 (purity as loperamide-d6 = 99.7%)
as also obtained from TRC Inc. The blank plasma sample wasarvested from donors and collected by the blood bank. Plasmaas obtained by centrifugation of blood treated with sodium hep-
rin. LC/MS-quality for deionized water, acetonitrile, methanol andormic acid were purchased from Merck (Darmstadt, Germany).
.2. Instrumentation
The LC–MS/MS was composed from API 3200 Mass Spectrome-er protected by a built-in waste/detector switcher valve, attachedo Agilent 1200HPLC Computer System, Windows XP, SP3, and Ana-yst 1.5.2 software for data management system.
.2.1. HPLC conditionsChromatographic conditions were identical for plasma
nd saliva samples. The elution system was derived fromethanol:water (70:30%, v/v) acidified by 0.1% formic acid,
elivered isocratically through an analytical column (ACE, C18,ith dimensions of 50 mm × 2.1 mm, 5 �m) at a flow rate of
.75 ml/min under column oven temperature maintained at 50 ◦C.he auto sampler tray temperature was set at 4 ◦C and the injectionolume was 5 �l.
.2.2. Mass spectrometric conditionsThe mass spectrum machine was optimized to get the high-
st intensity for loperamide, with nitrogen gas 1 flow = 30, gas = 80, curtain gas = 14, ion spray voltage = 2500 V, drying tem-erature = 550 ◦C, orifice temperature = 100 ◦C under normalizedollision energy of 25%. The mass spectrometer was operated in
positive ion mode.
.3. Standard solutions
Stock solutions of 1.0 mg/ml for loperamide and loperamide-d6nternal standard (IS) were prepared separately in methanol, andhese solutions were stored in a refrigerator (4–8 ◦C). These solu-ions were further diluted to give appropriate working solutionssed to prepare the calibration curves, and similarly, a new lopera-ide stock solution was diluted to prepare quality control working
olutions.
.3.1. Standard calibration curves and quality control samplesStandard calibration concentrations for loperamide were pre-
ared in human pooled analyte-free plasma by spiking 50 �l fromorking serial solution for each level into 950 �l of plasma in single
r. B 972 (2014) 81–88
dilution step to yield final concentrations of 20, 40, 100, 250, 500,1000, 2000 and 3000 pg/ml for loperamide. The constructed con-centration dynamic range of the calibration curve was proposedon the basis of pharmacokinetic parameters (bioavailability andmaximum concentration) of loperamide in human plasma [24],to attain the European and US FDA guidelines requirements withregard to LLOQ and QC values [21,22]. Similarly, quality controlsamples were prepared in human pooled analyte-free plasma atconcentration of 20 pg/ml as LLOQ, 60 pg/ml (QC low), 1500 pg/ml(QC mid) and 2400 pg/ml (QC high). The lowest concentration forcalibration curve was considered LLOQ. All the calibration standardand QC plasma samples were divided into aliquots and stored indeep freezer at −40 ± 5 ◦C until analysis. Calibration curve wasconstructed from a blank sample (an analyte-free plasma sample,processed without an IS), a zero sample (an analyte-free plasma,processed with IS) and eight non-zero samples covering the totalrange including LLOQ.
2.4. Sample preparation
Protein direct precipitation is the drug extraction procedurefor each of plasma and saliva sample by adding 100 �l acetoni-trile (after spiking with 30 �l from 3.0 ng/ml loperamide-d6) to50 �l plasma sample in an Eppendorf tube; the mixture wasvortex-mixed for 30 s using a Vibrax Type VX-Z, VXR BasicVortexer (IKA-Werke GmbH & Co., Staufen, Germany) and then cen-trifuged using Multitude Sigma1-15 (Sigma, Germany) for 15 minat 14,000 rpm (14,680 × g). The supernatant was transferred to anauto-sampler micro-vial, and then 5 �l was injected into the ana-lytical column.
2.5. Bioanalytical method validations
In human plasma, the method was validated in concordancewith the European FDA guideline [22], taking into considerationthe United States FDA guideline requirements [21]. Both guidelineswere considered as protocols for all validation sections. The vali-dation was performed in order to evaluate the method in termsof specificity, carryover, sensitivity, calibration curve (linearityof response), accuracy, precision, dilution integrity, matrix effect,recovery and stability. In this study the bioanalytical method wasalso partially validated on human saliva in terms of specificity,matrix effect, recovery, sensitivity, within and between day pre-cision and accuracy.
2.5.1. Specificity and carryoverThe specificity of the method was evaluated by screening 6
individual sources of the appropriate blank matrix, which wereindividually analyzed as replicates and evaluated for interferencewith comparison to LLOQ. Carryover effect was evaluated to ensurethat the rinsing solution used to clean the injection needle is ableto avoid any carry forward of injected sample in the subsequentruns. Specificity test was also applied on 6 individual sources ofthe appropriate saliva blank. Normally the absence of interferingcomponents is accepted where the response is less than 20% of thelower limit of quantification for the analyte and 5% for the internalstandard in both plasma and saliva.
2.5.2. Linearity, accuracy and precisionThe accuracy and precision of within-run evaluations were
determined by running analytical batch containing 6 replicatesfrom LLOQ and each level of QC with calibration curve included
blank and zero, separately for each of plasma and saliva. Between-run linearity, accuracy and precision were determined by runningthree sets of within-run batches in three separate days, and eachprecession run was from freshly spiked eight levels constructing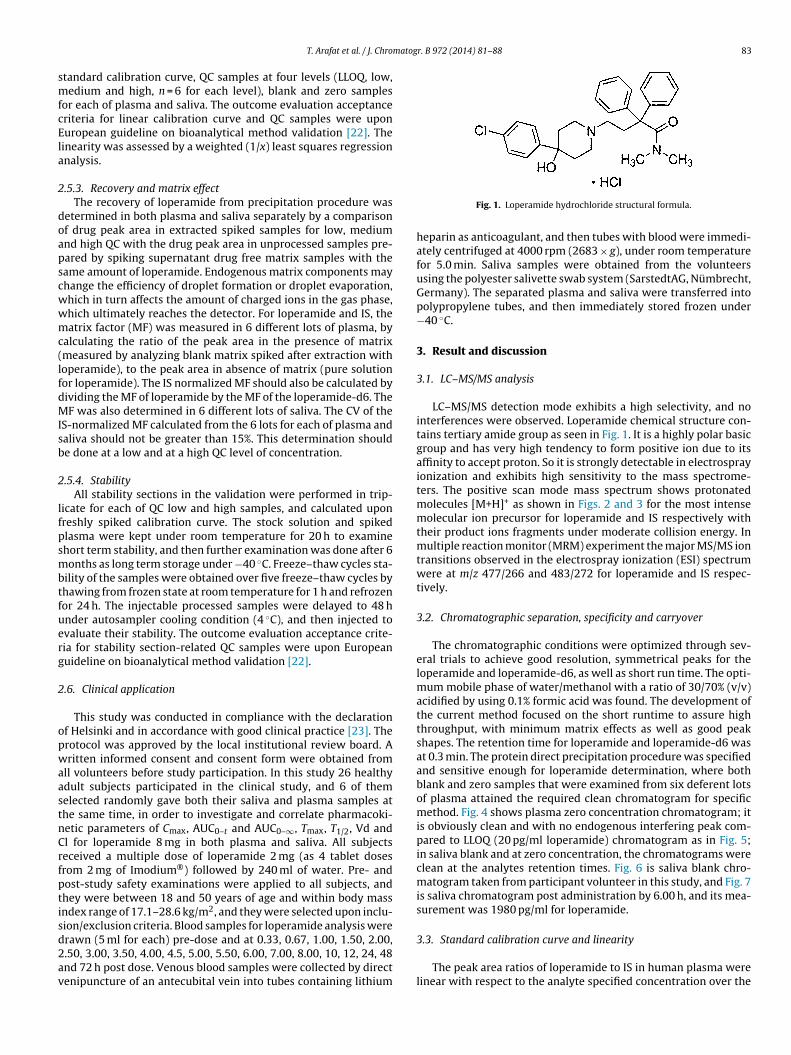
matogr. B 972 (2014) 81–88 83
smfcEla
2
doapscwwmc(lfdMIsb
2
lfpsmbtfuerg
2
opwaastnCrfptisd2av
T. Arafat et al. / J. Chro
tandard calibration curve, QC samples at four levels (LLOQ, low,edium and high, n = 6 for each level), blank and zero samples
or each of plasma and saliva. The outcome evaluation acceptanceriteria for linear calibration curve and QC samples were uponuropean guideline on bioanalytical method validation [22]. Theinearity was assessed by a weighted (1/x) least squares regressionnalysis.
.5.3. Recovery and matrix effectThe recovery of loperamide from precipitation procedure was
etermined in both plasma and saliva separately by a comparisonf drug peak area in extracted spiked samples for low, mediumnd high QC with the drug peak area in unprocessed samples pre-ared by spiking supernatant drug free matrix samples with theame amount of loperamide. Endogenous matrix components mayhange the efficiency of droplet formation or droplet evaporation,hich in turn affects the amount of charged ions in the gas phase,hich ultimately reaches the detector. For loperamide and IS, theatrix factor (MF) was measured in 6 different lots of plasma, by
alculating the ratio of the peak area in the presence of matrixmeasured by analyzing blank matrix spiked after extraction withoperamide), to the peak area in absence of matrix (pure solutionor loperamide). The IS normalized MF should also be calculated byividing the MF of loperamide by the MF of the loperamide-d6. TheF was also determined in 6 different lots of saliva. The CV of the
S-normalized MF calculated from the 6 lots for each of plasma andaliva should not be greater than 15%. This determination shoulde done at a low and at a high QC level of concentration.
.5.4. StabilityAll stability sections in the validation were performed in trip-
icate for each of QC low and high samples, and calculated uponreshly spiked calibration curve. The stock solution and spikedlasma were kept under room temperature for 20 h to examinehort term stability, and then further examination was done after 6onths as long term storage under −40 ◦C. Freeze–thaw cycles sta-
ility of the samples were obtained over five freeze–thaw cycles byhawing from frozen state at room temperature for 1 h and refrozenor 24 h. The injectable processed samples were delayed to 48 hnder autosampler cooling condition (4 ◦C), and then injected tovaluate their stability. The outcome evaluation acceptance crite-ia for stability section-related QC samples were upon Europeanuideline on bioanalytical method validation [22].
.6. Clinical application
This study was conducted in compliance with the declarationf Helsinki and in accordance with good clinical practice [23]. Therotocol was approved by the local institutional review board. Aritten informed consent and consent form were obtained from
ll volunteers before study participation. In this study 26 healthydult subjects participated in the clinical study, and 6 of themelected randomly gave both their saliva and plasma samples athe same time, in order to investigate and correlate pharmacoki-etic parameters of Cmax, AUC0–t and AUC0–∞, Tmax, T1/2, Vd andl for loperamide 8 mg in both plasma and saliva. All subjectseceived a multiple dose of loperamide 2 mg (as 4 tablet dosesrom 2 mg of Imodium®) followed by 240 ml of water. Pre- andost-study safety examinations were applied to all subjects, andhey were between 18 and 50 years of age and within body massndex range of 17.1–28.6 kg/m2, and they were selected upon inclu-ion/exclusion criteria. Blood samples for loperamide analysis were
rawn (5 ml for each) pre-dose and at 0.33, 0.67, 1.00, 1.50, 2.00,.50, 3.00, 3.50, 4.00, 4.5, 5.00, 5.50, 6.00, 7.00, 8.00, 10, 12, 24, 48nd 72 h post dose. Venous blood samples were collected by directenipuncture of an antecubital vein into tubes containing lithiumFig. 1. Loperamide hydrochloride structural formula.
heparin as anticoagulant, and then tubes with blood were immedi-ately centrifuged at 4000 rpm (2683 × g), under room temperaturefor 5.0 min. Saliva samples were obtained from the volunteersusing the polyester salivette swab system (SarstedtAG, Nümbrecht,Germany). The separated plasma and saliva were transferred intopolypropylene tubes, and then immediately stored frozen under−40 ◦C.
3. Result and discussion
3.1. LC–MS/MS analysis
LC–MS/MS detection mode exhibits a high selectivity, and nointerferences were observed. Loperamide chemical structure con-tains tertiary amide group as seen in Fig. 1. It is a highly polar basicgroup and has very high tendency to form positive ion due to itsaffinity to accept proton. So it is strongly detectable in electrosprayionization and exhibits high sensitivity to the mass spectrome-ters. The positive scan mode mass spectrum shows protonatedmolecules [M+H]+ as shown in Figs. 2 and 3 for the most intensemolecular ion precursor for loperamide and IS respectively withtheir product ions fragments under moderate collision energy. Inmultiple reaction monitor (MRM) experiment the major MS/MS iontransitions observed in the electrospray ionization (ESI) spectrumwere at m/z 477/266 and 483/272 for loperamide and IS respec-tively.
3.2. Chromatographic separation, specificity and carryover
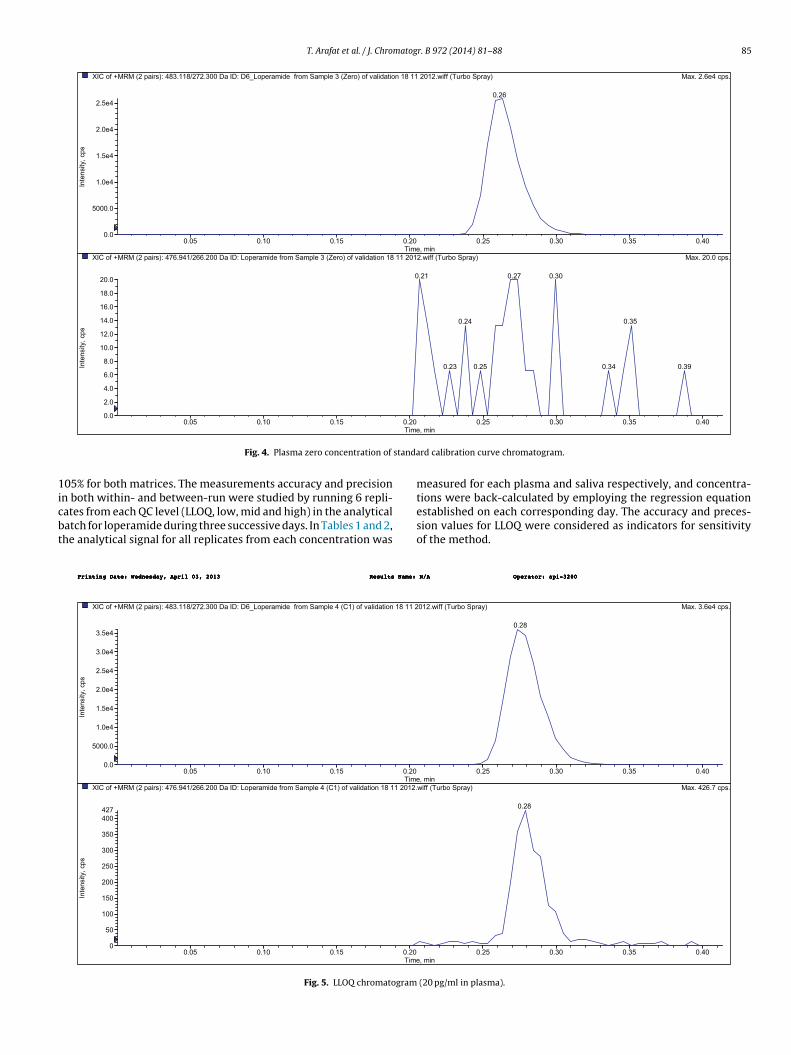
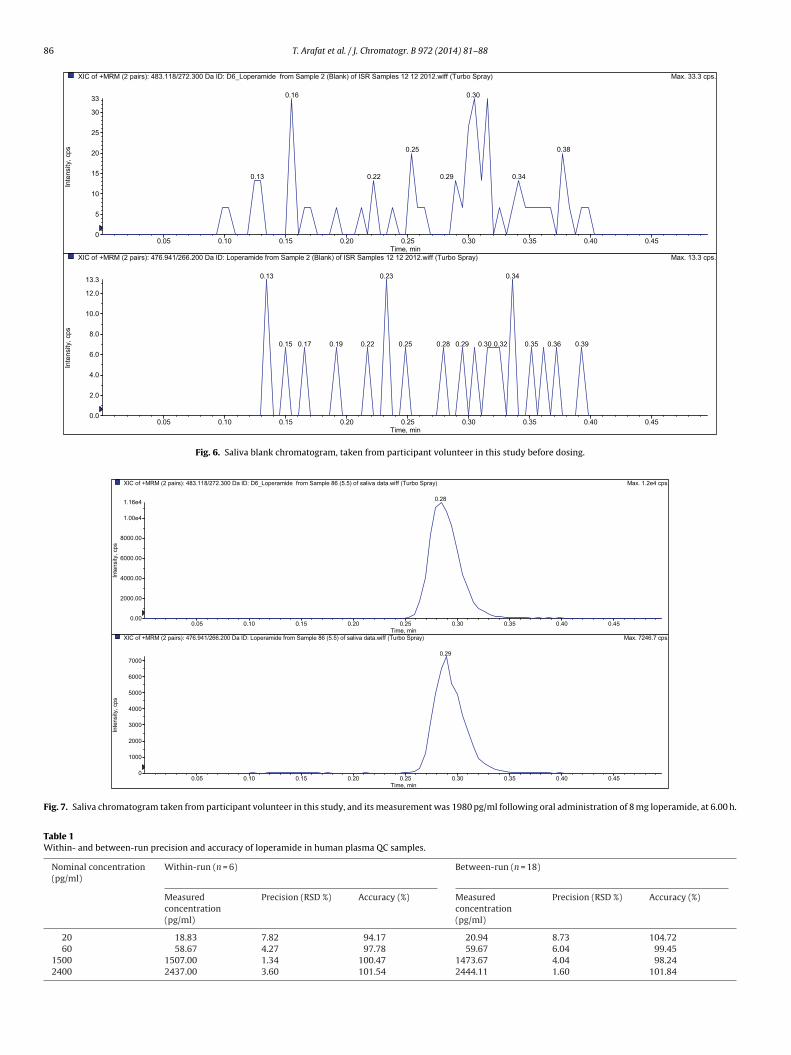
The chromatographic conditions were optimized through sev-eral trials to achieve good resolution, symmetrical peaks for theloperamide and loperamide-d6, as well as short run time. The opti-mum mobile phase of water/methanol with a ratio of 30/70% (v/v)acidified by using 0.1% formic acid was found. The development ofthe current method focused on the short runtime to assure highthroughput, with minimum matrix effects as well as good peakshapes. The retention time for loperamide and loperamide-d6 wasat 0.3 min. The protein direct precipitation procedure was specifiedand sensitive enough for loperamide determination, where bothblank and zero samples that were examined from six deferent lotsof plasma attained the required clean chromatogram for specificmethod. Fig. 4 shows plasma zero concentration chromatogram; itis obviously clean and with no endogenous interfering peak com-pared to LLOQ (20 pg/ml loperamide) chromatogram as in Fig. 5;in saliva blank and at zero concentration, the chromatograms wereclean at the analytes retention times. Fig. 6 is saliva blank chro-matogram taken from participant volunteer in this study, and Fig. 7is saliva chromatogram post administration by 6.00 h, and its mea-surement was 1980 pg/ml for loperamide.
3.3. Standard calibration curve and linearity
The peak area ratios of loperamide to IS in human plasma werelinear with respect to the analyte specified concentration over the

84 T. Arafat et al. / J. Chromatogr. B 972 (2014) 81–88
ctrum
cfa%suts
Fig. 2. Product ion mass spe
alibration dynamic range from 20 to 3000 pg/ml during validationor loperamide, with mean values (n = 6) for slope of 0.341 ± 0.042nd precision (RSD %) = 11.7, intercept of 0.000903 ± 0.001, RSD
= 1.1 and correlation coefficient of 0.9996 ± 0.001. The regres-
ion parameters of the calibration curve were generated forn-weighted (x) and weighted (1/x) function. The weighting fac-or 1/x calculated from the peak area ratio gave better fit data totraight line than un-weighted factor, so that the calibration curvesFig. 3. Product ion mass spectrum o
of [M+H]+ for loperamide.
for loperamide were calculated by weighted least-squares linearregression analysis (1/x) for specified concentrations (x-axis) vs.peak area ratio of loperamide to IS (y-axis).
3.4. Within- and between-run sensitivity, accuracy and precision
The within- and between-day precisions were all below 8.7% forplasma and below 11.4% for saliva. Accuracies ranged from 94 to
f [M+H]+ for loperamide-d6.
T. Arafat et al. / J. Chromatogr. B 972 (2014) 81–88 85
aM)yarpSobruT(ffiw.21021181noitadilavfo)oreZ(3elpmaSmorfedimarepoL_6D:DIaD003.272/811.384:)sriap2(MRM+foCIX x. 2.6e4 cps.
0.05 0.10 0. 15 0.20 0.25 0.30 0.35 0.40Time, min
0.0
5000 .0
1.0e4
1.5e4
2.0e4
2.5e4
Inte
nsity
, cps
0.26
2.xaM)yarpSobruT(ffiw.21021181noitadilavfo)oreZ(3elpmaSmorfedimarepoL:DIaD002.662/149.674:)sriap2(MRM+foCIX 0.0 cps.
0.05 0.10 0. 15 0.20 0.25 0.30 0.35 0.40Time
0.0
2.0
4.0
6.0
8.0
10.0
12.0
14.0
16.0
18.0
20.0
Inte
nsity
, cps
03.012.0 0.27
53.042.0
0.34 93.032.0 0. 25
standa
1icbt
Fig. 4. Plasma zero concentration of
05% for both matrices. The measurements accuracy and precision
n both within- and between-run were studied by running 6 repli-ates from each QC level (LLOQ, low, mid and high) in the analyticalatch for loperamide during three successive days. In Tables 1 and 2,he analytical signal for all replicates from each concentration was21181noitadilavfo)1C(4elpmaSmorfedimarepoL_6D:DIaD003.272/811.384:)sriap2(MRM+foCIX
0.05 0.10 0. 15 0.20Time
0.0
5000 .0
1.0e4
1.5e4
2.0e4
2.5e4
3.0e4
3.5e4
Inte
nsity
, cps
:emaNstluseR3102,30lirpA,yadsendeW:etaDgnitnirP :emaNstluseR3102,30lirpA,yadsendeW:etaDgnitnirP :emaNstluseR3102,30lirpA,yadsendeW:etaDgnitnirP
.21021181noitadilavfo)1C(4elpmaSmorfedimarepoL:DIaD002.662/149.674:)sriap2(MRM+foCIX
0.05 0.10 0.15 0.20Time
0
50
100
150
200
250
300
350
400427
Inte
nsity
, cps
:emaNstluseR3102,30lirpA,yadsendeW:etaDgnitnirP :emaNstluseR3102,30lirpA,yadsendeW:etaDgnitnirP :emaNstluseR3102,30lirpA,yadsendeW:etaDgnitnirP
Fig. 5. LLOQ chromatogram
, min
rd calibration curve chromatogram.
measured for each plasma and saliva respectively, and concentra-
tions were back-calculated by employing the regression equationestablished on each corresponding day. The accuracy and preces-sion values for LLOQ were considered as indicators for sensitivityof the method..xaM)yarpSobruT(ffiw.210 3.6e4 cps.
0.25 0.30 0.35 0.40, min
0.28
0023-ipa:rotarepOA/N 0023-ipa:rotarepOA/N 0023-ipa:rotarepOA/N
624.xaM)yarpSobruT(ffiw .7 cps.
0.25 0.30 0.35 0.40, min
0.28
0023-ipa:rotarepOA/N 0023-ipa:rotarepOA/N 0023-ipa:rotarepOA/N
(20 pg/ml in plasma).
86 T. Arafat et al. / J. Chromatogr. B 972 (2014) 81–88
XIC of +MRM (2 pair s): 483 .118 /27 2.300 Da ID: D6_L oper amide f rom Sa mple 2 (Bla nk) of ISR Sa mples 12 12 2012 .wiff (Turbo Sp ray) Max. 33 .3 c ps.
0.05 0.10 0.15 0.20 0.25 0.30 0.35 0.40 0.45Time, min
0
5
10
15
20
25
30
33
Inte
nsity
, cps
03.061.0
83.052.0
0.29 0.340.220.13
.xaM)yarpSobruT(ffiw.21022121selpmaSRSIfo)knalB(2elpmaSmorfedimarepoL:DIaD002.662/149.674:)sriap2(MRM+foCIX 13 .3 cps.
0.05 0.10 0.15 0.20 0.25 0.30 0.35 0.40 0.45Time, min
0.0
2.0
4.0
6.0
8.0
10.0
12.0
13.3
Inte
nsity
, cps
0.13 0.340.23
0.19 0.220.17 03.092.082.051.0 0.32 63.053.052.0 0.39
Fig. 6. Saliva blank chromatogram, taken from participant volunteer in this study before dosing.
c4e2.1.xaM)yarpSobruT(ffiw.atadavilasfo)5.5(68elpmaSmorfedimarepoL_6D:DIaD003.272/811.384:)sriap2(MRM+foCIX ps.
0.05 0.10 0.15 0.20 0.25 0.30 0.35 0.40 0.45Time, min
0.00
2000 .00
4000 .00
6000 .00
8000 .00
1.00e4
1.16e4
Inte
nsity
, cps
0.28
XIC of +MRM (2 pa irs): 47 6.941/26 6.200 Da ID: Lope ramide from Sample 86 (5.5) of sali va da ta.wiff (Turbo Spray) Max. 724 6.7 cps.
0.05 0.10 0.15 0.20 0.25 0.30 0.35 0.40 0.45Time, min
0
1000
2000
3000
4000
5000
6000
7000
Inte
nsity
, cps
0.29
Fig. 7. Saliva chromatogram taken from participant volunteer in this study, and its measurement was 1980 pg/ml following oral administration of 8 mg loperamide, at 6.00 h.
Table 1Within- and between-run precision and accuracy of loperamide in human plasma QC samples.
Nominal concentration(pg/ml)
Within-run (n = 6) Between-run (n = 18)
Measuredconcentration(pg/ml)
Precision (RSD %) Accuracy (%) Measuredconcentration(pg/ml)
Precision (RSD %) Accuracy (%)
20 18.83 7.82 94.17 20.94 8.73 104.7260 58.67 4.27 97.78 59.67 6.04 99.45
1500 1507.00 1.34 100.47 1473.67 4.04 98.242400 2437.00 3.60 101.54 2444.11 1.60 101.84

T. Arafat et al. / J. Chromatogr. B 972 (2014) 81–88 87
Table 2Within- and between-run precision and accuracy of loperamide in human saliva QC samples.
Nominalconcentration
Within-run (n = 6) Between-run (n = 18)
Measuredconcentration(pg/ml)
Precision (RSD %) Accuracy (%) Measuredconcentration(pg/ml)
Precision (RSD %) Accuracy (%)
20 19.32 10.53 96.60 20.12 11.35 100.6060 57.66 7.02 96.10 59.54 6.78 99.23
1500 1488.21 2.08 99.21 1474.11 4.56 98.272400 2528.56 2.16 105.36 2496.05 3.53 104.00
Table 3Matrix effects in human plasma and saliva represented as MF for loperamide and normalized MF for IS.
Plasma Saliva
MF IS-normalized MF MF IS-normalized MF
QC low QC high QC low QC high QC low QC high QC low QC high
Source(1) 1.0696 1.0300 1.1222 1.0970 0.998 1.033 1.055 1.028Source(2) 0.8897 1.0231 0.9961 1.0938 1.015 0.976 0.988 0.993Source(3) 1.0070 1.3461 1.1221 1.1896 0.987 1.013 1.066 1.022Source(4) 1.0477 1.4116 1.2284 1.1925 1.026 1.028 1.062 1.032Source(5) 1.0398 1.1664 1.1487 1.2005 1.086 1.097 1.088 1.091Source(6) 1.1332 1.1638 1.2465 1.1907 0.954 0.998 0.914 0.955
Mean 1.0312 1.1902 1.1440 1.1607 1.0110 1.0242 1.0288 1.0202STDEV 0.0810 0.1601 0.0900 0.0507 0.0444 0.0413 0.0656 0.0452CV% 7.85 13.45 7.87 4.37 4.39 4.03 6.38 4.43
Table 4Stability of long term, autosampler and Three-thaw cycles for loperamide in human plasma.
Specified concentration(pg/ml)
Storage at −40 ◦C for 6 months Autosampler 4 ◦C for 48 h Three-thaw 5-cycles
Measuredconcentration(pg/ml)
Accuracy (%) Measuredconcentration(pg/ml)
Accuracy (%) Measuredconcentration(pg/ml)
Accuracy (%)
102.60 62.35 103.91.25 102.84 2521.11 105.04
3
sapmlfmmlf
3
pfr
4
tAi
Table 5Pharmacokinetic parameters of loperamide 8 mg for 26 subjects in plasma and 6subjects in saliva.
Parameter In plasma (mean ± SD) In saliva (mean ± SD)
Cmax (ng/ml) 2.15 ± 0.58 2.06 ± 0.633AUC0–72 (ng h/ml) 39.55 ± 17.75 27.25 ± 8.32AUC0–∞ (ng h/ml) 44.67 ± 21.63 30.26 ± 13.23Tmax (h) 3.98 ± 1.92 6 ± 0.61T1/2 (h) 21.39 ± 4.21 20.87 ± 4.63Vd (l) 7296.43 42653.20Cl (l/h) 236.42 328.16
Cmax: maximum plasma concentration; AUC0–72: area under the curve from 0 to 72 h;AUC0–∞: area under the curve extrapolated to infinity; Tmax: time to reach maximum
60 56.85 94.75 61.562400 2424.35 101.01 2468
.5. Specificity, recovery and matrix effect
The protein direct precipitation procedure was specified andensitive enough for loperamide determination, where both blanknd zero samples that were examined from six deferent lots oflasma attained the required clean chromatogram for specificethod. From recovery test, the extraction procedure for the ana-
ytes has given a maximum possible extraction efficiency valuesrom their biological matrix, and it was around 96 ± 5% from both
atrices. And the biological matrix effected on the analytes by ainimum or null factor, indicated in Table 3 as calculated MF for
operamide and normalized MF for loperamide-d6, by testing 6 lots,rom both plasma and saliva.
.6. Stability
The spiked plasma and stock solutions kept under room tem-erature on bench top were stable for 20 h. Table 4 illustratesreeze–thaw cycles, auto-sampler and long term stability testesults with their storage condition.
. Clinical study applications
After oral administration of quartet dose of Imodium® 2 mgablet (2 mg × 4 = 8 mg), the pharmacokinetic parameters Cmax,UC0–72 and AUC0–∞, Tmax, T1/2, Vd and Cl were calculated
n plasma for 26 subjects and correlated in Table 5 to same
plasma concentration; T1/2: elimination half-life; Vd: volume of distribution; Cl:drug clearance; SD: standard deviation.
parameters in saliva for 6 from participant volunteers. Themean concentration–time profile of 26 subjects for loperamidein plasma is presented in Fig. 8 and correlated to the meanconcentration–time profile of 6 subjects for loperamide in saliva.
It is obvious by direct inspection from Fig. 8 and in spite of6 out of 26 volunteers participating in saliva experiment, theconcentration–time profile was indicative enough and representsthat Cmax and T1/2 were identical, but values of AUC0–72 and AUC0–∞were lower in saliva by 30% from plasma. Based on the findings,
the loperamide levels in saliva may have potential use in bio-equivalence as alternative to plasma [25], and correlation of drugplasma levels vs. saliva levels in human body is very important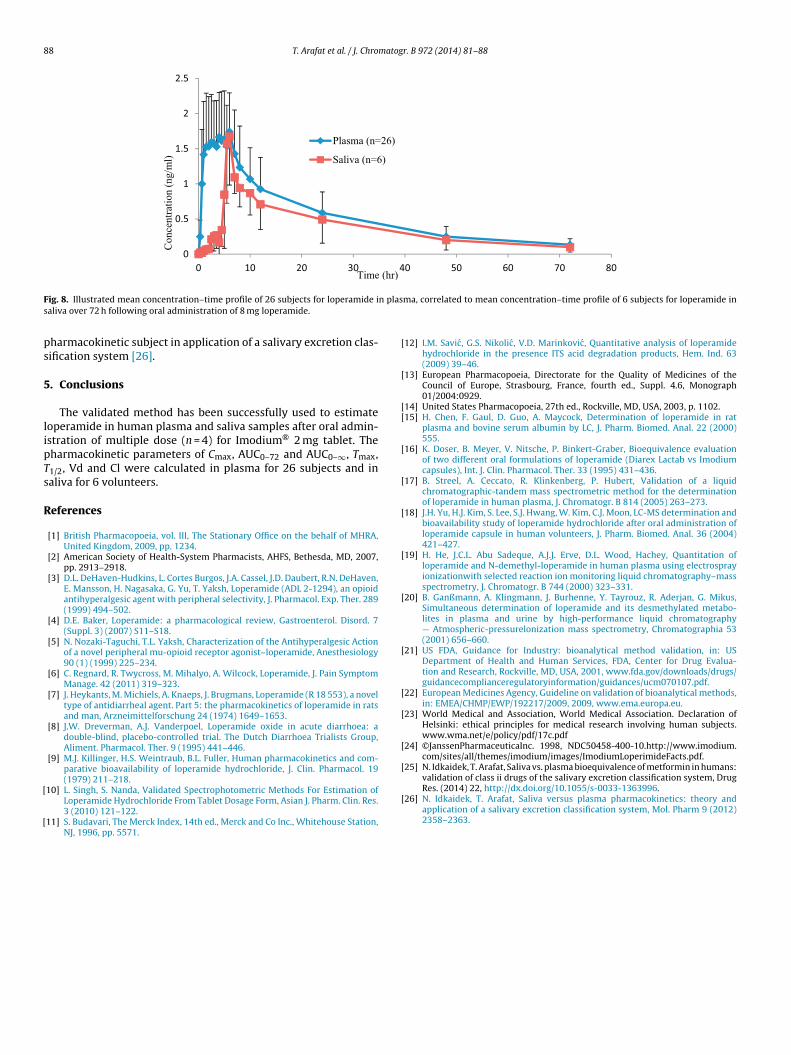
88 T. Arafat et al. / J. Chromatogr. B 972 (2014) 81–88
0
0.5
1
1.5
2
2.5
0 10 20 30 40 50 60 70 80
Pla sma (n=26)
Sali va (n= 6)
Time (hr)
Con
cent
ratio
n (n
g/m
l)
F n plass
ps
5
lipTs
R
[
[
[
[
[[
[
[
[
[
[
[
[
[
[
[validation of class ii drugs of the salivary excretion classification system, Drug
ig. 8. Illustrated mean concentration–time profile of 26 subjects for loperamide ialiva over 72 h following oral administration of 8 mg loperamide.
harmacokinetic subject in application of a salivary excretion clas-ification system [26].
. Conclusions
The validated method has been successfully used to estimateoperamide in human plasma and saliva samples after oral admin-stration of multiple dose (n = 4) for Imodium® 2 mg tablet. Theharmacokinetic parameters of Cmax, AUC0–72 and AUC0–∞, Tmax,1/2, Vd and Cl were calculated in plasma for 26 subjects and inaliva for 6 volunteers.
eferences
[1] British Pharmacopoeia, vol. III, The Stationary Office on the behalf of MHRA,United Kingdom, 2009, pp. 1234.
[2] American Society of Health-System Pharmacists, AHFS, Bethesda, MD, 2007,pp. 2913–2918.
[3] D.L. DeHaven-Hudkins, L. Cortes Burgos, J.A. Cassel, J.D. Daubert, R.N. DeHaven,E. Mansson, H. Nagasaka, G. Yu, T. Yaksh, Loperamide (ADL 2-1294), an opioidantihyperalgesic agent with peripheral selectivity, J. Pharmacol. Exp. Ther. 289(1999) 494–502.
[4] D.E. Baker, Loperamide: a pharmacological review, Gastroenterol. Disord. 7(Suppl. 3) (2007) S11–S18.
[5] N. Nozaki-Taguchi, T.L. Yaksh, Characterization of the Antihyperalgesic Actionof a novel peripheral mu-opioid receptor agonist–loperamide, Anesthesiology90 (1) (1999) 225–234.
[6] C. Regnard, R. Twycross, M. Mihalyo, A. Wilcock, Loperamide, J. Pain SymptomManage. 42 (2011) 319–323.
[7] J. Heykants, M. Michiels, A. Knaeps, J. Brugmans, Loperamide (R 18 553), a noveltype of antidiarrheal agent. Part 5: the pharmacokinetics of loperamide in ratsand man, Arzneimittelforschung 24 (1974) 1649–1653.
[8] J.W. Dreverman, A.J. Vanderpoel, Loperamide oxide in acute diarrhoea: adouble-blind, placebo-controlled trial. The Dutch Diarrhoea Trialists Group,Aliment. Pharmacol. Ther. 9 (1995) 441–446.
[9] M.J. Killinger, H.S. Weintraub, B.L. Fuller, Human pharmacokinetics and com-parative bioavailability of loperamide hydrochloride, J. Clin. Pharmacol. 19(1979) 211–218.
10] L. Singh, S. Nanda, Validated Spectrophotometric Methods For Estimation ofLoperamide Hydrochloride From Tablet Dosage Form, Asian J. Pharm. Clin. Res.3 (2010) 121–122.
11] S. Budavari, The Merck Index, 14th ed., Merck and Co Inc., Whitehouse Station,NJ, 1996, pp. 5571.
[
ma, correlated to mean concentration–time profile of 6 subjects for loperamide in
12] I.M. Savic, G.S. Nikolic, V.D. Marinkovic, Quantitative analysis of loperamidehydrochloride in the presence ITS acid degradation products, Hem. Ind. 63(2009) 39–46.
13] European Pharmacopoeia, Directorate for the Quality of Medicines of theCouncil of Europe, Strasbourg, France, fourth ed., Suppl. 4.6, Monograph01/2004:0929.
14] United States Pharmacopoeia, 27th ed., Rockville, MD, USA, 2003, p. 1102.15] H. Chen, F. Gaul, D. Guo, A. Maycock, Determination of loperamide in rat
plasma and bovine serum albumin by LC, J. Pharm. Biomed. Anal. 22 (2000)555.
16] K. Doser, B. Meyer, V. Nitsche, P. Binkert-Graber, Bioequivalence evaluationof two different oral formulations of loperamide (Diarex Lactab vs Imodiumcapsules), Int. J. Clin. Pharmacol. Ther. 33 (1995) 431–436.
17] B. Streel, A. Ceccato, R. Klinkenberg, P. Hubert, Validation of a liquidchromatographic-tandem mass spectrometric method for the determinationof loperamide in human plasma, J. Chromatogr. B 814 (2005) 263–273.
18] J.H. Yu, H.J. Kim, S. Lee, S.J. Hwang, W. Kim, C.J. Moon, LC-MS determination andbioavailability study of loperamide hydrochloride after oral administration ofloperamide capsule in human volunteers, J. Pharm. Biomed. Anal. 36 (2004)421–427.
19] H. He, J.C.L. Abu Sadeque, A.J.J. Erve, D.L. Wood, Hachey, Quantitation ofloperamide and N-demethyl-loperamide in human plasma using electrosprayionizationwith selected reaction ion monitoring liquid chromatography–massspectrometry, J. Chromatogr. B 744 (2000) 323–331.
20] B. Ganßmann, A. Klingmann, J. Burhenne, Y. Tayrouz, R. Aderjan, G. Mikus,Simultaneous determination of loperamide and its desmethylated metabo-lites in plasma and urine by high-performance liquid chromatography— Atmospheric-pressurelonization mass spectrometry, Chromatographia 53(2001) 656–660.
21] US FDA, Guidance for Industry: bioanalytical method validation, in: USDepartment of Health and Human Services, FDA, Center for Drug Evalua-tion and Research, Rockville, MD, USA, 2001, www.fda.gov/downloads/drugs/guidancecomplianceregulatoryinformation/guidances/ucm070107.pdf.
22] European Medicines Agency, Guideline on validation of bioanalytical methods,in: EMEA/CHMP/EWP/192217/2009, 2009, www.ema.europa.eu.
23] World Medical and Association, World Medical Association. Declaration ofHelsinki: ethical principles for medical research involving human subjects.www.wma.net/e/policy/pdf/17c.pdf
24] ©JanssenPharmaceuticaInc. 1998, NDC50458-400-10.http://www.imodium.com/sites/all/themes/imodium/images/ImodiumLoperimideFacts.pdf.
25] N. Idkaidek, T. Arafat, Saliva vs. plasma bioequivalence of metformin in humans:
Res. (2014) 22, http://dx.doi.org/10.1055/s-0033-1363996.26] N. Idkaidek, T. Arafat, Saliva versus plasma pharmacokinetics: theory and
application of a salivary excretion classification system, Mol. Pharm 9 (2012)2358–2363.