DETERMINATION OF AN OPTIMAL FLEET FOR A CNG …
23
Brodogradnja/Shipbuilding/Open access Volume 70 Number 3, 2019. 1 Francesco Mauro Luca Braidotti Giorgio Trincas http://dx.doi.org/10.21278/brod70301 ISSN 0007-215X eISSN 1845-5859 DETERMINATION OF AN OPTIMAL FLEET FOR A CNG TRANSPORTATION SCENARIO IN THE MEDITERRANEAN SEA UDC 629.5(05): 629.56: 629.5.545: 629.5.01 Original scientific paper Summary For the natural gas transportation, several technologies can be applied, having different effectiveness and costs depending on the analysed case. The Mediterranean Sea is presenting a typical scenario where compressed natural gas (CNG) transportation is particularly attractive compared to liquefied natural gas (LNG) and pipelines, not only for stranded gas shipping but also for transportations cases where CNG is usually representing the most economically convenient solution. Approaching the design of a CNG ship is not an easy task, since the pressure vessel (PV) technology is strongly influencing the ship layout and hull form. Here an enhanced conceptual design method is adopted; taking into account the economic-financial issues together with logistics, in order to determine the best fleet composition selecting the best ships for the selected scenario. The ships composing the fleet are supposed to load/offload the natural gas on buoys; hence, dynamic positioning (DP) will also be considered as an attribute in the evaluation of alternative designs. As final outcome of the enhanced concept design process it will be possible to speed up drawing of the preliminary lines plan and general arrangement plan of the sister ships composing the fleet. Key words: CNG transportation; Conceptual design; Optimal fleet composition; Dynamic positioning; Shipping tariff 1. Introduction Nowadays hydrocarbons are still the main source for energy production around the world, covering almost the 80% of the total energy production [1]. Natural gas, among all available hydrocarbons, is for sure the most environmental friendly solution for energy production and it is believed that it will be continuously more employed for production with an estimated annual rate of 2.2% from 2015 to 2050. Already in 2025, the natural gas production will grow up to 151 trillion cubic feet (tcf), being almost 70% higher than global production in 2001 [2]. The growing necessity to access the gas resources requires more flexibility for the exploitation of the considered resource [3]. In particular, especially for maritime countries, this flexibility implies to dedicate particular effort also on the gas transportation from off-shore fields to on- shore installations [4]. Several technologies can be adopted for natural gas marine transportation. Present means of transporting natural gas to the markets consists primarily of
Transcript of DETERMINATION OF AN OPTIMAL FLEET FOR A CNG …
Brodogradnja/Shipbuilding/Open access Volume 70 Number 3, 2019.
1
Francesco Mauro
Luca Braidotti
Giorgio Trincas
http://dx.doi.org/10.21278/brod70301 ISSN 0007-215X
eISSN 1845-5859
DETERMINATION OF AN OPTIMAL FLEET FOR A CNG
TRANSPORTATION SCENARIO IN THE MEDITERRANEAN SEA
UDC 629.5(05): 629.56: 629.5.545: 629.5.01
Original scientific paper
Summary
For the natural gas transportation, several technologies can be applied, having different
effectiveness and costs depending on the analysed case. The Mediterranean Sea is presenting a
typical scenario where compressed natural gas (CNG) transportation is particularly attractive
compared to liquefied natural gas (LNG) and pipelines, not only for stranded gas shipping but
also for transportations cases where CNG is usually representing the most economically
convenient solution. Approaching the design of a CNG ship is not an easy task, since the
pressure vessel (PV) technology is strongly influencing the ship layout and hull form. Here an
enhanced conceptual design method is adopted; taking into account the economic-financial
issues together with logistics, in order to determine the best fleet composition selecting the best
ships for the selected scenario. The ships composing the fleet are supposed to load/offload the
natural gas on buoys; hence, dynamic positioning (DP) will also be considered as an attribute
in the evaluation of alternative designs. As final outcome of the enhanced concept design
process it will be possible to speed up drawing of the preliminary lines plan and general
arrangement plan of the sister ships composing the fleet.
Key words: CNG transportation; Conceptual design; Optimal fleet composition;
Dynamic positioning; Shipping tariff
1. Introduction
Nowadays hydrocarbons are still the main source for energy production around the world,
covering almost the 80% of the total energy production [1]. Natural gas, among all available
hydrocarbons, is for sure the most environmental friendly solution for energy production and it
is believed that it will be continuously more employed for production with an estimated annual
rate of 2.2% from 2015 to 2050. Already in 2025, the natural gas production will grow up to
151 trillion cubic feet (tcf), being almost 70% higher than global production in 2001 [2]. The
growing necessity to access the gas resources requires more flexibility for the exploitation of
the considered resource [3]. In particular, especially for maritime countries, this flexibility
implies to dedicate particular effort also on the gas transportation from off-shore fields to on-
shore installations [4]. Several technologies can be adopted for natural gas marine
transportation. Present means of transporting natural gas to the markets consists primarily of

Francesco Mauro, Braidotti Luca, Determination of an Optimal Fleet for a CNG
Giorgio Trincas Transportation Scenario in the Mediterranean Sea
2
pipelines and liquefied natural gas (LNG), the former accounting for 71% of all internationally
traded gas volumes with the latter making for the rest.
Pipelines are usually the most efficient way to supply natural gas to a final on-shore user.
However, its adoption for offshore purposes is limited by the huge installation costs and durable
investments, making the offshore pipelines costs up to ten times higher than on-shore ones. The
final costs are then influenced by the distance between the gas source and the end user, the
water depth and the seabed orography. On the contrary, whichever marine gas transportation
mode avoids these kind of restrictions, removing the physical tie between producer and buyer,
resulting in a more flexible solution even for the spot market [5].
However, due to the continuous research on the pressure vessels (PV) materials [6], the
compressed natural gas (CNG) transport is starting to be really attractive [7,8] and economically
competitive also on medium-long distances and large gas volumes, where, traditionally, LNG
has always been the most economical solution. CNG is also attractive because of the absence
of costly infrastructure facilities such as liquefaction and regasification plants. In fact, in terms
of infrastructures, a CNG supply chain only requires submerged turret loading (STL) systems
and single point mooring (SPM) discharging systems, which are less expensive than LNG
facilities. For such a reason, being CNG competitive also for stranded gas transportation, it can
be stated that, in the near future, CNG technology will be the most flexible solution for natural
gas transportation.
Marine CNG might be studied as ideal solution for gas trading in several areas around the
globe [9,10], where trade links are all within a transport range from 800 up to 2500 nm, which
can be considered as the economic competitive range for fleets composed by CNG ships
[11,12]. Then, to efficiently minimise the shipping tariff for the specific trade scenario, the
definition and selection of an optimal fleet for CNG transportation becomes of primary
importance [13,14,15]. An alternative approach was proposed [16], where the best CNG ships
of different size and hull form characteristics can be identified, and then, according to the
specific boundaries and constraints, the best solution is identified in terms of economic
effectiveness.
Whatever approach is used to handle the CNG marine transportation, the success of the
gas value chain is given by the adoption of a feasible and sufficiently accurate concept design
process. It is well known that most of the total ship lifetime cost is driven by the decisions taken
in the concept design phase [17]. Therefore, putting even more effort in this phase will be
extremely favourable for the final economic effectiveness of the gas transportation. For this
purpose, an enhanced concept design process [18] is adopted throughout this work, to study the
optimal fleet composition for CNG transportation. In the specific case of a CNG ship [19], this
kind of approach is mandatory since, due to the continuous developments in the storage
technologies and pressure vessels’ materials (see Table 1), there is the necessity to design never-
built ships, without having any comparable reference.
By means of an accurate concept design, different concurrent solutions for several
subsystems can be easily compared [20], identifying the most competitive one.
Table 1 Pressure vessels types and characteristics
PV (250 bar) DPV (m) WPV (t/m) Material
Type I 1.00 0.86 Full steel
Type II 0.95 0.71 Full steel
Type III 2.35 0.81 Steel liner wrapped with composites
Type IV 2.34 0.72 Full composites
Determination of an Optimal Fleet for a CNG Francesco Mauro, Braidotti Luca,
Transportation Scenario in the Mediterranean Sea Giorgio Trincas
3
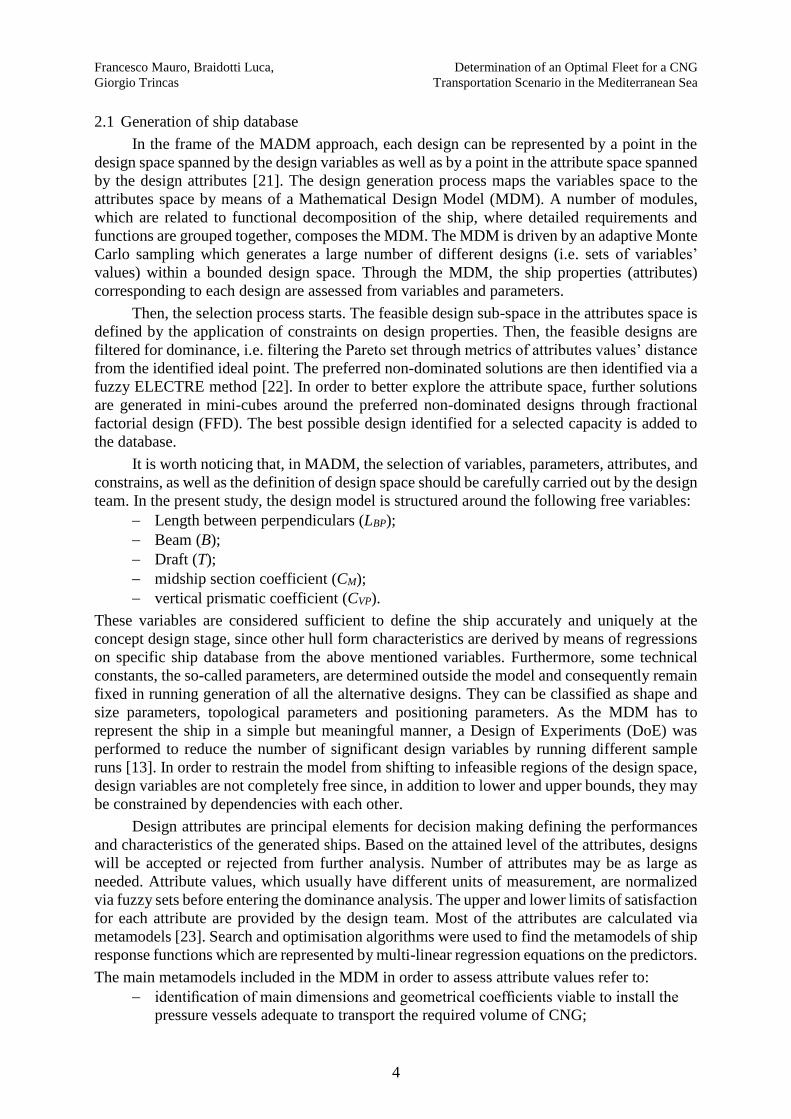
Fig. 1 Enhanced concept design methodology applied to CNG ships fleets.
Here, a possible scenario of natural gas transportation in the Mediterranean Sea is
presented, assuming an economic/financial scenario referred to the gas shipping between Zohr
field (Egypt) and Brindisi (Southern Italy) with Type III PVs. Since the ships’ loading phase is
performed through an STL system, also dynamic positioning (DP) has been considered during
the concept design phase, evaluating the station-keeping ability in specific conditions and using
it as a constraint in the selection procedure.
2. Design Methodology
With the aim of selecting the “best possible” fleet capable to transport gas in a given
operative scenario, the Multiple Attribute Decision Making (MADM) approach has been
adopted as concept design methodology of CNG ships. With this approach, a huge number of
different concept solutions can be generated and then the “best possible” concept design is
selected through a dedicated evaluation process. The outcome of the process has a strong
connection to the operative scenario and can be assumed as basis for the next design phases.
In the present study, MADM has been used to build two databases of “best possible”
CNG ships characterized by different gas capacities (from 50 to 900 mmsfc, in steps of 50
mmsfc) and different propulsion system. Type III PVs of 2.35 m diameter at 250 bar have been
chosen as gas containment system for all the ships. Then, in the so called external task, the best
fleet composition is assessed in order to minimise the gas shipping tariff. Concurrently, the
corresponding number of sister ships, their capacity and service speed are determined according
to logistics constraints. Furthermore, the internal cargo layout is perfected by defining the
sectional area curve at both design draught and tank-top height. With this approach, the number
and length of pressure vessels are more accurately assessed and a concept lines plan and general
arrangement are generated [18] in order to speed up the transition to preliminary design. The
whole concept design process is provided in Figure 1.
Francesco Mauro, Braidotti Luca, Determination of an Optimal Fleet for a CNG
Giorgio Trincas Transportation Scenario in the Mediterranean Sea
4
2.1 Generation of ship database
In the frame of the MADM approach, each design can be represented by a point in the
design space spanned by the design variables as well as by a point in the attribute space spanned
by the design attributes [21]. The design generation process maps the variables space to the
attributes space by means of a Mathematical Design Model (MDM). A number of modules,
which are related to functional decomposition of the ship, where detailed requirements and
functions are grouped together, composes the MDM. The MDM is driven by an adaptive Monte
Carlo sampling which generates a large number of different designs (i.e. sets of variables’
values) within a bounded design space. Through the MDM, the ship properties (attributes)
corresponding to each design are assessed from variables and parameters.
Then, the selection process starts. The feasible design sub-space in the attributes space is
defined by the application of constraints on design properties. Then, the feasible designs are
filtered for dominance, i.e. filtering the Pareto set through metrics of attributes values’ distance
from the identified ideal point. The preferred non-dominated solutions are then identified via a
fuzzy ELECTRE method [22]. In order to better explore the attribute space, further solutions
are generated in mini-cubes around the preferred non-dominated designs through fractional
factorial design (FFD). The best possible design identified for a selected capacity is added to
the database.
It is worth noticing that, in MADM, the selection of variables, parameters, attributes, and
constrains, as well as the definition of design space should be carefully carried out by the design
team. In the present study, the design model is structured around the following free variables:
Length between perpendiculars (LBP);
Beam (B);
Draft (T);
midship section coefficient (CM);
vertical prismatic coefficient (CVP).
These variables are considered sufficient to define the ship accurately and uniquely at the
concept design stage, since other hull form characteristics are derived by means of regressions
on specific ship database from the above mentioned variables. Furthermore, some technical
constants, the so-called parameters, are determined outside the model and consequently remain
fixed in running generation of all the alternative designs. They can be classified as shape and
size parameters, topological parameters and positioning parameters. As the MDM has to
represent the ship in a simple but meaningful manner, a Design of Experiments (DoE) was
performed to reduce the number of significant design variables by running different sample
runs [13]. In order to restrain the model from shifting to infeasible regions of the design space,
design variables are not completely free since, in addition to lower and upper bounds, they may
be constrained by dependencies with each other.
Design attributes are principal elements for decision making defining the performances
and characteristics of the generated ships. Based on the attained level of the attributes, designs
will be accepted or rejected from further analysis. Number of attributes may be as large as
needed. Attribute values, which usually have different units of measurement, are normalized
via fuzzy sets before entering the dominance analysis. The upper and lower limits of satisfaction
for each attribute are provided by the design team. Most of the attributes are calculated via
metamodels [23]. Search and optimisation algorithms were used to find the metamodels of ship
response functions which are represented by multi-linear regression equations on the predictors.
The main metamodels included in the MDM in order to assess attribute values refer to:
identification of main dimensions and geometrical coefficients viable to install the
pressure vessels adequate to transport the required volume of CNG;
Determination of an Optimal Fleet for a CNG Francesco Mauro, Braidotti Luca,
Transportation Scenario in the Mediterranean Sea Giorgio Trincas
5
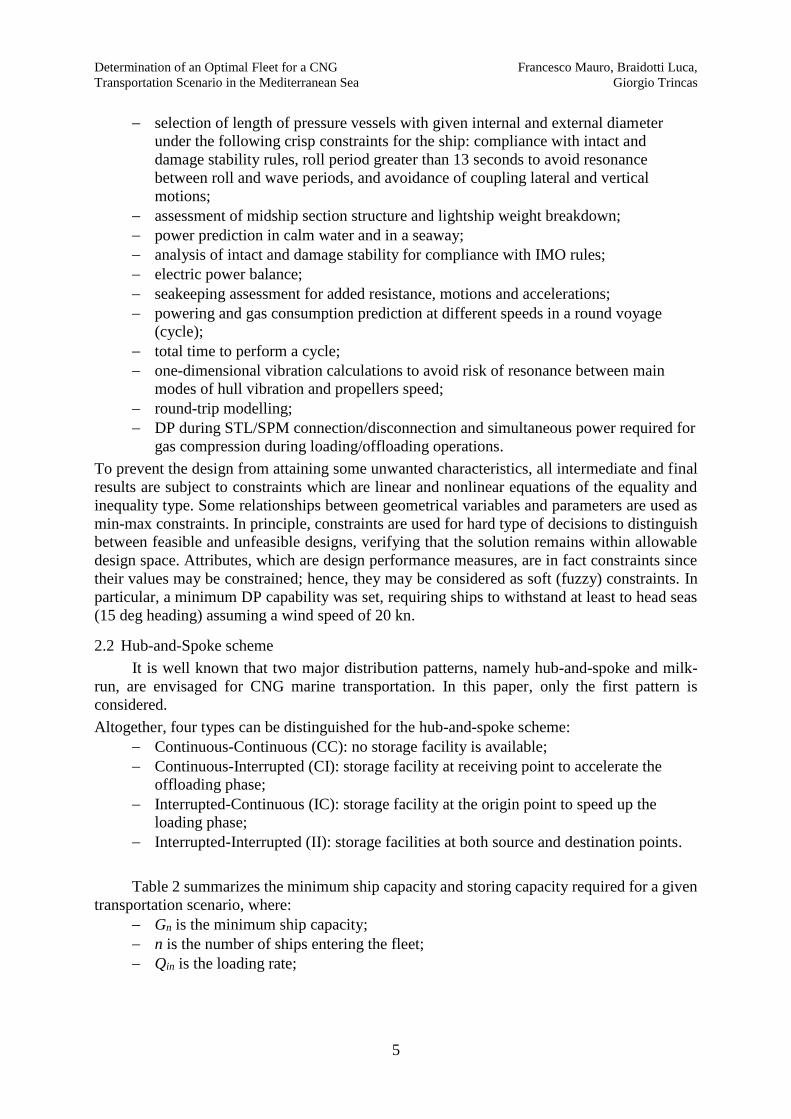
selection of length of pressure vessels with given internal and external diameter
under the following crisp constraints for the ship: compliance with intact and
damage stability rules, roll period greater than 13 seconds to avoid resonance
between roll and wave periods, and avoidance of coupling lateral and vertical
motions;
assessment of midship section structure and lightship weight breakdown;
power prediction in calm water and in a seaway;
analysis of intact and damage stability for compliance with IMO rules;
electric power balance;
seakeeping assessment for added resistance, motions and accelerations;
powering and gas consumption prediction at different speeds in a round voyage
(cycle);
total time to perform a cycle;
one-dimensional vibration calculations to avoid risk of resonance between main
modes of hull vibration and propellers speed;
round-trip modelling;
DP during STL/SPM connection/disconnection and simultaneous power required for
gas compression during loading/offloading operations.
To prevent the design from attaining some unwanted characteristics, all intermediate and final
results are subject to constraints which are linear and nonlinear equations of the equality and
inequality type. Some relationships between geometrical variables and parameters are used as
min-max constraints. In principle, constraints are used for hard type of decisions to distinguish
between feasible and unfeasible designs, verifying that the solution remains within allowable
design space. Attributes, which are design performance measures, are in fact constraints since
their values may be constrained; hence, they may be considered as soft (fuzzy) constraints. In
particular, a minimum DP capability was set, requiring ships to withstand at least to head seas
(15 deg heading) assuming a wind speed of 20 kn.
2.2 Hub-and-Spoke scheme
It is well known that two major distribution patterns, namely hub-and-spoke and milk-
run, are envisaged for CNG marine transportation. In this paper, only the first pattern is
considered.
Altogether, four types can be distinguished for the hub-and-spoke scheme:
Continuous-Continuous (CC): no storage facility is available;
Continuous-Interrupted (CI): storage facility at receiving point to accelerate the
offloading phase;
Interrupted-Continuous (IC): storage facility at the origin point to speed up the
loading phase;
Interrupted-Interrupted (II): storage facilities at both source and destination points.
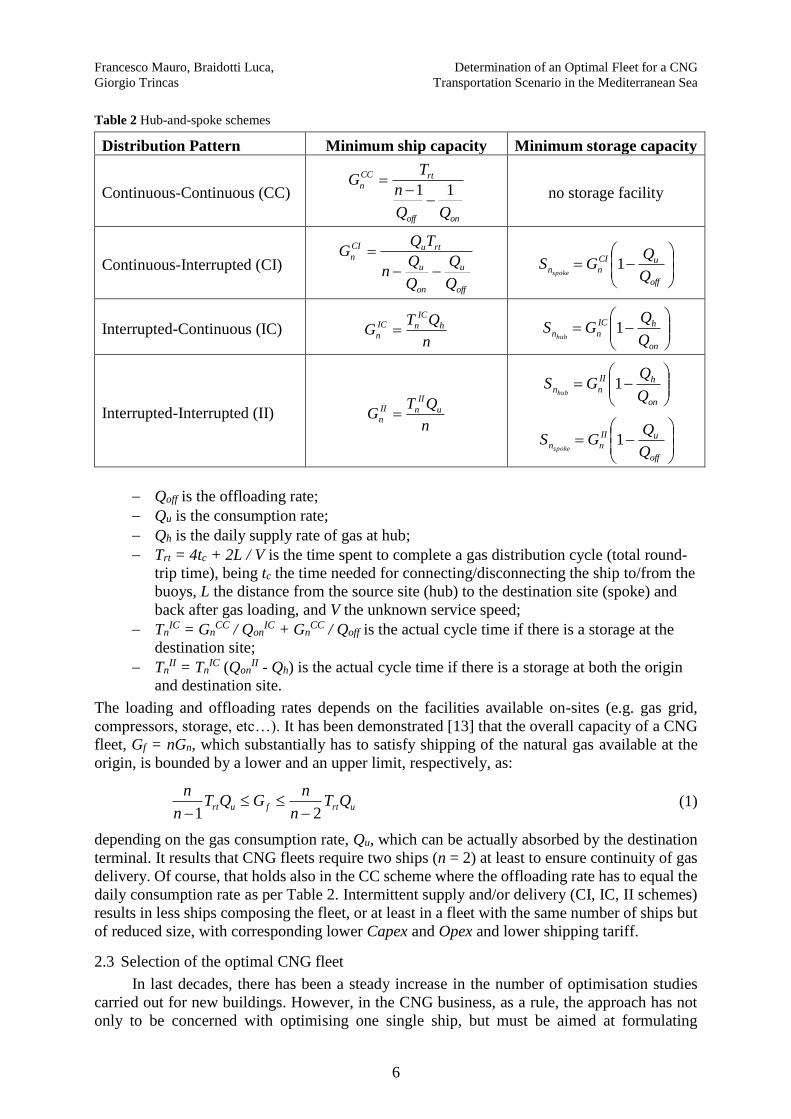
Table 2 summarizes the minimum ship capacity and storing capacity required for a given
transportation scenario, where:
Gn is the minimum ship capacity;
n is the number of ships entering the fleet;
Qin is the loading rate;
Francesco Mauro, Braidotti Luca, Determination of an Optimal Fleet for a CNG
Giorgio Trincas Transportation Scenario in the Mediterranean Sea
6
Table 2 Hub-and-spoke schemes
Distribution Pattern Minimum ship capacity Minimum storage capacity
Continuous-Continuous (CC)
onoff
rtCC
n
n
TG
11
no storage facility
Continuous-Interrupted (CI)
off
u
on
u
rtuCI
n
Q
Q
Q
Qn
TQG
off
uCI
nnQ
QGS
spoke1
Interrupted-Continuous (IC) n
QTG h
IC
nIC
n
on
hIC
nnQ
QGS
hub1
Interrupted-Interrupted (II) n
QTG u
II
nII
n
on
hII
nnQ
QGS
hub1
off
uII
nnQ
QGS
spoke1
Qoff is the offloading rate;
Qu is the consumption rate;
Qh is the daily supply rate of gas at hub;
Trt = 4tc + 2L / V is the time spent to complete a gas distribution cycle (total round-
trip time), being tc the time needed for connecting/disconnecting the ship to/from the
buoys, L the distance from the source site (hub) to the destination site (spoke) and
back after gas loading, and V the unknown service speed;
TnIC = Gn
CC / QonIC + Gn
CC / Qoff is the actual cycle time if there is a storage at the
destination site;
TnII = Tn
IC (QonII - Qh) is the actual cycle time if there is a storage at both the origin
and destination site.
The loading and offloading rates depends on the facilities available on-sites (e.g. gas grid,
compressors, storage, etc…). It has been demonstrated [13] that the overall capacity of a CNG
fleet, Gf = nGn, which substantially has to satisfy shipping of the natural gas available at the
origin, is bounded by a lower and an upper limit, respectively, as:
urtfurt QTn
nGQT
n
n
21
(1)
depending on the gas consumption rate, Qu, which can be actually absorbed by the destination
terminal. It results that CNG fleets require two ships (n = 2) at least to ensure continuity of gas
delivery. Of course, that holds also in the CC scheme where the offloading rate has to equal the
daily consumption rate as per Table 2. Intermittent supply and/or delivery (CI, IC, II schemes)
results in less ships composing the fleet, or at least in a fleet with the same number of ships but
of reduced size, with corresponding lower Capex and Opex and lower shipping tariff.
2.3 Selection of the optimal CNG fleet
In last decades, there has been a steady increase in the number of optimisation studies
carried out for new buildings. However, in the CNG business, as a rule, the approach has not
only to be concerned with optimising one single ship, but must be aimed at formulating
Determination of an Optimal Fleet for a CNG Francesco Mauro, Braidotti Luca,
Transportation Scenario in the Mediterranean Sea Giorgio Trincas
7
optimum fleet for a particular transport of natural gas. Different feasible fleets may well have
the same annual cargo capacity, while being made up of ships of varying sizes and different
service speeds. Enlarging what stated by Lamb [24], the fleet success substantially depends on
its economic success. In evaluating different feasible fleets for CNG marine transport, the
optimal (preferred) fleet will be that one which requires the minimum tariff to transport an
energy unit (USD/mmBtu).
The optimal CNG fleet composition is strictly connected to the operative scenario,
techno-economic characteristics of feasible ships, costs and feasibility of infrastructures, the
financial parameters (loans, interest rates, period of reimbursement, depreciation allowances,
etc.). Scope of the implemented decision-making process is to establish simultaneously the
number of sister ships entering the fleet, as well as to simultaneously identify their capacity and
economic service speed, in order to transport a specified volume of gas per year from loading
terminal (both onshore and offshore) to destination terminals while achieving the expected rate
of return. The definition of the shipping scenario is completed by the distance to the market,
the stand-by time, the connection/disconnection time on/from the buoys, the loading and
offloading rates, and the possible storage facilities at both and destination sites. Several studies
[4,7,13] have highlighted that all these parameters have a strong influence on the best fleet
composition and must be taken into account simultaneously.
The main logistic constraint in optimising the CNG fleet composition is to ensure that the
delivery site is always supplied with the required volume of gas by a ship during the time other
CNG ships are on a round-trip from the destination site to the source and back. The loading and
offloading rates play a relevant role in the optimal fleet selection. The identification of the best
rates depends on many factors of both technical and economic nature. These rates are strictly
correlated to the number of ships in the fleet and to ship capacity. For instance, in the
interrupted-continuous scheme the loading rate is solved through the following equation
rton
h
onCC
n
CC
n
on
CC
nIC
on
TQQ
QGnG
QGQ
(2)
which could be solved by means of a constrained multiobjective optimisation method.
On the contrary, the authors’ strategy has been to establish a set of possible values for
loading and offloading rates and to determine the sub-optimal fleet for each couple (Qon, Qoff)
by identifying the feasible sister ship previously stored in a database. Then, the optimal fleet is
selected as the sum of ships extracted from the database, requiring the minimum total tariff, e.g.
the shipping tariff plus the extra cost incurred by the infrastructure facilities.
Even in the simplest hub-and-spoke distribution pattern, e.g. continuous-continuous
service, avoiding concurrent consideration of logistics and conceptual designing of ships with
simultaneous merging of technical and economic properties can lead to wrong decision making.
Availability of a database of CNG ships with different capacity and evaluated in techno-
economic terms at different service speeds is a must in searching for the optimal CNG fleet
while complying with the aforementioned logistic constraint.
2.3.1 Cashflow model
Especially in concept design, which impacts on total building cost for 70% at least, cost
estimation of alternative technical solutions is a decision making tool of paramount importance.
The engineering economics constitutes a basic element of the shipping strategy since
optimisation of a fleet composition cannot be a mere technical problem. Economic prognoses
constitute the input from which any selection method concludes to an optimal decision making.

Francesco Mauro, Braidotti Luca, Determination of an Optimal Fleet for a CNG
Giorgio Trincas Transportation Scenario in the Mediterranean Sea
8
In order to evaluate a shipping tariff, a built-in economic model provides monetary value of
each alternative CNG project from a shipowner’s financial prospective. Ship costs include the
costs from the shipyard, the cost of the operating cycle and elements of cost of the ship through
its economic life. Clearly, the cost of construction and operation will affect the shipping tariff,
but the financial conditions in the market will have an equally important impact. It is the
relationship between the two which forms the conceptual basis for the economic model
implemented for decision making about CNG fleet composition.
The most popular tool for analysis of engineering economics is a Discounted CashFlow
(DCF) model, which allows to determine the Net Present Value (NPV) for an expected rate of
return and over the assumed project life. Discounting allows for the time value of money, which
is an effective tactic for evaluating the future value of a project in terms of today’s money. The
decision criterion for investment selection is the NPV which can be represented by a linear
function of the economic variables, that is, the object function which is the sum of the
discounted annual cash flows. Cash flows are calculated on an after-tax basis and are assumed
to occur on an end-of-year basis. In formulating the NPV equation, the fiscal depreciation of
every ship is established by the linear method on the basis of the scrap value at the end of the
ships’ estimated economic life. On the basis of NPV evaluated for each feasible fleet, it is
straightforward to determine the best fleet composition, e.g. that one which requires the
minimum tariff for unit energy transport by setting NPV = 0 for the expected rate of return to
the shipowner.
Calculation of DCF involves deduction of running costs and capital costs from assumed
revenue earned. What is left from annual income after these expenditures and amortisation is
generally subject to taxes. Income is assumed as the amount of money the shipping company
gets for shipping the gas between the origin and destination points. While income is assumed
constant year-to-year, some running costs (crew and victualing, maintenance, administration)
are escalated over time.
Running costs cover:
operating costs related to the daily running of the ship (crew, lubricants, stores and
consumables, routine maintenance and repairs, insurance, administration), assumed
to represent an Italian registered ship with national crew
voyage costs (gas consumption from main engines and auxiliaries, gas price at
wellhead),
CNG handling costs.
Capital costs include:
capital repayment (loan to finance the project, terms of loan),
interest payments (source of loan, interest rate, terms of loan),
periodic maintenance (age of ship, survey cycles, class regulations, maintenance
policy).
Many assumptions are made when calculating the profitability of a CNG fleet. Material costs
of the ship are difficult to estimate accurately as public prices from manufacturers are usually
not available Moreover, since CNG ships belong to a quite novel concept, cost estimate of some
special features of the ship like gas containment system are necessarily imprecise. Operational
cost calculations are somewhat less inaccurate.
Determination of an Optimal Fleet for a CNG Francesco Mauro, Braidotti Luca,
Transportation Scenario in the Mediterranean Sea Giorgio Trincas
9
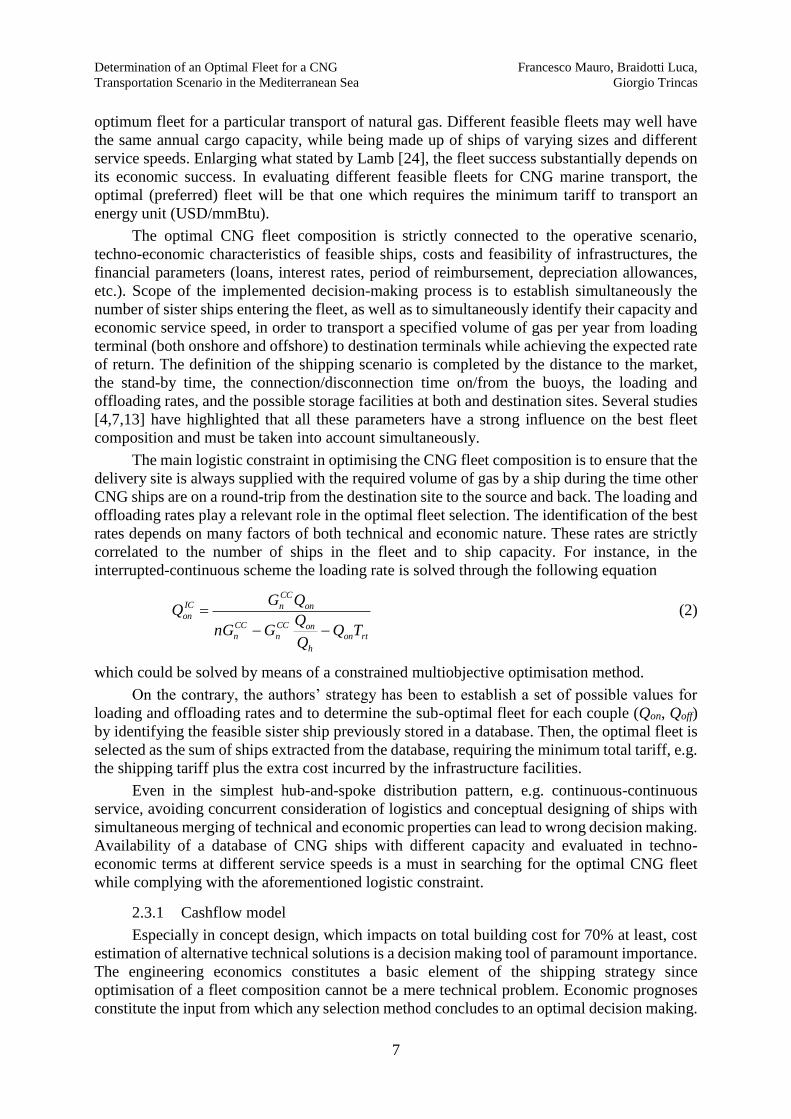
Fig. 2 Manhours per tonne of steelwork and outfitting in Italian shipyards
2.3.2 Capex
The cost estimate for building an innovative ship and infrastructure facilities (Capex) is
performed with a top-down approach for main items by project elements and then by discipline.
Each discipline contains details as to outline of the cost estimate breakdown structure, technical
data sources, cost data sources and contingencies. Transferring the gas from the production
facility to the CNG containment system on board is technically straightforward and requires a
minor capital investment for a short subsea pipeline, riser pipes and gas transfer buoys. On
average, 5% and 6% of the total investment on the CNG project is expected for loading and
offloading terminals, respectively.
As regards the ship building cost, it is evaluated distinguishing between material costs,
direct labour costs and overheads, including an expected profit margin by the shipyard.
Breakdown of the material cost covers technological main groups such as hull structure,
superstructure, engine rooms, propulsors, electrical plant, electronics & control system,
auxiliary systems, outfit and furnishings, special systems. Cost of the pressure vessels is
included depending on their number and length. Finally, a CGT (compensated gross tons) factor
pertaining to an LNG ship of the same size is applied.
At concept design stage, based on statistics of LNG/LPG ships the ship acquisition cost
in US dollars can be formulated as:
pCCCCC PVEMHSacq 1103 (3)
where CHS = 3.365 WHS-0.224 is the hull steel cost as a function of steel weight WHS in metric
tonnes, CM = 14.308 PB0.669 is the machinery and auxiliaries cost depending on engines brake
power PB in kW, CE = 14.770 WOD0.932 is the equipment cost depending on outfitting, heating,
ventilation, air conditioning, electric plant and deck machinery cost depending on their weight
WOD in metric tonnes, CPV is the total cost of the containment system (pressure vessels, piping,
compressors, etc.), p is the profit margin of the shipyard, in percentage. It is worth noticing that
cost of pressure vessels is strictly confidential.
Manhours are the basis of all labor costs, and once estimated, it is only necessary to apply
wage rates, overheads and yard profit to arrive at the total labor costs. At the simplest level
deemed as sufficient at concept design stage, steelwork labor cost Ch can be estimated from:
htHSh chWC (4)
where ht is manhours required for each steel tonne, ch is the wage rate per manhour. It is worth
noticing that manhours depend on steel weight, ship length, block coefficient and compensated
gross ton coefficient. Productivity data available from an Italian shipyard made it possible to
derive the regression relationships for manhours (Fig. 2) distinguishing between structures and
outfitting building.

Francesco Mauro, Braidotti Luca, Determination of an Optimal Fleet for a CNG
Giorgio Trincas Transportation Scenario in the Mediterranean Sea
10
An average reduction factor is given to evaluate economics of scale for multiple ship
production, considering the elimination of nonrecurring needs, such as drawings and templates,
and considering the improvement resulting from the learning of the labour force.
2.3.1 Opex
Operating costs are the ongoing expenses which include most of the daily operational
costs during the ship lifetime, but excluding the gas (fuel) which is assumed to be included in
the voyage costs. The operation costs of the ship are divided in three main categories: fuel costs,
personnel costs, and maintenance.
Fuel costs are estimated based on the operational profile calculated earlier. Crew salary
costs are estimated based on the number of personnel onboard and their jobs. There are 20-25
crew members (captain, three officers, seamen). In addition to basic salaries and wages,
personnel costs include basic salaries and wages, victuals, social insurance, repatriation
expenses, recruitment and training cons. Maintenance costs are divided into hull maintenance,
engine maintenance and general maintenance. Engine maintenance is assumed to cost about
3750 USD/kW per year, whereas general maintenance is assumed to cost 0.5% of ship total
price per year. Insurance costs are assumed to be 1.2% of ship total price per year.
In the overall maintenance cost, a significant part is on the dry-docking cost CDD. It has
been estimated as [25]:
BDD PeSDdDWTcybaC (5)
where y denotes number of years from the date the ship is delivered, DWT its deadweight and
SD are the days from the ship’s arrival date to the yard and the departure date. The coefficients
in the regression formula have been determined from data on a number of chemical carriers
with deadweight below 30,000 tons.
3. Operative scenario and financial parameters
The case study is centred on the specific case of the gas shipping in the Mediterranean
Sea area, from North Africa to Europe. More in detail, the case of gas transportation between
the offshore field of Zohr, part of the Egyptian economic area, and the South of Adriatic Sea
(Brindisi). The selected scenario is representative of a source-destination distance of about 1000
nm and a production rate of 2 billion cubic meters of gas (bcm) per year.
A hub-and-spoke continuous-continuous service scheme is adopted, assuming a constant
service speed, to be determined as economically optimal, over the entire voyage. Furthermore,
the following assumption have been set:
Loading/offloading rate: 5 mmscm/d, where 4 mmscm/d is the delivered capacity;
STL connection and SPM disconnection time: 1.5 hours per operation;
Operating days per year: 355 (as required by rules, the CNG ships will be taken out
of service for dry-docking once every 5 years for 40 days and at each 30-month
intermediate point for about one week during an underwater survey; this totally
amounts to about 50 days in 5 years).
In addition, in order to properly take into account unpredictable situations that might occur to
the ship during its lifecycle, each one-way voyage duration is rounded up to the nearest half-a-
day time.
Furthermore, in the present case study, the following financial assumptions are made:
monetary values at a base value of 2018 US dollars and an inflation rate of 2% for revenues and
expenses, a 30% corporate income tax; linear depreciation of ships for a period of 15 years.
Capital for ship building will be acquired through both equity and debt, at a rate of 30% equity
to 70% debt. The loan term is assumed to be 8 years at an interest rate of 5.5%.
Determination of an Optimal Fleet for a CNG Francesco Mauro, Braidotti Luca,
Transportation Scenario in the Mediterranean Sea Giorgio Trincas
11
Interest payments begin at the end of the project’s initial year. For the three years of the
CNG ships’ construction, the principal repayment is assumed to be 40%, 30%, and 30% of the
total project cost. The expected rate of return for the CNG project is assumed to be 12.5%, a
reasonably fairly standard value for the oil & gas companies. Italian shipyards average hourly
cost has been assumed in building cost estimation, whilst daily operating costs were derived
from average data for LNG ships, while fuel costs from present market information concerning
price of natural gas at wellhead.
4. Propulsion systems
Different propulsion systems installations have a remarkable effect on shipping efficiency
when applied on CNG ships [20]. The impact on hull forms (not limited on the aft-body),
propeller design and general arrangement, should be taken into account since the concept design
stage. Moreover, since natural gas is flammable and potentially explosive, the application of
redundant propulsion systems and steering gears is advisable. Thus, the single screw propulsion
system should be avoided in favour of twin-screw arrangements. In the present study, a
comparison between two alternative twin-screw solutions is carried out highlighting the effect
on the required freight rate (tariff) and DP capability. The first solution is a twin-skeg ship with
conventional mechanic propulsion driven by 2-stroke dual-fuel engines. The second is a full
diesel-electric solution with pods. In this section the two propulsion systems are briefly
described highlighting the differences and peculiarities rising up in the ship modelling during
concept design stage.
4.1 2-stroke diesel engine system
The first option under investigation is a conventional propulsion system adopting 2-stroke
dual fuel engines as prime movers. Such a solution adopts high efficiency engines, rotating at
low speeds to be directly coupled with the propellers. Hence, all the propulsive drive will be
extremely essential, reducing the amount of losses from engine brake power PB to propeller
delivered power PD. However, this kind of propulsion system requires a propeller rotating at
low speed. Such a low rotational rate implies utilisation of large diameter propellers, being
mountable only in case of a sufficiently high draught. Because of the adoption of light Type III
PVs, it is not reasonable to presume to have a high draught even for large capacity ships; for
such a reason, in order to keep the propeller diameter under control, the selected hull form for
this kind of propulsive solution will be of the twin-skeg type.
This kind of propulsion layout requires a different modelling of the propulsion since
conceptual calculations. Although the total resistance in calm water can be evaluated according
to statistical methods [26], the determination of propulsive coefficients (especially for wake
fraction w) is not comparable with a conventional twin-screw ship. The presence of the gondola
is effectively decreasing the relative flow velocity coming into the propeller disk, leading to
values of w more similar to those of single-screw ships. That is why the wake fraction w has
been estimated according to an equivalent single-screw statistic method [26], while the thrust
deduction factor t was estimated with conventional twin-screw statistical formula [27].
To take into account the actual operative scenario since propeller selection process, also
added wave resistance has been included according to statistical formulations [28]. The
propeller selection has been carried out with a bounded iterative procedure; considering 4-
bladed B-Series propellers [29], a maximum diameter DMAX according to hull clearances and a
database of 2-strokes diesel engines. Selection of the diesel engine has to ensure the matching
between propeller and engine revolution rates.

Francesco Mauro, Braidotti Luca, Determination of an Optimal Fleet for a CNG
Giorgio Trincas Transportation Scenario in the Mediterranean Sea
12
4.2 Diesel-electric system
Another interesting solution for the propulsive system can be the adoption of a diesel-
electric propulsion. The adoption of such a system is required by the installation of pod
propulsive devices, which can be considered as an improving solution for the positioning ability
of the ship during loading/offloading operations on/from a fixed buoy. Besides, the installation
of the pods leads to an aft-body hull form totally different with respect to the twin-skeg, but
more similar to a conventional twin-screw ship. It means that the metamodel used to define the
geometric hull characteristics in ships generation will be different between the two cases, in
order to capture the peculiarities of each candidate hull form.
The propulsive coefficients evaluation in a podded ship can be performed, as first
approximation, in the same way of a twin-screw ship. However, a different modelling of
kinematics and dynamics coefficients of the propulsors is needed. On this purpose, the
reproduction of characteristic thrust and torque curves can be done starting from B-series
propeller open water curve and applying a procedure derived from thruster units [30]. Open-
water curves have been modified according to the following coefficients:
QT K
Q
K
T
Q
Q
Q
T
TT
J
Je
J
Je
K
K
K
K
0000
(6)
where subscript 0 denotes original B-series values. The coefficients as per equation (6) modify
the standard open water curve, simulating the behaviour of the complete pod unit. An example
is given in Figure 3. The tuning of the coefficients has been performed to reproduce the pod
hydrodynamic characteristics given by the manufacturer.
Fig. 3 Open water chart comparison between a B series propeller (black) and equivalent pod unit (red).

Determination of an Optimal Fleet for a CNG Francesco Mauro, Braidotti Luca,
Transportation Scenario in the Mediterranean Sea Giorgio Trincas
13
Fig. 4 Length modelling for the two proposed propulsion systems.
4.3 Concept design ship layout modelling
The selection of two different propulsive systems influences not only the hull form
modelling and algorithms for power performance prediction, but also the internal layout of the
ship, hence, the areas needed to fit the engine room and consequently the main dimensions of
the ship. As described in [18], the internal layout modelling of a CNG ship can be done as a
function of the so-called primitive cargo unit, which for a CNG ship is the PV diameter. Some
specific spaces should be taken into account. In fact, besides cargo length and engine room
length (common to all the type of ships), other longitudinal spaces should be dedicated to
equipment necessary to gas loading and offloading process. This is the case of the conical recess
in the fore part of the flat of bottom for connection to the STL system and of the main
compressors. For such a reason dedicated space should be considered to install the above
mentioned equipment. A schematic representation of the different configurations is given in
Figure 4. With such a discretisation, considering the system origin on the fore perpendicular,
the length overall LOA definition becomes:
MANERHSTLCBSMOA LLLLLLLskegtwin
(7)
ERHSTLCBSMOA LLLLLLpod
(8)
where LSM is the stem overhang length, LCB is the collision bulkhead distance from the origin,
LSTL is the STL longitudinal space, LH is the total length of the holds, LER is the engine room
length, and LMAN is the manoeuvring machinery space. It must be noted that in the podded case
LER includes the length of both pods LPOD and gen sets LGEN, so that there is no necessity to add
an extra space for manoeuvring equipment. The engine room length is then function of the
machinery size selected by the mathematical metamodel.
5. Dynamic positioning
A CNG ship, as it has been presented throughout this paper, has another issue, e.g. the
dynamic positioning, to tackle in order to load/offload the gas in the expected time. In fact,
while the ship is stationing on the STL buoy for the gas loading, should keep position and then
manoeuvre autonomously [31], thus requiring a DP system. Therefore, the DP issue should be
considered since the concept design stage.

Francesco Mauro, Braidotti Luca, Determination of an Optimal Fleet for a CNG
Giorgio Trincas Transportation Scenario in the Mediterranean Sea
14
The determination of the capabilities of a DP system is not an easy task and may be
assessed typically using two different approaches [32]: a quasi-steady approach and/or a time
domain one. The time domain approach [33,34] is used once the available ship details are
sufficient to accurately define the whole system mounted on board. This is not the case at the
concept design stage, where fast and sufficiently reliable tools should be used to assess the
performance of each attribute. For such a reason, a quasi-steady approach [35] has been used
to perform station-keeping capability of the ship, where only the equilibrium between the
external forces and the thruster delivered forces should be evaluated on the horizontal plane:
0
0
0
EXTTHRENV
EXTTHRENV
EXTTHRENV
ZZZ
YYY
XXX
NNN
FFF
FFF
(9)
In system (9), FENV, NENV are the environmental, FTHR, NTHR the thruster and FEXT, NEXT the
external forces and moments. By modelling the DP in the concept design stage, the external
forces have been neglected, since they are related to the mutual interaction between ship and
STL buoy, forces that are initially unknown. Since it will be extremely complicated and time
consuming to perform a complete DP assessment during a generation process as described in
Section 2, it has been decided to restrict the analysis to a single environmental condition and
encounter angle. Here, only the 15-deg case is calculated per each generated ship, considering
a wind speed of 20 knots and a collinear wave according to IMCA correlation [36] and a 1 knot
collinear current speed. By doing that, each generated ship can be accepted or discarded
according to the selected criteria. This kind of approach, slightly reduces the calculation time
and allows to use more reliable allocation algorithm for the equilibrium resolution.
5.1 Thrust allocation algorithm
Between the several possibilities to solve system (9), here an optimisation algorithm has
been used, capable to manage non-linear objective functions subject to non-linear constraints
[37]. As objective function, the minimum absorbed power has been selected, considering the
following non-quadratic formulation:
n
iixxf
1
23
(10)
where n is the number of thrust devices and xi are the thrust values delivered by each single
device. In the specific, for the total thrust determination, interaction effects have been
considered according to ABS indications [38]. Moreover, for the back thrusters of the podded
ship, forbidden zones have been implemented to avoid the possibilities of the thruster to work
in an excessive interaction zone, due to the presence of the skeg and the other thruster.
In case of the twin-skeg ship, the rudder has been considered of the Becker type, using lift and
drag coefficients coming out from literature.
5.2 Environmental loads determination
The environmental forces have been modelled in such a way to take into account the
effects of wind, waves and current. Since it is difficult to determine in the conceptual design
stage the current and wave loads as a function of the main parameters of the ship, simplified
methods given by regulations have been applied [39]. As regards the wind loads, a more
detailed analysis has been carried out, since more information are available from the scientific
literature.

Determination of an Optimal Fleet for a CNG Francesco Mauro, Braidotti Luca,
Transportation Scenario in the Mediterranean Sea Giorgio Trincas
15
Several possibilities are available to determine the wind loads in an early-design stage
[40], adopting coefficients that depend on the main parameters of the ship superstructures. In
literature, different databases are available for direct use of experimentally derived coefficients
for wind loads [41]. However, the novelty of the ship type proposed in this study has made it
impossible to find a suitable comparable geometry in standard databases. For such a reason
other methods have been investigated to determine the wind loads.
Here Isherwood [42], Fujiwara [43] and DNV [39] methods are compared on the standard
superstructure layout considered for the two ship types. The methods are using different ways
to obtain non-dimensional wind coefficients. Here all the coefficients are represented in the
following form to have a homogeneous comparison:
2
2
2
5.0
5.0
5.0
WOALair
ZZ
WLair
YY
WTair
XX
VLA
NN
VA
FC
VA
FC
(11)
where ρair is the air density, VW the wind speed, LOA the overall length and AT, AL the transversal
and lateral area projections respectively. AT and AL are estimated as a function of ship main
dimensions and PV length.
In Figure 5, a comparison is presented between the different methods for the two ship
types. It can be seen that the Isherwood method is more scattered and is giving the lower values
for the maximum loads. The DNV method is giving a really simple trend, being in line with the
maximum loads of Isherwood method for lateral winds. The Fujiwara method is giving the
higher values for the transverse and lateral forces. It has been decided to adopt the Fujiwara
method to perform the DP calculations, in such a way to take a margin on the loads.
6. Best ships comparison
The design process described in section 2 has been applied to the operative scenario
defined in section 3 leading to assess the best CNG fleet composition for both the twin-skeg
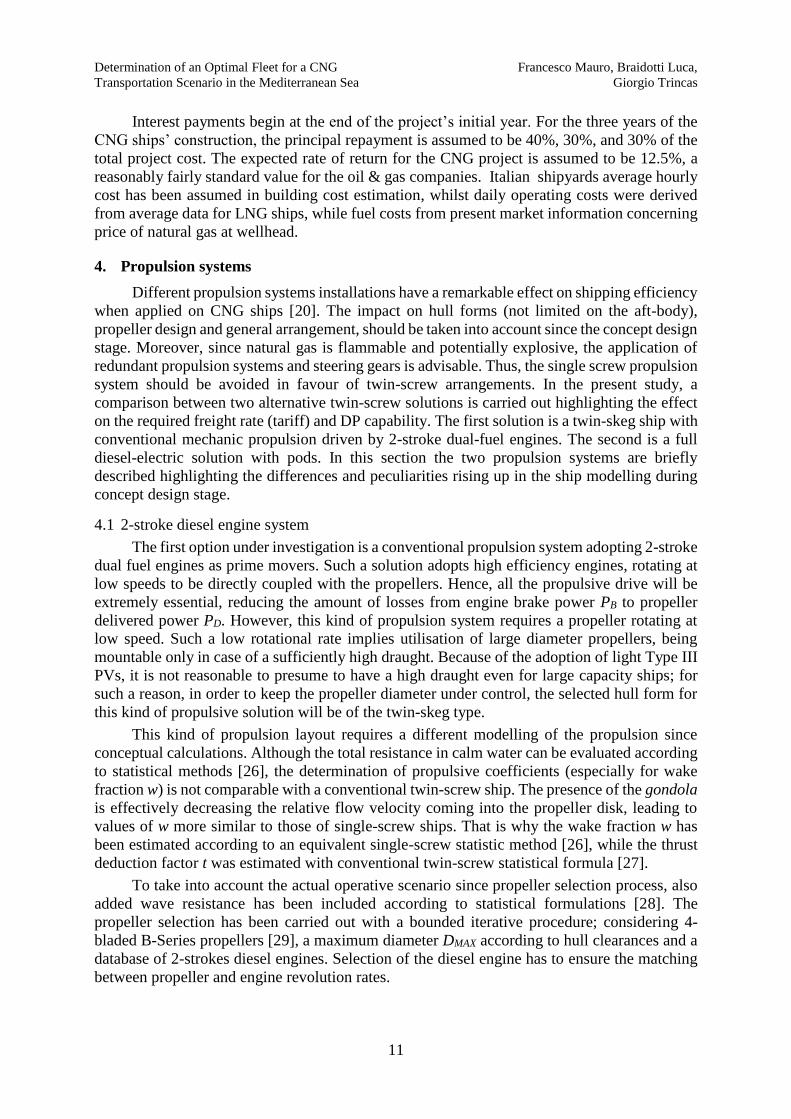
and podded ship concepts installing different propulsion systems. Figure 6 shows all the feasible
fleets for both the ship families. For each fixed number of sister ships (5,6,7,8 and 9 ships), the
combination of ship capacity and service speed (from 17 to 24 knots in step of 1 knot) is
determining the shipping tariff. Than the minimum tariff can be evaluated per each fleet
composed by different number of ships. Comparing the relative minima, the optimum fleet is
determined. Some scattering on tariffs between contiguous design solutions is mainly caused
by the discrete nature of machinery sizes available on the market. This behaviour is more
evident for the podded solution.
For both families of ships, an optimal fleet can be defined, i.e. the one requiring the
minimum tariff. In the given scenario, for the twin-skeg solution the best fleet composition
corresponds to 6 ships sailing at a service speed of 23 knots, resulting in a total gas capacity of
290 mmscf per ship. As to the podded solution, the diagram presents less evidence for the
optimum determination. In fact, there is a range of ship capacities yielding fleets requiring
almost the same shipping tariff. Nevertheless, an absolute minimum can be determined
corresponding to a fleet of 7 ships with lower service speed of 20 knots and a capacity of 251.6
mmscf.
Francesco Mauro, Braidotti Luca, Determination of an Optimal Fleet for a CNG
Giorgio Trincas Transportation Scenario in the Mediterranean Sea
16
Fig. 6 Shipping tariff for all the feasible fleet composition for both podded and twin-skeg solutions.
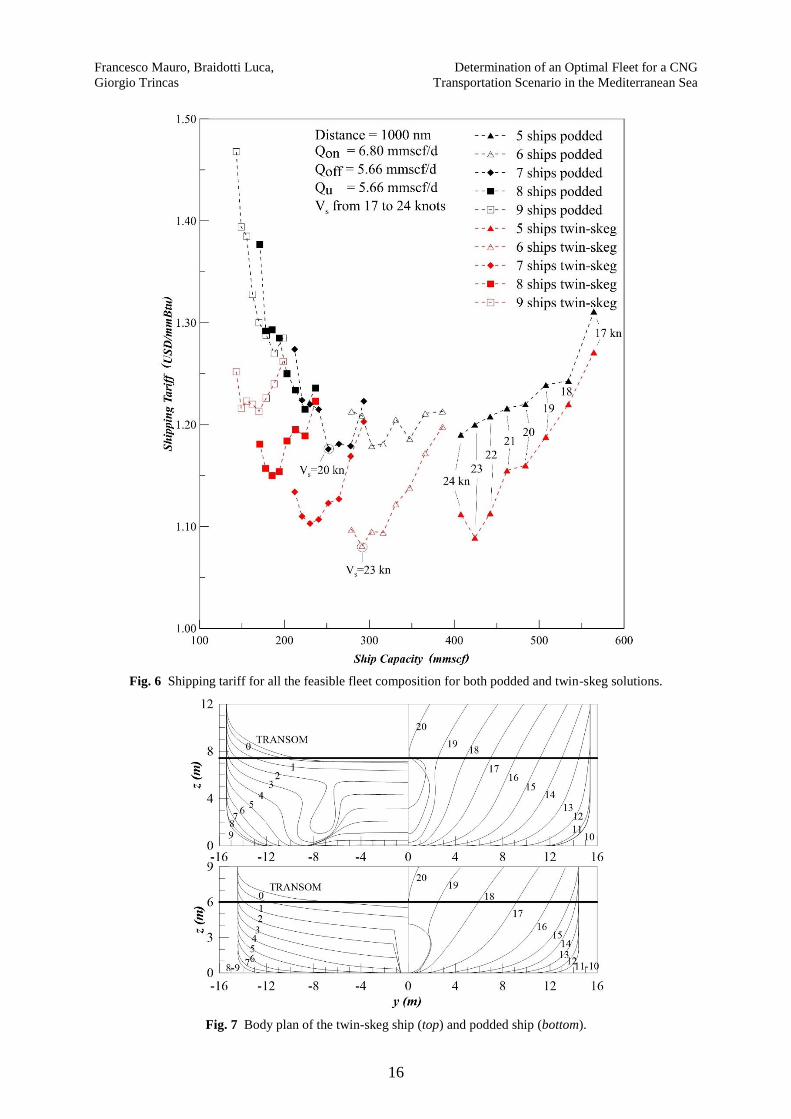
Fig. 7 Body plan of the twin-skeg ship (top) and podded ship (bottom).
Determination of an Optimal Fleet for a CNG Francesco Mauro, Braidotti Luca,
Transportation Scenario in the Mediterranean Sea Giorgio Trincas
17
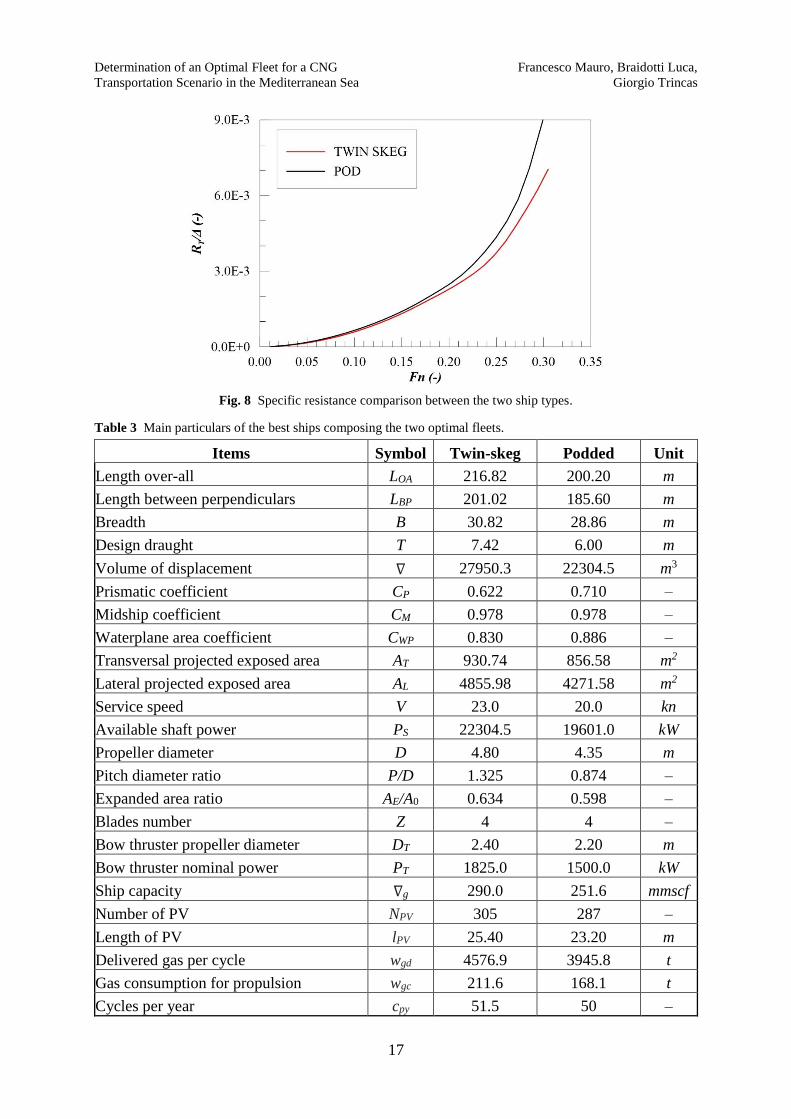
Fig. 8 Specific resistance comparison between the two ship types.
Table 3 Main particulars of the best ships composing the two optimal fleets.
Items Symbol Twin-skeg Podded Unit
Length over-all LOA 216.82 200.20 m
Length between perpendiculars LBP 201.02 185.60 m
Breadth B 30.82 28.86 m
Design draught T 7.42 6.00 m
Volume of displacement ∇ 27950.3 22304.5 m3
Prismatic coefficient CP 0.622 0.710 –
Midship coefficient CM 0.978 0.978 –
Waterplane area coefficient CWP 0.830 0.886 –
Transversal projected exposed area AT 930.74 856.58 m2
Lateral projected exposed area AL 4855.98 4271.58 m2
Service speed V 23.0 20.0 kn
Available shaft power PS 22304.5 19601.0 kW
Propeller diameter D 4.80 4.35 m
Pitch diameter ratio P/D 1.325 0.874 –
Expanded area ratio AE/A0 0.634 0.598 –
Blades number Z 4 4 –
Bow thruster propeller diameter DT 2.40 2.20 m
Bow thruster nominal power PT 1825.0 1500.0 kW
Ship capacity ∇g 290.0 251.6 mmscf
Number of PV NPV 305 287 –
Length of PV lPV 25.40 23.20 m
Delivered gas per cycle wgd 4576.9 3945.8 t
Gas consumption for propulsion wgc 211.6 168.1 t
Cycles per year cpy 51.5 50 –

Francesco Mauro, Braidotti Luca, Determination of an Optimal Fleet for a CNG
Giorgio Trincas Transportation Scenario in the Mediterranean Sea
18
Fig. 9 Speed power prediction at trials condition for the two ships.
In both cases, the service speed corresponding to the minimum tariff for a given number
of ships increases as the number of ships decreases. Furthermore, it is worth noticing how, in
the same operative scenario, even the number of sister ships changes with adoption of different
propulsion systems resulting in very different design solutions in terms of main dimensions,
capacity, service speed, etc. All the characteristics of the two optimal ships (Fig. 7) have been
assessed via metamodels; the resulting main characteristics are provided in Table 3. Analyzing
the main dimensions and coefficients, it rises up that the podded ship, even though of smaller
size, is less slender than the twin-skeg solution.
The main cause is the higher Froude number (Fn=0.26) for the twin-skeg ship at service
speed of 23 knots, whereas the podded ship has Fn=0.24. The different required capacities of
the two solutions have a heavy impact on the ratio between cargo capacity and total
displacement, which is reflected on the block coefficient too.
The difference between hull form shapes has led to obtain a better specific resistance for
the twin-skeg ship in all the speed range, as shown in Figure 89. The same consideration is still
valid when propulsive issues are considered. In fact, analysing the trial condition for the two
ships, the following conclusion can be drawn for the two ships considering the different
propulsive power mounted on board of each configuration as per Table 3.
For the twin-skeg concept, mounting a propeller with geometrical characteristics similar
to the one of Table 3, a sustained speed of 24.45 knots is expected with propellers rotating at
124.0 rpm absorbing a shaft power of 22304.5 kW without presence of wind and waves. Under
the same conditions, a speed of 21.55 knots with propeller rotating at 203.8 rpm with an
available shaft power of 19601.0 kW is expected for the podded ship. It must be noted that the
selected propellers parameters have been chosen searching for the design point at service speed,
taking into account the added resistance evaluated in the Eastern Mediterranean sea.
Determination of an Optimal Fleet for a CNG Francesco Mauro, Braidotti Luca,
Transportation Scenario in the Mediterranean Sea Giorgio Trincas
19
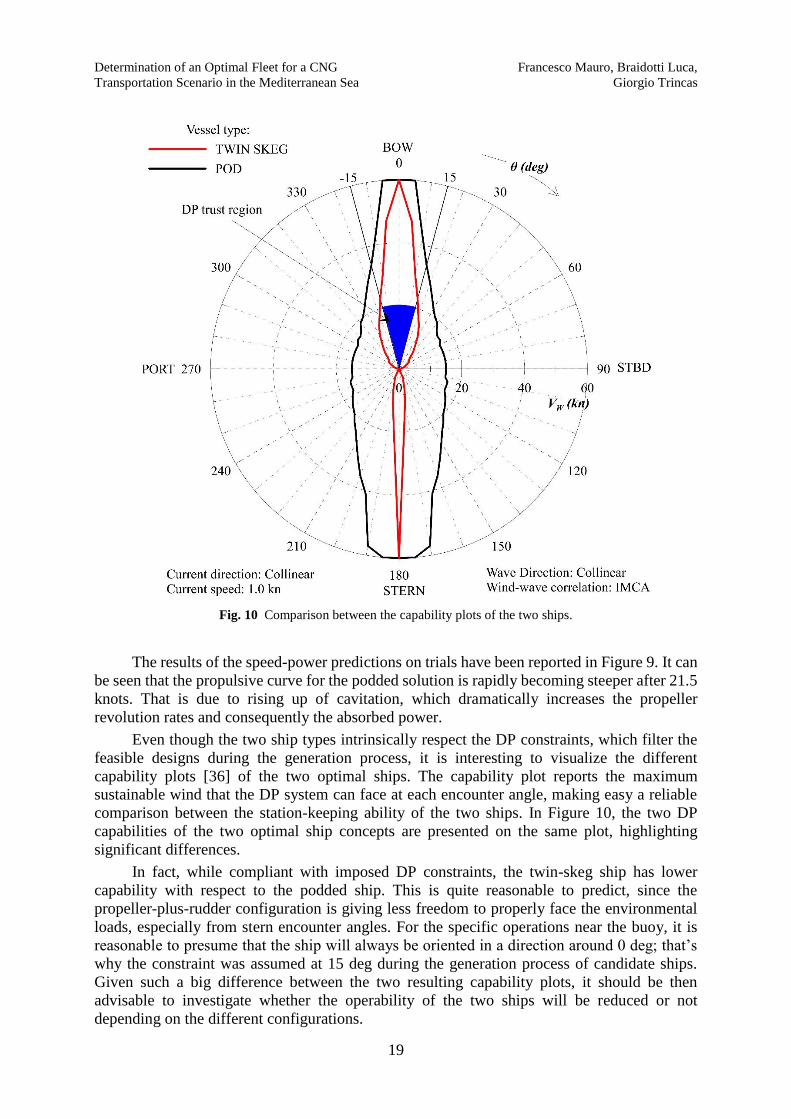
Fig. 10 Comparison between the capability plots of the two ships.
The results of the speed-power predictions on trials have been reported in Figure 9. It can
be seen that the propulsive curve for the podded solution is rapidly becoming steeper after 21.5
knots. That is due to rising up of cavitation, which dramatically increases the propeller
revolution rates and consequently the absorbed power.
Even though the two ship types intrinsically respect the DP constraints, which filter the
feasible designs during the generation process, it is interesting to visualize the different
capability plots [36] of the two optimal ships. The capability plot reports the maximum
sustainable wind that the DP system can face at each encounter angle, making easy a reliable
comparison between the station-keeping ability of the two ships. In Figure 10, the two DP
capabilities of the two optimal ship concepts are presented on the same plot, highlighting
significant differences.
In fact, while compliant with imposed DP constraints, the twin-skeg ship has lower
capability with respect to the podded ship. This is quite reasonable to predict, since the
propeller-plus-rudder configuration is giving less freedom to properly face the environmental
loads, especially from stern encounter angles. For the specific operations near the buoy, it is
reasonable to presume that the ship will always be oriented in a direction around 0 deg; that’s
why the constraint was assumed at 15 deg during the generation process of candidate ships.
Given such a big difference between the two resulting capability plots, it should be then
advisable to investigate whether the operability of the two ships will be reduced or not
depending on the different configurations.
Francesco Mauro, Braidotti Luca, Determination of an Optimal Fleet for a CNG
Giorgio Trincas Transportation Scenario in the Mediterranean Sea
20
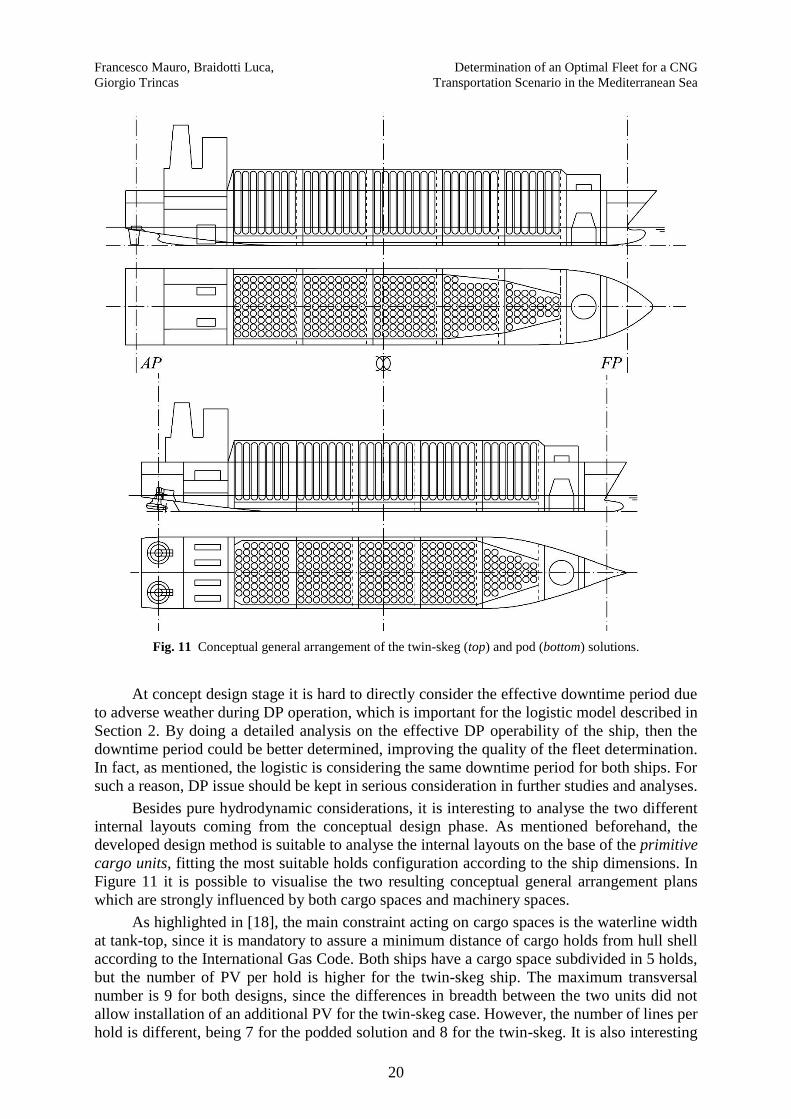
Fig. 11 Conceptual general arrangement of the twin-skeg (top) and pod (bottom) solutions.
At concept design stage it is hard to directly consider the effective downtime period due
to adverse weather during DP operation, which is important for the logistic model described in
Section 2. By doing a detailed analysis on the effective DP operability of the ship, then the
downtime period could be better determined, improving the quality of the fleet determination.
In fact, as mentioned, the logistic is considering the same downtime period for both ships. For
such a reason, DP issue should be kept in serious consideration in further studies and analyses.
Besides pure hydrodynamic considerations, it is interesting to analyse the two different
internal layouts coming from the conceptual design phase. As mentioned beforehand, the
developed design method is suitable to analyse the internal layouts on the base of the primitive
cargo units, fitting the most suitable holds configuration according to the ship dimensions. In
Figure 11 it is possible to visualise the two resulting conceptual general arrangement plans
which are strongly influenced by both cargo spaces and machinery spaces.
As highlighted in [18], the main constraint acting on cargo spaces is the waterline width
at tank-top, since it is mandatory to assure a minimum distance of cargo holds from hull shell
according to the International Gas Code. Both ships have a cargo space subdivided in 5 holds,
but the number of PV per hold is higher for the twin-skeg ship. The maximum transversal
number is 9 for both designs, since the differences in breadth between the two units did not
allow installation of an additional PV for the twin-skeg case. However, the number of lines per
hold is different, being 7 for the podded solution and 8 for the twin-skeg. It is also interesting
Determination of an Optimal Fleet for a CNG Francesco Mauro, Braidotti Luca,
Transportation Scenario in the Mediterranean Sea Giorgio Trincas
21
to notice how the holds are disposed. The podded ship, having a relatively bigger parallel
middle body, is suitable to have almost 4 fully loaded holds; on the contrary, the twin-skeg
solution is having only three holds fully loaded, while the two foremost holds are strictly limited
by the waterline width at tank-top. As discussed in subsection 4.3, the propulsive system has a
strong influence on the general arrangement. In fact, the engine room for the podded ship is less
extended compared to the twin-skeg solution, leading to a much shorter afterbody. The twin-
skeg ship, even though is slenderer, has a more extended parallel body ranging from section 8
to 10, while it is limited to sections 8 and 10 in the podded ship.
7. Conclusions
A process aimed to determine an optimal CNG fleet has been presented, considering a
specific transportation scenario in the Mediterranean Sea. Two different ship concepts have
been conceived, designed at conceptual design level and analysed in techno-economic terms.
Comparison between the shipping tariffs on the selected scenario for the optimal fleets
composed by two ship concepts has highlighted that the twin-skeg solution has a lower tariff
compared to the podded one. Analysing more in detail the two ship types composing the optimal
fleets, it results that the twin-skeg solution presents better hydrodynamic performances with
respect to the podded solution. The tariff evaluation of the podded ship shows some
discontinuities that are due to the fact that pod size cannot be customized, but are roundly fixed
by the manufacturers. The twin-skeg solution is not presenting this discontinuity since the
propeller selection is more flexible. Also the dynamic positioning problem has been considered
for the two solutions. Besides the constraints on a single DP criteria for an environmental
condition and heading, the two ships composing the best fleets have been compared considering
the capability plot. The analysis highlights that the podded solution has a higher capability with
respect to the twin-skeg one, since the pod system is more flexible to balance the environmental
and external load. The possibility to consider also DP inside the concept design stage has to be
further analysed, since it can be source of a better definition of the ship operability. This is
influencing the downtime period of the ships, relaxing the constraints in the logistic model.
The developed strategy for optimal fleet selection simultaneously provides the number of fleet’s
ships, the gas capacity and the economically service speed of each sister ship on the basis of
minimising a shipping tariff at the expected rate of return.
REFERENCES
[1] …, 2018, World Energy Balances (2018 edition), International Energy Agency, Paris, France.
[2] …, 2016, International Energy annual 2016, DOE/EIA-0219, Energy Information Administration,
Washington, USA.
[3] Economides, M.J. and Wood, D.A., 2009, The state of natural gas, Journal of Natural Gas Science and
Engineering, 1(1-2), 1-13. http://dx.doi.org/10.1016/j.jngse.2009.03.005.
[4] Economides, M.J., Wang, X., Colafemmina, F. and Tomaselli, N.V., 2012, The optimization of natural
gas transportation, Proceedings of Society of Petroleum Engineering, Hydrocarbon, Economics and
Evaluation Symposium, Calgary, Canada. https://doi.org/10.2118/161583-MS.
[5] Chernyavs’ka, L. and Dorigoni, S., 2003, Transportation Modes of Natural Gas and Liberalization of
Markets in Europe: Pipelines or LNG? (in Italian), Economia delle Fonti di Energia e dell’Ambiente, 2.
[6] Nikolaou, M, Wang, X. and Economides, M.J., 2013, Optimisation of compressed natural gas marine
transportation with composite-Material containers, Proceedings of SPE Asia Pacific Oil and Gas
Conference and Exhibition, Jakarta, Indonesia. https://doi.org/10.2118/165898-MS.
[7] Nikolaou, M., 2010, Optimizing the logistics of compressed natural gas transportation by marine vessels,
Journal of Natural Gas Science and Engineering, 2(1), 1-20. https://doi.org/10.1016/j.jngse.2010.02.001.
[8] Wagner, J. V., van Wagensveld, S., et al.,2002. Marine transportation of compressed natural gas a viable
alternative to pipeline or lng. In SPE Asia Pacific Oil and Gas Conference and Exhibition. Society of
Petroleum Engineers. https://doi.org/10.2118/77925-MS.

Francesco Mauro, Braidotti Luca, Determination of an Optimal Fleet for a CNG
Giorgio Trincas Transportation Scenario in the Mediterranean Sea
22
[9] Stenning, D. G., Fitzpatrick, J. P., Trebble, M. A., 2012, Floating CNG, a simpler way to monetise
offshore gas. In Offshore Technology Conference. Offshore Technology Conference.
https://doi.org/10.4043/23615-MS.
[10] Bortnowska, M., 2009, Development of new technologies for shipping natural gas by sea. Polish
Maritime Research, 16(3):70–78. https://doi.org/10.2478/v10012-008-0036-2.
[11] Valsgård, S., Reepmeyer, O., Lothe, P., Strøm, N. K., and Mørk, K., 2004. The development of a
compressed natural gas carrier. In 9th International Symposium on Practical Design of Ships and Other
Floating Structures
[12] Trincas, G., 2018, Comparison of Marine Technologies for Mediterranean Offshore Gas Export,
Proceedings of 19th International Conference on Ship & Maritime Research - NAV 2018, Trieste, Italy.
http://dx.doi.org/10.3233/978-1-61499-870-9-577
[13] Trincas, G., 2014, Optimal fleet composition for marine transport of compressed natural gas from
stranded fields, Proceedings of 1st INT-NAM Conference, Istanbul, Turkey.
[14] Vernengo, G. and Rizzuto, E., 2010, Ship synthesis model for the preliminary design of a fleet of
compressed natural gas carriers, Ocean Engineering, 89, 189-199.
https://doi.org/10.1016/j.oceaneng.2014.08.012.
[15] Gaggero, T., Vernengo, G., Parodi, M., and Rizzuto, E., 2018. Logistics-based fleet design for complex
transportation scenarios. Ships and Offshore Structures, pages 1–16.
https://doi.org/10.1080/17445302.2018.1454095.
[16] Vernengo, G., Gaggero, T. and Rizzuto, E., 2016, Simulation based design of a fleet of ships under power
and capacity variations, Applied Ocean Research, 61, 1-15. https://doi.org/10.1016/j.apor.2016.09.003.
[17] Pugh, S. 1991, Total design: integrated methods for successful product engineering, Workingam.
[18] Trincas, G., Mauro, F., Braidotti, L., Bucci, V., 2018, Handling the path from concept to preliminary ship
design, Proceedings of the 13th International Marine Design Conference, IMDC 2018, Helsinki, Finland.
[19] Lothe, P., 2005. The Knutsen OAS shipping pressurized natural gas carrier (PNG). In The Fifteenth
International Offshore and Polar Engineering Conference. International Society of Offshore and Polar
Engineers.
[20] Mauro, F., Braidotti, L. and Trincas, G., 2018, Effect of Different Propulsion Systems on CNG Ships
Fleet Composition and Economic Effectiveness, Proceedings of 19th International Conference on Ship &
Maritime Research - NAV 2018, Trieste, Italy. http://dx.doi.org/10.3233/978-1-61499-870-9-398
[21] Trincas, G., Grubišić, I. and Žanić, V., 1994, Comprehensive concept design of fast ro-ro ships by
multiattribute decision making. Proceedings of 5th International Marine Design Conference, IMDC'94,
Delft, the Netherlands.
[22] Sevkli, M., 2009, An Application of the Fuzzy Electre Method for Supplier Selection, International
Journal of Production Research 48(12), 3393–3405. https://doi.org/10.1080/00207540902814355.
[23] Myers R.H., Montgomery D.C and Anderson-Cook C.M., 2008, Response surface methodology – process
and product optimization using designed experiments. Third edition, J. Wiley & sons, Hoboken, USA.
[24] Lamb T., 2003, Ship Design and Construction, Vol. I, SNAME, Jersey City, USA.
[25] Apostolidis, A., Kokarakis, J., and Merikas, A., 2012, Modeling the Dry-Docking Cost – The Case of
Tankers, Journal of Ship Production, Vol. 28, no. 3, pp. 134-143.
https://doi.org/10.5957/JSPD.28.3.110039.
[26] Holtrop J., 1988, A statistical re-analysis of resistance and propulsion data, International Shipbuilding
Progress 31(363), 272–276.
[27] Holtrop, J. and Mennen, G.G.J., 1982, An approximate power prediction method, International
Shipbuilding Progress 29(335), 166–170. https://doi.org/10.3233/ISP-1982-2933501.
[28] Shifrin, L.S., 1973, AN Approximate Calculation of Added Resistance of Ship in Regular Waves.
Sudostroenie, 12, 5-7 (in Russian).
[29] Kuipers, G., 1992, The Wageningen Propeller Series, 1st edition, MARIN publication, Wageningen, The
Netherlands.
[30] Mauro, F., and Duranti E., 2018, Effect of propeller modelling on station-keeping thruster allocation
strategy, Proceedings of 19th International Conference on Ship & Maritime Research - NAV 2018,
Trieste, Italy. http://dx.doi.org/10.3233/978-1-61499-870-9-356
[31] Nabergoj, R., 2011, Station keeping and seakeeping in offshore vessels design. Proceedings of 1st INT-
NAM, Istanbul, Turkey.
Determination of an Optimal Fleet for a CNG Francesco Mauro, Braidotti Luca,
Transportation Scenario in the Mediterranean Sea Giorgio Trincas
23
[32] Mauro, F. and Gaudiano, F., 2018, Station-keeping calculations in early design stage: two possible
approaches. Proceedings of 19th International Conference on Ship & Maritime Research - NAV 2018,
Trieste, Italy. http://dx.doi.org/10.3233/978-1-61499-870-9-372
[33] Serraris, J., 2009, Time-domain analysis for DP simulations, Proceedings of OMAE Conference,
Honolulu, Hawaii. https://doi.org/10.1115/OMAE2009-79587.
[34] Smogeli, O., Trong, N., Borhaug, B. and Pivano, L., 2013, The next level DP capability analysis,
Proceedings of Dynamic Positioning Conference.
[35] Mauro, F. and Nabergoj, R., 2015, Smart thrust allocation procedures in early design stage dynamic
positioning predictions, Proceedings of 18th International Conference on Ship & Maritime Research -
NAV 2015, Lecco, Italy.
[36] …, 2000, Specification for D capability plots, IMCA 140 rev.1, The International Marine contractors
Association (IMCA).
[37] Mauro, F. and Nabergoj, R., 2016, Advantages and disadvantages of thrusters allocation procedures in
preliminary dynamic positioning predictions. Ocean Engineering 123, 96-102.
http://dx.doi.org/10.1016/j.oceaneng.2016.06.045
[38] …, 2014, Guide for Dynamic Positioning Systems, American Bureau of Shipping (ABS).
[39] …, 2018, Assessment of station keeping capability of Dynamic Positioning vessels, DNV-GL.
[40] Turk, A. and Prpić-Oršić, J., 2009, Estimation of extreme wind loads on marine objects, Brodogradnja
60(2), 147-156.
[41] Blendermann, W., 1996, Wind loading of ships- collected data from wind tunnel tests in uniform flow,
technical Report 574, Institut für Shiffbau der Universität Hamburg.
[42] Isherwood, R.M., 1972, Wind resistance of merchant ships. The Royal Institution of Naval Architects
115, 327-338.
[43] Fujiwara, T. and Nimura, T., 2005, New estimation method for wind forces acting on ships on the basis of
mathematical model. Proceedings of the 15th International Offshore and Polar engineering Conference,
Seoul, Korea.
Submitted: 13.12.2018.
Accepted: 23.05.2019.
Francesco Mauro (*corresponding author), [email protected]
Luca Braidotti, [email protected]
Giorgio Trincas, [email protected]
Department of Engineering and Architecture, University of Trieste, Via Valerio 10,
34127 Trieste (Italy)