Determinants Of Sustainability Of ... - University of Nairobi
114
DETERMINANTS OF SUSTAINABILITY OF COMMUNITY WATER PROJECTS IN WEBUYE EAST SUB-COUNTY, BUNGOMA, KENYA BY SUZZANE KIVEU A RESEARCH PROJECT REPORT SUBMITTED IN PARTIAL FULFILLMENT OF THE REQUIREMENT FOR THE AWARD OF THE DEGREE OF MASTER OF ARTS IN PROJECT PLANNING AND MANAGEMENT OF THE UNIVERSITY OF NAIROBI. 2016
Transcript of Determinants Of Sustainability Of ... - University of Nairobi

DETERMINANTS OF SUSTAINABILITY OF COMMUNITY
WATER PROJECTS IN WEBUYE EAST SUB-COUNTY,
BUNGOMA, KENYA
BY
SUZZANE KIVEU
A RESEARCH PROJECT REPORT SUBMITTED IN PARTIAL FULFILLMENT OF
THE REQUIREMENT FOR THE AWARD OF THE DEGREE OF MASTER OF
ARTS IN PROJECT PLANNING AND MANAGEMENT OF THE UNIVERSITY OF
NAIROBI.
2016

i
DECLARATION
This is my original work and has not been presented for award of a degree in the University of
Nairobi or any other university.
Signature………………………................. Date.....................................
Suzzane Kiveu
L50/80288/2015
This research project report has been submitted for examination with my approval as
university supervisor.
Signature………………………............. Date……………………...............
Mr. Julius Koringura
Lecturer, Department of Extra-Mural Studies,
University of Nairobi

ii
DEDICATION
I dedicate this study to my husband Michael Situma for his encouragement, financial support
and motivation during the study.

iii
ACKNOWLEDGEMENT
I take this opportunity to appreciate my supervisor Mr. Julius Koringura for his valuable
guidance and supervision during writing of the project report, my lecturers for their unreserved
support, constructive scholarly comments and assistance throughout my study at the
University. I would also like to acknowledge the University of Nairobi, School of Distance
and Continuing Education, Eldoret Centre for giving me a chance to learn and undertake this
study. My appreciation also goes to Mr. Raphael Murei and Mary Shitanda for their guidance
during the study. Above all, I thank the Almighty God for giving me good health, guidance
and protection during the study.

iv
TABLE OF CONTENTS
Page
DECLARATION....................................................................................................................... i DEDICATION.......................................................................................................................... ii ACKNOWLEDGEMENT ..................................................................................................... iii TABLE OF CONTENTS ....................................................................................................... iv
LIST OF TABLES ............................................................................................................... viii LIST OF FIGURES ................................................................................................................. x
ACRONYMS AND ABBREVIATIONS ............................................................................... xi ABSTRACT ............................................................................................................................ xii CHAPTER ONE ...................................................................................................................... 1
1.1 Background of the Study .................................................................................................. 1
1.2 Statement of the Problem ................................................................................................. 4
1.3 Purpose of the Study ........................................................................................................ 5
1.4 Objectives of the Study .................................................................................................... 5
1.5 Research Questions .......................................................................................................... 5
1.6 Significance of the Study ................................................................................................. 6
1.7 Basic Assumptions of the study ....................................................................................... 6
1.8 Delimitations of the Study................................................................................................ 6
1.9 Limitations of the Study ................................................................................................... 7
1.10 Definitions of Significant terms used in the study ......................................................... 7
1.11 Organization of the study ............................................................................................... 8 CHAPTER TWO ..................................................................................................................... 9
LITERATURE REVIEW ....................................................................................................... 9
2.1 Introduction ....................................................................................................................... 9
2.2 The Concept of Sustainable Development ....................................................................... 9
2.3 Water Resources Conservation Practices and Sustainability of Community Water Projects ............................................................................................................................ 10
2.4 Training and Sustainability of Community Water Projects ........................................... 13
2.5 Choice of Technology and Sustainability Community Water Projects.......................... 15
2.6 Levels of funding and Sustainability of Community Water Projects............................. 19
2.7 Theoretical Framework .................................................................................................. 22
2.7.1 Resource Dependence Theory ..................................................................................... 23
2.7.2 Citizen Participation Theory ....................................................................................... 23
2.8 Conceptual Framework .................................................................................................. 24
2.9 Research Gap.................................................................................................................. 26
v
CHAPTER THREE ............................................................................................................... 27
RESEARCH DESIGN AND METHODOLOGY ............................................................... 27
3.1 Introduction .................................................................................................................... 27
3.2 Research Design ............................................................................................................. 27
3.3 Target Population ........................................................................................................... 27
3.4 Sampling Size and Sampling Technique ........................................................................ 28
3.5 Research Instruments ..................................................................................................... 30
3.6 Pilot Study ...................................................................................................................... 30
3.7 Validation of Research Instruments ............................................................................... 31
3.8 Reliability of Research Instruments ............................................................................... 31
3.9 Data Collection Procedures ............................................................................................ 32
3.10 Data Analysis Techniques ............................................................................................ 32
3.11 Ethical Considerations.................................................................................................. 32
CHAPTER FOUR .................................................................................................................. 34
DATA ANALYSIS, PRESENTATION AND INTERPRETATION ................................ 34
4.1 Introduction .................................................................................................................... 34
4.2 Questionnaire Return Rate .............................................................................................. 34
4.3 Demographic Characteristics of the Respondents .......................................................... 35
4.3.1 Gender Distribution of Respondent’s .......................................................................... 35
4.3.2Age of the Respondents................................................................................................ 36
4.3.3Level of Education of the Household User Respondents ............................................. 37
4.3.4 Period of Residence of the Household User Respondents .......................................... 39
4.4 Sustainability and Water Supplies .................................................................................. 39
4.4.1 Type of Water Project ................................................................................................. 39
4.4.2 Age of the Community Water Projects ....................................................................... 40
4.4.3 Functionality of the Community Water Projects......................................................... 41
4.4.4 Extent of Sustainability of the Water Supplies ........................................................... 42
4.5 Water Resource Conservation Practices and Sustainability of Community Water Projects ............................................................................................................................ 43
4.5.1 Source /Catchment Area for the Water Projects ......................................................... 43
4.5.2 Community Involvement in Conservation and Protection of Water Catchment Areas ............................................................................................................................... 44
4.5.3 Conservation and Protection of Water Catchment Areas of the Water Projects ......... 45
4.5.4 Water Resource Conservation Practices and Continued Water Supply ...................... 46
4.5.5 Relationship between Water Resource Conservation Practices and Sustainability of the Water Supplies ...................................................................................................... 47

vi
4.6 Training and Sustainability of Community Water Projects ........................................... 48
4.6.1 Training of the Household User Respondents............................................................. 48
4.6.2 Type of Training Received .......................................................................................... 49
4.6.3 Usefulness of Training in Operation and Maintenance ............................................... 50
4.6.4 Extent of Usefulness of Training in O & M ................................................................ 50
4.6.5 Level of Awareness on Training Opportunities .......................................................... 51
4.6.6 Frequency of Training ................................................................................................. 52
4.6.7 Training and Sustainability of Community Water Projects. ....................................... 52
4.6.8 Relationship between Training and Sustainability of Community Water Projects ..... 53
4.7 Technology and Sustainability of Community Water Projects ...................................... 54
4.7.1 Type of Technology .................................................................................................... 54
4.7.2 Community Involvement in Choosing the Technology .............................................. 55
4.7.3 Community Conversancy with the Technology Used................................................. 56
4.7.4 Interruptions of Water Supply as a Result Breakdowns ............................................. 57
4.7.5 Extent of Interruptions ................................................................................................ 57
4.7.6 Availability of Spare Parts .......................................................................................... 58
4.7.7 Affordability of the Spare Parts .................................................................................. 59
4.7.8. Influence of Technology Choice on Sustainability of Community Water Projects ... 59
4.7.9 Relationship between Appropriate Technology Choice and Sustainable Water Projects ............................................................................................................................ 60
4.8 Levels of Funding and Sustainability of Community Water Projects ............................ 61
4.8.1 Source of Funds for Construction of the Water Project .............................................. 61
4.8.2 Community Financial Contribution for Operation and Maintenance of Water Systems ................................................................................................................ 62
4.8.3 User Fees ..................................................................................................................... 62
4.8.4 Level of Funding ......................................................................................................... 63
4.8.5 Funding Levels and Sustainability of Community Water Projects ............................. 64
4.8.6 Relationship between Funding Levels and Sustainability of Community Water Projects ............................................................................................................................ 65
CHAPTER FIVE ................................................................................................................... 66
SUMMARY OF THE FINDINGS, DISCUSSIONS, CONCLUSION AND RECOMMENDATIONS ....................................................................................................... 66
5.1 Introduction .................................................................................................................... 66
5.2 Summary ........................................................................................................................ 66
5.2.1 Water Resources Conservation Practices .................................................................... 66
5.2.2 Training ....................................................................................................................... 67
5.2.3 Choice of Technology ................................................................................................. 68

vii
5.2.4 Levels of Funding........................................................................................................ 69
5.2.5 Correlation between Determinants of Sustainability and Sustainability of Community Water Projects in Webuye East Sub-County, Bungoma, Kenya. ............... 70
5.3 Discussions of the Study Findings ................................................................................. 70
5.3.1 Water Resources Conservation Practices .................................................................... 71
5.3.4 Training ....................................................................................................................... 72
5.3.5 Choice of Technology ................................................................................................. 73
5.3.6 Levels of Funding........................................................................................................ 74
5.4 Conclusions .................................................................................................................... 75
5.5 Recommendations of the study ...................................................................................... 76
5.6 Suggestions for further research ..................................................................................... 77
REFERENCES ....................................................................................................................... 78
APPENDICES ........................................................................................................................ 87
Appendix i: Letter of Transmittal......................................................................................... 87
Appendix ii: Questionnaire for Household Users ................................................................ 87
Appendix iii: Questionnaire for Water Committee Members .............................................. 92
Appendix iv: Interview Schedule for key informant-from the Ministry .............................. 96
Appendix v: Map of Webuye East Sub-County .................................................................. 97 Appendix vi: Community Water Projects in Webuye East
Sub-County ................................................................................................................... 110

viii
LIST OF TABLES
Table 3.1 Target Population ................................................................................................. 28 Table 3.2 Proportionate Sampling of Respondents .............................................................. 29 Table 3.3 Operationalization of Variables Table ................................................................. 33 Table 4.1 Questionnaire Return Rate ................................................................................... 34 Table 4.2 Gender of the Household User Respondents ........................................................ 35 Table 4.3 Gender of the Water Committee Executives ........................................................ 36 Table 4.4 Age Group of the Household User Respondents .................................................. 37 Table 4.5 Level of Education of the Household User Respondents ..................................... 37 Table 4.6 Level of Education of the Management Water Committee Executives ............... 38 Table 4.7 Period of Residence of the Household User Respondents ................................... 39 Table 4.8 Type of Water Project .......................................................................................... 40 Table 4.9 Age of the Community Water Projects ................................................................ 40 Table 4.10 Functionality of the Water Facilities .................................................................... 41 Table 4.11 Sustainability of the Water Facilities ................................................................... 42 Table 4.12 Extent of Sustainability ........................................................................................ 42 Table 4.13 Source/Catchment Area for the Water Projects ................................................... 44 Table 4.14 Community Involvement in Conservation and Protection of Water
Catchment Areas .................................................................................................. 44 Table 4.15 Conservation and Protection Practices ................................................................. 45 Table 4.16 Water Resource Conservation Practices Contribute to Continued Water
Supply ................................................................................................................... 46 Table 4.17 Relationship Between Water Resource Conservation Practices and
Sustainability of the Water Supplies .................................................................... 47 Table 4.17 Conservation Practices Sustainability of the Water Facilities Cross
Tabulation ............................................................................................................. 48 Table 4.18 Training by Household User Respondents ........................................................... 49 Table 4.19 Type of Training ................................................................................................... 49 Table 4.20 Usefulness of Training in O & M ......................................................................... 50 Table 4.21 Extent of Usefulness of Training for O & M ....................................................... 51 Table 4.22 Level of Awareness on Training Opportunities ................................................... 51 Table 4.23 Frequency of Training .......................................................................................... 52 Table 4.24 Extent to which Training Impacts Sustainability of Water Projects .................... 53 Table 4.25 Relationship between Training and Sustainability of Community Water
Projects ................................................................................................................. 54 Table 4.26 Type of Technology Used .................................................................................... 55 Table 4.27 Community Involvement in Choosing the Technology ....................................... 55 Table 4.28 Community Conversant with Technology Used .................................................. 56 Table 4.29 Interruptions as a Result of Breakdowns of the Water System ............................ 57 Table 4.30 Water Interruptions ............................................................................................... 58 Table 4.31 Availability of Spare Parts ................................................................................... 58

ix
Table 4.32 Affordability of the Spare Parts ............................................................................ 59 Table 4.33 Influence of Technology Choice on Sustainability of Water Projects ................. 59 Table 4.34 Relationship between Appropriate Technology Choice and Sustainable Water
Projects ................................................................................................................. 60 Table 4.35 Source of Funds for Construction of Water Projects ............................................ 61 Table 4.36 Community Financial Contribution for Operation and Maintenance .................. 62 Table.4.37 User Fees .............................................................................................................. 63 Table 4.38 Level of Funding .................................................................................................. 63 Table 4.39 Extent to Which Level of Funding Affects Sustainability of Water Projects ...... 64 Table 4.40 Relationship between Funding Levels and Sustainability of Community
Water Projects ...................................................................................................... 65

x
LIST OF FIGURES
Figure 2. 1: Conceptual Framework ...................................................................................... 259

xi
ACRONYMS AND ABBREVIATIONS
CIDA Canadian International Development Agency
DANIDA Danish International Development Agency
EU European Union
EUWI- FWG European Union Water Initiative-Finance Working Group
GWP Global Water Partnership
IFAD International Fund for Agricultural Development
IISD International Institute for Sustainable Development
IWRM Intergrated Water Resource Management
JPM Joint Progress Monitoring
MDG Millennium Development Goals
NACOSTI National Commission for Science, Technology and Innovation
NGO Non- governmental Organization
O& M Operation and Maintenance
OECD Organization for Economic Co-operation and Development
SPSS Statistical Package for Social Sciences
UN United Nations
UNDESA United Nations Department of Economic and Social Affairs
UN-HABITAT United Nations Habitat
UNICEF United Nations Children’s Fund
VLOM Village level Operation and Maintenance
WB World Bank
WCED World Commission on Environment and Development
WHO World Health Organization
WSSD World Summit on Sustainable Development

xii
ABSTRACT
Water is the most important natural resource and a basic human need. In many developing countries as a result of achieving the United Nations Millennium Goal 7c which targeted to reduce the proportion of people without sustainable access to safe water by 50% by year 2015, many Governments in partnership with the communities have invested money in construction and maintenance of the water projects. Despite the numerous water projects initiated, many have failed after a short time leading to unsustainable access to clean safe water. In order to make the investment in water projects more effective, failure rates of the water systems should be reduced. This study purposed to investigate determinants of sustainability of community water projects in Webuye East Sub-County, Bungoma, Kenya. The study was guided by the following objectives; to assess the extent to which water resources conservation practices, training, choice of technology and levels of funding influences sustainability of community water projects. The study employed descriptive survey design. The study targeted population size of 10,000 household users, 300 community water management committee executives and key informant from the Ministry of Water and Irrigation. The sample size of this study was calculated using simplified Yamane formula (1967:886). The study employed both probability and non-probability sampling techniques. The researcher used questionnaires and interview schedule to collect data. Pilot study results were used to test reliability and validity of the instruments. Data was analysed using descriptive statistics and correlation analysis by use of Statistical Package for Social Sciences (SPSS) version 20 and presented using frequency distribution, percentages, tables and Pearson product moment coefficients. With regards to water resources conservation practices, the study established a low community participation level of 36.2%. Findings revealed that afforestation was at 43.1%, pollution management and hygiene practices at 38.2% and management at 18.7%. The study established low level of training at 42.1% of which 38.5% were trained on conservation, 23.8% on management and 37.8% on Operation and Maintenance. The study also found out there are only two technologies used; use of hand pump (3.5%) and use of gravity fed pipes (96.5%). Community participation in choosing the technology was high at 90.3%. 97.1% of the community are conversant with the technology used while 2.9% are not conversant with hand pump technology introduced by the County Government. Findings show that spare parts are readily available but not affordable. It was also established that there is low level of funding, with the community contribution towards construction of the water projects highest at 96.5% while the County Government contribution was at 3.5%, only 16.8% contribute towards operation and maintenance of the water systems. Insufficient financing is a major factor in poor maintenance which leads to project failure. The study established that there is a positive correlation between sustainability of community water projects and water resources conservation practices, training, choice of technology and level of funding ( r=0.959, 0.821, 0.879 and 0.689 respectively)by using Pearson’s Product Moment Correlation (PPMC) analysis. It is recommended that awareness creation on importance of water resources conservation and sensitization on water catchment areas should be done to enhance reliability of the water sources. Stakeholders should raise the level of awareness on available training opportunities regarding conservation, O & M and management to ensure the community is impacted with proper skills and knowledge that enhance water project sustainability. The community and the County Government should explore other modern technologies to pump water to households and train community on how to use the technologies. Prices for spare parts should be subsidized to be affordable. Lastly the County Government should increase level of funding for construction and maintenance of community water projects. The study findings will benefit the County Government, water project financiers and the community in achieving sustainable community water projects.

1
CHAPTER ONE
INTRODUCTION
1.1 Background of the Study
Water is the most important natural resource, indispensable for life and the backbone of
growth and prosperity for mankind (Hutton, Haller & Bartram, 2007). Water is the most basic
need for human health and survival and many refer to water as life. United Nations General
Assembly in 2010 recognized the human right to water and acknowledged that water is
essential to the realization of all human rights. The resolution called upon international
organizations and states to provide financial support, technology and capacity building for
developing countries to access safe clean water. United Nations Department of Economic and
Social Affairs (UNDESA) states that water as a resource is important for sustainable
development and is critical for socio-economic development, healthy ecosystems and for
human survival.
Acknowledging water as a basic human right has lead to international communities and
nations to enhance their efforts to meet the need. The United Nations had formulated
Millennium Development Goals (MDG’s) towards reducing poverty and ensuring sustainable
development. UN MDG 7c targeted to reduce the proportion of people without sustainable
access to safe water by 50% by year 2015, (WHO, 2010).According to progress update and
MDG assessment, (1990 to 2015), access to improved drinking water increased from 76% to
91% of population. Target for water was 90% which was achieved globally. The report also
states that, 147 countries have met the MDG target on safe water, about 2.6 billion people
access safe drinking water since 1990. About 96% of global urban population access safe

2
drinking water compared with 84% of the rural population in 2015. The target of safe
drinking water was met in 2010, ahead of 2015 deadline. Over 90% of the world’s population
have access to improved sources of drinking water. However, the least developed countries
did not meet the target; 663 million people still lack access to improved or safe water.
United Nations World Water Vision 2050, states that by 2050 humanity could have achieved
a water secure world, where every person will have access to adequate quantities of water of
an acceptable quality and from sustainable sources in order to meet their basic needs and
sustain their well-being and development. In 2010, Kenya adopted a new constitution that
enshrines the human right to water and sanitation in Article 43(1d). It states that, ‘every
person has a right to clean and safe water in adequate quantities”.
According to Joint Progress Monitoring (JPM) report for water supply 63% of Kenyans (82%
in urban areas and 57% in rural areas) had access to improved drinking water by 2015. 22%
of Kenyans (45% of urban and 14% of rural dwellers) have access to piped water through
house connection. It estimates that there is a decrease of access to improved water in urban
areas from 92% in 1990 to 82% in 2015 while in rural areas it increased from 33% in 1990 to
57% in 2015.
Water demand has been projected to increase in demand by 55% globally between 2000-2050
(OECD, 2011). According to Kenya National Water Master Plan 2030, the demand for water
in Kenya was at 14% in 2010 and by 2050 it is projected to be at 81%. This is as a result
increase in competition for the scarce resource for Agriculture, electricity generation,
industrial use and domestic use. Climate change also seen to affect the balance between water
demand and water availability. This calls for efforts to ensure sustainable water supplies.

3
Abrams (2000) defines sustainability of water resources as water that continues to be
available for the period for which it was designed. Water availability at the same rate and
quality as the day the project was commissioned, then it is said to be sustainable. He argues
that for water to be sustainable, there must be money spent for repairs, that consumers should
accept the service, source of supplying service must be adequate and the design must be
properly done or constructed. Sustainability of water projects ensures adequate water quantity
and appropriate water quality without compromising the present and future ability to provide
capacity and quality.
Asumani & Danny (2014) recommended seven factors for sustainability of water projects
including; the quantity of water available, quality of water available, capacity of the
infrastructure to produce and supply adequate water continually, capacity of the infrastructure
to produce safe water continually, capacity of infrastructure to function as required at the
design stage, capacity to operate the infrastructure and the realization of service provider
expectation. Well (1998) adopted a criteria of measuring sustainability; effectiveness,
efficiency, equity and replicability.
Haysom (2006) states that improving sustainability of community water supplies ensures
ongoing provision of service which is important in improving people’s health, reducing
burden of carrying water long distances by women and girls and ensures communities live a
life of dignity. Achieving sustainable water supply remains a critical issue globally as
indicated in the recent Sustainable Development Goals. Goal 6 targets to ensure availability
and sustainable management of water and sanitation for all. Sustainability of the water
projects is related to factors such as water resources conservation practices, training, choice
of technology and levels of funding as cited by Carter, Harvey & Casey (2010).

4
1.2 Statement of the Problem
In most of the African countries, water supply systems in rural areas are not operational due
to breakdown and are eventually abandoned. According to World Health Organization
(WHO), it is estimated that 30% to 60 % of existing water supply systems are not operational.
The operation and maintenance of community water projects have been given little attention
in developing countries. International Institute for Environment and Development estimates
that in Africa, 50,000 water supply points have effectively died as a result of failure to plan
for maintenance of infrastructure. Carter et al. (2010) observes that many rural water supply
projects in Sub-Saharan Africa, have not been sustainable as a result of; community
participation levels, poor or lack of freshwater management, community having not owned
the projects, financial costs which the community is not in a position to raise for O&M, lack
of skills to operate and maintain the systems, construction quality been compromised in terms
of technology used, lack of spare parts for repairs and changes in ground water levels
affecting the reliability of water supplies.
In Webuye East Sub-County, the County Government in partnership with the community has
invested money in construction water projects. Despite the numerous water projects initiated,
many have failed after a short time leading to unsustainable access to clean safe water. It has
been observed that increasing coverage of the water projects in the region does not equate to
increased access due to high failure rate of the water systems. Unsustainability of the water
systems poses a challenge to women and children as they have to walk long distances to
access the nearest water points to draw water and at times they are forced to use water from
unsafe sources which has a health risk. In order to make the investment in water projects
more effective, failure rates of the water systems should be reduced. There is therefore a need

5
to find out why there are numerous water projects while the problem of water shortage exists.
Therefore, this study intended to investigate the determinants of sustainability of community
water projects in Webuye East Sub-County, Bungoma, Kenya.
1.3 Purpose of the Study
The purpose of this study was to carry out an in depth study of determinants of sustainability
of community water projects in Webuye East Sub-County, Bungoma, Kenya.
1.4 Objectives of the Study
The study was guided by the following objectives:
1. To assess the extent to which water resources conservation practices affects
sustainability of community water projects in Webuye East Sub-County, Bungoma,
Kenya.
2. To assess the impact of training on sustainability of community water projects in
Webuye East Sub-County, Bungoma, Kenya.
3. To determine how choice of technology affects sustainability of community water
projects in Webuye East Sub-County, Bungoma, Kenya.
4. To assess the extent to which levels of funding influences sustainability of community
water projects in Webuye East Sub-County, Bungoma, Kenya.
1.5 Research Questions
The study intended to answer the following questions:
1. To what extent does water resources conservation practices affects sustainability of
community water projects in Webuye East Sub-County?

6
2. What is the impact of training on sustainability of community water projects in
Webuye East Sub-County?
3. How does choice of technology affect sustainability of community water projects in
Webuye East Sub-County?
4. To what extent does the level of funding influence sustainability of community water
projects in Webuye East Sub-County?
1.6 Significance of the Study
The findings of this study will provide stakeholders with possible indicators of sustainable
water systems and associated factors that need to be given due emphasis in future planning.
This will enable them make informed decisions in the establishment of water projects and
adopt suitable strategies and measures, the community will gain knowledge on the important
role they play in ensuring sustainable water projects, Lastly it will be of great benefit to the
future researchers as it will be a platform for their research and it will add to the existing
body of knowledge in the field area.
1.7 Basic Assumptions of the study
The study assumed that the participants will be available, cooperate and give required
information willingly and honestly.
1.8 Delimitations of the Study
The study was conducted in Webuye East Sub-County, involving Sub-County official in the
Ministry of Water and Irrigation, community water committee executives and household
users. The study was confined on how water resources conservation practices, training,
choice of technology and levels of funding determine sustainability of community water

7
projects in Webuye East Sub-County, Kenya. The study relied on the use questionnaire and
interview schedule as instruments for collection of data.
1.9 Limitations of the Study
The remoteness of the study area and the heavy rains during this period were the major
limitations of the study. The issue of remoteness was countered by engaging a research
assistant from the study area who assisted in data collection. Due to heavy rains and flooding
paths leading to the water springs, the researcher was forced to collect data from homesteads.
1.10 Definitions of Significant terms used in the study
Water resources conservation practices; Refers to strategies and activities to manage fresh
water as a sustainable resource to protect the water environment and to meet current and
future human demand for water.
Training; refers to a process of enhancing stakeholder’s knowledge and skills, changing their
attitudes, values and practices.
Technology in community water projects; refers to the techniques, knowledge, tools
machines, systems used in a water project to achieve a given goal or solve a problem arising
in the construction, operation and maintenance of the water system.
Sustainability of water projects; sustainability of community water projects refers to
management of water resources in the manner that it ensures both the current and future
generations benefit, that acceptable levels of service are available for the current and future
generations.
Water quantity; refers to the mass of water or the discharge in terms of the timing,
frequency and duration.
Functionality; refers to a condition whereby the system provides water to the users.

8
1.11 Organization of the study
The research report is organised into five chapters. Chapter one provides the background
information of the study, statement of the problem, purpose of the study, objectives of the
study, research questions, significance of the study, basic assumptions, delimitations of the
study, limitations and definition of significant terms used in the study. Chapter two covers past
or previous studies in the same field, the theoretical framework and conceptual framework of
the study and the knowledge gap identified. Chapter three covers the following under research
methodology; research design, target population, sample size and sampling procedure,
research instruments, piloting of the instruments, validity and reliability of the research
instruments, data collection procedures, data analysis and ethical considerations in the study.
Chapter four covers data analysis, interpretation and presentation according to the variables of the
study. Chapter five provides a summary of the findings, discussion, conclusions of the study,
recommendations of the study and suggestions for further research.

9
CHAPTER TWO
LITERATURE REVIEW
2.1 Introduction
This chapter critically reviews relevant literature review related to the study. The literature
reviewed in this chapter is in connection with the research objectives of the study. The
chapter also presents a conceptual framework and theoretical framework on which the study
is based.
2.2 The Concept of Sustainable Development
The concept of sustainable development evolved between 1972 and 1992 through a series of
international conferences and initiatives. The UN conference on the Human Environment
held in Stockholm in 1972 being the first international conference to discuss sustainability at
a global scale. In 1983, UN convened a Commission which was created to address the
deterioration of the human environment and natural resources and its consequences on
economic and social development (International Institute for Sustainable Development,
2010).
In 1987, the World Commission on Environment and Development published ‘Our Common
Future’ (or Brundland report). The report popularized the most commonly used definition of
sustainable development; development that meets the needs of current generations without
compromising the ability of the future generations to meet their own needs (WCED, 1987).
Brundland report provided foundation for 1992 Rio Summit, Rio Declaration contained 27
principles of sustainable development including; developed countries acknowledge to have

10
the responsibility to bear the international pursuit of sustainable development. Important
conferences were also held in 1997 (Earth summit) in New York and in 2002 (World
Summit) in Johannesburg to review the progress.
In 2002, WSSD (World Summit on Sustainable Development) demonstrated a major shift in
the perception of the concept sustainable development away from environmental issues to
social and economic development. The shift was accelerated by the needs of the least
developed countries, the Millennium Development Goals and the recent Sustainable
Development goals. According to IFAD Strategic Framework (2007-2010) the concept
sustainability of a project is the ability to ensure benefits of a project are realized and
maintained after the external funding has stopped. Sustainability measures the growth or
expansion, maintenance or degradation of a resource.
Over year the concept has gained wider acceptance by many institutions, NGOS,
governments, private sector and in businesses. Sustainable development worldwide has been
achieved in integrating environmental considerations in economic decision-making. Critics of
sustainable development argue that there has been a problem to measure whether
sustainability has been achieved or not and its level of achievement (strong or weak).
2.3 Water Resources Conservation Practices and Sustainability of Community Water
Projects
Availability and quality of freshwater in many regions around the world is threatened by
overuse, misuse and pollution. As a result of growing imbalance between supply and demand
of water, there is an increasing need for ensuring adequate water quality and quantity. Water
catchment areas include lakes, rivers, underground water, wetlands, forests and mountains.

11
Sustainable forest management is important to ensure supply of good quality freshwater.
Forest ecosystem is the largest renewable freshwater supply source at 57 %. Forests play a
role in ensuring quality, quantity and regularity of water flow. The loss of forest cover can
adversely affect freshwater supplies as they act as water reservoirs. Protection of groundwater
and surface water catchments is important in maintaining quantity and quality of water.
Protection activities include well use of agricultural products such as herbicides, pesticides
and fertilizers. Washing of the chemicals downstream results in water pollution affecting the
quality of water. Change of land use patterns example clearing of forest areas to use for
cultivation purposes can lead to rainfall runoff affecting water quality.
McLyor (2000) urged that the main reason why the water resources are being destroyed is
because majority of people in the communities are passive observers of environmental
degradation but currently communities around the world are beginning to realize the
economic, social, and environmental benefits of water conservation. Planners and water
managers are increasingly moving away from supply-side solutions to meet water demand
(e.g. expanding physical infrastructure, such as pipes, pumps, dams, and reservoirs) Instead,
they are looking toward long-term, comprehensive water management approaches that will
ensure adequate quantities of water for the future.
Brikke & Davis (1995) states that conditions in the environment can have adverse effects on
the quality and quantity of water source. Maintenance of a water supply includes the
protection and conservation of the water source environment. Demand for water is on the
increase while the resource is getting more and more limited globally. World Bank (2010)
estimates that 40% percent increase is expected in water demand over the period of next two
decades. The increase in water demand is as a result of growing population, agriculture,
12
industrialization and for energy production. Therefore to ensure quantity of water is available
to meet the demands, protection and conservation of the sources is very important.
Global Water Partnership (2000) states that Integrated water resource management (IWRM)
is a process that promotes the coordinated development and management of water, land and
related resources, in order to maximize the resultant economic and social welfare in an
equitable manner without compromising the sustainability of vital ecosystems The concept of
IWRM as advanced by the UN encourages coordinated sustainable management of water
resources among all water users. However, according to Victor (2013)
the optimism about IWRM must be tempered by realities about how integration across
different industries and political systems might be achieved. Further, IWRM is a repetitive
process of managing water resources. It needs coordinated efforts and engaging relevant
stakeholders.
The World Summit on Sustainable Development (WSSD) held in Johannesburg, South
Africa, in 2002 put IWRM at the top of the international agenda. The IWRM was included as
one of the key components for achieving sustainable development. Since 2002, IWRM has
marked a fundamental shift away from the traditional top-down, supply-led solutions to water
problems dominated by technology (McDonnell, 2008). This where the issue of paying water
use fees and maintenance costs is significant in sustaining IWRM. The 2012 United Nations
survey revealed that over 50% of African countries are implementing national plans for
IWRM while 75% are on course in the implementation of water laws in line with African
Water Vision for 2025. The report shows that 18 of the 40 countries that responded have
IWRM plans under implementation compared to 2008 when 5 countries, out of the 16 that
responded had IWRM plans (UN Water report, 2012).

13
Mwangi (2014) In the study of determinants of sustainability of community water projects in
Kieni East District, Nyeri County, found out that in communities which practiced adequate
water conservation interventions including storage reservoirs, roof water harvesting and
fencing around water sources had more reliable water sources in quality and quantity than
those who sparingly practiced.
2.4 Training and Sustainability of Community Water Projects
Training of community members and water committee members play a critical role in
ensuring sustainability of water projects. Training provides knowledge and skills on how to
operate and maintain the water systems. Komives, Akanbang, Thorsten, Tuffuor, Wakeman,
Larbi, Bakalian & Whittington (2008) states that training of community water caretakers by
water agencies and technical experts has always resulted in proper Operation and
Maintenance ( O & M) leading to sustainable water systems. Many community members
always need guidance and support on managing the water systems. Training provides
knowledge and skills on how to operate and maintain the water systems and also increase
awareness of the community members about willingness to sustain the water systems. If a
water system is to operate efficiently, properly and continuously, skilled personnel are
needed. Availability of trained personnel in charge of operations, inspection, monitoring and
maintenance is important to ensure sustainable water. Ong’wen (2014) recommended that
trainings need to be frequent and education level of the community members should be
considered to choose the best mode of training and the language to be used to ensure effective
learning.
Beyene (2012) in the study of factors affecting the sustainability of rural water supply
systems in Ethiopia, shows that where the household users and the water committee members

14
were trained most of the water systems were functional and where no training was conducted
the water projects were not functioning. This shows that training play a great role in ensuring
sustainability.
Sarah & Katz (1997) in their study on Making Rural Water Sustainable established that
household training plays a key role in ensuring sustainability of water systems. Communities
lack capacity to operate and maintain the water projects. Projects that received training on
O& M and hygiene had higher sustainability compared to projects that did not receive
training. He states that training impacts knowledge and skills on how to operate the systems
and do repairs, training on O &M informs communities of what expectations they should
have for their system, how to identify and address minor problems on the system and
educates the users that the responsibility for maintaining the system rests with them. Training
on hygiene issues informs people on health benefits of protecting the water source and this
may affect how people value the water sources and increases their satisfaction and
willingness to sustain the water system.
Karanja (2014) carried out a study on the influence of management practices on sustainability
of youth income generating projects in Kangema District, Murang’a County, Kenya. The
study revealed that appropriate training influence the sustainability of the youth projects. The
study recommends that, the youths should be provided with comprehensive, quality and
convenient training on project planning, implementation and post- implementation of income
generating projects.
Mimrose, Gunawardena & Nayakakorala (2011) carried out an assessment of sustainability of
community water supply projects in Kandy District. 20 community managed water schemes

15
in eight Divisional Secretariat divisions in Kandy district were assessed to determine the
sustainability of community based rural water supply projects. The results show that the
community water supply projects to provide water to rural areas of Kandy district has been a
success since 14 out of 20 schemes were found to be sustainable indicating that the strategies
followed during the project implementation have succeeded. However, the study has also
highlighted areas which require further attention to ensure that these systems would continue
to provide the expected services and improve the functioning of other potentially sustainable
schemes in the long run. A capacity building program along with an institutional arrangement
to provide the support services by the authorities, at least in the short term, is considered vital
to help improve the Community Based Organizations and to make them capable and mature
entities
Tifow (2013) carried out a study on factors influencing sustainability of rural water supplies
in Kenya: (Case of UNICEF supported rural water projects in Lake Victoria south and Lake
Victoria north water ). The study findings indicate lack of training on the management of the
projects contributed majorly to the failure of sustainability. The study recommends the water
sector to develop training packages and models for training communities and middle level
trainers of trainers to improve sustainability of rural water supplies.
2.5 Choice of Technology and Sustainability Community Water Projects.
Brikke & Bredero (2003) points out that the choice of technology to be used in water projects
can have far-reaching consequences on the sustainability of the water services .They suggest
an affordable, simple, appropriate, alternative, village technology, self-help and low-cost
technology should be used in O &M of community water projects .Effective O&M is of great
benefit as it contributes towards sustainable access of water supplies in adequate quantity and

16
quality; by reducing the time and effort spent on water collection. When choosing a
technology to be used factors to be considered should include its complexity, the technical
capacity of the system to respond to demand and provide the desired service level, the
technical skills needed to operate and maintain the system, the availability, accessibility and
cost of spare parts, the overall costs of O&M.
Taylor & Mudege (1996) states that technology choice is very important in ensuring
sustainable rural water supply because the type of technology affects O &M. Proper operation
and maintenance of community water supply systems is important for sustainability of the
water project. Musonga (2004) states that technology should be socially acceptable,
economically sustainable, environmentally sound and technically effective. Haysom (2006)
points out that the use of appropriate technologies which are of low cost, easy to maintain,
easy to use and readily available ensures water project sustainability. He also argues that
appropriate technologies are intergral concept of village level O &M (VLOM) which
emerged in Water Decade (1981-1990). VLOM ensures beneficiary participation in selection
of technologies to be used creating a sense of ownership. Webster, Dejachew, Tseion,
Mehari, & Tesfaye (1999) does not support the VLOM concept by arguing that it does not
recognise contribution of external support from the Government and other agencies in
achieving sustainability.
Roark, Yacoob & Roark (1989) categorises water technologies in two; Water provision
methods which includes; spring, dug well, drilled well, dam and catchment. The other
category is water lifting or conveyance methods which include; gravity fed pipeline, hand
pump, diesel engine, solar pump and windmill. They suggest that when choosing a
technology to be used in water projects one should consider water quality(conditions of water

17
source), reliability(frequency of breakdowns), construction techniques( degree of
complexity), construction costs(installing the system),maintenance techniques(expertise and
spare parts required),maintenance cost(cost of operating and maintaining a system)and
operations management (management, organization and financial management).
Brikke & Davis (1995) noted that lack of spare parts has been a major constraint in the
sustainability of water supplies. In some community water projects, it has resulted to the
complete abandonment of water systems. Spare parts are all those materials and tools
(lubricants, chemicals, electrical and mechanical parts) that are very important in ensuring
efficient and sustainable operation of the technical components of a water supply. Spare parts
affordability and availability should be considered when selecting the technology to be used.
Donnelly (1987) argues that there is no community that is self-sufficient, it must interact with
other agencies to meet their needs. Community’s need for spare parts to repair water systems
which are usually imported or purchased from businessmen. For example a water project
using a pump, the community needs to be trained on the technology used to ensure
sustainability. He states that ongoing operations and maintenance of a given water system is
an indicator of sustainability. O & M requires technical skills to repair the water systems and
he observes that on projects where successfully O & M has been done, it has resulted into
sustainable projects.
Brikke & Bredero (2003) came up with factors that influence the selection of community
water-supply technology. Technical factors include dependence on fuel or power, quality and
durability of materials, availability of spare parts, O &M requirements, compatibility with
user’s expectations and preferences, availability of trained personnel within the community,

18
availability of mechanics, carpenters and masons, potential local manufacturing and potential
for standardization. Environmental factors including availability accessibility and reliability
of water sources (springs, ground water, rainwater, surface water, streams, lakes and ponds),
seasonal variations, water quality and treatment, water source protection and negative
environmental impact. Institutional factors includes; roles of different stakeholders,
availability of local artisans, training and follow-up, availability and capacity of training,
skills requirement and monitoring. Community and managerial factors including; local
economy, managerial capacity, availability of technical skills and ownership. Lastly, financial
factors includes; capital costs, budget allocations, financial participation of users, local
economy, financial management, tariff design, cost of spare parts, recurrent costs.
Tafara (2013) in the study of factors influencing sustainability of rural community based
water projects in Mtito Andei, Kibwezi Sub-county, found out that factors affecting
continued water supply included breakdown of generator pumps, breakage of pipes,
vandalism and blockages of pipes. Local people lacked adequate skills to maintain the water
systems. He points out that ensuring that local people have adequate skills and capacity to
maintain water projects is important in ensuring sustainability of water projects.
Beyene (2012) in his study found out wrong choice of technology led to failure of Kuyu-Rim
water supply system. The pipes did not fit well with the water pump, as the pressure of water
pumped is greater than the size of the pipe and this led to breakages.
Musonga (2004) in the study of Issues Regarding Sustainability of Rural Water Supply in
Zambia noted that Africare was involved in rehabilitating of water supply facilities and water
system in Munjili community was not functioning as the system had not been repaired for 2

19
weeks. This was as a result of the inability of the community to finance repairs and get
technical capacity from the community and even the trained members were not in a position
to do repairs and they needed external support.
2.6 Levels of funding and Sustainability of Community Water Projects
Raising of adequate funds for maintaining water systems and activities is important to
achieving sustainability. Insufficient financing is a major factor in poor maintenance which
leads to project failure. The commitment of financial resources by beneficiary communities is
a clear indicator of the expected value of the project to the community members. Capital
costs are necessary for purchasing equipment, materials and paying labour services for
construction of the projects while recurrent costs cover operations, maintenance, repair, and
replacement of system components and community extension activities.
European Union Water Initiative-Finance Working Group (2012) states that public financing
for water could take different forms including; including allocations from annual budgets,
loans for infrastructure development from governments, external finance like EU and WB,
subsidies targeted at water users or service providers including self-initiatives and public
guarantees for loans. Water services tend to recover part of their costs from consumers. For
developing countries, external finance is always the largest source of capital for investment in
water projects.
In Africa, according to Africa Water Vision 2025, financial investment required per year is
about USD 20 billion in the water sector. Most water financing systems are based on
political, bureaucratic and legal pressures. EUWI 2012 states that in Zambia, financing of
water resources is through; recovering costs from users for direct services, use of public

20
finance for public good, use of external grants and loans, from commercial sources, revenues
such as polluters, penalties which are returned the government .In Ghana the constraint to
water development is lack of adequate financial resources. The budget falls far below the
required levels. The main donors to water sector in Ghana have been CIDA, DANIDA, EU,
UN-HABITAT and UNICEF. South Africa gains revenue through licensing fees and license
application fees, it also has polluter pay principle, state budgetary allocations have been a
source of capital for investment for water projects.
Charity Water as a non-profit organization funds water programs in 24 countries around the
world- in Asia, Africa, Central and South America. The organization has funded 13,641
projects, benefiting over 4.6 million people. Over $155 million as at the end of 2014 was
raised. The organization funds construction of new wells and fund existing ones to ensure
that water projects continue to provide clean water to communities long after they are
installed. Up to 30% of the funds go to training and educating the community about how to
maintain the wells on their own. This promotes sense of ownership of the projects. They are
trained on how to make minor repairs and the organization ensures funding for maintenance
is adequate. Charity water has ensured sustainable water supply in Central African Republic
by partnering with the communities, communities are asked to pay $8 to help support repair
costs but for those who cannot afford pay in kind. In India, Charity water has tried a new
approach of investing in local entrepreneurs to repair broken wells as a business for them and
this has led to sustainability of the projects.
According to the Annual Water review 2013-2014, Investment in Kenyan urban water and
sanitation was 12 billion compared to and investment need of around 75billion. The main
sources of funds in Kenya for water sector is the government budget, donor funding and

21
voluntary contribution from the communities. In 2013/14, Kenya depended on external
donors for over 94% of the total investment. World Bank is the largest external source of
financing for water projects in the world totalling to US$7.5 billion in FY 11, comprising
53% for water supply and sanitation 12.5% for irrigation and drainage, 23.5% for
hydropower and 9.9% for flood protection.Water.org has been providing financial support to
Ethiopia, Ghana, Kenya (Kisumu), In Uganda (Kampala) Water.org also supports water
projects in India, Bangladesh, Indonesia, Philippines.
Brikke & Rojas (2001) points out sources finance for community water projects. Voluntary
funds by voluntary contributions from the members of the community through public meeting
and social activities, these funds could be used construction and repairs on the water systems.
The communities in some regions also fund their water projects through community revenue
from other productive activities, some households contribute to construction and repairs in
kind, by providing voluntary labour for trench digging, transport and providing materials
such as sand.
Musonga (2004) is his study found out that Munjili community was unable to meet the cost
of spare parts as poverty levels were high. They could only meet costs of less expensive spare
parts as valves and lubricants but they could not afford pipes, rods and cylinder heads leading
to non functional systems. Munyui (2014) carried out a study on factors influencing
sustainability of community water projects: a case of Kitui West Sub County, Kitui County.
The study indicated that the national governments and Non-governmental Organization had
invested large sums of money over years developing community water projects to address the
problem of accessibility of water, but the aspect of sustainability of the water projects is left
in the hands of the community resulting to high failure rates of these projects. The study

22
established that sustainability of community water projects in Kitui West Sub County was
being influenced though differently by community participation, technology, management
and financial factors. The research also established that failure by communities and other
stakeholders to take up ownership of projects have plunged community projects into immense
financial huddles threatening the sustainability and hence threatening them to seize
operations daily. Managerial training of management committees, managerial capacity of
management committees, technical training of management committees and financial support
for payments of operations and maintenance services significantly influenced sustainability of
community water projects in Kitui West Sub County. The study recommends that policy
makers should formulate policies aimed at addressing capacity building of management
committees in terms of managerial and technical aspects. Policy makers should also
formulate policies to address sustainable financing of operations and maintenance of
community water projects (Munyui, 2014).
Okemwa & Wanyoike (2015) in the study on Influence of Integrated Water Resources
Management approach on Sustainability of water projects in Lake Naivasha Basin concluded
that treating water as an economic and social good, contributes towards continuous water
supply ensuring project sustainability. They argue that paying water use fees is very
important in water project ownership and promotes its sustainability.
2.7 Theoretical Framework
A theoretical framework is a collection of interrelated ideas based on theories. It accounts for
or explains phenomena. The study was based on Resource Dependency theory and citizen
participation theory.

23
2.7.1 Resource Dependence Theory
The study was based on Resource Dependence Theory developed by Pfeffer and Salancik
(1978).The theory is based upon how organizations depend on resources; it argues that
resources originate from an organization’s external environment which affects the behaviour
of the organization that dependent on resources. According to the theory, organizations
depend on resources for their survival or maintenance which is sustainability.
(Davis & Cobb,2010). For any project to achieve its sustainability resources are very
important and these resources include financial and human resources.
The theory relates to this study in that in establishment, operation, maintenance and
management of community water projects, resources are needed in order for the water
projects to be sustainable. Resources include human resource, finances, spare parts for repairs
and experts to offer training to the community. There is no community that is self-sufficient
and therefore there is need to involve other stakeholders to ensure project sustainability.
2.7.2 Citizen Participation Theory
The history of citizen participation was institutionalized in the mid 1960’s with President
Lydon Johnson’s Great Society Programs. It is traced in ancient Greece and colonial England
when government procedures were designed to accelerate external participation. The theory
states that participation is necessary in community development activities. Citizen
participation is a process where individuals are given opportunities to take part in decision
making process in a democratic way. This is based on the assumption that those who are
affected by a given decision have a right to participate in the making of the decision. Citizen
participation approach has widely been used in management of forests.
(Cogan & Sharpe, 1986).

24
In the study, communities were involved in choice of technology to be used especially in
projects initiated by the community but they were not involved in choosing the technology in
projects initiated by the County Government. Communities were involved in financing of the
water projects and water resources conservation practices that contributed towards
sustainability.
2.8 Conceptual Framework
According to Mugenda & Mugenda (2003) a conceptual framework is a hypothesized model
that identifies the concepts under study and their relationships. It presents in a diagrammatic
form the way the researcher has conceptualized the relationship between the independent and
dependent variables. The independent variables are arranged on the left while the dependent
variable is on the right of the diagram in Figure 2.1

25
Independent variables (Determinants) Dependent variable
Figure 2. 1: Conceptual framework
Water resource conservation practices -Water catchment areas/water sources -Stakeholders participation -Conservation practices
Levels of funding -Sources of funding -Levels of funding -Community contribution for O & M -User fees
Choice of Technology -Technology used in lifting and conveyance -Community involvement in technology choice -Community conversancy of technology -Water interruptions -Availability and affordability of spare parts
Training (Household users and Water management committee executives) -Type of training -Usefulness of training in O & M -Level of awareness on training opportunities -Frequency of trainings
Sustainability of Community water projects -Continued adequate water quantity supply -Functionality of the water
systems
Moderating variable -Climate change -High population
-

26
As indicated in the figure 2.1 above, Independent variables are Water resource conservation
practices, training, choice of technology and levels of funding. The dependent variable is
sustainability of water projects and the moderating variables are climate change and high
population. The relationship between the independent and dependent variables could be
affected by the moderating variables which will not be measured in the study.
2.9 Research Gap
Literature reviewed provided an analysis of determinants of sustainability of community
water projects including; water resources conservation practices, training, choice of
technology and level of funding. Literature reviewed from previous studies indicate that there
is a knowledge gap, little has been done on variables such as water resources conservation
practices, training, choice of technology, and levels of funding on sustainability of
community water projects. Therefore the study was conducted to fill pertinent knowledge
gaps in literature as it covered additional variables.

27
CHAPTER THREE
RESEARCH DESIGN AND METHODOLOGY
3.1 Introduction
This chapter outlines the Research design and methodology that was employed to the study. The
chapter covers research design, target population, sample size and sampling procedure,
research instruments, piloting of the instruments, validity and reliability of the instruments,
data collection procedure, data analysis techniques and ethical considerations in the study.
3.2 Research Design
This study adopted descriptive survey design. It attempts to describe characteristics of a
particular phenomenon, situation, of an individual or a group (Kothari, 2004). It involves
studying a situation as it is, in an attempt to explain why the situation is the way it is.
(Wierman, 1999).The researcher considered it most the appropriate in examining
determinants of sustainability of community water projects since it permits gathering of
information on a large population and allows generalization of results from the sample to the
larger target population, it is also an approach that allows to collect both qualitative and
quantitative data. It is relatively quick and inexpensive considering the researcher’s limited
resources.
3.3 Target Population
Target population is a complete set of individuals, cases or objects with some common
observable characteristics (Mugenda & Mugenda, 1999). This study targeted the water
management committee executives, the household water users and an official in the Ministry of

28
Water and Irrigation in Webuye East Sub-county. The Sub-County has approximately 100
community water management committees and each is made up of three executive officials
including the chairman, secretary and treasurer. An estimated population of 10,000 household
users are served by the community water projects. Therefore the target population units for the
study consisted of; 10,000 household users, 300 community water management committee
executives and 1 official in the Ministry of water and Irrigation. Consequently the target
population for this study was 10,301 respondents as represented in the table 3.1
Table 3.1: Target Population
Strata Target Population
Community water management
committee executives
300
Household users 10000
Ministry of water official 1
Total 10,301
3.4 Sampling Size and Sampling Technique
Sampling is the process of systematically selecting representative elements of a population
(Kothari, 2014). The sample size of this study was calculated using simplified Yamane
formula (1967:886) below. 95% confidence level and 5% error is assumed
n = N 1+N (e)2
Where;
n = Sample size
N = Population size (10,301)
e = Sampling error

29
Sample size for the respondents
n = 10301 1+10301 (0.05)2
The sample size of respondents was 382.
Table 3. 2: Proportionate Sampling of Respondents Strata Target Sampling procedure Sample
Community water committee
executives
300 300/10301*382 11
Household users 10000 10000/10301*382 370
Ministry of water official 1 1/10301*382 1
Total 10301 10301/10301*382 382
Using simplified Yamane formula (1967:886) above, the sample size for the community
water projects was 80. The researcher employed Simple Random Sampling in selecting the
community water projects. The researcher selected 370 household users by convenience
sampling, which involves selection of cases as they become available. The advantage of this
method is that subjects are easily and conveniently available and accessible as they come to
collect water. Purposive sampling was used to select 11 executive committee members and an
official from the Ministry of Water and Irrigation. Purposive sampling is a technique that
allows a researcher to use cases that have required information with respect to the objectives
in the study (Mugenda & Mugenda, 2003).

30
3.5 Research Instruments
The researcher used questionnaires to collect quantitative data from water management
committee executives and the household users. A questionnaire is a research instrument that
gathers data over a large sample and therefore can enable generalizations. (Mugenda &
Mugenda,2003). The researcher used two types of questionnaires, one for the water
management committee executives and the other for household users. The questionnaires
consisted of both open and closed form of questions. Qualitative data was collected using
interview guide from the key informant from the Ministry of Water and Irrigation at the Sub-
County level. According Ong’ondo & Jwan (2011) interviews are intended to get to what the
participant in the study thinks, the attitudes of that person or explore person’s reasons for
thinking in a certain way. Interviews are flexible, take care of sensitive remarks and have
high rate of response. The interview guide was developed by the researcher in accordance
with the set objectives.
3.6 Pilot Study
Orodho (2004) states that pilot testing is a smaller version of a large study that is conducted
in order to prepare for the study and to provide a basis for the design. According to Mugenda
& Mugenda (2003) pilot study enables the researcher to incorporate suggestions made by the
respondents to improve the questionnaire and also evaluate the methods of analysis, if they
are appropriate or not. He states that a pilot size of between 1% and 10% is considered
appropriate. Before the research instruments were finally administered to the targeted
sampled respondents, pre-testing was carried out to assess their validity and reliability. It was
conducted among selected community water projects in the neighbouring Webuye West Sub-
County. The researcher employed a sample size of 5% of the required sample size in
pretesting (4 water management committee executives and 16 household users). Questions

31
were checked to ensure they were relevant, understandable and the wording, structure and
sequence were also checked. Piloting assisted the researcher in reviewing and adjusting the
research instruments appropriately.
3.7 Validation of Research Instruments
Validity is the measure of accuracy of data obtained from the instruments used in the study
(Mugenda & Mugenda, 1999). In this study piloting was used to determine accuracy, clarity
and suitability of the instruments. Based on pilot study results, rectifications and
modifications were made to the research instruments. The instruments were assessed for
content validity. Content validity was done to ensure the instruments cover exhaustively the
study objectives, content logically get at the intended variable and have an appropriate
format. The instruments were given to the supervisor and lecturers in the department to assess
their validity. Final instruments to be used for data collection put into consideration the
contribution of made.
3.8 Reliability of Research Instruments
The researcher used the split half method to test reliability of the research instruments. It involves
scoring two-halves of a test separately for each item and then calculating a correlation coefficient
for the two sets of the scores. The split-half method was preferred because it was a simple to
use, time and cost effective. The researcher used SPSS to compute Pearson’s product moment
correlation coefficient (0.84).According to Orodho (2004) a correlation coefficient of about
0.84 should be considered strong enough to judge the instrument as reliable for a study.
32
3.9 Data Collection Procedures
The researcher obtained a research permit from NACOSTI and a letter from the University
An introductory letter was attached to the questionnaire to inform the participants on the
purpose and significance of the information that they provided and assuring them
confidentiality. The researcher then contacted the various water management committee
executives and set up appointments. The researcher first trained the research assistant on how
to use the instruments, then administered the questionnaires together with the research
assistant to the household users and the committee executives. The researcher personally
conducted the interview to an official from the Ministry of Water and Irrigation at the Sub-
County level.
3.10 Data Analysis Techniques
Data analysis is the process of creating order, structure and meaning to the mass of
information collected (Mugenda, 2003). Data collected was first cleaned to identify missing
data, identify errors and corrections were made. Then data coding was done to translate other
types of data into numeric codes. Descriptive statistics and correlations analysis was used to
analyse raw data by using Statistical Package for Social Sciences version 20.0 and data was
presented using frequency distribution, tables, percentages and Pearson product moment
coefficients. Pearson’s correlation was used to determine the degree of relationship between
the independent and dependent variables.
3.11 Ethical Considerations
The researcher upheld ethical issues in the study and this included; obtaining consent from
National Commission for Science, Technology and Innovation and sought permission from
the University of Nairobi and was granted a letter to allow the researcher carry out the

33
research. The researcher obtained informed consent from the participants and assured them of
anonymity and confidentiality.
Table 3. 3: Operationalization of Variables Table
Objective Variable Measuring Indicators Data collection methods
Scale Method of data analysis
To assess the extent to which water resources conservation practices affects sustainability of community water projects
Water resources conservation practices
-Sources of water/ catchment areas -Stakeholders participation -Conservation/ protection practices
Questionnaire and interview guide
Nominal Ordinal
-Descriptive analysis -Correlation analysis
To assess the impact of training on sustainability of community water projects
Training of Household users and water management committee executives
-Types of training -Usefulness of training in O & M -Level of awareness on training opportunities - Frequency of trainings
Questionnaire and interview guide
Nominal Ordinal
-Descriptive analysis -Correlation analysis
To determine how choice of technology affects sustainability of community water
Choice of Technology
-Technology used(lifting or conveyance) -Community involvement in choice of technology -Community conversancy -Water interruptions -Availability and affordability of spare parts
Questionnaire and interview guide
Nominal Ordinal
-Descriptive analysis -Correlation analysis
To assess the extent to which levels of funding affects sustainability of community water projects
Levels of funding
-Sources of funding -Levels of funding - Community contribution for O & M -User fees
Questionnaire and interview guide
Nominal Ordinal
-Descriptive analysis -Correlation analysis

34
CHAPTER FOUR
DATA ANALYSIS, PRESENTATION AND INTERPRETATION
4.1 Introduction
This chapter provides data analysis, presentation and interpretation. Raw data was organized
and analyzed using descriptive statistics and correlations using Computer Software Statistical
Package for Social Sciences version 20 according to the objectives of the study. The analyzed
data is presented using frequency distribution, percentages, cross tabulations, narratives,
interpretation and explanations of the findings on the Determinants of Sustainability of
Community Water Projects in Webuye East Sub-County.
4.2 Questionnaire Return Rate
Bobbie (2002) defines questionnaire return rate as the proportion of the questionnaires
returned after they are issued and filled by the respondents. He states that a questionnaire
return rate of 50% and above is sufficient for analysis. Questionnaires were administered to a
sample of 11 management committee executives and 370 household user respondents.
Response rate for management committee executives was 100% while response rate for
household user respondents is given in the Table 4.1 below.
Table 4.1: Questionnaire Return Rate
Questionnaire Return Rate Frequency Percent Cumulative Percent
Returned Questionnaires 340 91.9 91.9 Unreturned Questionnaires 30 8.1 100.0 Total 370 100.0

35
Household user respondents’ response rate was at 91.9%. High response rate can be
attributed to the data collection procedure, where the researcher personally administered
questionnaires with the help of a research assistant .It is also as a result of willingness of the
respondents to participate in the survey. 30 (8.1 %) of the questionnaires that were not
returned were due to unavailability of respondents at that time of collection and the heavy
rains that resulted in impassable roads.
4.3 Demographic Characteristics of the Respondents
The study sought to establish information on the respondents’ background information
including gender, age distribution, education level and period of residence. This information
is presented in Tables 4.2 to 4.7. This information was important in establishing
appropriateness of the respondents in answering questions regarding determinants of
sustainability of community water projects in Webuye East Sub-County.
4.3.1 Gender Distribution of Respondent’s
The study sought to establish the gender of the respondent’s. Table 4.2 shows the gender
distribution of the household user respondents.
Table 4.2: Gender of the Household User Respondents
Gender Frequency Percent Cumulative Percent
Male 80 23.5 23.5 Female 260 76.5 100.0 Total 340 100.0
From the findings as shown in table 4.2, majority of the household user respondents were
female 260 (76.5 %) and the minority were male (23.5 %). The findings show that female are
more involved in water issues than men because of their gender roles that confine women to

36
household chores such as fetching water. This made it possible to involve more women in the
survey as they were easily found at water points. Few men are involved as the roles are
changing. Fetching water as a responsibility continues to be shared between women and men.
This could have a significant role in operation and management of the water projects
affecting the sustainability of the projects.
The study also sought to find out gender distribution in water management executive
positions in the 11 water management committees.
Table 4.3: Gender of the Water Committee Executives
Gender Distribution Frequency Percent Cumulative Percent
Equal distribution 4 36.4 36.4 Male dominance 1 9.1 45.5 Female dominance 6 54.5 100.0 Total 11 100.0
From the findings as shown in Table 4.3.2, female dominance was at 54.5 % which is the
highest and male dominance the lowest at 9.1 %. This indicates that female have been given
chance in leadership on water committees as women are the most affected by water scarcity
issues.
4.3.2 Age of the Respondents
The study sought to find out the age group of the household user respondents. Table 4.4 presents
the Age groups.

37
Table 4.4: Age Group of the Household User Respondents
Age Frequency Percent Cumulative Percent
20-30 years 133 39.1 39.1 31-40 years 100 29.4 68.5 41-50 years 41 12.1 80.6 51-60 years 36 10.6 91.2 over 60 years 30 8.8 100.0 Total 340 100.0
Among the household user respondents 133(39.1 %) was aged between 20- 30 years, 100 (29.4
%) were aged between 31-40 years, 41(12.1 %) were aged between 41- 50 years, 36(10.6 %)
were aged between 51-60 years and 30(8.8 %) were over 60 years. The findings indicates that the
most dominant age group in this community was between the ages 20 - 40 years and it is the age
that is actively involved in fetching water as a responsibility. This dominant group was very vital
in the survey as it was more informed on current issues concerning water projects in this
community than the age between 41 and above.
4.3.3 Level of Education of the Household User Respondents
The study sought to find out the level of education of the respondents. The findings are shown in
Table 4.5 below.
Table 4.5 : Level of Education of the Household User Respondents
Level of Education Frequency Percent Cumulative Percent
Never attended school 5 1.5 1.5
Primary level 107 31.5 32.9 Secondary level 195 57.4 90.3 College/ University level 33 9.7 100.0 Total 340 100.0
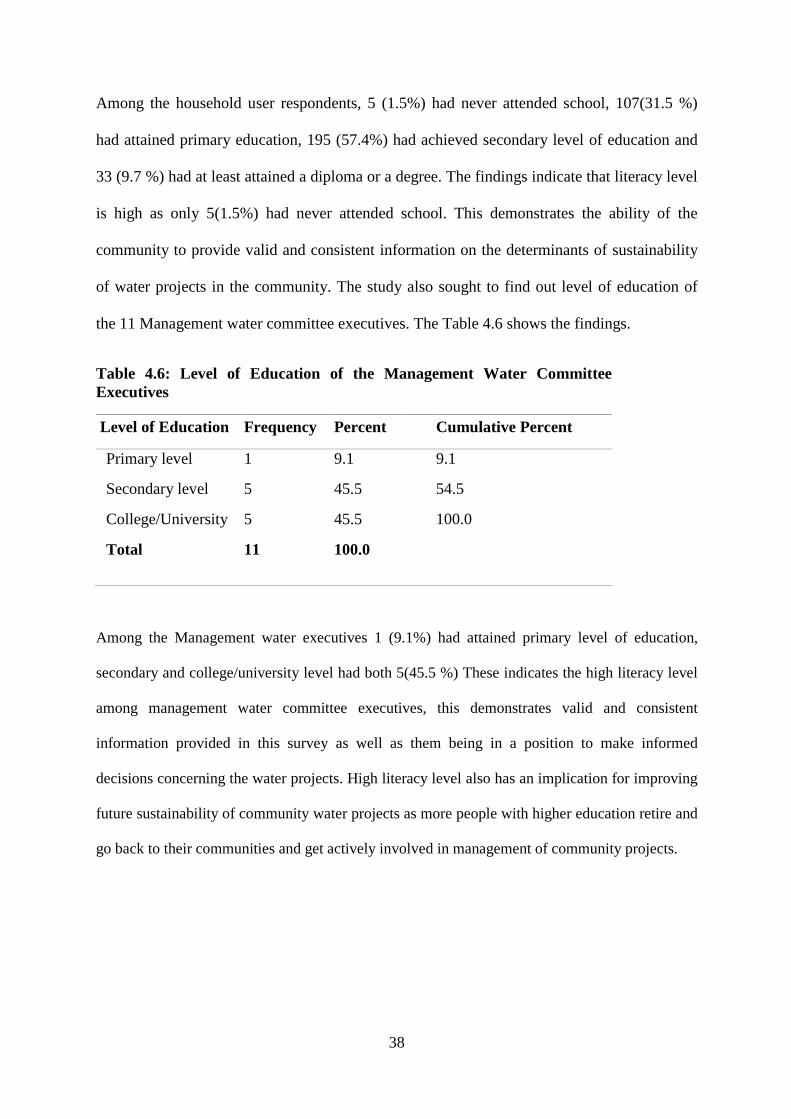
38
Among the household user respondents, 5 (1.5%) had never attended school, 107(31.5 %)
had attained primary education, 195 (57.4%) had achieved secondary level of education and
33 (9.7 %) had at least attained a diploma or a degree. The findings indicate that literacy level
is high as only 5(1.5%) had never attended school. This demonstrates the ability of the
community to provide valid and consistent information on the determinants of sustainability
of water projects in the community. The study also sought to find out level of education of
the 11 Management water committee executives. The Table 4.6 shows the findings.
Table 4.6: Level of Education of the Management Water Committee Executives
Level of Education Frequency Percent Cumulative Percent
Primary level 1 9.1 9.1
Secondary level 5 45.5 54.5
College/University 5 45.5 100.0
Total 11 100.0
Among the Management water executives 1 (9.1%) had attained primary level of education,
secondary and college/university level had both 5(45.5 %) These indicates the high literacy level
among management water committee executives, this demonstrates valid and consistent
information provided in this survey as well as them being in a position to make informed
decisions concerning the water projects. High literacy level also has an implication for improving
future sustainability of community water projects as more people with higher education retire and
go back to their communities and get actively involved in management of community projects.

39
4.3.4 Period of Residence of the Household User Respondents
The study sought to find out for how long the household user respondents had lived in
Webuye East Sub-County. Table 4.6.1 below shows the findings;
Table 4.7 : Period of Residence of the Household User Respondents
Period of Residence Frequency Percent Cumulative Percent
Less than 6 months 13 3.8 3.8 6 months - 1 year 17 5.0 8.8 1-5 years 106 31.2 40.0 over 5 years 204 60.0 100.0 Total 340 100.0
From the findings, 13 (3.8%) of the respondents had stayed in the community for less than 6
months, 17 (5 %) between 6 months to 1 year, 106 (31.2 %) had been resident for a period of
1-5 years and 204 (60%) for over 5 years. This indicates that most of the respondents had
been residents long enough to give credible information about the community water projects.
4.4 Sustainability and Water Supplies
The study sought to find out the operational status and the sustainability of the community
water projects. The household user respondents were asked concerning the type of the water
project, when it was developed, if it is functioning or not and opinions on whether the water
supply is sustainable or not.
4.4.1 Type of Water Project
The study aimed at finding out the types of community water projects in the region. The table
below shows the findings;

40
Table 4.8: Type of Water Project
Type Frequency Percent Cumulative Percent
Borehole 12 3.5 3.5
Spring 328 96.5 100.0 Total 340 100.0
From the household user respondents, 12(3.5%) collect water from the community boreholes
and 328(96.5%) from community water springs. According to an official from the Ministry of
water and irrigation at the sub-county level, most of the boreholes have been drilled by the
county government. The researcher sought to find out types of the water projects as this could
contribute towards the sustainability depending on how the water is extracted.
4.4.2 Age of the Community Water Projects
The household user respondents were asked to indicate when their respective water supplies
facilities were developed. Their responses were as shown in Table 4.9 below
Table 4.9: Age of the Community Water Projects
Age of Community Water Projects
Frequency Percent Cumulative Percent
Under 2 years 105 30.9 30.9 Between 2-4 years 113 33.2 64.1 Between 4-6 years 93 27.4 91.5 6 years and above 29 8.5 100.0 Total 340 100.0
105(30.9%) of the household respondents indicated that their respective water projects had
been developed in less than 2years, 113(33.2%) said that their facilities had been operational
between 2-4 years, 93(27.4%) indicated their facilities having been operational between 4-6
years and 29(8.5%) indicated that they had lasted for over 6 years. The researcher found it
important to know the period the facilities have been in existence in order to know the
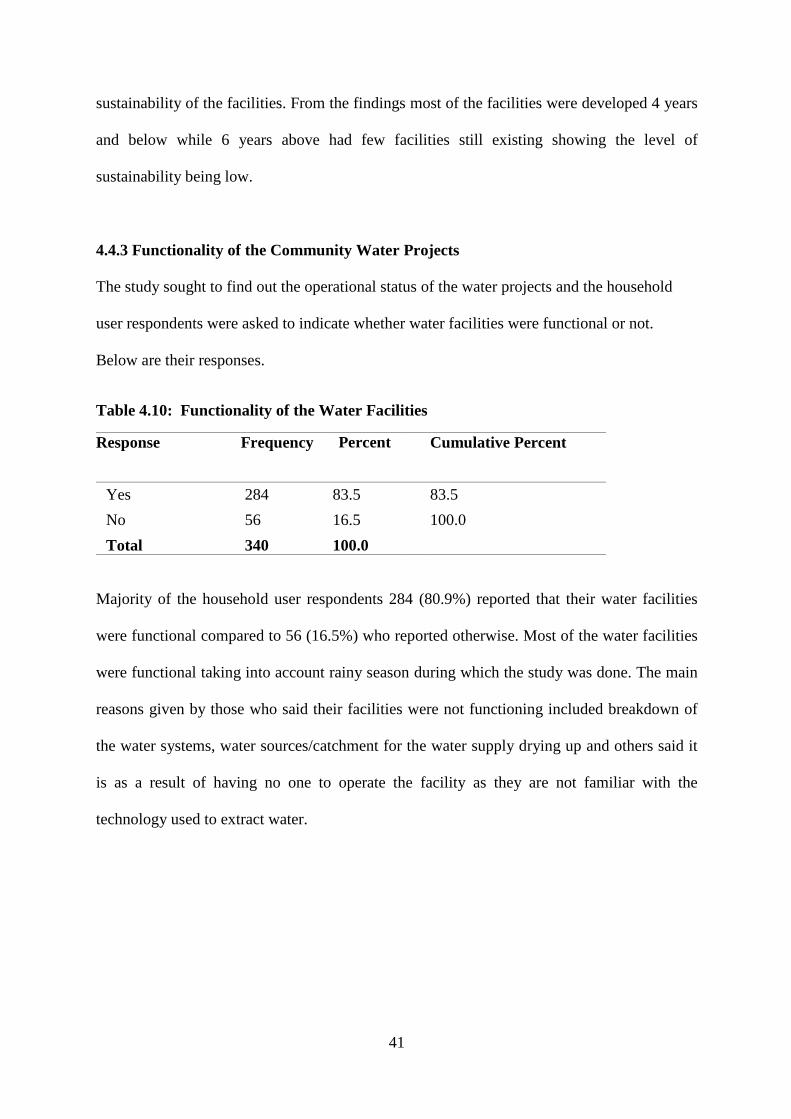
41
sustainability of the facilities. From the findings most of the facilities were developed 4 years
and below while 6 years above had few facilities still existing showing the level of
sustainability being low.
4.4.3 Functionality of the Community Water Projects
The study sought to find out the operational status of the water projects and the household
user respondents were asked to indicate whether water facilities were functional or not.
Below are their responses.
Table 4.10: Functionality of the Water Facilities
Response
Frequency Percent Cumulative Percent
Yes 284 83.5 83.5 No 56 16.5 100.0 Total 340 100.0
Majority of the household user respondents 284 (80.9%) reported that their water facilities
were functional compared to 56 (16.5%) who reported otherwise. Most of the water facilities
were functional taking into account rainy season during which the study was done. The main
reasons given by those who said their facilities were not functioning included breakdown of
the water systems, water sources/catchment for the water supply drying up and others said it
is as a result of having no one to operate the facility as they are not familiar with the
technology used to extract water.

42
4.4.4 Extent of Sustainability of the Water Supplies
Household user respondents and the management water committee executives were asked if
the water supply was sustainable. The findings are presented in Table 4.11 below.
Table 4.11: Sustainability of the Water Facilities
Response Frequency Percent Cumulative Percent
Yes 208 61.2 61.2 No 132 38.8 100.0 Total 340 100.0
The findings in the table 4.11 indicate responses by the household user respondents.
208(61.2%) reported that their water supplies are sustainable while 132(38.8%) reported that
their water supplies are not sustainable. Among the 11 water management water executives,
6(54.5%) reported that water supplies are sustainable and 5(45.5%) reported that they were
not sustainable. Household user respondents and the water management water committee
executives who reported that their water supply was not sustainable attributed it to lack of
funds to maintain the facilities, water drying up during dry seasons and breakdowns due to
non-repairs. The household user respondents were asked to indicate the extent to which the
water supplies were sustainable and the responses are presented below.
Table 4.12: Extent of Sustainability
Response Frequency Percent Cumulative Percent
To a very low extent 56 26.9 26.9 To a low extent 41 19.7 46.6 Sometimes good and sometimes bad
65 31.3 77.9
Great extent 27 13.0 90.9 A very great extent 19 9.1 100.0 Total 208 100.0
43
From the 208 household user respondents who had indicated that water supply was
sustainable, 56(26.9%) said the water supply was sustainable to a very low extent, 41(19.7%)
reported the water supply to be sustainable to a low extent, 65(31.3%) indicated that water
supply was sometime good and sometimes bad, 27(13%) indicated that the water supply is
sustainable to a great extent and 19(9.1%) reported the water supply to be sustainable at a
very great extent.
When the water management committee executives and household users were asked of what
influences sustainability of the community water projects, they gave reasons including
financial constraints that the community faces in construction and maintenance of the
facilities, complex technology used especially for those getting water from the boreholes
using a hand pump, lack of community participation in county initiated projects and low
efforts in conservation of catchment areas.
4.5 Water Resource Conservation Practices and Sustainability of Community Water
Projects
The first objective of the study was to assess the extent to which water resources conservation
practices affects sustainability of community water projects.
4.5.1 Source /Catchment Area for the Water Projects
The researcher sought to know the sources/catchment areas for the water projects. The
response was as shown in the table 4.13 below.

44
Table 4.13: Source/Catchment Area for the Water Projects
Source Frequency Percent Cumulative Percent
Groundwater 217 63.8 63.8 Wetland 33 9.7 73.5 Forest 29 8.5 82.1 Mountain/Hill 8 2.4 84.4 River 53 15.6 100.0 Total 340 100.0
From the Table, 217(63.8%) of the household user respondents say the source of the water
for projects is from underground, 33 (9.7 %) from wetland, 29 (8.5%) from forests, 8(2.4 %)
from mountain/hill and 53 (15.6 %) from rivers. The researcher found it of great importance
to know the sources of water for the projects as it can have adverse impact on the
sustainability of the water projects.
4.5.2 Community Involvement in Conservation and Protection of Water Catchment
Areas
The study aimed at establishing community involvement in conservation of catchment areas
and the findings are shown in Table 4.14
Table 4.14: Community Involvement in Conservation and Protection of Water Catchment Areas
Response Frequency Percent Cumulative Percent
Yes 123 36.2 36.2 No 217 63.8 100.0 Total 340 100.0
In responding to the level of community involvement, 123 (36.2 %) household user
respondents indicated that they were involved in the conservation and protection activities
that were initiated in order to ensure continued water supply, 217 (63.8 % ) of the

45
respondents indicated that they have never been involved in water conservation practices. A
high level of non-participation indicates how it contributes to unsustainable water projects.
4.5.3 Conservation and Protection of Water Catchment Areas of the Water Projects
The study established some of the conservation practices by the household users and the
findings are shown in the Table 4.15
Table 4.15: Conservation and Protection Practices
Conservation and Protection Practices
Frequency Percent Cumulative Percent
Afforestation 53 43.1 43.1 Pollution management and Hygiene practices
47 38.2 81.3
Management of catchment areas
23 18.7 100.0
Total 123 100.0
With regards to the types of water catchment conservation interventions, 53 (43.1%)
household user respondents indicated afforestation which involves planting trees in the
catchment area and according to the Ministry of Water and Irrigation official, the County
Government have been initiating programmes towards afforestation in the area. 47 (38.2 %)
been involved in pollution management and hygiene practices including; avoiding dumping
in the rivers, not bathing in the rivers and avoiding grazing in the areas, careful use of
fertilizers in farms upstream to avoid pollution of water as fertilizers are swept into the rivers.
23 (18.7 %) of the respondents indicated that they have been involved in management
practices such as fencing the catchment areas and the water systems. Respondents said that
most of the conservation activities were initiated by the community itself as the county
government plays a minimal role. This has resulted into little effort as the community is not

46
in a position to ensure effective conservation and management of water resources affecting
water sustainability.
4.5.4 Water Resource Conservation Practices and Continued Water Supply
The researcher sought to find out from household user respondents if water conservation
practices contribute towards continued water supply. Table 4.16 presents their responses.
Table 4.16: Water Resource Conservation Practices Contribute to Continued Water Supply
Response Frequency Percent Cumulative Percent
Strongly Agree 156 45.9 45.9 Agree 123 36.2 82.1 Undecided 44 12.9 95.0 Disagree 12 3.5 98.5 Strongly disagree 5 1.5 100.0 Total 340 100.0
Of the 340 household user respondents interviewed on whether water conservation practices
contribute to continued water supply, 156 (45.9 %) strongly agree with the statement, 123
(36.2%) agree, 44 (12.9 %) were undecided, 12 (3.5 %) disagreed with the statement and (1.5
%) strongly disagreed with the statement. Majority of the respondents attributed that the
conservation of the water resources such as afforestation and general management of the
water sources or catchment areas influence water supply. While the minority did not see how
conservation activities would lead to a continued water supply in the community water
projects because of other factors that could influence continued supply such as climatic
change. Climate change is a phenomenon we can no longer deny as its effects have become
increasingly evident worldwide.

47
4.5.5 Relationship between Water Resource Conservation Practices and Sustainability
of the Water Supplies
The respondents’ responses on the question related to the extent to which they thought water
supplies were sustainable was scored on a 5-point scale, ranging from “a very low extent “to
a very great extent” These scores were used to compute the Pearson’s Product Moment
Correlation (PPMC) between water resource conservation practices and sustainability of the
water supplies. The results of correlation analysis were as shown in Table 4.17
Table 4.17: Relationship Between Water Resource Conservation Practices and Sustainability of the Water Supplies
Conservation practices
Extent of sustainability
Conservation practices
Pearson Correlation
1 .959**
Sig. (2-tailed) .000 N 123 123
Extent of sustainability
Pearson Correlation
.959** 1
Sig. (2-tailed) .000 N 123 208
**. Correlation is significant at the 0.01 level (2-tailed).
The PPMC analysis indicated that there was a strong positive correlation between water
resources conservation practices and sustainability of water supplies (r=0.959).The
correlation was significant at the 0.01 level. An official from the ministry of water and
irrigation pointed out that conservation and protection of water resources and catchment areas
is very important in ensuring sustainable community water projects and it calls upon efforts
from the community and the county government. The researcher cross tabulated conservation
practices and sustainability of water facilities to know how much each intervention has
contributed to sustainability.

48
Table 4.17: Conservation practices * Sustainability of the Water Facilities Cross Tabulation
Conservation practices Sustainability of the water facilities
Afforestation
Count 53 % within Sustainability of the water facilities
43.1%
Pollution management and Hygiene practices
Count 47 % within Sustainability of the water facilities
38.2%
Management of catchment areas
Count 23 % within Sustainability of the water facilities
18.7%
Total
Count 123 % within Sustainability of the water facilities
100.0%
From the cross tabulation, afforestation contributed towards sustainability at 43.1%, pollution
management and hygiene practices at 38.2% and management of catchment areas at 18.7% .
4.6 Training and Sustainability of Community Water Projects
The second objective was to assess the impact of training on sustainability of community
water projects.
4.6.1 Training of the Household User Respondents
The study sought to find out if the household user respondents had received any kind of training.
The findings are indicated in table 4.18

49
Table 4.18: Training by Household User Respondents
Response Frequency Percent Cumulative Percent
Yes 143 42.1 42.1 No 197 57.9 100.0 Total 340 100.0
Among the household user respondents, 143(42.1%) indicated that they have received
training concerning the water projects while 197(57.9) indicated that they have never
received any kind of training. This implies that most of the beneficiaries lack proper skills
and knowledge which could contribute towards sustainability of water projects.
4.6.2 Type of Training Received
The study sought to establish types of training the household user has ever received. Table
4.19 shows the findings.
Table 4.19: Type of Training
Type of Training Frequency Percent Cumulative Percent
Conservation 55 38.5 38.5 Management 34 23.8 62.2 Operation &Maintenance
54 37.8 100.0
Total 143 100.0
Among the 143 household user respondents who had received training, 55(38.5%) reported to
have received training on conservation of water resources and catchment areas, 34(23.8%)
received training on management aspects and 54(37.8%) received training on operation and
maintenance of the water facilities. When 11 water management executives were asked on
which trainings they have received, those serving under borehole projects reported to have
received training on operation and maintenance. All the officials had received training on

50
conservation and management. An official from the Ministry of water and Irrigation indicated
that the county had initiated afforestation programmes which encourage the communities to
plant trees in water catchment areas and that training by the county officials on operating
boreholes fixed with hand pumps has been done to management water committee executives
and the household users.
4.6.3 Usefulness of Training in Operation and Maintenance
The water management committee executives were asked to indicate if they consider training
an important aspect in Operation and maintenance. Table 4.20 shows the results.
Table 4.20: Usefulness of Training in O & M
Response Frequency Percent Cumulative Percent
Yes 7 63.6 63.6 No 4 36.4 100.0 Total 11 100.0
Among the 11 committee executives, 7(63.6%) stated that training on O & M is necessary
and important in Operation and Maintenance while 4(36.4%) did not see the usefulness of
training on O & M as the technology used in water springs is simple. The researcher sought
to know the opinion of the executives because proper operation and maintenance of the water
facilities contributes towards sustainability of water supply.
4.6.4 Extent of Usefulness of Training in O & M
Management committee executives were asked to indicate what extent to which they think
Training is important for proper O & M of water facilities. Table 4.21 presents the findings

51
Table 4.21: Extent of Usefulness of Training for O & M
Response Frequency Percent Cumulative Percent
To a very low extent 1 14.3 14.3 To a low extent 1 14.3 28.6 To a great extent 3 42.9 71.4 To a very great extent 2 28.6 100.0 Total 7 100.0
Among the 7 management committee executives who regard training as important for proper
O&M, 1 (14.3%) stated that it is important to a very low extent, 1(14.3%) stated that it is
useful to a low extent, 3 (42.9%) stated that it is useful to a great extent and 2 (28.6%) stated
that it is useful to a very great extent.
4.6.5 Level of Awareness on Training Opportunities
Household user respondents were asked to state the level of awareness on available training
opportunities concerning the water projects and below are their responses.
Table 4.22: Level of Awareness on Training Opportunities
Response Frequency Percent Cumulative Percent
High Average
0 85
0.0 25.0
0.0 25.0
Low 255 75.0 100.0 Total 340 100.0
None of the household user respondents indicated that level of awareness for training is
high.85 (25%) indicated that the level of awareness on trainings is average whereas the
majority 255(75%) indicated that the level of awareness was low. This explains why the
number of those who have never received training is high at (57.9 %) as shown in Table 4.15

52
above. This could have a significant impact on sustainability of the community water
projects.
4.6.6 Frequency of Training
The study sought to establish the frequency of trainings offered to the household users. Table
4.23 presents the findings.
Table 4.23: Frequency of Training
Response Frequency Percent Cumulative Percent
Never 167 49.1 49.1
Rarely 117 34.4 83.5 Occasionally 56 16.5 100.0
Always Total
0 340
0.0 100.0
100.0
In responding to the frequency of trainings that are available, household users 167(49.1)
indicated that there has never been training on various aspects of water projects. 117(34.4%)
indicated that rarely were the trainings conducted, 56(16.5%) indicated that the trainings were
occasional and none of the respondents indicated if the trainings are held always. Frequency
of the trainings influences sustainability of water projects as the community is supposed to be
regularly equipped with necessary skills and knowledge concerning management, O & M and
conservation.
4.6.7 Training and Sustainability of Community Water Projects.
The study sought to establish whether the skills and knowledge acquired during training
influences sustainability of water projects. Household user respondents were asked to indicate
what extent to which they think training impacts on sustainability of water projects.
Responses are shown in Table 4.24 below.

53
Table 4.24: Extent to which Training Impacts Sustainability of Water Projects
Response Frequency Percent Cumulative Percent
To a very low extent 157 46.2 46.2
To a low extent 93 27.4 73.5 To a great extent 65 19.1 92.6 To a very great extent 25 7.4 100.0 Total 340 100.0
Findings from the household user respondents indicated that the majority 157(46.2%) said
that training had contributed to sustainability of water projects to a very low extent.
93(27.4%) indicated that it had contributed to a low extent, 65(19.1) said its contribution is to
a great extent and 25(7.4%) indicated that training has contributed to a very great extent. The
majority of the respondents indicated to a very low extent as the level of awareness on
training opportunities is very low and training is a rare exercise on management, O & M and
water resource conservation. Training of household users and Water management committee
executives provides knowledge and skills on how to operate and maintain the water systems
and where training levels are low, achieving of sustainability becomes a challenge.
4.6.8 Relationship between Training and Sustainability of Community Water Projects
Pearson’s Product Moment Correlation (PPMC) analysis was computed between scores of
the question on the extent to which household user respondents think training contributes to
sustainability of water projects and sustainability of community water projects. The results of
correlation analysis were as shown in Table 4.25
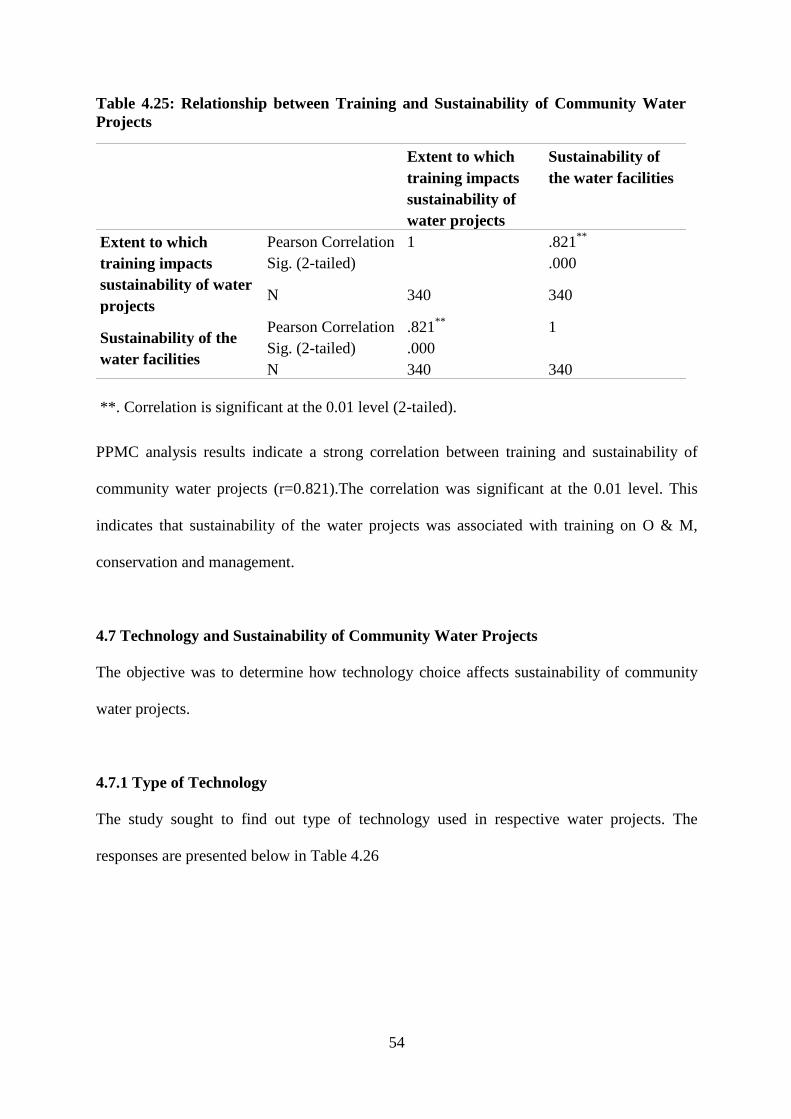
54
Table 4.25: Relationship between Training and Sustainability of Community Water Projects
Extent to which training impacts sustainability of water projects
Sustainability of the water facilities
Extent to which training impacts sustainability of water projects
Pearson Correlation 1 .821** Sig. (2-tailed) .000
N 340 340
Sustainability of the water facilities
Pearson Correlation .821** 1 Sig. (2-tailed) .000 N 340 340
**. Correlation is significant at the 0.01 level (2-tailed).
PPMC analysis results indicate a strong correlation between training and sustainability of
community water projects (r=0.821).The correlation was significant at the 0.01 level. This
indicates that sustainability of the water projects was associated with training on O & M,
conservation and management.
4.7 Technology and Sustainability of Community Water Projects
The objective was to determine how technology choice affects sustainability of community
water projects.
4.7.1 Type of Technology
The study sought to find out type of technology used in respective water projects. The
responses are presented below in Table 4.26
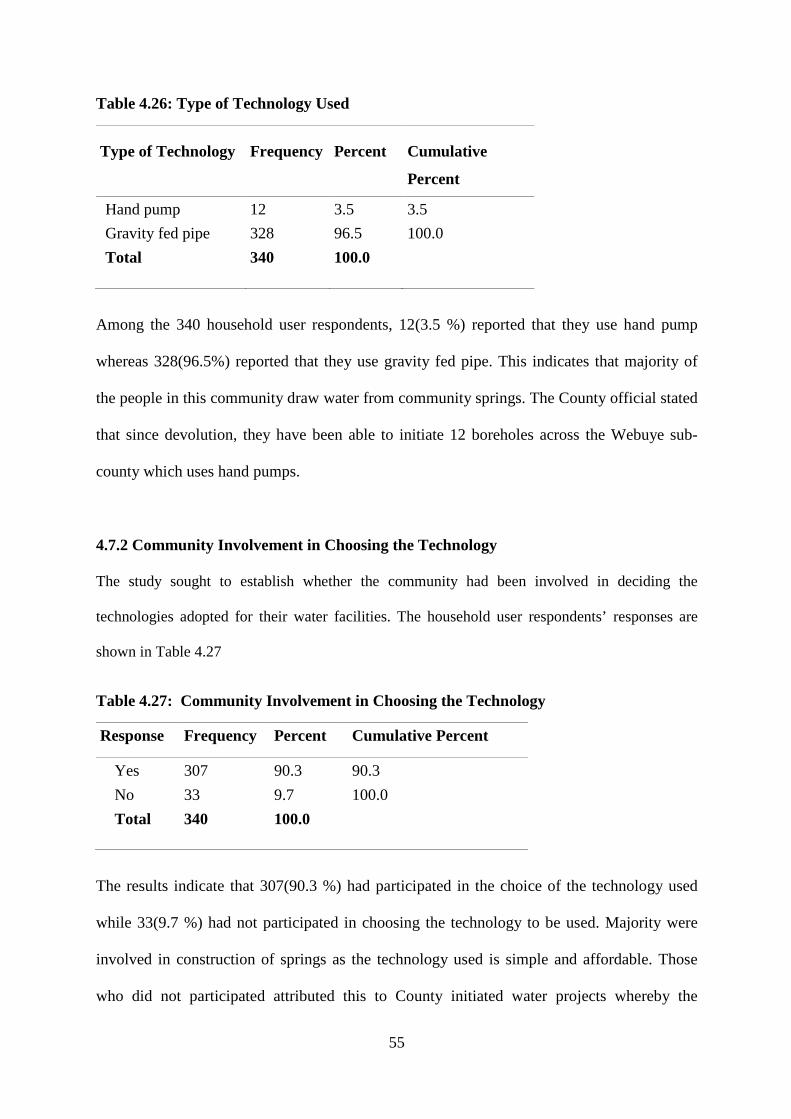
55
Table 4.26: Type of Technology Used
Type of Technology Frequency Percent Cumulative
Percent
Hand pump 12 3.5 3.5 Gravity fed pipe 328 96.5 100.0 Total 340 100.0
Among the 340 household user respondents, 12(3.5 %) reported that they use hand pump
whereas 328(96.5%) reported that they use gravity fed pipe. This indicates that majority of
the people in this community draw water from community springs. The County official stated
that since devolution, they have been able to initiate 12 boreholes across the Webuye sub-
county which uses hand pumps.
4.7.2 Community Involvement in Choosing the Technology
The study sought to establish whether the community had been involved in deciding the
technologies adopted for their water facilities. The household user respondents’ responses are
shown in Table 4.27
Table 4.27: Community Involvement in Choosing the Technology
Response Frequency Percent Cumulative Percent
Yes 307 90.3 90.3 No 33 9.7 100.0 Total 340 100.0
The results indicate that 307(90.3 %) had participated in the choice of the technology used
while 33(9.7 %) had not participated in choosing the technology to be used. Majority were
involved in construction of springs as the technology used is simple and affordable. Those
who did not participated attributed this to County initiated water projects whereby the

56
community is not involved in choosing the technology to be used. The water management
water committee executives also reported that they were involved in choosing the technology
to be used except for the borehole that the County had initiated.
4.7.3 Community Conversancy with the Technology Used
The study sought to establish if the household users were conversant with the technology
used in extraction of water
Table 4.28: Community Conversant with Technology Used
Response Frequency Percent Cumulative Percent
Yes 330 97.1 97.1 No 10 2.9 100.0 Total 340 100.0
Findings indicate that 330(97.1%) of the household user respondents are conversant with the
technology used in drawing or extraction of water while 10(2.9%) indicate that they are not in
a position to use the technology. Majority of the people are conversant in drawing water from
the springs as it is a simple technology while the minority who are not able to use the
technology draw water from the boreholes which use a hand pump and since they have not
been trained they are not in a position to use it. Conversancy with the technology used has a
positive influence on sustainability of water supplies. Management committee executives
reported that most of the repairs of the springs are made by the community itself while
breakdowns on hand pumps are made by technicians. Waiting on the technicians to repair
hand pumps affects continued supply of water and is expensive for the community to raise
the money for the spare parts.

57
4.7.4 Interruptions of Water Supply as a Result Breakdowns
Household user respondents were asked to indicate if they ever experience interruptions in
water supply as a result of breakdowns. Table below gives their responses;
Table 4.29: Interruptions as a Result of Breakdowns of the Water System
Response Frequency Percent Cumulative Percent
Yes 154 45.3 45.3 No 186 54.7 100.0 Total 340 100.0
Findings indicate that 154(45.3%) reported that they have ever had interruptions with water
supply as a result of breakdowns while 186(54.7%) reported that they have never had
interruptions as a result of breakdowns. Management water committee executives indicated
that they have ever experienced interruptions of water supply. An official from the ministry
attributes interruptions to the negligence of the water facilities by the community who depend
largely on external support from Non-governmental organizations and the county
government.
4.7.5 Extent of Interruptions
Respondents who indicated that they have ever had interruptions were asked to indicate how
often they experience the interruptions. The results are shown in Table 4.30

58
Table 4.30: Water Interruptions
Response Frequency Percent Cumulative Percent
Rarely 48 31.2 31.2 Occasionally 39 25.3 56.5 Always 67 43.5 100.0 Total 154 100.0
Among the 154 household user respondents who reported that had ever experienced the
interruptions, 48 (31.2%) indicated it was a rare occurrence, 39(25.3%) it does happen
occasionally, 67(43.5%) indicated they have always had interruptions of the water supply due
to breakdowns.
4.7.6 Availability of Spare Parts
Household user respondents were asked if the spare parts for doing repairs for the water
systems were available. Results are shown in the Table 4.31 below;
Table 4.31: Availability of Spare Parts
Response Frequency Percent Cumulative Percent
Yes 314 92.4 92.4 No 26 7.6 100.0 Total 340 100.0
The findings indicate that 314(92.4 %) reported that Spare parts for the water systems were
readily available while 26(7.6%) reported that the Spare parts were not available. This could
have an influence on when the repairs are done and could affect sustainability in a positive
way.

59
4.7.7 Affordability of the Spare Parts
The study sought to find out if the Spare parts were affordable and the respondents gave their
responses shown in Table 4. 32
Table 4.32: Affordability of the Spare Parts
Response Frequency Percent Cumulative Percent
Yes 104 30.6 30.6 No 236 69.4 100.0 Total 340 100.0
Among 340 household user respondents asked, 104(30.6%) indicated that the spare parts
were affordable while 236(69.4) indicated that the spare parts were not affordable. The
highest percentage reporting that they are not affordable is an indication that it could affect
sustainability of water supplies in case of breakdowns.
4.7.8. Influence of Technology Choice on Sustainability of Community Water Projects
The respondents’ views on the influence of technology choice on sustainability of community
water projects are shown in Table 4.33
Table 4.33: Influence of Technology Choice on Sustainability of Water Projects
Response Frequency Percent Cumulative Percent
Low 17 5.0 5.0 Average 182 53.5 58.5 High 141 41.5 100.0 Total 340 100.0
Majority of the household user respondents 182(53.5%) indicated that choice of technology
influenced sustainability at an average extent, 17(5%) reported that the influence was at low

60
extent while 141(41.5%) reported that technology choice influenced sustainability at a high
extent.
4.7.9 Relationship between Appropriate Technology Choice and Sustainable Water
Projects
The respondents’ responses on the question on influence of technology choice on
sustainability and responses on sustainability of water projects were used to compute the
Pearson’s Product Moment Correlation (PPMC) between technology choice and
sustainability of the water supplies. The results of correlation analysis were as shown in
Table 4.34 below;
Table 4.34: Relationship between Appropriate Technology Choice and Sustainable Water Projects
Influence of technology choice on sustainability on water projects
Sustainability of the water facilities
Influence of technology choice on sustainability on water projects
Pearson Correlation 1 .879** Sig. (2-tailed) .000
N 340 340
Sustainability of the water facilities
Pearson Correlation .879** 1 Sig. (2-tailed) .000
N 340 340
**. Correlation is significant at the 0.01 level (2-tailed). Pearson’s Product Moment Correlation (PPMC) results indicate a strong correlation between
technology choice and sustainability of community water projects (r=0.879).The correlation
was significant at the 0.01 level.

61
4.8 Levels of Funding and Sustainability of Community Water Projects
The fourth objective was to assess the extent to which level of funding influence
sustainability of community water projects. The researcher found it of great importance to
have household user respondents’ comment on the aspect as funds are necessary for
purchasing materials and equipment for construction and repairs, paying labour services,
cover operations and maintenance which determine sustainability of water projects.
4.8.1 Source of Funds for Construction of the Water Project
The study sought to find out the sources of funds for construction of the water projects.
Responses from the household user respondents are shown in Table 4.35 below;
From the findings, 328(96.5%) indicated that the community contributed funds towards
construction of the water projects while 12(3.5%) indicated that the county Government
contributed funds for construction of the water project. The findings show that the
community has greatly contributed towards the development of the water projects and the
county Government efforts are less felt. The commitment of financial resources for
construction by beneficiary communities is a clear indication that they value the projects as
water scarcity issue is addressed. An official from the line ministry reported that the county
government has plans to construct springs and wells and some have already been constructed,
money have been budgeted for construction and maintenance.
Table 4.35: Source of Funds for Construction of Water Projects
Source of Funding
Frequency Percent Cumulative Percent
Community 328 96.5 96.5
County 12 3.5 100.0 Total 340 100.0

62
4.8.2 Community Financial Contribution for Operation and Maintenance of Water
Systems
Household user respondents were asked on community contribution towards operation and
maintenance of the water systems. Findings are presented in Table 4.36
Table 4.36: Community Financial Contribution for Operation and Maintenance
Response Frequency Percent Cumulative Percent
Yes 57 16.8 16.8 No 283 83.2 100.0 Total 340 100.0
From findings, 57(16.8%) mentioned that the community is involved in financial contribution
towards operation and maintenance of the water systems while the majority 283(83.2%) said
the community does not get involved. Findings clearly show that operation and maintenance
of the water systems is given little attention once the projects are developed. Insufficient
financing is a major factor in poor maintenance which leads to project failure. The researcher
considered this aspect because effective O & M is of great benefit in achieving sustainable
water supplies.
4.8.3 User Fees The household user respondents were asked to indicate if they have to pay to access water.
Responses are shown in Table 4.37 below;

63
Table 4.37: User Fees
Response Frequency Percent Cumulative Percent
Yes 4 1.2 1.2 No 336 98.8 100.0 Total 340 100.0
It is observed that 4 (1.2%) pay to access water while the majority 336(98.8%) do not pay to
access water. This implies that there are insufficient funds for operation and maintenance of
water systems. Raising of adequate funds for maintaining water systems and activities are
important in achieving sustainability.
4.8.4 Level of Funding
Household user respondents were asked to indicate the levels of funding. Table 4.38 shows
the results.
Table 4. 38: Level of Funding
Response Frequency Percent Cumulative Percent
High 4 1.2 1.2 Average 60 17.6 18.8 Low 276 81.2 100.0 Total 340 100.0
From the household responses, 4(1.2%) indicated that level funding is high, 60(17.6%)
indicated that level of funding is average and 276(81.2%) indicated that the level of funding
for the water projects is low. The findings show that financing of water projects still remains
a big challenge in the sub-county affecting sustainability of water projects. An official from
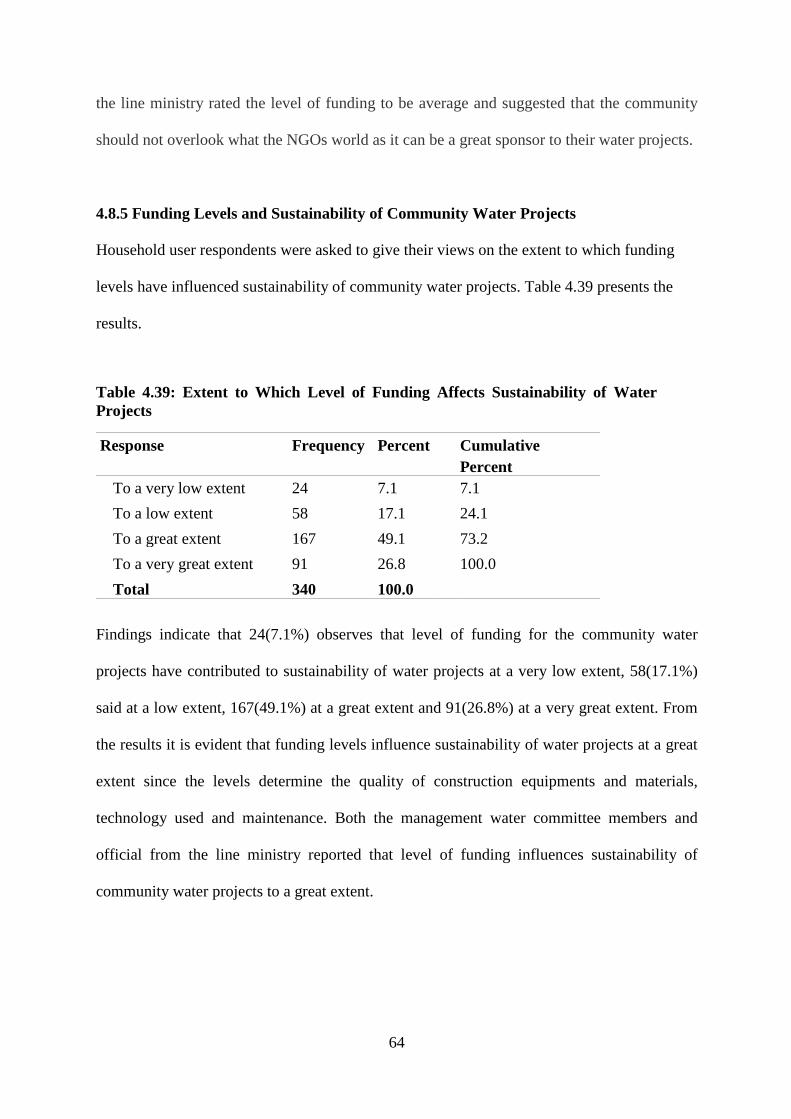
64
the line ministry rated the level of funding to be average and suggested that the community
should not overlook what the NGOs world as it can be a great sponsor to their water projects.
4.8.5 Funding Levels and Sustainability of Community Water Projects
Household user respondents were asked to give their views on the extent to which funding
levels have influenced sustainability of community water projects. Table 4.39 presents the
results.
Table 4.39: Extent to Which Level of Funding Affects Sustainability of Water Projects
Response Frequency Percent Cumulative Percent
To a very low extent 24 7.1 7.1 To a low extent 58 17.1 24.1 To a great extent 167 49.1 73.2 To a very great extent 91 26.8 100.0 Total 340 100.0
Findings indicate that 24(7.1%) observes that level of funding for the community water
projects have contributed to sustainability of water projects at a very low extent, 58(17.1%)
said at a low extent, 167(49.1%) at a great extent and 91(26.8%) at a very great extent. From
the results it is evident that funding levels influence sustainability of water projects at a great
extent since the levels determine the quality of construction equipments and materials,
technology used and maintenance. Both the management water committee members and
official from the line ministry reported that level of funding influences sustainability of
community water projects to a great extent.

65
4.8.6 Relationship between Funding Levels and Sustainability of Community Water
Projects
The respondents’ responses on the question related to the extent to which they thought level
of funding affects sustainability was used to compute the Pearson’s Product Moment
Correlation (PPMC) between levels of funding and sustainability of the water supplies. The
results of correlation analysis were as shown in Table 4.40
Table 4.40: Relationship between Funding Levels and Sustainability of Community Water Projects
Extent to which level of funding affects sustainability of water projects
Sustainability of the water facilities
Extent to which level of funding affects sustainability of water projects
Pearson Correlation 1 .689** Sig. (2-tailed) .000
N 340 340
Sustainability of the water facilities
Pearson Correlation .689** 1 Sig. (2-tailed) .000
N 340 340
**. Correlation is significant at the 0.01 level (2-tailed).
The PPMC analysis indicates that there was a strong positive correlation between levels of
funding and sustainability of community water projects (r=0.689).The correlation was
significant at the 0.01 level. Levels of funding are low and this has been a challenge in
achieving sustainability of thee water projects.

66
CHAPTER FIVE
SUMMARY OF THE FINDINGS, DISCUSSIONS, CONCLUSION AND
RECOMMENDATIONS
5.1 Introduction
This chapter presents summary of the study findings, discussions, conclusion and
recommendations on the determinants of sustainability of community water projects in
Webuye East Sub-County, Bungoma, Kenya and suggestions for further research.
5.2 Summary
This study purposed to investigate Determinants of Sustainability of Community Water
Projects in Webuye East Sub-County, Bungoma, Kenya. This section provides a summary of
the findings based on the objectives of the study. The findings are summarized and presented
according to the four variables of the study namely; water resources conservation practices,
training, technology choice and level of funding.
5.2.1 Water Resources Conservation Practices
The first objective was to assess the extent to which water resources conservation practices
influence sustainability of community water projects in Webuye East Sub-County, Bungoma,
Kenya. The study findings established that water sources /catchment areas included
underground water, wetlands, forests, mountain/hill and rivers. It was noted that majority of
the household users (63.8%) indicated underground water as their source. However, it was
further established that the majority (63.8%) of the household users never participated in
conservation of water resources. It was revealed that conservation practices by the
67
communities included afforestation at 43.1%, pollution management and hygiene practices
(avoiding dumping and bathing into rivers, nor grazing in catchment areas especially the
wetland) at 38.2% while management practices at 18.7% (fencing catchment areas and the
water facilities). The findings in addition indicate that conservation practices were mainly
initiated by the community and that the county government plays a minimal role. The
majority (45.5%) of the respondents as the study found out they strongly agree that water
conservation practices contribute to continued water supply and quality. The study
recognized a positive and significant correlation between water conservation practices and
sustainability of water supply after obtaining Pearson correlation coefficient of 0.959 at 0.01
level of significance.
5.2.2 Training
The second objective was to assess the impact of training on sustainability of community
water projects in Webuye East Sub-County, Bungoma, Kenya. The study found out that the
majority of the respondents (57.9%) had never received training concerning water projects
while 42.1 % had received training. Among those who indicated they had received training
(38.5%) reported to have been trained in conservation of water resources and catchment
areas, 23.8% were trained in management aspects, and 37.8% were trained in operation and
maintenance of the water facilities. Among the eleven water management committee
executives 63.6% stated that training on O & M was very important while 36.4% did not see
its usefulness. Among the 7 (63.6%) management committee executives who regard training
as essential for proper O & M stated that: 1 (14.3%) it is important; scored a very low extent,
1 (14.3%) it is useful; scored a low extent, 3 (42.9%) it is useful; scored a great extent, and 2
(28.6%) it is useful; scored a very great extent.
68
The study furthermore found out that 25% of the household respondents rated the level of
awareness for training opportunities at an average, while the majority (75%) rated it to be
low. None of the respondents rated the level of awareness high. This implies that level of
training was low and affecting sustainability of water projects. The study established that
trainings were conducted occasionally and in some communities it was rare. This implies that
most of the people in the communities lack necessary knowledge and skills concerning
management, O & M, and conservation which is important in achieving sustainability of
community water projects. Pearson’s Product Moment Correlation (PPMC) analysis results
shows a strong/positive and significant correlation between training and sustainability of
community water projects (r=0.821).
5.2.3 Choice of Technology
The third objective was to determine how choice of technology affects sustainability of
community water projects in Webuye East Sub-County, Bungoma, Kenya. The study
established that there were only two technologies used; hand pump and gravity fed pipe at
3.5% and 96.5% respectively of which the later, a majority use to draw water from springs. It
was found out that there was high community participation (90.3%) in choosing the
technology used. Majority were involved in construction of springs whose technology of
gravity fed pipe is simple and affordable. 9.7 % were not involved in choosing the technology
used in drilling boreholes as the projects were initiated by the County Government. The study
findings show that 97.1% were conversant with the technology used while 2.9% were not in a
position to use hand pump technique on boreholes drilled by the County Government. Most
of the repairs especially on the springs were done by the community as the technology used
was simple. Breakdowns of hand pumps were repaired by technicians who took time to avail
themselves leading to systems dysfunction and some were abandoned.

69
The study findings show that 45.3% had experienced interruptions with water supply as a
result of breakdowns while 54.7% had never had interruptions. Rare interruptions at 31.2%,
occasionally at 25.3% and 43.5% always were victims of interruption. The study besides
established that spare parts were readily available at 92.4% and affordable at 30.6%. The
availability and affordability of the spare parts have an impact on sustainability of water
supplies in case of breakdowns. Pearson’s Product Moment Correlation (PPMC) results
showed a strong correlation between technology choice and sustainability of community
water projects (r=0.879). The correlation was significant at the 0.01 level.
5.2.4 Levels of Funding
The fourth objective was to assess the extent to which levels of funding influence
sustainability of community water projects in Webuye East Sub-County, Bungoma, Kenya.
The study established that community financial contribution towards construction of the
water projects was the highest at 96.5% while the County Government’s contribution was at
3.5%. The commitment of financial resources for construction by beneficiary communities is
a clear indication of sense of ownership and a key factor to influencing sustainability. Despite
the active involvement in contribution towards construction, only 16.8% contribute towards
operation and maintenance of the water systems. This clearly shows that operation and
maintenance of the water systems were given little attention once the projects are developed.
Insufficient financing is a major factor in poor maintenance which leads to project failure.
The study as well revealed majority of the people in the community (98.8%) draw water for
free from the water systems and only 1.2% pay to draw water. Responses shows level of
funding as follows; 81.2% indicated low level, 17.6% indicated average level while 1.2 %
indicated high level. The findings show that financing of water projects still remains a big

70
challenge in the Sub-County affecting sustainability of water projects. The findings establish
that 49.1% level of funding had contributed to sustainability at a great extent since funding
determines the quality of construction equipment and materials, technology used and
maintenance. Results from PPMC showed that there was a strong positive correlation
between levels of funding and sustainability of community water projects (r=0.689). The
correlation was significant at the 0.01 level.
5.2.5 Correlation between Determinants of Sustainability and Sustainability of
Community Water Projects in Webuye East Sub-County, Bungoma, Kenya.
The study established that there is a positive correlation between sustainability of community
water project and water resources conservation practices, training, choice of technology and
level of funding. The study used Pearson product-moment correlation analysis to measure the
relationship/association between independent variables and the dependent variable and is
denoted by r. The Pearson correlation coefficient can range from +1 to -1. A value of 0
indicates that there is no relationship between the two variables. The value greater than 0
shows a positive relationship and the values less than 0 shows negative relationship. The
value for relationship between community water project sustainability and water resources
conservation practices, training, choice of technology and level of funding is 0.959, 0.821,
0.879 and 0.689 respectively. Water resources conservation practices have the highest
influence while level of funding have the lowest influence.
5.3 Discussions of the Study Findings
The study examined types of community water projects and the findings shows the most
common type of water project was springs and just a few community boreholes drilled by the
County Government. Water systems that were 6 years and above since commissioning only

71
few were still functioning as many had been abandoned. Majority of the water projects were
functioning while others were dysfunctional as a result of breakdowns, drying up of water
sources/catchment areas and lack of technical capacity to operate and do repairs.
5.3.1 Water Resources Conservation Practices
Brikke & Davis (1995) states that conditions in the environment can have adverse effects on
the quality and quantity of water source. Maintenance of a water supply includes the
protection and conservation of the water source environment. The major sources of water
supply included underground water, forests, mountain/hills, wetlands and rivers (Table 4.13).
The sources and the environment need to be conserved and protected to ensure adequate
water quantities. From the findings, community involvement in conservation and protection
activities is very low at 36.2% (Table 4.14) as other stakeholders like the County Government
has not been actively involved in the interventions apart from encouraging communities to
plant trees in the catchment areas.
McLyor (2000) urged that the main reason why the water resources are being destroyed is
because majority of people in the communities are passive observers of environmental
degradation. Similarly, few communities were involved in conservation and protection
activities; afforestation in the catchment areas, pollution management and hygiene practices
with regard to no dumping, bathing in the rivers, no grazing in catchment areas especially the
wetland and management practices like fencing catchment areas and the water facilities. Low
levels of participation in conservation practices indicate that there is low level of awareness
on the importance of conservation measures on sustainability of community water projects.
The findings revealed there is a strong positive correlation (Table 4.17) between water
resources conservation practices and sustainability of water projects. This implies that water

72
sustainability is highly dependent on conservation practices, similar with Mwangi (2014) who
states that communities which practiced adequate water conservation practices like fencing
and planting trees had more reliable water quantities than those who never got involved.
5.3.4 Training
Sarah & Katz (1997)states that training provides knowledge and skills to the community
members and water committee members on how to operate and maintain the water systems.
Komives et al., (2008) stated that training always results in proper operation and maintenance
of water systems leading to sustainable water systems. Findings established that trainings
were conducted occasionally and in some communities it was rare, this is contrary to
Ongw’en (2014) who recommended that trainings need to be frequent to ensure effective
learning.
The study found out that only 42.1 % had ever received training, this implies that most of the
people in the communities lack necessary knowledge and skills concerning management, O
& M and conservation that are important in achieving sustainability of community water
projects. 63.6% management executive committee members were trained on O & M. Sarah &
Katz (1997) states that training water management committee ensures trained personnel in
charge of operations, inspection, monitoring and maintenance. It was established that
training was low as a result of low awareness on training opportunities available.
Communities who were trained by the county government on how to operate the hand pumps
installed by the County had their water systems functional as they had technical skills to
operate while those whole lacked skills had their hand pumps broken down and abandoned.
73
The findings revealed statistically significant correlation (Table 4.25) existed between
training and sustainability of community water projects. This implies that water sustainability
is highly dependent on training, similar with Beyene (2012) who observes that community
water projects where household users and water committee members were trained most of the
water systems were functional and where there was no training projects were nonfunctional.
Mimrose et al., (2011) recommended capacity building program to ensure water systems
continue to provide expected services and improve functioning and sustainability.
5.3.5 Choice of Technology
Haysom (2006), Brikke & Bredero (2003)suggests an affordable, simple, appropriate,
alternative, village technology, self-help and low cost technology should be used in
community water projects. They argue that choice of technology can have far-reaching
consequences on sustainability of water projects. It was found out that only two technologies
were used; use of hand pump extract water from the boreholes and use gravity fed pipes from
the springs. 96.5% use gravity fed pipes to draw water from the springs, this can be referred
to as village technology and it is very simple and appropriate while 9.7 % used hand pumps.
Musonga (2004) argues that the technology should be socially acceptable, technically
effective and economically sustainable. The findings of the study indicate high community
participation (90.3%) in choosing the technology. It was also revealed that the community
was left out by County Government in choosing hand pump technology used in projects that
they initiate. This has affected sustainability of most of the boreholes drilled by the county is
there is no community ownership. The community is well conversant with the technology
used by springs while few are not failure with technology used to extract water from the
boreholes.
74
The availability and affordability of the spare parts have an impact on sustainability of water
supplies in case of breakdowns. Tafara (2013) found out that factors affecting continued
water supply included breakdown of generator pumps, breakage of pipes, vandalism and
blockages of pipes. The study established that spare parts were readily available at 92.4%.
while affordable at 30.6%. This implies that the spare parts were available but were not
affordable resulting in non-functionality of the water systems as a result of breakdowns. This
was similar to findings by Munyui (2015) who established that lack of spare parts was a
major cause of non-functional of water systems.
5.3.6 Levels of Funding
Raising of adequate funds for construction, maintenance, repairs and operations for water
systems is important in achieving sustainability of community water projects. Community
contribution towards construction of the water projects was at 96.5% (Table 4.35) while the
county government contribution was at 3.5%. This is a clear indication of sense of ownership
by the community which is a key factor to influencing sustainability. The study established
that only 16.8% contribute towards operation and maintenance of the water systems.
Insufficient financing is a major factor in poor maintenance which results to project failure.
Mechanisms to raise adequate funds for O & M are not in place as majority of the people
(98.8 %) get water for free. Similar with Musonga (2004) in his study established that water
systems in Munjili community which were not functioning as a result of the inability of the
community to finance repairs as they needed external support. This is to the contrary to what
Okemwa & Wanyoike (2015) recommended in their study that water should be used as an
economic good by paying water user fees to cater for maintenance and conservation. The
findings found out that level of funding had contributed to sustainability at a great extent at

75
49.1 %, since the funding determine the quality of construction equipments and materials,
technology used and maintenance.
5.4 Conclusions of the Study
Water resources conservation practices play key role in ensuring sustainability of community
water projects. It was revealed that community involvement in water resources conservation
is low affecting water supplies. The study found out that levels of interventions including
afforestation, management of catchment areas and pollution management/hygiene practices
influence continued water supplies. This implies that community water sustainability is
highly dependent on conservation practices.
Training of household users and management committee members play an important role in
ensuring proper Operation and Maintenance of water projects leading sustainability of
community water projects. The study established that training on various aspects including
conservation, O & M and management was low resulting in lack of proper skills and
knowledge to operate, manage and maintain water facilities that had lead to unsustainability
of some water projects. Training should be in key areas including O & M, conservation and
management.
Choice of technology to be used in water projects has far-reaching consequences on the
sustainability of water projects. The study established that where appropriate, simple and
affordable technology was used lead to sustainability. Where spare parts were expensive and
unavailable had resulted in breakdowns and the water facilities were completely abandoned.
Adequate funding for construction and maintenance of water systems is important in
achieving sustainability. Funds are required to cover operations, maintenance, repairs,

76
purchasing equipments and paying labour services. Findings show that the communities have
been able to raise money for construction with little efforts from the County Government but
maintenance have been given little attention due to insufficient financing which is a major
factor in poor maintenance which leads to project failure.
5.5 Recommendations of the study
1. The County Government and experts in the environmental field should create
awareness on the importance of water resources conservation, sensitize the
community on water catchment areas and increase allocation of funds for
interventions such as afforestation. This will enhance reliability and adequacy of the
water sources.
2. Stakeholders should raise the level of awareness on available training opportunities
regarding conservation, management and O & M in the community to ensure the
management committee members and the entire community are impacted with proper
skills and knowledge that enhance water project sustainability. The trainings should
also be frequent to ensure effective learning.
3. The community and the County Government should explore other modern
technologies like use of solar pumps, diesel engines and wind mill to pump water to
households to reduce the distance covered by women and children to draw water. The
community should be trained on how to use the technologies available and how to
repair them in case of breakdowns to avoid disruptions in water supplies. Lastly the
county government should subsidize prices for spare parts to ensure they are
affordable.

77
4. County Government to increase level of funding on construction and maintenance of
community water projects. The community should also explore other sources of
funding like NGO’s and individuals who can sponsor. The community should
introduce user fee to ensure funds are secured for operations and maintenance of the
water projects.
5.6 Suggestions for Further Research
1. Studies should be conducted on community participation in County Government
initiated community water projects.
2. Studies should be conducted on influence of water resource conservation practices on
the quality of water in community water projects.
3. Studies should be done on the role of women in enhancing the sustainability of
community water projects in Kenya.

78
REFERENCES
Abrams, L. (2000). Understanding Sustainability of Local Water Services. Retrieved from
http://www.africanwater.org/sustainability.htm. Accessed 8th January 2016
Agenda 21 Retrieved http://sustainabledevelopment.un.org Accessed 8th January 2016
Annual Water Review 2013-2014 Retrieved http//en.m.wikipedia.org Accessed 7th January
2016
Asumani & Danny (2014). Combined Effects of the Factors that affect Sustainability of
Drinking Water Supply Services in Malawi: A Validated Perspective, Journal of
Sustainable Development In Africa (Volume 16, No.4 2014) ISSN : 1520-5509
Retrieved from http://www.academic journals.org Accessed 26th January 2016
Boulder Area Sustainability Information Network [BASIN] (2002) Boulder’s Urban Forest
Benefits Storm Water Runoff. Pages. 1-1-1-8. In BASIN. Calculating the Value of
Boulder’s Urban Forest. Boulder (CO): City of Boulder Water Conservation Office.
(30 August 2004)
Beyene, A. (2012).Factors affecting the Sustainability of Rural Water Supply Systems: The
Case of Mecha WOREDA, Amhara Region, Ethiopia. Unpublished Research Project,
Cornell University
Brikke F. & Bredero,( 2003). Linking Technology Choice with Operation and Maintenance in
the Context of Community Water Supply and Sanitation: A reference document for
Planners and Project Staff. World Health Organization and IRC Water and Sanitation
Centre
79
Brikke F. & Rojas (2001). Key Factors for Sustainable Cost Recovery; In the Context of
Community –Managed Water Supply. IRC International Water and Sanitation Centre,
Delft, Netherlands. Retrieved http//www.ircwash.org Accessed 8 January 2016
Brikke, F. & Davis J.(1995). Making your Water Supply Work; Operation and Maintenance
of Small Water Supply Systems. IRC International Water and Sanitation Center, The
Hague, Netherlands. Retrieved http// www.wsp.org Accessed 7 January 2016
Carter, R.C., Harvey, E., & Casey V. (2010). User Financing of Rural Hand pump Water Services, Water Aid, UK Retrieved; http://www.ircwash.org Accessed 26th January 2016
Charity: Water Retrieved http//www.charitywater.org/projects Accessed 8th January 2016
IISD, (2010). Sustainable Development: From Brundland to Rio 2012. Retrieved
http://www.un.org Accessed 25th January 2016
Corgan and Sharpe. (1986). Unpacking Participation Models, Meaning and Practice.
Community Development Journal, 43(3) 269-283
Davis, G.F & Cobb J.A. (2010). Resource Dependence Theory; Past and Future. Stanford’s
Organization Theory Renaissance. Bingley, Emerald Group
Donnelly-Roark, P. (1987). New Participatory Frameworks for the Design and Management
of Sustainable Water Supply and Sanitation Projects. WASH Technical Report No.
52/PROWWESS Report No. 50. Arlington, Va.: Water and Sanitation for Health
Project.
European Union Water Initiative. (2012) . Financing of Water Resources Management;
Experiences from Sub-Saharan Africa. Stockholm, Sweden. Retrieved
www.euwi.net/wg/finance Accessed 3rd January 2016
80
Fraenkel J.R. & Wallen, N.E .(2000). How to Design and Evaluate Research in Education.
Sage publications
Freshwater Ecosystems. Retrieved http://en.m.wikipedia.org Accessed on 28th February
2016
Geneva, Switzerland. Retrieved http://www.who.int Accessed on 25th January 2016
Gleick P.H .(2004) .Global freshwater resources: Soft-path solutions for the 21st century.
Science. 302: 1524-1528.
GWP, (2000), Integrated Water Resources Management – TAC Background Papers No. 4:
Sweden: GWP
Haysom A. (2006). A Study of the Factors Affecting Sustainability of Rural Water Supplies in
Tanzania. Retrieved http://www.sswm.info Accessed 3rd march 2016
Hutton, G., Haller, L. & Bartram, J. (2007). Global Cost Benefit Analysis of Water Supply
and Sanitation Interventions. J. Water Health
IFAD, (2006). IFAD Strategic Framework 2007-2010; Enabling the Rural Poor to overcome
Poverty. Rome, Italy. Accessed http//www.Ifad.org Retrieved 8 January 2016
International Decade for Action “Water for Life’ 2005-2015 Retrieved http;//www.un.org
Accessed 5th January 2016
Karanja, G.M. (2014). Influence of Management Practices on Sustainability of Youth Income
Generating Projects in Kangema District, Murang’a County, Kenya; International
Journal of Education and Research Vol. 2 No. 2 February 2014

81
Kenya National Bureau of Statistics, (2013). Exploring Kenya’s Inequality; Pulling Apart or
Pooling Together? KNBS, Nairobi. Kenya.
Komives, K., Akanbang, B., Thorsten, R., Tuffuor, B., Wakeman, W., Larbi, E., Bakalian, A.
& Whittington D. (2008). Post-Construction Support and the Sustainability of Rural
Water Projects in Ghana. 33rd WEDC International Conference. Accra, Ghana.
Kothari, C.R.(2014). Research Methodology; Methods and Techniques (2nd ed) New Age
International Publisher.
Kyamani (2013). Determinants of Rural Water Project Sustainability: A case of Rufiji
District, Pwani Region, Tanzania
Mcdonnel, W. (2008). The Process of Intergrated Water Resource Management (IWRM):
IRC. International Water and Sanitation.
McLvor, C. (2000). Community Participation in Water Management. Experience from
Zimbambwe.International and Entwickling GmbH.
Mimrose, D., Gunawardena, E. & Nayakakorala H. (2011). Assessment of Sustainability of
Community Water Supply Projects in Kandy District Sri Lanka; Tropical Agricultural
Research Vol. 23 (1): 51 – 60 (2011)
Mugenda, O. & Mugenda, G. (2003). Research Methods; Quantitative & Qualitative
Approaches, Acts Press. Nairobi. Kenya
Mugenda, O.& Mugenda, G. (1999). Research Methods; Quantitative and Qualitative
Approaches. Act Press, Nairobi. Kenya

82
Munyoki J, and Mulwa, A. (2012). Social Science Research: A Hand Book, First Edition,
Downtown Publishers and Printers, Nairobi. Kenya.
Munyui, E.W. (2014). Factors Influencing Sustainability of Community Water Projects: A
case of Kitui West Sub County, Kitui County, Unpublished thesis, University of
Nairobi.
Musonga K, (2004). Issues Regarding Sustainability of Rural Water Supply in Zambia.
Unpublished Thesis, University of South Africa.
Mwangi , M .(2014). Determinants of Sustainability of Community Water Projects in Kieni
East District, Nyeri County. Unpublished thesis, University of Nairobi.
Organization for Economic Co-operation and Development, (2009). Managing Water for All;
An OECD Perceptive on pricing and Financing, Key messages for Policy Makers, 2
Retrieved http//www.oecd.org Accessed 15th January 2016
Okemwa, E. N. & Wanyoike, D. M. (2015). Influence of Integrated Water Resources
Management Approach on Sustainability of Water Projects in Lake Naivasha Basin.
International Journal of Economics, Commerce and Management United Kingdom
Vol. III, Issue
Ong’ondo O. & Jwan O. (2011). Qualitative Research; An Introduction to Principles and
Techniques. Moi University Press, Moi University, Eldoret . Kenya
Ong’wen , L. (2014). Factors Influencing Sustainability of Community Water Projects in
Shianda Division, Kakamega County- Kenya. Unpublished research project,
University of Nairobi.

83
Orodho, A. J. (2004). Techniques of Writing Research Proposals and Reports in Education
and Social Sciences (1st Edition). Masola Publishers.Nairobi. Kenya
Roark, P., Yacoob, M. & Roark D. (1989).Developing Sustainable Community Water Supply
Systems; Key Questions for African Development Foundation Applicants. Retrieved
http://www.pdf.usaid.gov Accessed 4th march 2016
Sara and Katz, 1997. “Making Rural Water Supply Sustainable: Report on the Impact of
Project Rules”, UNDP World Bank Water and Sanitation Program Retrieved
http://www.wsp.org
Sustainable Development Retrieved http://www.thegreatdebate.org.uk Accessed 10th January
2016
Tafara A. (2011). Factors Influencing Sustainability of Rural Community Based Water
Projects in Mtito Andei, Kibwezi sub-county, Kenya. Unpublished research project,
University of Nairobi.
Taylor P. & Mudege N. (1996). Sustainability: The Challenge of Rural Water Supply and
Sanitation in Zimbabwe, Harare, IWSD
The Constitution of Kenya, Laws of Kenya, (2010). Amkeni Wakenya, Nairobi, Kenya.
Tifow, A. (2013). Factors Influencing Sustainability of Rural Water Supplies in Kenya: (Case
of UNICEF supported Rural Water Projects in Lake Victoria South and Lake Victoria
North water
UN WATER/AFRICA, The Africa Water Vision for 2025: Equitable and Sustainable Use of
Water for Socioeconomic Development Retrieved http//www.unwater.org Accessed 7
January 2016

84
UNICEF &WHO, (2015). Progress on Sanitation and Drinking Water; 2015 Update and
MDG Assessment. Retrieved http;//www.wssinfo.org. Accessed 5th January 2016
United Nations, (2015). World Water Development Report; Water for Sustainable World.
UNESCO. Retrieved http;//www.unesdoc.unesco.org. Accessed 23rd Jan 2016
United Nations, (2008). UN-Water report; IWRM and Water Efficiency Plans. Status Report
on IWRM and Water Efficiency Plans for CSD16 held in March, 2007
Victor, D. (2013). Water Resources Conservation Practices; Intermediate Technology
Publications. London, UK
Water and Sanitation Technology. Retrieved http://www.wateraid.org Accessed 2nd March
2016
Webster, J., Dejachew, G., Tseion, B., Mehari, M. and Tesfaye, G. (1999). Sustainability of
Rural Water and Sanitation Projects. Proceedings from the 25th WEDC Conference,
Integrated Development for Water Supply and Sanitation, Addis Ababa, Ethiopia
WELL, (1998). DFID Guidance Manual on Water Supply and Sanitation Programmes.
WELL, WEDC, Loughborough University, UK, 1998, http://www.Iboro.ac.ke/well
Accessed 24th Feb 2016
WHO, (2010). Millennium Development Goals (MDGs) Retrieved
http://www.who.int/topics/millennium_development_goals. Accessed 25th Dec 2015
Wiersman, W. (1999). Research Methods in Education: An Introduction. Itasca (U.S.A): F.E.
Peacock Publishers.

85
World Commission on Environment and Development Report ,(1987) : Our Common Future
(Brundland) Retrieved http;//www.cfr.org Accessed 3rd January 2016
World Commission on Environment and Development, (1987). Our Common Future. Oxford
University Press.
Yamane, T. (1967). Statistics : An Introductory Analysis, 2nd Edition , New York: Harper and
Row

86
APPENDICES
Appendix i: Letter of Transmittal
Suzzane Kiveu,
P.o Box 3900
Eldoret
Dear Sir/Madam,
REF: REQUEST FOR PARTICIPATION IN RESEARCH STUDY
I am a student of University of Nairobi undertaking a Master of Arts Degree in Project
Planning and Management. I am conducting an academic research on Determinants of
sustainability of community water projects in Webuye East Sub-County as part of the
requirement for the ward of a degree.
You have been selected to participate in the study. The information you will provide will be
of great importance to the Webuye East Sub-County, management team of the water projects
and the community to ensure that the water projects initiated are sustainable.
I am therefore requesting for your support and cooperation in answering the questions. The
information that will be provided will be treated with confidentiality. Thank you for your
cooperation.
Yours faithfully,
Suzzane Kiveu,
L50/80288/2015

87
Appendix ii: Questionnaire for Household Users
Determinants of Sustainability of Community Water Projects in Webuye East Sub-
County, Kenya.

88
Instructions
Please answer all questions in the relevant sections honestly and exhaustively. All the
information given will strictly be used for this study only and will be treated with utmost
confidentiality. Please tick where applicable (√)
Section A: Background Information
1. Respondent Information ( please tick appropriately)
(a) Gender Male ( ) Female ( )
(b) Age group 20-30 years ( ) 30-40 years ( ) 40-50 years ( )
50-60 years ( ) Over 60 years ( )
(c) Highest level of education attained
Never attended school ( ) Primary level ( )
Secondary level ( ) College/University ( )
(d) How long have you stayed in this area?
0-6 months ( ) 6 months - 1 year ( ) 1-5 years ( ) Over 5 years ( )
Section B: Sustainability and Water supplies
a) Type of water project a. Borehole ( ) Spring ( )
b) When was the facility developed? Under 2 years ( ) 2-4 years ( )
a. Between 4-6 years ( ) 6 years and above ( )
c) Is the facility functional? Yes ( ) No ( )
d) If No, why is the facility not functioning?
Breakdowns ( ) No one to operate ( ) Water source dried up e) Is the water supply sustainable? Yes ( ) No ( )
f) If yes, to what extent? To a very low extent ( ) To a low extent ( )
To a great extent ( ) To a very great extent ( )
g) If No give reasons…………………………………………………………………….

89
h) What do you think influences sustainability of the water projects?
Water resources conservation practices ( ) Training ( ) Technology ( )
Levels of funding ( )
Section C: Water resources conservation practices and sustainability of community
water projects
a) What is the main source/catchment area for the water project?
Groundwater ( ) Wetland ( ) Mountain/hill ( ) River ( )
b) Does the community get involved in conservation and protection of the water
catchment areas? Yes ( ) No ( )
c) If yes list some of the conservation practices..................................................................
d) Who initiates the conservation activities? Community ( ) County/ Government ( )
e) State your level of agreement with the following statement.
Water conservation practices contribute to continued water supply. Strongly Agree ( )
Agree ( ) Undecided ( ) Disagree ( ) Strongly Disagree ( )
Section D: Training and Sustainability of community water projects
a) Have you ever received any kind of training? Yes ( ) No ( )
b) What type of training have you received? .....................................................................
c) How will you rate the level of awareness on training opportunities available?
High ( ) Average ( ) Low ( )
d) How often does the community receive training? Never ( ) Rarely ( )
Occasionally ( ) Always ( )

90
e) To what extent do you think training influences sustainability of community water
projects? To a very low extent ( ) To a low extent ( )
To a great extent ( ) To a very great extent ( )
Section F: Technology choice and sustainability of community water projects
a) Which type of technology is used for extraction of water for use?
Hand pump ( ) Use of a bucket ( )
b) Was the community involved in choosing the Technology? Yes ( ) No ( )
c) Is the community conversant with the use of the technology used for extraction?
Yes ( ) No ( )
d) Who does the repairs and maintenance on the water system?
Community ( ) Technician ( )
e) Do you experience an interruption of water supply as a result of breakdowns and
failures in the systems? Yes ( ) No ( )
f) If yes in the above, how often are the interruptions?
Rarely ( ) Occasionally ( ) Always ( )
g) Are the spare parts for repairs for the water system available? Yes ( ) No ( )
h) Are the spare parts affordable Yes ( ) No ( )
i) To what extent do you think technology choice influence sustainability of community
water projects? Low ( ) Average ( ) High ( )
Section E: Levels of funding and Sustainability of community water projects
a) What is the source of funds for construction of the water project?
Community ( ) County/Government ( )
b) Does the community contribute towards funding for O & M? Yes ( ) No ( )
c) Do you pay to get water? Yes ( ) No ( )
d) How will you rate the level of funding? High ( ) Average ( ) Low ( )

91
e) To what extent do you think levels of funding have contributed to sustainability of
the water project? To a very low extent ( ) To a low extent ( )
To a great extent ( ) To a very great extent

92
Appendix iii: Questionnaire for Water Committee Members
Section A: Background Information
a) Gender Male ( ) Female ( )
b) Age group 20-30 years ( ) 30-40 years ( ) 40-50 years ( )
50-60 years ( ) Over 60 years ( )
c) Highest level of education attained
Never attended school ( ) Primary level ( )
Secondary level ( ) College/University ( )
d) How long have you served in this committee?
0-6 months ( ) 6 months - 1 year ( ) 1-5 years ( ) Over 5
years ( )
e) What is the composition of the water committee in terms of gender?
Men....................... Women.................................
Section B: Sustainability and Water supplies
a) Type of water project
a. Borehole ( ) Spring ( )
b) When was the facility developed? Under 2 years ( ) 2-4 years ( )
a. Between 4-6 years ( ) 6 years and above ( )
c) Is the facility functional? Yes ( ) No ( )
d) If No, why is the facility not functioning?
e) Breakdowns ( ) No one to operate ( ) Water source dried up
f) Is the water supply sustainable? Yes ( ) No ( )
g) If yes, to what extent? To a very low extent ( ) To a low extent ( )
h) To a great extent ( ) To a very great extent ( )

93
i) If No give reasons…………………………………………………………………….
j) What do you think influences sustainability of the water projects?
Water resources conservation practices ( ) Training ( )
Technology ( ) Levels of funding ( )
Section C: Water resources conservation practices and sustainability of community
water projects
a) What is the main source/catchment area for the water project?
Groundwater ( ) Wetland ( ) Mountain/hill ( ) River ( )
b) Does the management committee get involved in conservation and protection of
the water catchment areas? Yes ( ) No ( )
c) If yes list some of the conservation
practices..................................................................
d) Who initiates the conservation activities? Community ( ) County/ Government ( )
e) State your level of agreement with the following statement.
f) Water conservation practices contribute to continued water supply. Strongly
Agree ( ) Agree ( ) Undecided ( ) Disagree ( ) Strongly
Disagree ( )
Section D: Training and Sustainability of community water projects
a) Have you ever received any kind of training? Yes ( ) No ( )
b) What type of training have you received? .....................................................................
c) How will you rate the level of awareness on training opportunities available?
High ( ) Average ( ) Low ( )
d) How often does the management committee executives receive training?
Never ( ) Rarely ( ) Occasionally ( ) Always ( )

94
e) To what extent do you think training influences sustainability of community water
projects? To a very low extent ( ) To a low extent ( )
To a great extent ( ) To a very great extent ( )
Section F: Technology choice and sustainability of community water projects
a) Which type of technology is used for extraction of water for use?
Hand pump ( ) Gravity fed pipes ( )
b) Was the management committee executive members involved in choosing the
Technology? Yes ( ) No ( )
c) Is the management committee executive team conversant with the use of the
technology used for extraction? Yes ( ) No ( )
d) Who does the repairs and maintenance on the water system? Community ( )
Technician ( )
e) Do you experience an interruption of water supply as a result of breakdowns and
failures in the systems? Yes ( ) No ( )
f) If yes in the above, how often are the interruptions?
Rarely ( ) Occasionally ( ) Always ( )
g) Are the spare parts for repairs for the water system available? Yes ( ) No ( )
h) Are the spare parts affordable Yes ( ) No ( )
i) To what extent do you think technology choice influence sustainability of community
water projects? Low ( ) Average ( ) High ( )
Section E: Levels of funding and Sustainability of community water projects
a) What is the source of funds for construction of the water project?

95
Community ( ) County/Government ( )
b) Does the community contribute towards funding for O & M? Yes ( ) No ( )
c) Do you pay to get water? Yes ( ) No ( )
d) How will you rate the level of funding? High ( ) Average ( ) Low ( )
e) To what extent do you think levels of funding have contributed to sustainability of the
water project? To a very low extent ( ) To a low extent ( )
To a great extent ( ) To a very great extent

96
Appendix iv: Interview Schedule for Key Informant-from the Ministry
1. In your own opinion has the county government managed to conserve and protect the
water sources? What are some of the strategies that have been employed?
2. In which ways has the county government gotten involved in creating awareness on
conservation and protection of water sources and catchment areas?
3. What initiatives have you put in place to ensure the communities are trained and
educated on management practices that ensures sustainability of water projects?
4. What new technologies has the county been able to introduce to communities to
ensure sustainability of water projects?
5. What are the sources of funding for the community water projects in the county? do
you think there are other sources which you have not explored?
6. From your own opinion has the county government been able to fund maintenance
costs of county sponsored water projects?
7. What are your recommendations on how to ensure sustainability of water projects in
the county?

97
Appendix v: Map of Webuye East Sub-County
KEY
Maraka Ward
Mihuu Ward
Ndivisi Ward

98
Appendix vi: Community Water Projects in Webuye East Sub-County
1. Ndivisi Water Spring 2. Namwatikho Water Spring
3. Sang’alo Water Spring 4. Wabukhonyi Water Spring
5. Masibai Water Spring 6. Chetekei Water Spring
7. Makuselwa Water Spring 8. Chepkora Water Spring
9. Sinoko Water Spring 10. Sitabicha Water Spring
11. Namarambi Water Spring 12. Joseph Wafula Water Spring
13. Chebukwari Water Spring 14. Meso Water Spring
15. Magemo Water Spring 16. Masweveve Water Spring
17. Maasai Water Spring 18. Matumbufu Water Spring
19. Misemwa Water Spring 20. John Isoka Borehole
21. Makuselwa Primary Borehole 22. Sinoko health Center Borehole
23. Namarambi Primary Borehole 24. Magemo Dam Borehole
25. Stanley Sifuma Borehole 26. Johnstone Siundu Borehole
27. Iyaya Borehole 28. Silungai Primary Borehole
29. Makuselwa Secondary Borehole 30. Sinoko Water Spring
31. Marambakila Water Spring 32. Timotheo Water Spring
33. Luvande Water Spring 34. Marambakanywa Water Spring
35. Nabiswa Water Spring 36. Fwamba Water Spring
37. Khamunialo Water Spring 38. Aggrey Water Spring
39. Webi Water Spring 40. Wanjofu Water Spring
41. Pombo Toto Water Spring 42. Maruum Water Spring
43. Sirende Water Spring 44. Manyorori Water Spring
45. Mwasame Water Spring 46. Tete Water Spring
47. Muyaisi Water Spring 48. Njebwe Water Spring
49. Sinoko Misimo Water Spring 50. Wanene Water Spring

99
51. Mukonyole Water Spring 52. Lukorito Water Spring
53. Khutambi Water Spring 54. Brando Water Spring
55. Makokha Water Spring 56. Mapata Water Spring
57. Sitemu Water Spring 58. Khaoya Water Spring
59. Lumakanda Water Spring 60. Sipala Water Spring
61. Lusenaka Water Spring 62. Kakai Water Spring
63. Wanakacha Water Spring 64. Walindi Water Spring
65. Mwibanda Water Spring 66. Siundu Water Spring
67. Webale Water Spring 68. Mohammed Water Spring
69. Mwinami Water Spring 70. Walela Water Spring
71. Silapwe Water Spring 72. Ngosafia Water Spring
73. Namilama Water Spring 74. Namusasi Water Spring
75. Walubengo Water Spring 76. Sindano Water Spring
77. Siketi Water Spring 78. Lubwani Water Spring
79. Wafula Water Spring 80. Ndumbu Water Spring
81. Siyilila Water Spring 82. Mihuu Secondary Borehole
83. Mihuu Chief’s Office 84. Mulachi Dispensary Borehole
85. Lugulu Borehole 86. Jesus Praise Temple Borehole
87. Simwelo-Magemo Borehole 88. Lugusi dispensary Borehole
89. Nabuyole Borehole 90. Lufwindiri Water Spring
91. Maraka Water Spring 92. Ngano Water Spring
93. Wanainchi Water Spring 94. Mkinisu Water Spring
95. Nzoia Water Spring 96. Makuma Water Spring
97. Lukhendu Water Spring 98. Lang’oto Water Spring
99. Sango Water Spring 100. Namukisu Water Spring

100
Appendix vii: Introduction Letter

101
Appendix viii: NACOSTI Permit