DETERMINANTS OF FINANCIAL DISTRESS AMONG …etd.uum.edu.my/4924/2/s816217_abstract.pdf ·...
56
DETERMINANTS OF FINANCIAL DISTRESS AMONG MANUFACTURING COMPANIES IN MALAYSIA BY NUR HAFIZAH BINTI ROSLAN Thesis Submitted to Othman Yeop Abdullah Graduate School of Business, Universiti Utara Malaysia, in Fulfillment of the Requirement for the Degree of Master of Science in Finance
Transcript of DETERMINANTS OF FINANCIAL DISTRESS AMONG …etd.uum.edu.my/4924/2/s816217_abstract.pdf ·...

DETERMINANTS OF FINANCIAL DISTRESS AMONG
MANUFACTURING COMPANIES IN MALAYSIA
BY
NUR HAFIZAH BINTI ROSLAN
Thesis Submitted to
Othman Yeop Abdullah Graduate School of Business,
Universiti Utara Malaysia,
in Fulfillment of the Requirement for the Degree of
Master of Science in Finance
i
PERMISSION TO USE
In presenting this dissertation in partial fulfillment of the requirements for a Post
Graduate degree from the Universiti Utara Malaysia, I agree that the Library of this
university may make it freely available for inspection. I further agree that permission
for copying this dissertation in any manner, in whole or in part, for scholarly
purposes may be granted by my supervisor or in their absence, by the Dean of
Othman Yeop Abdullah Graduate School of Business where I did my dissertation. It
is understood that any copying or publication or use of this dissertation parts of it for
financial gain shall not be allowed without my written permission. It is also
understood that due recognition shall be given to me and to the UUM in any
scholarly use which may be made of any material in my dissertation.
Request for permission to copy or to make other use of materials in this dissertation
in whole or in part should be addressed to:
Dean of Othman Yeop Abdullah Graduate School of Business
Universiti Utara Malaysia
06010 UUM Sintok
Kedah Darul Aman

ii
ABSTRACT
This study is conducted to evaluate the relationship between liquidity (WCTA,
CACL), leverage (TDTA, CLNW), profitability (EBTA, ROE, ROA), BTMV, sales
growth, and cash flow (CFFTL, CFITL, CFOTL) and the corporate financial distress
among listed manufacturing firms in Malaysia. This study uses a sample from 2001
to 2014. Logistic regression is used to evaluate the relationship between the variables
in three models. In model 1, the result shows that the WCTA, TDTA, EBTA, ROA,
BTMV, and CFOTL have significant relationship with corporate financial distress. In
model 2 when only cash flows variables are included, the results show that CFITL
and CFOTL are negatively significant with financial distressed. In model 3 when all
variables are included in the analysis, the results remain similar as in model 1. In
model 4 when the stepwise logit regression is used, the results similar as in model 1.
Keywords: Logistic regression, financial distressed, cash flow

iii
ABSTRAK
Kajian ini dijalankan untuk menilai hubungan antara kecairan (WCTA, CACL),
hutang (TDTA, CLNW), keuntungan (EBTA, ROE, ROA), BTMV, pertumbuhan
jualan, dan aliran tunai (CFFTL, CFITL, CFOTL) dan kesulitan kewangan syarikat-
syarikat pembuatan yang disenaraikan di Malaysia. Kajian ini menggunakan sampel
dari tahun 2001 hingga 2014. Kaedah regresi logistik digunakan untuk menilai
hubungan antara pembolehubah dalam tiga model. Dalam model 1, hasilnya
menunjukkan bahawa WCTA, TDTA, EBTA, ROA, BTMV dan CFOTL
mempunyai hubungan yang signifikan dengan masalah kewangan korporat. Dalam
model 2 apabila pembolehubah aliran tunai sahaja dimasukkan, keputusan
menunjukkan bahawa CFITL dan CFOTL adalah negatif dan signifikan dengan
kesulitan kewangan. Dalam model 3 apabila semua pembolehubah dimasukkan
dalam analisis, hasilnya tetap sama dengan model 1. Dalam model 4, apabila kaedah
‘stepwise logit regression’ digunakan, keputusannya adalah sama seperti model 1.
Katakunci: Regresi logistik, kesulitan kewangan, aliran tunai.

iv
ACKNOWLEDGEMENT
Bismillahirrahmanirrahim,
Firstly I would like thank to Allah s.w.t. for giving me the strength and courage until
I manage to finish this project paper successfully. At the beginning of the process of
doing this project paper, I have gone through some hardship and difficulty at first as
it requires lots of research, with support from my family and friends, and also
guidance from all the lecturers, I manage to finish this project paper. I owe the
successful completion of this project paper to those who have willingly and
relentlessly offered their guidance and assistance to me. I would also like to express
my gratitude to my dearest supervisor, Associate Professor Dr. Rohani Md Rus for
her advice and guidance until this dissertation is complete. She helped me a lots from
the very beginning of the process. Her guidance and the knowledge she had shared to
me for process have help me to proceed with the project paper without any difficulty.
Without her support and encouragement, I would not be successful completing this
project paper. So I would like to share this dissertation successful with her. Lastly, I
would not forget to all my friends who had helped me a lots in the process of
completing this dissertation.
v
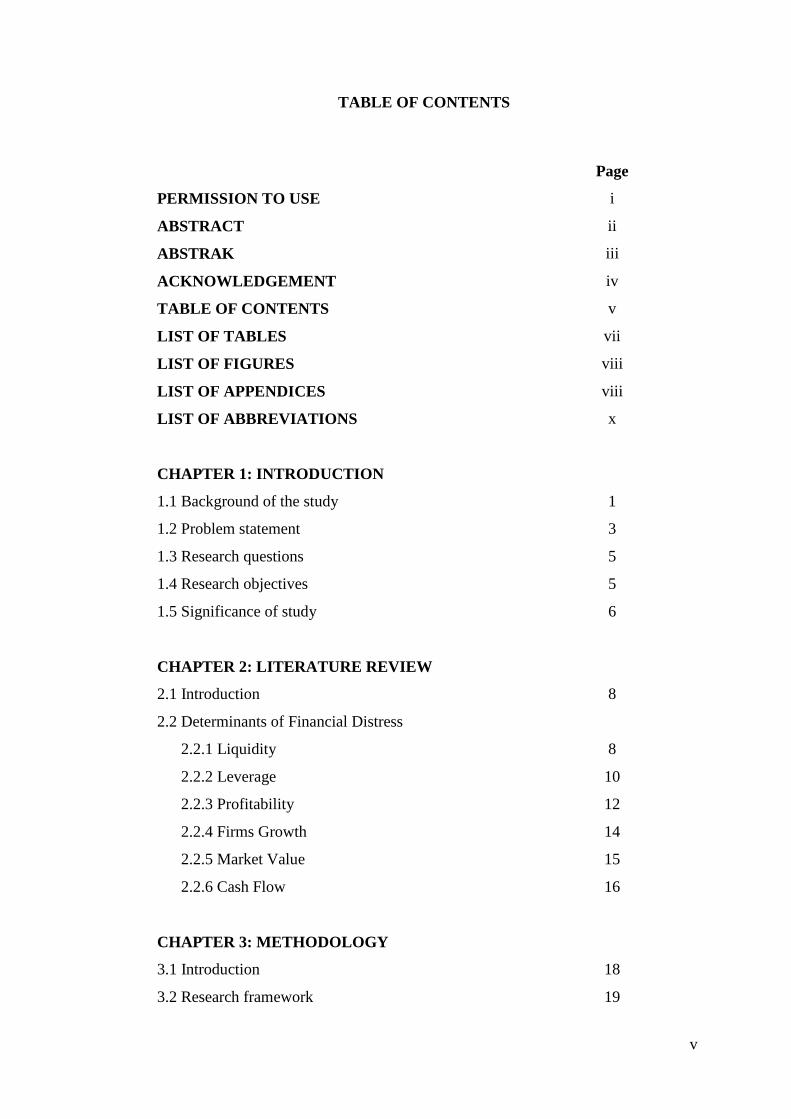
TABLE OF CONTENTS
Page
PERMISSION TO USE i
ABSTRACT ii
ABSTRAK iii
ACKNOWLEDGEMENT iv
TABLE OF CONTENTS v
LIST OF TABLES vii
LIST OF FIGURES
LIST OF APPENDICES
viii
viii
LIST OF ABBREVIATIONS
x
CHAPTER 1: INTRODUCTION
1.1 Background of the study 1
1.2 Problem statement 3
1.3 Research questions 5
1.4 Research objectives 5
1.5 Significance of study
6
CHAPTER 2: LITERATURE REVIEW
2.1 Introduction 8
2.2 Determinants of Financial Distress
2.2.1 Liquidity
2.2.2 Leverage
2.2.3 Profitability
2.2.4 Firms Growth
2.2.5 Market Value
2.2.6 Cash Flow
8
10
12
14
15
16
CHAPTER 3: METHODOLOGY
3.1 Introduction 18
3.2 Research framework 19

vi
3.3 Variables 20
3.4 Hypotheses 23
3.5 Measurement of variables 26
3.5 Data collection 27
3.7 Sampling 28
3.8 Data analysis
29
CHAPTER 4: FINDINGS
4.1 Introduction 32
4.2 Descriptive statistics
4.3 Correlation Analysis
32
35
4.4 Logistic regression
37
CHAPTER 5: CONCLUSION AND RECOMMENDATION
5.1 Conclusion 41
5.2 Limitation of the study 42
5.3 Recommendation
43
REFERENCES 44-46
vii
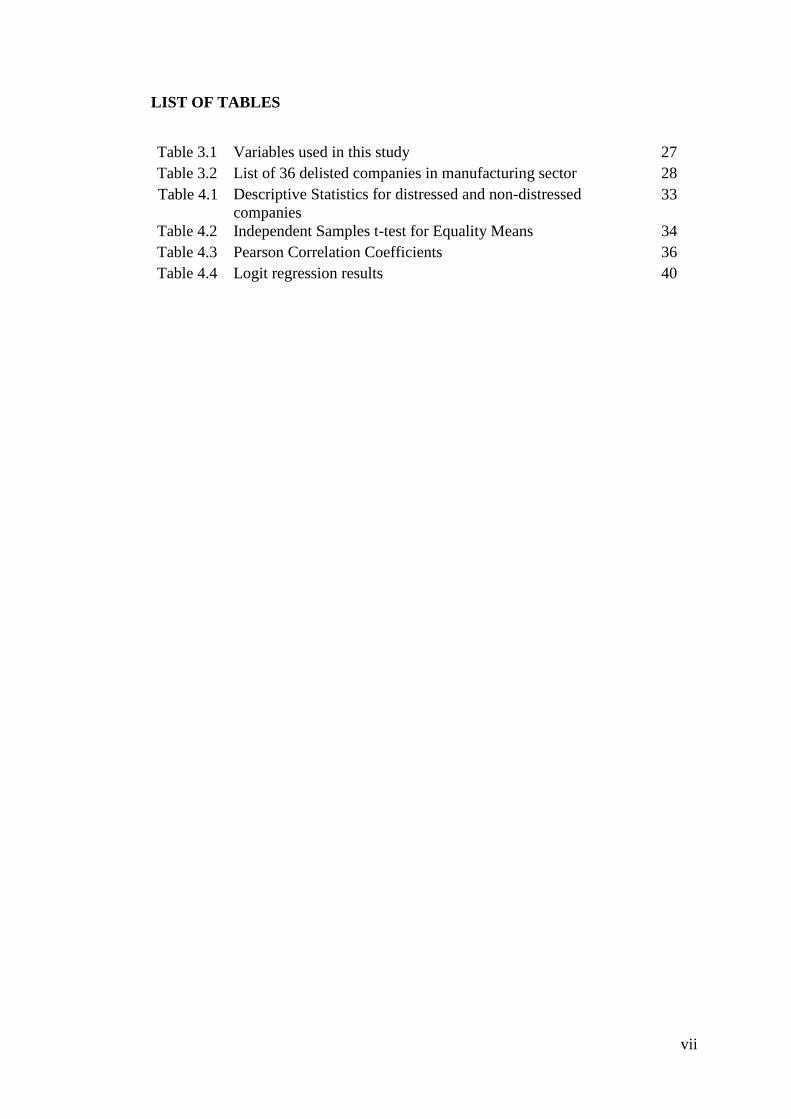
LIST OF TABLES
Table 3.1 Variables used in this study 27
Table 3.2 List of 36 delisted companies in manufacturing sector 28
Table 4.1 Descriptive Statistics for distressed and non-distressed
companies
33
Table 4.2 Independent Samples t-test for Equality Means 34
Table 4.3 Pearson Correlation Coefficients 36
Table 4.4 Logit regression results 40

viii
LIST OF FIGURES
Figure 3.1 Theoretical Framework: Relationship between corporate
financial distress and firms’ performance
24
LIST OF APPENDICES
A List of 84 Delisted Companies in Manufacturing Sector 45
B List of Matching Between Distressed and Non-Distresses
Companies Based On Total Asset
47

ix
LIST OF ABBREVIATIONS
WCTA Working capital to total assets
CACL Current assets to current liabilities
TDTA Total debt to total assets
CLNW Current liabilities to net worth
EBTA Earnings before interest and taxes to total assets
ROE Return on Equity
ROA Return on assets
BTMV Book to market value
CFFTL Cash flow from financing to total liabilities
CFITL Cash flow from investing to total liabilities
CFOTL Cash flow from operating to total liabilities
SMEs Small and medium sized enterprises
TEST Tehran stock exchange
MDA Multivariate discriminant analysis
PN17 Practice Note 17
PN4 Practice Note 4
DSC Debt Service Coverage
KSE Karachi Stock Exchange
KRIS Kamakura Risk Information Services
1
CHAPTER ONE
INTRODUCTION
1.1 Background of the Study
The research on bankruptcy prediction is still an important topic in the
finance area. Bankruptcy is a circumstance when companies are unable to
meet or having difficulty to pay pecuniary obligation to creditors.
“Bankruptcy”, “insolvency”, “default”, and “failure” are the other terms
usually used to describe the situation where the firms face financial
difficulties. The chances to be in the financial difficulties increase when
firms have high fixed costs, illiquid assets or their income is sensitive to the
economic downturn. Malaysia has a strong economic fundamental before the
Asian financial crisis in mid-1997. However, after the crisis, many Malaysian
companies was restructured as most of the companies was affected by the
crisis, and many companies fall into bankruptcy (Ferri et al., 1998). During
the crisis period, almost 50% of the Malaysian ringgit has devalued. The
Malaysian stock market also shows a decrease of 54% for the six months
ended December 31, 1997, creating a serious impact on the economy in the
country.
In Malaysia, companies that falls under financial distress condition
are classified as PN17 companies (Practice Note 17). The companies that are
under PN17 category must submit their proposals to the Board of Approval to
restructure and restore the company to maintain the status in listing. Before

2
2005, the listed companies which in a state of PN17 are classified under
PN4.
Forecasting corporate financial distress has attracted the attention of
financial economists as it can provide a signal regarding the company
financial condition. A range of techniques have been developed to predict
bankruptcy (Altman, 1968; Shumway, 2001; Jones and Hensher, 2004).
Research regarding failure of the company comes out with a model to predict
the corporate financial problems (Altman, 1968, Haldeman and Narayanan,
1977). This model has been widely used for a variety of purposes, such as
loan assessments by the lender, an assessment by the auditors and the
portfolio risk assessment by the fund managers and others (Jones and
Hensher, 2004).
There are varieties of methods used to predict failure such as
multivariate discriminant analysis, probit model, logit model, survival
analysis and neural networks; all of this is the traditional model for prediction
of distress. According to the study by Chi and Tang (2006), their bankruptcy
prediction model shows a good classification accuracy by using logit
analysis. Laitinen and Laitinen (2000) also adopted logistic regression in their
bankruptcy predictive model to prevent problems related with variables
normality.
The earlier studies of bankruptcy assert that financial ratios are very
important to distinguish the companies into healthy and non-healthy.
Therefore this study will use financial ratios to predict corporate failure for
Malaysian manufacturing firms for the period from 2001 to 2014.

3
1.2 Problem Statement
Liquidity ratio plays a significant role in predicting financial distress
(Altman, Haldeman, & Narayanan, 1977). This might happen because firms
with higher liquidity will have more money to cover all their financial
obligations on time. Keige (1991), Kiragu (1993) and Ohlson (1980) find that
current asset to current liabilities has successfully predict bankruptcy. In
contrast, Nyamboga, Omwario, Muriuki and Gongera (2014) find that
profitability ratio measured by earnings before interest and taxes to total
assets is significant. However, Paranowo (2010) and Salehi and Abedini
(2009) find that profitability ratio has no significant effect on the corporate
financial distress status. Hence, this study will look at the relationship
between profitability and financial distress.
For leverage ratio, the study from Keige (1991) and Halim (2008)
conclude that the leverage ratio is a significant predictor of corporate distress.
The study measure the leverage ratio by using total debt to total assets.
Paranowo (2010) also find that leverage ratio proxied by debt service
coverage is also a significant predictor. However, Nyamboga, Omwario,
Muriuki and Gongera (2014) find that leverage ratio measured by book value
of equity to total liabilities does not have a significant ability to predict
financial distress. Hence, this study will look at the relationship between
leverage and financial distress.
According to Dichev (1998), book-to-market can be a factor to
measure distress. This confirms the earlier study by Beaver (1996) and
followed by Altman (1968) who indicate that book-to-market value as the

4
most critical variable in predicting bankruptcy. Fama and French (1992) also
find that book-to-market effect may be a cause of risk in financial distress
companies. In contrast, the study by Titman and Wessels (1988) find that the
relationship between this ratio and financially distressed firms is substantially
weaker. Hence, this study will analyse the relationship between book-to-
market and distress.
Platt and Platt (2008) find that sales growth is the most significant
variable in predicting bankruptcy. Higher sales will lead to a higher profit,
thus it will reduce the tendency of becoming bankrupt. Most study indicates
that the larger the growth in sales, the lower is the possibility of financial
difficulties (Altman, 1984; Giroux and Wiggins, 1984; Opler and Titman,
1994; and Plat, Platt, and Chen, 1995). Hence, this study will analyse the
relationship between growth and financial distress.
Many previous studies measure the prediction of financial distress
using operating cash flow and find that operating cash flow is an important
variable in financial distress prediction. (Gombola and Ketz, 1983; Gombola
et. al,1983; Libby, 1975; Aziz and Lawson, 1989; Beaver, 1966; Altman,
2000; Largay and Stickney, 1980; Andreas Charitou et al., 2004; Deakin,
1972; Gilbert, 1990; Charitou and Venieris, 1990; Fulmer et al., 1991; and
Sharma and Iselin, 2000). Ward (2011) indicates that cash flow from
operating and cash flow from investing are important variables in predicting
financial distress. However, cash flow from financing is not a significant
variable. Hence, this study will analyze the relationship between cash flow
variables and financial distress.
5
1.3 Research Questions
The following research questions are formulated for the study.
1) Is there any relationship between financial distress and liquidity of the
firms?
2) Is there any relationship between corporate financial distress and
leverage?
3) Is there any effect of the firms’ financial distress on their
profitability?
4) Is there any relationship between book-to-market ratio and financial
distress?
5) Is there any relationship between financial distress and firms’ growth
level?
6) Is there any relationship between cash flows and firms’ financial
distress?
1.4 Research Objectives
1.4.1 General Objective
The general objective for this study is to evaluate the
determinants of financial distress among manufacturing firms listed in the
Bursa Malaysia.

6
1.4.2 Specific Objectives
The specific objectives for this research are based on the research
question as above:
1) To determine the relationship between financial distress and liquidity
of the firms.
2) To evaluate the effect of corporate financial distress and leverage.
3) To examine the effect of the financial distress and profitability.
4) To examine the relationship between book-to-market ratio and firms’
financial distress.
5) To determine the effect of financial distress on growth level.
6) To investigate the relationship between cash flow and firms’ financial
distress.
1.5 Significance of Study
Compared to previous study, this study uses a longer period, which is
from 2001 to 2014. Having a longer period allows more firms to be included
as a sample. Hence, the result will be more reliable.
Besides using a traditional ratio to predict bankruptcy, this study also
uses three types of cash flows which are cash flow from financing, cash flow
from investing, and cash flow from operating. Hence, this study is able to

7
show whether cash flow is an important factor that contributes to the failure
of the firm.

8
CHAPTER TWO
LITERATURE REVIEW
2.1 Introduction
There are several prior studies and investigations that identify the
determinants of corporate financial distress among non-financial firms. The
determinants of financial distress have been conducted by scholars all over
the world through many studies and using various methods.
2.2 Determinants of Financial Distress
2.2.1 Liquidity
The liquidity ratio is among the popular ratio that has been used in
corporate financial distressed. Studies that have used liquidity ratios are
Mohammed (1997), Altman, Haldeman, & Narayanan (1977), Salehi &
Abedini (2009), Kiragu (1993), Altman (1968), Kimura (1980), Paranowo
(2010), Keige (1991), Baimwera (2006), Sulaiman and Sanda (2001),
Paranowo (2010) and Theodossiou, (1996). Their study provide some
evidence on the usefulness of accounting information specifically the
financial ratio as an indicator of present, past and future performance. In
general, financial analysts and investors used financial ratios to evaluate or to
identify the financial distress or bankruptcy.
9
The study of Altman, Haldeman, and Narayanan (1977) find that
liquidity is the most significant indicator for financial distress. Their study
use a matched sample consists of 53 bankrupt companies and 58 non-
bankrupt entities between the years 1969 to 1975. The model adopted by
them is multiple discriminant analysis. The finding suggests that companies
should retain sufficient liquidity to prevent the insolvency problems.
Paranowo (2010) uses debt service coverage ratio as a proxy for liquidity and
find liquidity as a significant variable. The sample consists of public listed
non-financial companies in Indonesia for the period from 2004 to 2008.
On the other hand, Altman (1968) uses a sample from manufacturing
sector and find that liquidity ratio is not significant in predicting the
bankruptcy. Keige (1991) uses discriminant analysis and concludes that
stakeholder should give an attention to liquidity. Baimwera (2006) using Z-
Score model find that liquidity has no significant influence in determining
corporate financial distress. Similar findings is given by Theodossiou (1996)
who finds that liquidity ratios is not significant, despite the fact that this
measure is important determinants in the previous empirical papers. The
reason might be on the proxy of liquidity used by the researchers.
Kiragu (1993) conducted a study of corporate failure prediction using
accounting data of price adjusted. He uses a matched sample of 10 bankrupt
firms and the 10 healthy firms. Financial ratios are calculated from financial
statistics adjusted price level. Discriminant model developed shows that the
9 of the ratios has the ability to predict corporate failure. He finds that
liquidity is the most important ratio and has negative relationship with

10
financial distressed. This conclusion is in line with previous findings. Firms
need to maintain sufficient liquidity to prevent the problem of insolvency.
Sulaiman and Sanda (2001) use logit model to predict the corporate
failure in Malaysia. Their study uses the data that is obtained from the Kuala
Lumpur Stock Exchange Companies Annual Handbook. The bankrupt
companies used in their research are those that has not sought for court
protection and the companies which have sought for court protection. The
finding shows that liquidity is negatively significant with corporate
failure. The result is similar with previous studies even though the model
used is different.
Nyamboga, Omwario, Muriuki, Gongera (2014) use debt service
coverage ratio (DSCR) as their proxy for financial distressed. The sample
consists of of 38 non-financial public firms listed in the NSE and the data is
achieved from the financial statement of the selected companies from 2007 to
2010. The Altman Z-score model is used to determine the financial distress of
companies and they find that liquidity has no significant effect on corporate
financial distress.
2.2.2 Leverage
The studies which discuss the relationship between corporate
financial distress and leverage ratios are Titman and Opler (1994), Paranowo
(2010), Baimwera (2006), Shamser et al. (2001), Tan (2012), Andrade and
Kaplan (1998), and Malik (2013).
11
Titman and Opler (1994) find that leverage has a positively significant
relationship with distressed. However, Paranowo (2010) found leverage has a
positively significant relationship with debt service coverage (DSC). A
similar finding by Keige (1991) also concludes that leverage is as an
important variable. The results of Theodossiou et al. (1996) indicate that
leverage factors have strongly impact in financial problems. In this respect,
firms having high leverage ratios are more disposed to failure during
low income or recessionary periods.
However, Baimwera (2006) study uses DSC as a proxy to corporate
financial distress. The result shows that leverage has no significant effect
with financial distress. This finding is different from Keige (1991) who find
that leverage is important variable in predicting the financial distress.
In addition, Shamser et al. (2001) attempt to identify the common
characteristics of the failed firms that are listed on Bursa Malaysia and find
that the leverage of those firms increase gradually as they approach
bankruptcy. Significant decline in this ratio occurred a year before failure.
This study finds that there is a consistent trend in the changes of selected
financial ratios towards bankruptcy and it gives an early signal on the
potential failure or financial problems of the firm.
A study to determine the relationship between financial performance
and financial distress during the financial crisis by Tan (2012) is carried
out and the results confirm that the firms that have a low level of leverage
tend to do better than those firms with a higher amount of leverage. In
addition, the negative relationship between crises augments financial
12
difficulties and financial performance and this simply shows that high
leverage is a bad experience during the crisis. The result is consistent with
Andrade and Kaplan (1998).
Furthermore, by using financial ratios, Malik (2013) evaluate the
financial difficulties of Pakistanis firm that a listed on Karachi Stock
Exchange (KSE). The non-financial companies from 2003 to 2010 are used
as the sample and the analysis is done by using Z-score model. The results
show that the leverage is positively significant to the financial distressed and
it suggests that the use of a high level of leverage contributes to the
bankruptcy.
2.2.3 Profitability
Profitability ratio is among the standard variable use in the study on
the relationship between the financial distressed and firm specific factor.
Prior study which discusses bankruptcy using profitability as the variable are
Altman (1968), Altman, Haldeman, and Narayanan (1977), Kiragu (1993),
Nyamboga, Omwario, Muriuki, Gongera, (2014), and Paranowo (2010), Li
(2007), Geng, Bose and Chen (2013).
Altman (1968) using Z-Score model concludes that profitability
has a positive relationship with distress and it is the most significant ratio in
predicting failure. Kimura (1980) also indicates that profitability is the most
important ratio.
On the other hand, Paranowo (2010) study revealed that
profitability do not has an impact on the status of corporate financial
problems. This leads to the conclusion that high profits is not a guarantee that

13
companies can live to satisfy its liability. However, financially distressed
firms with above average profitability may be appealing acquisition targets to
firms that have the income and know how to improve their financial distress
problems. This result is based on Indonesian companies.
Szilagy, Hilsche, and Campbell (2010) study aim to examine the
factors that determine individual and corporate financial problem of public
companies listed on the Kamakura Risk Information Services (KRIS). They
use logit model as the method. The result is similar with previous researcher
which find that profitability has a negatively significant relationship with
financial difficulties.
Salehi and Abedini (2009) investigate the relationship between
profitability and financial distress prediction of listed companies on
Tehran Stock Exchange (TES). For this reason, they use the multiple
regressions as the model. Valuation models made using the data from the
two groups. The first group consists of 30 companies which do not have any
financial difficulties, and for the second group, likewise, contain of 30
companies facing the financial difficulties. Their study find that profitability
has negative significant relationship with financial distressed.
Bhunia, Khan and Mukhuti (2011) use companies listed on Indian
Stock Exchange as a sample. The data is collected from the Companies
Annual Report. A matched sample design method is applied in their analysis.
Each failed company has a non-failed “partner” in the sample. Paired samples
of failed and non-failed companies from year of 2001 to 2010 are utilized in
their analysis. Their result is different from previous studies where they find

14
that profitability is not significantly related with financial distressed. This
result might occur because the proxy for liquidity use in the study is different
from previous study.
Li (2007) uses a rough set (RS) model to study the financial distress
prediction for Chinese listed companies. The sample consists of 212 financial
distressed firms and 212 healthy firms from the years 1998 to 2005. The
result from this study finds that profitability has a strong effects on corporate
financial distress.
Geng, Bose and Chen (2013) studies the prediction of financial
distress for 107 Chinese companies that received the label ‘special treatment’
from 2001 to 2008 by the Shanghai Stock Exchange and the Shenzhen Stock
Exchange. They use data mining techniques to build financial distress
warning models based on 31 financial indicators and using three different
time windows by comparing these 107 firms to a control group of firms. The
results find an important role of profitability in predicting financial
distress.
2.2.4 Firms Growth
Most previous studies use assets to sales ratio as a proxy to measure
sales growth. The result shows that an assets to sale has a positively
significant relationship to financial distress costs (John, 1993). To identify
troubled companies, Opler and Titman (1994) study use sales growth as a
variable. Then, they find a negative growth in sales is related to the
companies that have problems in their daily business. Both indicators are
particularly important during a recession because they reflect not only the
15
structure of the effective operations of the company, but it shows that it is
also dependent on investor sentiment, the state of competition and also to the
general condition of the industry.
Altman (1984) estimate the cost of the financial difficulties by using
two measures. The first measure is decline in the sales compared with other
firms in the industry, and the second is a measure of the deviation between
the firms in their real earnings and forecast their income in three years before
they file for bankruptcy. They find that the observed decline in sales is due to
the financial difficulties of the firm.
Another measure of growth used by previous authors is operating
income. At the early stages of financial distress, operating income falls below
industry average and this shows that it is positively significant with distressed
(Whitaker, 1999).
2.2.5 Market Value
Baimwera (2006) study the relationship between the ratio of
book-to-market of equity, distress risk and stock of return. The risk of distress
is proxied by the score of Ohlson. The ratio of book-to-market equity and risk
of distress as proxied by O-score is also compared to other variables that are
considered to be related with distress. Stocks are listed each year based on the
probability of the difficulty and the ratio of books-to-equity market and
Spearman’s rank correlation coefficients are calculated between ranks. The
results show that the ratio of book-to-market equity and risk of distress are
both negative in relation. Furthermore, Baimwera (2006) also look at the
relationship between book-to-market and return and find that book-to-market
16
and return and find that book-to-market equity is positively related to return
but the relationship is not very powerful.
A study conducted by Altman (2003) who use financial ratios to
predict the occurrence of bankruptcy is able to correctly predict 94% one year
before bankruptcy occurs, and 72% two years before the actual event. Book-
to-market ratio is found positively significant on bankruptcy prediction.
According to Dichev (1998), firm distress risk factor is related to size and the
book-to-market effects. A natural proxy for firm distress is bankruptcy risk.
He hypothesize that if bankruptcy is systematic, one would expect a positive
association between bankruptcy risks and subsequent realized returns.
However, his study proved that bankruptcy risk is not rewarded by higher
returns. Thus a distress factor is unlikely to account for the size and book-to-
market effects. Surprisingly, firms with high bankruptcy risk earn lower than
average returns since 1980. A risk based description cannot fully explain
inconsistent evidence.
2.2.6 Cash Flow
Most previous studies use cash flow information as a variable to
predict the bankruptcy. The studies that use operating cash flow are Beaver
(1966), Deakin (1972), Blum (1974), Casey and Bartczak (1984, 1985),
Gentry et al. (1990), and Ward (1992, 2011).
The significance of cash flow information for predicting bankruptcy
is emphasized by Beaver (1966). Beaver (1966) uses net income plus
depreciation, depletion and amortisation, to total debt as a proxy for cash

17
flow from operations (CFFO). Nevertheless, the univariate approach to
analyze financial problems is rarely followed by other researchers.
Deakin (1972) uses cash flow to total debt as the cash flow variable
and uses a dichotomous classification test to study a single-year and multiple-
years discriminant analysis; all for 1 to 5 years prior to failure. He finds that
CF/TD is significant for 1, 2, and 3 years prior to failure with single-year
discriminant models. Blum (1974) has similar result where CF/TD is a
significant variable but he uses multivariate discriminant analysis as a
method.
Casey and Bartczak (1984) use CFFO, CFFO/CL, and CFFO/TL as
the variables in their MDA model in the study. The results of their study find
that CFFO/CL is significant for the first three years, CFFO/TL for the first
two years, and CFFO for years 1, 4, and 5 prior to bankruptcy. The best
MDA model contain only CFFO variable.
Ward (2011) uses CFFO, CFFI, and CFFF and scaled them by total
liabilities in mining, oil, and gas firms. The study also uses logistic regression
prediction models. He find that CFFO is an important indicator to predict
financial distressed companies in the industry. While, CFFI is the most
important variable to predict the financial distressed in mining, oil, and
gas firms.

18
CHAPTER THREE
METHODOLOGY
3.0 Introduction
This chapter is divided into seven subsections which comprise of
research framework, variables used in the study, hypotheses development,
measurement of variables, data collection, sampling and methodology.
19
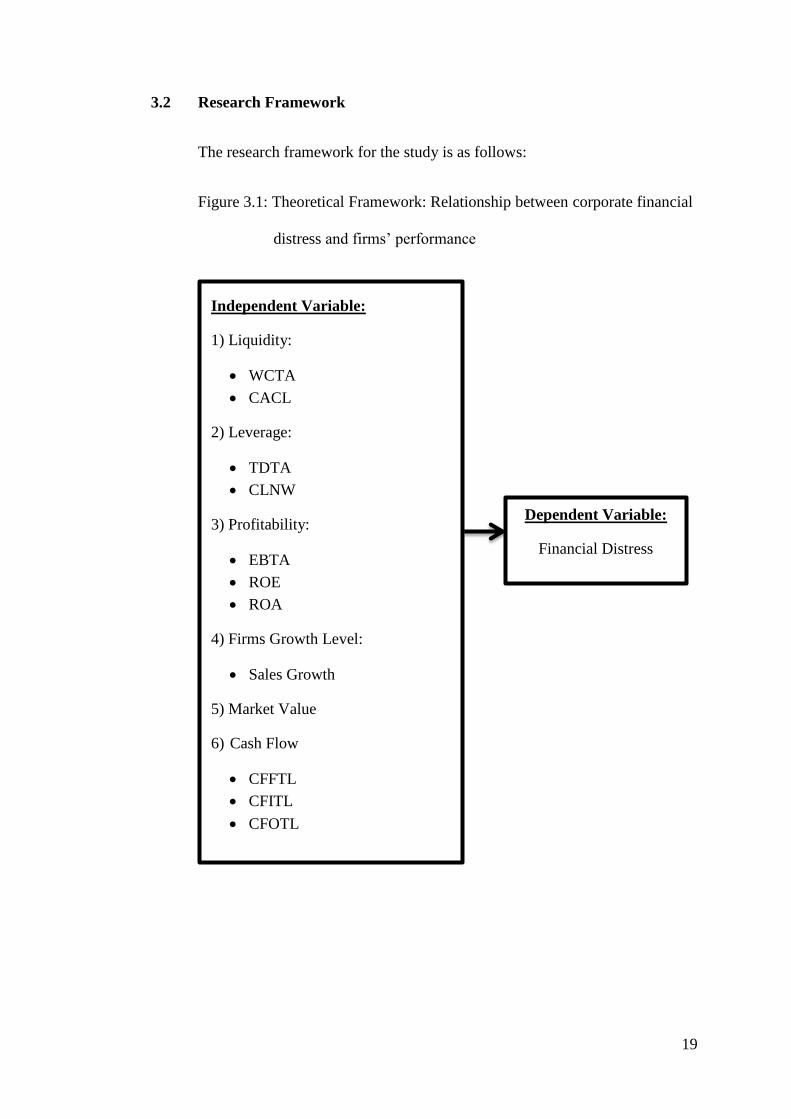
3.2 Research Framework
The research framework for the study is as follows:
Figure 3.1: Theoretical Framework: Relationship between corporate financial
distress and firms’ performance
Independent Variable:
1) Liquidity:
WCTA
CACL
2) Leverage:
TDTA
CLNW
3) Profitability:
EBTA
ROE
ROA
4) Firms Growth Level:
Sales Growth
5) Market Value
6) Cash Flow
CFFTL
CFITL
CFOTL
Dependent Variable:
Financial Distress

20
3.3 Variables
3.2.1 Dependent variables
This study uses a dummy variable as the dependent variable. It is
coded as 1 for bankrupt firm and 0 for healthy firm.
3.2.2 Independent variables
Twelve financial variables are used as the independent variables in the
study. They are WCTA, CACL, TDTA, CLNW, EBTA, ROE, ROA, Sales
growth, BTMV, CFFTL, CFITL, and CFOTL. The ratios are chosen based
on the results from previous study and they usually have been used in the
bankruptcy studies.
In accounting term, liquidity is defined as the company capability to
fulfil their financial obligations as they become due or in other words, it
measure the ability of the company to pay the short-term debt on time. The
ratio of working capital / total assets (WCTA), which is a measure of the
firm’s net liquid assets compared with total capitalization, is used as a
measure for liquidity. Typically for a firm that consistently has losses in their
business, the current assets will become lower in relation to the total assets.
Merwin (1942) indicates that the net working capital to total assets is the best
indicator for financial distress. The second ratio used to proxy for liquidity is
the current ratio. The current ratio shows the ability of the company to pay the
debt or its obligations on time. The current ratio is calculated as current
assets / current liabilities.

21
The second independent variable used is the leverage ratio. Leverage
ratio also determines the balance costs mix of the company and its impact on
operating income. Those who are concerned with long-term financial position
of the firm are long-term creditors such as debenture holders and financial
institutions. The total debt / total assets (TDTA) is used as a measure of
leverage which shows the long-term financial obligations of the company.
Increases in leverage will increase the probability of the financial difficulties.
With the high degree of leverage, there is possibility that the company will
have insufficient cash flow to service debt which lead to bankruptcy. The
second ratio used to measure the leverage is current liabilities/net worth
(CLNW) which shows the cost of debt financing may be greater than the
return that the company generates on the debt through investment and
business activities and become too much for the company to handle. This can
lead to bankruptcy, which would leave nothing to the shareholders.
Profitability ratio measure the performance of the company.
Earnings before interest and taxes to total assets (EBTA) is used as a measure
of profitability. This ratio measures the actual productivity of the assets of the
firm after abstracting tax. Since an absolute existence is based on this ratio, it
seems appropriate to use this ratio in studies related to corporate failures. In
addition bankruptcy or insolvency happens when the total liabilities exceed
the fair valuation of the assets of the firm with the value determined by the
power of the item.
The return on equity (ROE) measured as net income to common
equity is used as a second measure for profitability. High returns on common
equity shows that companies have use their equity and this increases the

22
profitability of the company. Higher return on common equity leads to a
higher share prices. Analysts believe that the return on common equity is an
essential indicator of the company's publicly traded health.
The return on assets (ROA) is the third measure of profitability used
in the study proxied by net income to total assets. Companies that cannot
utilize their assets effectively tends to go bankrupt.
Firms’ growth is proxied by sales growth. Sales growth is a measure
of the percentage increase in sales between the two time periods. The
equations for sales growth is current period net sales minus prior period net
sales to prior period net sales. The higher the sales growth for the companies,
the lower is the probability of bankruptcy.
Book-to-market ratio is the ratio of the book value of a firm's to its
market value. The book value is a historical cost or accounting value of the
firm. The market value is determined on the stock market by market
capitalization. The ratio of book-to-market can be used to identify whether
the securities are undervalued or overvalued. In basic terms, if the ratio is
above one then it is undervalued; if it is less than one, stocks are overvalued.
Cash flow from operations is cash inflows and outflows arising
directly from producing and selling the products of company. This cash flow
from operations activities include item from net income, depreciation and
working capital accounts other than cash and operations that is associated
with short-term debt. Cash flow from investing activities is cash flow relating
to the purchase or sale of long-term fixed assets or others. Cash flow from
financing activities is cash flow arising from the debt and equity financing.
23
These include increasing cash by issuing short-term debt, long-term debt
issuing, issue of shares, using of cash to pay dividends, using the cash to buy
back shares and use cash to pay off debt.
3.4 Hypotheses
Six hypotheses have been developed for this study.
3.4.1 Liquidity
Liquidity measures the company's ability to fulfil its current
obligations. Failure to have enough liquidity will lead to poor
creditworthiness as the company cannot fulfil their financial obligations. This
will lead to loss of creditors' confidence. Previous studies which found
positive relationship between liquidity and financial distress are Muhammad
Suleiman (2001), Altman (1968), Platt and Platt (2002), Smith and Graves
(2005), Taffler (1983), Ameer (2010), Abdullah et al. (2008), and Rosliza
(2006).
However, negative relationship can occur when the higher the
liquidity, the lower would be the probability of bankruptcy. Studies that find
negative relationship between liquidity and distress are Nuha (1996), Begley
(1996) and Deakin (1972). Nevertheless, Shirata (1998) find that liquidity is
not an important factor. Begley (1990) and Deakin (1972) show that
working capital ratio to total assets is an important factor. Hence, we
hypothesized that

24
H1: There is a relationship between financial distress and liquidity of the
firms.
3.4.2 Leverage
The higher the amount of leverage in the company, the greater is the
financial risk. Prior researchers who have found a significant positive
relationship between corporate financial distress and leverage are Altman
(2000), Theodossiou et al. (1996), Zulkarnain (2009), Paranowo (2010),
Halim (2008), Malik (2013), Andrade and Kaplan (1997); Asquith et al.
(1994), Kaplan and Stein (1993), Whitaker (1999), Wruck (1990) and Keige
(1991).
However, some prior study finds that leverage is not significantly
related to corporate financial distress. Those studies are from Baimwera
(2006), Nyamboga, Omwario, Muriuki, Gongera (2014), Baimwera and
Muriuki (2014), Sitati and Ondipo (2006), and Pindado (2005). Hence, we
hypothesized that
H2: There is a relationship between corporate financial distress and
leverage.
3.4.3 Profitability
Companies with poor profitability are associated with potentially
bankrupt firm. Previous researchers find that profitability has a positive
significant relationship with firms’ financial distress level (Altman,
Haldeman, & Narayanan, 1977; Altman, 1968; Kimura, 1980; Nyamboga,
Omwario, Muriuki, Gongera, 2014; Malik, 2013; Hunter and Isachenkova,

25
2000; Bhunia, 2011; Baimwera and Muriuki, 2014; Theodossiou et al., 1996;
Parker, Peters and Turetsky, 2002; Li and Liu, 2009; Altman, 1968, 1991 &
2000; Myer, 1977; Myers and Majluf, 1984; Fazilah, 2000; Beaver, 1966; and
Idris, 2008).
However, some studies find that profitability does not lead to the
distress (Kiragu, 1993; Paranowo, 2010; Kaver, 1980; Ohlson, 1980;
and Shirata, 1998). Hence, we hypothesized that
H3: There is a relationship between profitability and firms’ financial
distress.
3.4.4 Sales Growth
Plat and Platt (2008) find that sales growth is negatively significant
with distress, where the larger the growth in sales, the lower is the possibility
of financial difficulties. Their study confirm the earlier studies by Altman
(1984), Giroux and Wiggins (1984), Opler and Titman (1994), and Plat, Platt,
and Chen (1995). Hence, we hypothesized that
H4: There is a relationship between sales growth and firms’ financial
distress.
3.4.5 Market Value
Baimwera (2006) and Dichev (1998) find that book-to-market ratio is
negatively significantly related to distress. Fama and French (1992) find
that book to market ratio is significantly positively and related to distress is
an important factor to measure the risk. Hence, it is hypothesized that

26
H5: There is a relationship between corporate financial distress and
market-to-book value.
3.4.6 Cash Flow
Earlier study has been conducted to estimate whether the data of
operating cash flow are negatively significantly associated with distress and
lead to more exact in predictions of corporate failure. Those studies are
Gombola and Ketz (1983), Gombola et al. (1983), Libby (1975), Aziz and
Lawson (1989), Beaver (1966), Altman (2000), Largay and Stickney (1980),
Andreas Charitou et al. (2004), Deakin (1972), Gilbert (1990), Charitou and
Venieris (1990), Fulmer et al. (1991), and Sharma and Iselin (2000).
Several prior studies find that cash flow is not an important factor in
predicting corporate failure. The studies are Casey and Bartczak (1984 &
1985), Shamser et. al (2001), Zavgren (1983), Jones (1987), Neill et al.
(1991), Watson (1996), Gentry et. al (1985), Viscione (1985), Laitinen
(1994), Ward (1994), Simons (1994), Ijiri (1979), Heath (1978), Climo
(1976), Lee (1971), and Sharma (1995). Hence, we hypothesized that
H6: There is a relationship between cash flow from activities with firms’
financial distress.
3.5 Measurement of variables
Twelve variables are used in this study as shown in table 3.1. All the
variables have been found as significant by previous researcher.
27
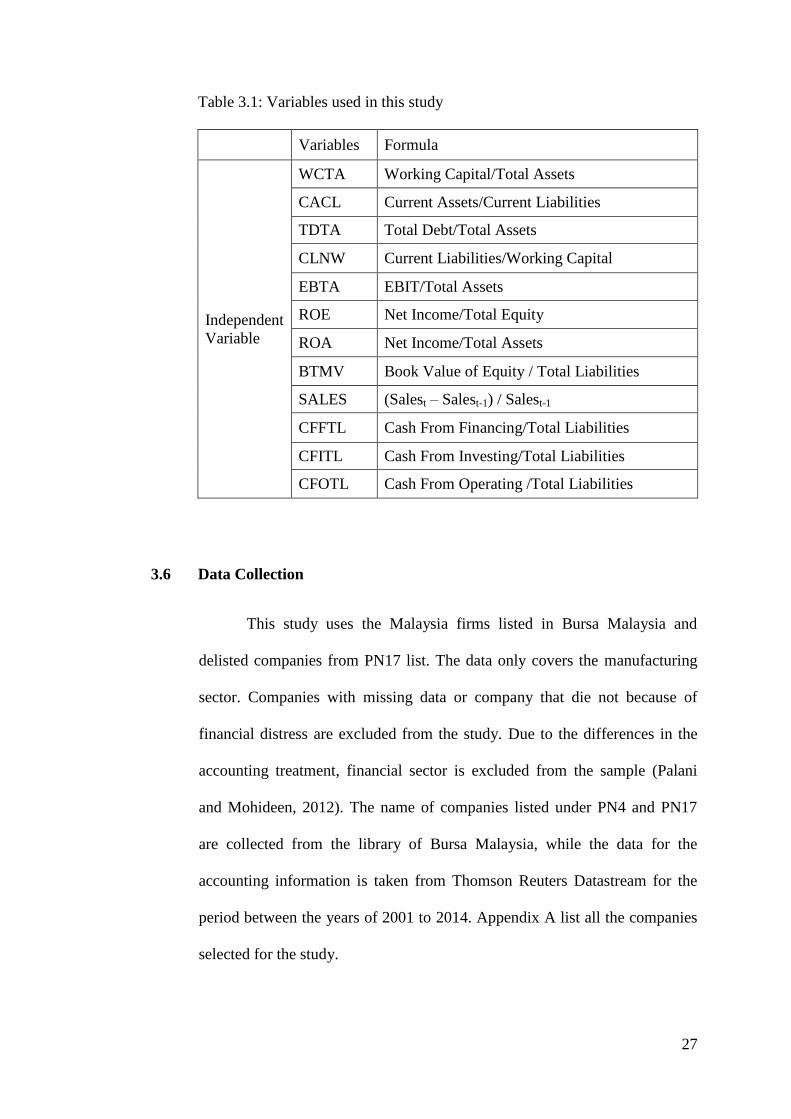
Table 3.1: Variables used in this study
Variables Formula
Independent
Variable
WCTA Working Capital/Total Assets
CACL Current Assets/Current Liabilities
TDTA Total Debt/Total Assets
CLNW Current Liabilities/Working Capital
EBTA EBIT/Total Assets
ROE Net Income/Total Equity
ROA Net Income/Total Assets
BTMV Book Value of Equity / Total Liabilities
SALES (Salest – Salest-1) / Salest-1
CFFTL Cash From Financing/Total Liabilities
CFITL Cash From Investing/Total Liabilities
CFOTL Cash From Operating /Total Liabilities
3.6 Data Collection
This study uses the Malaysia firms listed in Bursa Malaysia and
delisted companies from PN17 list. The data only covers the manufacturing
sector. Companies with missing data or company that die not because of
financial distress are excluded from the study. Due to the differences in the
accounting treatment, financial sector is excluded from the sample (Palani
and Mohideen, 2012). The name of companies listed under PN4 and PN17
are collected from the library of Bursa Malaysia, while the data for the
accounting information is taken from Thomson Reuters Datastream for the
period between the years of 2001 to 2014. Appendix A list all the companies
selected for the study.

28
3.7 Sampling
The data are collected from 2001 to 2014. All 84 delisted
companies as in appendix A in that period are taken into account. However,
some of the companies are delisted because of other reasons; therefore, those
companies are excluded from the sample. As a result, only 36
companies are chosen as the sample as in the table 3.2.
Table 3.2: List of 36 delisted companies in manufacturing sector
NO DATE
ENTERED IND-PROD
SECOND
NAME
1 23/2/2001 Denko Industrial Corporation
Berhad
2 26/2/2001 Integrated Rubber Corporation
Berhad
3 26/2/2001 Lion Corporation Berhad
4 13/5/2002
Sunway Building Technology Bhd
( Now known as Dolomite
Corporation Bhd )
Dolomite Corp
Bhd
5 1/12/2005
Boustead Heavy Industries
Corporation Bhd
(formerly known as PSC Industries
Berhad)
6 11/7/2005 Poly Glass Fibre (M) Berhad
7 28/2/2005 Scomi Engineering Bhd (formerly
known as Bell & Order Berhad)
8 7/7/2005 Sinora Industries Berhad
Innoprise
Plantations
BHD
9 8/5/2006 Harvest Court Industries Bhd
10 8/5/2006 Syarikat Kayu Wangi Bhd
11 8/5/2006 Tenggara Oil Bhd
12 30/11/2007 Wonderful Wire & Cable Bhd
13 9/6/2008 BSA INTERNATIONAL BHD
14 11/9/2008
Energreen Corporation Berhad (
fka Welli Multi Corporation
Berhad)
15 3/12/2008 Englotechs Holding Bhd
16 2/5/2008 Luster Industries Bhd
17 20/3/2009 Axis Incorporated Berhad
18 26/2/2009 Connectcounty Holdings Berhad

29
19 12/5/2009 Evermaster Group Berhad
20 3/9/2009 HDM-Carlaw Corporation Berhad
21 17/8/2009 JPK Holdings Berhad
22 15/5/2009 Poly Tower Ventures Berhad
23 30/12/2009 Limahsoon Berhad
24 29/10/2010 Carotech Berhad
25 13/7/2010 Ecofuture Berhad
26 23/6/2010 Linear Corporation Berhad
27 23/8/2010 Metech Group Berhad
28 2/3/2010 Tracoma Holdings Berhad
29 25/2/2010 VTI Vintage Berhad ML GLOBAL
BERHAD
30 8/6/2012 Octagon Consolidated Bhd
31 29/6/2004 Adventa Bhd
32 4/2/1998 Autoair Holdings Bhd
33 10/8/2005 IRM Group Bhd
34 26/5/1996 Malaysian AE Models Holdings
Bhd
35 31/10/2014 Asia Knight Berhad
36 2014 Metal Reclamation Bhd
Non-distressed listed companies and distressed companies are
matched based on total assets and industry. For each distressed companies, a
non-distressed companies is matched and chosen. This sampling technique is
called one-to-one basis. This procedure of using matched sampling is
consistent with the studies by Beaver (1996), Laitinen (1994), Altman (1968),
Zulkarnain et al. (2001), and Gadenne and Iselin (2000).
3.8 Data Analysis
3.3.1 Logistic Regression Analysis
This study uses logit analysis by statistical package for the social
sciences (SPSS) to overcome the limitations in the Multivariate Discriminant

30
Analysis (MDA), which are multivariate normality and equality in the
distribution matrix among group. Logit analysis provides the likelihood ratio
where it is explained by the dichotomous dependent variable or by
independent variables coefficients. The prediction fromlogit model is
estimated by a maximum likelihood ratio. In this study, dependent variables
are coded as one if the firms are in financial distress and coded as zero if they
are healthy companies. This model is used by Ohlson (1980) and Gujarati
(1995). The model is as follows:
Where,
y = dummy variable, =1 for distress companies, and 0 for non-
distress companies
WCTA it = Working Capital / Total Asset
CACL it = Current Asset / Current Liabilities
TDTA it = Total Debt / Total Asset
CLNW it = Current Liabilities/Working Capital
EBTA it = Earnings before Interest Taxes / Total Assets
ROE it = Return on Equity
ROA it = Return on Assets
SG it = Sales Growth
BTMVit = Book-to-Market Value
CFFTL it = Cash Flow from Investing / Total Liabilities
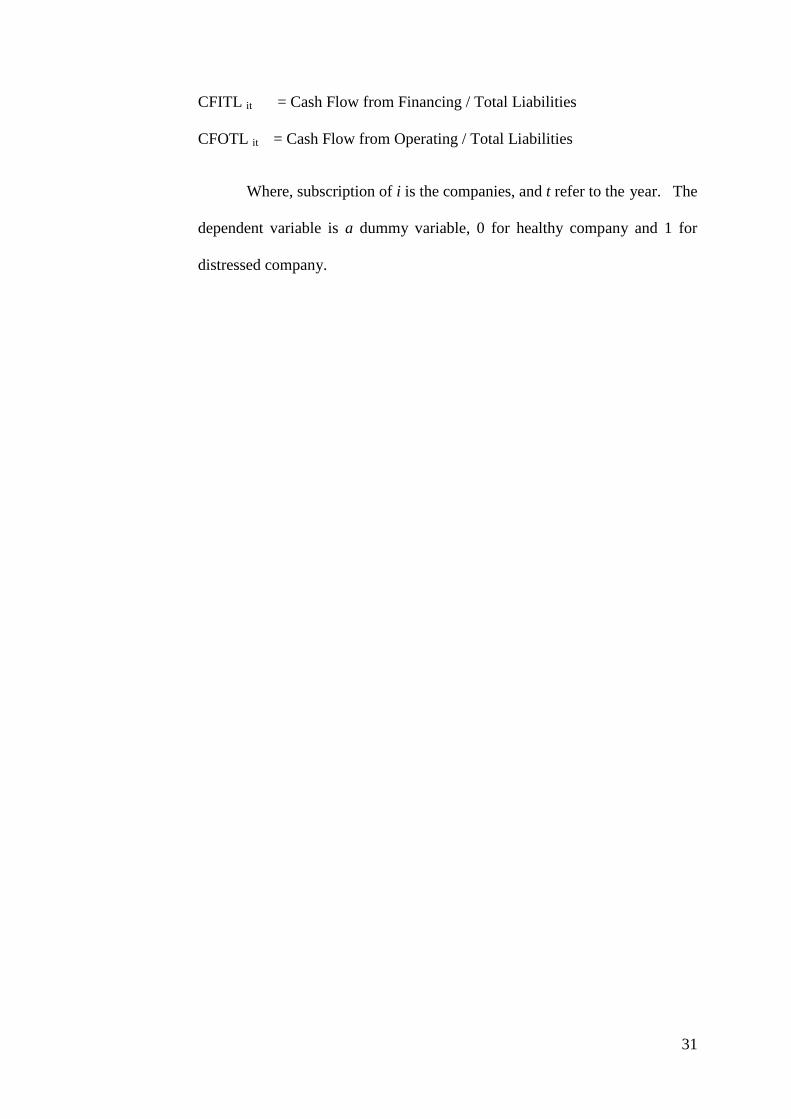
31
CFITL it = Cash Flow from Financing / Total Liabilities
CFOTL it = Cash Flow from Operating / Total Liabilities
Where, subscription of i is the companies, and t refer to the year. The
dependent variable is a dummy variable, 0 for healthy company and 1 for
distressed company.
32
CHAPTER FOUR
FINDINGS AND DISCCUSSION
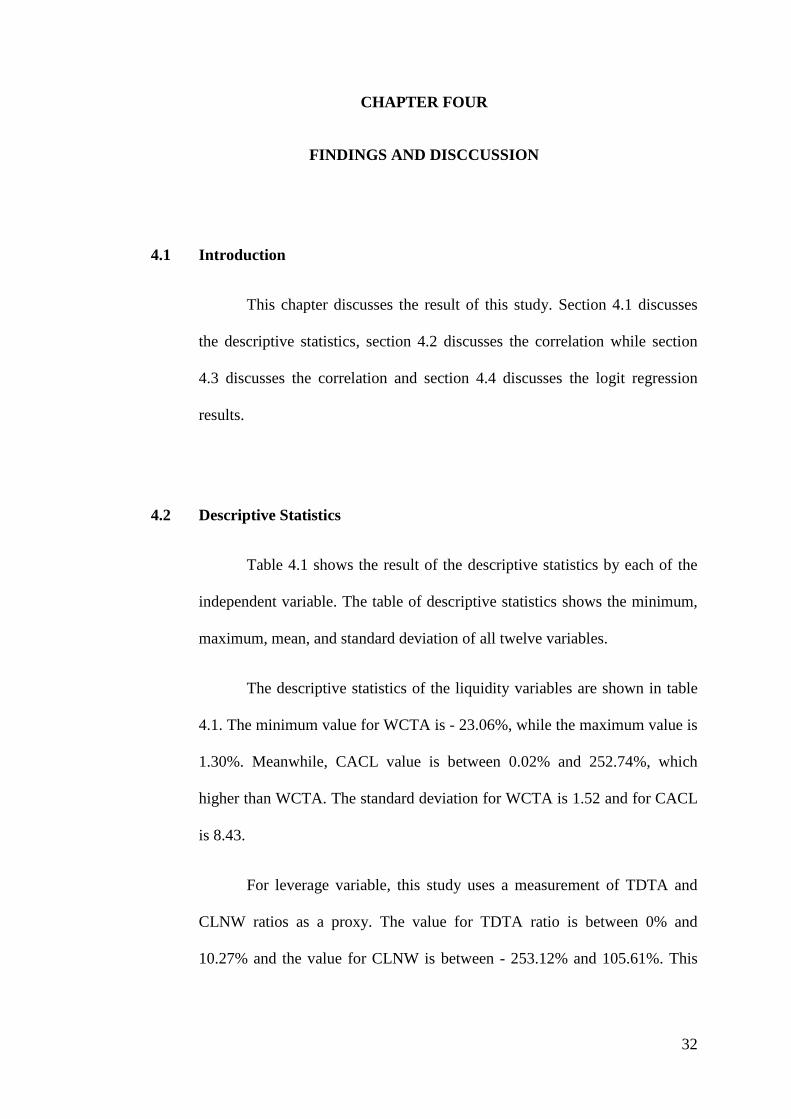
4.1 Introduction
This chapter discusses the result of this study. Section 4.1 discusses
the descriptive statistics, section 4.2 discusses the correlation while section
4.3 discusses the correlation and section 4.4 discusses the logit regression
results.
4.2 Descriptive Statistics
Table 4.1 shows the result of the descriptive statistics by each of the
independent variable. The table of descriptive statistics shows the minimum,
maximum, mean, and standard deviation of all twelve variables.
The descriptive statistics of the liquidity variables are shown in table
4.1. The minimum value for WCTA is - 23.06%, while the maximum value is
1.30%. Meanwhile, CACL value is between 0.02% and 252.74%, which
higher than WCTA. The standard deviation for WCTA is 1.52 and for CACL
is 8.43.
For leverage variable, this study uses a measurement of TDTA and
CLNW ratios as a proxy. The value for TDTA ratio is between 0% and
10.27% and the value for CLNW is between - 253.12% and 105.61%. This
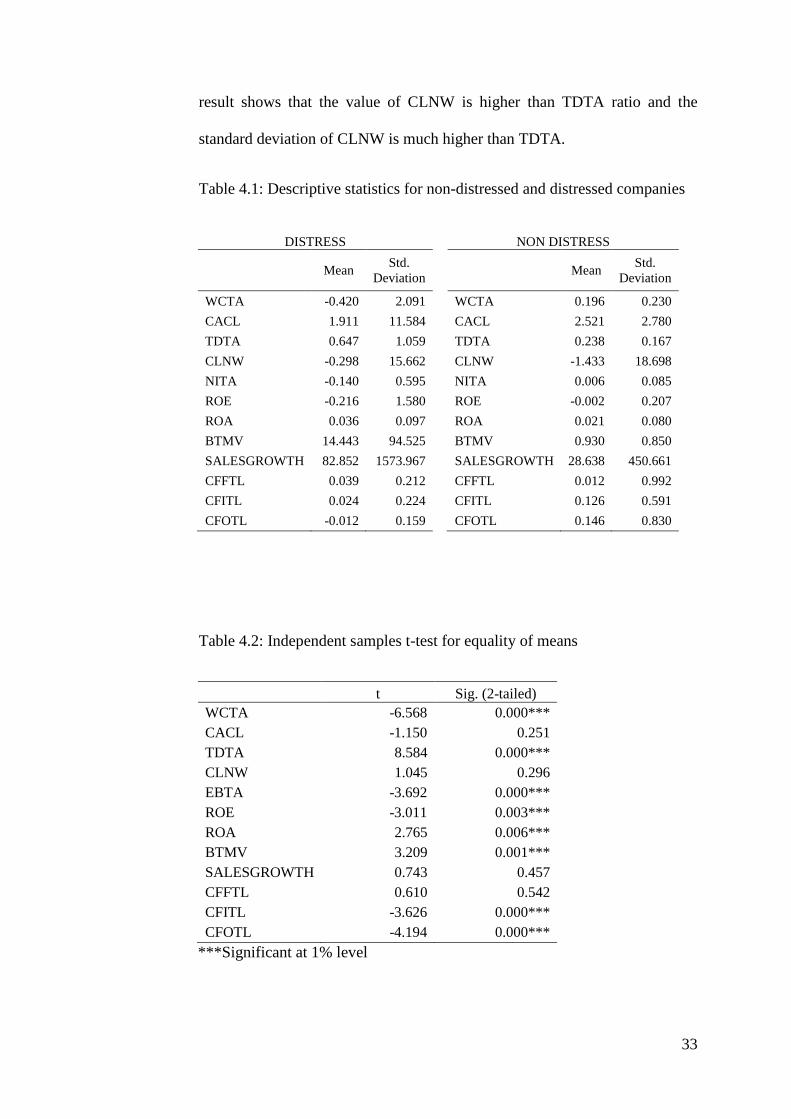
33
result shows that the value of CLNW is higher than TDTA ratio and the
standard deviation of CLNW is much higher than TDTA.
Table 4.1: Descriptive statistics for non-distressed and distressed companies
DISTRESS
NON DISTRESS
Mean
Std.
Deviation Mean
Std.
Deviation
WCTA -0.420 2.091
WCTA 0.196 0.230
CACL 1.911 11.584
CACL 2.521 2.780
TDTA 0.647 1.059
TDTA 0.238 0.167
CLNW -0.298 15.662
CLNW -1.433 18.698
NITA -0.140 0.595
NITA 0.006 0.085
ROE -0.216 1.580
ROE -0.002 0.207
ROA 0.036 0.097
ROA 0.021 0.080
BTMV 14.443 94.525
BTMV 0.930 0.850
SALESGROWTH 82.852 1573.967
SALESGROWTH 28.638 450.661
CFFTL 0.039 0.212
CFFTL 0.012 0.992
CFITL 0.024 0.224
CFITL 0.126 0.591
CFOTL -0.012 0.159
CFOTL 0.146 0.830
Table 4.2: Independent samples t-test for equality of means
t Sig. (2-tailed)
WCTA -6.568 0.000***
CACL -1.150 0.251
TDTA 8.584 0.000***
CLNW 1.045 0.296
EBTA -3.692 0.000***
ROE -3.011 0.003***
ROA 2.765 0.006***
BTMV 3.209 0.001***
SALESGROWTH 0.743 0.457
CFFTL 0.610 0.542
CFITL -3.626 0.000***
CFOTL -4.194 0.000***
***Significant at 1% level

34
Table 4.1 shows the result of the descriptive statistics by each of the
independent variable. The table of descriptive statistics shows the mean, and
standard deviation of all twelve variables. Sample for non-distressed
companies has better mean values than the sample from distressed
companies.
The descriptive statistics of the liquidity variables are shown in table
4.1. The mean value for WCTA is -0.42 for distress and 0.19 for non-distress
which shows that the working capital for distress companies lower and the
companies lead to the bankruptcy.
The TDTA ratio of the leverage is shown in the table 4.1. The mean
value for distress is 0.65 and 0.24 for non-distress. This shows that the higher
debt of the companies will tend to the bankruptcy.
The descriptive statistics of the profitability is measure by EBTA,
ROE and ROA. The table 4.1 shows that the mean value for EBTA ratio for
distress is -0.06 and non-distress is 0.03, ROE is -0.22 for distress and -0.002
for non-distress. ROA mean value is 0.04 for distress and 0.02 for non-
distress. This shows that higher of profitability will reduce the probability of
bankruptcy.
The result for book-to-market variable is 14.4 for distress and 0.93 for
non-distress. The variable of firms’ growth is measured by sales growth. The
mean value is 82.8 for distress and 28.6 for non-distress.

35
The variables used to measure cash flows are cash flow from
financing, investing, and operating activities. The descriptive statistics shows
that the mean value of CFFTL is 0.04 for distress and 0.012 for non-distress.
CFITL is 0.02 for distress and 0.13 for non-distress while CFOTL is -0.0122
for distress and 0.15 for non-distress.
Table 4.2 shows an independent samples t-test for equality of means.
The results show that there are significant differences in mean between the
two groups in WCTA, TDTA, EBTA, ROE, ROA, BTMV, CFITL and
CFOTL.
4.3 Correlation Analysis
The correlation analysis shows the relationship between the variables,
where, a higher correlation shows a higher level of association between the
variable while a lower correlation indicates a lower level of association. The
result shows that all variables are not highly correlated.
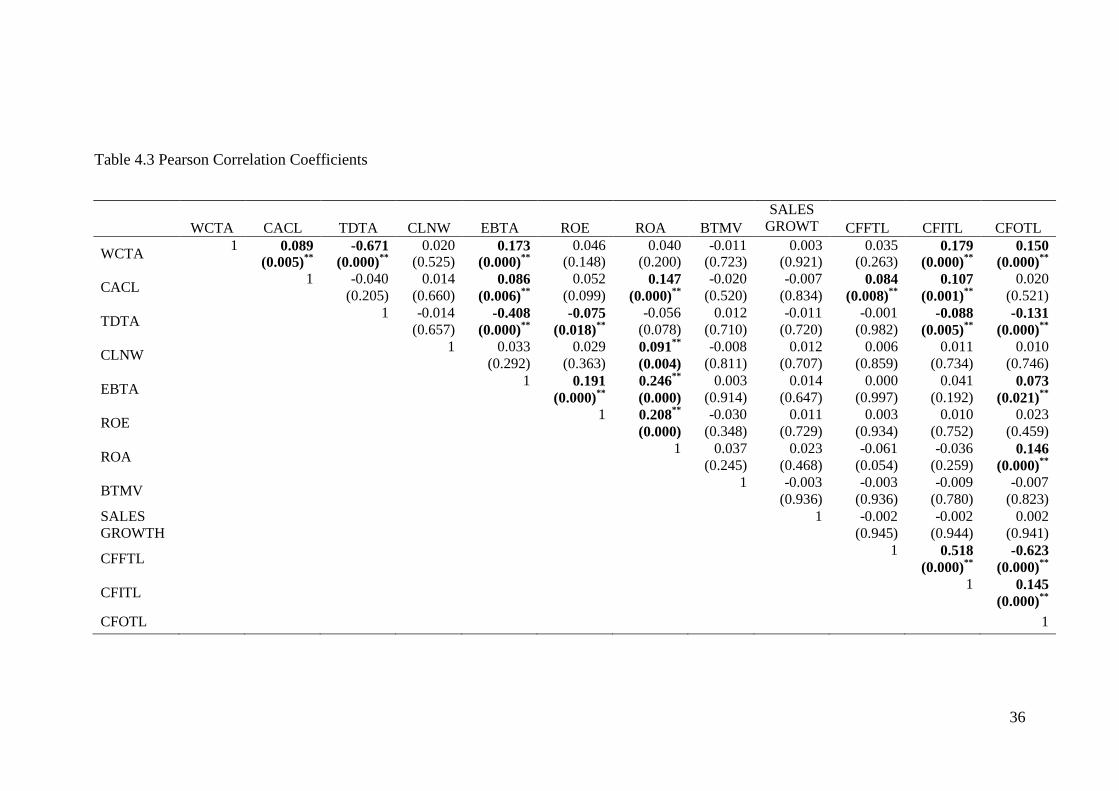
36
Table 4.3 Pearson Correlation Coefficients
WCTA CACL TDTA CLNW EBTA ROE ROA BTMV
SALES
GROWT
H CFFTL CFITL CFOTL
WCTA 1 0.089 -0.671 0.020 0.173 0.046 0.040 -0.011 0.003 0.035 0.179 0.150
(0.005)
** (0.000)
** (0.525) (0.000)**
(0.148) (0.200) (0.723) (0.921) (0.263) (0.000)**
(0.000)**
CACL 1 -0.040 0.014 0.086 0.052 0.147 -0.020 -0.007 0.084 0.107 0.020
(0.205) (0.660) (0.006)
** (0.099) (0.000)** (0.520) (0.834) (0.008)
** (0.001)
** (0.521)
TDTA 1 -0.014 -0.408 -0.075 -0.056 0.012 -0.011 -0.001 -0.088 -0.131
(0.657) (0.000)
** (0.018)
** (0.078) (0.710) (0.720) (0.982) (0.005)**
(0.000)**
CLNW 1 0.033 0.029 0.091
** -0.008 0.012 0.006 0.011 0.010
(0.292) (0.363) (0.004) (0.811) (0.707) (0.859) (0.734) (0.746)
EBTA 1 0.191 0.246
** 0.003 0.014 0.000 0.041 0.073
(0.000)
** (0.000) (0.914) (0.647) (0.997) (0.192) (0.021)
**
ROE 1 0.208
** -0.030 0.011 0.003 0.010 0.023
(0.000) (0.348) (0.729) (0.934) (0.752) (0.459)
ROA 1 0.037 0.023 -0.061 -0.036 0.146
(0.245) (0.468) (0.054) (0.259) (0.000)
**
BTMV 1 -0.003 -0.003 -0.009 -0.007
(0.936) (0.936) (0.780) (0.823)
SALES
GROWTH
1 -0.002 -0.002 0.002
(0.945) (0.944) (0.941)
CFFTL 1 0.518 -0.623
(0.000)
** (0.000)
**
CFITL 1 0.145
(0.000)
**
CFOTL
1

37
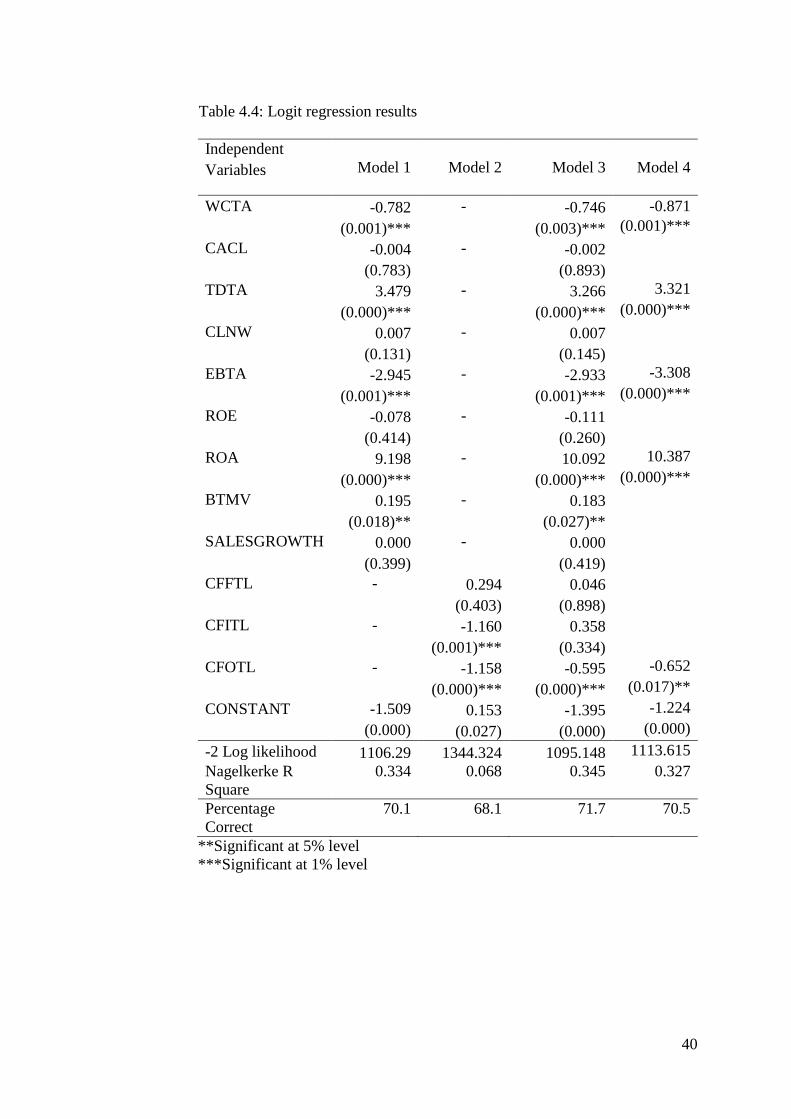
4.4 Logistic Regression
In this study, the logit analysis is used to estimate the relationship
between dependent and independent variable. Three models are being
analyzed. In model one, except cash flow variables are excluded. Then, in the
second model, only cash flow variables are included from the analysis. After
that, in the third model, all variables are included in the analysis. In model 4,
we include all variables, but the method changes to stepwise logit regression.
Table 4.4 shows that in model 1, the significant variables to measure
distress are WCTA, TDTA, EBTA, ROA, and BTMV. The WCTA,
which is a measure of liquidity, is negatively significant. This shows that the
higher the liquidity, the lower would be the probability of bankruptcy. This
finding is similar to Nuha (1996), Begley (1996) and Deakin (1972).
The variable of TDTA which is a measure of leverage shows a
positively significant value. This indicates that the higher the debt of the
company, the higher the probability for the company to be in the financial
distressed. This finding is similar to Altman (2000), Theodossiou et al.
(1996), Zulkarnain (2009), Paranowo (2010), Halim (2008), Malik (2013),
Andrade and Kaplan (1997), Asquith et al. (1994), Kaplan and Stein (1993),
Whitaker (1999), Asquith et al. (1994) and Wruck (1990).
EBTA which is a measure of profitability is negatively significant to
financial distress. This is consistent with previous studies that suggest that a
higher amount of profitability will reduce the probability of bankruptcy. This
finding is similar to Altman (1968 and 2000), Altman et al. (1977), Bhunia
and Sarkar (2011), Odipo and Sitati (2006), and Paranowo (2010).

38
ROA which is another measure of profitability shows a positively
significant relationship with financial distress. This shows that as return on
assets increases, the probability of bankruptcy increases. This finding is
similar to Gombola (2014), Paranowo (2010).
The BTMV has a positively significant relationship to the financial
distressed. This shows that assets of the company decline in value before the
liabilities exceed the assets and the firm tends to go into the bankruptcy. The
findings is similar to Dichev (1998), Fama and French (1992), Chen and
Zhang (1998), Giroux and Wiggins (1984), Opler and Titman (1994), Plat,
Platt, and Chen (1995) and Shumway (1996).
In model 2, only cash flows variables are included in the analysis. The
results show that CFOTL and CFITL have negative and significant
relationship with financial distressed. The negative relationship suggests that
cash flows that arise from operating and investment of the company has a
tendency to reduce the probability of bankruptcy. This finding is similar to
Ward (2011).
Model 3 shows that when all items are included in the analysis, the
results remain similar as in model 1. For cash flow, only CFOTL is
negatively significant to the financial distressed and this results suggest that
the higher the operating cash flow the lower the probability of bankruptcy.
This results confirms the finding by Gombola and Ketz (1983), Gombola et
al. (1983), Libby (1975), Aziz and Lawson (1989), Beaver (1966), Altman
(2000), Largay and Stickney (1980), Andreas Charitou et al. (2004),

39
Deakin (1972), Gilbert (1990), Charitou and Venieris (1990), Fulmer et al.
(1991), and Sharma and Iselin (2000).
In model 4, the stepwise regression confirms that the WCTA, TDTA,
EBTA, ROA, and CFOTL are important variables in determining financial
distress in Malaysia.
Hence, all the hypotheses regarding liquidity, leverage, profitability,
book-to-market ratio, and cash flow are accepted.
Comparing the percentage correctly predicted, table 4.4 shows that
model 1 correctly predict 70.1% of the companies, while model 2 is 68.1%,
model 3 is 71.7%, and model 4 is 70.5%.
40
Table 4.4: Logit regression results
Independent
Variables Model 1 Model 2 Model 3 Model 4
WCTA -0.782 - -0.746 -0.871
(0.001)*** (0.003)*** (0.001)***
CACL -0.004 - -0.002
(0.783) (0.893)
TDTA 3.479 - 3.266 3.321
(0.000)*** (0.000)*** (0.000)***
CLNW 0.007 - 0.007
(0.131) (0.145)
EBTA -2.945 - -2.933 -3.308
(0.001)*** (0.001)*** (0.000)***
ROE -0.078 - -0.111
(0.414) (0.260)
ROA 9.198 - 10.092 10.387
(0.000)*** (0.000)*** (0.000)***
BTMV 0.195 - 0.183
(0.018)** (0.027)**
SALESGROWTH 0.000 - 0.000
(0.399) (0.419)
CFFTL - 0.294 0.046
(0.403) (0.898)
CFITL - -1.160 0.358
(0.001)*** (0.334)
CFOTL - -1.158 -0.595 -0.652
(0.000)*** (0.000)*** (0.017)**
CONSTANT -1.509 0.153 -1.395 -1.224
(0.000) (0.027) (0.000) (0.000)
-2 Log likelihood 1106.29 1344.324 1095.148 1113.615
Nagelkerke R
Square
0.334 0.068 0.345 0.327
Percentage
Correct
70.1 68.1 71.7 70.5
**Significant at 5% level
***Significant at 1% level

41
CHAPTER FIVE
CONCLUSION AND RECOMMENDATION
5.1 Conclusion
The general objective of this study is to evaluate the determinants of
financial distress among manufacturing firms listed in the Bursa Malaysia for
the period from 2001 to 2014. A matched sample consists of 36 distressed
and 36 non-distressed firms are used in the study. This study uses a binary
logistic regression to determine the financial distressed. The variables consist
of liquidity ratios (WCTA and CACL), leverage ratio (TDTA and CLNW),
profitability (EBTA, ROA, and ROE), book-to-market (BTMV), sales
growth, and cash flow (CFFTL, CFITL, and CFOTL). Three models are
develop. In the first model, all variables except cash flow variables are
included in the analysis. In the second model, only cash flow variables are
included while in the third model, all variables are included in the analysis. In
model four, all variables are included but the method changes to stepwise
logit regression. Hence, this study can highlight the importance of cash flow
in determining the financial distress of the firm.
The results from model 1, cash flow variables are excluded from the
analysis. The results show that WCTA has negatively significant
relationship which suggests that the higher the liquidity, the lower is the
probability of distress. The CACL is not significant with financial distress.
Furthermore, the findings show that a higher amount of leverage will lead to
bankruptcy. This is reflected in the relationship between TDTA and distress

42
which is negatively related. In terms of profitability, the results shows that
EBTA is negatively significant while ROA is positively significant to
corporate financial distressed. The results of ROA is confusing since it shows
that the higher the profitability, the higher would be the distressed. This
contradicts the results from previous studies. In addition, BTMV ratio also
has positive significant relationship to the bankruptcy of the company while
sales growth has no significant relationship to the corporate financial
distressed.
In order to see the importance of cash flow, model 2 is carried out
where only cash flow variables are included in the analysis. The results
confirm that CFOTL is still an important factor. In addition, the model also
show that CFITL is also significant to the corporate financial distressed.
When all variables are included from the analysis as in model 3, the
results remain similar as model 1. Regarding cash flow variables, model 3
show that only CFOTL has a negatively significant relationship to the
financial distressed. This shows the importance of operating cash flow in
reducing the financial distress of the firm. Model 3 shows that cash flow
from investing and cash flow from financing are not important in determining
financial distress in Malaysia.
5.2 Limitation of the study
There are several limitations in this study. The first limitation is the
time period. This study is conducted within three months. Due to the time

43
limitation, this study could not observe the determinants of financial
distressed in all Malaysian listed firms. Hence, the sample only covers
manufacturing sectors, and excludes other non-financial sectors such as
constructions, mining, consumer, hotels, plantations, properties, technologies,
trading and services sectors. The results would be better if a larger sample
size is used.
5.2 Recommendation
There are several opportunities for future investigation in this area.
First, a larger sample size might be used to get a better results of this
study. Future researchers can also conduct an analysis by looking at all
sectors in Malaysia.

44
LIST OF REFERENCES
Altman, E. I. (1968). Financial ratios, discriminant analysis and the prediction of
corporate bankruptcy. Journal of Finance, 23,589-609.
Altman, E. I. (1993) Corporate Financial Distress and Bankruptcy (2nd
ed.), New
York: John Wiley.
Altman, E. I., Haldeman, R. G. & Narayanan, P. (1977). Zeta Analysis: A new
model to identify bankruptcy risk of corporations. Journal of Banking and
Finance, 1, 9-24.
Baimwera, B. (2006). The relationship between book-to-market ratio of equity
and distress for stocks quoted at the NSE. Nairobi: University of Nairobi.
Barnes, P. (1987). The analysis and use of financial ratios: A review article.
Journal of Business Finance and Accounting, 14(4), 449-461.
Beaver, W. H. (1966). Financial ratios as predictors of failure. Supplement to
Journal of Accounting Research, 4 (3), 71-13 1.
Casey, C.J. and Bartczak, N.J. (1984). Cash Flow-It’s Not the Bottom Line.
Harvard Business Review, pp. 61-66.
Casey, C. and Bartczak, N. (1985). Using operating cash flow data to predict
financial distress: some extensions. Journal of Accounting Research, Vol. 23,
No. 1, 384-401.
Deakin, E. B. (1976). Distributions of financial accounting ratios: some empirical
evidence. The Accounting Review, 90-96.
Dichev, D. I. (1998). Is the Risk of Bankruptcy a Systematic Risk? The Journal of
Finance, 10-28.
Gilbert, L. R., Menon, K. & Schwartz, K. B. (1990). Predicting bankruptcy for
firms in financial distress. Journal of Business Finance and Accounting, 17,
161-171.
Gombola, M.J. and Ketz, J.E. (1983). A note on cash flow and classification
patterns of financial ratios. The Accounting Review, Vol. LVIII, No. 1, pp.
105-114.
Gombola, M.J., Haskins, M.E., Ketz, J.E. and Williams, D.D. (1987). Cash flow in
bankruptcy prediction. Journal of Financial Management, pp. 55-65.
Gujarati, D. N. (1995). Basic Econometric (3rd
ed.). Singapore: McGraw- Hill
International Editions.

45
Abdullah, Ahmad, H., & Rus, M. R. (2008). Predicting corporate failure of
malaysia's listed companies: comparing multiple discriminant analysis,
logistic regression and the hazard model. International Research Journal of
Finance and Economics, 1-17.
Keige, P. (1991). Business failure prediction using discriminate analysis. Nairobi:
University of Nairobi.
Kiragu, M. (1993). The prediction of corporate failure using price adjusted
accounting data. Nairobi: University of Nairobi.
Laitinen, E. K. (1994). Traditional versus operating cash flow in failure
prediction. Journal of Business Finance and Accounting, 22 (2), 195-217.
Libby, R. (1975). Accounting ratios and the prediction of failure: some behavioral
evidence. Journal of Accounting Research, Spring, 150-161.
Lincoln, M. (1984). An empirical study of the usefulness of accounting ratios to
describe levels of insolvency risk. Journal of Banking and Finance, 8,321-
340.
Mohamed, S., Ang, J. & Ahmadu, U. S. (2001). Predicting corporate failure in
Malaysia: An application of the logit model to financial ratio analysis.
Asian Academy of Management Journal, 6 (l), 99-118.
Muhamad Sori, Z., Mohamad, S., Hamid, A., & Ali, M. (2001). Why Companies
Fail? An Analysis of Corporate Failures. An Analysis of Corporate Failures.
Akauntan Nasional: Journal of the Malaysian Institute of Accountants, 14(8),
5-8.
Ohlson, J. A. (1980). Financial ratios and the probabilistic prediction of
bankruptcy. Journal of Accounting Research, 28,109-131.
Paranowo, K. e. (2010). Determinant of Corporate Financial Distress in an
Emerging Market Economy: Empirical Evidence from the Indonesian Stock
Exchange 2004-2008. International Research Journal of Finance and
Economics, 80-88.
Platt, H. D. & Platt M. B. (1990). Development of a class of stable predictive
variables: The case of bankruptcy prediction. Journal of Business Finance
and Accounting, 17, 31-51.
Scott, J. (1981). The probability of bankruptcy: A comparison of empirical
predictions and theoretical models. Journal of Banking and Finance, 5 (3),
317–344.
Shirata, C. Y. (1998). Financial ratios as predictors of bankruptcy in Japan: an
empirical research. online paper.

46
Sitati, A., & Odipo, M. K. (2009). Evaluation of applicability of Altman's revised
model in prediction of Financial Distress: A case of companies quoted in the
Nairobi Stock Exchange.
Soo, W. L., Fauzias, M. N. & Puan Yatim. (2001). Predicting Corporate Financial
distress using the logit model: The case of Malaysia. Asian Academy of
Management Journal, 6 (l), 49-61.
Titman, S., & Opler, C. T. (1994). Financial distress and corporate performance.
The Journal of Finance, 1015-1040.
Ward, T. J. & Foster, B. P. (1997). A note on selecting a response measure for
financial distress. Journal of Business Finance and Accounting, 24, 869-879.
Wruck, K. H. (1990). Financial distress, reorganization, and organizational
efficiency. Journal of Financial Economics, 27, 419-444.
Zulkarnain, M. S., Mohamad Ali, A. H., Annuar, M. N. & Zainal Abidin, M. (2001).
Forecasting corporate failure in Malaysian industrial sector firms. Asian
Academy of Manangement Journal, 6(1), 15-30.
Zulkarnain, M. S., Shamsher, M., Mohamad Ali, A. H. & Annuar, M. N. (2002).
Determinants of corporate success and failure: The Malaysian case.
Akauntan Nasional, 23.