A Unified, Correlated Logging Architecture for Intrusion Detection ...
International Journal of Scientific and Research Publications, Volume 4, Issue 12, December 2014 1 ISSN 2250-3153
www.ijsrp.org
Detection of Water-logging Areas Based on Passive
Remote Sensing Data in Jessore District of Khulna
Division, Bangladesh
Md. Shareful Hassan *, Syed Mahmud-ul-islam **
* Centre for Environmental Change Studies and Management, Dhaka, Bangladesh
** Department of Sustainable Development, Environmental Science and Engineering, KTH-Royal Institute of Technology, Teknikringen 34, S-
10044, Stockholm, Sweden
Abstract- Water-logging is one of the major environmental problems and challenges of socio-economic development in the south-
western part of Bangladesh. In this research paper, Jessore district of Khulna division was selected as the study area to detect water-
logging and damaged agriculture lands. To carry out this detection, Landsat imageries from 1972, 1989 and 2014 were used. A post
classification comparison of change detection was followed to calculate transformation of water and agriculture in the study area.
About 32830 hectare lands were extracted as waterlogged areas, which is 13% of the total land. Moreover, agriculture has been
decreased while water bodies have upward trend. In this analysis, a multi-regression analysis was performed using Upazila wise
water-logged as independent variable and Upazila wise damaged agriculture lands as dependent variable. This result shows a strong
correlation between waterlogged and damaged areas, which was 93% at 95% confidence level with P value < 0.5. The overall
accuracy assessment for water and agriculture were 92%, 91% and 95% in 1972, 1989 and 2014 respectively
Index Terms- Agriculture, Bangladesh, Change Detection, Jessore, Landsat, Water-logging.
I. INTRODUCTION
he south-western coastal zone area of Bangladesh has been facing drastic water-logging problems. The part of the district Jessore
is located in this zone and has been affected as well. Some upazilas of this district are directly affected with regular water-logging
and drainage congestion problems due to vulnerable climate, over silted up riverbed and low capacity of drainage systems.[1]
The
entire district sways badly water-logging during all seasons. Around 2% to 20% people of Jessore district were found affected water-
logging problem.[1]
People of that region suffer a lot and get affected by various water borne diseases. The healthy sanitary systems
totally collapse during water-logging period. Social environment, local economy, and ecology has been hampered and degraded due to
prolonged water-logging. In addition to these problems, damages of agriculture crops has been shown to be a major disaster due to
water logging. In the study paper, temporal remote sensing of Landsat imageries of 1972, 1989 and 2014 were used to detect water-
logged areas in order to calculate damaged agricultural crops in the study area.
According to WARPO (2005), the nearby river bed and sediment system was interrupted which causes intensifying the Water-
logging situation.[2]
Climate change vulnerabilities also effects directly or indirectly to drainage congestion by storm surge.[3]
A
research work using satellite image analysis reveals that the water-logging problem is increasing gradually in this region.[4]
Paul et al., (2000) used Landsat 5 TM imageries to detect open water bodies and floodplain of the Murrumbidgee River near the
city of Wagga Wagga, Australia [5]
. They found that optical Landsat is very useful for detecting water bodies and floodplain in their
study. NDVI and NDWI have important application to identify water-logged areas. Sahu (2014) used integrated GIS and remote
sensing in order to detect water-logging areas in the part of Purba Medinipur district of Keleghai river basin, India. Finally, he used a
statistical analysis that shown a strong correlation of water-logged areas and canal density. [6]
II. OBJECTIVE OF THE STUDY AND STUDY AREA
The main objective of this study is to detect water-logged areas in Jessore district using temporal Landsat imageries. The specific
objectives are as follows:
1) To assess water bodies and agriculture using multi-temporal data sets.
2) To assess agriculture damaged areas.
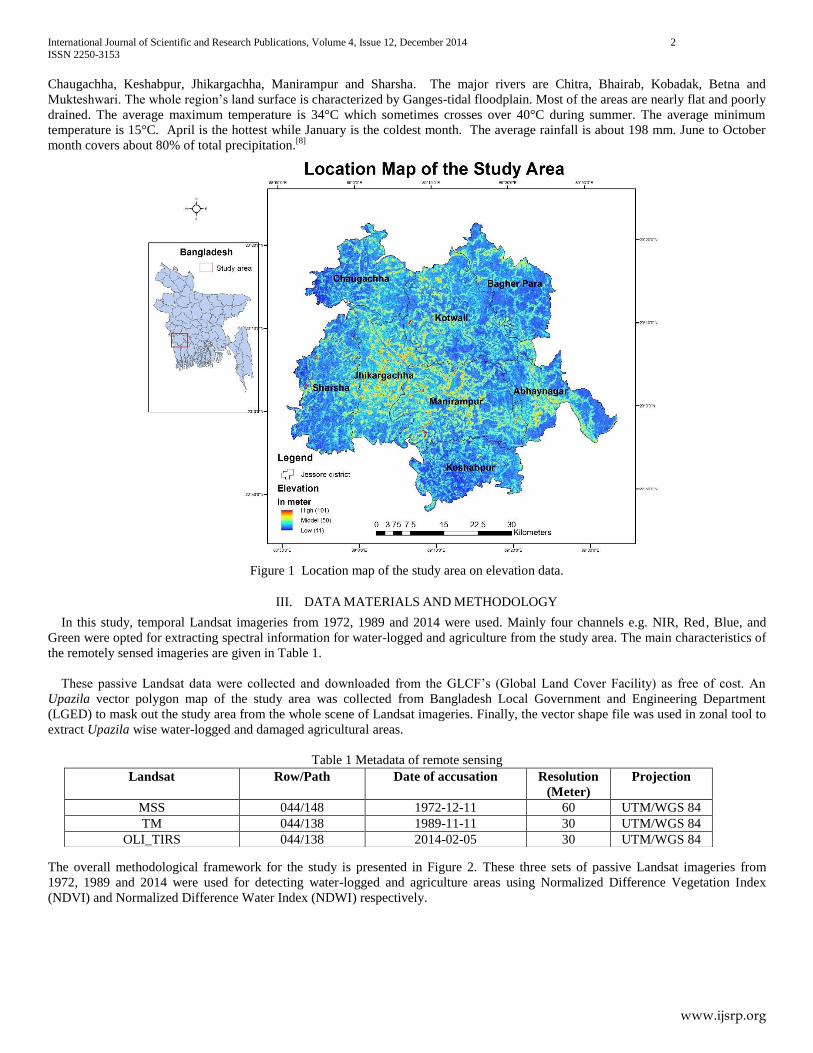
The study area is located in the south-western part of Bangladesh. The entire Jessore district lies between latitude N 22° 50' to N
23° 20' and longitude E 88° 50' to E 89° 30' (Figure 1). The whole area covers about 2606.94 square km with total population
approximately 2764547. [7]
The study area consists of 4 municipalities and 8 upazilas; Jessore Sadar, Abhaynagar, Bagherpara,
T
International Journal of Scientific and Research Publications, Volume 4, Issue 12, December 2014 2
ISSN 2250-3153
www.ijsrp.org
Chaugachha, Keshabpur, Jhikargachha, Manirampur and Sharsha. The major rivers are Chitra, Bhairab, Kobadak, Betna and
Mukteshwari. The whole region’s land surface is characterized by Ganges-tidal floodplain. Most of the areas are nearly flat and poorly
drained. The average maximum temperature is 34°C which sometimes crosses over 40°C during summer. The average minimum
temperature is 15°C. April is the hottest while January is the coldest month. The average rainfall is about 198 mm. June to October
month covers about 80% of total precipitation.[8]
Figure 1 Location map of the study area on elevation data.
III. DATA MATERIALS AND METHODOLOGY
In this study, temporal Landsat imageries from 1972, 1989 and 2014 were used. Mainly four channels e.g. NIR, Red, Blue, and
Green were opted for extracting spectral information for water-logged and agriculture from the study area. The main characteristics of
the remotely sensed imageries are given in Table 1.
These passive Landsat data were collected and downloaded from the GLCF’s (Global Land Cover Facility) as free of cost. An
Upazila vector polygon map of the study area was collected from Bangladesh Local Government and Engineering Department
(LGED) to mask out the study area from the whole scene of Landsat imageries. Finally, the vector shape file was used in zonal tool to
extract Upazila wise water-logged and damaged agricultural areas.
Table 1 Metadata of remote sensing
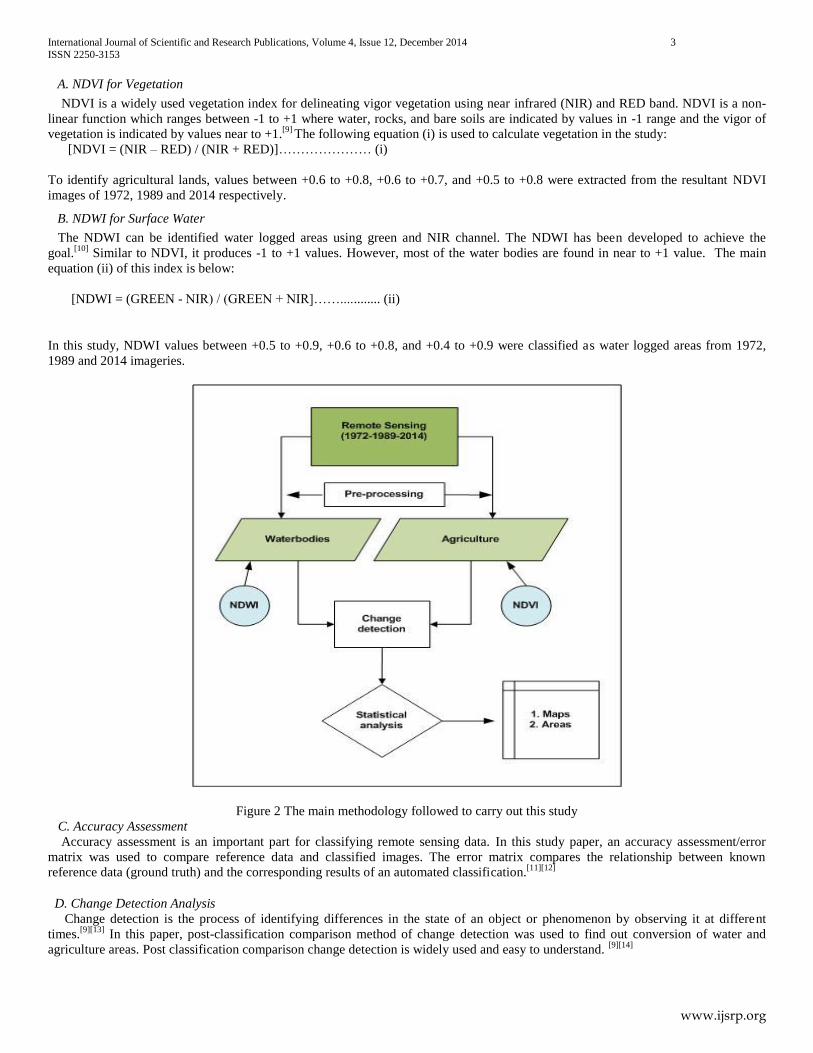
The overall methodological framework for the study is presented in Figure 2. These three sets of passive Landsat imageries from
1972, 1989 and 2014 were used for detecting water-logged and agriculture areas using Normalized Difference Vegetation Index
(NDVI) and Normalized Difference Water Index (NDWI) respectively.
Landsat Row/Path Date of accusation Resolution
(Meter)
Projection
MSS 044/148 1972-12-11 60 UTM/WGS 84
TM 044/138 1989-11-11 30 UTM/WGS 84
OLI_TIRS 044/138 2014-02-05 30 UTM/WGS 84
International Journal of Scientific and Research Publications, Volume 4, Issue 12, December 2014 3
ISSN 2250-3153
www.ijsrp.org
A. NDVI for Vegetation
NDVI is a widely used vegetation index for delineating vigor vegetation using near infrared (NIR) and RED band. NDVI is a non-
linear function which ranges between -1 to +1 where water, rocks, and bare soils are indicated by values in -1 range and the vigor of
vegetation is indicated by values near to +1.[9]
The following equation (i) is used to calculate vegetation in the study:
[NDVI = (NIR – RED) / (NIR + RED)]………………… (i)
To identify agricultural lands, values between +0.6 to +0.8, +0.6 to +0.7, and +0.5 to +0.8 were extracted from the resultant NDVI
images of 1972, 1989 and 2014 respectively.
B. NDWI for Surface Water
The NDWI can be identified water logged areas using green and NIR channel. The NDWI has been developed to achieve the
goal.[10]
Similar to NDVI, it produces -1 to +1 values. However, most of the water bodies are found in near to +1 value. The main
equation (ii) of this index is below:
[NDWI = (GREEN - NIR) / (GREEN + NIR]……............ (ii)
In this study, NDWI values between +0.5 to +0.9, +0.6 to +0.8, and +0.4 to +0.9 were classified as water logged areas from 1972,
1989 and 2014 imageries.
Figure 2 The main methodology followed to carry out this study
C. Accuracy Assessment
Accuracy assessment is an important part for classifying remote sensing data. In this study paper, an accuracy assessment/error
matrix was used to compare reference data and classified images. The error matrix compares the relationship between known
reference data (ground truth) and the corresponding results of an automated classification.[11][12]
D. Change Detection Analysis
Change detection is the process of identifying differences in the state of an object or phenomenon by observing it at different
times.[9][13]
In this paper, post-classification comparison method of change detection was used to find out conversion of water and
agriculture areas. Post classification comparison change detection is widely used and easy to understand. [9][14]
International Journal of Scientific and Research Publications, Volume 4, Issue 12, December 2014 4
ISSN 2250-3153
www.ijsrp.org
IV. RESULTS AND DISCUSSION
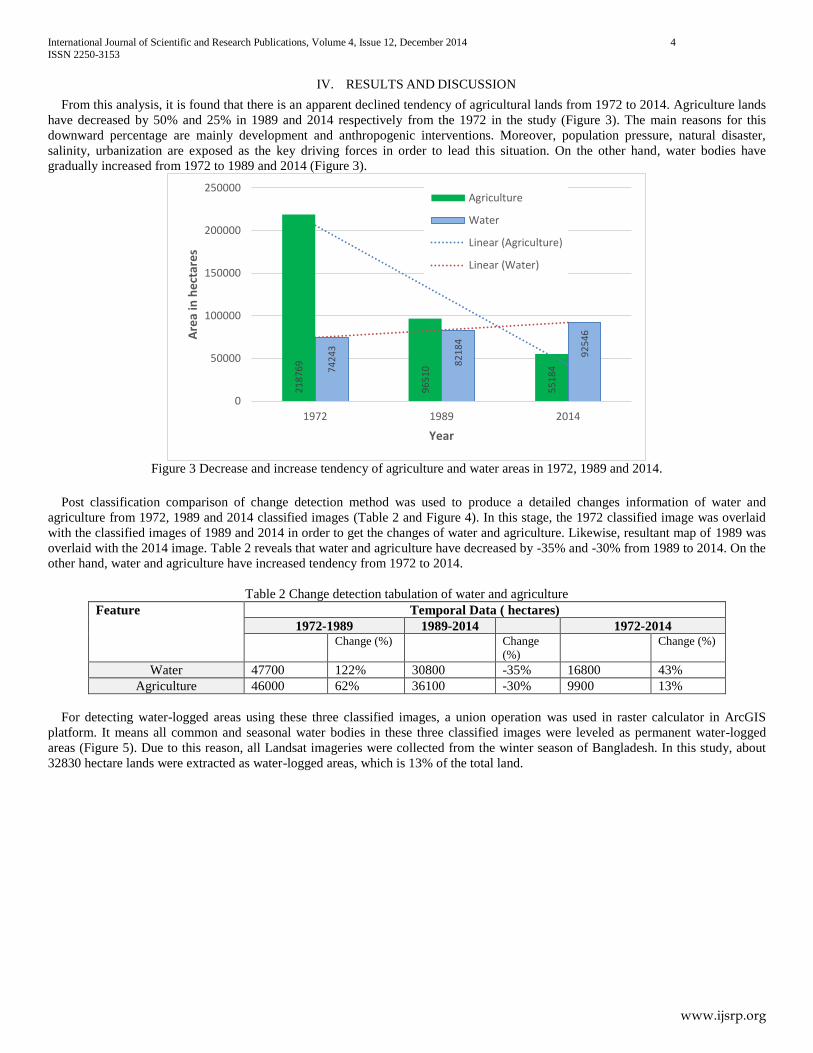
From this analysis, it is found that there is an apparent declined tendency of agricultural lands from 1972 to 2014. Agriculture lands
have decreased by 50% and 25% in 1989 and 2014 respectively from the 1972 in the study (Figure 3). The main reasons for this
downward percentage are mainly development and anthropogenic interventions. Moreover, population pressure, natural disaster,
salinity, urbanization are exposed as the key driving forces in order to lead this situation. On the other hand, water bodies have
gradually increased from 1972 to 1989 and 2014 (Figure 3).
Figure 3 Decrease and increase tendency of agriculture and water areas in 1972, 1989 and 2014.
Post classification comparison of change detection method was used to produce a detailed changes information of water and
agriculture from 1972, 1989 and 2014 classified images (Table 2 and Figure 4). In this stage, the 1972 classified image was overlaid
with the classified images of 1989 and 2014 in order to get the changes of water and agriculture. Likewise, resultant map of 1989 was
overlaid with the 2014 image. Table 2 reveals that water and agriculture have decreased by -35% and -30% from 1989 to 2014. On the
other hand, water and agriculture have increased tendency from 1972 to 2014.
Table 2 Change detection tabulation of water and agriculture
Feature Temporal Data ( hectares)
1972-1989 1989-2014 1972-2014
Change (%) Change
(%)
Change (%)
Water 47700 122% 30800 -35% 16800 43%
Agriculture 46000 62% 36100 -30% 9900 13%
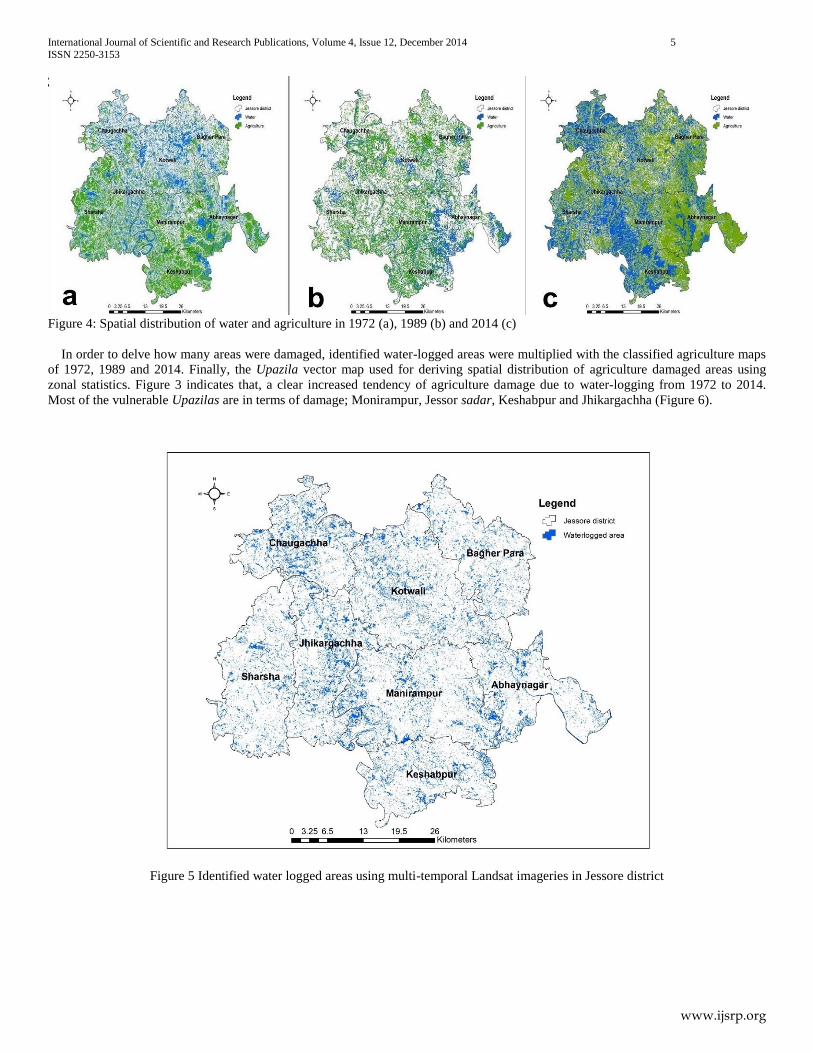
For detecting water-logged areas using these three classified images, a union operation was used in raster calculator in ArcGIS
platform. It means all common and seasonal water bodies in these three classified images were leveled as permanent water-logged
areas (Figure 5). Due to this reason, all Landsat imageries were collected from the winter season of Bangladesh. In this study, about
32830 hectare lands were extracted as water-logged areas, which is 13% of the total land.
21
87
69
96
51
0
55
18
4
74
24
3
82
18
4
92
54
6
0
50000
100000
150000
200000
250000
1972 1989 2014
Are
a in
he
ctar
es
Year
Agriculture
Water
Linear (Agriculture)
Linear (Water)
International Journal of Scientific and Research Publications, Volume 4, Issue 12, December 2014 5
ISSN 2250-3153
www.ijsrp.org
Figure 4: Spatial distribution of water and agriculture in 1972 (a), 1989 (b) and 2014 (c)
In order to delve how many areas were damaged, identified water-logged areas were multiplied with the classified agriculture maps
of 1972, 1989 and 2014. Finally, the Upazila vector map used for deriving spatial distribution of agriculture damaged areas using
zonal statistics. Figure 3 indicates that, a clear increased tendency of agriculture damage due to water-logging from 1972 to 2014.
Most of the vulnerable Upazilas are in terms of damage; Monirampur, Jessor sadar, Keshabpur and Jhikargachha (Figure 6).
Figure 5 Identified water logged areas using multi-temporal Landsat imageries in Jessore district

International Journal of Scientific and Research Publications, Volume 4, Issue 12, December 2014 6
ISSN 2250-3153
www.ijsrp.org
Figure 6 Agriculture damaged areas based on the analysis of 1972, 1989 and 2014 imageries
To identify relationship between water-logged and agriculture damaged areas, a multi-regression analysis was performed. In this
analysis, water-logged areas of the eight upazilas added as independent variable while agriculture damaged areas of the same upazilas
were used as dependent variable. Finally, this result (Table 3) shows a significant positive correlation (93%) at 95% confidence level
with P value < 0.5. It indicates that, if there are more water-logging phenomena then agriculture damage will be higher. Water-logged
areas have robust influence for leading damage of agriculture lands and crops which can be affected to local ecology, biodiversity and
livelihoods.
Table 3 Regression of water logged areas and agriculture damaged areas in the study area.
Regression Statistics
Multiple R 0.96562124
R Square 0.932424379
Adjusted R Square 0.881742664
Standard Error 412.7821285
Observation 8
About more than 1500 pixels were selected as reference data for both classified water and agriculture images. The overall accuracy
assessment for water and agriculture were 92%, 91% and 95% in 1972, 1989 and 2014 respectively.
V. CONCLUSION
Landsat imageries are shown to be a useful material to detect water-logged areas in this study. Using medium resolution (30 meter)
passive data for extracting water and agriculture in rural and semi-rural area can be viable. Normalized difference vegetation index
(NDVI) and normalized difference water index (NDWI) were also appropriate for generating lucid information for water and
agriculture respectively. In this research, some other important environmental and socio-economic data have not used. Therefore, such
kinds of data are recommended for further research on the field in the study area. In terms of environmental degradation and damage
of agriculture crops, the government and development agencies should take into account as serious issue in the entire south-western
part of Bangladesh.
REFERENCES
[1] F.K. Khadim, K.K. Kar, P.K. Halder, M.A. Rahman and A.K.M.M Morshed, “Integrated Water Resources Management (IWRM) Impacts in South West Coastal Zone of Bangladesh and Fact-Finding on Tidal River Management (TRM),” Journal of Water Resources and Protection, October, 2013. Vol 5, pp. 953-961.
[2] WARPO, “Drainage Issues in Coastal Zone, Integreted Coastal Zone Management Plan Project,” PDO-ICZMP, Water Resources Planning Organization (WARPO), Ministry of Water Resources, The Government of Bangladesh, Dhaka, 2005.
[3] M.R. Islam and M. Ahmed, “Living in the Coast: Problems, Opportunities and Challenges,” Program Development Office, Integrated Coastal Zone Management Plan (ICZMP), Dhaka, 2004.
[4] S. Rahman, S.H. Rahman and M.W. Ullah, “Assessment of Water-logging extent using RS and GIS techniques and its possible remedial measures at the Kopotaksho basin area, Bangladesh,” unpublished.
0
5000
10000
15000
20000
25000
30000
35000Agriculture lost in 2014
Agriculture lost in 1989
Agriculture lost in 1972
International Journal of Scientific and Research Publications, Volume 4, Issue 12, December 2014 7
ISSN 2250-3153
www.ijsrp.org
[5] S. F. Paul and J. Kenneth, “Water Body Detection and Delineation with Landsat TM Data,” Photogrammetric Engineering & Remote Sensing, Vol. 66, No. 12, December 2000, pp. 1461-1467.
[6] A. S. Sahu, “Identification and mapping of the water-logged areas in Purba Medinipur part of Keleghai river basin, India: RS and GIS methods,” International Journal of Advanced Geosciences, 2014, Vol 2, Issue 2, pp. 59-65.
[7] BBS (Bangladesh Bureau of Statistics), “Population Census 2011 Preliminary Report,” Statistic Division, Ministry of Planning, Government of Bangladesh, 2011.
[8] BMD (Bangladesh Meteorological Department), Data for temperature, rainfall, 2009.
[9] S. Hassan, “Assessment of landuse and land Degradation in the North-Westren Part of Bangladesh using Landsat Imagery,” TRITA Master's Thesis. Division of Geoinformatics, Royal Institute of Technology (KTH), Stockholm, Sweden, 2009, GIT EX 09-013: 1-73, ISSN 1653-5227.
[10] S.K. McFeeters, “The use of the Normalized Difference Water Index (NDWI) in the delineation of open water features,” International Journal of Remote Sensing, 1996, Vol 17, Issue 7, pp.1425-1432.
[11] T. Lillesand and R. Kiefer, “Remote Sensing and Image Interpretation,” John Wiley & Sons, Inc., 2000.
[12] S. Hassan, and M. Moniruzzaman, “Rule-based Image Classification for Wetland mapping of Godagari thana of Rajshahi District, Bangladesh,” The Journal of Geo-Environment, April 2010, Vol 9, pp. 61-70.
[13] A. Singh, “Digital change detection techniques using remotely sensed data,” International Journal of Remote Sensing, 1989, Vol.10, pp. 989-1003.
[14] J.R. Jensen, “Introductory Digital Image Processing- A remote sensing perspective,” Prentice-Hall, 2nd Edition, New Jersey, 1996.
AUTHORS
First Author – Md. Shareful Hassan, (M.Sc., Sweden), GIS/RS Specialist, Centre for Environmental Change Studies and
Management, Dhaka, Bangladesh. Email: [email protected]
Second Author – Syed Mahmud-ul-islam, (M.Sc., Sweden), Department of Sustainable Development, Environmental Science and
Engineering, KTH-Royal Institute of Technology, Teknikringen 34, S-10044, Stockholm, Sweden
Email: [email protected]
Correspondence Author – Md. Shareful Hassan, email: [email protected], alternate email address: [email protected],
Contact number: +8801733750087