Radio Frequency Interference Detection for Passive Remote ... · Radio Frequency Interference...
19
Radio Frequency Interference Detection for Passive Remote Sensing Using Eigenvalue Analysis Adam Schoenwald (University of Maryland, Baltimore County) (NASA Goddard Space Flight Center) Dr. Seung-Jun Kim (University of Maryland, Baltimore County) Dr. Priscilla Mohammed, (Morgan State University) To be presented by Adam Schoenwald at the 2017 IEEE International Geoscience and Remote Sensing Symposium, Fort Worth, Texas, July 2017 1 https://ntrs.nasa.gov/search.jsp?R=20170007322 2020-03-29T19:43:20+00:00Z
Transcript of Radio Frequency Interference Detection for Passive Remote ... · Radio Frequency Interference...

Radio Frequency Interference Detection for Passive Remote Sensing Using
Eigenvalue Analysis
Adam Schoenwald
(University of Maryland, Baltimore County)(NASA Goddard Space Flight Center)
Dr. Seung-Jun Kim (University of Maryland, Baltimore County)
Dr. Priscilla Mohammed, (Morgan State University)
To be presented by Adam Schoenwald at the 2017 IEEE International Geoscience and Remote Sensing Symposium, Fort Worth, Texas, July 2017 1
https://ntrs.nasa.gov/search.jsp?R=20170007322 2020-03-29T19:43:20+00:00Z

Acronym List
To be presented by Adam Schoenwald at the 2017 IEEE International Geoscience and Remote Sensing Symposium, Fort Worth, Texas, July 2017
Acronym Definition Acronym Definition
ABS() Absolute Value H Horrizontal
AS&D ASRC Federal Space and Defense ICA Independent Component Analysis
AUC Area Under Curve INR Interference to Noise Ratio
CERBM Complex Entropy Rate Bound Minimization MME Maximum Minimum Eigenvalue ratio
CONUS Continental United States MSE Mean Square Error
CQAMSYM Complex Quadrature Amplitude Modulation NASA National Aeronautics and Space Administration
CSK Complex Signal Kurtosis NCCFASTICA Non Circular Complex Fast ICA
CW Continuous Wave PI Principal Investigator
dB Decibel QPSK Quadrature Phase Shift Keying)
DDC Digital Down Converter RADAR RAdio Detection And Ranging
DSP Digital Signal Processing RF Radio Frequency
DVB-S2 Digital Video Broadcasting - Satellite - Second Generation RFI Radio Frequency Interference
ERBM Entropy Rate Bound Minimization ROACH Reconfigurable Open Architecture Computing Hardware
ESTO Earth Science Technology Office ROC Receiver Operating Characteristic
FB Full Band RRCOS Root Raise Cosine
FPGA Field Programmable Gate Array RSK Real Signal Kurtosis
Gbps Billions of Bits per Second SB Sub Band
GMI GPM Microwave Imager SERDES Serializer / Deserializer
GPM Global Precipitation Measurement SMAP Soil Moisture Active Passive
GSFC Goddard Space Flight Center V Vertical
2

Motivation
• Unmitigated RFI (Radio Frequency Interference) can cause errors in science measurements– L- and C-Band: soil moisture measurements over land– L-, C- and X-band: ocean salinity, sea surface
temperature, wind speed direction– K band: water vapor, liquid water
• Approach– RF front end development for 18 GHz (K band)
• These allocations are known to be corrupted by direct broadcast services
– Digital back end to allow sophisticated RFI detection and mitigation techniques
To be presented by Adam Schoenwald at the 2017 IEEE International Geoscience and Remote Sensing Symposium, Fort Worth, Texas, July 2017 3

L, X band RFI
SMAP TA H-pol 1400 MHz
SMAP TA H-pol filtered-15 -10 -5 0 5 10 15 20 25
30
35
40
45
50
55
60
180 200 220 240 260 280 300 320 340 360 380 400
10 GHz GMI Tb V-pol (Vertical)
SMAP (Soil Moisture Active Passive) algorithms developed previously under ESTO (Earth Science Technology Office)
To be presented by Adam Schoenwald at the 2017 IEEE International Geoscience and Remote Sensing Symposium, Fort Worth, Texas, July 2017 4

RFI from Geosynchronous Satellites Reflecting from the Surface
18 V Maximum of daily average RFI index
The 18 GHz Channel sees significant RFI from surface reflections around CONUS (Continental United States) and Hawaii
To be presented by Adam Schoenwald at the 2017 IEEE International Geoscience and Remote Sensing Symposium, Fort Worth, Texas, July 2017
Picture from David W. Draper, [1]
GMI data
5
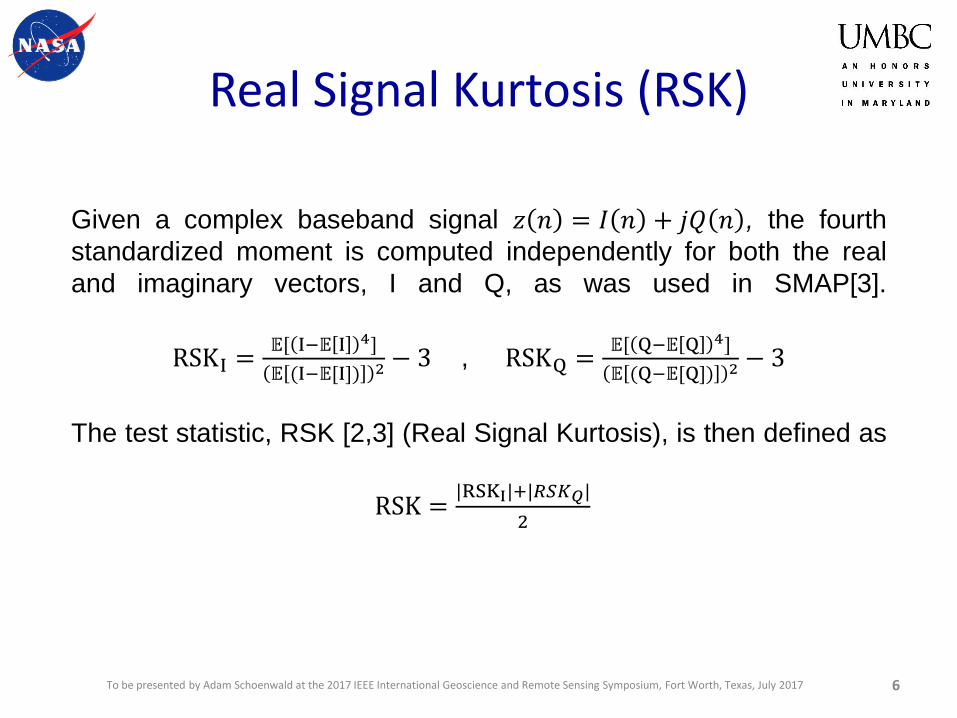
Real Signal Kurtosis (RSK)
Given a complex baseband signal 𝑧 𝑛 = 𝐼 𝑛 + 𝑗𝑄 𝑛 , the fourth
standardized moment is computed independently for both the real
and imaginary vectors, I and Q, as was used in SMAP[3].
RSKI =𝔼[ I−𝔼 I 4]
𝔼 (I−𝔼[I]) 2 − 3 , RSKQ =𝔼[ Q−𝔼 Q 4]
𝔼 (Q−𝔼[Q]) 2 − 3
The test statistic, RSK [2,3] (Real Signal Kurtosis), is then defined as
RSK =|RSKI|+|𝑅𝑆𝐾𝑄|
2
To be presented by Adam Schoenwald at the 2017 IEEE International Geoscience and Remote Sensing Symposium, Fort Worth, Texas, July 2017 6
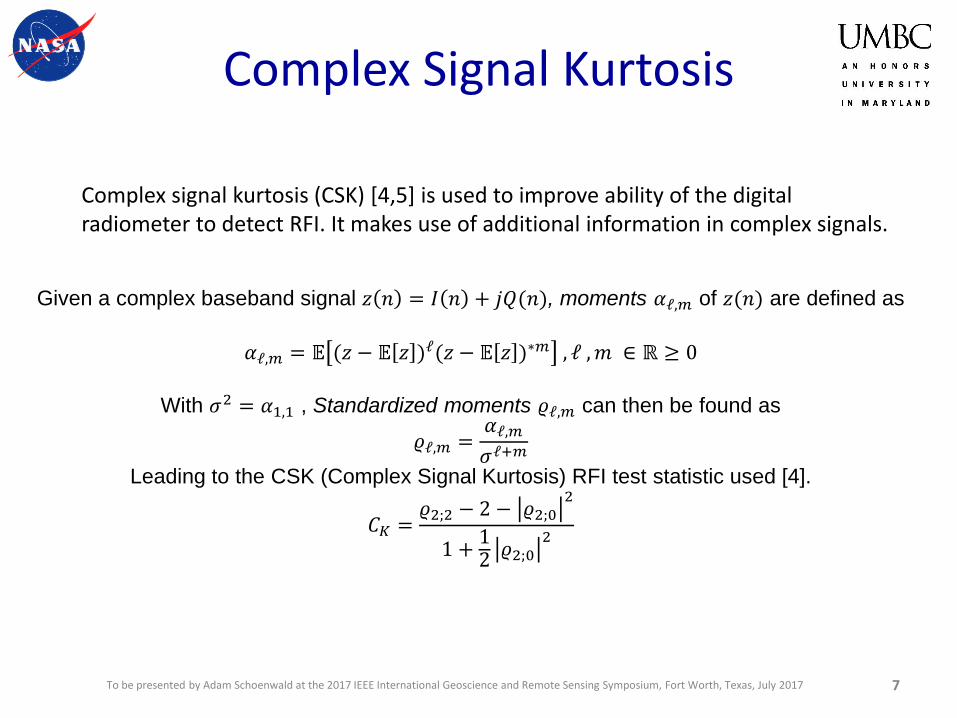
Complex Signal Kurtosis
Given a complex baseband signal 𝑧 𝑛 = 𝐼 𝑛 + 𝑗𝑄(𝑛), moments 𝛼ℓ,𝑚 of 𝑧(𝑛) are defined as
𝛼ℓ,𝑚 = 𝔼 (𝑧 − 𝔼 𝑧 )ℓ(𝑧 − 𝔼 𝑧 )∗𝑚 , ℓ ,𝑚 ∈ ℝ ≥ 0
With 𝜎2 = 𝛼1,1 , Standardized moments 𝜚ℓ,𝑚 can then be found as
𝜚ℓ,𝑚 =𝛼ℓ,𝑚𝜎ℓ+𝑚
Leading to the CSK (Complex Signal Kurtosis) RFI test statistic used [4].
𝐶𝐾 =𝜚2;2 − 2 − 𝜚2;0
2
1 +12𝜚2;0
2
To be presented by Adam Schoenwald at the 2017 IEEE International Geoscience and Remote Sensing Symposium, Fort Worth, Texas, July 2017
Complex signal kurtosis (CSK) [4,5] is used to improve ability of the digital radiometer to detect RFI. It makes use of additional information in complex signals.
7
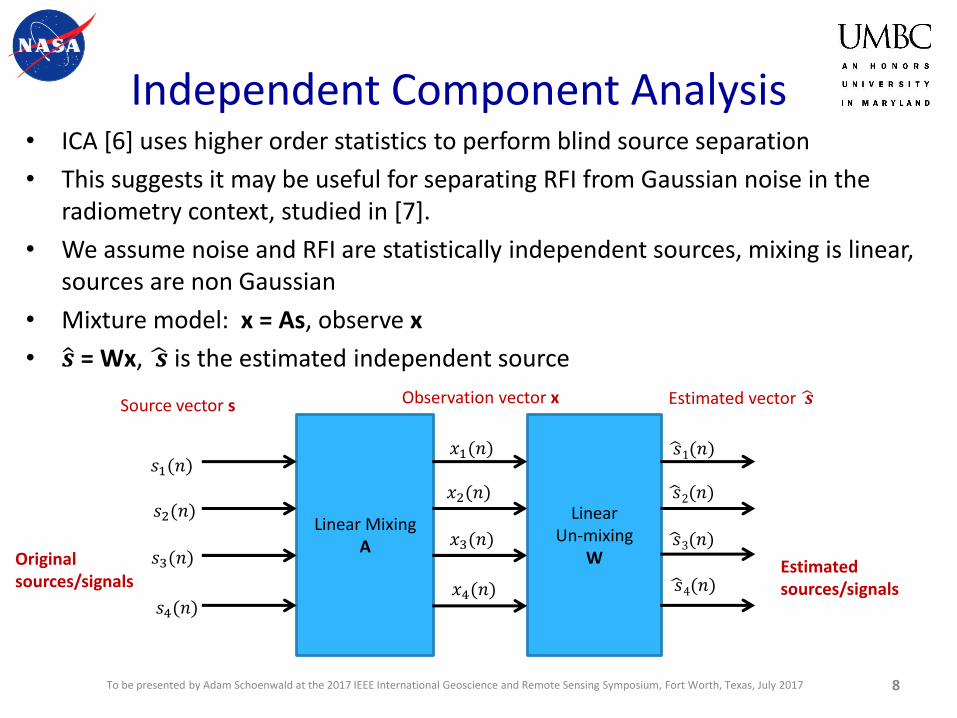
Independent Component Analysis• ICA [6] uses higher order statistics to perform blind source separation
• This suggests it may be useful for separating RFI from Gaussian noise in the radiometry context, studied in [7].
• We assume noise and RFI are statistically independent sources, mixing is linear, sources are non Gaussian
• Mixture model: x = As, observe x
• ො𝒔 = Wx, ෝ𝒔 is the estimated independent source
Observation vector x
Linear Mixing A
Linear Un-mixing
W
Source vector s
Original sources/signals
ෝ𝑠1(𝑛)
ෝ𝑠2(𝑛)
ෝ𝑠3(𝑛)
ෝ𝑠4(𝑛)
𝑠1(𝑛)
𝑠2(𝑛)
𝑠3(𝑛)
𝑠4(𝑛)
𝑥3(𝑛)
𝑥4(𝑛)
𝑥2(𝑛)
𝑥1(𝑛)
Estimated vector ෝ𝒔
Estimated sources/signals
To be presented by Adam Schoenwald at the 2017 IEEE International Geoscience and Remote Sensing Symposium, Fort Worth, Texas, July 2017 8

ICA RFI Detection
𝑠0 0 𝑠0 1 … 𝑠0 N − 1
𝑠1 0 𝑠1 1 … 𝑠1 N − 1
𝑠2 0 𝑠2 1 … 𝑠2 N − 1
𝑠3 0 𝑠3 1 … 𝑠3 N − 1
max𝑘{ABS(RSKk – 3)}
ICA Detector Output
Kurtosis
Kurtosis
Kurtosis
Kurtosis
RSK0
RSK1
RSK2
RSK3
Step 1: Take Kurtosis of each estimated independent component vector Step 2: Select the kurtosis value that
deviated the furthest from 3
ICA Output
To be presented by Adam Schoenwald at the 2017 IEEE International Geoscience and Remote Sensing Symposium, Fort Worth, Texas, July 2017 9
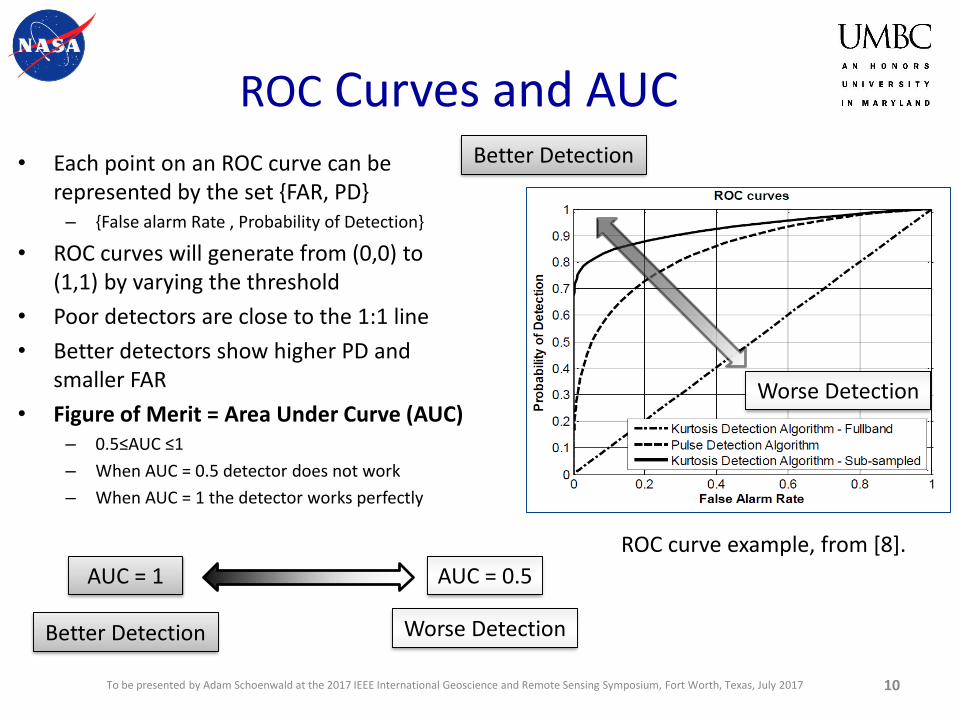
ROC Curves and AUC• Each point on an ROC curve can be
represented by the set {FAR, PD}– {False alarm Rate , Probability of Detection}
• ROC curves will generate from (0,0) to (1,1) by varying the threshold
• Poor detectors are close to the 1:1 line
• Better detectors show higher PD and smaller FAR
• Figure of Merit = Area Under Curve (AUC)– 0.5≤AUC ≤1
– When AUC = 0.5 detector does not work
– When AUC = 1 the detector works perfectly
ROC curve example, from [8].
To be presented by Adam Schoenwald at the 2017 IEEE International Geoscience and Remote Sensing Symposium, Fort Worth, Texas, July 2017
Better Detection Worse Detection
AUC = 1 AUC = 0.5
Better Detection
Worse Detection
10

AUC Results- ICA Performance - CW
More ICA results in [7], generally a marginal improvement in detection is seen
RSK = Real Signal KurtosisCSK = Complex Signal Kurtosis
To be presented by Adam Schoenwald at the 2017 IEEE International Geoscience and Remote Sensing Symposium, Fort Worth, Texas, July 2017
-14-12-10-8-6-4
INR
0.4
0.5
0.6
0.7
0.8
0.9
1
AU
C
ICA Performance, CW d = 100%, N = 9000
direct | RSK
direct | CSK
fastica | RSK
fastica | CSK
robustica | RSK
robustica | CSK
nccfastica | RSK
nccfastica | CSK
erbm | RSK
erbm | CSK
cqamsym | RSK
cqamsym | CSK
cerbm | RSK
cerbm | CSK
-8-6-4-20
INR at AUC = 0.75
CSK cerbm
CSK cqamsym
CSK nccfastica
CSK erbm
CSK robustica
RSK nccfastica
RSK cqamsym
RSK cerbm
CSK direct
RSK erbm
RSK direct
RSK fastica
RSK robustica
CSK fastica
ICA Performance, CW d = 100%, N = 9000
Various ICA algorithms are tested [9,10,11,12,13,14,15,16,17].No ICA pre-processing is done on ‘direct’ data sets.
11

Eigenvalue Approach
To be presented by Adam Schoenwald at the 2017 IEEE International Geoscience and Remote Sensing Symposium, Fort Worth, Texas, July 2017
• Two objectives:– Detection: Identify power measurements that
have been contaminated with interference• The Minimum Maximum Eigenvalue (MME)
approach, adapted from the cognitive radio context [10], is applied here for RFI detection in passive remote sensing.
– Excision: Accurately guess what the power measurement would have been if the interfere were not there
12

Conceptual Signal Model
Hypothesis Test / Signal Model
ℋ0: 𝑥 𝑘 = 𝑤 𝑘ℋ1: 𝑥 𝑛 = 𝑤 𝑘 + 𝑟 𝑘
𝑆𝑁𝑅 =𝑃𝑠𝜎𝑤2
Ps = E 𝑟 𝑘 2
𝑤 𝑘 ~𝒩(0, 𝜎𝑤2) = Thermal Noise
𝑟[𝑘] = RFI Gaussian Noise
RFI
SatelliteRadiometer
Earth
(depiction not to scale)
DirecTVStationary Orbit
Polar Orbit
To be presented by Adam Schoenwald at the 2017 IEEE International Geoscience and Remote Sensing Symposium, Fort Worth, Texas, July 2017 13

Measure the Sample Covariance(Oversampled)
The Eigenvalues of the covariance matrix are found
𝜆1 > 𝜆2 > ⋯ > 𝜆𝑀𝐿
The test statistic is then formed as
𝐓𝜆 =𝜆𝑚𝑎𝑥
𝜆𝑚𝑖𝑛
Given our sampled signal x,
𝑥𝑖 𝑛 ≡ 𝑥 𝑛𝑀 + 𝑖 − 1 𝑖 = 1,2, … ,𝑀
𝐱 𝑛 ≡ 𝑥1 𝑛 , 𝑥2 𝑛 ,… 𝑥𝑀 𝑛 𝑇
ො𝐱 𝑛 ≡ 𝐱𝑇 𝑛 , 𝐱𝑇 𝑛 − 1 ,…𝐱𝑇 𝑛 − 𝐿 + 1 𝑇
𝐑𝑥 = 𝔼[ො𝐱 𝑛 ො𝐱𝐻 𝑛 ]
𝐑𝑥 𝑁𝑠 ≡1
𝑁𝑠
𝑛=𝐿−1
𝐿−2+𝑁𝑠
ො𝐱 𝑛 ො𝐱𝐻 𝑛
To be presented by Adam Schoenwald at the 2017 IEEE International Geoscience and Remote Sensing Symposium, Fort Worth, Texas, July 2017 14

Eigenvalue Noise Power Estimate
Scale the minimum eigenvalue of the covariance matrix to estimate the variance of the Gaussian thermal noise. The limiting distributions from [19] help derive the scaling factor.
𝐑𝑥 → 𝜆1 > 𝜆2 > … ≥ 𝜆𝑀𝐿
lim𝑁𝑠→∞
𝜆𝑚𝑖𝑛 = 𝜎2 1 − 𝑦 2
lim𝑁𝑠→∞
𝜆𝑚𝑎𝑥 = 𝜎2 1 + 𝑦 2
𝜎w2 = 𝜆𝑚𝑖𝑛
𝑁𝑠
𝑁𝑠 − 𝑀𝐿
To be presented by Adam Schoenwald at the 2017 IEEE International Geoscience and Remote Sensing Symposium, Fort Worth, Texas, July 2017 15

Wideband RFI – 5 QPSK Channels
To be presented by Adam Schoenwald at the 2017 IEEE International Geoscience and Remote Sensing Symposium, Fort Worth, Texas, July 2017 16

MME Detection Results
To be presented by Adam Schoenwald at the 2017 IEEE International Geoscience and Remote Sensing Symposium, Fort Worth, Texas, July 2017 17
Eigenvalue Detection method greatly outperforms all other methods tested (Kurtosis[2,3] and Spectral Kurtosis[20])
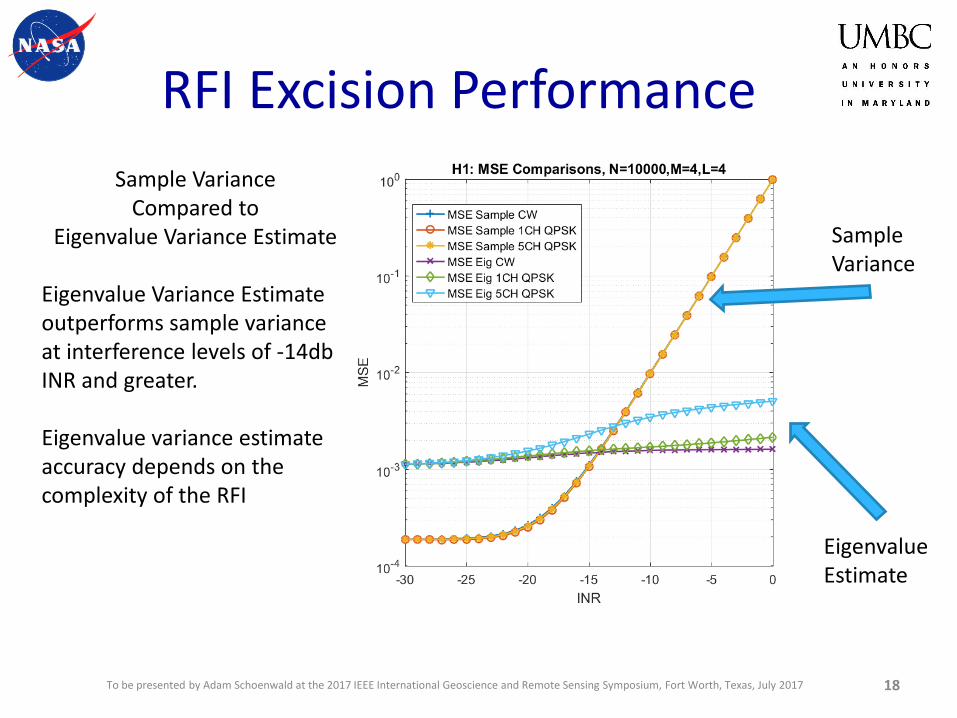
RFI Excision Performance
To be presented by Adam Schoenwald at the 2017 IEEE International Geoscience and Remote Sensing Symposium, Fort Worth, Texas, July 2017 18
Sample VarianceCompared to
Eigenvalue Variance Estimate
Eigenvalue Variance Estimateoutperforms sample variance at interference levels of -14db INR and greater.
Eigenvalue variance estimate accuracy depends on the complexity of the RFI
Sample Variance
Eigenvalue Estimate

References1) Draper, David W., “Report on GMI Special Study #15: Radio Frequency Interference” , Ball Aerospace and Technologies Corp., Jan 16, 2015
2) De Roo, R.D.; Misra, S.; Ruf, C.S., "Sensitivity of the Kurtosis Statistic as a Detector of Pulsed Sinusoidal RFI," in Geoscience and Remote Sensing, IEEE Transactions on , vol.45, no.7,
pp.1938-1946, July 2007
3) J. Piepmeier, J. Johnson, P. Mohammed, D. Bradley, C. Ruf, M. Aksoy, R. Garcia, D. Hudson, L. Miles,and M. Wong, “Radio-frequency interference mitigation for the soil moisture
active passive microwave radiometer,” IEEE Transactions on Geoscience and Remote Sensing, vol. 52, no. 1, pp. 761–775, January 2014.
4) Bradley, D.; Morris, J.M.; Adali, T.; Johnson, J.T.; Aksoy, M., "On the detection of RFI using the complex signal kurtosis in microwave radiometry," in Microwave Radiometry and
Remote Sensing of the Environment (MicroRad), 2014 13th Specialist Meeting on , vol., no., pp.33-38, 24-27 March 2014
5) A. J. Schoenwald, D. C. Bradley, P. N. Mohammed, J. R. Piepmeier and M. Wong, "Performance analysis of a hardware implemented complex signal kurtosis radio-frequency
interference detector," 2016 14th Specialist Meeting on Microwave Radiometry and Remote Sensing of the Environment (MicroRad), Espoo, 2016, pp. 71-75.
6) A. Hyvärinen and E. Oja. Independent component analysis: algorithms and applications. Neural Networks 13, 4-5 (May 2000), 411-430
7) A. J. Schoenwald, A. Gholian, D. C. Bradley, M. Wong, P. N. Mohammed and J. R. Piepmeier, "RFI detection and mitigation using independent component analysis as a pre-
processor," 2016 Radio Frequency Interference (RFI), Socorro, NM, 2016, pp. 100-104.
8) S. Misra, P. N. Mohammed, B. Guner, C. S. Ruf, J. R. Piepmeier and J. T. Johnson, "Microwave Radiometer Radio-Frequency Interference Detection Algorithms: A Comparative
Study," in IEEE Transactions on Geoscience and Remote Sensing, vol. 47, no. 11, pp. 3742-3754, Nov. 2009.
9) A. Hyvärinen. “Fast and Robust Fixed-Point Algorithms for Independent Component Analysis”, IEEE Transactions on Neural Networks 10(3):626-634, 1999.
10) V. Zarzoso and P. Comon, "Robust Independent Component Analysis by Iterative Maximization of the Kurtosis Contrast with Algebraic Optimal Step Size", IEEE Transactions on
Neural Networks, Vol. 21, No. 2, February 2010, pp. 248-261.
11) Mike Novey and T. Adali, "On Extending the complex FastICA algorithm to noncircular sources" IEEE Trans. Signal Processing, vol. 56, no. 5, pp. 2148-2154, May 2008.
12) X.-L. Li, and T. Adali, "Blind spatiotemporal separation of second and/or higher-order correlated sources by entropy rate minimization," in Proc. IEEE Int. Conf. Acoust., Speech,
Signal Processing (ICASSP), Dallas, TX, March 2010.
13) Mike Novey and T. Adali, "Complex Fixed-Point ICA Algorithm for Separation of QAM Sources using Gaussian Mixture Model" in IEEE Conf. ICASSP 2007
14) G.-S. Fu, R. Phlypo, M. Anderson, and T. Adali, "Complex Independent Component Analysis Using Three Types of Diversity: Non-Gaussianity, Nonwhiteness, and Noncircularity,"
IEEE Trans. Signal Processing, vol. 63, no. 3, pp. 794-805, Feb. 2015.
15) ICA and BSS Group, Aalto University, Matlab Resources, http://research.ics.aalto.fi/ica/fastica/
16) Vicente Zarzoso, Institut Universitaire de France , Robust ICA, Matlab Resources, http://www.i3s.unice.fr/~zarzoso/robustica.html
17) Machine Learning for Signal Processing Laboratory, University of Maryland Baltimore County , Matlab Resources, http://mlsp.umbc.edu/resources.html
18) Y. Zeng and Y. C. Liang, "Eigenvalue-based spectrum sensing algorithms for cognitive radio," in IEEE Transactions on Communications, vol. 57, no. 6, pp. 1784-1793, June 2009.
19) Bai, Z. D. Methodologies in Spectral Analysis of Large Dimensional Random Matrices, A Review Statistica Sinica, 1999 , 9 , 611-662
20) Nita, G. M.; Gary, D. E.; Liu, Z.; Hurford, G. J. & White, S. M. Radio Frequency Interference Excision Using Spectral-Domain Statistics Publications of the Astronomical Society of the
Pacific, 2007 , 119 , 805-827
To be presented by Adam Schoenwald at the 2017 IEEE International Geoscience and Remote Sensing Symposium, Fort Worth, Texas, July 2017 19