![PROCESS-ORIENTED ARCHITECTURES FOR ELECTRONIC …Traditional E-commerce [13,18,30,36,45,47,51,53] mainly using Electronic Data Interchange (EDI) is rapidly moving to the Internet.](https://static.fdocuments.us/doc/165x107/5eb59d86e2bff764543f06a0/process-oriented-architectures-for-electronic-traditional-e-commerce-1318303645475153.jpg)
DETECTION OF MULTI ORIENTED MOVING TEXT IN...
183
DETECTION OF MULTI -ORIENTED MOVING TEXT IN VIDEOS VIJETA KHARE THESIS SUBMITTED IN FULFILMENT OF THE REQUIREMENTS FOR THE DEGREE OF DOCTOR OF PHILOSOPHY FACULTY OF ENGINEERING UNIVERSITY OF MALAYA KUALA LUMPUR, MALAYSIA 2016
-
Upload
hoangtuong -
Category
Documents
-
view
220 -
download
3
Transcript of DETECTION OF MULTI ORIENTED MOVING TEXT IN...
DETECTION OF MULTI-ORIENTED MOVING TEXT
IN VIDEOS
VIJETA KHARE
THESIS SUBMITTED IN FULFILMENT OF THE
REQUIREMENTS FOR THE DEGREE OF DOCTOR OF
PHILOSOPHY
FACULTY OF ENGINEERING
UNIVERSITY OF MALAYA
KUALA LUMPUR, MALAYSIA
2016

ii
UNIVERSITY OF MALAYA
ORIGINAL LITERARY WORK DECLARATION
Name of Candidate: Vijeta Khare (I.C/Passport No: L4935644)
Registration/Matric No: KHA120026
Name of Degree: Doctor of Philosophy
Title of Thesis: DETECTION OF MULTI-ORIENTED MOVING TEXT IN
VIDEOS
Field of Study: Electronic
I do solemnly and sincerely declare that:
(1) I am the sole author/writer of this Work;
(2) This Work is original;
(3) Any use of any work in which copyright exists was done by way of fair
dealing and for permitted purposes and any excerpt or extract from, or
reference to or reproduction of any copyright work has been disclosed
expressly and sufficiently and the title of the Work and its authorship have
been acknowledged in this Work;
(4) I do not have any actual knowledge nor do I ought reasonably to know that
the making of this work constitutes an infringement of any copyright work;
(5) I hereby assign all and every rights in the copyright to this Work to the
University of Malaya (“UM”), who henceforth shall be owner of the
copyright in this Work and that any reproduction or use in any form or by
any means whatsoever is prohibited without the written consent of UM
having been first had and obtained;
(6) I am fully aware that if in the course of making this Work I have infringed
any copyright whether intentionally or otherwise, I may be subject to legal
action or any other action as may be determined by UM.
Candidate‟s Signature Date:
Subscribed and solemnly declared before,
Witness‟s Signature Date:
Name:
Designation:

iii
ABSTRACT
Text, as one of the most significant creations of humankind, has played a vital part
in humanoid life, so far from olden periods. High level semantics embodied in the text
are beneficial in a wide range of vision-based applications. For example, image
understanding, image indexing, geo location, automatic navigation, license plate
recognition, assisting blind person and other surveillance applications. There are
approaches in the field of content based image retrieval to solve the above mentioned
problems. However, these approaches are inadequate to generate annotation based on
semantics according to content of video or images due to opening between high level
and low level features. Therefore text detection and recognition in videos grow into
active and important research areas in computer vision and document analysis, which is
capable of understanding the content of video and images at high level with the help of
Optical Character Recognizer (OCR). Especially in recent years, the researchers has
seen a flow of research efforts and considerable developments in these fields, however
many challenges e.g. low resolution, complex background and variations in colors,
font, font size, Multi-orientations, Multi-orientation text movements, noise, blur, and
distortion still remain. The objectives of this work are in four folds: (1) to introduce a
new descriptor called Histogram Oriented Moments (HOM) for detecting multi-
oriented text from videos. The HOM is created by considering the orientations
calculated with the second order geometrical moments. Further, to verify the detected
text, optical flow properties are used to estimate the motion between text candidates in
temporal frames. However, the use of temporal information is limited to false positive
elimination but not as main features to find text candidates. (2) to propose new models
for finding multi-oriented moving text from video and scene images through moments,
motion vectors are utilized to identify moving regions that have constant velocity.
However, the model is slightly sensitive to window size used for moment‟s calculation

iv
and different scripts in video. (3) To develop automatic window size determination for
detecting text from videos, the next method explored stroke width transform based on
the information that the stroke width remains constant throughout the characters.
Further, the temporal frames are used for identifying text candidates based on the fact
that caption text stays at the same unchanged location for few frames. However, the
performance of the proposed method degrades when there is blur present in the video
frames because moments and stroke width transforms are sensitive to blur. (4) To
develop a method for text detection and recognition in blur frames, a blind
deconvolution model is introduced that enhances the edge sharpness by suppressing
blurred pixels. In summary, each work has been tested over benchmark datasets and
authors‟ created datasets from different resources using standard measures.
Furthermore, the results of the proposed methods are compared with the state of art
methods to show that the proposed methods are competent to existing methods.

v
ABSTRAK
Teks, sebagai salah satu ciptaan yang paling unggul daripada manusia, telah
memainkan peranan yang penting dalam kehidupan harian, sejak zaman dulu. Semantik
bertahap tinggi yang terkandung dalam teks dapat digunakan dalam pelbagai aplikasi
berasaskan penglihatan. Sebagai contoh, pengertian imej, pengindeksan imej, lokasi
geo, navigasi automatik, pengecaman tempat letak lesen, pertolongan kepada orang
buta dan aplikasi-aplikasi pengawasan lain. Terdapat pelbagai kaedah yang berkenaan
dengan pengembalian imej berasaskan kandung (CBIR) untuk menyelesaikan masalah-
masalah tersebut. Walau bagaimanapun, kaedah sebegini adalah tidak mencukupi untuk
menjana nota penjelasan yang berasaskan semantik yang mengikut kandungan video
atau imej. Ini adalah kerana terdapat jurang besar antara ciri-ciri tahap rendah dan
tinggi. Oleh itu pengesanan dan pengecaman teks dalam video telah berkembang ke
bidang-bidang visi computer dan analisa dokumen yang penting dan aktif, iaitu
pemahaman kandungan video dan imej pada tahap yang tinggi dengan bantuan
Pengecam Aksara Optik (OCR). Pada tahun-tahun kebelakangan ini, para penyelidik
telah menyaksikan usaha-usaha penyelidikan dan perkembangan yang besar dalam
bidang ini, namun pelbagai cabaran seperti resolusi rendah, latar belakang yang
kompleks dan penukaran warna, perkataan, saiz perkataan, orientasi majmuk,
pergerakan teks dalam orientasi majmuk, hingar, kabur, dan herotan, masih kekal.
Terdapat empat objektif dalam kajian ini: (1) untuk memperkenalkan penghurai baru
yang dikenali sebagai momen berasaskan histogram (HOM) untuk mengesan teks
berorientasikan majmuk dari video. HOM direka cipta dengan mengambil kira orientasi
yang dikira dengan momen geometri peringkat kedua. Selanjutnya, untuk mengesahkan
teks yang dikesan, ciri-ciri aliran optik, telah digunakan untuk menganggarkan
pergerakkan antara bingkai tempoh. Walau bagaimanapun, penggunaan maklumat
tempoh adalah terhad kepada penghapusan positif palsu tetapi bukan sebagai ciri-ciri

vi
utama untuk mencari teks-teks calon. (2) untuk mencadangkan model baru yang dapat
mencari pergerakkan teks yang berorientas majmuk daripada video dan imej
pemandangan, dengan menggunakan momen. Vektor gerakan digunakkan untuk
mengenal pasti kawasan-kawasan yang mempunyai halaju tetap. Walau bagaimanapun,
model ini didapati sensitif kepada saiz tetingkap yang digunakan untuk pengiraan
momen dan skrip yang berbeza dalam video. (3) Untuk menentu saiz tetingkap secara
automatik bagi pengesanan teks dari video. Jelmaan strok lebar diterokai di mana strok
lebar adalah tetap sepanjang masa. Selanjutnya, bingkai tempoh juga digunakan untuk
mengenal pasti teks-teks calon dengan berdasarkan fakta bahawa teks kapsyen kekal di
lokasi yang tetap untuk beberapa bingkai. Walau bagaimanapun, kaedah ini tidak dapat
dijalankan dengan baik untuk video yang kabur. Ini adalah kerana momen dan jelmaan
strok lebar adalah sensitif kepada kabur. (4) Untuk mengusahakan suatu kaedah yang
dapat mengesan dan mengecam teks dalam bingkai kabur. Model nyah-konvolusi buta
telah diperkenalkan untuk meningkatkan amatan tepian dengan menyekat piksel yang
kabur. Rumusannya, setiap kerja telah diuji ke atas set data yang sedia ada dan set data
yang dikumpulkan daripada pelbagai sumber dengan langkah-langkah piawai.
Tambahan lagi, keputusan kaedah yang dicadangkan adalah dibandingkan dengan
kaedah-kaedah lain untuk menunjukkan bahawa kaedah yang dicadangkan adalah lebih
baik berbanding dengan kaedah yang sedia ada.

vii
ACKNOWLEDGEMENTS
First and foremost, I would like to express my heartiest appreciation and gratitude to
my supervisors, Dr. P. Shivakumara and Prof. P. Raveendran, for being such a good
mentors. I am deeply grateful for your words of wisdom, encouragement and guidance
throughout my journey in obtaining this degree. Without your unflagging support and
active participation in every step of the process, this thesis may never have been
comprehended.
I am thankful to the present and past members of the Center for Signal and Image
Processing (CISIP) and Multimedia lab of University of Malaya, for their directly and
indirectly contribution to the constructive ideas and the time together in the lab.
I would also like to convey my profound gratitude to my family. Words cannot
express how grateful I am to my dearest mother, father, brother, mother-in-law and
father-in-law. Thank you for your unconditional love, support and understanding. Your
prayers and love have been my constant motivation and driving force. And to my
loving husband, Ahlad Kumar, who has been by my side through all weathers, ups and
downs, living every single seconds of it, and without whom, I would never have the
courage to start on this.
Vijeta Khare
Department of Electrical Engineering
Faculty of Engineering
University of Malaya
March 2016

viii
TABLE OF CONTENTS
Abstract ............................................................................................................................ iii
Abstrak .............................................................................................................................. v
Acknowledgements ......................................................................................................... vii
Table of Contents ........................................................................................................... viii
List of Figures ................................................................................................................. xii
List of Tables.................................................................................................................. xvi
Abbreviations ............................................................................................................... xviii
CHAPTER 1: INTRODUCTION .................................................................................. 1
1.1 Overview.................................................................................................................. 1
1.2 Objectives ................................................................................................................ 9
1.3 Contributions ......................................................................................................... 10
1.4 Organization of Thesis ........................................................................................... 12
CHAPTER 2: LITERATURE REVIEW .................................................................... 15
2.1 Text Detection from Videos .................................................................................. 15
2.1.1 Methods without Temporal Information .................................................. 15
2.1.1.1 Connected Component based methods ..................................... 16
2.1.1.2 Texture based methods .............................................................. 19
2.1.1.3 Edge/Gradient Feature based methods ...................................... 23
2.1.2 Methods with Temporal Information ....................................................... 27
2.2 Deblurring Text images ......................................................................................... 30
2.3 Summary ................................................................................................................ 31

ix
CHAPTER 3: A NEW HISTOGRAM ORIENTED MOMENTS DESCRIPTOR
FOR MOVING TEXT DETECTION ......................................................................... 33
3.1 Introduction............................................................................................................ 33
3.2 Proposed Method ................................................................................................... 34
3.2.1 HOM for Text Candidates Selection ........................................................ 35
3.2.2 Text Candidates Verification .................................................................... 40
3.2.3 Moving Text Detection ............................................................................ 42
3.3 Experimental Results and Discussion .................................................................... 46
3.3.1 Dataset ...................................................................................................... 46
3.3.2 Description of Measures ........................................................................... 47
3.3.3 Experiment on ICDAR 2013 Video ......................................................... 49
3.3.4 Experiment on Author‟s Dataset .............................................................. 51
3.4 Summary ................................................................................................................ 54
CHAPTER 4: MOTION ESTIMATION BASED METHOD FOR MULTI-
ORIENTED MOVING TEXT DETECTION ............................................................ 56
4.1 Introduction............................................................................................................ 56
4.2 Proposed Method ................................................................................................... 57
4.2.1 Motion Vector Estimation ........................................................................ 59
4.2.2 Selection of Text Candidates .................................................................... 61
4.2.3 Text Detection .......................................................................................... 62
4.3 Experimental Results and Discussion .................................................................... 65
4.3.1 Dataset ...................................................................................................... 66
4.3.2 Description of Measures ........................................................................... 67
4.3.3 Qualitative and Quantitative Results for static Text ................................ 68
4.3.4 Qualitative and Quantitative Results for dynamic Text ........................... 69
x
4.3.5 Discussion ................................................................................................ 71
4.4 Summary ................................................................................................................ 72
CHAPTER 5: ARBITRARILY-ORIENTED MULTI-LINGUAL TEXT
DETECTION IN VIDEOS ........................................................................................... 74
5.1 Introduction............................................................................................................ 74
5.2 Proposed Method ................................................................................................... 75
5.2.1 Automatic Window Size Detection .......................................................... 76
5.2.2 Static and Dynamic Text Cluster Classification ....................................... 79
5.2.3 Potential Text Candidates Detection for Text Detection .......................... 85
5.3 Experimental Results and Discussion .................................................................... 88
5.3.1 Datasets .................................................................................................... 89
5.3.2 Description Measures ............................................................................... 90
5.3.3 Analysing the Contributions of Dynamic Window Size and Deviation
Steps ......................................................................................................... 93
5.3.4 Experiments on Arbitrarily-Oriented English and Multilingual Video .... 95
5.3.5 Experiments on Standard ICDAR 2013, YVT and ICDAR 2015 Videos 99
5.4 Summary .............................................................................................................. 104
CHAPTER 6: A BLIND DECONVOLUTION METHOD FOR TEXT
DETECTION AND RECOGNITION ....................................................................... 106
6.1 Introduction.......................................................................................................... 106
6.2 Proposed Method ................................................................................................. 108
6.2.1 Classification of Blur and Non-Blur Frame in Video ............................ 109
6.2.2 Blind Deconvolutional Model ................................................................ 112
6.2.2.1 Kernel estimation .................................................................... 114
6.2.2.2 Image estimation ..................................................................... 118

xi
6.3 Experimental Results and Discussion .................................................................. 119
6.3.1 Experiments on Blur Frame Classification ............................................ 120
6.3.2 Experiments on Proposed Deblurring Model ......................................... 122
6.3.3 Text Detection Experiments for Validating the Proposed Model .......... 128
6.3.4 Text Recognition Experiments for Validating the Proposed Model ...... 145
6.4 Summary .............................................................................................................. 152
CHAPTER 7: CONCLUSION AND FUTURE WORK ......................................... 153
7.1 Conclusion ........................................................................................................... 153
7.2 Future work .......................................................................................................... 154
References ..................................................................................................................... 156
List of Publications and Papers Presented .................................................................... 164

xii
LIST OF FIGURES
Figure 1.1: Steps of automatic text recognition system .................................................... 3
Figure 1.2: Example of text information present at different sources............................... 5
Figure 1.3: Challenges in detecting text ............................................................................ 8
Figure 3.1: Steps of the proposed method ....................................................................... 34
Figure 3.2: Orientations of the HOM descriptor ............................................................. 37
Figure 3.3: Text candidates selected by HOM descriptor ............................................... 38
Figure 3.4: Orientations of HOG descriptor ................................................................... 39
Figure 3.5: Effect of HOG descript for text candidate selection..................................... 40
Figure 3.6: (a) Corners are detected for the text candidates, (b) and (c) represents
outputs when low dense corners and low edge density edges are rejected (d) Final text
detection result are shown ............................................................................................... 42
Figure 3.7: Optical flow vectors marked over video frames ........................................... 44
Figure 3.8: (a) Detected Text region multiplied with (b) optical flow intensity fields can
classifies the moving text region in (c) ........................................................................... 45
Figure 3.9: (a) Input frame (b)-(d) shows intermediate results of moving text detection45
Figure 3.10: Sample images from dataset considers ....................................................... 47
Figure 3.11: Example of matching between detected block (red) and ground truth
(yellow) ........................................................................................................................... 48
Figure 3.12: Sample results for proposed and existing methods when tested over
individual frames ............................................................................................................. 50
Figure 3.13: Sample results for proposed and existing methods when temporal
information is used .......................................................................................................... 51
Figure 3.14: Sample results for proposed and existing methods when tested over
individual frames ............................................................................................................. 52
Figure 3.15: Sample results for proposed and existing methods for Scene text when
temporal information used .............................................................................................. 53
Figure 4.1: Flow chart of the proposed method .............................................................. 58

xiii
Figure 4.2: Gradient direction of a character showing outer contour ............................. 59
Figure 4.3: Text block division: (a) Input first frame, (b) blocks division ..................... 59
Figure 4.4: Search area for motion estimation through three steps search method ........ 60
Figure 4.5: Illustration for text movements: (a) Video frames, (b) Edged image of each
frame, and (c) text movements can be noticed ................................................................ 61
Figure 4.6: Text candidate selection: (a) Moving text with edge components, (b) Text
candidates identified........................................................................................................ 61
Figure 4.7: False text candidate removal using gradient directions ................................ 63
Figure 4.8: Text representatives extraction: (a) Effect of gradient direction, (b) Effect of
edge density, (c) Text representatives ............................................................................. 64
Figure 4.9: Text detection: (a) Mask operation to connect potential text candidates, (b)
Boundary grown mask (c) Text lines edges inside final boundary grown Mask and (d)
Text detected ................................................................................................................... 64
Figure 4.10: Few sample images from datasets .............................................................. 67
Figure 4.11: Sample result of the proposed and existing methods for static text ........... 68
Figure 4.12: Sample results of proposed and existing methods for multi-oriented
moving text videos .......................................................................................................... 70
Figure 4.13: Limitations of the proposed method ........................................................... 72
Figure 5.1: Overall framework of the proposed method ................................................ 76
Figure 5.2: Automatic window size detection using stroke width (SW) distance and
opposite direction pair ..................................................................................................... 79
Figure 5.3: Iterative process for separating caption pixels from scene and background
pixels. .............................................................................................................................. 83
Figure 5.4: Cumulative graph of number of components in non-text cluster for
different iteration ............................................................................................................. 84
Figure 5.5: Text candidates of caption and scene texts. ................................................. 85
Figure 5.6: Potential text candidates from union of caption and scene text pixels ........ 86
Figure 5.7: Boundary Growing to detect full multi-oriented text lines: (a) Restored
edge components from Sobel edge image of the input frame corresponding to potential

xiv
text candidates, (b) Boundary fixing for edge components, (c)-(g) intermediate results
of boundary growing towards outward direction of pixels of edge components, (g) is
final growing results and (h) is text extraction results. ................................................... 88
Figure 5.8: Sample results for different combinations of automatic window selection
and deviation for frames selection. AW denotes Automatic Window and D denote
Deviation. ........................................................................................................................ 95
Figure 5.9: Sample results of the proposed and existing methods on an arbitrarily-
oriented video dataset ...................................................................................................... 97
Figure 5.10: Sample results of the proposed and existing methods on Author‟s
multilingual dataset ......................................................................................................... 98
Figure 5.11: Sample results of the proposed and existing methods on ICDAR2013
video dataset .................................................................................................................. 101
Figure 5.12: Sample results of the proposed and existing methods on YVT video
dataset ............................................................................................................................ 102
Figure 5.13: Sample results of the proposed and existing methods on ICDAR2015
video dataset .................................................................................................................. 103
Figure 6.1: Illustrating text detection and recognition for blurred and deblurred frames108
Figure 6.2: Proposed Methodology framework ............................................................ 109
Figure 6.3: Sample images with various degree of blur with their text detection
response ......................................................................................................................... 112
Figure 6.4: lambda (λ) and weight (w) impact over an image in terms of quality ........ 115
Figure 6.5: Sample blurred frame and corresponding deblurred frame with the QA
score of the proposed method associated with the estimated kernel of size 15×15. ..... 117
Figure 6.6: Kernel size Vs. Image quality .................................................................... 117
Figure 6.7: Samples successful results for blur and non-blur classification by the
proposed method ........................................................................................................... 121
Figure 6.8: Deblurring performance of the proposed and existing methods................. 126
Figure 6.9: Performance of the proposed and existing methods for deblurring in
comparison with the ground truth ................................................................................. 127
Figure 6.10: 1-D profile of existing methods with proposed ........................................ 128

xv
Figure 6.11: Text detection Response of existing method over blurred and deblured
frame on Author‟s dataset ............................................................................................. 133
Figure 6.12: Text detection Response of proposed methods over blurred and deblured
frame on Author‟s dataset ............................................................................................. 134
Figure 6. 13: Text detection Response of existing method over standard video dataset
(ICDAR 2013, YVT, ICDAR2015) .............................................................................. 136
Figure 6.14: Text detection Response of proposed methods over standard video dataset
(ICDAR 2013, YVT, ICDAR2015) .............................................................................. 137
Figure 6.15: Text detection Response of existing methods over blurred and deblured
scene images from standard datasets (MSRA-TD500, SVT, ICDAR2013) ................. 141
Figure 6.16: Text detection Response of proposed method of Chapter 3 over blurred
and deblured scene images from standard datasets (MSRA-TD500, SVT, ICDAR2013)142
Figure 6.17: Binarization and Recognition results of the existing binarization methods
for Author‟s dataset (Note: Recognition results are shown in box) .............................. 147
Figure 6.18: Binarization and Recognition results of the existing binarization methods
for standard video dataset (Note: Recognition results are shown in box)..................... 149
Figure 6.19: Binarization and Recognition results of the existing binarization methods
for text lines from scene images.................................................................................... 151

xvi
LIST OF TABLES
Table 1.1: Challenges in Text Detection ........................................................................... 7
Table 2.1: Summary of the methods that does not utilize Temporal Information .......... 27
Table 3.1: Performance on ICDAR2013 when tested over individual frames ............... 50
Table 3.2: Performance on ICDAR2013 with temporal information ............................. 51
Table 3.3: Performance on Author‟s dataset when tested over individual frames.......... 53
Table 3.4: Performance for scene text with temporal information ................................. 54
Table 4.1: Performance of the proposed and existing methods for static text ................ 69
Table 4.2: Performance of the proposed and existing methods for dynamic text ........... 70
Table 5.1: Performance of the proposed method for different combinations of
Automatic Window (AW) and Deviation (D) ................................................................. 95
Table 5.2: Text detection results of the proposed and existing methods for Author‟s
English and Multi-Lingual Video datasets ...................................................................... 99
Table 5.3: Text detection results for standard ICDAR 2013 and YVT videos ............. 104
Table 5.4: Text detection results for standard ICDAR 2015 videos ............................. 104
Table 6.1: Confusion matrix (classification rate in %) of video frames from authors
video datasets (BF: Blurred Frames; NBF: Non Blurred Frames) ................................ 122
Table 6.2: Confusion matrix (in %) of video frames from standard video datasets ..... 122
Table 6.3: Confusion matrix (in %) of images from standard scene image datasets (BI:
Blurred Image; NBI: Non-Blurred Image) .................................................................... 122
Table 6.4: Average quality measures of the proposed and existing methods for
deblurring before and after classification ...................................................................... 128
Table 6.5: Text detection response before classification across all frames for Author‟s
video dataset .................................................................................................................. 134
Table 6.6: Text detection response after classification across blurred and deblurred
frames for Author‟s video dataset ................................................................................. 135
Table 6.7: Text detection response before classification across all frames for
ICDAR2013 videos ....................................................................................................... 137

xvii
Table 6.8: Text detection response after classification across blurred and deblurred
frames for ICDAR2013 videos ..................................................................................... 138
Table 6.9: Text detection response before classification across all frames for the YVT
dataset ............................................................................................................................ 138
Table 6.10: Text detection response after classification across blurred and deblurred
frames for the YVT dataset ........................................................................................... 139
Table 6.11: Text detection response before classification across all frames for ICDAR
2015 ............................................................................................................................... 139
Table 6.12: Text detection response before and after classification across blurred and
deblurred frames for ICDAR 2015 ............................................................................... 140
Table 6.13: Text detection response before classification all frames for MSRA-TD500142
Table 6.14: Text detection response after classification across blurred and deblurred
frames for MSRA-TD500 ............................................................................................. 142
Table 6.15: Text detection response before classification across all frames for SVT .. 143
Table 6.16: Text detection response before and after classification across blurred and
deblurred frames for SVT ............................................................................................. 143
Table 6.17: Text detection response before classification across all frames for ICDAR
2013 Scene images ........................................................................................................ 143
Table 6.18: Text detection response after classification across blurred and deblurred
frames for ICDAR 2013 Scene images ......................................................................... 144
Table 6.19: Recognition results before and after classification over blurring and
deblurring for Author‟s dataset ..................................................................................... 148
Table 6.20: Recognition accuracy before classification over all frames for standard
video dataset .................................................................................................................. 150
Table 6.21: Recognition accuracy after classification over blurring and deblurring for a
standard video dataset ................................................................................................... 150
Table 6.22: Recognition accuracy before classification over all frames for standard
scene dataset .................................................................................................................. 151
Table 6.23: Recognition accuracy after classification over blurring and deblurring for a
standard scene dataset ................................................................................................... 152

xviii
ABBREVIATIONS
APT: Average Processing Time
ATA: Average Tracking Accuracy
ATB: Actual Text Blocks
BDM: Block Distortion Measure
BRISQUE: Blind/Reference less Image Spatial Quality Evaluator
CBIR: Content Based Image Retrieval
CC: Connected Component
CRF: Conditional Random Field
F: F-measure
FDB: Falsely Detected Block
GD: Gradient Direction
GPC: Global Phase Coherence
GVF: Gradient Vector Flow
GW-L1: Gaussian Weighted-L1 norm
HOG: Histogram Oriented Gradients
HOM: Histogram Oriented Moments
KNFB: Kurzweil National Federation of the Blind
MDB: Text Block with Missing Data
MDR: Misdetection Rate
MOTA: Multiple Object Tracking Accuracy
MOTP: Multiple Object Tracking Precision
MSER: Maximally Stable Extremal Region
NRIQA: blind/No-Reference (NR) Image Quality Assessment (IQA)
OCR: Optical Character Recognizer

xix
P: Precision
QA: Quality Assessment
R: Recall
SI: Sharpness Index
SW: Stroke Width
SWT: Stroke Width Transform
TDB: Truly Detected Block
TV: Total Variation
WHO: World Health Organization

1
CHAPTER 1: INTRODUCTION
1.1 Overview
In the abundance of online information present in the form of text videos, with the
evolution of mobile devices and the entry of new concept like augmented reality, text
detection is trending in recent years. The emergence of applications on mobile devices
that translate text into other languages in real time has stimulated renewed interest in
the problems. One of the most expressive means of communications is text which can
be embedded into documents or into scenes or into a video as a means of
communicating information. This is done in the way that makes it noticeable and/or
readable by others. The collection of massive amounts of street view data is just one
driving application. Other well-known examples are vehicle license, signs containing
text from a natural scene detection and recognition. Text in web images is relevant to
the content of the web pages. Video captions annotate information about the happening
events. Expansion of mobile devices containing digital cameras has made imaging
devices widely available. Embedded module assists mobile devices to automatically
input name cards, white boards and slide presentations. Without being forced to input
by keyboard, users feel more comfortable and work more efficiently. Traffic Signs in
natural scenes carry significant information. Traffic sign recognition and translation
systems aid users to overcome language barriers (Chen, Odobez, & Bourlard, 2004; J.
Zhang & Kasturi, 2008).
In general, text recognition in video consists of four steps: (1) Pre-processing of
input image or video frame that includes the removal of blur, noise or other distortion
present in video. (2) Text detection, finding region in image or video frame that
contains text which results in text with closed bounding box. In other words, it requires
separating text from non-text regions in video. (3) Text binarization is separating
foreground (text pixels) from background (non-text pixels) information in the images

2
by representing text pixels as white pixels and non-text pixels as black pixels. (4) Text
recognition which uses Optical Character Recognizer (OCR) engine for recognition.
Recently (Harris & Stephens, 1988; Neumann & Matas, 2015), methods are proposed
that do not use binarization step in order to avoid loss of information during
binarization for text detection and recognition in video and natural scene images.
However, these methods extract large number of features using gray information and
use classifier for detection and recognition. Since these methods depend on classifier
and large number of training samples, the methods limit their ability to detect and
recognize the particular script. Furthermore, developing separate OCR for video images
is not necessary when OCR of plain document images is available in publicly.
Therefore, the thesis uses binarization to validate the results of text detection methods
as the main aim of the thesis is text detection in video images not recognition.
Among these steps, text detection and binarization are essential, challenging and
have attracted much research attention because the success of recognition system
depends on these steps. The logical flow of the recognition system can be seen in
Figure 1.1. The thesis focuses on preprocessing that deblur the video images with new
algorithm because blur is quite common in case of video images. Then text detection
in video images as it is challenging and the success of recognition depends on success
of text detection step.

3
Text detection and recognition is an old problem for document analysis where
researchers developed many successful methods. One such successful application is
Optical Character Recognizer (OCR) engine (Tesseract). However, this OCR engine
has its own inherent limitations, such as binary image, size of the character image,
shape to be preserved, high contrast image, plain background image etc. As a result,
these approaches may not be appropriate for images like video where one can expect
large variations in contrast, background and foreground. It can be confirmed from
sample images shown in Figure 1.2 (a)-(d) where Figure 1.2 (a) is a scanned document
image which contains plain background and Figure 1.2 (b)-(d) are natural scene and
video images which contains complex background and variations in text. To overcome
the problem of complex background images such as text detection in natural scene
images which generally captured by high resolution camera as shown in Figure 1.2 (b),
several methods are developed (Qiaoyang Ye & Doermann, 2014; Qixiang Ye &
Doermann, 2015). Since images captured by high resolution camera, images contains
Figure 1.1: Steps of automatic text recognition system
Input: Image / video
Pre-processing
Text Detection
Text Recognition
Text Binarization
Output Text
Thesis

4
high contrast text information. Hence, the methods developed for detecting text in
natural scene images work well for high contrast images but the performance of the
method degrades for low contrast text image like video where one can expect both low
and high contrast images as shown in Figure 1.2(c). It is true that there are devices to
capture high resolution videos in today‟s world. However, since storing video requires
huge memory, the trend is to capture low resolution video to save memory. Therefore,
video image may contain both high contrast and low contrast. The main problem with
low contrast images is that it may cause more disconnections and loss of information
compared to high contrast images where complete shape without much disconnections
and loss of information is expected. Besides, usually video comprises two kinds of text:
Caption/superimpose/artificial text which is manually edited text and Scene text which
is naturally existing text as in natural scene images. Since caption text is edited text, it
has horizontal direction, good quality, clarity, and contrast while scene text exists
naturally; it is unpredictable as shown in Figure 1.2 (d). As a result, due to the presence
of two different types text in video, the complexity of the problem increases in contrast
to text detection in natural scene images. Hence, text detection in video requires special
attention of researchers to tackle the issues with video text detection system.
The occurrence of both graphics and scene texts in video increases the complexity of
the problem. Text information born in digital images is considered to be an essential
aspect of overall image understanding. At the same time, text information extractions
from videos and natural scene images have many challenging issues. The challenges lie
in numerous issues, such as alignment of text, variation of the light intensity, font size,
color, and camera angles (Qiaoyang Ye & Doermann, 2014). Challenges in detail will
be discussed in subsequent section. Examples of video images with text information
can be found in Figure 1.2 (c) and (d).

5
Document analysis methods help in detecting text from plain document images, such
as print text image, handwritten text images etc. Similar to that the methods that work
for natural scene images are good for understanding scenes, such as sign board, bill
board, building names, street names etc. In the same way, due to invention of new
digital devices and technology; storing, capturing, and processing large data has
become easier. For example, cloud computing concept for storage, parallel processing
for performing operations, advanced internet and network for communication and
transportation etc. As a result, people prefer to capture video rather than images to grab
more information and details. The text based retrieval system helps in retrieving video
accurately and efficiently according to semantic of video as the meaning of text is close
to content of the video. Therefore, the existing methods that developed for scanned
images and natural images may not be suitable for handling videos of the above
mentioned applications.
(d) Scene text in Video
Figure 1.2: Example of text information present at different sources
(a) Text in document images (b) Text in Natural Scene images
(c) Graphics Text in Video

6
For example, caption text in video can be used for event identification, news reader
identification and news channel understanding while scene text in video can be used for
tracking and surveillance applications. This research is greatly motivated by the vast
range of real time applications to find more robust solutions for detecting text from
scene images and videos. For instance, according to the World Health
Organization(WHO), approximately 286 million visually impaired and 38 million
legally blind people living in the world. Creating personal text-to-speech devices assists
them in understanding road sign boards, product and pharmaceutical labels, grocery
signs, and currency and ATM instructions (Ezaki, Kiyota, Minh, Bulacu, & Schomaker,
2005; Xu Liu, 2008). The University of Maryland (Xu Liu, 2008) and City University
of New York (Yi & Tian, 2012) have developed text recognition prototypes for visually
impaired people. The Kurzweil National Federation of the Blind (KNFB) reader2 runs
on mobile application, which allows reading text from indoor scenes to people who are
visually impaired.
Similarly, in the last few years, advancement of new technologies in the field of
information retrieval has been changing in day to day life of humans (Jung, Kim, &
Jain, 2004; Sharma, Shivakumara, Pal, Blumenstein, & Tan, 2012). It is evident from
the official statistics of the popular video portal, YouTube that almost 60 hours of
videos are uploaded every minute and more than 3 billion videos are watched per day
over YouTube. Therefore, retrieval of the videos on World Wide Web (WWW) has
become a very important and challenging task for researchers (X. Wang, Song, Zhang,
& Xin, 2015).
The complication of applications, environments, flexible image capturing styles and
variations in text contents poses various challenges, which are categorized in Table 1.1
as follows,

7
Table 1.1: Challenges in Text Detection
Category Subcategory
Text content
Variation of font size
Multi-oriented (or) curved text
Variation of font style
Multilingual Text
Graphics Text
Scene Text
Image capturing
Blurring (or) degradation
Perspective distortion
Environment effect
Scene complexity (Complex background)
Illumination effects
Font Size: since video images contains scene text, variations in font and font size if
common as it depends on object embedded in background while caption text in video
image has uniform font and font size at least for that image. It can be seen in Figure 1.3
(a) & (b) where texts of different font type and font size are present.
Multi-oriented (or) curved text: Extracting feature which are invariant to rotation is
hard and it is essential for scene text detection in video. Traversing cured text to fix
closed bounding box around is a real challenge. In addition, single frame may contain
different oriented scene text and horizontal caption text. This adds more complexity to
the problem as shown in Figure 1.3 (b).

8
Multilingual environments: Most of the existing methods developed are targeting
English text but the same methods may not good for multi-lingual text as in Figure 1.3
(b) because the shape of characters varies from one script to another script. Since text
detection is pre-processing step for recognition, the developing method should work for
the text of any scripts. Extracting features which are invariant script for text detection
in video is another challenge.
Blurring and degradation: Due to camera movements or object movements or
defocusing, there are high chances introducing blur, perspective distortion, loss of
information, contrast variation etc. as in Figure 1.3 (c). Therefore, a robust text
detection method should be able to withstand the aforementioned challenges.
Low resolution: In general, cameras used for capturing video have low resolution to
store more videos as mentioned in the above compared to the camera which capture
individual images. This results in low quality images which lead to more
(d) (e) (f)
Figure 1.3: Challenges in detecting text
(a) (b) (c)
9
disconnections, loss of information, loss of shapes, loss of structure etc. Extracting
features which detect text of low contrast pixels from high contrast background pixel is
challenging.
Scene complexity (Complex background): In natural locations, several man-made
objects, such as houses, symbols and paintings appear, that can have similar looks and
structures as text, as shown in Figure 1.2 (d) & (e). It is hard to predict the background
changes and variations. Surrounding scene makes it difficult to discriminate text from
non-text in complex scene environment.
Illumination effects: When capturing images or recording video in the open
environment, irregular lighting is common due to the illumination and the uneven
response of sensory devices, as shown in Figure 1.2 (f). Uneven lighting creates
corrosion of visual features and color distortion, and therefore introduces false
detection, and recognition results.
The work presented in this thesis is greatly motivated by the huge number of
applications and challenges involved in text detection from videos. The scope of this
thesis is limited to develop methods for text detection in video because it is complex
step compared to other intermediate steps of text recognition system. In addition, only
few methods target text detection from videos.
1.2 Objectives
The main objectives of this thesis are as follows,
i. To introduce a new descriptor for text detection in video which is invariant to
rotation, scaling, font, and font size variations.

10
ii. The motion vectors and optical flow properties are utilized for identifying
moving text from videos. In addition to that text motion properties are used to
verify the text region.
iii. To detect blur text in video images a new deblurring method is proposed. This
model improves text detection accuracy in blur environment.
iv. Proposed methods are designed, implemented and validated using publically
acceptable standard database.
v. To evaluate the usefulness and effectiveness of the proposed approaches, it has
been compared with the latest and well known existing methods.
1.3 Contributions
The contributions of this thesis to detect text from videos are as follows:
1. The first contribution of this thesis is to develop a new descriptor called
Histogram Oriented Moments (HOM). Inspired by the well-known descriptor
called Histogram Oriented Gradients (HOG) used for object recognition,
classification in computer vision field, the proposed method proposes a new
descriptor called Histogram Oriented Moments (HOM) that explores moments
for determining orientations unlike HOG uses gradient (Minetto, Thome, Cord,
Leite, & Stolfi, 2013). From experimental analysis it has been noticed that HOM
is more effective when compared to HOG because HOG detects more non-text
components compared to HOM. HOM is invariant to rotation, scaling, font, and
font size variations. The proposed descriptor is able to detect both static text and
dynamic text from video frame, and then utilize the optical flow that is temporal
information to detect the moving text. In this contribution, temporal information
is used only at text blocks level for removing false positives but not as a main
feature for text detection.
11
2. The second contribution of this thesis proposed a method to detect moving text.
The method utilizes temporal information. The proposed method utilizes motion
vectors for identification of moving blocks that have same velocity. For every
block, moments are calculated and k-means clustering algorithm is applied to
identify text blocks. Then gradient direction (Epshtein et al., 2010) of character
candidates are investigated and observed. This results in the special
characteristic that is the many of the gradient direction of outer contour pixels of
character components moves towards the character centroid and few moves
away from the character. This observation inspires us to propose a rule for
finding potential text candidates from the text candidate s. Then region growing
method is used to extract multi-oriented text line, which uses nearest neighbor
criterion for finding neighbor components along text line direction as proposed
in (Palaiahnakote Shivakumara, Dutta, Tan, & Pal, 2014) for text detection in
individual frames. Since the method uses fixed window size for moment
calculation, it is sensitive to text lines of different scripts in video.
3. The third contribution of the thesis examines geometric moments for identifying
moving as well as non-moving text of any orientation and script in video. The
method produces higher accuracy than the method proposed in second
contribution. The deviation for the moments between first frames and successive
temporal frames is estimated to identify the text components and background
components with the help of k-means clustering algorithm. In addition, the
stroke width transform is proposed to determine the automatic window size.
Furthermore, to extract full text lines of arbitrarily-oriented texts, boundary
growing is proposed. For which the nearest neighbor growing in gradient
direction is proposed. This method does not consider blurred frames for text

12
detection as the stroke width based features are sensitive to blur information in
video.
4. Finally, in fourth contribution a new deblurring method is proposed to detect the
blur text present in videos. It is evident from the paper (Kim, Jung, & Kim,
2003) that blur is the main cause to get poor accuracy of the methods because
edge or gradient-based methods are sensitive to blur and distortions. These
issues can be resolved in two ways: (1) developing a method which can
withstand causes given by blur artifact and (2) developing a method for
deblurring the blur image to restore the structure of the components. The
proposed work select the second approach because developing a method which
is invariant to blur is challenging (C. Liu et al., 2005). In using the proposed
deblurring model the text detection and recognition accuracy improved.
In summary, the collective impact of the four contributions will constitute to an
efficient and robust text detection method in video images. In addition, the proposed
work is able to detect both static text as well as moving text without affecting the above
mentioned causes.
1.4 Organization of Thesis
This thesis is organized into seven main chapters as described in the followings:
Chapter 2 reviews the state-of-the-art solutions, methods and strategies which are
relevant to the video text detection.
Chapter 3 presents description on the proposed descriptor called Histogram
Oriented Moments (HOM) for text detection in video. The proposed method uses
optical flow properties to detect moving text. To validate the proposed method over

13
existing methods, experimentation is performed on ICDAR 2013 video dataset and
author‟s video dataset.
Chapter 4 presents detailed explanation on the proposed method that uses motion
vectors with moments to detect moving text. The proposed technique is tested on
both static and moving text videos to evaluate the performance. The results are
compared with the well-known existing methods to show effectiveness of the
proposed method.
Chapter 5 provides details of the proposed method that is capable of detecting text
line of any orientation in multi-script environment. The method is able to
automatically determine the number of frames and window size to be used for text
detection process. Experimental results are represented on standard video, namely,
ICDAR 2013, ICDAR 2015, YVT videos and authors own English and Multi-
lingual video to demonstrate that the proposed method outperforms the existing
methods.
Chapter 6 provides detailed description of the proposed deblurring model to deblur
the video images containing text to improve the text detection accuracy. The
proposed deblurring model is compared with other existing models to demonstrate
its superiority. In addition, to validate the usefulness and the effectiveness of the
proposed model, text detection and recognition experiments are conducted on
blurred images of video databases, namely, ICDAR 2013, ICDAR 2015, YVT and
then standard natural scene image databases, namely, ICDAR 2013, SVT, and
MSER. Text detection and recognition results on both blurred and deblurred
video/images illustrate that the proposed model improves the performance
significantly.

14
Chapter 7 concludes the thesis with some recommendation for the future work.

15
CHAPTER 2: LITERATURE REVIEW
In this chapter, various well-known conventional text detection methods in video
domain will be reviewed. Particularly, the review includes the recent advances in text
detection approaches followed with the survey on deblurring techniques for restoring
the text images/frames.
2.1 Text Detection from Videos
A large number of approaches have been proposed in the literature for detecting text
in video. These can be classified into two broad categories (Y.-K. Wang & Chen, 2006;
Wu, Shivakumara, Lu, & Tan, 2015; J. Xu, Shivakumara, Lu, Tan, & Uchida, 2016),
(1) the methods which do not use temporal information and (2) the methods which use
temporal information. The methods fall on category-1 generally use first frame or key
frame of video for text detection. These methods either assume key frames containing
text is available or use existing methods for extracting key frames. The methods that
fall under category-2 prefer to use temporal information for enhancing text of low
resolution or reducing false positives but not for tracking text or for the detection of
moving text. Generally, these approaches combine several frames into single enhanced
frame to produce small details of texts and for eliminating false positives. The big
query lies in determining the exact number of frames for the enhancement process.
2.1.1 Methods without Temporal Information
Methods that do not utilize temporal information can further be classified into three
classes, namely, connected component (CC) based methods, texture based and
edge/gradient based methods (J. Zhang & Kasturi, 2014).
16
2.1.1.1 Connected Component based methods
Bottom-up approach has been used by connected component based methods by
merging small components into successively larger components till all regions are
covered in the image (Weilin Huang, Lin, Yang, & Wang, 2013; JIANG et al., 2006; Z.
Liu & Sarkar, 2008; Lu & Tan, 2006). A geometrical analysis is frequently desired in
later phases to find text components and assemble them to localize text regions. CC-
based methods straightaway classify candidate text components by color clustering or
edge detection. The non-text components are then removed with heuristic rules or
classifiers. Since the amount of segmented candidate components is comparatively
small, CC-based methods consumes less processing time and found text components
can be directly used for recognition. However, CC-based methods cannot detect text
correctly without prior knowledge of text scale and position. Moreover, designing
reliable and fast connected component analyzers is hard since there are many non-text
components which are easily confused with texts when analyzed individually. Also,
CC-based methods exploit characteristics of text components for text detection in video
because text components properties help us to separate background from the text
information. For example, several methods are discussed in the survey by Jung et al.
(Jung et al., 2004).
In the paper proposed by Zhang et al. (H. Zhang, Liu, Yang, Ding, & Wang, 2011),
„text‟ or „non-text‟ labeled by conditional random field to give connected components.
This paper is extended work from the algorithm proposed in (Y.-F. Pan, Hou, & Liu,
2011) that also uses a Conditional Random Field (CRF) model. And backgrounds that
possess same characteristics as text are recognized as text characters with a low
confidence. Then the authors in this paper proposed a two-step iterative CRF algorithm
with a Belief Propagation inference stage and an OCR filtering step. Two types of
neighborhood association graph are utilized in the respective iterations for extracting

17
multiple text lines. The first CRF iteration targets at finding certain text components,
especially in multiple text lines, and sending uncertain components to the second
iteration. The second iteration gives second chance for the uncertain components and
filter false alarm components with the assistance of OCR. The proposed method aims at
extracting text lines, instead of separated words as the ground truth of ICDAR2005
competition, which contributes to a reduction of precision and recall rate.
Neumann et al. (Sun, Huo, Jia, & Chen, 2015) proposed character stroke area
estimation for detecting text. The proposed feature is invariant to scaling and rotation.
The initial hypothesis is drawn from MSER. Followed by, determining the stroke area
ratio, aspect ratio, compactness, convex hull area ratio and holes area ratio to define the
text regions. The methods require more text information like text line for achieving
good results. However, video images sometimes contain words with few characters and
it is common that limits the performance of this method.
Wang et al. (Kongqiao Wang & Kangas, 2003) proposed a connected component
based method to find characters in scene images. The method also distinct color images
into homogeneous color layers. Then each connected component is analyzed in color
layers using block adjacency graph similarity. For characters detection, an aligning and
analysis scheme is introduced by author to locate all the potential characters candidates
in all color layers. Huang et al. (Weilin Huang et al., 2013) presented a Stroke Feature
Transform, new operator based on Stroke Width Transform. In direction to resolve the
disparity problem of edge points in original Stroke Width Transform, SFT proposed
color consistency and constrains relations of local edge points, resulting better
component extraction results. Although the method works well in comparison with
existing method but it is limited to horizontal texts.

18
Wang and Kangas (H. Wang & Kangas, 2001) introduced a method based on basic
localization on connected component analysis. CC‟s are extracted from each
decomposed layer (weak color space, gray-scale space, and hue space). Block
candidates are checked by alignment analysis. Character segmentation by (Priority
adaptive segmentation) algorithm extracts characters in the final composed image. This
algorithm is not so robust to multi-scale size, variant illumination, over lighting and
low contrast.
Neumann and Matas (Jacob & Thomas, 2015) detected character components as
Extremal Regions (ER) which is selected in a two stage classification. First, operating
on a coarse Gaussian scale space pyramid and second, on multiple image projections.
The performance of the method degrades because ER is sensitive to disconnections.
Wang and Kangas (H. Wang, 2001) described a CC-based method for automatic text
detection and segmentation from natural scene images. To deal with the complexity of
color background, a multi-group decomposition system is used. CC extraction is
implemented by means of block adjacency graph algorithm after noise removal and run
length smearing operation. Some heuristic features and priority adaptive segmentation
of characters are proposed in block candidate verification and gray-scale-based
recognition.
Chen et al. (Chen & Odobez, 2005) proposed a sequential Monte Carlo based
method for text detection in video. This method uses Otsu thresholds to segment initial
text regions and then it uses distribution of pixels of each segmented region for
classification of text pixels from the background. (Y. Liu, Song, Zhang, & Meng, 2013)
proposed a method for multi-oriented Chinese text extraction in video. This method
utilizes the combination of wavelet and color domains to obtain text candidates for the

19
given video image. For every text candidate, the method extracts features at component
level for classifying component as text or non-text.
In summary, it is observed from the discussion on connected component based
methods that these methods focus on caption or superimposed text but not scene text
because caption text has better quality and contrast compared to its background.
Therefore, these methods expect the shape to be preserved as in document analysis and
use uniform color features and shape features. These methods are sensitive to complex
background because components in background may produce text like features. In
addition, these methods are limited to high contrast text but not to scene texts which
can have variation in contrasts. To overcome the problems associated with connected
component based methods, texture based methods have been proposed for text
detection in video which considers appearance of a text pattern as a special texture.
2.1.1.2 Texture based methods
To alleviate the problems of connected based methods, texture-based methods are
proposed. These methods consider appearance of text as special texture property for
detecting text in video. These methods use texture analysis techniques such as Wavelet
decomposition, Gaussian filtering, Discrete Cosine Transform, Local Binary Pattern,
and Fourier transform. Usually, features are extracted over a certain region and a
classifier (trained using machine learning techniques or by heuristics) is applied to
identify the existence of text because text regions have distinct textural properties from
non-text ones, these methods can detect and localize texts accurately even when images
are noisy. However, it has relatively slower speed and the performance of method is
sensitive to text alignment orientation.
Zhou et al. (Palaiahnakote Shivakumara, Phan, & Tan, 2009) proposed a text
detection method for multilingual text, which emphases on finding all the text regions
20
in natural scene irrespective of their language variety. According to guidelines of
writing system, three different texture features are nominated to describe the
multilingual text: local binary pattern, mean of gradients and HOG. Finally, cascade
Ada Boost classifier is adopted to combine the influence of different features to decide
the text regions. This work is similar to the methods illustrated in paper (Hanif &
Prevost, 2009; Hanif, Prevost, & Negri, 2008).
Pan et al. (Y.-F. Pan, Liu, & Hou, 2010) proposed a new method for fast text
detection in natural scene images by combining learning-based region finding and
verification using a coarse-to-fine strategy. Unlike methods that use learning-based
classification for only filtering or verification, a boosted classifier and a polynomial
classifier are used for coarse region filtering and fine verification respectively with
selecting discriminative features. For the verification step, the method evaluates five
widely used features: HOG, local binary pattern, discrete cosine transform, Gabor, and
wavelets. A weak classifier selection based on computational complexity and boosting
framework integrating feature is proposed to construct efficiently detecting text in the
paper proposed by Shehzad Muhammad et al. (Hanif & Prevost, 2009). The proposed
system that builds a larger set of features by combining small set of heterogeneous
features. A neural network based localizer learns necessary rules for detection. Three
different types of features HoG, Standard Deviation and Mean Difference Feature are
extracted from a text segmentation block. Ji et al. (Ji et al., 2008) uses local Haar
Binary Pattern for robust text characterization. The method especially addressed the
issues of text-background contrasts and variant illumination. More specifically,
threshold restricted local binary pattern is extracted from high-frequency coefficients of
pyramid Haar wavelet, calculated at different resolution to signify multi-scale texture
information. Local Haar Binary Pattern can preserve uniform inconsistent text-
background contrasts while filtering gradual illumination variations. Presumed that

21
occurrence between certain directions were notable, directional correlation analysis was
used to locate candidate text regions.
Saoi et al. (Saoi, Goto, & Kobayashi, 2005) proposed a novel unsupervised
clustering method for the classification of multi-channel wavelet features to deal with
color images, as the proposed algorithm in required the ability of discriminating color
differences. The key contributions in the paper consist of the following steps:
decomposing color image into R, G, B channel images and making 2D Wavelet
Transform of every decomposed image, then utilizing the unsupervised pixel block
classification with the k-means algorithm in combined feature vector space and
integrating results of three channels by logical OR.
Angadi and Kodabagi (Angadi & Kodabagi, 2009) introduces a novel texture based
text detection method. This uses a high pass filtering in the DCT domain to remove
most of the background. Then the homogeneity and contrast based feature vectors are
calculated to detect text area. Though the algorithm is robust and achieves good
detection rate on a variety of 100 low resolution natural scene images, this paper
primarily focused on the localization of rough estimate text blocks.
Gllavata et al. (Gllavata, Ewerth, & Freisleben, 2004) proposed a method based on
unsupervised classification of high frequency wavelet coefficients for accurate text
detection in video frames. The method used a sliding window to move over the
transformed wavelet images and characterized the areas with the distribution of high-
frequency wavelet coefficients. Then classifies the predefined regions into three parts
by k-means algorithm: text, simple and complex backgrounds.
Shivakumara et al. (Palaiahnakote Shivakumara et al., 2010) proposed a method
based on the combination of wavelet and color features for detecting text candidates

22
with the help of k-means clustering. Boundary growing has been proposed to extract
text lines of different orientations in video. Shivakumara et al. (P. Shivakumara et al.,
2010) proposed a method which combines Fourier transform and color spaces for text
detection in video. Though the methods work well for complex background of the
video, the methods require more number of computations because of expensive
transformation is involved in text detection process. However, the primary focus on
these methods is on horizontal text detection in video but not arbitrarily-oriented text in
video. Recently, Liang et al. (Guozhu, Shivakumara, Tong, & Chew Lim, 2015)
proposed a method based on multi-spectral fusion for arbitrarily-oriented scene text
detection in video images. The performance of the method degrades for the multi-script
images. In addition, the method does not utilize the temporal information for text
detection though it is available in video.
Wang & Chen (Y.-K. Wang & Chen, 2006) have proposed spatial-temporal wavelet
transform to enhance the video frames. For the enhanced frame, this method extracts a
set of statistical features by performing sliding window over an enhanced image. Then
a classifier was used for classifying the text and non-text pixels. (Anthimopoulos,
Gatos, & Pratikakis, 2013) proposed a method for artificial and scene text detection in
images and videos using a Random forest classifier and a multi-level adaptive color
edge local binary pattern. The multi-level adaptive color edge local binary pattern has
been used to study the spatial distribution of color edges in multiple adaptive levels of
contrasts. In continuation, gradient based algorithm has been applied to achieve text
detection in video/images.
In summary, it is noted from the review of texture based methods that most of the
methods use a large number of features and classifier with a large number of training
samples. Therefore, these methods are said to be computationally expensive though the

23
methods work well for complex background in contrast to connected component based
methods. In addition, the methods scope is limited to be used with specific scripts
because of constraints of classifiers and training samples. To achieve better efficiency
and accuracy for the text detection in video, the methods based on edge and gradient
information are developed.
2.1.1.3 Edge/Gradient Feature based methods
It is fact that characters in text are formed with the combination of horizontal,
vertical and diagonal edges. Identifying the presence of such prominent edge
information is the main basis for developing edge/gradient based methods. As a result,
one can expect high gradient values for text information and low gradient values for
non-text information due to high contrast at edges. Further, the methods explore edge
and gradient information for text detection based on the fact that dense pixels with
unique spatial relationship between edge where text is presents.
For example, Liu et al. (C. Liu et al., 2005) extracts a set of statistical features from
the edge images of different directions. Then k-means clustering has been used for
classifying text and non-text pixels. Geometrical properties have been used for
grouping text pixels and to extract text line in video and images. Shivakumara et al
(Palaiahnakote Shivakumara et al., 2012) proposed multi-oriented video scene text
detection in video using Bayesian classifier and boundary growing. This method uses
the combination of Sobel and Laplacian operation for enhancing the text information.
Then the Bayesian classifier has been used for classifying text and non-text pixels
based on generating three probability matrices. Similarly, the (gradient vector flow) and
grouping based method are proposed by (Palaiahnakote Shivakumara, Yuan, Zhao, Lu,
& Tan, 2015) for arbitrary orientation text detection in video. This method addresses
the complex arbitrary orientation problem by combining GVF information and

24
grouping strategies. Though it solves complex problem, it does utilize the temporal
information, rather rely on individual frames of video. This limitation makes the
methods to produce inconsistent results for the different data and applications.
Cho et al. (X. C. Yin, Pei, Zhang, & Hao, 2015) exploits the similarity between
edges of image with text edges using canny edge detector. The proposed method does
non-maximum suppression, double threshold classification, and text tracking to localize
the text region. Although the method is simple and effective but it is limited to only
scene text. A new pixel intensity based stroke width detector is proposed in (Hu, Wang,
& Lu, 2015). The text is detected using Stroke-specific keypoints which are efficiently
detected by local thresholding guided by keypoint properties.
Wei and Lin (Wei & Lin, 2012) proposed a robust video text detection method using
Support Vector Machine (SVM). This approach generates two downsized images for
the input image and then performs gradient difference for the three images including
the input image which results in three gradient difference images. K-means clustering is
applied on the difference images to separate text cluster from non-text. Finally, the
SVM classifier has been used for classifying true text pixels from the text clusters.
Shivakumara et al.(Palaiahnakote Shivakumara et al., 2009) derive rules using the
different edge maps of the input image. The rules have been used for segmenting text
region and then the same rules are modified for extracting text information from the
video images. (Lienhart & Wernicke, 2002) have proposed a method based on the
combination of gradient and RGB color space. This results in different directions of
edge maps for the input image. Then neural network classifier is applied for separating
text and non-text pixels. Further, refinement has been proposed for full text line
extraction.

25
Sun et al. (Qixiang Ye, Jiao, Huang, & Yu, 2007) introduced a method to extract
board text under natural scene. The method is constructed upon color image filtering
procedures, where rims are first obtained, followed by an analysis on relationships
among characters and inherent features. The approach was presented to work
efficiently on board text under natural scenes.
(Xiaoqing Liu & Samarabandu, 2006; Ou, Zhu, & Liu, 2004) proposed an edge-
based multi- scale text detection algorithm, which can automatically detect and locate
text in complex background images. Edge density, strength and the variance were used
as the three distinguishing characteristics of text embedded in images, which can be
used as main features for detection. It is strong and gives good results with respect to
the orientation, font style, size, color, and orientation of text and can be used in many
application fields, such as vehicle license detection and recognition, mobile robot
navigation, document retrieving, page segmentation, and object identification.
(CUI, YANG, & LIANG, 2006) proposed a system that first utilized the Roberts
operator to compute edges, which uses a self-adaptive threshold to process binary
image, and utilizes erosion operator in mathematical morphological to eliminate
nonlinear influence and outstand linear feature. Then, the method proposed focusing
function based projection, finding text region required and completing text extraction.
(Ezaki, Bulacu, & Schomaker, 2004; Jain & Yu, 1998) detected text location in
complex background images. The method proposed an effective edge-based algorithm
for text detection in natural scene images. First it performed pyramid decomposition,
then color-based edge detection and binarization is performed. Later the mathematical
morphology method, the text of the color image is extracted by the restriction of text
regions at last. Carried experiment on a large number of images selected from the
26
ICDAR2003 database (Lucas et al., 2003), this algorithm shows its robustness and
accuracy against variations in text color and font size.
Zhang and Kasturi (J. Zhang & Kasturi, 2014) proposed a text detection method
based on character and link energies. The method explores stroke width distance to
define link energies between the character components on the basis of stroke width
distance of the character components is generally almost same. Then a maximum
spanning tree is used for text line extraction from both images and videos.
In summary, it can be inferred from the literature review on edge and gradient based
methods that these methods are fast compared to texture based methods, but these are
sensitive to background because edge and gradient are not robust to complex
background variations. This results in more false positives. Therefore, few hybrid
methods also developed that usually combines the benefits of connected component
based, texture based methods or edge based methods. Hybrid methods (Y.-F. Pan et al.,
2011; Yangxing & IKENAGA, 2006) are a combination of texture based methods and
component based methods, which make use of the advantages of these two types of
methods. In the method proposed by Liu et al. (Yangxing & IKENAGA, 2006), edge
pixels of all possible text regions were extracted using an elaborate edge detection
strategy, and the gradient and geometrical properties of region contours are verified to
generate candidate text regions, followed by a texture analysis procedure to distinguish
true text regions from non-text regions.
Pan et al. (Y.-F. Pan et al., 2011) presented a hybrid method for detecting and
localizing texts in natural scene images by a scale-adaptive segmentation algorithm
designed for stroke candidate‟s extraction and a CRF model with pair-wise weight by
local line fitting designed for stroke verification. This algorithm achieved competitive
results in the ICDAR 2005 competition.

27
Overall, in conclusion the methods that do not utilize the temporal information can
be summarized as in Table 2.1.
Table 2.1: Summary of the methods that does not utilize Temporal Information
Methods Advantages Limitations
Connected
component based
methods
Good for plain
background and high
contrast images
Require the characteristics of
character components
Focused on only caption text
Not robust to multi-scale size,
variant illumination, over lighting
and low contrast
Texture based
methods
Good for complex
background images
Sensitive to font type or font size
and are computationally expensive
Performance get affected by blur
artifacts
Edge/Gradient
Feature based
methods
Fast and effective
Produce more false positives for
complex background images
Inconsistent results for the different
data and applications
More false detection is possible
However, despite temporal information is available for video, these methods do not
utilize the temporal information for text detection in video.
2.1.2 Methods with Temporal Information
This section provides literature survey on the methods which uses temporal
information for text detection like proposed methods.
Li et al (H. Li, Doermann, & Kia, 2000) proposed method for video text tracking
based on wavelet and moments features. This method uses advantage of wavelet
decomposition, spatial information provided by the moments with neural network
classifier for identifying text candidates. Text block shape features are used to track the

28
text in temporal frames. Huang et al. (Weihua Huang, Shivakumara, & Tan, 2008)
proposed a method for scrolling text detection in video using temporal frames. This
method uses motion vector estimation for detecting text. However, this method is
limited to only scrolling text but not arbitrary orientation texts. Zhou et al. (J. Zhou,
Xu, Xiao, Dai, & Si, 2007) exploit edge information and geometrical constraints to
form a coarse-to-fine methodology to define text regions. Then candidate regions are
labeled as connected components by morphological close operation and filtered by
geometrical constraints. Based on the temporal redundancy, the text authentication and
enhancement are implemented over multiple frames by using the text polarity
consistency, overlapping text area and the stability of character stroke. However, the
method is unable to deal with dynamic text objects. Mi et al. (Congjie et al., 2005)
proposed a text extraction approach based on multiple frames. The edge features are
explored with similarity measure for identifying text candidates. Wang and Chen‟s
method (Y.-K. Wang & Chen, 2006) uses spatio-temporal wavelet transform to extract
text objects in video documents. In the edge detection stage, a three-dimensional
wavelet transform with one scaling function and seven wavelet functions is applied on
a sequence of video frames. Then in the classification stage, the texture features, such
as grey-level co-occurrence matrix, maximum probability, energy, and entropy,
calculated from salience maps are input to a Bayes classifier to obtain final text regions.
Huang (X. Huang, 2011) detected video scene text based on the video temporal
redundancy. Video scene texts in consecutive frames have arbitrary motion due to
camera or object movement. Therefore, method performs the motion detection in 30
consecutive frames to synthesize motion image. Further video scene text detection is
implemented in single frame to retrieve candidate text regions. Finally, the synthesized
motion image is used to filter out candidate text regions and only keep the regions
which have motion occurrence as final scene text. Zhao et al (Z. Xu et al., 2011)

29
proposed an approach for text detection using corners in video. This method proposes
to use dense corners for identifying text candidates. From the corners, the method
forms region of text using morphological operations. Then the method extracts features,
such as area, aspect ratio, orientation etc. for the text regions to eliminate false text
regions. Finally, optical flow has been used for moving text detection. Liu & Wang
(Xiaoqian Liu & Wang, 2012) proposed a method for video caption text detection using
stroke like edges and spatio-temporal information. The color histogram is used for
segmenting text information. Li et al (L. Li, Li, Song, & Wang, 2010) proposed a
method for video text detection using multiple frames integration. This method uses
edge information to extract text candidates. The morphological operation and heuristic
rules are proposed to extract final text information from video.
Bouaziz et al. (Bouaziz, Zlitni, & Mahdi, 2008) proposed a similarity criterion to
find text appearance based on frame differences. However, the similarity criterion
requires a threshold to identify the sudden difference. Therefore, it may not work for
different types of videos. In addition, the focus of the method is only on graphics text
detection but not scene text detection. Tsai et al. (Tsai, Chen, & Fang, 2009) proposed a
method for video text detection using edge and gradient information. Though the
method uses temporal frames, its performance depend on edge images and the number
of temporal frames.
Wu et al (Wu et al., 2015) proposed a new technique for multi-oriented scene text
line detection and tracking in video. The method explores gradient directional
symmetry and spatial proximity between the text components for identifying text
candidates. To handle the multi-font and multi-sized text, the method proposed multi-
scale integration by pyramid structure, which helps to extract full text lines. The text

30
lines are tracked by matching sub-graphs of text components. The ability of the method
is not tested on arbitrarily-oriented text and multi-script text lines in video.
In summary, though the methods used temporal information for text detection in
video, the features used in the methods are sensitive to blur and distortion. It is true that
blur occurs due to text movements or camera movements which is quite common in
videos. Besides, most of the methods fix the constant number of temporal frames out of
25-30 frames per second. This constraint causes poor accuracy.
2.2 Deblurring Text images
Although the reviewed approaches achieved promising results compared to high-
resolution scene text in uncontrolled environments remains very challenging. Presence
of blur in video is one such effect that may occur in video during the process of
capturing due to motion of text object or the motion of camera handler. In this section,
some of the existing deconvolution models, particularly deblurring methods on text
images will be reviewed.
When literature on blind deconvolution is reviewed, it is observed that most of the
models proposed are for general image deblurring but not for images containing text in
video or natural scene images. As a result, one can see only a few deblurring models
related to text applications. For instance, Pan et al. (J. Pan et al., 2014) propose a
simple yet effective L0-regularized prior based on intensity and gradient for text image
deblurring. However, L0-norms are an np-hard problem which makes it expensive in
terms of time complexity, and hence restricts its use in video applications. Cho et at
(Cho et al., 2012) takes into account the specific properties of text images. This method
extends the commonly used optimization framework for image deblurring to allow
domain specific properties to be incorporated in the optimization process. Wang et al.
(Y. Wang et al., 2008) proposed an alternating minimization algorithm for recovering

31
images from blur and noise observations with total variation (TV) regularization which
is good for edge preservation. However, one paper for scene text deblurring using text-
specific multi-scale dictionaries by Cao et al (Cho et al., 2012). The objective of this
method is to improve the visual quality of blurred images by applying a deblurring
method. The method explores the combination of multi-scale dictionaries and an
adaptive version of non-uniform deblurring method. The performance of the method
depends on the size of the dictionaries and kernel estimation for different situations.
There is a need for developing a new deblurring model, specifically for text in video
and natural scene images.
2.3 Summary
The methods which are proposed based on connected component analysis; texture;
edge/gradient and methods that use temporal information are reviewed. Based on
analysis of existing methods, conclusion can be made that the followings are still major
issues without perfect solution for text detection in video.
(1) Most of the current methods focus on horizontal caption texts for detection in
video because the methods use advantage of characteristic of caption text, such as
uniform color, high contrast, and uniform size. However, these constraints are not
necessarily true for scene text in complex backgrounds. There is scope for developing a
method which can detect both caption and scene text.
(2) The existing methods utilize the temporal frame information for enhancing text
detection performance that is for false removal but not for detecting moving text in
videos. In other words, the existing methods do not use the fact that text in video
usually moves unidirectional with almost constant velocity. Therefore, the scope of the
method is to detect static text rather than moving text in video.

32
(3) Though the existing methods use multiple frames for text detection but not much
attention has been given for automatically determining the number of temporal frames
used. The methods generally assume the number of frames to be processed based on
experimental results. The threshold fixed based on experiments may not work well for
different dataset and situations.
(4) Since most of the existing methods use classifiers and large number of training
samples for classification of text and non-text at pixels or component level or text line
level. Therefore, the methods lose the ability of multi-script text detection in video.
This limits generic ability.
The above demerits of existing methods is motivation to propose new methods,
which are capable of detecting moving and static text as well as multi-oriented and
multi-lingual text from videos accurately and efficiently, irrespective of text types,
orientations and scripts.

33
CHAPTER 3: A NEW HISTOGRAM ORIENTED MOMENTS DESCRIPTOR
FOR MOVING TEXT DETECTION
From the previous chapter where detailed literature for detecting text from videos is
reviewed, one can conclude that very few methods are designed for detecting graphics
and scene text together and which is able to utilize the temporal information for finding
the moving text. In this work, a new descriptor called Histogram Oriented Moments
(HOM) for text detection in video is introduced, which is invariant to rotation, scaling,
font, font size variations.
3.1 Introduction
This work proposes a new descriptor called Histogram Oriented Moments (HOM)
for both static and moving text detection in video. As the proposed method is inspired
by the work presented in (Minetto et al., 2013; Tsai et al., 2009; Wolf & Jolion, 2006)
where the new descriptors were developed by referring a Histogram Oriented Gradients
(HOG) for text detection and Histogram of Optical Flow for detecting human action,
this method introduces a new descriptor based on moments for text detection in video.
The main reason to choose moments for deriving this descriptor is that moments
consider both spatial information as well as pixel values for estimating orientation in
contrast to HOG which uses only gradient information for text detection. In this way,
the HOM descriptor is different from the existing descriptors. The HOM finds
dominant orientation for each overlapped block by performing histogram operation on
moment orientation of each sliding window. The proposed method derives a new
hypothesis based on dominant orientations as the numbers of orientations which move
towards centroid of the connected component are larger than the number of orientations
which move away from the centroid of the connected component to classify text and
non-text components. The components which satisfy the above hypothesis are

34
considered as text candidates while others are considered non-text candidates.
Geometrical characteristics of text candidates are proposed for eliminating false text
candidates. The proposed method explores optical flow properties of the text for
detecting moving text.
3.2 Proposed Method
It is true that moments have been used for text detection successfully in literature
(H. Li et al., 2000) because the moments have ability to capture unique features such as
spatial information and structure of the components, which can distinguish text from
non-text from the complex background of video. With this notion, the proposed method
uses the second order moments for deriving new descriptor to estimate orientations
which represents group of text pixels as HOG uses gradient orientations. The flow of
proposed procedure can be seen in Figure 3.1.
Video Static Frame HOM Feature Description
Text
candidates
Optical
Flow
Motion
Feature
Moving
Text
Validation
Figure 3.1: Steps of the proposed method

35
3.2.1 HOM for Text Candidates Selection
For a given video, the proposed method select frame containing text as shown in
Figure 3.2(a) where one can see different oriented text lines. The proposed method
divides the whole frame into overlapped equal sized sub-blocks of size 8 × 8. For each
overlapped block (size 8 × 8) in Figure 3.2(a) method determine second order moments
as defined in equations (3.1)-(3.7). Figure 3.2(b) shows the moment image of input
frame computed through second order moments. Figure 3.2(c) represents the
orientations for highlighted block in Figure 3.2(b). Then the proposed method obtains
dominant orientation for each block by performing histogram operation. That is, divide
the entire range of orientation values into a series of orientation intervals—and then
count how many values fall into each orientation interval. Histogram for the selected
block is shown in Figure 3.2(d). The orientation which represent highest peak is
considered as dominant orientation as shown in Figure 3.2(e) where the orientation
represent the whole block. The final dominant orientations for all the blocks can be
seen in Figure 3.2(f) where it is noted that all dominant orientations are representing
edge pixels of the objects for the input frame in Figure 3.2(a). This is the advantage of
the orientations given by moments as it gives high response for text pixels where there
is a high contrast and low response for non-text pixels where there is a low contrast.
This high response near text pixels will reflect as higher attraction of HOM orientations
towards those components in the image. Based on this observation, a new hypothesis
can be drawn that if the orientations of the component which move towards component
(inside count) are larger than the orientations of the component which move away from
the component (outside count) then the component is considered as text component else
it is non-text component as shown in Figure 3.3. The proposed method eliminates non-
text components using this hypothesis. The effect can be seen in Figure 3.3(e) where
most of the non-text components are removed. This output is called text candidates.

36
))/(2arctan(*2/1)( '02
'20
'11 f
(3.1)
Here pqis central moment of the image f(x, y) drawn from,
x y
qp
pq yxfyyxx ),()()(
(3.2)
In order to reduce the computational complexity, raw moments are used to generate
2nd
order central moment rather than using the above equation. Required second order
central moment can be directly drawn by:
2
0020
'
20 / xMM (3.3)
2
0002
'
02 / yMM (3.4)
yxMM ./ 0011
'
00 (3.5)
Where ),( yx are centroids drawn from following:
0010 / MMx , 0001 / MMy
(3.6)
Image raw moments can be define as the weighted average (moment) of the image
pixels' intensities
N
x
N
y
jiij yxfyxM
1 1
),(
(3.7)

37
(a) Frame (b) Moment Image (c) Moment Directions of
selected block
(d) Histogram of all pixels in a block (e) Resultant HOM direction
(f) HOM Directions
Figure 3.2: Orientations of the HOM descriptor

38
By looking at process and steps of the orientation estimation by moments, one can
found that there is a similarity between Histogram Oriented Gradients (HOG) and
HOM. This concept has been used for text detection in the past. Therefore, to show the
performance of HOM over HOG, proposed method compile HOG with the same steps
that of HOM. Figure 3.4 shows orientations given by HOG. As HOG involves gradient
for orientation estimation for each pixel using sliding window over the image to extract
features, the proposed HOM uses moments for orientation estimation over the image
(b) HOM directions for Non-text (c) HOM directions for Text
(d) Inside and outside count for text and non-text (e) Text Candidates
Figure 3.3: Text candidates selected by HOM descriptor
(a) HOM

39
using sliding window to find dominant direction of text components. Therefore, in
order to show effectiveness of the proposed HOM, the HOM is compared with HOG as
shown in Figure 3.4 and Figure 3.5. For example, it is noticed from Figure 3.4 and
Figure 3.5 that HOM is more effective compared to HOG because HOG gives more
non-text components compared to HOM. This observation is found based on many
video frames. The main reason of that is HOG considers only gradient directions while
the HOM considers both spatial, as well as pixel values for finding orientations.
(d) Histogram of all pixels in a block (e) Resultant HOG direction
(f) HOG Directions for all blocks
Figure 3.4: Orientations of HOG descriptor
(a) Video Frame (b) Blocks divided (c) Gradient directions of
on gradient selected block

40
3.2.2 Text Candidates Verification
Figure 3.3(e) shows that the HOM alone is not sufficient to remove false text
candidates due to variation in background and resolution. The proposed method
proposes two features, based on structure of text candidates that are dense corners and
edge density.
(d) Inside and outside count for (e) Text candidate
respective non-text (b) and text (c) block
Figure 3.5: Effect of HOG descript for text candidate selection
(b) HOG directions for Non-text (c) HOG Directions for Text
(a) HOG Directions

41
Dense corners provides cue for the text information in the images. Therefore, the
proposed method explores corners for detecting text candidates in the images. A corner
can be defined as the intersection of two edges or a point where there are two dominant
and different edge directions in a local neighborhood of the point. The proposed
method uses Harris corner detector (Harris & Stephens, 1988) to extract the corner
points. The Harris method uses algorithm that depend on the eigenvalues of the
summation of the squared difference matrix (SSD). The eigenvalues of an SSD matrix
represent the differences between the surroundings of a pixel and the surroundings of
its neighbors. The larger difference between the surroundings of a pixel and those of its
neighbors, the larger the eigenvalues, which results in corners.
Similar to corners, edges are edge density is used here to remove small non-text
components. For a given window, an edge density feature measures the average edge
magnitude in a sub-region of the window. Let W(u,v) be a window and e(u,v) be the
edge magnitude of the window. For a sub-region r with the left-top corner at (u1, v1)
and the right-bottom corner at (u2, v2), the edge density feature is defined as
2
1
2
1
),(1
u
uu
v
vvr
vuea
f
(3.8)
where rais the region area,
).1)(1( 1212 vvuuar A block is rejected if the
edge density is smaller than the fixed threshold. It is known fact that dense corner and
edge density are high for the text candidates compared to non-text candidates. The
effect can be seen in Figure 3.6(c) where almost all false text candidates are removed.
The final text detection results are shown in Figure 3.6(d) where one can see bounding
boxes for the text lines. The thresholds for the above rules are determined based on
experimental study.

42
3.2.3 Moving Text Detection
This section focuses on detecting moving text using temporal frames. The proposed
method proposes optical flow and its properties to determine moving text. It is valid
that text in video moves with same velocity and single direction especially, graphics
text. This is the key property of moving text which is exploited it this work. As this
work is inspired by the work presented in (Bruhn, Weickert, & Schnörr, 2005) where
optical flow is used globally, as well as locally for tracking objects of arbitrary
movements, the proposed method uses the same concept for tracking text in video in
this work. The proposed method uses optical flow globally and locally to overcome the
problem of moving background objects. Global optical flow helps in differentiating
moving background objects from the graphics text while local optical flow assists in
estimating constant velocity and direction of the texts. The proposed method use the
combined global-local spatial approach presented in (Bruhn et al., 2005), which tries to
combine the local Lucas-Kanade method and global Horn-Schunk method advantages.
Let us first reformulate the previous approaches as them. Here, (u,v) are displacement
field called optical flow, using the notions:
Tvuw )1,,(: (3.9)
(a) (b) (c) (d)
Figure 3.6: (a) Corners are detected for the text candidates, (b) and (c)
represents outputs when low dense corners and low edge density edges are
rejected (d) Final text detection result are shown

43
222 ||||:|| vuw (3.10)
T
tyx ffff ),,(:3 (3.11)
)(*:)( 333
T
pp ffKfJ (3.12)
Lucas-Kanade method minimizes the quadratic form,
wfJwwE p
T
LK )()( 3 (3.13)
While Horn-Schunk technique minimizes the functional,
dxdywwfJwwEHS ))(_()(230
(3.14)
This terminology suggests a natural way to extend the Horn-Schunk functional to
desired CLG functional. The proposed method simply replaces the matrix )( 30 fJ
with some integration scale 0 . Thus, it minimize the functional,
dxdywwfJwwE p
T
CLG )||)(()( 2
3
(3.15)
Its minimizing flow field (u,v) satisfies the Euler-Lagrange equations. This
replacement is hardly more complicated than the original Horn-Schunk Equations.
More detailed about this algorithm can be found in (Bruhn et al., 2005). The proposed
method extracts the optical flow feature for every consecutive frame, in order to
preserve the spatial-temporal information. Sample of optical flow computed over
frames are shown in Figure 3.7.

44
The combination of motion features with the detected text candidates by the
previous section is used to detect moving text. Since the previous step gives text
candidates for every frame, the method uses motion feature corresponding to text
candidates to identify the moving texts as shown in Figure 3.8.
Figure 3.7: Optical flow vectors marked over video frames
.
.
.

45
The velocity and direction feature are calculated as follows: Let (u, v) be the optical
flow vectors, then direction )(
and velocity )(vel
can be defined as:
)/(tan 1 uv (3.8)
22 vuvel (3.9)
When velocity and direction changes drastically, the proposed method stops process
of estimating motion with optical flow method. According to the experiments, for
almost all the cases, the method uses less than 10 frames for moving text detection.
Figure 3.9 illustrates one sample example for moving text detection.
(a) (b) (c)
Figure 3.8: (a) Detected Text region multiplied with (b) optical flow
intensity fields can classifies the moving text region in (c)
Figure 3.9: (a) Input frame (b)-(d) shows intermediate results of moving
text detection
(a) (b) (c) (d)

46
3.3 Experimental Results and Discussion
All experiment are executed over the system Windows XP Intel core i5 with 6GB
RAM. To evaluate the effectiveness of the proposed descriptor, comparison has been
made with latest and well known existing methods: Liu et al. (C. Liu et al., 2005),
Shivakumara et al. (Palaiahnakote Shivakumara et al., 2010) and Zhao et al. (Z. Xu et
al., 2011), which does not utilize temporal information (uses single frame) for text
detection from video. Liu et al. (C. Liu et al., 2005) proposed a method for text
detection in video using texture features and k-means clustering. These methods are
good for caption text but not for combinational graphics and scene text. Similarly,
Shivakumara et al. (Palaiahnakote Shivakumara et al., 2010) proposed an improved
method which detects both graphics and scene text in video based on the combination
of wavelet and color features. Zhao et al. (Z. Xu et al., 2011) uses the dense corners and
other features to detect text in video as well as in single frame.
The proposed method is also getting compared with the methods which use temporal
frames for text detection. Mi et al. (Congjie et al., 2005) which uses multiple frames for
text detection, Huang (X. Huang, 2011) which uses motion vector for detecting text in
video.
3.3.1 Dataset
To evaluate the performance of the proposed descriptor, a benchmark database
ICDAR 2013 video (Karatzas et al., 2013) is used which is available publicly. This data
contains 15 videos captured at different rates and different situations. In addition, the
video contains text of different types such as different scripts, fonts, font size and
orientations. In the same way, authors own dataset of size 1000 video is also created at
30 frames per second. This data is collected from different sources, namely, CNN,
CNBC, NDTV news channels ESPN, FOX, Ten sports, Star sports channels. Own

47
dataset videos usually contain significant variations in font styles, contrast, font sizes
and complex background variations. For example News channels videos like CNN,
CNBC or NDTV have combination of large number of scene text and caption text that
can be moving text (rolling news at bottom of screen). Whereas sports channels like
ESPN, FOX, Ten sports, Star sports have more number of scene text with lot of moving
text in the presence of small number of caption text. The proposed method believes this
data is good enough to cover all possible variations of texts and situations. In total 1015
videos are considered for evaluating the proposed descriptor. Few of the sample images
are shown in Figure 3.10.
3.3.2 Description of Measures
Three standard measures are considered, namely, recall, precision and F-measure for
measuring the performance of the proposed technique. The proposed evaluation system
follows the standard evaluation scheme as given in the ICDAR 2013 robust reading
competition. Note that the measure proposed in (Karatzas et al., 2013) requires words
segmentation because the ground truth is generated for words but not text lines. Since
video suffer from low contrast, word segmentation is not easy as word segmentation in
natural scene images. In order to use the standard measures, the ground truths of words
is combined and transformed into text lines for calculating the measures. For all the
Figure 3.10: Sample images from dataset considers

48
experimentations in this work, measures are calculated at text lines with the same
measures. Specifically, the measures are defined formally as follows. A match pm
between two rectangles (detected and ground truth) is defined as the area of the
intersection (Figure 3.11 shaded area) divided by the area of the minimum bounding
box containing both rectangles, an example is shown in Figure 3.11.
So the best match );( Rrm for a rectangle r in a set of rectangles R is defined as
}'|)';(max{),( RrrrmRrm p (3.10)
This is defined to find the closest match in the set of ground truth targets for each
rectangle in the set of estimates. Then Precision and Recall are defined as
Precision (P )=S
Er re
E
Trmse
);( (3.11)
Recall (R) = r
Tr St
T
Ermrt
);(
(3.12)
Figure 3.11: Example of matching between detected block (red)
and ground truth (yellow)

49
Where rT and SE are the sets of targets (ground truth) and estimated boxes,
respectively. These two measures are combined to form a single F-measure or F-score:
f with a parameter . The is set to 0.5 to give precision and recall an equal weight
while testing on ICDAR 2013 data set as stated by (Karatzas et al., 2013) and 0.8 for
authors own dataset. The reason for selecting higher parameter for this experiments
is to create stricter boundary for evaluation,
RP
f
1
1 (3.13)
In addition to these measures, Average Processing Time (APT) per frame is also
used as a measure to evaluate time efficiency for text detection.
3.3.3 Experiment on ICDAR 2013 Video
Sample qualitative results of the proposed and existing methods for text detection
from single frames are shown in Figure 3.12 where one can notice that the proposed
method detects text line well for the multi-oriented text with different backgrounds.
The methods proposed by Liu et al. (C. Liu et al., 2005), Shivakumara et al.
(Palaiahnakote Shivakumara et al., 2010) and Zhao et al. (Z. Xu et al., 2011) detect text
lines with missing text and more false positives because these methods are sensitive to
orientations. These existing methods focus much on horizontal text detection but not
multi-oriented text detection. Therefore, the methods give poor results for the input
images in Figure 3.12. On the other hand, the proposed descriptor is developed for both
horizontal and non-horizontal text detection in video. Quantitative results of the
proposed and existing methods are reported in Table 3.1 where it is found that the
proposed method outperforms the existing methods in terms of recall, precision, F-
measure and average processing time. One can observe from Table 1 that recall of the

50
proposed is close to the existing method while precision shows significant difference
compared to existing methods. This shows the proposed descriptor detects text well
without much false positives.
Table 3.1: Performance on ICDAR2013 when tested over individual frames
Method Recall Precision F-Score APT(s)
Per Frame
Proposed Method 0.74 0.82 0.78 2
(Z. Xu et al., 2011) 0.71 0.69 0.70 2.5
(Palaiahnakote
Shivakumara et al., 2010) 0.72 0.78 0.75 2.3
(C. Liu et al., 2005) 0.68 0.67 0.67 2
Similarly, the proposed and existing methods are tested on temporal frames for text
detection. The qualitative and quantitative results of the proposed and existing methods
are shown in Figure 3.13 and Table 3.2, respectively. Figure 3.13 and Table 3.2 show
that the proposed method utilizes temporal frames well for text detection as it detects
text lines well compared to existing methods. From Tables 3.1 to 3.2, recall improves
slightly compared to without temporal frames experiments because temporal
information helps us to locate text properly for the complex backgrounds. This shows
(d)(Palaiahnakote Shivakumara, Phan, & Tan, 2010) (e)(C. Liu et al., 2005)
Figure 3.12: Sample results for proposed and existing methods when
tested over individual frames
(a) Input Frame (b) Proposed Method (c) (Z. Xu et al., 2011)

51
that the proposed optical flow based method for moving text detection helps in
improving overall accuracy of the methods. However, according to F score, the
proposed method gives consistent results for both temporal and without temporal
frames.
Table 3.2: Performance on ICDAR2013 with temporal information
Method Recall Precision F-Score APT(s)
Per Frame
Proposed Method 0.76 0.79 0.77 2.3
(Z. Xu et al., 2011) 0.69 0.65 0.7 2.6
(Congjie et al., 2005) 0.73 0.72 0.77 2.3
(X. Huang, 2011) 0.7 0.69 0.69 2.8
3.3.4 Experiment on Author’s Dataset
Sample qualitative and quantitative results of the proposed and existing methods
using single frame are shown in Figure 3.14 and Table 3.3, respectively. It has been
observed from Figure 3.14 and Table 3.3 that the proposed method performs better for
the different orientations text with background images while existing methods either
(c) (Z. Xu et al., 2011) (d) (Congjie et al., 2005), (e) (X. Huang, 2011)
Figure 3.13: Sample results for proposed and existing methods when
temporal information is used
(a) Input Frame (b) Proposed Method

52
miss text information or give more false positives. When created dataset is compared
with ICDAR 2013 video, this dataset is huge and has plenty of variations. As for this
dataset no ground truth is available, so manual counting of recall and precision is made
with stricter value 0.8. For this dataset, the proposed descriptor gives better results
than existing methods can give, in terms of recall, precision, F-measure, as well as
average processing time. The main reason is that the proposed descriptor does not
involve expensive operations such as connected component analysis which is part of
the existing methods to improve the accuracy.
(d)(Palaiahnakote Shivakumara et al., 2010) (e)(C. Liu et al., 2005)
Figure 3.14: Sample results for proposed and existing methods when
tested over individual frames
(a) Input Frame (b) Proposed Method (c) (Z. Xu et al., 2011)

53
Table 3.3: Performance on Author’s dataset when tested over individual frames
Method Recall Precision F-Score APT(s) per
Frame
Proposed Method 0.8 0.84 0.82 2
(Z. Xu et al., 2011) 0.74 0.8 0.76 2.5
(Palaiahnakote Shivakumara et
al., 2010) 0.71 0.82 0.76 2.2
(C. Liu et al., 2005) 0.7 0.65 0.67 2.1
In the same way, experiments for the temporal frames is also conducted to detect
moving text in video as shown in Figure 3.15 and the results are reported in Table 3.4.
It is noticed that the results of temporal frames has been increased compared to the
results of single frames. This is because the dataset is large and the proposed method
utilizes optical flow properties for improving text detection performance. In summary,
the proposed new descriptor is good enough to handle temporal frames and single
frames as it achieves better accuracy compared to existing methods.
(c) (Z. Xu et al., 2011) (d) (Congjie et al., 2005) (e) (X. Huang, 2011)
Figure 3.15: Sample results for proposed and existing methods for
Scene text when temporal information used
(a) Input Frame (b) Proposed Method

54
Table 3.4: Performance for scene text with temporal information
Method Recall Precision F-Score APT(s)
Per Frame
Proposed Method 0.86 0.88 0.87 2.3
(Z. Xu et al., 2011) 0.73 0.75 0.73 2.6
(Congjie et al., 2005) 0.81 0.8 0.80 2.4
(X. Huang, 2011) 0.78 0.77 0.77 3.2
Based on the experimental results on standard dataset and authors dataset it can be
concluded that the proposed method is competent to existing methods. However, there
are some limitations as follows. The performance of the proposed method may degrade
when a video contains text with arbitrary movements because the scope of the proposed
method is limited to unidirectional moving text detection.
3.4 Summary
In this work, a new descriptor HOM is presented for both text detection from single
frame and moving text detection in video. The proposed method explored second order
geometric moments for deriving a new descriptor to exploits the strength of moments,
such as spatial information and pixel values. This results in dominant orientation for
each sliding window over an input frame. Next introduced a new hypothesis based on
orientations of the moments to identify text candidates. False text candidates are
removed by using dense corners and edge density of the text candidates. Optical flow
with velocity and direction are explored for moving text detection. Experimental results
on benchmark dataset, ICDAR 2013 and authors data show that the proposed method
outperforms the existing methods for all measures i.e. recall, precision, F-Score and
average processing time. Besides, experimental results shows that the proposed method
is independent of orientation, data, fonts and font size. In this work after detecting text
regions over individual frames, the proposed method utilizes the optical flow

55
information to categorize the moving text region and for validating the text regions.
The same temporal information will be explored for text candidates in next chapter.

56
CHAPTER 4: MOTION ESTIMATION BASED METHOD FOR MULTI-
ORIENTED MOVING TEXT DETECTION
In the previous chapter temporal information is used to identify the moving text
from already detected text region from HOM feature. In this chapter, temporal
information will be explored for detection of moving text from videos. Detection of
moving text of different orientations in video is challenging because of low resolution
and complex background of video. In this work, a method is proposed based on motion
vectors to identify the moving blocks which have linear and constant velocity. The
proposed method introduces a new criterion based on gradient direction of pixels in text
candidates to remove false text candidates which results in potential text candidates.
Then the proposed method performs region growing to group the potential text
candidates which outputs text lines. The proposed method is tested on both static and
moving text video to evaluate the performance in terms of recall, precision, F-measure,
misdetection rate and time. The results are compared with the well-known existing
methods to show effectiveness of the proposed method.
4.1 Introduction
Video containing moving caption text has a special property that is text will move
with specific velocity for making it easily readable by viewers. So mostly if text is
static then velocity of motion is zero and if text is moving then it will have some
constant velocity. These observations lead us to utilize the motion pattern of objects
present in videos for detecting moving text. In this work, a new method is presented
which would be able to detect both moving scene and graphics text together
independent to orientation. As this work is motivated by the work presented in (Congjie
et al., 2005; H. Li et al., 2000; Minetto, Thome, Cord, Leite, & Stolfi, 2011) for text
detection and tracking using wavelet, moments and motion vectors, the proposed

57
method propose to use motion vectors with moments to identify text candidates.
Gradient directional features are explored for the text candidates to identify potential
text candidates. Then region is used for each potential text candidates to group them
into text line of any orientation. Though the multi-oriented text detection in video have
been addressed in (Palaiahnakote Shivakumara et al., 2014; Palaiahnakote
Shivakumara, Phan, & Tan, 2011), the methods do not consider temporal information
for text detection and their scope is limited to text detection from single frame in
contrast to the proposed method. The main advantage of the proposed method is that it
is capable of detecting both static and dynamic in video. The contribution is to use of
motion vectors and moments in a novel way for detecting moving multi-oriented text
regardless of whether text is caption or scene text.
4.2 Proposed Method
Text motion in video is one of the three types: static which does not have any
motions, simple linear motion (for example, scrolling movie credits) and complex
which may have non-linear motion (for example zooming in and out, rotation, or free
movement of scene text). As per review, most of the videos contain first two cases and
video having arbitrary text moments is rare. This work is targeting to detect the linear
and arbitrary moving text. The flow chart of the proposed method is shown in Figure
4.1.

58
As motivated by the ability of motion vector estimation techniques proposed in (X.
Huang, 2011; R. Li, Zeng, & Liou, 1994) for tracking moving objects with fast and
efficient searching technique, the proposed method offers the same motion estimation
with new three step search method for estimating the motion linearity of the blocks to
identify the possible text blocks. The moments are proposed for identifying probable
text blocks. When the gradient direction (Epshtein et al., 2010) of character
components are studied, it is noted that most of the gradient direction of pixels, outer
contour of character components moves into the character and few move away from the
character. It can also been observed from Figure 4.2. This observation motivates us to
propose a rule for identifying potential text candidates from the text candidates. Then in
order to extract multi-oriented text line, region growing method is used as proposed in
(Palaiahnakote Shivakumara et al., 2014) for text detection in individual frames.
Video Frames
Motion Estimation
Using Moments
Cost Function
Selection of Text
Candidates with k-
means clustering
Text Detection
through gradient
directions
False Elimination Boundary
Growing
Figure 4.1: Flow chart of the proposed method
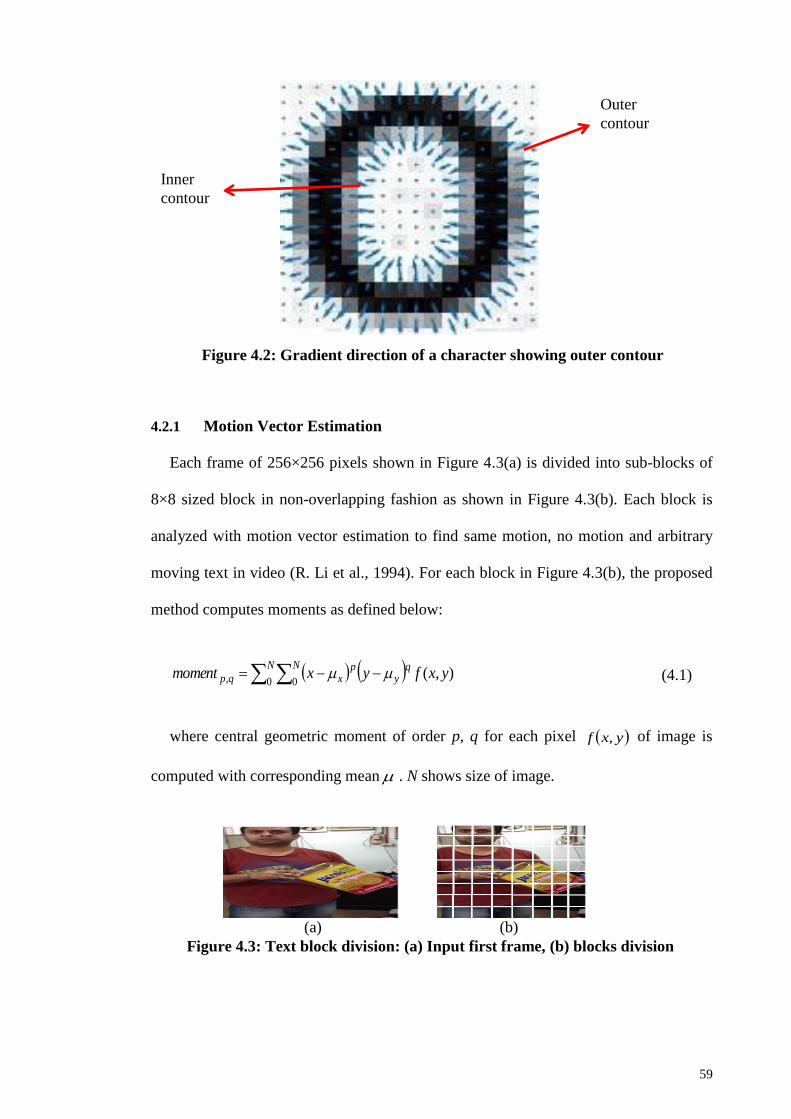
59
4.2.1 Motion Vector Estimation
Each frame of 256×256 pixels shown in Figure 4.3(a) is divided into sub-blocks of
8×8 sized block in non-overlapping fashion as shown in Figure 4.3(b). Each block is
analyzed with motion vector estimation to find same motion, no motion and arbitrary
moving text in video (R. Li et al., 1994). For each block in Figure 4.3(b), the proposed
method computes moments as defined below:
N N q
yp
xqp yxfyxmoment0 0, ),( (4.1)
where central geometric moment of order p, q for each pixel yxf , of image is
computed with corresponding mean . N shows size of image.
Figure 4.2: Gradient direction of a character showing outer contour
Inner
contour
Outer
contour
(a) (b)
Figure 4.3: Text block division: (a) Input first frame, (b) blocks division

60
Then a new three steps search is used as proposed in (R. Li et al., 1994) in order to
find matching block and motion in the successive frames, the range of search is 3-level
neighbor pixels for each pixel as shown in Figure 4.4.
The proposed method finds difference of the moment of each block with the
neighbor blocks in the adjacent frame to find matching block. Then Block Distortion
Measure (BDM) is set to certain threshold to find probable match in the search area
shown in Figure 4.4. For instance, for each video sequence, say first frame (F1) and
second frame (F2) the motion is estimated with the cost (BDM) calculated by the
difference among block moment:
(4.2)
where M and N denote size of the block.
Equation (4.1) represents the difference of moment of each block (i, j) in frame1
with relative block (i+u, j+v) in next frame2. Moments are computed using Equation
(4.1). In Figure 4.5, position of text in each frame is moving in same direction for all
shown frames. Even if text moves in arbitrary direction it will be same for few limited
frames. This can be determined with the help of moment of those blocks which will
remain same for next few frames. In this way, the proposed method applies iterative
procedure till the motion cost remain same for consecutive frames to extract moving
text blocks which is the converging criteria to stop the procedure.
Figure 4.4: Search area for motion estimation through three steps
search method
M
i
N
j
vjuimomentFjimomentFjit1 1
),(2),(1),(cos

61
4.2.2 Selection of Text Candidates
The above process gives moving blocks which are the possible dynamic text blocks.
Moment behavior at text region is utilized for probable text candidate selection. It is
observed that the moments give higher value for text components and low value for
non-text components. Therefore, k-means clustering is used wth k=2. The cluster that
gives high mean is considered as a text cluster as shown in Figure 4.6(b) where one can
see few non-text edge components are removed compared to Figure 4.6(a). This output
is called text candidates. However, due to complex background and low resolution of
video, Figure 4.6(b) still contains few non-text components.
(a)
(b)
(c)
Figure 4.5: Illustration for text movements: (a) Video
frames, (b) Edged image of each frame, and (c) text
movements can be noticed
Figure 4.6: Text candidate selection: (a) Moving text with edge
components, (b) Text candidates identified
(a) (b)

62
4.2.3 Text Detection
It is noticed from the results in Figure 4.6 (b) that text candidate selection
misclassifies non-text candidates as text candidates due to complex background and
low resolution of video. To eliminate such false text candidates, proposed method
proposes to use the gradient direction of each edge components based on the
observation that most of gradient direction of outer contour pixels of edge component
move towards characters centroid and few pixel gradient direction move away from the
character centroid (Epshtein et al., 2010). This is illustrated in Figure 4.7.

63
(d) Number of directions which go inside the components and away from
the component
Figure 4.7: False text candidate removal using gradient directions
(a) Candidates which represent text is marked by yellow rectangle and
candidates which represent non-text is marked by red rectangle
(b) Gradient directions for Text region marked in (a)
(c) Gradient directions for non-text region marked in (a)
No of components in text No of components in Non-text

64
The proposed method uses this criterion to eliminate false text candidates as shown
in Figure 4.8(a). Further, edge density is used to remove small non-text components as
shown in Figure 4.8(b), and finally edge components in Sobel edge image of the input
first frame are restored corresponding to potential text candidates, which are called text
representative as shown in Figure 4.8(c).
For each representative in Figure 4.7(c), the method propose to use region growing
as in (Palaiahnakote Shivakumara et al., 2014) for restoring full text lines by referring
Sobel edge image of the first frame. As stated in (Palaiahnakote Shivakumara et al.,
2014), nearest neighbor criteria is used to determine the angle of orientation of a text
line from the candidate text representatives. This uses a candidate text representative
belonging to that line as the seed to grow the boundary. The method starts growing
(a) (b) (c)
Figure 4.8: Text representatives extraction: (a) Effect of gradient
direction, (b) Effect of edge density, (c) Text representatives
Figure 4.9: Text detection: (a) Mask operation to connect
potential text candidates, (b) Boundary grown mask (c) Text lines
edges inside final boundary grown Mask and (d) Text detected
(a) (b)
(c) (d)

65
boundary of the seed point by expanding the boundary, pixel by pixel. For each
expanded boundary, the method checks whether the expanded boundary contains white
pixel or not. If expanded boundary does not contain white pixel then growing continues
until it gets white pixel of nearest neighbor component in the text line. This process
continues along the text edge information in the Sobel edge map from the seed
representative till it satisfies some convergent criteria. This boundary growing uses
converging criteria based on angle information, which allows the proposed method to
grow as direction of text line without covering the background information and
touching adjacent text lines.
The process of boundary growing is shown in Figure 4.9 where (a) shows initial
boundary fixing for each representative, (b) shows merged character boundaries based
on nearest neighbor criterion that has been used to find merge adjacent characters in a
text line, (c) shows edges of the growing output and (e) shows final text line detected.
More details for region growing for multi-oriented text lines extraction can be found in
(Palaiahnakote Shivakumara et al., 2014).
4.3 Experimental Results and Discussion
In order to show the effectiveness of the method, well-known existing methods are
being implemented that are Mi et al. (Congjie et al., 2005) which use multiple frames
for text detection, Huang (X. Huang, 2011) which uses motion vector for detecting text
in video and Zhao et al. (Z. Xu et al., 2011) which uses dense corners and optical flow
properties for text detection in video. These methods explore the temporal information
for text detection, which is same state of art as proposed methods. To evaluate the
effectiveness of proposed method over static text, Two methods are also considered for
comparison: Liu et al. (C. Liu et al., 2005) and Shivakumara et al. (Palaiahnakote
Shivakumara et al., 2010), which do not use temporal information and works for static
66
text in single frame of video. Liu et al. proposed a method for text detection in video
using texture features and k-means clustering. This method is good for captions text but
not for both graphics and scene text. Similarly, Shivakumara et al. proposed improved
method which detects both graphics and scene text in video based on the combination
of wavelet and color features. However, the method does not work for moving text as
scope is limited to text detection in individual frames of video.
4.3.1 Dataset
To evaluate the performance of proposed method, a dataset has been created which
includes variety of text from different sources like news channels CNN, CNBC, and
NDTV. In total, 250 such videos of 1 to 6 seconds have been considered for evaluating
the proposed method out of which 60 videos contain only static text, 100 contains
moving text and 90 contains both scene and graphics text together. Few samples from
dataset are shown in Figure 4.10. Each video follows 30 frames per second. The reason
for collecting dataset videos from the news channels like CNN, CNBC and NDTV‟s
are that they contains variety of moving rolling text with static text present in
background. One can also found the variety of font size text in these videos. The
observation of the velocity pattern which has been followed throughout this work of
moving text can also been observed from such videos. Standard measures proposed in
section 3.4.2 is used for evaluation: recall (R), precision (P), f-measure (F) and Average
processing time (APT).

67
4.3.2 Description of Measures
To evaluate the performance of authors datasets, the same measure Recall (R),
Precision (P), F-measure (F) and Average Processing Time (APT) are used as discussed
in section 3.4.2. In addition Misdetection Rate (MDR) as defined in (Palaiahnakote
Shivakumara et al., 2011) are also considered to evaluate the performance of the
method. These categories are defined for each detected block by a text detection
method:
Truly Detected Block (TDB): TDB is a detected block that contains partially or
fully text. If the block contains more 80% of the text, it is considered as block
with partial text (Palaiahnakote Shivakumara et al., 2011).
Text Block with Missing Data (MDB): MDB is a detected text block that misses
some characters. If the block misses more than 20%, it is considered as missing.
The performance measure is defined as follows:
Misdetection Rate (MDR) = MDB/TDB,
(c) Both Scene and graphics text
Figure 4.10: Few sample images from datasets
(a) Only scene text
(b) Only graphics text
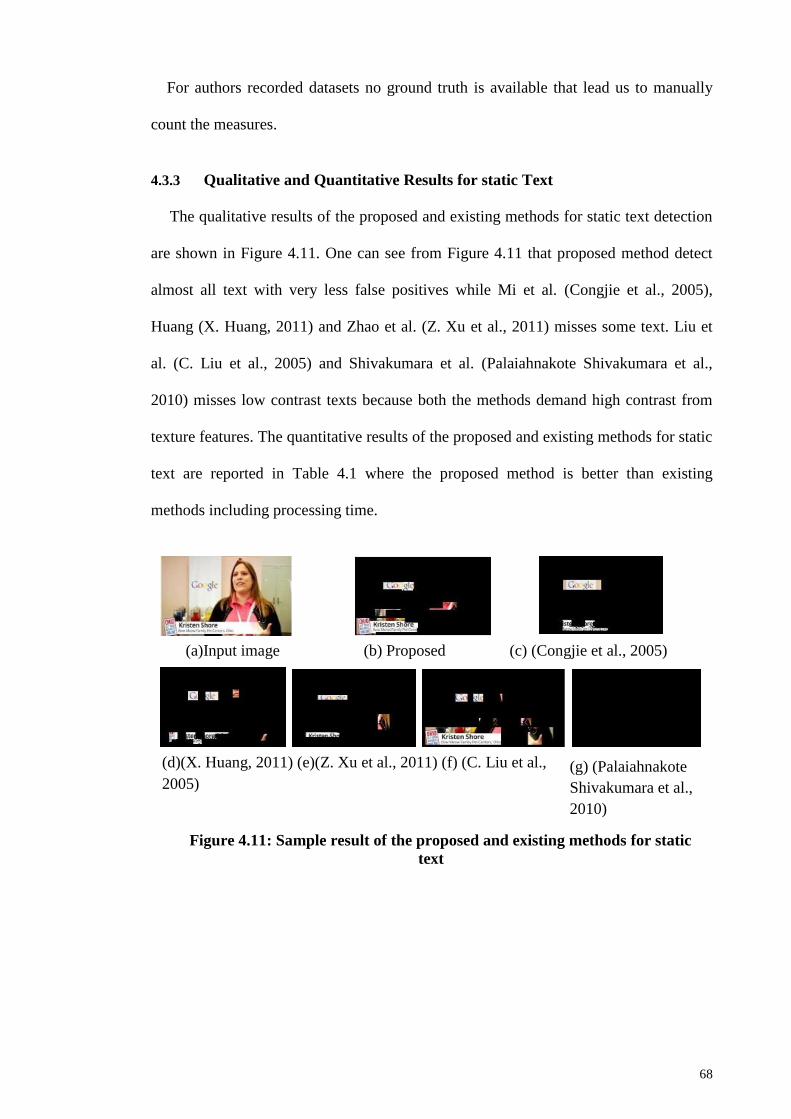
68
For authors recorded datasets no ground truth is available that lead us to manually
count the measures.
4.3.3 Qualitative and Quantitative Results for static Text
The qualitative results of the proposed and existing methods for static text detection
are shown in Figure 4.11. One can see from Figure 4.11 that proposed method detect
almost all text with very less false positives while Mi et al. (Congjie et al., 2005),
Huang (X. Huang, 2011) and Zhao et al. (Z. Xu et al., 2011) misses some text. Liu et
al. (C. Liu et al., 2005) and Shivakumara et al. (Palaiahnakote Shivakumara et al.,
2010) misses low contrast texts because both the methods demand high contrast from
texture features. The quantitative results of the proposed and existing methods for static
text are reported in Table 4.1 where the proposed method is better than existing
methods including processing time.
(a)Input image (b) Proposed (c) (Congjie et al., 2005)
Figure 4.11: Sample result of the proposed and existing methods for static
text
(d)(X. Huang, 2011) (e)(Z. Xu et al., 2011) (f) (C. Liu et al.,
2005) (g) (Palaiahnakote
Shivakumara et al.,
2010)

69
Table 4.1: Performance of the proposed and existing methods for static text
Methods R P F MDR APT(Seconds)
Proposed Method 0.84 0.86 0.85 0.13 1.6
(Congjie et al., 2005) 0.82 0.81 0.81 0.4 2.2
(X. Huang, 2011) 0.78 0.77 0.77 0.3 3.6
(Z. Xu et al., 2011) 0.78 0.79 0.78 0.38 2.8
(C. Liu et al., 2005) 0.76 0.72 0.73 0.18 5.2
(Palaiahnakote Shivakumara et al., 2010) 0.73 0.87 0.77 0.46 42.1
4.3.4 Qualitative and Quantitative Results for dynamic Text
The qualitative results of the proposed and existing methods for dynamic text
detection are shown in Figure 4.12 where for the first and the second input frames,
most of existing methods fail to detect text properly and for the third frame, most of the
methods detect text correctly including the proposed method. On the other hand, the
proposed method detects almost all text in all three input frames since it works for both
static and dynamic text without any constraints as in the exiting methods. The proposed
method finds the text region which has same movement through multiple frames, which
includes the static text whose motion is same (near to 0) that makes it detectable by the
proposed method. The comparative result is shown in Table 4.2, which shows the
performance of all methods for dynamic text.

70
Table 4.2: Performance of the proposed and existing methods for dynamic text
Method R P F MDR APT
(Seconds)
Proposed Method 0.89 0.83 0.85 0.13 1.76
(Congjie et al., 2005) 0.66 0.68 0.66 0.42 2.22
(X. Huang, 2011) 0.78 0.79 0.79 0.28 3.3
(Z. Xu et al., 2011) 0.76 0.7 0.73 0.25 2.71
(C. Liu et al., 2005) 0.59 0.60 0.58 0.40 5.38
(Palaiahnakote Shivakumara et al., 2010) 0.66 0.84 0.71 0.52 42.35
(c) (Congjie, Yuan, Hong, & Xiangyang, 2005)
(a) Input Image
(f) (C. Liu, Wang, & Dai, 2005)
(g) (Palaiahnakote Shivakumara et al., 2010)
Figure 4.12: Sample results of proposed and existing methods for
multi-oriented moving text videos
(d) (X. Huang, 2011)
(e) (Z. Xu et al., 2011)
(b) Proposed Method

71
4.3.5 Discussion
The key reason behind this response is (Congjie et al., 2005), (X. Huang, 2011) and
(Z. Xu et al., 2011) works only for horizontal moving text. Here situations represented
contain both static and dynamic text combinations. Existing method are not able to
detect the both. On the other hand (C. Liu et al., 2005) and (Palaiahnakote Shivakumara
et al., 2010) do not work for moving text which results in there low performance. When
the results of Table 4.1 and Table 4.2 are compared, accuracy of the proposed method
is almost similar. Therefore, it can be concluded that the proposed method is superior to
existing methods in terms of recall, precision, F-measure, misdetection rate and
processing time. When this work is compared with the work presented in Chapter 3, the
key difference lies in utilizing the temporal information for detecting text candidates.
Here the proposed method exploits more information present in temporal information.
For the case where frames contain too low contrast text, complex background, the
method fails to detect text properly as shown in Figure 4.13 where the proposed method
does not detect full text lines and it detects non-text region as a text region. The reason
is that moments features for tracing text blocks in temporal frames find mismatch when
there is complex background. Therefore, there is a scope for the improvement in future.

72
Based on the experimental results on authors dataset it can be concluded that the
method performs better to detect moving text compare to existing methods. However,
there are some limitations discussed in section 4.4.3. The performance of the proposed
method may degrade when a video contains low contrast text with complex
background.
4.4 Summary
This work presented a novel method for multi oriented moving text detection of both
scene and graphics text present in video based on motion vector estimation at block
level. The moments are explored for finding the possible text blocks in temporal
frames. Gradient directions of text pixels are explored to refine text candidates and
(a). Input frames (b) Text detection results
Figure 4.13: Limitations of the proposed method

73
finally region growing is used based on nearest neighbor criterion for restoring text line
information regardless of orientation, scripts. However, the proposed method explores
inter-frame temporal information between every frame for selecting text that is an
improvement from Chapter 3 work but also has a limitation of using only few frames.
In addition usage of fixed window size for estimating motion limits the performance of
proposed method for multi sized font text, which will be the next consideration for
improvement.

74
CHAPTER 5: ARBITRARILY-ORIENTED MULTI-LINGUAL TEXT
DETECTION IN VIDEOS
It has seen in the previous chapter that usage of fixed window size can reduce the
performance of the method. Considering that point in mind, this work will focus on
introducing a novel idea for determining automatic window to extract moments for
tackling multi-fonts, multi-font size text in the video. In addition another lacking factor
in previous proposed method was lying on one question that is “How many frames
should one consider for the usage of temporal information that would be enough for
correct text detection?” In this work, the temporal information is explored in such a
way with developed condition which is capable to choose number of frames
automatically and stops when converging criteria meets.
5.1 Introduction
Inspired by the work presented in (H. Li et al., 2000) for multi-oriented text
detection in video using the combination of wavelet and moments, where it is shown
that moments helps in detecting text candidates for text successfully, the method
propose to explore moments in a new way without wavelet support for classifying static
and dynamic text clusters using temporal frames. It is noted that (Epshtein et al., 2010;
Yang, Quehl, & Sack, 2014) stroke width distance is almost same for the characters in
the video, The proposed method utilize the same stroke width distance for determining
window size automatically to make the method invariant to different fonts, font size
etc. Most of the existing methods which use temporal frames utilize fix number of
frames based on pre-defined experiments because the intention of the methods is to use
temporal frames for enhancing low contrast text information. Therefore, this work
proposes a new iterative procedure that estimates the deviation between first and
successive temporal with moments based on the fact (X. Huang, Ma, Ling, & Gao,

75
2014) that caption text stay at the same location for few frames while scene text has
little movement from one frame to another for separating caption text from scene and
background pixels. The advantage of this iterative procedure is that it helps in
identifying exact number of temporal frames to be used for text candidate detection. As
motivated by boundary growing proposed in (Palaiahnakote Shivakumara et al., 2014)
for multi-oriented text detection in video, this method proposes boundary growing
without angle projection for arbitrarily-oriented text extraction in video.
5.2 Proposed Method
As discussed in the previous section, moments helps in extracting vital clues of text
pixels, such as regular spacing between text pixels and uniform color of the text pixels
(Palaiahnakote Shivakumara et al., 2014), the proposed method explore the moments to
estimate deviation between temporal frames to separate caption (pixels which stay at
the same location) from scene text (pixels which has little movements along
background) and background pixels. To obtain such clues for classification, window
should be defined for estimating moments. Since video contains multi-font, multi-size
text, fixing particular window does not yield good accuracy results. Therefore, the
proposed method offers a new idea for determining window automatically based on
stroke width information of Sobel and Canny edge images of the input video frame.
The proposed method introduces iterative procedure for estimating deviation using
moments of pixels in consecutive frames with the help of k-means clustering, which
results in static and dynamic text clusters containing caption text and scene text,
respectively. The output of clustering is named as text candidates of caption and scene
texts in respective clusters. Due to low resolution and complex background, the
clustering may misclassify non-text pixels as text pixels. Therefore, gradient direction
of text candidates is analyzed to identify the potential text candidates. Furthermore,

76
boundary growing is proposed for each potential text candidate to extract full text line
of any direction in video. The flow of the proposed method can be seen in Figure 5.1.
It is true that generally, video contains both static and dynamic text. Most of the
time caption text refers static text as it stays at same location for few frames since in
order to be readable. The proposed method explores the same observations for
estimating deviation between the first frame and the successive frames using Euclidean
distance. For estimating deviation, moments are proposed for each window (dynamic)
in non-overlapping fashion with k-means clustering.
5.2.1 Automatic Window Size Detection
It is known that usually, window size is determined based on performance of the
method on sample data by varying different sizes, which generally results in study of
optimal stroke thickness of text components in images for text detection/recognition.
As a result, this procedure may hamper the performance of the method when input data
Figure 5.1: Overall framework of the proposed method
Input video
Window Size
Moments for Text Candidates Selection
Static text Cluster Dynamic text cluster
Text pixels separation
Text Candidates
Gradient Direction for Potential Text Candidates Selection
Boundary growing for final text line retrieval

77
contains multi-font and multi-text size as in video. Therefore, this work proposes a new
idea for finding window automatically based on stroke width and opposite direction
pair. Motivated by the work in (Phan, Shivakumara, & Tan, 2012) for text detection in
natural scene images where it is shown that the pattern of text in Sobel and Canny edge
images of the input image share the same symmetry property to identify text
candidates, so the proposed method find common pixels in Sobel and Canny edge
image of the input image, which satisfies stroke width distance and opposite direction
pair to identify the common pixels, as defined in equation (5.1).
)&(&)( ),(),(),(),( njijijiSjiC GDGDSWSWif (5.1)
Where for all pixels (i, j) of image P, a common pixels image CP is generated if
stroke width for that pixels in canny image CSW matches with the stroke width in
Sobel image SSW of input. As well as the Gradient Direction (GD) will also be present
in opposite pair combination, stating for GVF at location (i, j) there will exist an
opposite (-GD) at location (i, j+n). Here n denotes pixels that represent stroke width.
On the common pixels, the proposed method perform histogram operation for stroke
width distance vs. frequencies to choose the distance which gives highest peak and the
corresponding stroke width distance is considered as window size for moments
estimation, which results in candidate text pixel image. It is illustrated in Figure 5.2
where (a) is the input image, (b) is the Sobel edge image, (c) is the Canny edge image,
(d) is the common pixels which satisfy the stroke width distance and opposite direction
pair in Sobel and Canny edge image and (e) is the histogram where stroke width
distance greater than equal to two to choose highest peak are plotted. Note: Pixels that
have stroke width distance less than two do not contribute to represent text. It is noticed
from Figure 5.2(e) that the stroke width (SW) distance, 2 gives highest peak and hence
1:),( ),( jiCPjiP

78
it is considered as window dimension for given input image. The pixels which
contribute to highest peak are called candidate text pixels as shown in Figure 5.2(f)
where one can see that a few non-text pixels are removed compared to the results in
Figure 5.2(d) and text pixels are retained. For the image shown in Figure 5.2(a), 2×2
dimension is considered as actual window dimension. In this way, automatic window
size detection helps in retaining strokes that represents text in the video frame without
losing significant information. However, Figure 5.2(f) shows that this step misclassifies
non-text pixels as candidate text pixels due to complex background and low resolution
of video. In addition, it can be seen in Figure 5.2(f) that few text pixels are also lost
compared to Figure 5.2(d). This loss does not affect much for the text detection in this
work because the restoration steps which will be presented in subsequent sections,
restores missing text pixels from the edge image while extracting text lines in the video
frame. The main advantage of this step is that the step gives candidate text pixels
regardless of caption and scene text type as shown in Figure 5.2(f) where one can see
candidate text pixels for caption (bottom line in Figure 5.2(a)) and scene text (“Oreilly”
in middle of the image in Figure 5.2(a)). Hence, this step solves two problems: window
size detection and candidate text pixels identification by reducing non-text pixels. The
candidate text pixels are input for identifying text candidates which will be presented in
next Section.

79
5.2.2 Static and Dynamic Text Cluster Classification
It is observed from Figure 5.2(f) that the step presented in Section 3.1 misclassifies
non-text pixels as candidate text pixels due to complexity of the problem. In order to
classify text pixels accurately, the proposed method proposes to explore temporal
information for classifying text and non-text pixels in this Section. As mentioned in (X.
Huang et al., 2014), pixel that represents caption text stay at the same location for few
frames while pixel that represents scene text (background) have little movements, the
proposed method uses the same basis for classifying caption and scene text pixels.
Since caption text pixels do not have movements and scene and background pixels have
movements, the deviation between caption text pixels is lower than the scene and
background pixels. To extract such observation, moment estimation is proposed for the
defined window over the first frame and its successive frames. The intuition behind
using moments to find deviation is that it provides spatial coherence of text pixels
which usually have clusters. As a result, it gives higher value round text and lower
around non-text. It can also increase the gap between caption text and scene text
regions. For the deviation computed between first and second frame, next the proposed
(a) First frame (b) Sobel edge (c) Canny edge (d) Common pixels
(e) Histogram for SW>=2: SW vs. frequencies (f) Candidate pixels of highest peak
Figure 5.2: Automatic window size detection using stroke width (SW)
distance and opposite direction pair

80
method employ k-means clustering with k=2 to classify caption pixels into one cluster
(static) and scene, background pixels into another cluster (dynamic). The cluster which
gives lowest mean is considered as static cluster (caption text) and other is considered
as dynamic cluster (scene text and background pixels), which is called first iteration
result. In the same way, the process continues for first and third temporal frame by
considering static cluster as input. In other words, the deviation is computed between
the result of first iteration and third frame. Again, the k-means clustering with k=2 is
deployed to obtain static and dynamic cluster. As iteration increases, the pixels which
represent non-text in static cluster classified into dynamic cluster. When all the pixels
which represent non-text in static cluster classified into dynamic cluster after certain
iterations, dynamic cluster contains nothing. This is the converging criterion for
terminating iterative process. As a result, static cluster gives caption text and dynamic
cluster gives scene text along with non-text pixels. The same converging criterion helps
in deciding the number of temporal frames unlike existing methods (Weihua Huang et
al., 2008; C. Liu et al., 2005; Palaiahnakote Shivakumara et al., 2011; Z. Xu et al.,
2011) that assume or fixed the number of temporal frames to be used for text detection.
The advantage of this step is that it solves two issues: It separates caption text from
scene text and background pixels, at the same time it helps in deciding the number of
temporal frames.
For each video sequence, f, f+1, f+2…fn as shown in Figure 5.3(a), the proposed
method employs an iterative procedure to identify text candidates. Here n denotes 30
frames per second. For the first iteration, the method considers the first two consecutive
frames, say f and f+1 as shown in Figure 5.3(b). Each frame is divided into equal sized
blocks of window size. The automatic window size will be determined by the method
presented in Section 5.3.1 in a non-overlapping fashion. For each block in f and f+1
frame, a Higher Order Moments (HM) are computed as follows.

81
N N q
y
p
xqp yxfyxHM0 0, ),( (5.2)
where p, q are order of HM and yxf , is the image intensity with the
corresponding mean ; N shows the size of image. Then the moments of each block f
and f+1 frame are compared using Euclidean distance by following equation.
n
i ii pqqpd1
2),( (5.3)
where ),...,,( 21 npppp and ),.....,,( 21 nqqqq are two points in the Euclidean n-
space.
The resultant is deviation matrix between the first two frames as shown below.
),(...)0,(
.
.
.
.
.
.
),0(...)0,0(
NNdNd
Ndd
D NXN
(5.4)
For the deviation matrix obtained from the frames, f and f+1, the method employs a k-
means clustering algorithm to classify the pixels which represent low deviation values
as static cluster from high deviation values. As a result, the k-means clustering
algorithm gives two clusters: a text cluster containing caption (Static cluster-1) and a
dynamic cluster containing the scene text and background pixels (Dynamic cluster-1)
as shown in Figure 5.3(c) where one can observe a few non-text pixels misclassified as
caption text in static cluster-1. The method counts the number of edge components in
both Static cluster-1 and Dynamic cluster-1. For the second iteration, the gray values
corresponding to Static cluster-1 are considered for deviation estimation with the f+2
frame (the third consecutive temporal frame) as shown in Figure 5.3(d) where one can

82
see gray pixels which represents pixels in Static cluster-1. The deviation is estimated
between only gray patches in Static cluster-1 and corresponding gray patches in the f+2
frame (third frame). As a result of the second iteration, two new clusters will made that
are Static cluster-2 and Dynamic cluster-2 as shown in Figure 5.3(e). It is observed that
the number of edge components in Dynamic cluster-2 have decreased compared to the
number of edge components in Dynamic cluster-1. This iterative process continues
until the condition satisfies the criterion in which the number of edge components in
the Dynamic cluster approaches zero. This is valid because as the iterations increases
the number of non-text pixels from Dynamic cluster becomes zero as shown in Figure
5.3(f) where the final Static cluster contains caption text pixels and the final Dynamic
cluster contains zero edge components after sixth iteration. To validate this converging
criterion, a cumulative graph for the number edge component in Dynamic clusters is
shown in Figure 5.4 by adding the number of the edge components of the current
iteration to the number of the number of edge components of the previous iteration. It
can be observed that the number of edge components increases gradually and remains
constant as iteration increases.

83
The iteration at which the Dynamic cluster has no edge component, the proposed
method considers that the iterative process has met the converging criterion. For the
example shown in Figure 5.3, the iterative process terminates at the sixth iteration as
shown in Figure 5.4. Since this step considers the output (candidate text pixels) of the
step presented in Section 5.3.1, the iterative process terminates quickly and accurately.
Therefore, it does not require much processing time for separating caption text from
scene and background pixels.
(a) Input: Video sequence starting from f, f+1, f+2…....fn
(f) Final, Static cluster-6 and Dynamic cluster-6 at the 6th
iteration
Figure 5.3: Iterative process for separating caption pixels from scene and
background pixels.
(e) Static cluster-2 and Dynamic
cluster-2 for the second iteration
(d) Static cluster-1 and f+2 frame as
input for the second iteration
(c) Static cluster-1 and Dynamic
cluster-1 for the first iteration
(b) f and f+1 frames as input for the
first iteration
……….

84
It is seen from Figure 5.3(f) that the iterative procedure separates caption text from
scene and background pixels successfully. Next, the question is how to separate scene
text from the results of Dynamic cluster which contains both scene text and background
pixels. Therefore, the proposed method consider compliment of caption text results
given by iterative procedure by referring candidate text pixels results given by step
presented in Section 5.3.1. This result in scene text pixel with background pixels
without caption text pixels as shown in Fig. 5.5(a) where it can be seen can see scene
text pixels along with the background pixels. In order to separate scene text pixel from
Figure 5.5(a), the proposed method calculates moments as discussed in the above for
the pixels in Figure 5.5(a). It is known that text pixels have high contrast compared to
its background (Qixiang Ye & Doermann, 2015). As a result, moments give high
values for text pixels and low values non-text pixels. Since moments calculation
provide gap between text and non-text pixels, the proposed method employ the k-means
clustering with k=2 on moments matrix which gives two clusters. The cluster that gives
highest mean is considered as text cluster and other one as non-text cluster as shown in
Figure 5.5(b) where it can be seen that non-text pixels are removed. Furthermore, the
proposed method combines caption text (Figure 5.5(c)) and text cluster (Figure 5.5(b))
by union operation as shown in Figure 5.5(d) where one can see both caption and scene
text pixels, which is called text candidates.
Figure 5.4: Cumulative graph of number of components in non-text
cluster for different iteration

85
5.2.3 Potential Text Candidates Detection for Text Detection
Since considered problem is complex, it is difficult to eliminate false text candidates
completely for every input video. For example, the results shown in Figure 5.5(d)
suffer from false text candidates and loss of information. To eliminate such false text
candidates, the proposed method proposes to explore gradient direction of the text
candidate pixels. It is noted from (Palaiahnakote Shivakumara, Phan, Lu, & Tan, 2013)
that for character components in text line, most of the gradient direction (GD) of pixels
show inward direction and few pixels shows outward direction. Inward direction is
defined as the direction which shows towards character. Outward direction is defined as
the direction which shows towards nearest neighbor character. Due to influence of
nearest neighbor character, few pixels of text candidates show direction away from the
text candidates. Based on this observation, the proposed method formulate a rule as if
the text candidate is actual text candidate then it must have more number of inward
direction (ID) compared to outward directions (OD) else the text candidate is
considered as non-text candidate as defined in equation (5). One such example is
shown in Figure 5.6, where more number of pixels of character in Figure 5.6(a) show
inward directions (green arrows) compared to outward directions (red arrows) and
Figure 5.5: Text candidates of caption and scene texts.
(c) Caption text by iterative procedure (d) Union of (b) and (c)
(a) Result of compliment (scene text) (b) Text cluster by k-means

86
pixels of non-text component in Figure 5.6(b) does not satisfy this formulation. In
addition, it is observed from Figure 5.6(b) that the directions of candidate pixels are
arbitrary due to background influence. The effect of this formulation can be noticed in
Figure 5.6(c) and Figure 5.6(d) where Figure 5.6(c) is the final result which combines
(union) of caption and scene text shown in Figure 5.5(d), and Figure 5.6(d) does not
have any false text candidates. Therefore, the output of this step is called potential text
candidates (PTC) that can be defined as:
Otherwise
GDODGDIDPTC
ii )()( )(
textNon
Text
:
:
(5.5)
One can notice from Figure 5.6 (d) that image contain loss of text information because
the above formulation and clustering presented in Section 5.3.2 may eliminate
significant text pixels sometimes. To restore full text lines using potential text
(c) Union of caption and scene text (d) Effect of inwards and outward directions
(a) Text components (b) Non-text component
Figure 5.6: Potential text candidates from union of caption and
scene text pixels

87
candidates, the proposed method proposes boundary growing which extracts edge
components from Sobel edge image of the input frame corresponding to potential text
candidates in Figure 5.6(d) as shown in Figure 5.7(a) where edge components for
corresponding potential text candidates can be seen, in Figure 5.6(d). Next, the
boundary growing method fixes bounding boxes for the edge component as shown in
Figure 5.7(b) where rectangular boxes are shown. It expands boundary towards
outward gradient direction of pixel of the edge component pixel by pixel in Sobel edge
image of the input frame until it reaches nearest neighbor components based on nearest
neighbor criterion as shown in Figure 5.7(c)-(f) where boundary of the potential
candidates are expanded until it finds nearest neighbor component. This process
continues till it reaches end of the text line as shown in Figure 5.7(g) where it can be
seen full text line is covered. Finally, the boundary growing method extracts text from
the input frame corresponding to the results in Figure 5.7(g) as shown in Figure 5.7(h)
where it is seen full text lines of both caption and scene text. This growing works well
because of the fact that the space between the characters is lesser than the space
between words and the text lines as it is stated in (Palaiahnakote Shivakumara et al.,
2014).

88
5.3 Experimental Results and Discussion
In order to show superiority to existing methods, state-of-the-art methods of
different categories are implemented, such as the methods of natural scene images,
video with temporal and without temporal frames, video with horizontal text and non-
horizontal texts, etc. For example, the work in (Epshtein et al., 2010), which is the
state-of-the-art method, proposes a stroke width transform for text detection in natural
scene images, and it is considered as a benchmark method. Liu et al. (C. Liu et al.,
2005) proposed texture features for text detection in both video and natural scene
images. Shivakumara et al. (P. Shivakumara et al., 2010) used the combination of
(g) (h)
Figure 5.7: Boundary Growing to detect full multi-oriented text
lines: (a) Restored edge components from Sobel edge image of the
input frame corresponding to potential text candidates, (b) Boundary
fixing for edge components, (c)-(g) intermediate results of boundary
growing towards outward direction of pixels of edge components, (g)
is final growing results and (h) is text extraction results.
(e) (f)
(c) (d)
(a) (b)

89
Fourier and color for detecting text in both images and video without temporal
information. Shivakumara et al. (Palaiahnakote Shivakumara et al., 2012) explored a
Bayesian classifier for text detection in video without temporal information. Khare et
al. (Khare et al., 2015) used a HOM descriptor for detecting text in video using
temporal information. Yin et al. (X.-C. Yin et al., 2014) used Maximally Stable
Extremal Regions (MSERs) as character candidates and the strategy of minimizing
regularized variations for text detection in natural scene images. It is robust to multi-
orientations, multi-fonts and multi-size text. Mi et al. (Congjie et al., 2005) used
multiple frames for text detection with temporal frames. Huang, (X. Huang, 2011) used
motion vectors for detecting text in video with temporal information. Zhao et al. (Z. Xu
et al., 2011) used dense corners and optical flow properties for text detection in video
with temporal information. Note: For the methods which do not use temporal frames,
such as natural scene text detection methods and a few video text detection methods,
key frames are extracted from each video to give inputs for the methods. And for
tracking results on ICDAR 2015 video data, word is detected over individual frame by
the text detection methods and added to track system to track the text as per instructions
in (Karatzas et al., 2015).
5.3.1 Datasets
To evaluate the performance of the proposed method, experiments are conducted on
standard datasets, namely, ICDAR 2013 (Karatzas et al., 2013), YVT (Nguyen, Wang,
& Belongie, 2014), ICDAR 2015 (Karatzas et al., 2015) videos. Author‟s dataset of
100 video of 1 to 6 seconds is also created that contains arbitrary-oriented any multi-
script text. This dataset has been created to test the proposed method multi-lingual text
detection ability because there is no standard dataset available publicly and the above
mentioned standard datasets do not contain much different script text lines. ICDAR
2013 and ICDAR 2015 video usually contain lots variations in fonts, contrast, font

90
sizes and background variations. YVT data contains only scene text that includes
variety of background, such as building, greenery, sky etc. Author‟s data includes
arbitrarily oriented text lines of different scripts with background variations. In
summary, all datasets are collected to test the generic property of the proposed method.
5.3.2 Description Measures
The proposed method uses standard measures proposed in (Karatzas et al., 2013)
and discussed in section 3.4.2 for calculating recall (R), precision (P) and f-measure (F)
for ICDAR 2013 and YVT video datasets, while for ICDAR 2015 video data the
proposed method uses the measures used in (Karatzas et al., 2015) where it suggests the
same formula as in (Karatzas et al., 2013) discussed in section 3.4.2 of this thesis. In
addition to this tracking measures are also considered. The definitions are as follows.
Multiple Object Tracking Precision (MOTP), which expresses how well locations of
words are estimated, and the Multiple Object Tracking Accuracy (MOTA), which
shows how many mistakes the tracker system made in terms of false negatives, false
positives, and ID mismatches. On the other hand, the Average Tracking Accuracy
(ATA) provides a spatio-temporal measure that penalizes fragmentations while
accounting for the number of words correctly detected and tracked, false negatives, and
false positives.
Given a video sequence an ideal text tracking method should be able to detect all
text words present at every frame and estimate their bounding boxes precisely;
additionally it should also keep consistent track of each word over time, by assigning a
unique ID which stays constant throughout the sequence (even after temporary
occlusion, etc). For every time frame t a text tracking system outputs a set of
hypotheses },.....,{ 1
t
n
t hh for a set of words in the ground-truth },.......,{ 1
t
m
t ww . Those
frame level objects can be grouped by their unique identifiers into sequence level

91
hypotheses },.....,{ 1 pHH and ground-truth words },.....{ 1 qWW (that typically span
more than one frame). For a distinctive notation it is referred as t
iH and t
iW to the
frame level objects at frame t in iH and iW respectively.
The evaluation procedure is based on a mapping list of word-hypothesis
correspondences. At the frame level it has a mapping tM for each frame t in the video
sequence made up with the set of pairs ),( t
j
t
i hw for which the sum of overlap ),( t
j
t
i hw
is maximized, where overlap is a function overlap ),( t
j
t
i hw = )(
)(
t
j
t
i
t
j
t
i
hwa
hwa
of the
intersection area )( a of their bounding boxes. Additionally, a pair ),( t
j
t
i hw is
considered a valid correspondence iff overlap 5.0),( t
j
t
i hw . At the sequence level it
has a unique mapping M of word hypothesis correspondences ),( ji HW combinations.
The two CLEAR-MOT metrics are calculated using the frame level mappings as:
t t
ti
i
t
c
oMOTP
, (5.6)
where i
to refers to the overlapping ratio of the ith correspondence in the mapping
tM and tc is the number of correspondences in tM ; and:
t t
t ttt
g
swidfpfnMOTA
)_(1 (5.7)
Where ,_,, ttt swidfpfn and tg refer respectively to the number of false negatives,
false positives, ID switches, and ground-truth words at frame t. The Sequence Track

92
Detection Accuracy (STDA) is calculated by means of the sequence level mapping M
as:
M
ii
N
i HW
t
t
i
t
i
N
HWmSTDA
1
),(
(5.8)
Where MN is the number of correspondences in M,
ii HWN is the number of
frames where either iW or iH exist, and ),( t
i
t
i HWm takes a value of 1 iff overlap
5.0),( t
i
t
i HW or 0 otherwise. The STDA is a measure of the tracking performance
over all of the objects in the sequence and thus can take a maximum value of WN ,
which is the number of ground-truth words in the sequence. The Average Tracking
Accuracy (ATA), which is the normalized STDA per object, is defined as:
2
Hw NN
STDAATA
More information can be found in (Karatzas et al., 2015). For authors data, same
definitions as in (Karatzas et al., 2013) is used at line level but not word level. The
main reason to calculate measures at line level is that fixing bounding box for the word
of arbitrarily-oriented text is hard. Besides, for different script text lines, spacing
between the words is not consistent as in English to segment words accurately.
Therefore, recall, precision and f-measure are calculated for the lines as it is common
practice for video text detection (Qixiang Ye & Doermann, 2015). Since the ground
truth is available for all standard data, ICDAR 2015, ICDAR 2013 and YVT video data
at word level, the proposed method use the same ground truth for calculating measures
and for authors datasets measures are calculated at human level.

93
5.3.3 Analysing the Contributions of Dynamic Window Size and Deviation Steps
The proposed method involves two key steps for text detection of arbitrarily-
oriented multi-lingual text in video. It proposes a method for finding automatic window
based on stroke width distances of the common edge components in Sobel and Canny
edge image of the input frame. The same steps also help in identifying candidate text
pixels. Another, an iterative procedure for the deviation values to the candidate text
pixel for separating caption text from scene and background pixels, which in turn
results in text candidates of both caption and scene text, and to determine the number of
frames. Therefore, in order to know the effect of each step, the proposed method
conduct experiments on different combinations of these two steps by calculating recall,
precision and F-measures. For this experiment, the proposed method uses authors
dataset which includes English and multi-script text lines of different orientations, as
discussed in the above section. The reason for only using authors data is that it is more
complex than standard video datasets. The combinations of these two steps are (1) With
Automatic Window (AW) and Without Deviation (D). In this step, the proposed
method deploys the step of automatic window selection and the proposed method
calculates the average of the moments for each sliding window over 10 frames without
using an iterative procedure proposed in section 5.3.2. This results in a moment‟s
matrix with the same dimensions of the input frame. Then, it applies k-means clustering
with k=2 for identifying text candidates. In other words, for this experiment, the
proposed method does not use an iterative procedure by calculating deviation values
between the first frame and successive frames. (2) Without Automatic Window and
With Deviation, where the proposed method does not use the step of automatic window
selection, it fixes an 8×8 window and it uses an iterative procedure for text candidate
detection. (3) Without Automatic Window and Without Deviation, where the proposed
method does not use both the steps. (4) With Automatic Window and With Deviation,

94
where the proposed method uses both the steps for calculation. The effect of these
experiments is shown in Fig. 8, where one can notice that for input Figure 5.8(a), with
automatic window and with deviation, this gives better results than other combinations
as shown in Figure 5.8 (e). If the effect of the other three combinations are compared,
without automatic window and with deviation gives better results than with automatic
window and without deviation, and without automatic window and without deviation as
shown in Figure 5.8 (c). It is observed from Figure 5.8(b)-(e) that with automatic
window detects the big font “GIVI” and the same text is missed without the automatic
window. In the same way, Figure 5.8 (b)-(e) show that with the use of deviation, it
detects almost all text lines other than the big font, while without using the deviation,
text lines are missed. Therefore, it can be concluded that the automatic window
selection steps helps in detecting multi-fonts and multi-size texts while the iterative
procedure for deviation helps in detecting texts without missing any. Overall, these two
steps help to improve the performance of the proposed method. Experimental results
are reported in Table 5.1 for the different combinations from which same conclusion
can be drawn.

95
Table 5.1: Performance of the proposed method for different combinations of
Automatic Window (AW) and Deviation (D)
Meas
ures
With DW and
without
Deviation
Without DW
and with
Deviation
Without DW
and without
Deviation
With DW
and with
Deviation
R 55.4 52.7 48.1 65.1
P 57.8 53.8 42.6 66.7
F 56.6 53.2 45.3 65.9
5.3.4 Experiments on Arbitrarily-Oriented English and Multilingual Video
Sample qualitative results of the proposed and the existing methods for authors
English and Multi-lingual video are shown in Figure 5.9 and Figure 5.10, respectively.
It is noted from Figure 5.9 and Figure 5.10 that the proposed method detects almost all
text and it is better than the existing methods. Figure 5.9 includes sample scripts of
Telugu which is a south Indian language of Andhra Pradesh state, Bangla which is the
language of West Bengal state of India, as well as Chinese and Arabic, respectively. It
can be observed from the frames of different scripts that each script has its own
structure with different styles, fonts and shapes. This makes the problem more
challenging for the method, which does not have the ability to handle multi-lingual
(c) Without DW (d) Without DW (e) With DW
and with Deviation and without Deviation and with Deviation
Figure 5.8: Sample results for different combinations of automatic
window selection and deviation for frames selection. AW denotes Automatic
Window and D denote Deviation.
(a) Input frame (b) With DW and without Deviation

96
script text lines compared to English texts. The main cause for getting poor accuracy
from the existing methods is that those methods do not have the ability to handle
arbitrarily-oriented text and multi-lingual text in video. As a result, the existing
methods miss some texts. It is evident from the quantitative results of the proposed and
existing methods for English video and Multi-lingual video reported in Table 5.2, the
proposed method gives better precision and F-measure compared to existing methods.
The methods reported in (Khare et al., 2015; Palaiahnakote Shivakumara et al., 2012;
P. Shivakumara et al., 2010; X.-C. Yin et al., 2014) score close to the proposed
method‟s results because these methods are robust to non-horizontal orientations and to
the extent of multi-lingual script text lines compared to other methods. Table 5.2 shows
that the proposed methods score lower results for Multi-lingual video compared to
English video including the proposed method. This shows that text detection in multi-
lingual video is difficult compared to English video.

97
Methods Arbitrarily-Oriented Data
Figure 5.9: Sample results of the proposed and existing methods on
an arbitrarily-oriented video dataset
(Epshtein et
al., 2010)
(C. Liu et al.,
2005)
(P.
Shivakumara
et al., 2010)
(Palaiahnakot
e
Shivakumara
et al., 2012)
(Z. Xu et al.,
2011)
(X. Huang,
2011)
(Congjie et
al., 2005)
(Khare et al.,
2015)
(X.-C. Yin et
al., 2014)
Proposed

98
Methods Multilingual Data
Figure 5.10: Sample results of the proposed and existing methods on
Author’s multilingual dataset
(Epshtein et
al., 2010)
(C. Liu et al.,
2005)
(P.
Shivakumara
et al., 2010)
(Palaiahnako
te
Shivakumara
et al., 2012)
(Z. Xu et al.,
2011)
(X. Huang,
2011)
(Congjie et
al., 2005)
(Khare et al.,
2015)
(X.-C. Yin et
al., 2014)
Proposed

99
Table 5.2: Text detection results of the proposed and existing methods for
Author’s English and Multi-Lingual Video datasets
Methods
Video with English
Texts
Multi-Lingual
Videos
R P F R P F
(Epshtein et al., 2010) 58.23 51.17 54.99 20.53 22.9 21.68
(C. Liu et al., 2005) 36.3 34.7 35.48 26.9 23.44 25.1
(P. Shivakumara et al., 2010) 38.12 62.32 47.30 31.2 29.9 30.92
(Palaiahnakote Shivakumara et al.,
2012) 65.1 42.62 51.51 35.41 32.5 33.92
(Z. Xu et al., 2011) 61.49 57.3 59.33 32.4 31.52 31.96
(X. Huang, 2011) 49.3 46.9 48.07 33.6 41.7 32.63
(Congjie et al., 2005) 49.1 49.9 49.41 46.4 46.17 46.31
(Khare et al., 2015) 53.9 52.7 53.29 48.4 49.3 48.84
(X.-C. Yin et al., 2014) 52.4 64.3 57.9 54.7 50.31 52.4
Proposed Method 65.12 66.7 65.9 52.3 53.4 52.8
5.3.5 Experiments on Standard ICDAR 2013, YVT and ICDAR 2015 Videos
Sample qualitative results of the proposed and existing methods for ICDAR 2013, YVT
and ICDAR 2015 video are shown in Figure 5.11-Figure 5.13, respectively, where it
can be noted that the proposed method detects almost all text lines in the video frames.
The quantitative result of the proposed and existing methods for ICDAR 2013, YVT
and ICDAR 2015 video data are reported in Table 5.3 and Table 5.4, respectively.
Table 5.3 shows that the proposed method is better than existing methods for both
ICDAR 2013 and YVT video. The reason for poor results of the existing method is that
the YVT dataset comprises complex backgrounds while the ICDAR comprise low
contrast text with background variations. In addition, the ICDAR datasets contain a few
European script text lines but the YVT data contains English and Chinese. Table 5.3
shows that Shivakumara et al. (P. Shivakumara et al., 2010), Yin et al. (X.-C. Yin et al.,
2014) and Khare et al. (Khare et al., 2015) score results close to the proposed method‟s
results because these methods are robust to contrast variations and multi-font and text
size. Epshtein et al. (Epshtein et al., 2010) developed a method for text detection in
natural scene images but not video images. Liu et al. (C. Liu et al., 2005) method is

100
sensitive to orientations as it was developed for horizontal direction text images.
Shivakumara et al. (Palaiahnakote Shivakumara et al., 2012) requires proper samples to
train the Bayesian classifier. The methods described in (Congjie et al., 2005; X. Huang,
2011; Z. Xu et al., 2011) fix the number of temporal frames. On the other hand, the
proposed method has the ability to handle multi-font, multi-size texts, arbitrary
orientations and multi-scripts, and hence it gives better results compared to existing
methods.
For ICDAR 2015 video data, results are reported according to (Karatzas et al., 2015)
where measures are calculated based on tracking results. In the same way, results of the
proposed and existing methods are reported in Table 5.4. It is noted from Table 5.4 that
the proposed method is the best at MOTA while AJOU (Karatzas et al., 2015) is the top
performer at MOTP and Deep2Text is the top performer at ATA. Since the proposed
method is developed to handle arbitrary-oriented-multi-lingual text, it scores slightly
low accuracy for the ICDAR 2015 in terms of MOTP and ATA compared to the best
performer in ICDAR 2015 robust competition. On the other hand, since AJOU,
Deep2Text methods are developed for ICDAR 2015 video data to track the words in
the video, the methods achieves the best results. Since other existing methods are
developed for text detection but not tracking the text in video, the methods scores low
results compared to the proposed methods and top performers in ICDAR 2015 robust
competition.
In summary, the proposed steps in Section 5.3.1 which automatically estimates the
window size for identifying candidate text pixels, followed by Section 5.3.2 which
identifies static and dynamic text by estimating number of frames to be utilized and
then Section 5.3.3 which identifies potential text candidates and detect text line using
boundary growing are invariant to rotation, scaling and scripts. Therefore, the objective
of the work is achieved.

101
Figure 5.11: Sample results of the proposed and existing methods
on ICDAR2013 video dataset
Methods ICDAR 2013 Video
(Epshtein et
al., 2010)
(C. Liu et al.,
2005)
(P.
Shivakumara
et al., 2010)
(Palaiahnakote
Shivakumara
et al., 2012)
(Z. Xu et al.,
2011)
(X. Huang,
2011)
(Congjie et al.,
2005)
(Khare et al.,
2015)
(X.-C. Yin et
al., 2014)
Proposed

102
Figure 5.12: Sample results of the proposed and existing methods on
YVT video dataset
Methods YVT Video
(Epshtein,
Ofek, &
Wexler, 2010)
(C. Liu et al.,
2005)
(P.
Shivakumara et
al., 2010)
(Palaiahnakote
Shivakumara et
al., 2012)
(Z. Xu et al.,
2011)
(X. Huang,
2011)
(Congjie et al.,
2005)
(Khare,
Shivakumara,
& Raveendran,
2015)
(X.-C. Yin,
Yin, Huang, &
Hao, 2014)
Proposed

103
Figure 5.13: Sample results of the proposed and existing
methods on ICDAR2015 video dataset
Methods ICDAR 2015 Video
(Epshtein et
al., 2010)
(C. Liu et al.,
2005)
(P.
Shivakumara
et al., 2010)
(Palaiahnakote
Shivakumara
et al., 2012)
(Z. Xu et al.,
2011)
(X. Huang,
2011)
(Congjie et al.,
2005)
(Khare et al.,
2015)
(X.-C. Yin et
al., 2014)
Proposed

104
Table 5.3: Text detection results for standard ICDAR 2013 and YVT videos
Methods ICDAR2013 YVT
R P F R P F
(Epshtein et al., 2010) 32.53 39.80 35.94 40.56 46.22 43.35
(C. Liu et al., 2005) 38.91 44.60 41.62 33.73 42.35 39.09
(P. Shivakumara et al., 2010) 50.10 51.10 50.59 56.68 54.38 55.43
(Palaiahnakote Shivakumara et al.,
2012) 53.71 51.15 50.67 54.53 50.34 52.71
(Z. Xu et al., 2011) 46.30 47.02 46.65 51.6 47.96 49.73
(X. Huang, 2011) 32.35 32.50 32.42 43.73 44.92 44.31
(Congjie et al., 2005) 40.30 26.92 32.76 40.86 38.1 49.84
(Khare et al., 2015) 47.6 41.4 44.3 55.2 52.71 53.93
(X.-C. Yin et al., 2014) 54.73 48.62 51.56 57.35 51.7 54.43
Proposed Method 55.9 57.91 51.7 57.9 52.6 55.16
Table 5.4: Text detection results for standard ICDAR 2015 videos
Methods ICDAR 2015
MOTP MOTA ATA
(Epshtein et al., 2010) 43.4 37.75 35.28
(C. Liu et al., 2005) 42.99 36.95 34.8
(P. Shivakumara et al., 2010) 70.22 49.73 39.37
(Palaiahnakote Shivakumara et al., 2012) 71.7 32.3 41.29
(Z. Xu et al., 2011) 64.61 45.93 34.36
(X. Huang, 2011) 44.3 36.62 34.5
(Congjie et al., 2005) 52.86 29.48 32.37
(Khare et al., 2015) 72.46 59.89 40.1
(X.-C. Yin et al., 2014) 73.51 50.47 41.26
AJOU (Karatzas et al., 2015) 73.25 53.45 38.77
Deep2Text-I (Karatzas et al., 2015) 71.01 40.77 45.18
Proposed Method 73.16 52.93 43.02
5.4 Summary
In this work, a new method for arbitrarily-oriented-multi-lingual text detection in
video based on moments and gradient directions is proposed. The proposed method
introduces a new idea for finding automatic window based on commons stroke width of
Sobel and Canny edge images of input frame. The same step helps in identifying
candidate text pixels. Then the proposed method explores temporal information for text
candidate detection by introducing an iterative procedure based on deviation between
consecutive frames along with k-means clustering. It also finds solution to decide the

105
number of temporal frames for identifying text candidates. Furthermore, the gradient
inward and outward directions of pixels of edge components are used for eliminating
false text candidates, which results in potential text candidates. The boundary growing
is proposed for potential text candidates to extract full text line using Sobel edge image
based on nearest neighbor criterion. Experimental results on different standard datasets
show that the proposed method outperforms the existing methods. Besides, the
experimental result shows that the proposed method is independent of orientation,
scripts, data, and fonts. However, Stroke width information is used here which is
required for estimating the window size in this work and it is a known fact that edge
and stroke width information degrades in presence of blur and other type of distortion.
The performance of the proposed method may get affected in the presence of blurred
text which is common in the case of videos.

106
CHAPTER 6: A BLIND DECONVOLUTION METHOD FOR TEXT
DETECTION AND RECOGNITION
In previous chapter, there is one common problem is that the performance of the
methods degrades when video affected by blur. This chapter presents a combine quality
metrics for estimating degree of blur in the video/image. Then the proposed method
introduces blind deconvoution model, kernel based energy minimization which
enhances the edge intensity by suppressing blur pixels.
6.1 Introduction
It is observed from the literature (Cao, Ren, Zuo, Guo, & Foroosh, 2015) on text
detection and recognition that distortion due to motion blur is a major issue among all
other artifacts because blur interferes with the structure of the components which in
turn changes the shape of the components. It is known that usually text detection and
recognition methods directly or indirectly use the structure of the components for
achieving good results. Therefore, the same methods fail to give satisfactory results
when blur exist in the video/image. It is evident from the paper (Palaiahnakote
Shivakumara et al., 2015) that blur is the main cause to get poor accuracy of the
methods because edge or gradient-based methods are sensitive to blur and distortions.
This problem can be solved in two ways: (1) developing a method which can withstand
causes given by blur artifact and (2) developing a method for deblurring the blur image
to restore the structure of the components. In this work, the second approach is selected
because developing a method which is invariant to blur is challenging (Cao et al.,
2015). Therefore, it can be asserted that there is a need for developing a method for
deblurring the blurred image for improving the performance of the text detection and
recognition methods in a real-time environment.

107
One such example is illustrated in Figure 6.1 where it can be observed from Figure
6.1 (a) that a text detection method fails to detect text in a blurred image while the same
method detects text in a deblurred image. However, for binarization, the text detection
methods are manually tuned to detect a full text line in the blurred frame as shown in
Figure 6.1(b) to validate the binarization method. Despite the fact that a, full text line
is input to the binarization methods, they fail to preserve the shape of the characters in
the blurred text, whereas for the text in the deblurred frame, the binarization method
preserves the shape of the characters as shown in Figure 6.1(c). Therefore, the same
conclusions can be drawn from the results in Figure 6.1 (b)-(d) that Optical Character
Recognizer (OCR) gives poor results for blurred text and gives good results for
deblurred text. For illustration purposes, as shown in Figure 6.1, the method by Kumar
et al. (Kumar et al., 2014) is used for deblurring which explores geometrical moments.
For text detection, the method proposed in (P. Shivakumara et al., 2010) is used, which
explores the combination of color and Fourier along with boundary growing for both
graphics and scene text detection in video. For binarization, Otsu (Otsu, 1975) method
is used as it is a popular global thresholding technique. The recognition results are
shown in Figure 6.1 obtained by Tesseract OCR which is available publicly
(Tesseract).

108
6.2 Proposed Method
Generally, natural scene video consists of a large number of text and non-text
frames. While capturing videos, it is obvious that several frames get affected by blur
due to the object or camera motion. As a result, text detection and recognition methods
may not give successful results. For the proposed work, video or images affected by
blur are input to enhance the performance of the text detection and recognition
methods. Since the main goal of this work is to improve text detection and recognition
methods for blurred images, the proposed method considers the images with uniform
blur and thus consider addressing non-uniform blur as beyond the scope of this work.
To solve this problem, first system needs to classify the blurred frames from the pool of
video frames. The proposed method explores quality assessment metrics in a different
way to classify blurred frames from non-blurred frames. The classified blurred frames
are passed to the proposed deblurring model to restore fine information such that text
detection and recognition methods give successful results. The proposed deblurring
model is derived based on Gaussian weighted GW- L1 norm and kernel based energy
- EUROLDMA
(d) Recognition results by OCR (Tesseract) for respective binary text lines in (c)
Figure 6.1: Illustrating text detection and recognition for blurred and
deblurred frames
(b) Text line detected by (P. Shivakumara et al., 2010) the text detection method in (a)
(c) Binarization results for the text line images in (b) by the method (Otsu, 1975)
(a) Text detection for a blurred image and a deblurred image by (Kumar et al., 2014)

109
minimization. Furthermore, experiments on text detection and recognition by several
methods are provided to show the usefulness and effectiveness of the deblurring model.
The flow diagram of the proposed method can be seen in Figure 6.2.
6.2.1 Classification of Blur and Non-Blur Frame in Video
For the given video or images with blur artifacts, quality assessment metrics as blur
metrics are explored to classify blurred frames/images from non-blurred frames/images
based on the fact that the frame loses quality due to blur artifacts. It is true that blur-
affected text may not be readable. Therefore, the proposed method combines quality
metrics for the input frame to estimate degrees of blur in the frame. Since the given
video does not provide reference or ideal frames, the proposed method estimate the
degree of blur automatically using the following quality metrics. Inspired by the
metrics proposed for measuring the quality of the image without a reference image
(Blanchet & Moisan, 2012; Blanchet, Moisan, & Rougé, 2008; Mittal, Moorthy, &
Bovik, 2011; Mittal, Soundararajan, & Bovik, 2013), the proposed method proposes the
same metrics for estimating degree of blur in the video text frame.
(i) BRISQUE (Mittal et al., 2011) (Blind/Reference less Image Spatial Quality
Evaluator): BRISQUE extracts the point wise statistics of local normalized luminance
Video
Frame
Text Detection
and Recognition
output
Kernel
Estimation
Image
Estimation
Pass
Figure 6.2: Proposed Methodology framework
Quality
Assessment
Fail
Restoration using GW-L1 norm

110
signals and measures image naturalness based on the measured deviations from a
natural image model.
(ii) NR IQA (Mittal et al., 2013) (blind/No-Reference (NR) Image Quality
Assessment (IQA)): It is a model that operates in the spatial domain. BRISQUE does
not compute distortion-specific features, such as ringing, blur, or blocking, but instead
uses scene information of locally normalized luminance coefficients to quantify
possible losses of “naturalness” in the image due to the presence of distortions. NR
IQA is based on the principle that natural images possess certain regular statistical
properties that are measurably modified by the presence of distortions.
(iii) GPC (Blanchet et al., 2008)(Global Phase Coherence): GPC of an image is
computed by comparing the likelihood of the image to the likelihood of all possible
images sharing the same Fourier power spectrum. The likelihood is measured by the
total variation (Rudin-Osher-Fatemi implicit prior), and the numerical estimation is
realized by a Monte-Carlo simulation.
(iv) SI (Blanchet & Moisan, 2012) (Sharpness Index): SI is closely related to the
GPC difference, which uses Gaussian random fields instead of random phase images.
BRISQUE measures the naturalness of video frames; with NRIQA are able to
measure the quality even though the frame is degraded by various artifacts. GPC
assesses the phase shift occurrence over the frame, whereas SI uses the same
methodology to measure the Gaussian random field.
The proposed method estimates the above metrics and aggregates them to obtain a
single value as a quality assessment (QA) score for classifying blurred or non-blurred
frames as follows. Since the scales of metrics varies from one metric to another i.e. as
BRISQUE is 0-100, NRIQA is 0-100, GPC is 0-10 and SI also 0-10, values are

111
normalized to the same scale to avoid loss of information. Then the proposed model
aggregates the normalized values as defined in equation (1), where smaller values
represent good quality images and higher values represent bad quality images. Let
,,, be the scores received from BRISQUE, NR IQA, GPC and SI respectively.
QA can be calculated as
nQA / (6.1)
where n is the number of quality measures considered, in the proposed work n is 4.
In order to automatically classify and to set a threshold value for classification, 100
frames are chosen randomly from the databases which include 50 non-blurred frames
and 50 blurred-frames. Sample non-blurred and blurred frames with QA scores are
shown in Figure 6.3 where it can be noticed that since the first two frames (Figure
6.3(a) and (b)) are not affected by blur, the QA score is low. It is observed from frames
with QA scores in Figure 6.3(c)-(j) that as blur increases, the QA score increases. It is
also observed from Figure 6.3(a)-(j) that a text detection response given by the method
(Cao et al., 2015) is good for the first two frames and it becomes worse as blur
increases. Based on this observation, the proposed method sets a QA score of 25.5 as a
threshold to classify blurred frames from the non-blurred frames. In other words, if the
QA of the input frame is more than 25.5, it is classified as a blurred frame otherwise it
is classified as non-blurred frame.

112
Overall, it is observed from the above analysis that the proposed Quality Assessment
(QA) of classification of blurred and non-blurred frames is robust to different degrees
of blur on a variety of images such as different types of video and natural scene images.
This is because the QA is obtained by aggregating four well known metrics, which are
proposed for estimating the quality of the images that are caused by different degrees of
blur and distortion. For example, BRISQUE measures the naturalness of video frames,
NRIQA is able to measure the quality even though the frame is degraded by various
artifacts, and GPC assesses the phase shift occurrence over the frame, whereas SI uses
the same methodology to measure the Gaussian random field. Since the proposed QA is
an aggregation of the above-mentioned four (different) metrics, the classification of
blurred and non-blurred images is robust to some extent.
6.2.2 Blind Deconvolutional Model
The method presented in the previous section classified blurred frames from the set
of non-blurred frames in video or images. For this section, a blurred image is input for
deriving a deblur model as follows. A classical image deblurring problem (Tang, Gong,
Li, & Wang, 2014) is formulated as:
(a) 8.51 (b) 15.58 (c) 25.14 (d) 34.69 (e) 45.81
(f) 55.28 (g) 68.77 (h) 74.08 (i) 83.51 (j) 91.09
Figure 6.3: Sample images with various degree of blur with their text
detection response

113
),(),(),( yxfyxkyxg (6.2)
where, ),( yxg
is the blurred text image, ),( yxk
is the system kernel and ),( yxf is
the original text image. There are many popular models for restoring an image that
make use of the L0 norm, L1 norm and L2 norm in the literature. For example, (J. Pan
et al., 2014) proposed a model for deblurring text images by exploring the L0 norm
with the gradient, where the regularizer parameter for L0 norm is0
0),( yxf , which
generates the kernel for deblurring. (Y. Wang et al., 2008) proposed an L1 norm-based
model for deblurring where the regularized parameter for the L1 norm is 1
1),( yxf for
deriving the kernel. (Cao et al., 2015) proposed an L2 norm-based model for
deblurring, where the regularizer parameter for the L2 norm is 2
2),( yxf for estimating
the blurring kernel. The above state-of-the-art methods are not effective for the images
which have low contrast and low illumination scenes. Therefore, in this work, the
proposed method estimate the kernel by exploring an alternative minimization (AM)
approach (Yun & Woo, 2011) to overcome the above problems. Here, the algorithm
minimizes the energy function by alternating between the image and the kernel, till the
final estimates ),(^
yxf and ),(^
yxk are obtained. This algorithm considers blurred
frames as input and a delta function which is the initial point of the kernel i.e. 1 at the
centre and 0 elsewhere are used as initial inputs for the optimization process through an
alternating minimization approach. This section formulates the use of the proposed
Gaussian weighted L1 norm in the AM algorithm. Here, first the modified energy
function will be discussed, followed by the formulation of partial differential equations
used for obtaining the estimates of the image and kernel.

114
6.2.2.1 Kernel estimation
Inspired by the work presented in (J. Pan et al., 2014; Y. Wang et al., 2008) for
deblurring text images where it proposed an automatic way to estimate the size of the
kernel using an efficient minimization method, the proposed method explores the same
approach to estimate the size of the kernel for blur present in video frames with a
modified L1 regularizer that uses the Gaussian function as weights. The kernel, which
is to be a smaller size of the image, is estimated using an energy minimization function
as follows.
dxdyyxkwRdxdyyxgyxfyxkyxkE )),(()),(),(*),(()),((
^2
^^
(6.3)
where is the image domain. The main task of restoration is to minimize this
energy by obtaining an estimate of the kernel ),(^
yxk such that ),(*),(^
yxfyxk
approximates ),( yxg
in a least square sense. Here, is the regularization parameter
with operator R chosen as the Gaussian weighted (w) L1 norm. These two parameters
help us to preserve the edges by removing blur in the images. The λ is required to
control the trade-off between data fidelity and the regularizer as defined in equation
(6.3). Motivated by the work proposed in (Hansen, 1992) for ill-posed problems by
means of the L-Curve method, the proposed method follows the same strategy for
deriving values for λ in this work. The value of λ is 0.27, which is determined based on
an experimental analysis in this work. w is the weight and is considered as the Gaussian
kernel with a variance of 0.4, which is applied over the L1 norm in gradient space to
increase the sharpness of the edges. It works based on the fact that pixels around the
edges behave like a Gaussian due to the transition from background to foreground and
vice versa (Yun & Woo, 2011).
Data Regular

115
In summary, both λ and w together help to brighten images where there are edges
with the R operator. This results in the removal of blur from the image. The whole
process is called Gaussian-weighted L1 norm for deblurring in this work, in which λ is
the regularization parameter and w is the weight. The selection of λ and w is crucial for
deblurring. The different value of λ and w create an impact over an image, this impact
can be analyze by the quality of images. For illustration quality of an image with
different range of λ and w is shown in Figure 6.4. It can also be observed from the
Figure 6.4 that for λ=0.27 and w=0.4, the quality score is coming least that shows the
highest quality of image.
This kernel estimation results in energy minimization taking the following form,
dxdyyxkwdxdyyxgyxfyxkyxkE )),(()),(),(*),(()),((
^2
^^
Figure 6.4: lambda (λ) and weight (w) impact over an image in terms of
quality

116
(6.4)
With Euler-Lagrange the solution to this energy minimization problem can be
obtained as:
)
),,(
),,(.()),(),(*),,((*),(2
),,(^
^^
^
tyxk
tyxkwyxgyxftyxkyxf
t
tyxk
(6.5)
Discretization of Eqation 6.3 leads to the formulation of a partial differential
equation given as,
)
),,(
),,(.()),(),(*),,((*),((2),,()1,,(
^
^^^^
nyxk
nyxkwyxgyxfnyxkyxfnyxknyxk
(6.6)
where n is the iteration number. Hence, by iterating Equation (6.6), an estimate of
the kernel ),(^
yxk will be obtained. Sample kernel estimation and its effect on
deblurring images is illustrated in Figure 6.4 where for the blurred images in Figure
6.4(a)-Figure 6.4(b), kernels of size 15×15 are used for deblurring the images as shown
in Figure 6.4(c)-Figure 6.4(d), respectively. It is noted from Figure 6.4(c) and (d) that
kernel estimation using the above procedure performs well.
The above procedure estimates the kernel automatically according to the degree of
blur in the frames. At the same time, the method needs to determine the size of the
kernel automatically as the kernel changes. It is true that if kernel is chosen of small
size, then there is a possibility of losing global information; conversely if it has large
size, it can lose local information. In order to find an optimal size for the kernel, the

117
proposed method proposes to check QA values by varying the kernel size for the input
frame. It is expected that when the input frame has no blur, the QA must give a low
value according to the quality metrics. Therefore, the proposed model considers the
kernel size for which the QA gives the lowest score compared to other kernel sizes, as
illustrated in Figure 6.5, for the frame in Figure 6.4(a), where one can see that the QA
gives the lowest score for a kernel of size 15×15. In this way, the proposed model
determines size, as well as the kernel automatically for deblurring the blurred frames.
(c) Deblurred frame with QA= 21.83 (d) Deblurred frame with QA= 13.34
Figure 6.5: Sample blurred frame and corresponding deblurred frame with
the QA score of the proposed method associated with the estimated kernel of
size 15×15.
(a) Blurred Frames with QA= 44.08 (b) Blurred frame with QA= 63.29
Kernel Kernel
Kernel Size
Figure 6.6: Kernel size Vs. Image quality
I
m
a
g
e
Q
u
a
l
i
ty
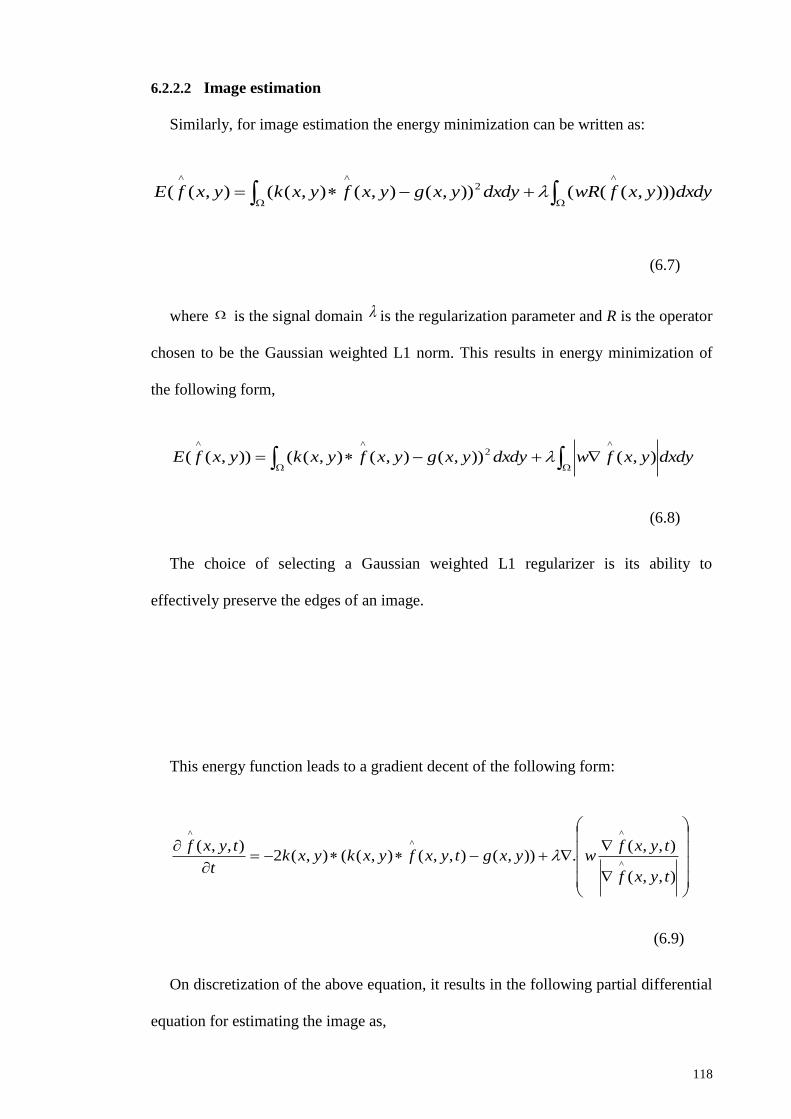
118
6.2.2.2 Image estimation
Similarly, for image estimation the energy minimization can be written as:
dxdyyxfwRdxdyyxgyxfyxkyxfE ))),((()),(),(),((),((
^2
^^
(6.7)
where is the signal domain is the regularization parameter and R is the operator
chosen to be the Gaussian weighted L1 norm. This results in energy minimization of
the following form,
dxdyyxfwdxdyyxgyxfyxkyxfE ),()),(),(),(()),((
^2
^^
(6.8)
The choice of selecting a Gaussian weighted L1 regularizer is its ability to
effectively preserve the edges of an image.
This energy function leads to a gradient decent of the following form:
),,(
),,(.)),(),,(),((),(2
),,(^
^^
^
tyxf
tyxfwyxgtyxfyxkyxk
t
tyxf
(6.9)
On discretization of the above equation, it results in the following partial differential
equation for estimating the image as,

119
),,(
),,(.)),(),,(),((),((2),,()1,,(
^
^
^^^
nyx
nyxwyxgnyxfyxkyxknyxfnyxf
f
f
(6.10)
Hence, by iterating equation (10) an estimate of the image ),(^
yxf will be obtained.
The proposed deblurring response is shown in Figure 6.4, where it is noted that the
proposed method restores fine details successfully for blurred images. It is evident from
the QA score that for those blurred images shown in Figure 6.4(a) and Figure 6.4(b) it
is reduced to 21.83 and 13.34 respectively, as shown in Figure 6.4(c) and Figure 6.4(d).
Therefore, it can be concluded that the proposed method is sufficiently satisfactory to
preserve the edge intensities which are essential for improving text detection and
recognition performance.
6.3 Experimental Results and Discussion
The experiment for the proposed model is carried out on PC with the system Intel®
Core™ i7-3517U CPU @1.90GHz, 2.40 GHz, 8GB RAM, 64 bit OS (Windows 7).
Since there is no standard blurred data for video text detection and recognition in video,
authors dataset has been created, consisting 30 videos, 15-20 seconds long results in
approximately 11400 frames. In order to test effectiveness of the proposed method,
standard databases are considered, namely, ICDAR 2015 (Karatzas et al., 2015) which
has 24 videos, 12-15 seconds long, results in 10,800 frames, ICDAR 2013 videos
(Karatzas et al., 2013) which has 15 videos, 10-15 seconds long, results in 7000 frames,
YVT (Nguyen et al., 2014) videos which has 30 videos, 12-16 seconds long, results in
13,500 frames. For natural scene databases, namely, ICDAR 2013 (Karatzas et al.,
2013) which has 462 images, SVT (Kai Wang & Belongie, 2010) which has 350 and

120
MSRA-TD500 (Yao, Bai, Liu, Ma, & Tu, 2012) which has 500 images. In total,
42,700 video frames and 1312 scene images for evaluating the proposed method in this
work.
Details of ICDAR 2015, ICDAR 2013 and YVT datasets are discussed in section
3.4.1. The ICDAR 2013 scene images include high resolution, complex backgrounds
with mostly horizontal texts. The SVT dataset focuses on street view images where one
can see complex backgrounds with lots of greenery and buildings. In this dataset, most
of the text present in horizontal direction. The MSRA-TD 500 dataset covers a variety
of scene text recorded in indoor and outdoor environments and the text is in multi-
oriented directions. The main intention to choose the above diverse data is to
demonstrate that the proposed method is sufficiently generic and effective in different
situations.
6.3.1 Experiments on Blur Frame Classification
For this experiment, the proposed method examined each frame of the video and
scene datasets considered to evaluate the proposed classification method. In total,
15805 blurred frames from video, 174 blurred images from scene data and 26895 good
frames from video, 1138 images from scene data were employed. The proposed method
uses the classification rate for measuring the performance of the proposed classification
method. Sample qualitative results of the proposed method are shown in Figure 6.7
where it can be observe that the proposed method classifies blurred and non-blurred
frames successfully.

121
The quantitative results for authors video data, standard video data and scene image
data in the form of a confusion matrix for the classification rates are reported in Table
6.1-Table 6.3, respectively. To determine the effect of normalization of scales of
different metrics compared to the actual scale of the metrics, the proposed method
calculated the classification rate through a confusion matrix using an actual scale range
on three datasets as reported in Table 6.1-Table 6.3, respectively. Table 6.1-Table 6.3
show that the classification rate of actual scale range scores provide a low accuracy
compared to the normalized scale range for all three datasets due to loss of information
caused by different scales. This shows that normalized score is better than the actual
scale range. Therefore, it can be concluded from Table 6.1-Table 6.3 that the results
provided by the proposed model are encouraging as it produces a classification rate
greater than 80% rate for all the datasets. Interestingly, the proposed method
demonstrates consistent results despite the fact that the nature of the datasets differ in
terms of resolution and backgrounds.
(a) Blur frame Our dataset (b) Blur frame YVT (c) Blur frame from ICDAR
(d) Blur from SVT (e) Non-blur from ICDAR 2013 (f) Non-blur from MSRA
Figure 6.7: Samples successful results for blur and non-blur classification
by the proposed method

122
Table 6.1: Confusion matrix (classification rate in %) of video frames from
authors video datasets (BF: Blurred Frames; NBF: Non Blurred Frames)
Types Normalized QA Parameters Actual Range QA Parameters
CR for NBF CR for Blurred Frame CR for NBF CR for BF
NBF 88.4 11.6 65.2 34.8
BF 17.4 82.6 26.3 73.7
Table 6.2: Confusion matrix (in %) of video frames from standard video
datasets
Normalized QA Parameters Actual Range QA Parameters
Dat
aset
s
ICDAR2013
video YVT ICDAR2015
video
ICDAR2013
video YVT ICDAR201
5 video
NBF BF NBF BF NBF BF NBF BF NBF BF NBF BF
NB
F 84.1 15.9 82.9 17.0 86.5 13.4 69.4 30.6 78.1 21.9 71.4 28.6
BF 16.5 83.5 21.8 78.2 16.3 83.6 38.7 61.3 35.3 64.7 32.9 67.1
Table 6.3: Confusion matrix (in %) of images from standard scene image
datasets (BI: Blurred Image; NBI: Non-Blurred Image)
Normalized QA Parameters Actual Range QA Parameters
Datasets
ICDAR2013
scene
images
SVT MSRA-
TD500
ICDAR2013
scene
images
SVT MSRA-
TD500
NBI BI NBI BI NBI BI NBI BI NBI BI NBI BI
NBI 92.49 7.51 82.29 17.71 92.8 7.2 76.5 23.5 78.4 21.6 76.1 23.9
BI 12.1 87.9 13.6 86.4 21 79 28.6 71.4 23.8 76.2 31.6 68.4
6.3.2 Experiments on Proposed Deblurring Model
For this experiment, the proposed method uses the response of proposed
classification method (Section 6.3.1 and experiments discussed in section 6.4.1) for
classifying blurred and non-blurred frame/images on the datasets. The classified blurred
images are considered for experiments on deblurring in this section. As a result, the
proposed method have got 9120, 1960, 2025, and 2700, blurred frames respectively
from authors dataset, the ICDAR 2013, YVT and ICDAR 2015 video datasets.

123
Similarly, 33, 22, 119 blurred scene images respectively from the ICDAR 2013, MSRA
and SVT datasets were obtained. In summary, 15805 blurred frames from video and
174 blurred images from scene datasets were extracted. It is noted that blurred frames
available in the video datasets are much higher than the blurred images present in the
scene image datasets because generally video captured by low resolution cameras and
arbitrary camera movements are more numerous as compared to still images captured
with a high resolution camera.
For the purpose of measuring the quality of the deblurred images, the proposed
method uses standard blind measures, namely, BRISQUE (Mittal et al., 2011), NRIQA
(Mittal et al., 2013), GPC (Blanchet et al., 2008), and SI (Blanchet & Moisan, 2012) as
discussed in section 6.3.1. In addition, the proposed method also uses Average
Processing Time (APT) per frame for deblurring each image to evaluate the efficiency
of the proposed method. To validate the usefulness of the proposed method, measures
are calculated before classification, which combined both blurred and non-blurred
images together, and after classification included classified blurred, deblurred by the
deblurring methods and non-blurred images.
To demonstrate the effectiveness of the proposed model in terms of quality
measures, the results of the proposed model is compared with the benchmark
deblurring techniques, namely, the method based on L0 norm proposed by Pan et al. (J.
Pan et al., 2014), which uses L0-regularized intensity and gradient blur for deblurring
text images, and a method based on L2 norm proposed by Cho et al. (Cho et al., 2012)
for text deblurring which takes into account the specific properties of text images.
Wang et al. (Y. Wang et al., 2008) used an L1 regularizer for deblurring, Kumar et al.
(Kumar et al., 2014), used moments for deblurring. The reason for selecting these
methods for a comparative study is that the methods are popular and present as

124
generalized methods with less constraints. Sample qualitative results of the proposed
and existing methods are shown in Figure 6.7 and Figure 6.8. Figure 6.7 (a) gives QA
for ground truth, (b) gives QA for blurred images and (c)-(g) are the result of the
proposed and existing methods respectively. For the blurred image in Figure 6.7(b)
with QA = 66.8, the proposed method gives better results with QA = 18.2 compared to
other existing methods. The QA of Pan et al. is close to the QA of the proposed
method, and as compared to other existing methods. However, the marginal difference
in deblurring plays a vital role for improving the accuracies of the text detection and
recognition methods. To show the effectiveness of the proposed deblurring model, the
proposed method presents deblurring results of the proposed and existing methods for
the frames having different degrees of blurred texts in Figure 6.8 where it can be seen
that the results given by the proposed model appear as highly sharpened images
compared to the results given by the existing methods. Therefore, the proposed model
is useful for enhancing the performance of existing text detection and recognition
methods for blurred frames.
The quantitative results of the proposed and existing methods on blurred images for
deblurring in terms of average quality metric are reported in Table 6.4. Table 6.4 shows
that the values of quality metrics for all the frames (before classification) give higher
values than the deblurred frames after classification. This is valid because data before
classification which involves a larger number of good images with no blur effects and a
small number of blurred images, which is compared to the data after classification
(blurred images). Since the contribution of good images is higher prior to
classification, the metrics give low values. However, the processing time for all the
frames consumes more time compared to the frames after classification because the
deburring algorithm runs on all the frames prior to classification while the deblurring
algorithm runs only on classified deblurred images after classification. The proposed

125
method also test the deblurring model for the non-blurred frame to understand the
behavior of the deblurring models on good quality images, as reported in Table 6.4. It
is noted from Table 6.4 that the quality metric for non-blurred frames (after
classification) scores a low value compared to the deblurred frames (after
classification) and before classification. This is valid because good quality images
without blur effect are the inputs for deblurring methods.
For the original blurred frames, average quality measures were: BRISQUE=63.7524,
NRIQA=19.165, GPC=71.63 and SI=82.922. It can be seen from Table 6.4 that the
proposed method is able to reduce the BRISQUE value lower than the existing
methods, which shows the improvement in naturalness of the frame/image. The
NRIQA measured the values of the proposed method and it demonstrates that blur
artifacts were reduced after deblurring. Similarly GPC and SI values show that the
proposed method is able to reduce the phase shift occurrence and Gaussian random
field, respectively, over the frame/image.
To better visualize the local restoration effect on the edges of a deblurred frame, the
1-D profile is shown, it is a graph between the column index vs. intensity values for the
row over the original image (ground truth) and deblurred images of the proposed and
existing methods as shown in Figure 6.9. Figure 6.9 shows that the proposed method is
closer to the ground truth when compared with other methods for all the four measures.
This shows that the proposed method is better than the existing methods.

126
(d)(Y. Wang et al., 2008)(e)(Kumar et al., 2014)(f) proposed
QA=26.1 QA=21.7 QA=18.2
Figure 6.8: Deblurring performance of the proposed and existing
methods
(a) Blurred image (b) (J. Pan et al., 2014) (c) (Cho et al., 2012)
QA=66.6 QA=19.6 QA=32.4

127
Figure 6.9: Performance of the proposed and existing methods for
deblurring in comparison with the ground truth
(a) Input blur image
(b) Deblurred by (Cho, Wang, & Lee, 2012)
(c) Deblurred by (J. Pan, Hu, Su, & Yang, 2014)
(d) Deblurred by (Y. Wang, Yang, Yin, & Zhang, 2008)
(e) Deblurred by (Kumar, Paramesran, & Shakibaei, 2014)
(f) Deblurred by the proposed method

128
Table 6.4: Average quality measures of the proposed and existing methods for
deblurring before and after classification
Methods Techniqu
es
Before
Classification
(blurred + non-
blurred frames)
After
Classification
(only blurred
frames)
After Classification
(only Non-blurred
frames)
Avera
ge QA
APT
(mins)
Averag
e QA
APT
(mins)
Averag
e QA
APT
(mins)
(J. Pan et
al., 2014) L0-norm 15.35 89.4 19.5 63.2 13.4 72.6
(Cho et al.,
2012) L2-norm 31.8 52 37.8 29.3 27.6 39.2
(Y. Wang
et al.,
2008)
L1-norm 24.75 58.6 37.14 26.2 22.5 43.1
(Kumar et
al., 2014) moments 21.7 73.3 24.9 52.7 19.6 55.7
Proposed
Method
GW-L1-
norm 15.01 55.3 19.15 24.9 13.1 35.7
6.3.3 Text Detection Experiments for Validating the Proposed Model
Experiments in previous sections evaluated the proposed deblurring model in terms
of quality metrics and classification rate. In order to illustrate the usefulness and
effectiveness of the proposed model, experiments for text detection and recognition in
video and natural scene images is conducted. In addition, experiments prior to
classification (blurred + non-blurred) and after classification (classified blurred frames,
Figure 6.10: 1-D profile of existing methods with proposed

129
deblurred frames using deblurring methods and non-blurred frames) are also conducted.
Furthermore, after classification, the proposed method considers blurred images
classified by the proposed classification method and their corresponding deblurred
images. 9120, 1960, 2700 frames were used from authors video dataset, the ICDAR
2013 video dataset, YVT video dataset and the ICDAR 2015 video dataset,
respectively. In the same way, 33, 22 and 119 were used from the ICDAR 2013 scene
dataset, MSRA-TD500 and SVT datasets, respectively. In total, 15805 deblurred
frames and 174 deblurred scene images were employed for conducting the experiments.
The proposed method uses the same measures described in earlier chapter 3.4.2,
namely, recall (R), precision (P) and f-measure (F) for evaluating the proposed method.
The proposed method also implemented existing text detection methods which use
different features to show that the performance of the text detection methods improves
significantly after deblurring compared to before deblurring. Therefore, the proposed
method computes recall, precision and f-measures before-deblurring (text detection
from blurred images) and after-deblurring (text detection from deblurred images). The
existing methods are Epshtein et al (Epshtein et al., 2010), which is the state-of-the-art
method for text detection-based edge and gradient features in natural scene images, Liu
et al. (C. Liu et al., 2005) which uses texture features for text detection in both video
and natural scene images, Shivakumara et al. (P. Shivakumara et al., 2010) which uses
the combination of Fourier and color for detecting text in both video as well as natural
scene images, Shivakumara et al. (Palaiahnakote Shivakumara et al., 2012) which
explores a Bayesian classifier for text detection in video, Zhao et al. (Z. Xu et al., 2011)
which use corners and connected component analysis for caption text detection in
video, Huang (X. Huang, 2011) and Mi et al. (Congjie et al., 2005) which use temporal
frames for text detection in video but not in natural scene images. The main reason to
choose these existing methods for experimentation is to show that the methods which

130
use edge, gradient, texture, color and the combinations are sensitive to blur artifacts and
the same methods give good results for deblurring. In addition methods proposed in
Chapter 3, 4 & 5 are also used for evaluating the methods performance before and after
classification over blur frames. Chapter 4 & 5 considers temporal information so they
will be tested on video datasets only, whereas Chapter 3 response will be shown for all
datasets.
Sample qualitative results of the text detection methods are shown in Figure 6.10-
Figure 6.16 for the respective video data of ICDAR 2013, YVT, ICDAR 2015 and
natural scene image data of ICDAR 2013, MSRA-TD500, SVT. It can be observed
from Figure 6.10-Figure 6.16 that for blurred frames, text detection methods perform
very poorly (before deblurring) and the same methods give good results for the
deblurred images (after deblurring). This shows that the existing text detection methods
are not capable of handling blurred artifacts. Since the proposed deblur model is able to
preserve the edge intensities during restoration, the existing methods give better results
after deblurring compared to before deblurring.
The quantitative results of the text detection methods reported in Table 6.5-Table
6.18 for authors video data, ICDAR 213 video, YVT video, ICDAR 2015 video,
ICDAR 2013 scene data, MSRA data and SVT data, respectively. It is observed from
Table 6.5-Table 6.18 that the conlusions are drawn from Figure 6.10-Figure 6.16 are
true as recall, prcision and f-measure of the text detection methods are lower before
deblurring and higher after deblurring.
Furthermore, Table 6.5-Table 6.18 show that the results prior to classification are
lower than after classification (deblurred images) and higher than for blurred images.
This is true because text detection methods do not perform well on blurred images due
to the blurring effect. Since a higher number of good images are included prior to

131
classification, and a smaller number of blurred images are used, overall the results of
the text detection methods are higher than the results of those only containing blurred
images. On the other hand, text detection methods give the best results for deblurred
images compared to the blurred ones and all other images due to the deblurring effect.
The proposed method has undertaken new experiments on non-blurred frames after
classification to deblurring, text detection and recognition, respectively in Table 6.4-
Table 6.23. It is observed from the experimental results on the non-blurred frames
reported in Table 6.4-Table 6.23 that for the deblurring results in Table 6.4, the QA of
the proposed deblurring method scores low compared to blurred frames. This results in
a better quality frame that enhances the text detection rate. At the same time, one can
observe that text detection rate is high for classified non-blur frames which were
expected as they were not affected by blur artifacts. The experiment validates that the
proposed blur frame classification and deblurring model performs well for improving
text detection results.
It is noted from the results of the methods proposed in Chapter 3, Chapter 4 and
Chapter 5 reported in Table 6.5-Table 6.12 for the Author‟s, ICDAR 2013, YVT and
ICDAR 2015 video data, respectively that the method proposed in Chapter 3 scores
better results in terms of recall for almost all the video datasets compared to the
methods proposed in Chapter 4, Chapter 5 and other existing methods. The main reason
is that it defines a new descriptor based on moments for detecting text that can work
well for the images containaing blur to some extent. However, experimentation reports
low results for precision compared to the methods presented in Chapter 5. This is due
to the use of fixed window size. The method proposed in Chapter 4 does not report
good results compared to Chapter 3 and Chapter 5 because the method is sensitive to
blur and window size. On the other hand, the method proposed in Chapter 5 gives good
results for almost all the video datasets in terms of F-measure compared to the methods

132
in Chapter 3, Chapter 4 and other existing methods. This is because the method is
insensitive to window size, the number of temporal frames unlike other methods that
uses fixed number of temporal frames.

133
Blurred images Deblurred images
Text Detection by (P. Shivakumara, Trung Quy, & Tan, 2010) of blurred frame and deblurred
frame
Text Detection by (Palaiahnakote Shivakumara et al., 2012)
Text Detection by (Z. Xu et al., 2011) of blurred frame and deblurred frame
Text Detection by (Congjie et al., 2005) of blurred frame and deblurred frame
Text Detection by (X. Huang, 2011) of blurred frame and deblurred frame
Text Detection by (Epshtein et al., 2010) of blurred frame and deblurred frame
Text Detection by (C. Liu et al., 2005)of blurred frame and deblurred frame
Figure 6.11: Text detection Response of existing method over blurred and
deblured frame on Author’s dataset

134
Table 6.5: Text detection response before classification across all frames for
Author’s video dataset
S. No. Methods
Before Classification
(blurred + non-blurred frames)
R P F
1 (Epshtein et al., 2010) 38.9 32.7 35.5
2 (C. Liu et al., 2005) 32.6 30.5 31.5
3 (P. Shivakumara et al., 2010) 55.7 48.9 52.0
4 (Palaiahnakote Shivakumara et al., 2012) 53.8 48.6 51.0
5 (Z. Xu et al., 2011) 49.8 50.6 50.2
6 (X. Huang, 2011) 43.1 41.7 42.3
7 (Congjie et al., 2005) 47.3 26.4 33.8
8 Chapter 3 56.2 47.2 51.7
9 Chapter 4 49.7 51.1 50.4
10 Chapter 5 54.2 50.4 52.3
Text Detection by Chapter 5 of blurred frame and deblurred frame Figure 6.12: Text detection Response of proposed methods over blurred
and deblured frame on Author’s dataset
Blurred images Deblurred images
Text Detection by Chapter 3 of blurred frame and deblurred frame
Text Detection by Chapter 4 of blurred frame and deblurred frame

135
Table 6.6: Text detection response after classification across blurred and
deblurred frames for Author’s video dataset
S.
No. Methods
After Classification (only blurred
frames)
After
Classification
Blurred Frame Deblurred frame Non-blurred
frame
R P F R P F R P F
1 (Epshtein et al.,
2010) 6.8 8.9 7.7 60.9 62.2 61.5 72.9 69.4 71.1
2 (C. Liu et al., 2005) 9.2 6.2 7.4 58.3 54.7 56.4 66.5 59.3 62.9
3 (P. Shivakumara et
al., 2010) 22.6 26.7 24.4 83.4 82.1 82.7 81.9 85.3 83.6
4
(Palaiahnakote
Shivakumara et al.,
2012)
18.6 18.7 18.6 89.7 83.4 86.4 88.4 86.1 87.2
5 (Z. Xu et al., 2011) 19.3 17.3 18.2 80.4 79.3 79.8 80.4 81.4 80.9
6 (X. Huang, 2011) 15.5 13.6 14.4 68.3 62.9 65.4 73.2 77.4 75.3
7 (Congjie et al.,
2005) 16.6 12.4 14.2 76.4 42.9 54.9 65.6 62.1 63.8
8 Chapter 3 22.1 24.4 23.2 84.9 86.3 85.6 86.7 87.3 87
9 Chapter 4 19.3 18.4 13.8 72.3 71.3 71.8 78.2 77.2 77.7
10 Chapter 5 20.3 17.6 18.9 76.9 81.3 79.1 82.4 80.6 81.5

136
Blurred images Deblurred images
Text Detection by (P. Shivakumara et al., 2010) of blurred frame and deblurred frame
Text Detection by (Palaiahnakote Shivakumara, Sreedhar, Phan, Lu, & Tan, 2012) of blurred frame
and deblurred frame
Text Detection by (Z. Xu et al., 2011) of blurred frame and deblurred frame
Text Detection by (Congjie et al., 2005) of blurred frame and deblurred frame
Text Detection by (X. Huang, 2011) of blurred frame and deblurred frame
Text Detection by (Epshtein et al., 2010)of blurred frame and deblurred frame
Text Detection by (C. Liu et al., 2005) of blurred frame and deblurred frame
Figure 6. 13: Text detection Response of existing method over standard
video dataset (ICDAR 2013, YVT, ICDAR2015)

137
Table 6.7: Text detection response before classification across all frames for
ICDAR2013 videos
S. No. Methods
Before Classification
(blurred + non-blurred frames)
R P F
1 (Epshtein et al., 2010) 37.0 32.7 32.8
2 (C. Liu et al., 2005) 33.1 28.6 30.6
3 (P. Shivakumara et al., 2010) 47.3 44.9 46.0
4 (Palaiahnakote Shivakumara et al., 2012) 48.6 47.1 47.8
5 (Z. Xu et al., 2011) 50.7 48.9 49.8
6 (X. Huang, 2011) 41.5 40.6 41.0
7 (Congjie et al., 2005) 42.7 36.4 39.2
8 Chapter 3 49.4 50.3 49.8
9 Chapter 4 46.7 44.9 45.8
10 Chapter 5 51.2 50.6 50.9
Text Detection by Chapter 5 of blurred frame and deblurred frame
Figure 6.14: Text detection Response of proposed methods over
standard video dataset (ICDAR 2013, YVT, ICDAR2015)
Blurred images Deblurred images
Text Detection by Chapter 3 of blurred frame and deblurred frame
Text Detection by Chapter 4 of blurred frame and deblurred frame

138
Table 6.8: Text detection response after classification across blurred and
deblurred frames for ICDAR2013 videos
S.
No. Methods
After Classification (only blurred
frames)
After
Classification
Blurred Frame Deblurred frame Non-blurred
frame
R P F R P F R P F
1 (Epshtein et al.,
2010) 5.7 4.2 4.8 57.5 61.8 59.5 64.3 59.4 61.8
2 (C. Liu et al., 2005) 8.3 5.2 6.3 50.9 66.6 57.7 68.4 66.9 67.6
3 (P. Shivakumara et
al., 2010) 28.5 37.5 32.4 82.1 83.1 82.5 84.3 81.4 82.8
4
(Palaiahnakote
Shivakumara et al.,
2012)
7.14 8.1 7.5 85.7 63.1 72.7 82.4 83.6 83
5 (Z. Xu et al., 2011) 17.1 21.3 19.0 78.3 79.0 78.6 79.5 72.8 76.1
6 (X. Huang, 2011) 10.5 12.7 11.4 51.3 54.5 52.8 66.5 62.5 64.5
7 (Congjie et al.,
2005) 9.28 7.4 8.2 62.3 39.9 48.6 67.4 62.1 64.7
8 Chapter 3 28.3 35.9 32.1 78.3 80.4 79.3 83.1 77.3 80.2
9 Chapter 4 21.4 20.6 21.1 76.1 74.1 75.1 77.1 72.4 74.7
10 Chapter 5 25.7 24.1 24.9 77.3 75.9 76.6 81.3 75.6 78.4
Table 6.9: Text detection response before classification across all frames for the
YVT dataset
S. No. Methods
Before Classification
(blurred + non-blurred frames)
R P F
1 (Epshtein et al., 2010) 41.3 36.9 38.9
2 (C. Liu et al., 2005) 38.6 34.1 36.2
3 (P. Shivakumara et al., 2010) 59.8 57.4 58.5
4 (Palaiahnakote Shivakumara et al., 2012) 58.3 54.6 56.3
5 (Z. Xu et al., 2011) 52.6 51.4 51.9
6 (X. Huang, 2011) 45.9 43.5 44.6
7 (Congjie et al., 2005) 49.6 38.3 43.2
8 Chapter 3 58.1 59.3 58.7
9 Chapter 4 55.4 50.6 53
10 Chapter 5 59.8 57.3 58.5

139
Table 6.10: Text detection response after classification across blurred and
deblurred frames for the YVT dataset
S.
No. Methods
After Classification (only blurred
frames)
After
Classification
Blurred Frame Deblurred frame Non-blurred
frame
R P F R P F R P F
1 (Epshtein et al.,
2010) 15.2 11.6 13.1 62.5 68.2 65.2 69.4 68.3 68.8
2 (C. Liu et al., 2005) 10.3 10.3 10.3 55.7 64.3 59.7 61.1 68.2 64.6
3 (P. Shivakumara et
al., 2010) 32.7 38.9 35.5 88.6 86.3 87.5 88.9 89.1 89
4
(Palaiahnakote
Shivakumara et al.,
2012)
27.8 22.2 24.7 86.5 72.3 69.9 82.1 79.3 80.7
5 (Z. Xu et al., 2011) 21.7 26.7 25.0 83.6 79.9 81.7 87.4 83.6 85.5
6 (X. Huang, 2011) 18.7 15.7 17.1 65.7 66.9 66.3 74.9 71.5 73.2
7 (Congjie et al.,
2005) 19.4 17.7 18.1 72.8 51.1 60.0 72.3 63.5 67.9
8 Chapter 3 33.5 34.8 34.1 88.6 87.3 87.9 87.3 86.3 86.8
9 Chapter 4 28.7 25.3 27 81.3 76.4 78.5 83.1 76.1 79.6
10 Chapter 5 32.4 32.1 32.2 85.4 83.4 84.4 85.7 84.3 85
Table 6.11: Text detection response before classification across all frames for
ICDAR 2015
S. No. Methods
Before Classification
(blurred + non-blurred frames)
R P F
1 (Epshtein et al., 2010) 35.7 34.5 35.1
2 (C. Liu et al., 2005) 33.1 31.8 32.4
3 (P. Shivakumara et al., 2010) 55.7 52.3 53.9
4 (Palaiahnakote Shivakumara et al., 2012) 51.4 48.6 49.9
5 (Z. Xu et al., 2011) 48.3 47.7 47.9
6 (X. Huang, 2011) 38.7 36.9 37.7
7 (Congjie et al., 2005) 37.9 35.2 36.5
8 Chapter 3 55.4 54.1 54.7
9 Chapter 4 45.6 42.1 43.8
10 Chapter 5 56.7 51.8 54.2

140
Table 6.12: Text detection response before and after classification across
blurred and deblurred frames for ICDAR 2015
S.
No. Methods
After Classification (only blurred
frames)
After
Classification
Blurred Frame Deblurred frame Non-blurred
frame
R P F R P F R P F
1 (Epshtein et al.,
2010) 4.6 5.3 4.9 51.4 59.7 55.0 69.7 62.4 66.1
2 (C. Liu et al., 2005) 8.1 6.8 7.4 50.9 58.9 54.6 63.1 65.3 64.2
3 (P. Shivakumara et
al., 2010) 26.7 35.8 30.6 81.2 81.7 81.4 84.3 82.9 83.6
4
(Palaiahnakote
Shivakumara et al.,
2012)
8.1 9.9 8.9 83.7 64.3 72.7 82.5 77.1 79.8
5 (Z. Xu et al., 2011) 16.9 20.8 18.6 76.6 77.9 77.2 79.1 80.5 79.8
6 (X. Huang, 2011) 8.6 11.6 9.8 52.3 54.6 53.4 62.8 61.7 62.2
7 (Congjie et al.,
2005) 8.9 8.52 8.7 61.8 42.4 50.3 66.7 53.7 60.2
8 Chapter 3 25.1 28.4 26.7 84.1 81.4 82.7 85.1 81.3 83.2
9 Chapter 4 19.7 20.4 20.1 76.4 72.1 74.2 74.5 70.3 72.4
10 Chapter 5 21.3 25.6 23.4 83.1 79.4 81.2 81.9 81.4 81.6

141
Blurred images Deblurred images
Text Detection by (P. Shivakumara et al., 2010) of blurred frame and deblurred frame
Text Detection by (Palaiahnakote Shivakumara et al., 2012) of blurred frame and
deblurred frame
Text Detection by (Z. Xu et al., 2011) of blurred frame and deblurred frame
Text Detection by (Congjie et al., 2005) of blurred frame and deblurred frame
Text Detection by (X. Huang, 2011) of blurred frame and deblurred frame
Text Detection by (Epshtein et al., 2010) of blurred frame and deblurred frame
Text Detection by (C. Liu et al., 2005) of blurred frame and deblurred frame
Figure 6.15: Text detection Response of existing methods over blurred
and deblured scene images from standard datasets (MSRA-TD500, SVT,
ICDAR2013)

142
Table 6.13: Text detection response before classification all frames for MSRA-
TD500
S. No. Methods
Before Classification
(blurred + non-blurred images)
R P F
1 (Epshtein et al., 2010) 61.3 60.2 60.7
2 (C. Liu et al., 2005) 59.2 57.6 58.3
3 (P. Shivakumara et al., 2010) 71.3 69.2 70.2
4 (Palaiahnakote Shivakumara et al., 2012) 68.4 67.5 67.9
5 (Z. Xu et al., 2011) 70.8 66.9 68.7
6 (X. Huang, 2011) 62.6 61.5 62.0
7 (Congjie et al., 2005) 63.1 61.4 62.2
8 Chapter 3 69.3 70.4 69.8
Table 6.14: Text detection response after classification across blurred and
deblurred frames for MSRA-TD500
S.
No. Methods
After Classification (only blurred
images)
After
Classification
Blurred images Deblurred frame Non-blurred
frame
R P F R P F R P F
1 (Epshtein et al.,
2010) 44.3 46.1 45.2 83.2 78.4 80.7 77.1 78.9 78
2 (C. Liu et al., 2005) 38.6 40.9 39.7 81.6 76.4 78.9 72.3 76.4 74.3
3 (P. Shivakumara et
al., 2010) 48.6 44.7 45.5 89.6 82.3 85.8 87.6 87.5 87.5
4
(Palaiahnakote
Shivakumara et al.,
2012)
46.3 44.5 45.3 86.4 78.3 82.1 84.1 81.8 82.9
5 (Z. Xu et al., 2011) 46.4 42.6 44.4 88.4 79.6 83.7 81.3 82.6 81.9
6 (X. Huang, 2011) 41.6 41.8 41.6 82.1 70.8 76.0 81.3 74.2 77.7
7 (Congjie et al.,
2005) 43.2 42.1 42.6 81.4 72.9 76.9 76.3 73.1 74.7
8 Chapter 3 47.2 48.4 47.8 87.4 85.2 86.3 86.3 85.2 85.7
Text Detection by Chapter 3 of blurred frame and deblurred frame
Figure 6.16: Text detection Response of proposed method of Chapter 3
over blurred and deblured scene images from standard datasets (MSRA-
TD500, SVT, ICDAR2013)
Blurred images Deblurred images

143
Table 6.15: Text detection response before classification across all frames for
SVT
S. No. Methods
Before Classification
(blurred + non-blurred images)
R P F
1 (Epshtein et al., 2010) 55.8 53.4 54.6
2 (C. Liu et al., 2005) 56.7 54.9 55.7
3 (P. Shivakumara et al., 2010) 66.8 64.9 65.8
4 (Palaiahnakote Shivakumara et al., 2012) 63.7 62.4 63.0
5 (Z. Xu et al., 2011) 58.3 57.2 57.7
6 (X. Huang, 2011) 55.4 52.5 53.9
7 (Congjie et al., 2005) 53.8 52.1 52.9
8 Chapter 3 66.3 65.2 65.7
Table 6.16: Text detection response before and after classification across
blurred and deblurred frames for SVT
S.
No. Methods
After Classification (only blurred
images)
After
Classification
Blurred images Deblurred frame Non-blurred
frame
R P F R P F R P F
1 (Epshtein et al.,
2010) 28.4 22.6 25.1 74.6 69.9 72.1 78.3 63.7 71
2 (C. Liu et al., 2005) 27.8 25.9 26.8 72.1 71.1 71.6 73.4 75.2 74.3
3 (P. Shivakumara et
al., 2010) 35.9 38.1 38.5 86.7 84.1 85.3 86.7 87.2 86.9
4
(Palaiahnakote
Shivakumara et al.,
2012)
33.2 35.2 34.1 82.4 78.6 80.4 83.1 83.4 83.2
5 (Z. Xu et al., 2011) 33.8 32.7 33.2 80.4 72.3 76.1 81.7 77.3 79.5
6 (X. Huang, 2011) 34.9 25.4 29.4 74.2 72.4 73.3 73.4 78.9 76.1
7 (Congjie et al., 2005) 32.4 28.2 30.1 78.4 75.3 76.8 78.4 71.4 74.9
8 Chapter 3 34.7 35.3 35 85.6 87.3 86.4 87.1 88.2 87.6
Table 6.17: Text detection response before classification across all frames for
ICDAR 2013 Scene images
S. No. Methods
Before Classification
(blurred + non-blurred images)
R P F
1 (Epshtein et al., 2010) 51.7 47.2 49.3
2 (C. Liu et al., 2005) 53.6 48.3 50.8
3 (P. Shivakumara et al., 2010) 55.9 52 53.8
4 (Palaiahnakote Shivakumara et al., 2012) 66.9 65.4 66.1
5 (Z. Xu et al., 2011) 63.7 62.1 62.8
6 (X. Huang, 2011) 55.8 53.9 54.8
7 (Congjie et al., 2005) 54.2 51.7 52.9
8 Chapter 3 67.8 65.2 66.5

144
Table 6.18: Text detection response after classification across blurred and
deblurred frames for ICDAR 2013 Scene images
S.
No. Methods
After Classification (only blurred
images)
After
Classification
Blurred images Deblurred frame Non-blurred
frame
R P F R P F R P F
1 (Epshtein et al.,
2010) 37.4 38.9 38.1 78.5 75.7 77.0 76.9 78.5 77.7
2 (C. Liu et al., 2005) 36.8 32.4 34.4 79.4 76.6 77.9 79.6 72.5 76.1
3 (P. Shivakumara et
al., 2010) 42.2 48.1 44.9 89.5 88.4 88.9 89.2 88.1 88.6
4
(Palaiahnakote
Shivakumara et al.,
2012)
44.3 45.4 45.1 86.1 82.1 84.0 86.1 84.7 85.4
5 (Z. Xu et al., 2011) 46.3 39.3 42.5 83.6 80.9 82.2 82.1 84.9 83.5
6 (X. Huang, 2011) 18.7 15.7 17.0 65.7 66.9 66.4 75.7 71.6 73.6
7 (Congjie et al.,
2005) 38.7 39.2 38.9 80.4 76.0 78.2 82.8 78.2 80.5
8 Chapter 3 45.3 42.1 43.7 88.3 87.6 87.9 87.8 88.4 88.1
Note: though Huang and Mi et al. (Congjie et al., 2005) require temporal frames for
text detection, here they are used for text detection in individual frames because the
main step of text candidate detection is performed for the first frame and then the same
text candidates are verified with the temporal frames. Therefore, the text candidates
given for the first frame are considered for text detection in this work. Since our
objective is to illustrate performance before deblurring and after deblurring, the
accuracy is not affected much by losing temporal frames.
It is observed from the results of the methods proposed in Chapter 3 reported in
Table 6.13-Table 6.18 for the natural scene datasets of MSRA, SVT and ICDAR 3013,
respectively that the method proposed in Chapter 3 scores the best results at recall,
precision and F-measure for almost all the datasets compared to other existing methods.
The main advantage of the method proposed in Chapter 3 is that the defined descriptor
work well for both low contrast and high contrast images. Therefore, the method
proposed in Chapter 3 is better than the existing methods.

145
6.3.4 Text Recognition Experiments for Validating the Proposed Model
The objective of this section is the same as text detection presented in the previous
section. However, for this experiment, texts lines detected by the text detection method
(P. Shivakumara et al., 2010) from blurred and deblurred images are input for
recognition through binarization. The method in (P. Shivakumara et al., 2010) looks
good compared to other text detection methods before deblurring and after deblurring
as reported in the results shown in Table 6.5-Table 6.18. Therefore, it has been chosen
for text line extraction from both blurred and deblurred images. To show the usefulness
of the proposed deblurring model, recognition rate is calculated at the character level
using a publicly available OCR (Tesseract) for the text line images of video and natural
scene datasets. The proposed method calculate the recognition rate before classification
(text lines detected from both blurred + non-blurred images) and after classification
(text lines detected from only deblurred images and non-blurred frames) to show the
effectiveness of deblurring in improving the recognition rate for blurred images. For the
after classification experiments, character recognition rate is reported before deblurring
and after deblurring which also includes non-blurred frames. Several binarization
methods are also implemented which are tested on text lines detected from blurred
images directly (before deblurring) and text lines detected from deblurred images (after
deblurring). For example, Otsu‟s method (Otsu, 1975), Sauvola‟s method (Sauvola &
Pietikäinen, 2000), Wolf et al. (Wolf et al., 2002) which are baseline thresholding
techniques for binarizing document images, also Bernsen (Bernsen, 1986) and Zhou et
al (Y. Zhou et al., 2013) which use gray-level information for binarization. These
methods are selected because most of the methods developed use these approaches as a
basis for solving the problems of binarization, which includes video text line
binarization and natural scene images. In addition, it is shown that the binarization
methods are sensitive to blur and lead to poor results when blur is present in the images

146
during binarization, and the same methods give better results for deblurred images after
deblurring. When video or images contain blur, it is not easy to fix a threshold for
binarization.
Sample qualitative results of binarization methods for the text lines detected from
authors dataset, ICDAR 2013, YVT, ICDAR 2015, ICDAR 2013 scene images,
MSRA-TD500, and SVT are shown in Figure 6.17 to Figure 6.19, respectively, where
it can be seen that both binarization and recognition results are poor before deblurring
compared to after deblurring. From these experiments, it can be concluded that the
proposed deblurring model is essential for improving text recognition results when the
image contains blur artifacts. The same conclusions can be drawn from the quantitative
results of the binarization methods for the video and natural scene datasets as reported
in Table 6.19-Table 6.23 where it can be seen that all binarization methods give better
results after deblurring compared to before deblurring.
From the results in Table 6.5-Table 6.18 (before classification and after
classification), the same conclusions are drawn for the text detection experiments as are
observed for the recognition results reported in Table 6.19-Table 6.23 where one can
see that the binarization methods give lower results for all the data (before
classification) compared to deblurred data, and higher results compared to blurred data.
It can also be observed from the results on non-blurred frames reported in Table 6.19-
Table 6.23 that the recognition accuracy is higher than deblurred frames because the
binarization methods work well for non-blurred frames (no blur effect). The same
binarization for deblurred frames is due to the complexity of the blur. However, the
difference between the recognition results on deblurred and non-blurred frames is not
significant. This shows that the proposed deblurring model is effective in removing blur
in frames.

147
In summary, it is observed from the experiments that the performance of the text
detection and binarization methods get affected when the video/image contains blur
information. Therefore, in order to improve the performance of the text detection and
binarization methods, deblurring is essential.
Blurred images Deblurred images
Text Line images of blurred and deblurred frames
Binarization & Recognition results by Bernsen (Bernsen, 1986)
Binarization & Recognition results by (Wolf et al., 2002)
Figure 6.17: Binarization and Recognition results of the existing
binarization methods for Author’s dataset (Note: Recognition results
are shown in box)
Binarization & Recognition results by Sauvola‟s (Sauvola & Pietikäinen, 2000)
method
Binarization & Recognition results by Otsu‟s (Otsu, 1975) method
Binarization & Recognition results by (Y. Zhou et al., 2013)
Rnabucï
¬‚ CCR
5868 Hairﬕ
i
-
- fluid. EDI!
5833
Roch!â€
˜
- - C 5; ;Io
- - ;.C -
- R CCR,.6 Rao

148
Table 6.19: Recognition results before and after classification over blurring and
deblurring for Author’s dataset
S.
No Methods
Before
Classification
(blurred + non-
blurred)
After Classification (only blurred
frames)
After
Classification
Blurred Frame Deblurred frame Non-blurred
frame
Recognition
Accuracy
Recognition
Accuracy
Recognition
Accuracy
Recognition
Accuracy
1 (Otsu, 1975) 45.9 15.83 66.3 68.5
2 (Wolf et al.,
2002) 42.6 15.41 62.08 65.2
3
(Sauvola &
Pietikäinen,
2000)
33.5 10.6 48.5 52.7
4 (Bernsen,
1986) 35.7 12.7 50.45 56.3
5 (Y. Zhou et
al., 2013) 48.7 16.2 68.91 71.4

149
Text Line images of blurred and deblurred frames
Binarization & Recognition results by Bernsen (Bernsen, 1986)
Binarization & Recognition results by (Wolf et al., 2002)
Figure 6.18: Binarization and Recognition results of the existing
binarization methods for standard video dataset (Note: Recognition
results are shown in box)
Binarization & Recognition results by Sauvola‟s (Sauvola & Pietikäinen, 2000) method
Binarization & Recognition results by Otsu‟s (Otsu, 1975) method
Binarization & Recognition results by (Y. Zhou et al., 2013)
- servilletas - - SANTA 69QUE "E3
IEIW
-
S;
-
- - servilletas SANTA F5TC
- - Eervilletas servilleta
s B906 „`i
- - "9E"--
.I'EIIEI-=.'i'
servilletas 8
SEFVIIIE
IBS - SANTA mnascu -
servillet
Blurred images Deblurred images

150
Table 6.20: Recognition accuracy before classification over all frames for
standard video dataset
S.No Methods
Before Classification
(blurred + non-blurred frames))
Recognition Accuracy
ICDAR 2013 YVT ICDAR 2015
1 (Otsu, 1975) 42.8 48.7 47.6
2 (Wolf et al., 2002) 36.8 43.6 42.3
3 (Sauvola & Pietikäinen, 2000) 34.2 35.7 34.8
4 (Bernsen, 1986) 38.9 48.3 46.1
5 (Y. Zhou et al., 2013) 51.8 52.9 52.3
Table 6.21: Recognition accuracy after classification over blurring and
deblurring for a standard video dataset
S.N
o Methods
After Classification (only blurred frames) After Classification
Blurred Frame Deblurred frame Non-blurred frame
Recognition Accuracy Recognition Accuracy Recognition Accuracy
ICDA
R
2013
YV
T
ICDA
R
2015
ICDA
R
2013
YV
T
ICDA
R
2015
ICDA
R
2013
YV
T
ICDA
R
2015
1 (Otsu,
1975) 27.4 32.6 29.5 58.1 67.3 63.7 66.9 73.4 71.5
2 (Wolf et
al., 2002) 18.9 23.4 19.7 54.3 63.4 56.8 54.8 63.8 59.2
3
(Sauvola
&
Pietikäine
n, 2000)
22.2 17.6 20.3 45.1 49.7 43.6 48.3 51.6 45.2
4 (Bernsen,
1986) 26.9 29.8 27.4 56.2 66.8 59.8 61.3 67.4 62.1
5
(Y. Zhou
et al.,
2013)
31.2 36.1 33.6 72.6 78.4 75.2 74.2 79.3 77.4

151
Table 6.22: Recognition accuracy before classification over all frames for
standard scene dataset
S.No Methods
Before Classification
(blurred + non-blurred images))
Recognition Accuracy
MSRA-TD500 ICDAR 2013 scene SVT
1 (Otsu, 1975) 54.7 51.6 53.7
2 (Wolf et al., 2002) 52.6 56.6 51.3
3 (Sauvola & Pietikäinen, 2000) 47.5 45.9 41.1
4 (Bernsen, 1986) 48.7 47.1 42.6
5 (Y. Zhou et al., 2013) 66.4 62.5 59.7
Blurred images Deblurred images
Text Line images of blurred and deblurred frames
Binarization results by Bernsen (Bernsen, 1986)
Binarization results by (Wolf, Jolion, & Chassaing, 2002)
Figure 6.19: Binarization and Recognition results of the existing
binarization methods for text lines from scene images
Binarization results by Sauvola‟s (Sauvola & Pietikäinen, 2000) method
Binarization results by Otsu‟s (Otsu, 1975) method
Binarization results by (Y. Zhou, Feild, Learned-Miller, & Wang, 2013)
II B NO
SMOK
HSBC N0 SMOK I
NC:
IIB NO
SMO
- NO SMOKI
- - IIB -
NO SMOKÌ‟N - NO
SMOKÌNG L
IISB N
SMOK - HSBC N0 SMOK
ING\ OL‟
- SOL
HSBC SOL
IIB IISBC
- NO MOK

152
Table 6.23: Recognition accuracy after classification over blurring and
deblurring for a standard scene dataset
S.N
o Methods
After Classification (only blurred images) After Classification
Blurred images Deblurred images Non-blurred frame
Recognition Accuracy Recognition Accuracy Recognition Accuracy MSRA
-
TD500
ICDA
R 2013
scene
SV
T
MSRA
-
TD500
ICDA
R 2013
scene
SV
T
MSRA
-
TD500
ICDA
R 2013
scene
SV
T
1 (Otsu,
1975) 31 38.1 22.4 79.4 76.2 77.3 80.8 72.5 78.3
2 (Wolf et
al., 2002) 28.2 24.8 18.9 78.9 80.4 72.5 78.2 81.3 76.4
3
(Sauvola &
Pietikäinen
, 2000)
22.9 23.4 16.6 68.4 62.1 61.5 69.7 67.2 65.9
4 (Bernsen,
1986) 12.3 15.3 14.8 71.7 68.3 60.9 76.2 72.2 69.2
5 (Y. Zhou et
al., 2013) 32.4 36.7 28.4 88.4 83.2 78.9 88.9 84.6 80.2
6.4 Summary
In this work a deblurring model which explores Gaussian weighted - L1 for
restoring sharpness of the edges in blurred video/images. The proposed deblur model
does not require a reference image for estimating the degree of blur in the
video/images. The degree of blur estimated is used for classifying blurred and
deblurred images from a pool of blurred and non-blurred frames. The experimental
results of the deblurring model and classification method show that the proposed model
is able to give better results than existing deblurring models. The proposed work have
conducted text detection and recognition experiments using different text detection and
binarization methods before deblurring and after deblurring to demostrate the
usefulness and effectivenss of the proposed deblur model. The results show that the
proposed deblur model helps in improving the performance of both text detection and
recogntion methods.

153
CHAPTER 7: CONCLUSION AND FUTURE WORK
7.1 Conclusion
In the thesis a new descriptor called Histogram of Oriented Moments (HOM) is
proposed for both text detection of static and moving text detection in video in Chapter
3. The second order geometric moments are explored for deriving a new descriptor to
exploits the strength of moments, such as spatial information and pixel values.
However, the utilization of temporal information is limited to false positive elimination
but not as main features to find text candidates.
In Chapter 4, motion vector estimation at block level is estimated for multi oriented
text detection of both scene and graphics text present in video. The moments are used
for finding the possible text blocks in temporal frames. Gradient direction of text pixel
are explored to refine text candidates and finally region growing is proposed based on
nearest neighbor criterion for restoring text line information regardless of orientation,
scripts. However, the model is sensitive to window size used for moment‟s calculation
and different scripts in videos.
Next a new method has been proposed for arbitrarily-oriented multi-lingual text
detection in video based on moments and gradient directions in Chapter 5. This work
proposes a new iterative procedure that utilizes the temporal information based on the
fact that caption text stay at the same location for few frames while scene text has little
movement from one frame to another to identify text candidates. The advantage of this
iterative procedure is that it helps in identifying exact number of temporal frames to be
used for text candidate detection. In addition proposed method had utilized the stroke
width information for estimating window size automatically that helps in finding multi
sized font text present in videos. However, the performance of the proposed method
degrades in the presence of blur.

154
Finally a deblur model is proposed which explores Gaussian weighted - L1 for
restoring sharpness of the edges in the blur video/images in Chapter 6. The main idea is
to deblur the image to improve the text detection and recognition response. The
proposed deblur model does not require reference image for estimating degree of blur
in the video/images. The degree of blur estimated is used for classifying blur and deblur
image from the pool of blur and non-blur frames.
7.2 Future work
The work presented in this thesis is able to detect the static text and moving text
present in video. However, the method assumes text appear at same location for few
frames to identify the text candidates. As a result, the scope of the method is limited to
the texts that have no arbitrary moments. The proposed methods do not consider text
affected by occlusion because the method is not capable of restoring missing text
information. The proposed method does not perform well for the video with blurred
text and severe distorted texts, such as text affected by perspective distortion and
camera movements.
Since a video is a collection of static images, one may think that detecting text from
videos is similar as from images. Although an existing method for static images could
in principle be used for detecting text from videos but videos are of different nature
compared to static images. Consecutive frames present in general with small
differences, while images from videos are typically worse than static images due to
motion blur and out of focus issues and video compression introduces further artifacts.
The work presented in this thesis is able to find texts which are affected by motion
blur but other artifacts generated by video compression and out of focus affected text
are still a challenge. In the future, proposed methods can be extended for finding
solution to the above mentioned limitations of the proposed method. More features can

155
be proposed based on characteristics of text components which can withstand arbitrary
movements of text components to track the text in video.
The future work will investigate the methods further to achieve enhanced text
detection and recognition accuracies by utilizing temporal information from video. In
addition, the proposed deblurring work can be extended for the images affected by non-
uniform blur.

156
REFERENCES
Angadi, S., & Kodabagi, M. (2009). A texture based methodology for text region
extraction from low resolution natural scene images. International Journal of
Image Processing, 3(5), 229-245.
Anthimopoulos, M., Gatos, B., & Pratikakis, I. (2013). Detection of artificial and scene
text in images and video frames. Pattern Analysis and Applications, 16(3), 431-
446.
Bernsen, J. (1986). Dynamic thresholding of grey-level images. Paper presented at the
International conference on pattern recognition.
Blanchet, G., & Moisan, L. (2012). An explicit sharpness index related to global phase
coherence. Paper presented at the Acoustics, Speech and Signal Processing
(ICASSP), 2012 IEEE International Conference on.
Blanchet, G., Moisan, L., & Rougé, B. (2008). Measuring the global phase coherence
of an image. Paper presented at the Image Processing, 2008. ICIP 2008. 15th
IEEE International Conference on.
Bouaziz, B., Zlitni, T., & Mahdi, W. (2008). AViTExt: Automatic Video Text
Extraction; A new Approach for video content indexing Application. Paper
presented at the Information and Communication Technologies: From Theory to
Applications, 2008. ICTTA 2008. 3rd International Conference on.
Bruhn, A., Weickert, J., & Schnörr, C. (2005). Lucas/Kanade meets Horn/Schunck:
Combining local and global optic flow methods. International Journal of
Computer Vision, 61(3), 211-231.
Cao, X., Ren, W., Zuo, W., Guo, X., & Foroosh, H. (2015). Scene Text Deblurring
Using Text-Specific Multiscale Dictionaries. Image Processing, IEEE
Transactions on, 24(4), 1302-1314.
Chen, D., & Odobez, J.-M. (2005). Video text recognition using sequential Monte
Carlo and error voting methods. Pattern Recognition Letters, 26(9), 1386-1403.
Chen, D., Odobez, J.-M., & Bourlard, H. (2004). Text detection and recognition in
images and video frames. Pattern recognition, 37(3), 595-608.
Cho, H., Wang, J., & Lee, S. (2012). Text image deblurring using text-specific
properties Computer Vision–ECCV 2012 (pp. 524-537): Springer.
Congjie, M., Yuan, X., Hong, L., & Xiangyang, X. (2005, 0-0 0). A Novel Video Text
Extraction Approach Based on Multiple Frames. Paper presented at the
Information, Communications and Signal Processing, 2005 Fifth International
Conference on.
CUI, Y.-y., YANG, J., & LIANG, D. (2006). An edge-based approach for sign text
extraction. Image Technology, 1, 007.

157
Epshtein, B., Ofek, E., & Wexler, Y. (2010). Detecting text in natural scenes with
stroke width transform. Paper presented at the Computer Vision and Pattern
Recognition (CVPR), 2010 IEEE Conference on.
Ezaki, N., Bulacu, M., & Schomaker, L. (2004). Text detection from natural scene
images: towards a system for visually impaired persons. Paper presented at the
Pattern Recognition, 2004. ICPR 2004. Proceedings of the 17th International
Conference on.
Ezaki, N., Kiyota, K., Minh, B. T., Bulacu, M., & Schomaker, L. (2005). Improved
text-detection methods for a camera-based text reading system for blind
persons. Paper presented at the Document Analysis and Recognition, 2005.
Proceedings. Eighth International Conference on.
Gllavata, J., Ewerth, R., & Freisleben, B. (2004). Text detection in images based on
unsupervised classification of high-frequency wavelet coefficients. Paper
presented at the Pattern Recognition, 2004. ICPR 2004. Proceedings of the 17th
International Conference on.
Guozhu, L., Shivakumara, P., Tong, L., & Chew Lim, T. (2015). Multi-Spectral Fusion
Based Approach for Arbitrarily Oriented Scene Text Detection in Video
Images. Image Processing, IEEE Transactions on, 24(11), 4488-4501. doi:
10.1109/TIP.2015.2465169
Hanif, S. M., & Prevost, L. (2009). Text detection and localization in complex scene
images using constrained adaboost algorithm. Paper presented at the Document
Analysis and Recognition, 2009. ICDAR'09. 10th International Conference on.
Hanif, S. M., Prevost, L., & Negri, P. A. (2008). A cascade detector for text detection
in natural scene images. Paper presented at the Pattern Recognition, 2008.
ICPR 2008. 19th International Conference on.
Hansen, P. C. (1992). Analysis of discrete ill-posed problems by means of the L-curve.
SIAM review, 34(4), 561-580.
Harris, C., & Stephens, M. (1988). A combined corner and edge detector. Paper
presented at the Alvey vision conference.
Hu, P., Wang, W., & Lu, K. (2015, 3-6 Nov. 2015). Video text detection with text edges
and convolutional neural network. Paper presented at the 2015 3rd IAPR Asian
Conference on Pattern Recognition (ACPR).
Huang, W., Lin, Z., Yang, J., & Wang, J. (2013). Text localization in natural images
using stroke feature transform and text covariance descriptors. Paper presented
at the Proceedings of the IEEE International Conference on Computer Vision.
Huang, W., Shivakumara, P., & Tan, C. L. (2008). Detecting moving text in video using
temporal information. Paper presented at the Pattern Recognition, 2008. ICPR
2008. 19th International Conference on.
Huang, X. (2011). A novel approach to detecting scene text in video. Paper presented at
the Image and Signal Processing (CISP), 2011 4th International Congress on.

158
Huang, X., Ma, H., Ling, C. X., & Gao, G. (2014). Detecting both superimposed and
scene text with multiple languages and multiple alignments in video.
Multimedia tools and applications, 70(3), 1703-1727.
Jacob, J., & Thomas, A. (2015, 18-19 Dec. 2015). Detection of multioriented texts in
natural scene images. Paper presented at the 2015 International Conference on
Control, Instrumentation, Communication and Computational Technologies
(ICCICCT).
Jain, A. K., & Yu, B. (1998). Automatic text location in images and video frames.
Pattern recognition, 31(12), 2055-2076.
Ji, R., Xu, P., Yao, H., Zhang, Z., Sun, X., & Liu, T. (2008). Directional correlation
analysis of local Haar binary pattern for text detection. Paper presented at the
Multimedia and Expo, 2008 IEEE International Conference on.
JIANG, R.-j., QI, F.-h., XU, L., WU, G.-r., JIANG, R.-j., QI, F.-h., . . . QI, F.-h. (2006).
Using connected-components' features to detect and segment text. Journal of
Image and Graphics, 11(11), 1653-1656.
Jung, K., Kim, K. I., & Jain, A. K. (2004). Text information extraction in images and
video: a survey. Pattern recognition, 37(5), 977-997.
Karatzas, D., Gomez-Bigorda, L., Nicolaou, A., Ghosh, S., Bagdanov, A., Iwamura,
M., . . . Lu, S. (2015). ICDAR 2015 Competition on Robust Reading. Paper
presented at the Proc. of ICDAR.
Karatzas, D., Shafait, F., Uchida, S., Iwamura, M., Gomez i Bigorda, L., Robles
Mestre, S., . . . de las Heras, L.-P. (2013). ICDAR 2013 robust reading
competition. Paper presented at the Document Analysis and Recognition
(ICDAR), 2013 12th International Conference on.
Khare, V., Shivakumara, P., & Raveendran, P. (2015). A new Histogram Oriented
Moments descriptor for multi-oriented moving text detection in video. Expert
Systems with Applications, 42(21), 7627-7640.
Kim, K. I., Jung, K., & Kim, J. H. (2003). Texture-based approach for text detection in
images using support vector machines and continuously adaptive mean shift
algorithm. Pattern Analysis and Machine Intelligence, IEEE Transactions on,
25(12), 1631-1639.
Kumar, A., Paramesran, R., & Shakibaei, B. H. (2014). Moment domain representation
of nonblind image deblurring. Applied optics, 53(10), B167-B171.
Li, H., Doermann, D., & Kia, O. (2000). Automatic text detection and tracking in
digital video. Image Processing, IEEE Transactions on, 9(1), 147-156.
Li, L., Li, J., Song, Y., & Wang, L. (2010). A multiple frame integration and
mathematical morphology based technique for video text extraction. Paper
presented at the Computer and Information Application (ICCIA), 2010
International Conference on.

159
Li, R., Zeng, B., & Liou, M. L. (1994). A new three-step search algorithm for block
motion estimation. Circuits and Systems for Video Technology, IEEE
Transactions on, 4(4), 438-442.
Lienhart, R., & Wernicke, A. (2002). Localizing and segmenting text in images and
videos. Circuits and Systems for Video Technology, IEEE Transactions on,
12(4), 256-268.
Liu, C., Wang, C., & Dai, R. (2005). Text detection in images based on unsupervised
classification of edge-based features. Paper presented at the Document Analysis
and Recognition, 2005. Proceedings. Eighth International Conference on.
Liu, X. (2008). A camera phone based currency reader for the visually impaired. Paper
presented at the Proceedings of the 10th international ACM SIGACCESS
conference on Computers and accessibility.
Liu, X., & Samarabandu, J. (2006). Multiscale edge-based text extraction from complex
images. Paper presented at the Multimedia and Expo, 2006 IEEE International
Conference on.
Liu, X., & Wang, W. (2012). Robustly extracting captions in videos based on stroke-
like edges and spatio-temporal analysis. Multimedia, IEEE Transactions on,
14(2), 482-489.
Liu, Y., Song, Y., Zhang, Y., & Meng, Q. (2013). A novel multi-oriented Chinese text
extraction approach from videos. Paper presented at the Document Analysis
and Recognition (ICDAR), 2013 12th International Conference on.
Liu, Z., & Sarkar, S. (2008). Robust outdoor text detection using text intensity and
shape features. Paper presented at the Pattern Recognition, 2008. ICPR 2008.
19th International Conference on.
Lu, S., & Tan, C. L. (2006). Camera text recognition based on perspective invariants.
Paper presented at the Pattern Recognition, 2006. ICPR 2006. 18th International
Conference on.
Lucas, S. M., Panaretos, A., Sosa, L., Tang, A., Wong, S., & Young, R. (2003). ICDAR
2003 robust reading competitions. Paper presented at the null.
Minetto, R., Thome, N., Cord, M., Leite, N. J., & Stolfi, J. (2011). Snoopertrack: Text
detection and tracking for outdoor videos. Paper presented at the Image
Processing (ICIP), 2011 18th IEEE International Conference on.
Minetto, R., Thome, N., Cord, M., Leite, N. J., & Stolfi, J. (2013). T-HOG: An
effective gradient-based descriptor for single line text regions. Pattern
recognition, 46(3), 1078-1090.
Mittal, A., Moorthy, A. K., & Bovik, A. C. (2011). Blind/referenceless image spatial
quality evaluator. Paper presented at the Signals, Systems and Computers
(ASILOMAR), 2011 Conference Record of the Forty Fifth Asilomar
Conference on.

160
Mittal, A., Soundararajan, R., & Bovik, A. C. (2013). Making a “completely blind”
image quality analyzer. Signal Processing Letters, IEEE, 20(3), 209-212.
Neumann, L., & Matas, J. (2015). Real-time Lexicon-free Scene Text Localization and
Recognition. IEEE Transactions on Pattern Analysis and Machine Intelligence,
PP(99), 1-1. doi: 10.1109/TPAMI.2015.2496234
Nguyen, P. X., Wang, K., & Belongie, S. (2014). Video text detection and recognition:
Dataset and benchmark. Paper presented at the Applications of Computer
Vision (WACV), 2014 IEEE Winter Conference on.
Otsu, N. (1975). A threshold selection method from gray-level histograms. Automatica,
11(285-296), 23-27.
Ou, W.-w., Zhu, J.-m., & Liu, C.-p. (2004). Text location in natural scene. Journal of
Chinese Information Processing, 5, 006.
Pan, J., Hu, Z., Su, Z., & Yang, M.-H. (2014). Deblurring text images via L0-
regularized intensity and gradient prior. Paper presented at the Computer
Vision and Pattern Recognition (CVPR), 2014 IEEE Conference on.
Pan, Y.-F., Hou, X., & Liu, C.-L. (2011). A hybrid approach to detect and localize texts
in natural scene images. Image Processing, IEEE Transactions on, 20(3), 800-
813.
Pan, Y.-F., Liu, C.-L., & Hou, X. (2010). Fast scene text localization by learning-based
filtering and verification. Paper presented at the Image Processing (ICIP), 2010
17th IEEE International Conference on.
Phan, T. Q., Shivakumara, P., & Tan, C. L. (2012). Detecting text in the real world.
Paper presented at the Proceedings of the 20th ACM international conference
on Multimedia.
Saoi, T., Goto, H., & Kobayashi, H. (2005). Text detection in color scene images based
on unsupervised clustering of multi-channel wavelet features. Paper presented
at the Document Analysis and Recognition, 2005. Proceedings. Eighth
International Conference on.
Sauvola, J., & Pietikäinen, M. (2000). Adaptive document image binarization. Pattern
recognition, 33(2), 225-236.
Sharma, N., Shivakumara, P., Pal, U., Blumenstein, M., & Tan, C. L. (2012). A new
method for arbitrarily-oriented text detection in video. Paper presented at the
Document Analysis Systems (DAS), 2012 10th IAPR International Workshop
on.
Shivakumara, P., Dutta, A., Tan, C. L., & Pal, U. (2014). Multi-oriented scene text
detection in video based on wavelet and angle projection boundary growing.
Multimedia tools and applications, 72(1), 515-539.
Shivakumara, P., Phan, T. Q., Lu, S., & Tan, C. L. (2013). Gradient vector flow and
grouping-based method for arbitrarily oriented scene text detection in video
161
images. Circuits and Systems for Video Technology, IEEE Transactions on,
23(10), 1729-1739.
Shivakumara, P., Phan, T. Q., & Tan, C. L. (2009). Video text detection based on filters
and edge features. Paper presented at the Multimedia and Expo, 2009. ICME
2009. IEEE International Conference on.
Shivakumara, P., Phan, T. Q., & Tan, C. L. (2010). New wavelet and color features for
text detection in video. Paper presented at the Pattern Recognition (ICPR), 2010
20th International Conference on.
Shivakumara, P., Phan, T. Q., & Tan, C. L. (2011). A laplacian approach to multi-
oriented text detection in video. Pattern Analysis and Machine Intelligence,
IEEE Transactions on, 33(2), 412-419.
Shivakumara, P., Sreedhar, R. P., Phan, T. Q., Lu, S., & Tan, C. L. (2012).
Multioriented video scene text detection through bayesian classification and
boundary growing. Circuits and Systems for Video Technology, IEEE
Transactions on, 22(8), 1227-1235.
Shivakumara, P., Trung Quy, P., & Tan, C. L. (2010). New Fourier-Statistical Features
in RGB Space for Video Text Detection. Circuits and Systems for Video
Technology, IEEE Transactions on, 20(11), 1520-1532. doi:
10.1109/TCSVT.2010.2077772
Shivakumara, P., Yuan, Z., Zhao, D., Lu, T., & Tan, C. L. (2015). New Gradient-
Spatial-Structural Features for video script identification. Computer Vision and
Image Understanding, 130, 35-53.
Sun, L., Huo, Q., Jia, W., & Chen, K. (2015). A robust approach for text detection from
natural scene images. Pattern recognition, 48(9), 2906-2920. doi:
http://dx.doi.org/10.1016/j.patcog.2015.04.002
Tang, S., Gong, W., Li, W., & Wang, W. (2014). Non-blind image deblurring method
by local and nonlocal total variation models. Signal Processing, 94, 339-349.
Tesseract. http://code.google.com/p/tesseract-ocr/.
Tsai, T.-H., Chen, Y.-C., & Fang, C.-L. (2009). 2DVTE: A two-directional videotext
extractor for rapid and elaborate design. Pattern recognition, 42(7), 1496-1510.
Wang, H. (2001). Automatic character location and segmentation in color scene
images. Paper presented at the Image Analysis and Processing, 2001.
Proceedings. 11th International Conference on.
Wang, H., & Kangas, J. (2001). Character-like region verification for extracting text in
scene images. Paper presented at the Document Analysis and Recognition,
2001. Proceedings. Sixth International Conference on.
Wang, K., & Belongie, S. (2010). Word spotting in the wild: Springer.

162
Wang, K., & Kangas, J. A. (2003). Character location in scene images from digital
camera. Pattern recognition, 36(10), 2287-2299.
Wang, X., Song, Y., Zhang, Y., & Xin, J. (2015). Natural scene text detection with
multi-layer segmentation and higher order conditional random field based
analysis. Pattern Recognition Letters, 60–61, 41-47. doi:
http://dx.doi.org/10.1016/j.patrec.2015.04.005
Wang, Y.-K., & Chen, J.-M. (2006). Detecting video texts using spatial-temporal
wavelet transform. Paper presented at the Pattern Recognition, 2006. ICPR
2006. 18th International Conference on.
Wang, Y., Yang, J., Yin, W., & Zhang, Y. (2008). A new alternating minimization
algorithm for total variation image reconstruction. SIAM Journal on Imaging
Sciences, 1(3), 248-272.
Wei, Y. C., & Lin, C. H. (2012). A robust video text detection approach using SVM.
Expert Systems with Applications, 39(12), 10832-10840.
WHO. http://www.who.int/blindness.
Wolf, C., & Jolion, J.-M. (2006). Object count/area graphs for the evaluation of object
detection and segmentation algorithms. International Journal of Document
Analysis and Recognition (IJDAR), 8(4), 280-296.
Wolf, C., Jolion, J.-M., & Chassaing, F. (2002). Text localization, enhancement and
binarization in multimedia documents. Paper presented at the Pattern
Recognition, 2002. Proceedings. 16th International Conference on.
Wu, L., Shivakumara, P., Lu, T., & Tan, C. L. (2015). A New Technique for Multi-
Oriented Scene Text Line Detection and Tracking in Video. Multimedia, IEEE
Transactions on, 17(8), 1137-1152.
Xu, J., Shivakumara, P., Lu, T., Tan, C. L., & Uchida, S. (2016). A new method for
multi-oriented graphics-scene-3D text classification in video. Pattern
recognition, 49, 19-42. doi: http://dx.doi.org/10.1016/j.patcog.2015.07.002
Xu, Z., Kai-Hsiang, L., Yun, F., Yuxiao, H., Yuncai, L., & Huang, T. S. (2011). Text
From Corners: A Novel Approach to Detect Text and Caption in Videos. Image
Processing, IEEE Transactions on, 20(3), 790-799. doi:
10.1109/TIP.2010.2068553
Yang, H., Quehl, B., & Sack, H. (2014). A framework for improved video text
detection and recognition. Multimedia tools and applications, 69(1), 217-245.
Yangxing, L., & IKENAGA, T. (2006). A contour-based robust algorithm for text
detection in color images. IEICE transactions on information and systems,
89(3), 1221-1230.
Yao, C., Bai, X., Liu, W., Ma, Y., & Tu, Z. (2012). Detecting texts of arbitrary
orientations in natural images. Paper presented at the Computer Vision and
Pattern Recognition (CVPR), 2012 IEEE Conference on.

163
Ye, Q., & Doermann, D. (2014). Text detection and recognition in imagery: A survey.
Ye, Q., & Doermann, D. (2015). Text detection and recognition in imagery: A survey.
Pattern Analysis and Machine Intelligence, IEEE Transactions on, 37(7), 1480-
1500.
Ye, Q., Jiao, J., Huang, J., & Yu, H. (2007). Text detection and restoration in natural
scene images. Journal of Visual Communication and Image Representation,
18(6), 504-513.
Yi, C., & Tian, Y. (2012). Localizing text in scene images by boundary clustering,
stroke segmentation, and string fragment classification. Image Processing,
IEEE Transactions on, 21(9), 4256-4268.
Yin, X.-C., Yin, X., Huang, K., & Hao, H.-W. (2014). Robust text detection in natural
scene images. Pattern Analysis and Machine Intelligence, IEEE Transactions
on, 36(5), 970-983.
Yin, X. C., Pei, W. Y., Zhang, J., & Hao, H. W. (2015). Multi-Orientation Scene Text
Detection with Adaptive Clustering. IEEE Transactions on Pattern Analysis
and Machine Intelligence, 37(9), 1930-1937. doi:
10.1109/TPAMI.2014.2388210
Yun, S., & Woo, H. (2011). Linearized proximal alternating minimization algorithm for
motion deblurring by nonlocal regularization. Pattern recognition, 44(6), 1312-
1326.
Zhang, H., Liu, C., Yang, C., Ding, X., & Wang, K. (2011). An improved scene text
extraction method using conditional random field and optical character
recognition. Paper presented at the Document Analysis and Recognition
(ICDAR), 2011 International Conference on.
Zhang, J., & Kasturi, R. (2008). Extraction of text objects in video documents: Recent
progress. Paper presented at the The Eighth IAPR International Workshop on
Document Analysis Systems.
Zhang, J., & Kasturi, R. (2014). A novel text detection system based on character and
link energies. Image Processing, IEEE Transactions on, 23(9), 4187-4198.
Zhou, J., Xu, L., Xiao, B., Dai, R., & Si, S. (2007). A robust system for text extraction
in video. Paper presented at the Machine Vision, 2007. ICMV 2007.
International Conference on.
Zhou, Y., Feild, J., Learned-Miller, E., & Wang, R. (2013). Scene text segmentation via
inverse rendering. Paper presented at the Document Analysis and Recognition
(ICDAR), 2013 12th International Conference on.

164
LIST OF PUBLICATIONS AND PAPERS PRESENTED
Published:
[1] Khare, V.; Shivakumara, P.; Raveendran, P., "Multi-oriented moving text
detection," Intelligent Signal Processing and Communication Systems
(ISPACS), 2014 International Symposium on , vol., no., pp.347,352, 1-4
Dec. 2014.
[2] Vijeta Khare, Palaiahnakote Shivakumara, Paramesran Raveendran, “A
NEW Histogram Oriented Moments descriptor for multi-oriented moving
text detection in video”, Expert Systems with Applications, November 2015,
Pages 7627-7640.
[3] Vijeta Khare, Palaiahnakote Shivakumara, Paramesran Raveendran, Michael
Blumenstein, A blind deconvolution model for scene text detection and
recognition in video, Pattern Recognition, Available online 18 January 2016.
Accepted:
[1] “Arbitrarily-Oriented-Multi-Lingual Text Detection in Video” in
Multimedia Tools and Applications.


![[PPT]STRATEGIC MANAGEMENT- CHAPTER SEVEN ... · Web viewOPENING CASE TECHNOLOGY GIANTS’ ACQUISITION STRATEGIES AND THEIR OUTCOMES Online commerce is moving into a consumer-oriented](https://static.fdocuments.us/doc/165x107/5aed90de7f8b9a45568fd836/pptstrategic-management-chapter-seven-viewopening-case-technology-giants.jpg)