Detecting Emergent Conflicts through Web Mining … Emergent Conflicts through Web Mining and...
8
Detecting Emergent Conflicts through Web Mining and Visualization Fredrik Johansson, Joel Brynielsson, Pontus H¨ orling, Michael Malm, Christian M˚ artenson Swedish Defence Research Agency (FOI) Stockholm, Sweden Email: fi[email protected] Staffan Truv´ e, Magnus Rosell Recorded Future AB G¨ oteborg, Sweden Email: [email protected] Abstract—An ocean of data is available on the web. From this ocean of data, information can in theory be extracted and used by analysts for detecting emergent trends (trend spotting). However, to do this manually is a daunting and nearly impossible task. We describe a semi-automatic system in which data is automatically collected from selected sources, and to which linguistic analysis is applied to extract e.g., entities and events. After combining the extracted information with human intelligence reports, the results are visualized to the user of the system who can interact with it in order to obtain a better awareness of historic as well as emergent trends. A prototype of the proposed system has been implemented and some initial results are presented in the paper. Index Terms—Information fusion; trend analysis; trend spot- ting; web harvesting; web mining I. I NTRODUCTION Open source intelligence (OSINT) has become a very im- portant type of information for intelligence analysts all around the world. In a number of recent FOI (Swedish Defence Research Agency) research projects, the need for tools that can support analysts and decision makers with mining web pages, social media, etc. has become obvious. The European Union has a number of battle groups, of which one is the Nordic Battle Group (in which Sweden and other countries are participating with officers and soldiers). Each of these battle groups consists of a battalion sized force, reinforced with combat support elements. At all times, two such battle groups are active and ready for deployments in conflicts where there is a critical need for humanitarian, peacekeeping, or peace enforcing operations. One of the recent conflicts in which the involvement of European Union battle groups has been discussed is the civil war in Libya, where the troops potentially can be used for securing the delivery of aid supplies. Despite the preparedness of the battle groups to act in different environments and circumstances, a lot of planning is required before an actual deployment. Therefore, it is important that escalating or upcoming conflicts can be discovered as early as possible, in order to allow for sufficient planning and training before military units are deployed [1]. Moreover, it is easier to influence global events in their earlier stages than later on. Our belief is that there are many signs of new conflicts or other types of “trends” before they are reported in traditional media and start to become common knowledge. We think that early signs of new conflict areas and trends such as suicide bombings, piracy, or systematic political, religious, and ethnic persecution in many cases are to be found in reports from non-governmental organizations (NGOs) such as Human Rights Watch 1 , Institute for War & Peace Reporting 2 , and International Crisis Group 3 , working in this kind of areas. In addition to detecting new trends of man-made disasters and events such as those already mentioned, the same sources may also be used for obtaining a better preparedness for humanitarian operations due to natural disasters such as drought. Besides NGOs and news agencies, it is at least for developed countries also very likely that signs of emergent trends are to be found in social media of various kind, e.g., Twitter or Facebook. In this paper, we present an idea of how to identify emergent trends by letting an intelligence analyst select a number of data sources (such as web pages and RSS feeds from NGOs), automatically harvest these sources and extract information such as events, places, dates, and actors from the unstructured harvested data, apply statistical analysis on the extracted information, and to present the analyzed information to the user in a graphical user interface which also allows the user to dig deeper into the underlying data and reports. The rest of this paper is organized as follows. In Section II, we present an overview of the proposed tool for semi- automatic trend analysis. In Section III, it is described how a tool called Recorded Future can be used to automatically harvest data and extract useful information such as event and entity types by the use of linguistic analysis. Section IV presents the Ushahidi platform and how this can be used to visualize OSINT extracted from the web, as well as manually created human intelligence (HUMINT) reports. The suggested idea has been implemented into a prototype tool which is described in Section V, in which we also present some initial findings from experiments where we have extracted information regarding protest events from the web. Section VI provides a discussion together with some ideas for future work. Finally, a number of conclusions are presented in Section VII. 1 http://www.hrw.org/ 2 http://www.iwpr.net/ 3 http://www.crisisgroup.org/
Transcript of Detecting Emergent Conflicts through Web Mining … Emergent Conflicts through Web Mining and...

Detecting Emergent Conflicts throughWeb Mining and Visualization
Fredrik Johansson, Joel Brynielsson, Pontus Horling,Michael Malm, Christian Martenson
Swedish Defence Research Agency (FOI)Stockholm, Sweden
Email: [email protected]
Staffan Truve, Magnus RosellRecorded Future AB
Goteborg, SwedenEmail: [email protected]
Abstract—An ocean of data is available on the web. From thisocean of data, information can in theory be extracted and used byanalysts for detecting emergent trends (trend spotting). However,to do this manually is a daunting and nearly impossible task. Wedescribe a semi-automatic system in which data is automaticallycollected from selected sources, and to which linguistic analysisis applied to extract e.g., entities and events. After combiningthe extracted information with human intelligence reports, theresults are visualized to the user of the system who can interactwith it in order to obtain a better awareness of historic as wellas emergent trends. A prototype of the proposed system has beenimplemented and some initial results are presented in the paper.
Index Terms—Information fusion; trend analysis; trend spot-ting; web harvesting; web mining
I. INTRODUCTION
Open source intelligence (OSINT) has become a very im-portant type of information for intelligence analysts all aroundthe world. In a number of recent FOI (Swedish DefenceResearch Agency) research projects, the need for tools thatcan support analysts and decision makers with mining webpages, social media, etc. has become obvious.
The European Union has a number of battle groups, ofwhich one is the Nordic Battle Group (in which Sweden andother countries are participating with officers and soldiers).Each of these battle groups consists of a battalion sizedforce, reinforced with combat support elements. At all times,two such battle groups are active and ready for deploymentsin conflicts where there is a critical need for humanitarian,peacekeeping, or peace enforcing operations. One of the recentconflicts in which the involvement of European Union battlegroups has been discussed is the civil war in Libya, wherethe troops potentially can be used for securing the deliveryof aid supplies. Despite the preparedness of the battle groupsto act in different environments and circumstances, a lot ofplanning is required before an actual deployment. Therefore,it is important that escalating or upcoming conflicts can bediscovered as early as possible, in order to allow for sufficientplanning and training before military units are deployed [1].Moreover, it is easier to influence global events in their earlierstages than later on. Our belief is that there are many signsof new conflicts or other types of “trends” before they arereported in traditional media and start to become common
knowledge. We think that early signs of new conflict areasand trends such as suicide bombings, piracy, or systematicpolitical, religious, and ethnic persecution in many cases areto be found in reports from non-governmental organizations(NGOs) such as Human Rights Watch1, Institute for War &Peace Reporting2, and International Crisis Group3, workingin this kind of areas. In addition to detecting new trendsof man-made disasters and events such as those alreadymentioned, the same sources may also be used for obtaining abetter preparedness for humanitarian operations due to naturaldisasters such as drought. Besides NGOs and news agencies,it is at least for developed countries also very likely that signsof emergent trends are to be found in social media of variouskind, e.g., Twitter or Facebook.
In this paper, we present an idea of how to identify emergenttrends by letting an intelligence analyst select a number ofdata sources (such as web pages and RSS feeds from NGOs),automatically harvest these sources and extract informationsuch as events, places, dates, and actors from the unstructuredharvested data, apply statistical analysis on the extractedinformation, and to present the analyzed information to theuser in a graphical user interface which also allows the userto dig deeper into the underlying data and reports.
The rest of this paper is organized as follows. In SectionII, we present an overview of the proposed tool for semi-automatic trend analysis. In Section III, it is described howa tool called Recorded Future can be used to automaticallyharvest data and extract useful information such as eventand entity types by the use of linguistic analysis. Section IVpresents the Ushahidi platform and how this can be used tovisualize OSINT extracted from the web, as well as manuallycreated human intelligence (HUMINT) reports. The suggestedidea has been implemented into a prototype tool which isdescribed in Section V, in which we also present someinitial findings from experiments where we have extractedinformation regarding protest events from the web. Section VIprovides a discussion together with some ideas for future work.Finally, a number of conclusions are presented in Section VII.
1http://www.hrw.org/2http://www.iwpr.net/3http://www.crisisgroup.org/

Figure 1. Overview of the proposed tool for semi-automatic trend analysis.
II. SYSTEM OVERVIEW OF THE PROPOSED TOOL
We envision a system for detecting emergent trends in whichan intelligence analyst (or some other kind of user) sets up aproject by:
• selecting a set of data sources (e.g., a number of web sitesand RSS feeds from NGOs, news agencies, or other kindsof organizations that may contain useful informationconcerning the development in potential conflict areas).
• determining the rate for how often data is to be updated.• choosing one or several existing extractors for finding
entities and events (or by constructing new ones)• selecting a taxonomy for how to group the extracted event
types.Once a project has been set up and the analyst chooses to
activate it, data is automatically harvested from the selecteddata sources. The content of the data sources is collected on aregular basis determined by the chosen update rate parameter.New data (or all data in the case of a new project whereno previous collection has been made) is after harvesting fedto a linguistic analyzer, in which useful information suchas event types, names, dates, and places is extracted. Theextracted information is used to construct structured OSINTreports, to which the underlying unstructured source data isattached. In addition to these automatically created reports,the idea is that users can add manually created reports fromother kinds of sources, e.g., human intelligence (HUMINT).All the constructed reports are then aggregated into groups,whereupon statistical analysis is applied. The clustered reportsare finally visualized geographically on a map, on which theuser can choose to zoom in and out, watch the developmentover time, and to dig down to the actual data content onwhich the visualized reports are based. An illustration of thissuggested process is shown in Figure 1.
III. HARVESTING THE WEB AND EXTRACTINGINFORMATION USING RECORDED FUTURE
In recent years there has been a growing interest in auto-matic and semi-automatic harvesting and mining of data from
web pages, social media, RSS feeds, etc. (see e.g., [2], [3], [4]).Web harvesting can according to Chen et al. [5] be defined as:
“the process of gathering and organizing unstruc-tured information from pages and data on the Web,”
while the closely related term web mining often is defined as[6], [7]:
“the use of data mining techniques to automaticallydiscover and extract information from web docu-ments and services.”
Many systems have been proposed for various web miningand web harvesting tasks, but here we will focus on the toolRecorded Future (see e.g., [8]), since it offers advanced lin-guistic analysis capabilities such as entity and event extractionusing natural language processing (NLP). Another strengthof Recorded Future is the way it handles time. Rather thanusing the publication date of a text, semantic information fromsentences such as:
About two weeks ago, a hurricane destroyed fivehouses in the southern parts of Massachusetts.
can be used to analyze when an event has taken place, or evenwill take place if the text refers to an event that is expectedto take place in the future.
Overall, Recorded Future has a database-centric view, asillustrated in Figure 2. Around this database, five main com-ponents can be identified [8]:
• Harvesting: a process in which text documents are re-trieved from various sources and stored in the database.The documents are stored for long-term if permitted byterms of use and IPR legislation, otherwise they are onlystored temporarily for the needed analysis.
• Linguistic analysis: the process in which the retrievedtexts are analyzed in order to extract entities, events, timeand location, etc. In contrast to the other components, thelinguistic analysis is language dependent.
• Refinement: additional information can be obtained inthis process by synonym detection, ontology analysis, andsentiment analysis.

• Data analysis: application of statistical and AI-basedmodels such as Hidden Markov Models (HMMs) andArtificial Neural Networks (ANNs) in order to generatepredictions about the future and to detect anomalies inthe data.
• User experience: a web interface for ordinary users tointeract with, and an API for interfacing to other systems.
Figure 2. A database-centric view on Recorded Future (from [8]).
In this work, it is the two first components, i.e., the harvestingand the linguistic analysis, that are of largest interest.
IV. CONSTRUCTING REPORTS AND VISUALIZING THERESULTS USING USHAHIDI
Ushahidi is Swahili for “testimony” or “witness,” and isalso the name of an open source platform that has been usedin several recent crises, such as Haiti, Libya, and Japan [9].Originally the platform was launched during the post-electionviolence in Kenya in the beginning of 2008. Ushahidi makes itpossible for local observers to submit eyewitness reports usingtheir mobile phones or the Internet (e.g., by text messagesor web forms) and increases the situational awareness ofwhat the crisis situation looks like for both ordinary peopleand decision-makers by presenting the reported events ina graphical interface using Google Maps, Yahoo Maps, orOpenStreetMap. An example of the Ushahidi interface isshown in Figure 3, taken from the recent crisis in Libya.
Ushahidi’s possibility to cluster the submitted eyewitnessreports and present them geographically is very appealing andclose to what we would like to accomplish in this project,except for that we would like to present the informationextracted from harvested data sources rather than observationssubmitted by web forms or SMS. Due to this, we have decidedto use Ushahidi as a basis for the proposed system.
In addition to the automatically created OSINT reports,we want the ability to combine those with manually createdreports, concerning HUMINT or other kinds of intelligencethat does not originate from harvested web data. For this kindof reports, we will use Ushahidi’s possibility to send in reportsby the use of web forms, as illustrated in Figure 4. Hence,
Figure 3. An example of the GUI in Ushahidi (from the Libya crisis).
Figure 4. An example of a HUMINT report created using Ushahidi’s webform for submitting reports.
we envision an analyst-centric tool where human intelligenceand information from web sensors are fused and visualizedin order to obtain situational awareness [10] and facilitatesensemaking [11] with regard to trends concerning upcomingconflicts.
To put this idea into context, we envision a system designbased on the mixed initiative paradigm [12], [13], i.e., asystem where the analyst uses a number of different “tools”to both interact with and influence the system in order tocontinuously refine his/her understanding of both the situ-ation itself as well as the reasons behind it. Here, we are
motivated by the increase of publically available on-line newsinformation in combination with the ease for first respondersto contribute with own reports via, e.g., mobile devices.Hence, the analyst has got hold of many types of informationfragments stemming from his own subjective ideas, HUMINTreports, news feeds, governmental/organizational information,classified intelligence databases, etc. A natural way for anorganization to implement a trend spotting tool according tothese ideas would then be to maintain its own Ushahidi serverinstallation connected to databases of interest and a graphicaluser interface letting the analyst combine different kinds ofinformation pieces that are temporally and geographicallycoded. Running one’s own server makes it possible to combinepublic sources with own, possibly secret, information. Wethink primarily of three types of information: 1) structured,continuously updated, and relevant web information such asthe Recorded Future database, 2) information gathered inreal-time by observers, 3) classified intelligence products.When combined, a system comprising all these three aspectswould 1) provide enough statistic and linguistic power todetect emerging trends, 2) provide the means to gather reportsfrom, e.g., soldiers present at an international mission or firstresponders reporting directly from a crisis situation, 3) makeit possible to let the trend analysis take a, possibly large,classified data set into account. In particular, events can bevisualized both spatially and temporally over time which ishelpful for understanding eventual trends. In practice, theactual design of a secret system would require the use of aunidirectional security gateway that lets the open informationflow into the secret system but not the other way around.
V. THE IMPLEMENTED TOOL
In order to demonstrate the usefulness of the proposedsystem, we have implemented a prototype tool which com-bines the strengths of Recorded Future and Ushahidi, as willbe explained below. We have in Recored Future chosen anumber of data sources, which e.g., consist of RSS feeds fromthe organization Human Rights Watch and web sites fromsome news agencies. A number of event extractors have beenconstructed which are used to extract events. Once the eventshave been extracted from the harvested data, the event typeis together with location, date and time, etc. used to constructreports which are saved in a .csv (comma-separated values)file, following the format:
1) Id (e.g., 2022)2) Title (e.g., Wrenching Photos Of The Inflation And
Unemployment Protests Tearing Apart Tunisia)3) Date and time (e.g., 2010-12-27 00:00:00)4) Location (e.g., Tunisia)5) Message (e.g., Frustration over high unemployment and
rising food prices has erupted in deadly riots in Tunisiawhere clashes between youth protesters and securityforces killed at least 23 people over the past weekaccording to UPI.)
6) Event type (e.g., Protest)7) Latitude (e.g., 35.418736)
8) Longitude (e.g., 9.987493)9) Approved (e.g., YES)
10) Verified (e.g., NO)
We have set up an Apache web server on which we havecreated a MySQL database and installed the Ushahidi platformafter downloading the source code from https://github.com/ushahidi.
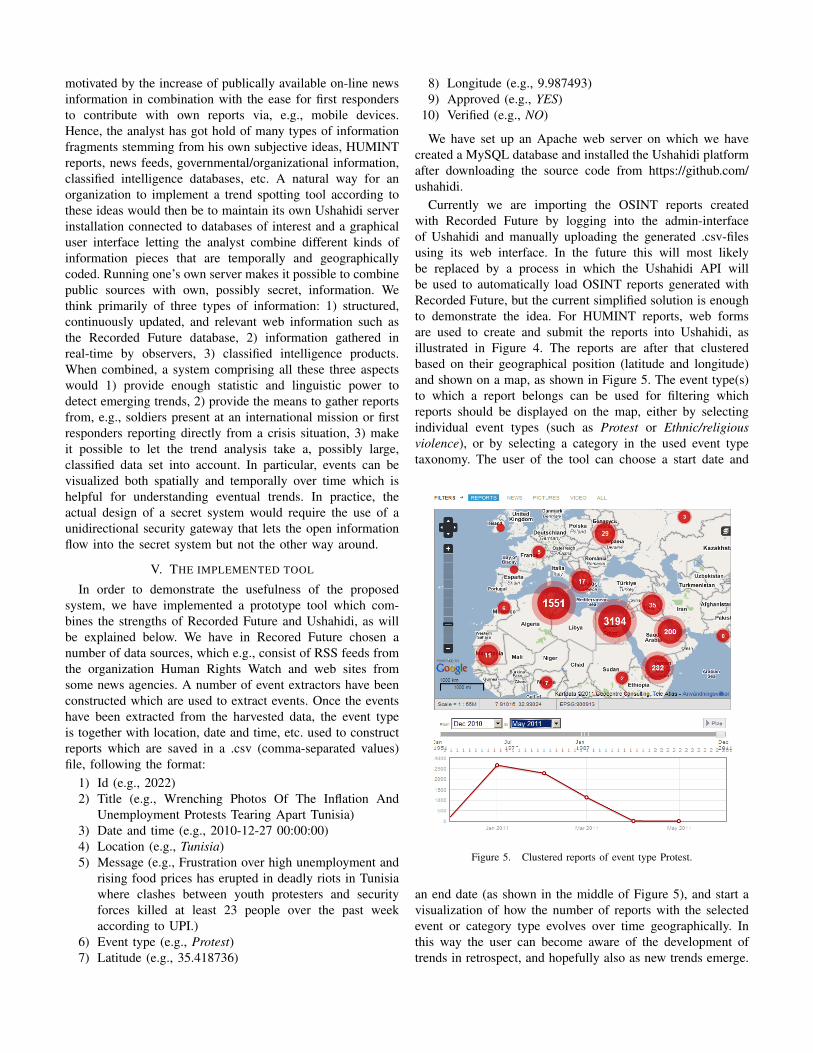
Currently we are importing the OSINT reports createdwith Recorded Future by logging into the admin-interfaceof Ushahidi and manually uploading the generated .csv-filesusing its web interface. In the future this will most likelybe replaced by a process in which the Ushahidi API willbe used to automatically load OSINT reports generated withRecorded Future, but the current simplified solution is enoughto demonstrate the idea. For HUMINT reports, web formsare used to create and submit the reports into Ushahidi, asillustrated in Figure 4. The reports are after that clusteredbased on their geographical position (latitude and longitude)and shown on a map, as shown in Figure 5. The event type(s)to which a report belongs can be used for filtering whichreports should be displayed on the map, either by selectingindividual event types (such as Protest or Ethnic/religiousviolence), or by selecting a category in the used event typetaxonomy. The user of the tool can choose a start date and
Figure 5. Clustered reports of event type Protest.
an end date (as shown in the middle of Figure 5), and start avisualization of how the number of reports with the selectedevent or category type evolves over time geographically. Inthis way the user can become aware of the development oftrends in retrospect, and hopefully also as new trends emerge.

A. Findings
We have from our selected data sources collected dataduring the first quarter of 2011. The harvested data also includementions of some historic as well as future events, sinceRecorded Future uses the extracted and estimated time forthe described event rather than the publication time. However,the major portion of the data concern events during Q1, 2011.From this data set containing texts on various themes, 7251Protest events have been extracted, out of which 5861 arebelieved to concern the first three months of 2011 accordingto the linguistic analysis performed by Recorded Future. Theprotest events have been identified using a trained protestextractor, which was constructed using the Recorded Futureevent extractor framework.
Protests in the World, Q1 2011
Time
Num
ber o
f men
tions
050
100
150
200
2011-01-01 2011-01-18 2011-02-04 2011-02-21 2011-03-10 2011-03-27
2011-01-25
Figure 6. Number of Protest events in the world.
Once the Protest events have been extracted, they have beenused for constructing OSINT reports on the format describedearlier (it should be noted that many of these reports in asense are “duplicates,” since they contain the same informationbut come from various sources). In Figure 6 it is shown howthe number of mentions of protests taken place anywhere inthe world has varied over the first quarter of 2011 (basedon the dataset described above). As seen in Figure 5, mostof the Protest events in the dataset originate from countriessuch as Tunisia and Egypt where the so called Arabian springhas taken place. Therefore, we also made histograms of thenumber of extracted protest events in Tunisia and Egypt, seeFigures 7 and 8. To find the events in Tunisia and Egypt weused a list of major cities in both countries to group eventstogether. Although this simple approach misses some of theevents it still gives a good picture of the trend. From thehistograms, it is quite obvious how the Tunisia protests precedethose in Egypt.
Protests in Tunisia, Q1 2011
Time
Num
ber o
f men
tions
050
100
150
200
2011-01-02 2011-01-17 2011-02-01 2011-02-16 2011-03-03 2011-03-18
2011-01-25
Figure 7. Number of Protest events in Tunisia.
Protests in Egypt, Q1 2011
Time
Num
ber o
f men
tions
050
100
150
200
2011-01-01 2011-01-18 2011-02-04 2011-02-21 2011-03-10 2011-03-27
2011-01-25
Figure 8. Number of Protest events in Egypt.
Since we have not collected data long enough to see thetrend development over a long time horizon, we currentlyhave to focus on trend development on a short basis forthe harvested data. It is rather troublesome to illustrate theinteractive aspects of the tool in paper format, but Figures9 and 10 give an idea of how the number of protests havedeveloped in Northern Africa from January 2011 to February2011 (notice that the numbers in the figures indicate the totalnumber of Protest events, i.e., the number of reported eventsfor Tunisia was 990− 721 = 169 in February). By watchingthe development in the region, it would in February 2011

Figure 9. Number of Protest events until the end of January 2011.
Figure 10. Number of Protest events until the end of February 2011.
have been possible for a user of the tool to see a suddenrise in the number of protests in Egypt, but also that therewere indications that the Arabian Spring was about to spreadto Libya. In the same manner, it can be seen that the situationin Tunisia had started to calm down at that time. However, itmight also be the case that the decline in media attention inTunisia is due to that all attention was brought over to Egypton January 25 when the 2011 Egyptian revolution began. Apreliminary hypothesis that we have is that a rise of mediaattention covering a specific area tends to dominate otherattention covering the same domain area, e.g., that the area“protests in north Africa,” came to be dominated by the 2011Egypt revolution although there were still frictions in Tunisiathat would have been reported on if the Egypt crisis wouldnot have taken place. This trend can be seen in Figures 7 and8 where the media reports covering Tunisia suddenly dropsto almost zero on January 25 when the Egyptian revolutionbegan (“the day of rage”). Also, it is interesting to note thatthe number of protest events in Egypt almost dominates theamount of protest reports in the whole world at the time ofthe onset of the revolution, which might provide empiricalevidence for a second hypothesis with regard to the totalamount of news information in the media. That is, if a protest
event is of significant interest, it might be the case that thisprotest event totally dominates the media coverage for sometime.
VI. DISCUSSION AND FUTURE WORK
A related idea to discover emerging trends through harvest-ing and analyzing data from the web is to analyze what kind ofweb searches that are made and how this varies over time. Atool that can be used for such trend analysis is Google Trends[14], in which the number of searches on specific terms canbe compared relative to the total number of Google searchesdone over time. In a number of recent papers it has beensuggested that the use of Google Trends can be useful todetect present [15], [16] as well as future trends [17], [18] indiverse areas. However, there is also recent research suggestingthat Google Trends are not always a good predictor, e.g., forsome congressional elections in the United States [19], [20].Whether web searches alone are suitable for trend spotting ornot is probably very context dependent. For the situation inwhich we would like to identify potential upcoming conflictareas, we do not think that the frequency of web searchesare enough, since most people will not make searches one.g., “Aden” and “piracy” before the reasons for making suchsearches are already common knowledge. However, it is ourhypothesis that an increasing number of texts about such thingswill be published on web pages from NGOs (or other typesof similar organizations) working in the areas before most ofthe rest of the world learns about it, making it possible to dotrend spotting based on such material.
Although we think that many trends can be identifiedthrough web mining and text analysis, this does not mean thatspecific events can be predicted. If a trend of suicide bombingsis started in some region, this can be discovered by harvestingthe news media, but we will not be able to predict individualsuicide bombings using this method since it is very unlikelythat people will make postings of this on the web before theactual attack. Furthermore, it should be noted that we currentlyonly deal with texts in English, since the linguistic analysisdepends on natural language processing. Support for analyzingSwedish as well as other languages can therefore be of interestfor the future.
In the work presented in this paper we have used Ushahidias a tool for mapping the reports geographically and visu-alizing them to the user. There are of course other optionsas well. One such option is to create .kml (keyhole markuplanguage) files instead of .csv files, and to display the contentof these files using Google Earth. An example of this is shownin Figure 11, in which we have plotted the extracted Protestevents using Google Earth. Our impressions so far is that it asa user is more convenient to work with Ushahidi than GoogleEarth for the tasks of interest for this paper. As an example,the clustering in Ushahidi allows for a gradual zooming inon interesting regions, while reports from one country areeither clustered together into one cluster or “exploded” intothe individual reports in Google Earth. Much of this can be

Figure 11. Protest events plotted using Google Earth.
extended by making use of the Google Earth API, but Ushahidiis currently better suited for our needs out-of-the-box.
To extract locations, dates, names, etc. from unstructuredtext is a challenging active research problem often referred toas entity extraction or named entity recognition. Many systemsfor entity extraction have been developed, such as ANNIE(part of the GATE distribution [21]) and TREX [22]. Mostapproaches use either handcrafted rule-based algorithms orstatistical machine learning models. Although much researchhas been devoted to entity extraction, it is to the best of ourknowledge more uncommon to also use the extracted entitiesfor extraction of events as done in the Recorded Future tool.An exception is the event data extracted in the Defense Ad-vanced Research Projects Agency (DARPA) funded ICEWSproject [1] and the previous National Science Foundation(NSF) funded KEDS project [23], [24]. However, their focusseems to be solely on political events, while our approachis more general and can take more types of intelligence intoaccount.
A. Future work
Currently, the Verified attribute is automatically set to NOfor all OSINT reports. The analyst can manually change thevalue of the attribute to YES in the Ushahidi interface forreports that in some way have been confirmed, but due to theamount of automatically created OSINT reports, this can be alabor intensive process. For the future it would be interestingto rank the source reliability and report credibility, and to usethese measures in order to try to automatically verify some
reports (e.g., reports that come from trusted news sources).One potential way of making such rankings is to use linkanalysis techniques such as HITS [25] or PageRank [26].Such techniques can also be used to automatically detect datasources that may be useful for the trend analysis at hand.
As has been described in Section V, the way users of thetool can detect trends is by looking for how the number ofreports with a certain characteristic (event type or category)changes over time. A possible continuation of this thought isto let the computer detect this kind of changes automatically,and offer a “relative” mode in which the user is shown placeswith a large positive derivative in the number of reports witha certain characteristic, in addition to the “absolute” modewhich is offered in the tool already today. Since the numberof reports from different sources varies over time, it wouldalso be of interest to use the fraction of events of a specifictype (cf. the approach used in [27]). Another plan for futurework is to add support for analysis of more languages, as hasbeen indicated earlier.
As has been argued in this paper, the proposed systemis expected to (at least to some extent) be able to forecastescalating conflicts and “hot spots” of various types. But howwell will it perform? One potential check could be to let itharvest old archived, since then unchanged, flows of informa-tion up to some specified date and from this try to forecastwhat was then the future. Today we know what actuallyhappened then, and this can be compared with these forecasts.However, the concept “know what actually happened” is rathersubjective, and some kind of objectively coded information on
the relevant events, their type, actors, start dates, etc. is needed.One way could be to use the datasets maintained in TheUppsala Conflict Data Program (UCDP) at Uppsala University(see [28]) for future, more systematic, benchmarking. Thesedatasets contain, coded with a given precision, the start andend dates for armed conflicts of various kinds where at leastone side is a government of a state, and where the conflictresults in at least 25 battle-related deaths during one or morecalendar years [29].
VII. CONCLUSIONS
We have in this paper proposed a semi-automatic systemfor trend spotting to be used by e.g., intelligence analystswhen trying to figure out where or what the next conflict willbe that may need military intervention of some sort, be ithumanitarian, peacekeeping or peace enforcing. An overviewof the proposed system has been given, in which automatedweb harvesting is used to collect data from open sourcessuch as web pages and RSS feeds. Once data have beenharvested, next step is to extract entities and events from thecollected texts using natural language processing, in order touse them for automatic report construction. By combining theextracted OSINT with manually constructed HUMINT reports,a good foundation for trend analysis is offered. The reports areclustered based on their geographical position (latitude andlongitude), whereupon they are visualized on a map, wherethe analyst can zoom in and out, look at the developmentover time, and access the content of the individual OSINTand HUMINT reports when needed.
A prototype tool has been developed to demonstrate thesuggested concept. This tool relies on Recorded Future forthe web harvesting and the extraction of e.g., location, dates,and events, while the creation of HUMINT reports and thevisualization is accomplished using the Ushahidi platform. Anexample of how the tool can be used to find informationconcerning protest events such as demonstrations has beengiven, in which we e.g., have analyzed how the protests havespread during the so called Arabian spring.
ACKNOWLEDGEMENTS
This work was supported by the R&D programme of theSwedish Armed Forces and by Recorded Future AB, and isalso a supporting work for the Alert4All research project4,which is funded under the European Union Seventh Frame-work Programme under contract no 261732.
REFERENCES
[1] S. P. O’Brien, “Crisis early warning and decision support: Contemporaryapproaches and thoughts on future research,” International StudiesReview, vol. 12, pp. 87–104, 2010.
[2] M. A. Russell, Mining the Social Web. O’Reilly, 2011.[3] N. Memon, D. Hicks, and H. Larsen, “Harvesting terrorists information
from web,” in Proceedings of the 11th International Conference onInformation Visualization, 2007, pp. 664–671.
4http://www.alert4all.eu/
[4] M. L. Nelson, J. A. Smith, and I. G. del Campo, “Efficient, automaticweb resource harvesting,” in Proceedings of the 8th annual ACMinternational workshop on Web information and data management.New York, NY, USA: ACM, 2006, pp. 43–50. [Online]. Available:http://doi.acm.org/10.1145/1183550.1183560
[5] H. Chen, J. Qin, E. Reid, Y. Zhou, and M. Sageman, TerrorismInformatics – Knowledge Management and Data Mining for HomelandSecurity. Springer, 2008, ch. Case Study of Jihad on the Web, pp.221–235.
[6] R. Kosala and H. Blockeel, “Web mining research: a survey,” ACMSIGKDD, vol. 2, pp. 1–15, 2000.
[7] O. Etzioni, “The world wide web: quagmire or gold mine?” Communi-cations of the ACM, vol. 39, pp. 65–68, 1996.
[8] Recorded Future, “Recorded future – a white paper on temporalanalytics,” 2010. [Online]. Available: http://blog.recordedfuture.com/tag/white-paper/
[9] Ushahidi. [Online]. Available: http://www.ushahidi.com/[10] M. R. Endsley, “Toward a theory of situation awareness in dynamic
systems,” Human Factors, vol. 37, no. 1, pp. 32–64, Mar. 1995.[11] K. E. Weick, K. M. Sutcliffe, and D. Obstfeld, “Organizing and the
process of sensemaking,” Organization Science, vol. 16, no. 4, pp. 409–421, Jul.–Aug. 2005.
[12] M. A. Hearst, J. F. Allen, C. I. Guinn, and E. Horvitz, “Trends &controversies: Mixed-initiative interaction,” IEEE Intelligent Systems,vol. 14, no. 5, pp. 14–23, Sep./Oct. 1999.
[13] G. Tecuci, M. Boicu, C. Ayers, and D. Cammons, “Personal cognitiveassistants for military intelligence analysis: Mixed-initiative learning,tutoring, and problem solving,” in Proceedings of the First InternationalConference on Intelligence Analysis, McLean, Virginia, May 2005.
[14] Google. [Online]. Available: http://www.google.com/trends[15] H. Choi and H. Varian, “Predicting the present with Google trends,”
Google Inc., Tech. Rep., 2009.[16] J. Ginsberg, M. H. Mohebbi, R. S. Patel, L. Brammer, M. S. Smolinski,
and L. Brilliant, “Detecting influenza epidemics using search enginequery data,” Nature, vol. 457, pp. 1012–1015, 2009.
[17] S. Asur and B. A. Huberman, “Predicting the future with social media,”HP Laboratories, Tech. Rep. HPL-2010-53, 2010.
[18] A. Tumasjan, T. O. Sprenger, P. G. Sandner, and I. M. Welpe, “Predictingelections with Twitter: What 140 characters reveal about politicalsentiment,” in Proceedings of the 4th International AAAI Conferenceon Weblogs and Social Media, 2010.
[19] C. Lui, P. T. Metaxas, and E. Mustafaraj, “On the predictability of theU.S. elections through search volume activity,” in Proceedings of theIADIS International e-Society 2011, 2011.
[20] D. Gayo-Avello, P. T. Metaxas, and E. Mustafaraj, “Limits of electoralpredictions using Twitter,” in Proceedings of the 5th International AAAIConference on Weblogs and Social Media, 2011.
[21] H. Cunningham, D. Maynard, K. Bontcheva, and V. Tablan, “Gate: Aframework and graphical development environment for robust nlp toolsand applications,” in Proceedings of the 40th Anniversary Meeting ofthe Association for Computational Linguistics, 2002.
[22] J. Iria, “T-rex: A flexible relation extraction framework,” in In Proceed-ings of the 8th Annual Colloquium for the UK Special Interest Groupfor Computational Linguistics (CLUK’05, 2005.
[23] P. A. Schrodt, “Twenty years of the kansas event data system project,”The Political Methodologist, vol. 14, pp. 2–8, 2006.
[24] P. A. Schrodt and D. J. Gerner, “An event data analysis of third-partymediation,” Journal of Conflict Resolution, vol. 48, pp. 310–330, 2004.
[25] J. Kleinberg, “Authoritative sources in a hyperlinked environment,”Journal of the Association for Computing Machinery, vol. 46, no. 5,pp. 604–632, 1999.
[26] L. Page, S. Brin, R. Motwani, and T. Winograd, “The pagerank citationranking: Bringing order to the web,” Stanford University, Tech. Rep.,1998.
[27] R. Colbaugh and K. Glass, “Early warning analysis for social diffu-sion events,” in Proceedings of the IEEE International Conference onIntelligence and Security Informatics (ISI 2010), 2010.
[28] Uppsala Conflict Data Program, “UCDP database.” [Online]. Available:http://www.pcr.uu.se/research/ucdp/database/
[29] N. P. Gleditsch, P. Wallensteen, M. Eriksson, and M. Sollenberg, “Armedconflict 1946-2001: A new dataset,” Journal of Peace Research, vol. 39,no. 5, pp. 615–637, 2002.