Emergent Biology Through Integration and Mining Of Microarray Datasets Lance D. Miller GIS...
32
ergent Biology Through Integration and Mini Of Microarray Datasets Lance D. Miller GIS Microarray & Expression Genomics
-
date post
24-Jan-2016 -
Category
Documents
-
view
220 -
download
0
Transcript of Emergent Biology Through Integration and Mining Of Microarray Datasets Lance D. Miller GIS...

Emergent Biology Through Integration and MiningOf Microarray Datasets
Lance D. MillerGIS Microarray & Expression Genomics
Mining of expression data to understandthe molecular composition of human
cancers and to define componentsof the tumor molecular profile
with mechanistic and clinical importance.
FOCUS:

2001, PNAS

Molecular classes are predictive of outcome
overall survival: relapse-free survival:

70-gene prognosis classifier for predicting riskof distant metastasis within 5 years
Van’t veer, et. al.

Van’t veer, et. al.

Sotiriou, et. al.

Though each tumor is molecularly unique,there exist common transcriptional cassettesthat underly biological and clinical propertiesof tumors that may be of diagnostic,prognostic and therapeutic significance.

GOAL:
Mining of expression data to understandthe molecular composition of human
cancers and to define componentsof the tumor molecular profile
with mechanistic and clinical importance.

The GIS Perpetual Array Platform

Integration of Independent DatasetsPerou et. al., 1999 Sorlie et. al., 2001 West et. al., 2001

Meta-Analysis of Breast Cancer Datasets:
dataset source sample size array format
1. Miller-Liu: unpublished 61 tumors: 39 ER+, 22 ER- 19K spotted oligo
2. Sotiriou-Liu: submitted: PNAS 99 tumors: 34 ER+, 65 ER- 7.6K spotted cDNA
3. Gruvberger-Meltzer: Cancer Research 47 tumors: 23 ER+, 24 ER- 6.7K spotted cDNA
4. Sorlie-Borrensen-Dale: PNAS 74 tumors: 56 ER+, 18 ER- 8.1K spotted cDNA
5. van’t Veer-Friend: Nature 98 tumors: 59 ER+, 39 ER- 25K spotted oligo
6. West-Nevins: PNAS 49 tumors: 25 ER+, 24 ER- 7.1K Affymetrix
total: 428 tumors, ~73,500 probes
(Adaikalavan Ramasamy et. al.)

META MADB: The Construct
1. Extract and Format the Data 2. Link sample/probe info via unique keys3. Log Transform and Normalize4. Filter Genes and Arrays5. Apply Statistical Tests
Building the Matrix
Creating a Universe
1. Apply UniGene ID as Unifying Key2. Remove Gene Redundancy 3. Extract p values, d values, z-scores4. Set p value threshold5. Merge Datasets

META MADB

META MADB


d values (difference of average expression)
T1 T2 T3 T4 T5 …Tn T1 T2 T3 T4 T5 …Tn
gene1 : e1 e2 e3 e4 e5 …en e1 e2 e3 e4 e5 …en
d = average e [ER+] average e [ER-]/
ER+ ER-


Identifying Grade-Specific Genesin Hepatocellular Carcinoma
• Sample: 10 cases of each class• Sample collection: HBV(+)• Array: Human 19K Oligonucleotide array• Analysis : 50 arrays
OAH AAH G1 G2 G3
HCC Progression
Pre-neoplastic lesions
Adenomatous hyperplasiaordinary atypical
HCC Grade 1, 2, 3

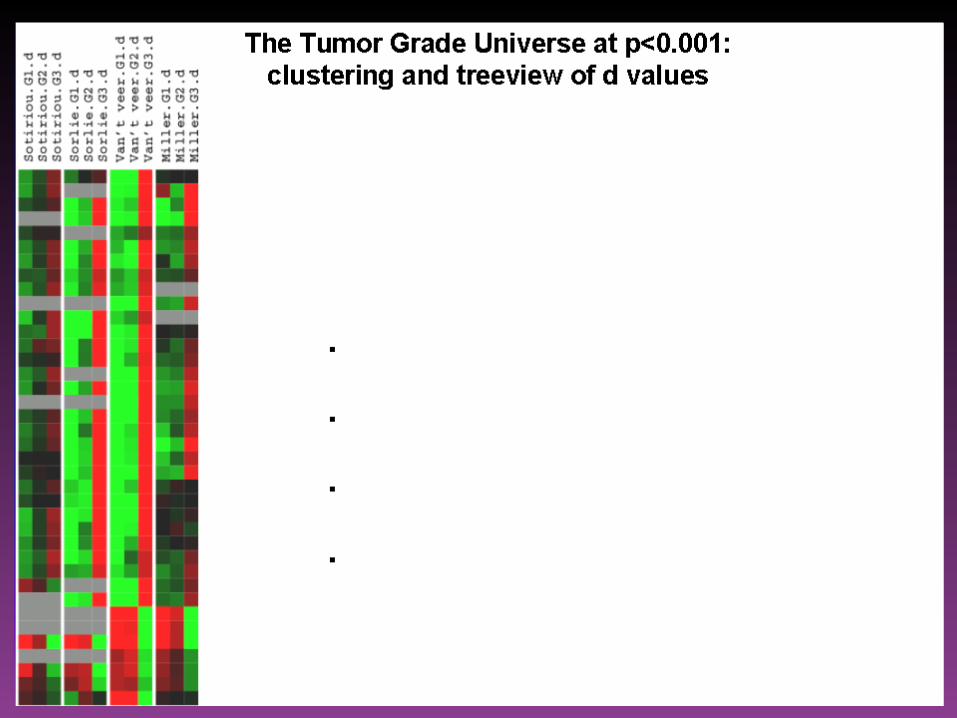
Identifying Grade-Specific Genesin Hepatocellular Carcinoma

Identifying Grade-Specific Genesin Hepatocellular Carcinoma

Breast Cancer Grade-Associated Genes asPredictors of HCC Grade?
HCC
BC

ORC6L DNA replicationTROAP M/G1 cell adhesionBUB1 G2/M mitotic spindle checkpoint; oncogenesisCKS2 G2/M cytokinesisMELK G2 tyr/ser/thr kinase activityCDC20 G2/M regulation of cell cycleHN1 G2/M UnknownMCM6 G1/S DNA replication initiationCDC2 G2 mitotic initiationUBE2C G2 cyclin catabolismTOP2A G2 DNA metabolismCDKN3 M/G1 regulation of CDK activityPTTG1 M/G1 mitotic regulation; oncogenesisE2-EPF M/G1 ubiquitin cycleFLJ23462 electron transportGATA3 embryogenesis
Breast Cancer Grade-Associated Genes asPredictors of HCC Grade?
HCC

UG Description Fold Change 2T47D MCF-7 ZR75-1 SAGE ERE (-2)Interleukin 6 signal transducer (gp130, oncostatin M receptor) 2.5 ++ +Insulin-like growth factor binding protein 4 2.1 + + + +Seven in absentia homolog 2 (Drosophila) 1.7 + +Matrix metalloproteinase 7 (matrilysin, uterine) -1.7 ++ +Stanniocalcin 2 5.0 ++ + + ++Nuclear receptor interacting protein 1/RIP140 1.6 + + +GREB1 protein 3.1 +Serum-inducible kinase -2.0 + +Amphiregulin 3.9 ++ +CD7 antigen (p41) -2.5 + +Duodenal cytochrome -2.1 + +Thrombospondin 1 2.4 + +Putative transmembrane protein -3.8 + + +++Stromal cell-derived factor 1 3.8 ++ ++Retinoblastoma binding protein 8 2.2 ++ + + ++Janus kinase 1 (a protein tyrosine kinase) 4.9 ++ ++protein kinase H11 1.5Olfactomedin 1 3.0 ++DEAD/H (Asp-Glu-Ala-Asp/His) box polypeptide 10 (RNA helicase) 2.3 + +Hypothetical protein similar to mouse Dnajl1 2.5 + +++Putative protein kinase 1.7
2.5 +UDP-Gal:betaGlcNAc beta 1,4- galactosyltransferase, polypeptide 1 3.7 + + ++Hypothetical protein FLJ14299/Similar to nocA zinc-finger protein 2.5 ++Immunoglobulin superfamily, member 4 2.2 + ++Cyclin G2 -2.6 ++ +Sialyltransferase 1 beta-galactoside alpha-2,6-sialytransferase -2.0 +Chitobiase, di-N-acetyl- -1.9 ++Arachidonate 12-lipoxygenase, 12R type -4.0 ++ +Purinergic receptor (family A group 5) -2.3 +G protein-coupled receptor kinase 7/Binds Erbeta -1.8 + +
Estrogen Responsive Genes in vitro (Chin-Yo Lin)
UG Description Fold Change 2T47D MCF-7 ZR75-1 SAGE ERE (-2)Interleukin 6 signal transducer (gp130, oncostatin M receptor) 2.5 ++ +Insulin-like growth factor binding protein 4 2.1 + + + +Seven in absentia homolog 2 (Drosophila) 1.7 + +Matrix metalloproteinase 7 (matrilysin, uterine) -1.7 ++ +Stanniocalcin 2 5.0 ++ + + ++Nuclear receptor interacting protein 1/RIP140 1.6 + + +GREB1 protein 3.1 +Serum-inducible kinase -2.0 + +Amphiregulin 3.9 ++ +CD7 antigen (p41) -2.5 + +Duodenal cytochrome -2.1 + +Thrombospondin 1 2.4 + +Putative transmembrane protein -3.8 + + +++Stromal cell-derived factor 1 3.8 ++ ++Retinoblastoma binding protein 8 2.2 ++ + + ++Janus kinase 1 (a protein tyrosine kinase) 4.9 ++ ++protein kinase H11 1.5Olfactomedin 1 3.0 ++
2.3 + +Hypothetical protein similar to mouse Dnajl1 2.5 + +++Putative protein kinase 1.7
2.5 +3.7 + + ++2.5 ++
Immunoglobulin superfamily, member 4 2.2 + ++Cyclin G2 -2.6 ++ +Sialyltransferase 1 beta-galactoside alpha-2,6-sialytransferase -2.0 +Chitobiase, di-N-acetyl- -1.9 ++Arachidonate 12-lipoxygenase, 12R type -4.0 ++ +Purinergic receptor (family A group 5) -2.3 +G protein-coupled receptor kinase 7/Binds Erbeta -1.8 + +

UG Description Fold Change 2T47D MCF-7 ZR75-1 SAGE ERE (-2)Interleukin 6 signal transducer (gp130, oncostatin M receptor) 2.5 ++ +Insulin-like growth factor binding protein 4 2.1 + + + +Seven in absentia homolog 2 (Drosophila) 1.7 + +Matrix metalloproteinase 7 (matrilysin, uterine) -1.7 ++ +Stanniocalcin 2 5.0 ++ + + ++Nuclear receptor interacting protein 1/RIP140 1.6 + + +GREB1 protein 3.1 +Serum-inducible kinase -2.0 + +Amphiregulin 3.9 ++ +CD7 antigen (p41) -2.5 + +
1 2 3 4 5 6
(p<0.001)
Estrogen-Responsive in vitro and ER Status-Associated in vivo
E2 E2 + ICI E2 + CHX

Identifying Cancer-Linked Genesin Epithelial Adenocarcinomas
Datasets: 3 gastric, 3 prostate, 2 liver, 1 lung

selection at p<0.001 242 Genes that Distinguish Tumor from Normalat p<0.001 in at least 3 of the 4 Tumor Types

database components:
internal and external datasets derived from:
- tumor studies (clinical samples)
- in vitro, pathway studies (eg, timecourse)
- SAGE data
- mouse studies (in vitro/in vivo)
An Integrated Database for Pan-CancerMeta-Analysis of Gene Expression Data
Summary

Derive expression signatures for all major factors known or suspected to have prognostic value
Determine the reliability of expression signatures in outcome prediction
Expand integrated database for pan- cancer meta-analysis
Integrate expression profiling into clinical decision making
Future Directions

Acknowledgements
Catholic University of KoreaSuk-Woo NamJung Yong Lee
GISAdai Ramasamy Liza VergaraPhil LongChin-Yo Lin Benjamin Mow