Detailed Empirical Data & 5 Analysis
111
Detailed Empirical Data & Analysis 5 Disclaimer: The information presented in this document is a draft for discussion only and should not be distributed further by the recipient nor relied on by any third party without TBI's prior written consent. To be read in support of TBI-P4P Ethiopia Digital Transformation Diagnostic: Preliminary Findings
Transcript of Detailed Empirical Data & 5 Analysis

Detailed Empirical Data & Analysis5
Disclaimer: The information presented in this document is a draft for discussion only and should not be distributed further by the recipient nor relied on by any third party without TBI's prior written consent.
To be read in support of
TBI-P4P Ethiopia Digital Transformation Diagnostic: Preliminary Findings

Ethiopia Macro Overview5a

Ethiopia’s economic growth has been strong, averaging 10% annually since 2009, yet overall incomes are still comparatively low
3
8.80%
12.55%11.18%
8.65%
10.58% 10.26% 10.39%9.43% 9.50%
6.81%
-4%
-2%
0%
2%
4%
6%
8%
10%
12%
14%
2009 2010 2011 2012 2013 2014 2015 2016 2017 2018
Ethiopia Kenya Rwanda Nigeria Sub-Saharan Africa
➢ GDP Growth rate is strong, averaging 10% in the past ten years and is
largely driven by the services and industrial sectors, and by the
construction sector within industry.
➢ GDP per capita has risen from $559 in 2013 to over $883 in 2018*
➢ The Economist Intelligence Unit (EIU) predicts average annual growth
rates of 7.5% in 2019-2023. This is below the targeted 11% in GTP II
➢ Ethiopia is still among the world’s poorest countries – GNI pc. will
need to grow by 30% to meet the GTP II target of reaching lower-
middle income status (US$ 1,026) by 2025.
Compared to regional peers, how fast is Ethiopia’s economy growing? Annual % change of GDP:
Rank Economy GNI pc (US$)
147 Nigeria 1960
153 Kenya 1620
174 Ethiopia 790
175 Rwanda 780
Sub-Saharan Africa 1506.98
Low income average 789.53
Lower middle income average 2244.53
Compared to regional peers, what are Ethiopian income levels? GNI per capita (Atlas method) 2018:
34.1
23.4 24.4
17.5
4.26.8 8.3
14.8
5.37.3
34 33
38.435.6
29.1
46.8
0
10
20
30
40
50
Agriculture
Manufacturing
Construction
Services
Where is Ethiopia's growth generated? Contribution of sectors to GDP growth in % of total growth, 2010-2018:
Source: World Bank (2019) and National Planning Commission, Study Report on Ethiopian Macroeconomic Framework, Hangyong Lee, 17/2/19

Household consumption levels continue to rise, but are not equally shared across regions and incomes
4Source: World Bank (2019) based on Household Consumption Expenditure Survey 2016
Regional median annual consumption per adult equivalent, % change between 2011 and 2016
Average annual growth of consumption between 2011 and 2016, by percentile of the population
➢ Ethiopia’s average consumption per capita is still
comparatively low at 967 US$, below the levels of
regional peers and the SSA average.
➢ Between 2011 and 2016 consumption increased in all
regions except Afar and Amhara. Mean consumption is
highest in Dawari (16,739 Birr) and lowest in Afar (8503
Birr
Households and NPISHs final consumption expenditure per capita (constant 2010 US$)
967
2,336
3,225
1,544
2,108
0
500
1000
1500
2000
2500
3000
3500
4000
Ethiopia Kenya Nigeria Rwanda Sub-SaharanAfrica2011 2014 2017

Growth has helped reduce poverty and increase overall consumption levels, but inequality is also increasing
5Source: World Bank World Development Indicators (2018)
Economy % of population living below the PL
Δ2010
GINI index
Ethiopia 27.3 -37% 39.1
Kenya 36.8 -19% 40.8
Rwanda 55.5 -11% 43.7
Sub-Saharan Africa 41 -12% -
Lower middle income 13.8 -40% -
Poverty levels in rural areas and small towns between 2012-2016How inclusive is Ethiopia's growth compared to regional peers? Poverty and inequality in Ethiopia and comparator countries:
Notes: Refers to the percentage of the population living below the US$ 1.90 a day poverty line; GINI index measures income inequality among individuals or households within an economy. A Gini index of 0 represents perfect equality, while an index of 100 implies perfect inequality.
➢ Ethiopia reduced poverty from 44% in 2000, to 30% in 2011, to 21% in 2018.
➢ But Inequality is increasing from 29.8 in 2004, to 33.2 in 2010 to 39.1 in 2015. But this remains below regional peers
➢ Poverty is higher in rural areas where rates of poverty reduction have also slowed in recent years
➢ Stark regional differences exist with respect to the extent of chronic poverty: Rates are highest in Somali and lowest in Addis Ababa (both listed under “Others” in the graph above).
0
0.1
0.2
0.3
0.4
0.5
1995/96 1999/00 2004/05 2010/11 2015/16
Total Rural Urban
Change in poverty headcount ratio 1995-2015, national poverty lines (less than US$ 0.6)

The share of agricultural employment remains comparatively high, while informality is on the rise in urban areas
6
22%
35%
25%
52%
34%38%
12%
8%
9%
12%
11%
22%
66% 57% 67% 37% 55% 40%
0%
10%
20%
30%
40%
50%
60%
70%
80%
90%
100%
Ethiopia Kenya Rwanda Nigeria Sub-SaharanAfrica
Lower middleincome
Services Industry Agriculture
Source: World Bank World Development Indicators (2018), IMF (2013) IMF Country Report No. 13/309, National Labour Force Survey 2013
71%
59%
72%
38%
56%
43%
9% 7% 7%12% 11%
21%20%
34%
21%
50%
33%36%
0%
10%
20%
30%
40%
50%
60%
70%
80%
Ethiopia Kenya Rwanda Nigeria Sub-SaharanAfrica
Lower middleincome
Agriculture Industry Services
Where are Ethiopia’s new jobs created? Still mainly in Agriculture. Average annual growth in employment across sectors 2009-2018
Employment shares in 2018, Ethiopia and regional peers (% of total employment)
➢ The unemployment rate (as defined by ILO) is relatively low in Ethiopia (5.40% in 2017 at the national level), compared to a 7.2% average in SSA
➢ Unemployment is mainly an urban phenomenon with a rate of 19.1% in 2018 ➢ Agriculture remains the main sector in employment (66% in 2017). Despite the high
increase in the share of Industry in GDP between 2009 and 2017, the increase in employment in industry has been very shy with an increase of only 3.1% between 2009 and 2017
➢ While employment growth was strongest in agriculture, recent years have shown faster employment growth for services and industry while employment in agriculture has grown more slowly
Level of wages in wage-
employment – in birr
2013 (% of wage-
employment)
27.4%
24.1%
17.5%
11.1%
18.7%
> 2000
1500-1999
1000-1499
500-999
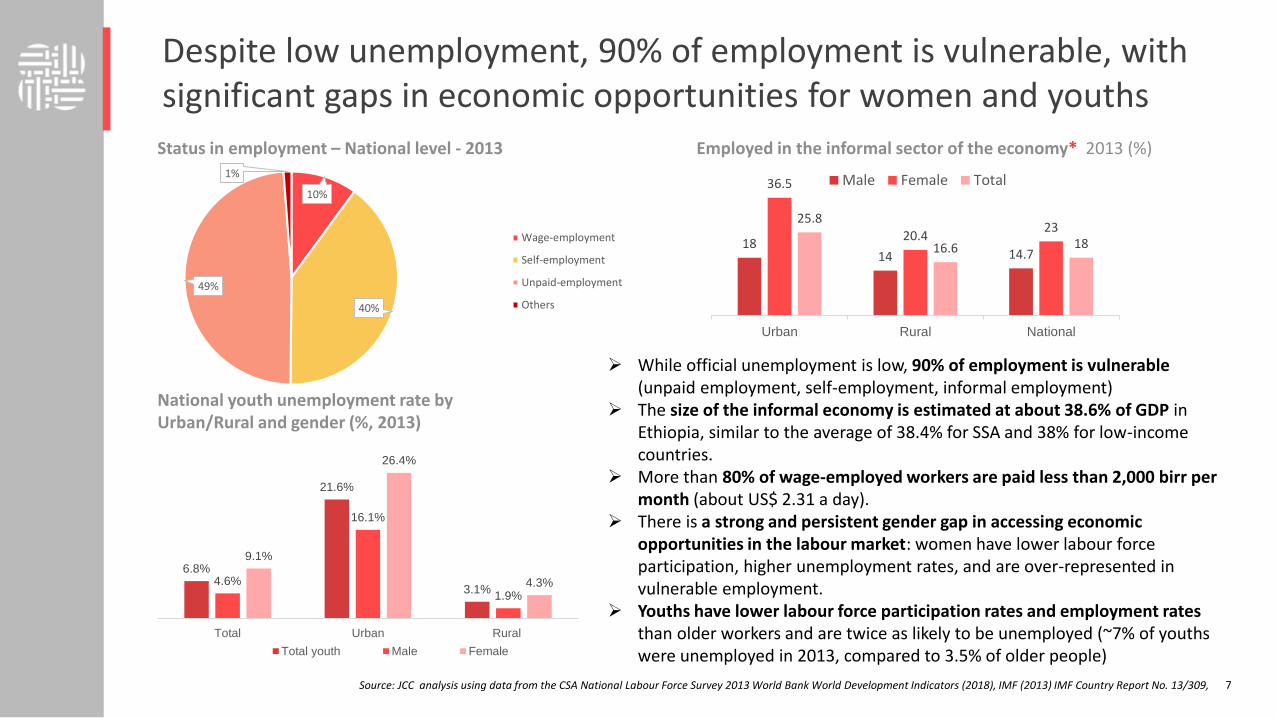
Despite low unemployment, 90% of employment is vulnerable, with significant gaps in economic opportunities for women and youths
7Source: JCC analysis using data from the CSA National Labour Force Survey 2013 World Bank World Development Indicators (2018), IMF (2013) IMF Country Report No. 13/309,
National youth unemployment rate by Urban/Rural and gender (%, 2013)
6.8%
21.6%
3.1%4.6%
16.1%
1.9%
9.1%
26.4%
4.3%
Total Urban Rural
Total youth Male Female
Status in employment – National level - 2013
10%
40%
49%
1%
Wage-employment
Self-employment
Unpaid-employment
Others
➢ While official unemployment is low, 90% of employment is vulnerable (unpaid employment, self-employment, informal employment)
➢ The size of the informal economy is estimated at about 38.6% of GDP in Ethiopia, similar to the average of 38.4% for SSA and 38% for low-income countries.
➢ More than 80% of wage-employed workers are paid less than 2,000 birr per month (about US$ 2.31 a day).
➢ There is a strong and persistent gender gap in accessing economic opportunities in the labour market: women have lower labour force participation, higher unemployment rates, and are over-represented in vulnerable employment.
➢ Youths have lower labour force participation rates and employment rates than older workers and are twice as likely to be unemployed (~7% of youths were unemployed in 2013, compared to 3.5% of older people)
Employed in the informal sector of the economy* 2013 (%)
1814 14.7
36.5
20.423
25.8
16.6 18
Urban Rural National
Male Female Total
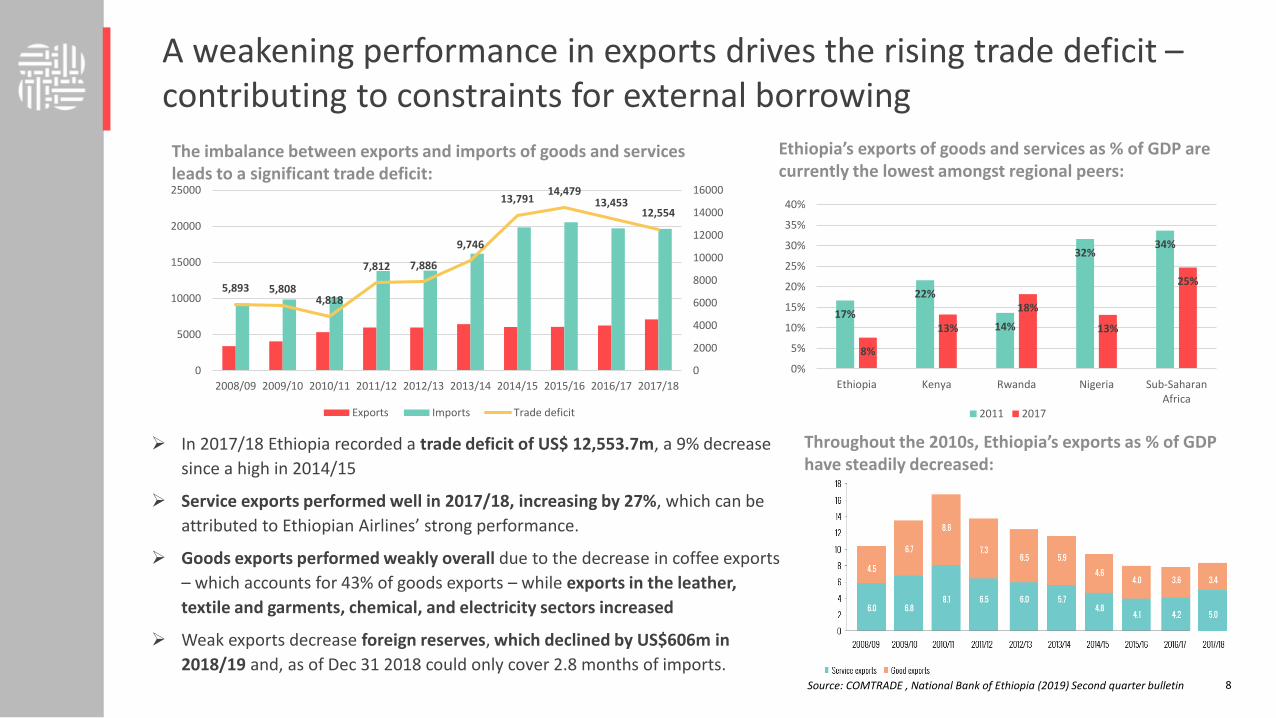
A weakening performance in exports drives the rising trade deficit –contributing to constraints for external borrowing
8Source: COMTRADE , National Bank of Ethiopia (2019) Second quarter bulletin
➢ In 2017/18 Ethiopia recorded a trade deficit of US$ 12,553.7m, a 9% decrease
since a high in 2014/15
➢ Service exports performed well in 2017/18, increasing by 27%, which can be
attributed to Ethiopian Airlines’ strong performance.
➢ Goods exports performed weakly overall due to the decrease in coffee exports
– which accounts for 43% of goods exports – while exports in the leather,
textile and garments, chemical, and electricity sectors increased
➢ Weak exports decrease foreign reserves, which declined by US$606m in
2018/19 and, as of Dec 31 2018 could only cover 2.8 months of imports.
17%
22%
14%
32%34%
8%
13%
18%
13%
25%
0%
5%
10%
15%
20%
25%
30%
35%
40%
Ethiopia Kenya Rwanda Nigeria Sub-SaharanAfrica
2011 2017
Ethiopia’s exports of goods and services as % of GDP are currently the lowest amongst regional peers:
Throughout the 2010s, Ethiopia’s exports as % of GDP have steadily decreased:
5,893 5,8084,818
7,812 7,886
9,746
13,79114,479
13,45312,554
0
2000
4000
6000
8000
10000
12000
14000
16000
0
5000
10000
15000
20000
25000
2008/09 2009/10 2010/11 2011/12 2012/13 2013/14 2014/15 2015/16 2016/17 2017/18
Exports Imports Trade deficit
The imbalance between exports and imports of goods and services leads to a significant trade deficit:
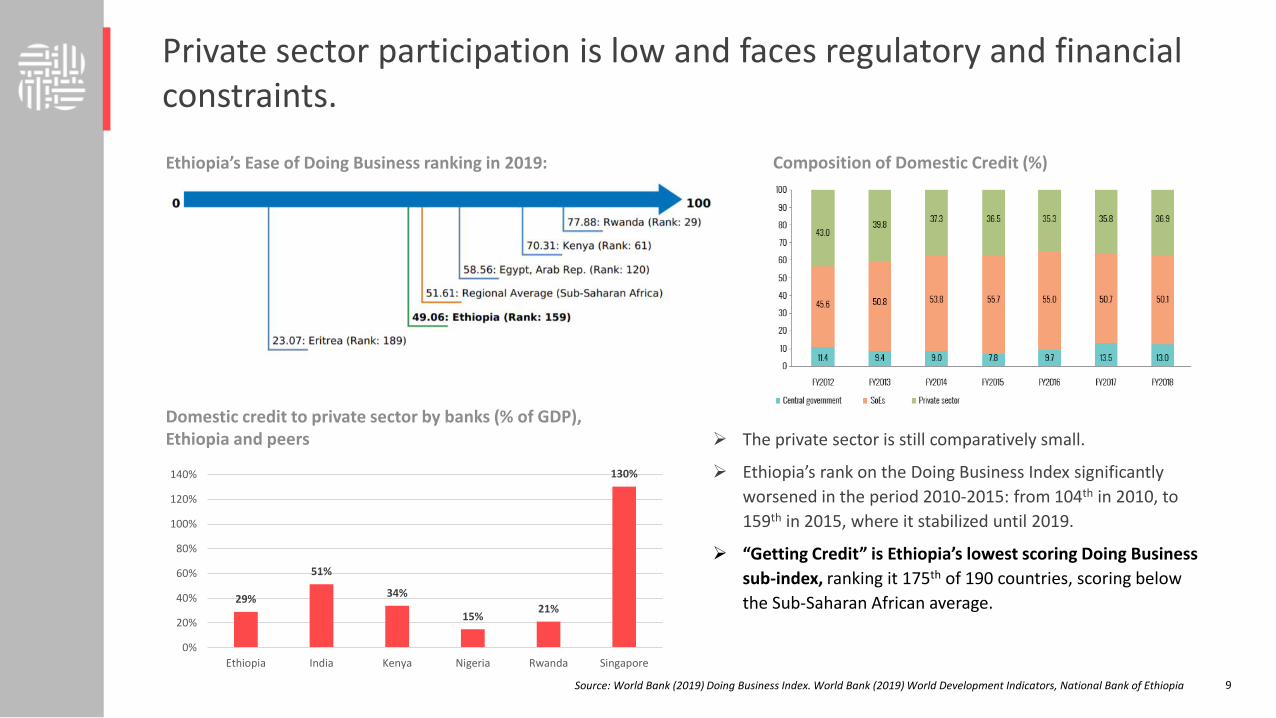
Private sector participation is low and faces regulatory and financial constraints.
9Source: World Bank (2019) Doing Business Index. World Bank (2019) World Development Indicators, National Bank of Ethiopia
Domestic credit to private sector by banks (% of GDP), Ethiopia and peers
Ethiopia’s Ease of Doing Business ranking in 2019:
29%
51%
34%
15%21%
130%
0%
20%
40%
60%
80%
100%
120%
140%
Ethiopia India Kenya Nigeria Rwanda Singapore
➢ The private sector is still comparatively small.
➢ Ethiopia’s rank on the Doing Business Index significantly
worsened in the period 2010-2015: from 104th in 2010, to
159th in 2015, where it stabilized until 2019.
➢ “Getting Credit” is Ethiopia’s lowest scoring Doing Business
sub-index, ranking it 175th of 190 countries, scoring below
the Sub-Saharan African average.
Composition of Domestic Credit (%)

Ethiopian services and industrial sectors exhibit strong growth rates – supported by construction and private household employment
10
6%
4%6%
4%
17%
6%
9%
2%
11%
6%
8%
5%
0%
2%
4%
6%
8%
10%
12%
14%
16%
18%
20%
Ethiopia Kenya Rwanda Nigeria
Agriculture Industry Services
Average growth rates in the main sectors (2009-2018)
Source: World Bank (2018), based on data from the National Planning Commission
Annual growth in value added: Industry
10% 11%
15%
20%
24%
17%20%
24%20%
12%
-15%
-10%
-5%
0%
5%
10%
15%
20%
25%
30%
2009 2010 2011 2012 2013 2014 2015 2016 2017 2018
Ethiopia Kenya Rwanda Nigeria Sub-Saharan Africa
15%17%
13%10% 9%
13%11% 11%
8%9%
-5%
0%
5%
10%
15%
20%
25%
30%
2009 2010 2011 2012 2013 2014 2015 2016 2017 2018
Ethiopia Kenya Rwanda Nigeria
Annual growth in value added: Services
➢ Ethiopia’s industrial and service sectors are growing fast
compared to regional peers and Sub Sahara Africa
➢ Growth in industrial value added was particularly strong in
recent years, which to a large extent is supported by a strong
construction industry and manufacturing.
➢ Growth in services has slowed since 2014, but it still strong in
regional comparison. Wholesale and retail trade is the most
important service sub-sector, while private household
employment has grown considerably in the past years.

While agricultural activities still comprise most of Ethiopia’s GDP, the fastest growth is observed in services and construction
11
National GDP by activity, 2017/18
Source: National Bank of Ethiopia (2019)
Top five growth in the last ten years(2022% ) Construction
(1597%) Private HH with employed persons (720%) Large and medium scale manufacturing
(710%) Manufacturing(692% ) Small scale and cottage industries
Top five growth in the last five yearsPrivate HH with employed persons (1127%)Construction (852%)Small scale and cottage industries (459%)Fishing (392%)Manufacturing (373%)
12345

Most investments occur in real estate activities and predominantly in Addis.
12
4%7% 1%
11%
76%
1%
Agriculture, hunting and forestry ConstructionEducation ManufacturingReal estate, renting and business activities Others
➢ The real estate, renting & business activities sector received
57.7% of the total Birr 814.3m capital invested, followed by
manufacturing (33.7%), and construction (4.4%)
➢ However, most permanent employment (64.3%) was created by
manufacturing with investments in real estate, renting &
business activities (sic?) contributing only 24.4%, education 6%
and construction 2.6 % to all permanent employment.
➢ Between 2018 and mid 2019, 75% of investment projects
and 86% of capital were operational in Addis
➢ However, more recently (QII 2018/19) Oromia recorded
the largest share of investments (81.9%) and investment
capital (63.8%), with only 14.1% of projects and 34% of
capital operational in Addis.
Source: National Bank of Ethiopia (2019), based on information by the Ethiopian Investment Commission
Number of investment projects, during QII of 2018/2019 Operational investments across regions, QII 2017/18 to QII 2018/19
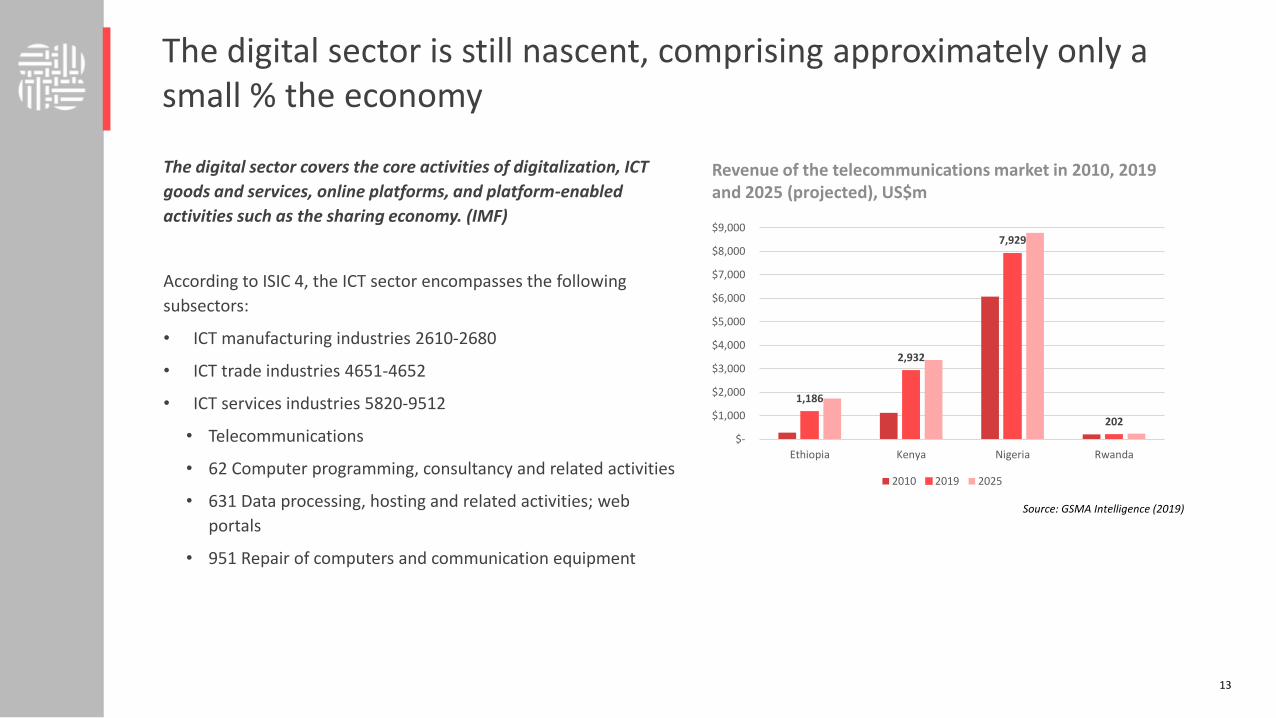
The digital sector is still nascent, comprising approximately only a small % the economy
13
The digital sector covers the core activities of digitalization, ICT
goods and services, online platforms, and platform-enabled
activities such as the sharing economy. (IMF)
According to ISIC 4, the ICT sector encompasses the following
subsectors:
• ICT manufacturing industries 2610-2680
• ICT trade industries 4651-4652
• ICT services industries 5820-9512
• Telecommunications
• 62 Computer programming, consultancy and related activities
• 631 Data processing, hosting and related activities; web
portals
• 951 Repair of computers and communication equipment
1,186
2,932
7,929
202
$-
$1,000
$2,000
$3,000
$4,000
$5,000
$6,000
$7,000
$8,000
$9,000
Ethiopia Kenya Nigeria Rwanda
2010 2019 2025
Revenue of the telecommunications market in 2010, 2019 and 2025 (projected), US$m
Source: GSMA Intelligence (2019)

Digital Transformation Framework: Empirical background5b
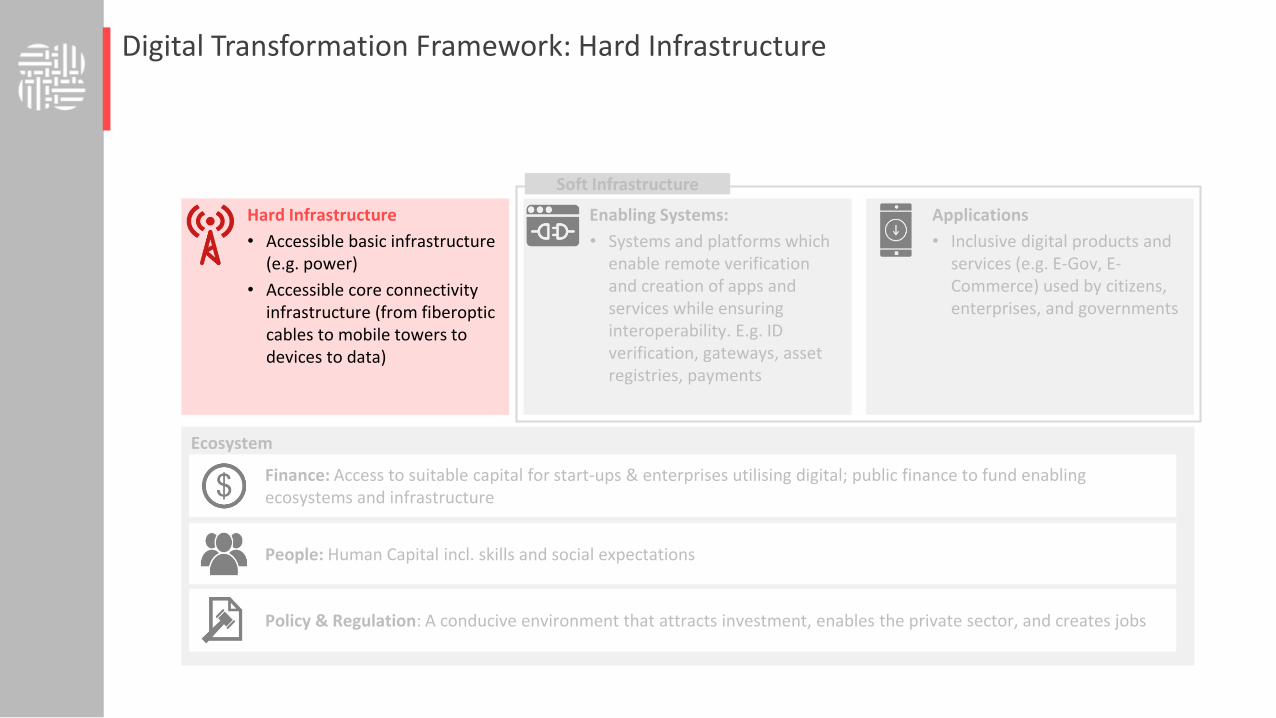
Hard Infrastructure
• Accessible basic infrastructure (e.g. power)
• Accessible core connectivity infrastructure (from fiberoptic cables to mobile towers to devices to data)
Enabling Systems:
• Systems and platforms which enable remote verification and creation of apps and services while ensuring interoperability. E.g. ID verification, gateways, asset registries, payments
Applications
• Inclusive digital products and services (e.g. E-Gov, E-Commerce) used by citizens, enterprises, and governments
Ecosystem
Finance: Access to suitable capital for start-ups & enterprises utilising digital; public finance to fund enabling ecosystems and infrastructure
People: Human Capital incl. skills and social expectations
Policy & Regulation: A conducive environment that attracts investment, enables the private sector, and creates jobs
Soft Infrastructure
Digital Transformation Framework: Hard Infrastructure

Power– as the baseline to internet connectivity - is accessible to 44.3% of Ethiopians. This is on par with the SSA average, but lower than its larger peers, Kenya (63.8%) and Nigeria (54.4%)
Access to electricity (% of population)2010 - 2017
Source: World BankBased on International Energy Agency (IEA), Sustainable Energy for All, and the Energy Sector Management Assistance Program.
44.3
63.8
54.4
34.1
0.0
10.0
20.0
30.0
40.0
50.0
60.0
70.0
2010 2011 2012 2013 2014 2015 2016 2017
Ethiopia Kenya Nigeria Rwanda
Rank in Electricity Access, (out of 140 countries in 2017)
Kenya
Nigeria
Ethiopia
Rwanda
Source: Global competitiveness report, 2018Based on International Energy Agency (IEA).
110
114
121
130
44.3
19.1
10.9
44.5
0.0
10.0
20.0
30.0
40.0
50.0
2010 2011 2012 2013 2014 2015 2016 2017
Ethiopia DRC Chad Sub saharian Africa

17
Compared to the wider world – and especially newly industrialising peers such as Bangladesh – Ethiopia’s electricity access is inadequate
Access to electricity (% of population)Ethiopia and new industrialisers
2010 -2017
44.3
88.0
100.0
92.6
0.0
20.0
40.0
60.0
80.0
100.0
2010 2011 2012 2013 2014 2015 2016 2017Ethiopia Bangladesh China India
44
100
0
20
40
60
80
100
2010 2011 2012 2013 2014 2015 2016 2017
Ethiopia Estonia Israel Korea, Rep.
Access to electricity (% of population)Ethiopia and advanced aspirational economies
2010 -2017
• Whilst Ethiopia is outperforming other ‘highperformers’ in SSA, such as Rwanda asillustrated in the slide before, it is no wherenear globally competitive to peers it aspiresto rival, such as Bangladesh.
• Its trajectory for access is rising (albeit itplateaued in the last year), but it needs togrow exponentially if it is able to supportwidespread digitisation of the economy.
• Even regardless of digitisation aspirations,its existing development plans forindustrialisation will require a significantinvestment in electricity access
Main bottlenecks in electricity affects the digitalisation of the economy
Source: World BankBased on International Energy Agency (IEA), Sustainable Energy for All, and the Energy Sector Management Assistance Program.

96.60
81.07
86.80
84.80
40.00
50.00
60.00
70.00
80.00
90.00
100.00
2010 2011 2012 2013 2014 2015 2016 2017
Ethiopia Kenya Nigeria Rwanda
Access to electricity (% of urban population)2010 - 2017
22.6
0.0
10.0
20.0
30.0
40.0
50.0
60.0
70.0
2010 2011 2012 2013 2014 2015 2016 2017
Ethiopia Kenya Nigeria Rwanda
Access to electricity (% of rural population)2010 - 2017
23.6
31
57.6
Electricity coverage is high amongst the urban population (96%) – far higher than its regional peers and indicative of Ethiopia’s industrialisation efforts. However rural access is still low and will need to be addressed if inclusive digital economic growth is to occur
Source: World BankBased on International Energy Agency (IEA), Sustainable Energy for All, and the Energy Sector Management Assistance Program.

19
Price of electricity
(US cents per kWh) Electricity production
kWh/capita Reliability of supply
index (0-8)Quality of supply
index (0-8)
3.9
12.8
13.9
21.5
92.2
167.6
28.7
203.1
0
0
5
4
0
0
5
4
Source: Doing Business 2018, based on data collected from markets’ players and regulators. Networked Readiness Index (2016) based on International Energy Agency (IEA) and World Bank
Whilst electricity coverage is relatively unequal, Ethiopia does offer the most affordable electricity of its peers where access is available. But reliability and quality remain a challenge, affecting business and FDI in particular
Ethiopia
Nigeria
Rwanda
Kenya

3,649328 123
0 1,000 2,000 3,000 4,000
Hydroelectric Wind
Planned generation capacity with new plants
Current generation capacity (MW)
17,200
6,800 6,800 6,800
6,300
4,100
Total Current Gen. cap. Plants under dev. Planned plants
Sources: “SDG Performance Report”, EEU, 2017; GTP II; Salini Construction website; “Geothermal Development in Africa: The Corbetti Example”, Reykjavik Geothermal, 2016. TBI analysis
Power generation expansion plan set by GTP II didn’t reach the expected target to increase generation capacity up to 17,200 MW by 2020 through major private sector contribution leaving the system exposed to power shortage risks
3,034
2,160
800
450
120
19050
Private PublicHydro Solar Wind Geothermal Biomass
GTP II power generation targets, 2020 (in MW)
Currently operational power generation plants 2019
Power plants (All public owned) currently under construction
4,524 MW
2,280 MW
▪ Only two geothermal projects (500MW each) have signed PPAs
▪ Another PV project (100MW) is negotiating PPA
➢ Ethiopia introduced power rationing program in June-July 2019 due to low water availability➢ This confirms its high dependence on hydropower and stresses the need to diversify its
generation mix ➢ To avoid power shortages in the next years Ethiopia needs to address the current unbalances
between demand and supply ➢Government’s efforts to crowd-in private sector into power generation have not yet reached
the expected results with only 3 projects currently underdevelopment

Ethiopia’s power sector is run by a state monopoly, with only generation open to private companies. This may indicate why prices have remained low, though reliability and quality is variable with respect to transmission and distribution
Sources: “Inventory of Policy Interventions – Ethiopia”, USAID/PATRP, 2015; World Bank, Access to Electricity in Ethiopia, June 2015; Interviews with EEU and EEP
officials; TBI analysis
MOWIE oversees the power sector
and EEA serves as the regulator
Institutional framework of the Ethiopian
power sector
Distribution
Overview of actors and respective duties along the power supply value chain
in Ethiopia
EEP (Ethiopian Electric Power) administers state
owned power plants in the country and buys power
from IPPs
IPPs (Independent Power Producers) generate power
and sell it to EEP
EEU bulk purchases power from EEP and sells to
customers
EEP is in charge of transmitting all power across
the nation
EEP owns and operates all long distance power
transmission lines
Transmission
Generation
Private sector participation is allowed for on-grid power generation,
but not transmission and distribution
Private sector participation allowed Private sector participation not allowed
Off-grid transmission and distribution are open for private investors
Ethiopian Electric Power (EEP)
Ethiopian Electric Utility (EEU)
• Generation• Transmission• Power procurement• Investment promotion
• Distribution and retail
MOFEC – develops detailed project pipelines for power generation plants through PPP project teams [According to the new PPP law]
• Regulates the power sector
• Provides licenses for sector investment
• Oversees the power sector at a ministerial level
Ministry of Water Irrigation and Energy
(MoWIE)
Ethiopian Energy Authority (EEA)

22
Rank Mobile-cellular phone subscriptionsout of 140, 2017
Mobile-cellular telephone subscriptions(as percentage of population) 2017
59.7
72.275.9
86.1
0
10
20
30
40
50
60
70
80
90
100
Ethiopia Rwanda Nigeria Kenya
Source: Global competitiveness report, 2018. Based on ITU
Mobile phones are the predominant means for internet access on the continent. And mobile subscriptions in Ethiopia have been significantly lower than its regional peers
59.70
85.20
75.92
73.61
0.00
10.00
20.00
30.00
40.00
50.00
60.00
70.00
80.00
90.00
2010 2011 2012 2013 2014 2015 2016 2017
Ethiopia Kenya Nigeria Rwanda
Mobile-cellular telephone subscriptions (as percentage of population)
2010 - 2017
113124130 127
Source: ITU 2017, based on national data
Source: ITU (2017) based on national dataResearch ICT Africa
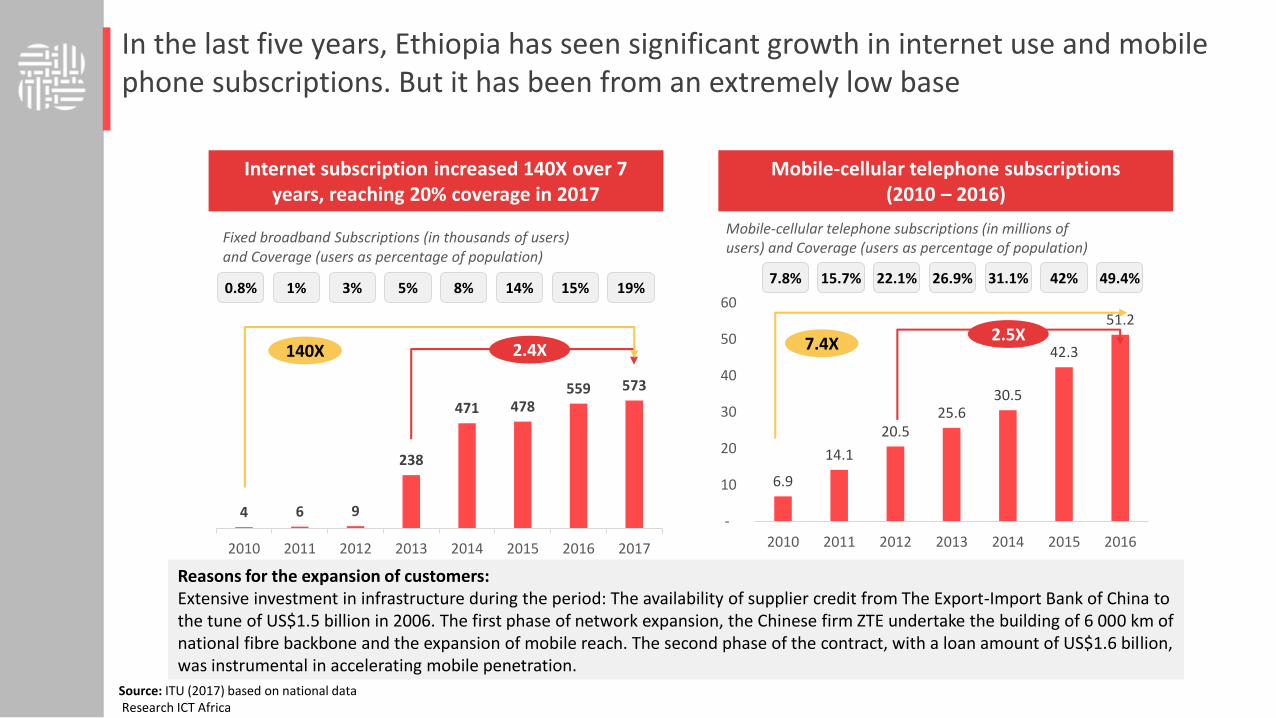
Internet coverage (%)
2.4X140X
4 6 9
238
471 478559 573
2010 2011 2012 2013 2014 2015 2016 2017
Fixed broadband Subscriptions (in thousands of users) and Coverage (users as percentage of population)
Internet Subscribers (Thousands)
0.8% 1% 3% 5% 8% 14% 15% 19%
Internet subscription increased 140X over 7 years, reaching 20% coverage in 2017
Reasons for the expansion of customers:Extensive investment in infrastructure during the period: The availability of supplier credit from The Export-Import Bank of China to the tune of US$1.5 billion in 2006. The first phase of network expansion, the Chinese firm ZTE undertake the building of 6 000 km of national fibre backbone and the expansion of mobile reach. The second phase of the contract, with a loan amount of US$1.6 billion, was instrumental in accelerating mobile penetration.
Mobile-cellular telephone subscriptions(2010 – 2016)
6.9
14.1
20.525.6
30.5
42.3
51.2
-
10
20
30
40
50
60
2010 2011 2012 2013 2014 2015 2016
Mobile-cellular telephone subscriptions (in millions of users) and Coverage (users as percentage of population)
7.4X
7.8% 15.7% 22.1% 26.9% 31.1% 42% 49.4%
2.5X
In the last five years, Ethiopia has seen significant growth in internet use and mobile phone subscriptions. But it has been from an extremely low base

94.1
89.2
83.7
83.4
70.2
66.2
65.0
59.6
48.3
43.8
33.7
0 10 20 30 40 50 60 70 80 90 100
South Africa
Botswana
Mozambique
Nigeria
Ghana
Zambia
Senegal
Kenya
Ethiopia
Tanzania
Rwanda
Cost of a smartphone (handset) relative to income, 100=most affordable
15%
49%
41%
29%
21%
40% 42%46%
0%
10%
20%
30%
40%
50%
60%
Ethiopia Kenya Nigeria Rwanda
Smartphones Basic/feature phones
Note: Indexed scores of the price of entry-level handset to the consumer, as a percentage of monthly GNI per capita; Score of 0-100, 100=most affordable
➢ Taxation of (imported) hardware is an issue for businesses
because of uncertainty regarding taxation and customs
charges
Market penetration of hardware, %
Internet-enabled smartphones are expensive for large parts of the population, which is reflected in the low take-up rate (15%)
Source: (GSMA 2018)
25
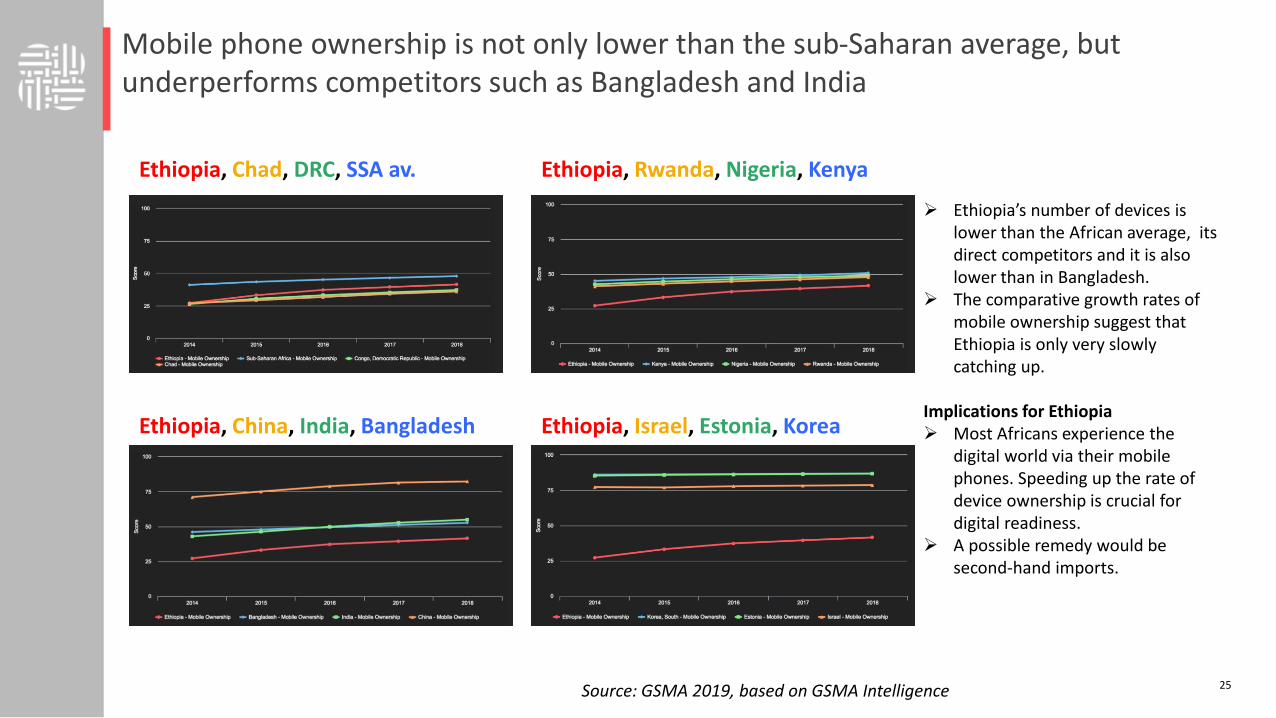
Ethiopia, Chad, DRC, SSA av.
Ethiopia, China, India, Bangladesh Ethiopia, Israel, Estonia, Korea
➢ Ethiopia’s number of devices is lower than the African average, its direct competitors and it is also lower than in Bangladesh.
➢ The comparative growth rates of mobile ownership suggest that Ethiopia is only very slowly catching up.
Implications for Ethiopia➢ Most Africans experience the
digital world via their mobile phones. Speeding up the rate of device ownership is crucial for digital readiness.
➢ A possible remedy would be second-hand imports.
Source: GSMA 2019, based on GSMA Intelligence
Ethiopia, Rwanda, Nigeria, Kenya
Mobile phone ownership is not only lower than the sub-Saharan average, but underperforms competitors such as Bangladesh and India

26
Ethiopia, Chad, DRC, SSA av.
Ethiopia, China, India, Bangladesh Ethiopia, Israel, Estonia, Korea
➢ Compared to the African average, Ethiopia’s devices have become significantly more expensive in recent years, same as in Nigeria and particularly in Rwanda (top left and right). Meanwhile, Indians and Bangladeshis have enjoyed more affordability of devices, on par with the global frontier countries.
➢ Implications for Ethiopia’s Digital Readiness: Bringing down the cost of devices is imperative to increasing digital readiness of the population.
Source: GSMA 2019, based on GSMA Intelligence
Ethiopia, Rwanda, Nigeria, Kenya
It is likely that the falling price competitiveness of mobile devices in Ethiopia has suppressed mobile phone subscription growth compared to peers

27
Given mobile access has been lower than its regional peers, it is not surprising that Ethiopia has some of the lowest rates of internet access in the world, lower than the SSA average
Comparative Factors Ethiopia Africa World
Percentage of individuals using the internet
18.6 22.1 48.6
Percentage of households with internet access
18 19.4 54.7
Percentage of households with computer
4.9 8.9 47.1
International Internet bandwidth per Internet user, kb/s
2.0 11.2 76.6
Mobile cellular subs per 100 inhab. 59.7 74.4 103.6
Active mobile broadband sub. Per 100 inhab.
7.1 24.8 61.9
Source: ITU, 2017
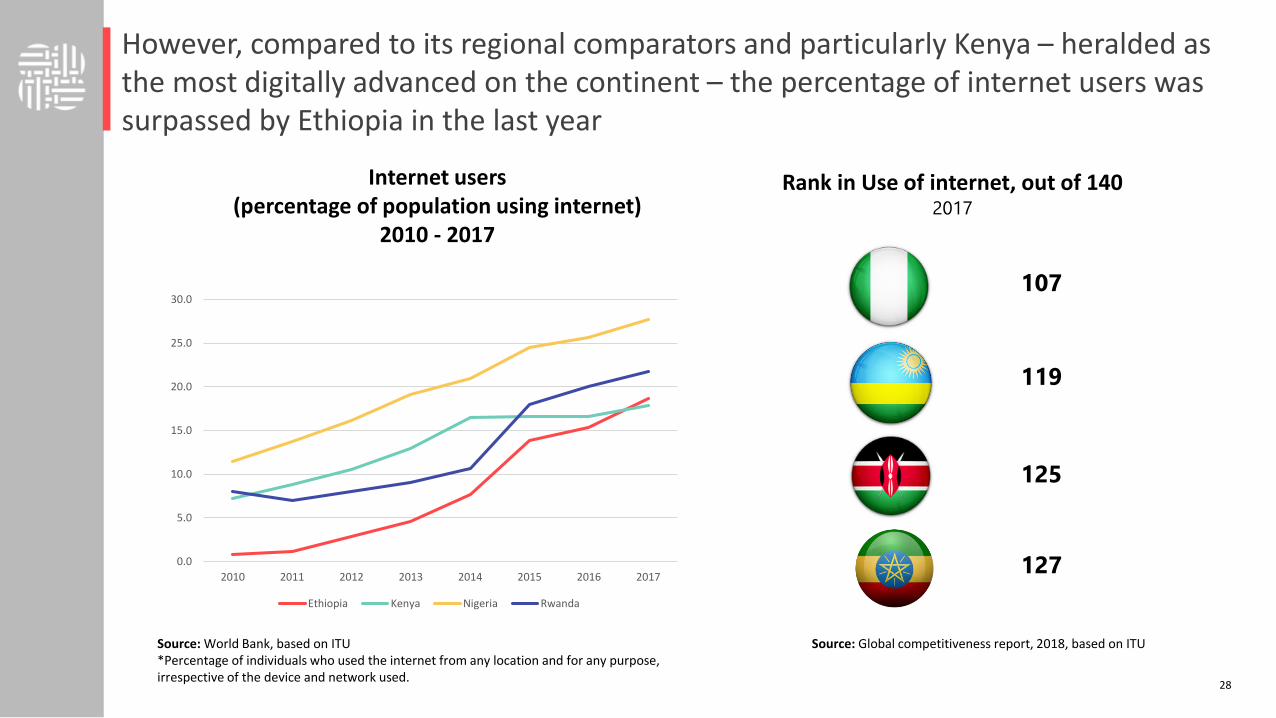
28
0.0
5.0
10.0
15.0
20.0
25.0
30.0
2010 2011 2012 2013 2014 2015 2016 2017
Ethiopia Kenya Nigeria Rwanda
Internet users (percentage of population using internet)
2010 - 2017
125
107
127
119
Source: Global competitiveness report, 2018, based on ITU
Rank in Use of internet, out of 1402017
Source: World Bank, based on ITU*Percentage of individuals who used the internet from any location and for any purpose, irrespective of the device and network used.
However, compared to its regional comparators and particularly Kenya – heralded as the most digitally advanced on the continent – the percentage of internet users was surpassed by Ethiopia in the last year

29
108
138
126
109
Mobile broadband subscriptions, out of 1402017
Mobile broadband subscriptions (as percentage of population) 2017
7.1
19.9
35 35.7
0
5
10
15
20
25
30
35
40
Ethiopia Nigeria Rwanda Kenya
Source: Global competitiveness report, 2018, based on ITU
Despite the rise in internet use amongst the population, mobile broadband subscriptions remains low versus regional peers.

30
Source: ICT research Africa, based on RIA African Mobile Pricing Index
Price for 1GB monthly use of data
• Ethiopia’s prices for internet are high but at the same time,it is failing at getting sustainability. The Average revenue perUser is within the lowest of the region. This is an indicativethat the monopoly in Ethiopia is not effective at generatingrevenue and demand for telecommunication services.
Source: ICT research Africa based on GSMA*ARPU: total revenue divided by the number of subscribers.
Ethiopia’s internet tariffs are the highest in East Africa – which could well indicate why broadband subscription remains so low
25.9
21.8
20.6
14.1
13.7
11.9
11.4
11.1
10.4
10.4
8.9
6.4
6.3
6.2
5.2
4.6
2.1
39.2
48.4
51.2
24.8
31
24.7
17
18.3
19.9
22.1
20.4
11.9
18.4
14.7
9
7.9
3.8
0 10 20 30 40 50 60
Namibia
Botswana
Ethiopia
South Africa
Uganda
Rwanda
Cote d'Ivore
Nigeria
Benin
Burkina Faso
Tunisia
Mozambique
Ghana
Tanzania
Senegal
Kenya
Cameroon
USD PPP USD
1.7 1.8
3.23.5
4
4.6
0
0.5
1
1.5
2
2.5
3
3.5
4
4.5
5
Rwanda Ethiopia Nigeria Kenya DRC Chad
Average Revenue per user(USD) 2016

Cost of 500MB of mobile broadband as a % of GNI, Ethiopia and peers, 2017
Cost of fixed broadband basket as a % of GNI, Ethiopia and peers
Note: Basket is on the basis of a 5GB monthly usage and an advertised download speed of at least 256 kbit/s.
2012 2013 2014 2015 2016 2017
Singapore 0.71 0.44 0.69 0.63 0.5 0.8
India 4.12 3.66 5.28 5.11 4.84 4.48
Nigeria 19.6 17.73 16.05 13.23 13.4 14.9
Ethiopia 64.55 55.07 27.95 26.31 25.24 18.45
Kenya 39.3 35.92 31.73 40.65 39.69 37.88
Rwanda 682.64 627.91 745.2 166.44 152.6 140.3
2013 2014 2015 2016 2017
Singapore 0.26 0.26 0.16 0.17 0.16
India 2.65 2.48 3.09 1.91 1.83
Nigeria 5.65 4.93 4.41 1.7 1.89
Rwanda 13.85 12.6 2.38 4.36 4.01
Kenya 5.9 5.29 5.08 4.41 4.03
Ethiopia 14.45 21.05 8.58 6.27
Source: International Telecommunications Unit (2017) ICT Prices 2017
And even though internet and mobile data has become more affordable in Ethiopia at US$3.45 per 1GB, it is still above the 2% target set by the ITU broadband commission.

➢ Due to the monopoly, there haven’t been market entrants
in the telecommunications sector
➢ The sector is set to begin liberalization by the end of 2019,
with two licenses being issued to foreign firms. In addition a
minority stake in Ethio Telecom will be sold to investors.
➢ Ethio Telecoms cut prices by in 2018, potentially as a
response to the threat of new entrants from market
opening
➢ Electricity tariff rates have increased over the past year with
the increments cascaded for 4 years
➢ There is no Universal Access / -Service Fund in Ethiopia
➢ The draft PE proclamation in the telecoms sector currently
includes a community service obligation, which works similar
to a Universal Access Fund.
▪ Depending on government support, services under the
CSO could be provided by both Ethio Telecom and new
private players
▪ Another possibility currently being discussed is the
inclusion of CSOs in telecoms licenses
▪ There is no policy for gender equity in internet access and use
New market entrants and market dynamicsAffordability policy
Ethiopia ranks second to last on the A4AI’s Affordability Drivers Index. Policies of digital inclusion need to be strengthened given particularly that poor digital infrastructure exacerbates gaps
Source: Alliance for Affordable internet 2016, based on The Web Index. TBI intelligence

33
Ethiopia, Chad, DRC, SSA av.
Ethiopia, China, India, Bangladesh Ethiopia, Israel, Estonia, Korea
➢ Ethiopia’s 3G access is steadily rising and noticeably above the African average and Nigeria.
➢ Kenya, Rwanda, India, and even Bangladesh have better 3G coverage
➢ China and the global frontier countries all have universal 3G coverage.
➢ Implications for Ethiopia’s Digital Readiness: inching upward on 3G coverage is important for basic communication. But many applications (such as audio and video are not accessible via 3G). Hence, 3G may not be enough to become competitive.
Source: GSMA 2019, based on GSMA Intelligence
Ethiopia, Rwanda, Nigeria, Kenya
Ethiopia is nonetheless making strides to improve its 3G access – outperforming the SSA average and coming closer to Kenya and Rwanda’s 3G connectivity

34
Ethiopia, Chad, DRC, SSA av.
Ethiopia, China, India, Bangladesh Ethiopia, Israel, Estonia, Korea
➢ Ethiopia’s 4G access is stagnant at 10. This is far below the African average, which has steadily risen to 36.5%.
➢ Within the main competitors, Nigeria hovers above at 41%, while Kenya (61%) and particularly Rwanda (99%) have rapidly spreading their 4G networks
➢ Rwanda, India, China and all the frontier countries have universal universal 4G coverage
➢ Only Bangladesh has comparable network problems
➢ Implications for Ethiopia’s Digital Readiness: As the world gears up for 5G, this constitutes Ethiopia’s key bottleneck.
➢ Possible remedies: ethio telecom’spending breakup and privatization.
Source: GSMA 2019, based on GSMA Intelligence
Ethiopia, Rwanda, Nigeria, Kenya
But Ethiopia’s efforts towards 4G access has plateaued compared to regional peers, and other aspirational benchmarks such as India and China. This will be a key bottleneck to a growth strategy grounded in the digital age

35
Ethiopia’s low bandwidth per internet user will likely limit availability of technologies in the country, and firms’ technology absorption in the country as compared to regional peers
International Internet bandwidth per Internet user, kb/s,
International internet bandwidth
Rank/140
Networked Readiness Index
Rank/140
Availability of latest technologies,
Rank / 140
Firm-level technology absorption Rank / 140
25.2
8.95
5.0
3.1
50
115
118
127
86
80
120
119
50
45
119
99
54
47
128
91
Source: Networked Readiness Index, 2016, based on ITU, WEF Surveys and The Global Information Technology Report 2016

Ethiopia has internet access via neighbouring Djibouti, Kenya, and Sudan
• Ethiopia accesses underwater ICT cables through terrestrial connections in Sudan, Djibouti and Kenya
• Total bandwidth capacity is 75 GB
• The primary connection is through a fibre network that stretches from the Red Sea port of Djibouti to Addis Ababa.
• The national optical-fibre network is connected to the continental shelf of East Africa - Eastern Africa Submarine Cable System (EASSY) – accessed through underwater cables via Mombassa.
• Ethiopia has two domestic satellites used as backup / redundancy.
Ethiopia is dependant on 3 countries for access to underwater cables…
Source: Ministry of Innovation and Technology
Connections for Eth
Ethiopia currently has access to 75 GB via underwater connections through 3 neighbouring countries. The current reforms will hopefully improve the environment for further investments in the network

37
Ethiopia, Chad, DRC, SSA av.
Ethiopia, China, India, Bangladesh Ethiopia, Israel, Estonia, Korea
➢ The number of available servers per user in Ethiopia is below the African average, and substantially below region’s leading ICT countries.
➢ Implications for Ethiopia’s Digital Readiness: the low availability of servers, together with the infrastructure issues and the low internet access deepen the challenges for Ethiopia’s digitalisation.
➢ Possible remedies: Ethiopia’s energy costs are comparatively low; the PMO’s office is in negotiations with Chinese Bitcoin miners. Addis Ababa’s high altitude and low temperatures would also be conducive for attracting server farms (energy reliability and cyber security would need to improve)Source: GSMA 2019, based on World bank
Ethiopia, Rwanda, Nigeria, Kenya
Ethiopia also has a relatively low number of servers per user as compared to the SSA average, and below that of its regional peers.
38
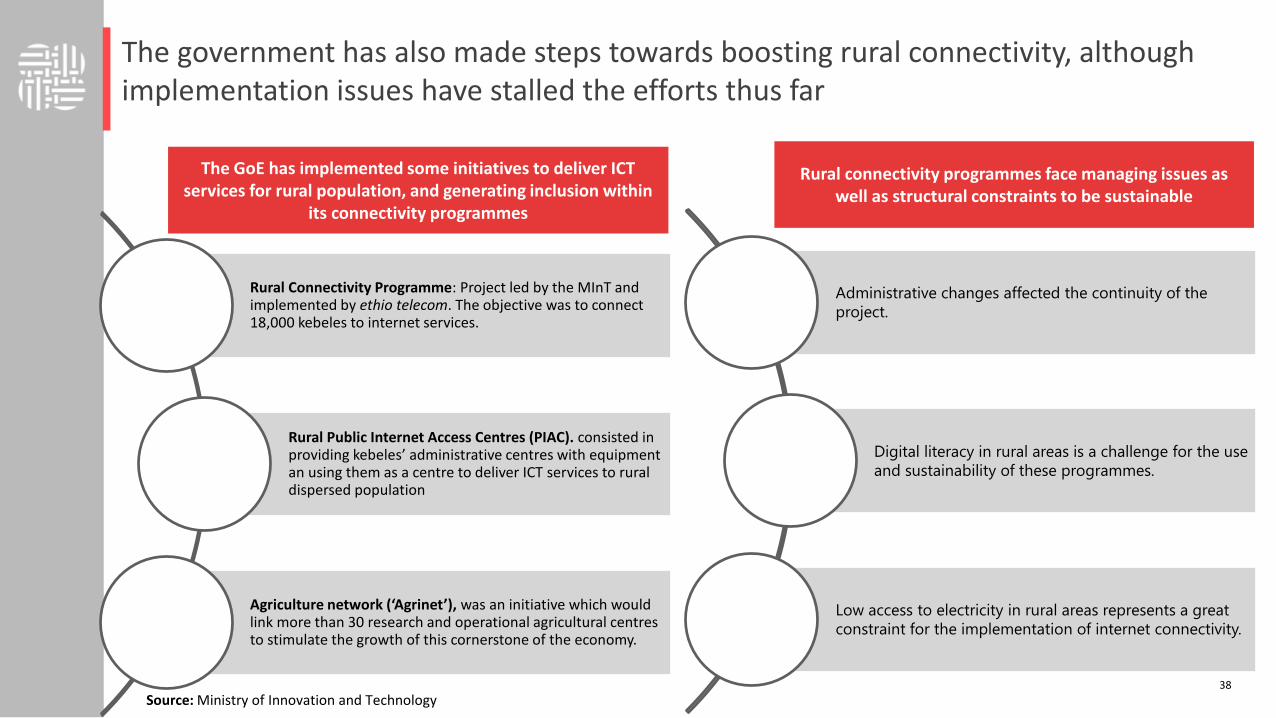
The government has also made steps towards boosting rural connectivity, although implementation issues have stalled the efforts thus far
Rural connectivity programmes face managing issues as well as structural constraints to be sustainable
The GoE has implemented some initiatives to deliver ICT services for rural population, and generating inclusion within
its connectivity programmes
Rural Connectivity Programme: Project led by the MInT and implemented by ethio telecom. The objective was to connect 18,000 kebeles to internet services.
Rural Public Internet Access Centres (PIAC). consisted in providing kebeles’ administrative centres with equipment an using them as a centre to deliver ICT services to rural dispersed population
Agriculture network (‘Agrinet’), was an initiative which would link more than 30 research and operational agricultural centres to stimulate the growth of this cornerstone of the economy.
Administrative changes affected the continuity of the
project.
Digital literacy in rural areas is a challenge for the use
and sustainability of these programmes.
Low access to electricity in rural areas represents a great
constraint for the implementation of internet connectivity.
Source: Ministry of Innovation and Technology

Digital Transformation Framework: Soft Infrastructure – Enabling Systems
Hard Infrastructure
• Accessible basic infrastructure (e.g. power)
• Accessible core connectivity infrastructure (from fiberoptic cables to mobile towers to devices to data)
Enabling Systems:
• Systems and platforms which enable remote verification and creation of apps and services while ensuring interoperability. E.g. ID verification, gateways, asset registries, payments
Ecosystem
Finance: Access to suitable capital for start-ups & enterprises utilising digital; public finance to fund enabling ecosystems and infrastructure
People: Human Capital incl. skills and social expectations
Policy & Regulation: A conducive environment that attracts investment, enables the private sector, and creates jobs
Soft Infrastructure
Applications
• Inclusive digital products and services (e.g. E-Gov, E-Commerce) used by citizens, enterprises, and governments

40
A fundamental enabling system to support digital transformation will be a national ID programme to ensure everyone can gain access to government services and become included within the formalised economy
• Assigning the NID number at birth and including
it in the birth certificate to provide a consistent
lifetime identification and linking the civil
registration processes and database to that of
the national ID system, would give every
Ethiopian and/or resident of Ethiopia a unique
lifetime number, which could serve for national
accountability and planning.
• Providing legal identity for all, including birth
registration, can accelerate progress towards
many targets, such as financial inclusion,
universal healthcare coverage and economy
formalization.
The program is, however, facing challenges• Changing mandates across Ministries (MCIT–
MINT–MOP)
Implications of a National ID Programme for the digitalisation of the economy
Some steps have been taken for stablishing a National ID programme, special attention should be given to implementation
for the success of the initiative
The original concept and justification document for a national ID to replace the kebele ID system was drafted in 2009.
The National Digital ID program envisioned to replace the Kebele ID system, initially led by a commission of authorities’ representatives and, now under the Ministry of Peace’s mandate.
All citizens will be provided a unique number (NID number) assigned at birth and used as a means of consistent lifetime identification
The project includes an Automated Fingerprint Identification System (AFIS), and the issuance of smart cards and regular, polycarbonate cards.
MoP is currently setting the strategy for the NIP and engaging MINT on whether to include a foundational digital ID programme within it.
Digital ID program has started implementation is Addis Ababa and could serve as an important pilot for the national upscale
Source: World Bank, MINT
41
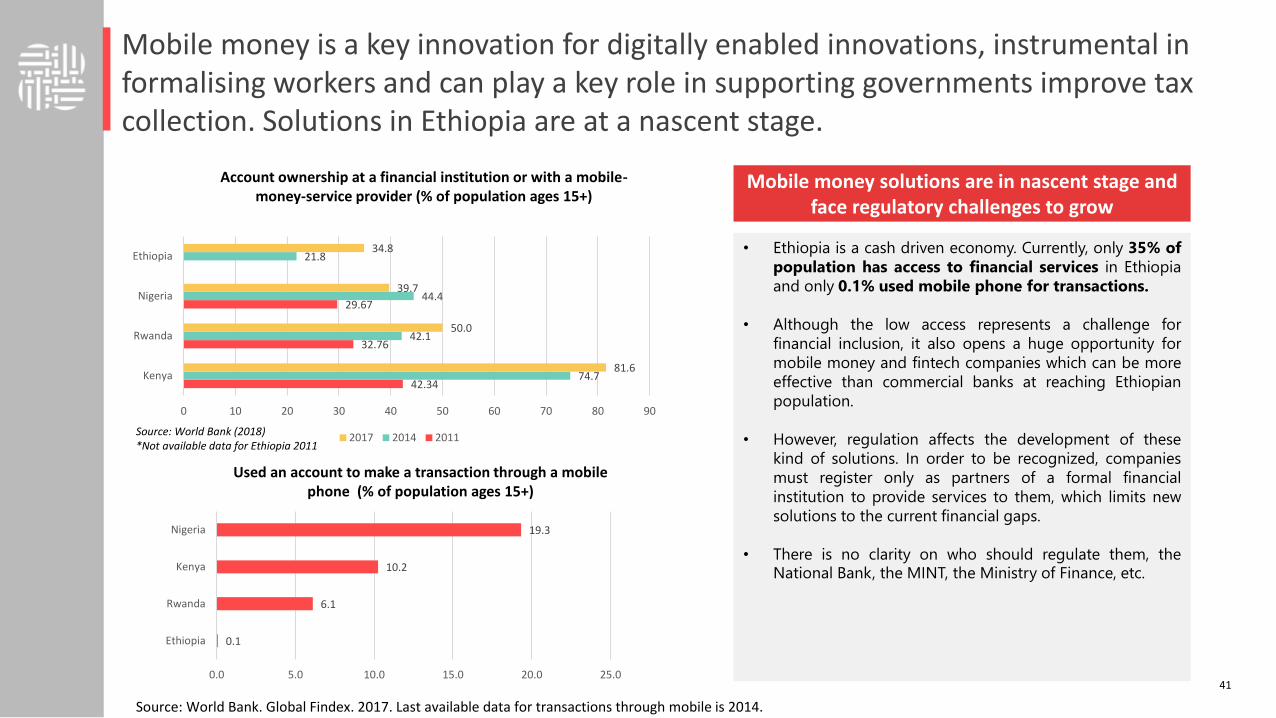
• Ethiopia is a cash driven economy. Currently, only 35% of
population has access to financial services in Ethiopia
and only 0.1% used mobile phone for transactions.
• Although the low access represents a challenge for
financial inclusion, it also opens a huge opportunity for
mobile money and fintech companies which can be more
effective than commercial banks at reaching Ethiopian
population.
• However, regulation affects the development of these
kind of solutions. In order to be recognized, companies
must register only as partners of a formal financial
institution to provide services to them, which limits new
solutions to the current financial gaps.
• There is no clarity on who should regulate them, theNational Bank, the MINT, the Ministry of Finance, etc.
Mobile money solutions are in nascent stage and face regulatory challenges to grow
Mobile money is a key innovation for digitally enabled innovations, instrumental in formalising workers and can play a key role in supporting governments improve tax collection. Solutions in Ethiopia are at a nascent stage.
42.34
32.76
29.67
74.7
42.1
44.4
21.8
81.6
50.0
39.7
34.8
0 10 20 30 40 50 60 70 80 90
Kenya
Rwanda
Nigeria
Ethiopia
2017 2014 2011
Account ownership at a financial institution or with a mobile-money-service provider (% of population ages 15+)
Source: World Bank (2018) *Not available data for Ethiopia 2011
Used an account to make a transaction through a mobile phone (% of population ages 15+)
0.1
6.1
10.2
19.3
0.0 5.0 10.0 15.0 20.0 25.0
Ethiopia
Rwanda
Kenya
Nigeria
Source: World Bank. Global Findex. 2017. Last available data for transactions through mobile is 2014.

88.93
79.24
65.83
65.67
0 20 40 60 80 100 120
Rwanda
Kenya
Ethiopia
Nigeria
Infrastructure and Investment Environment Agent Network
KYC Transaction Limits
Consumer Protection Authorisation
Index
GSMA MobileMoney Regulatory Index 2019, Ethiopia and peers
• Ethiopia has a relatively well-established agent network (as measured as proportionality of employing and using agents) as well as a high level of flexibility of providers to meet customer needs with regards to transactions
• However, Ethiopia’s regulatory framework is restrictive in authorisation, as non-financial institutions are currently not allowed to issue mobile money
Ethiopia performs relatively well on the MobileMoney regulatory index with respect to certain indices, yet the exclusive right of financial institutions to issue mobile money remains a key constraint
Source: GSMA 2019 based on GSMA Intelligence

43
0%
3%
9%
4%
1%
4%
0%
2%
4%
6%
8%
10%
12%
14%
48%
Share of the population who used the internet to buy something online in the past year (% age 15+)
Source: World Bank (2018) Findex database, Economist Intelligence Unit (2018)
96.0
0 10 20 30 40 50 60 70 80 90 100
Burkina Faso
Ethiopia
Côte d'Ivoire
Sudan
Congo (DRC)
Nigeria
Cameroon
Rwanda
Senegal
Tanzania
Malawi
Namibia
Zambia
Mozambique
Botswana
Kenya
South Africa
Uganda
Liberia
Ghana
Madagascar
Ethiopians are self-reportedly amongst the least productive technology users in Sub-Saharan Africa, behind Burkina Faso 2017 survey: E-Entertainment usage (% of overall internet usage)
Note: Reply to the survey question ‘How often do you use the internet for entertainment purposes? Ranked by responses indicating 'Several times a day', 'Every day' and 'Several times a week'
Currently Ethiopians use digital technology mainly for entertainment. This may be a reflection of the nascent development of mobile money and e-services, but also that citizens are not aware of the potential for economically productive activities.

44Source: Economist Intelligence Unit (EIU), based on ITU and Gallup data, Internet World Stats (2017)
Rank Country Previous Current(2016)
Change
1 South Korea 98.8 99.2 0.41%
10 Singapore 89.5 91.1 1.79%
52 Rwanda 6.7 39.7 490.77%
65 India 20 22.6 13.19%
67 Kenya 19.6 22.3 13.78%
74 Ethiopia 9.8 15.4 56.81%
75 Nigeria 11.4 15.2 33.60%Sub-Saharan Africa 14.6 20
Ethiopia’s gender gap in internet access – worse than Kenya or the African average, but better than Nigeria and Rwanda:
Note: Internet users are individuals who have used the Internet (from any location) in the last 12 months. Internet can be used via a computer, mobile phone, personal digital assistant, games machine, digital TV etc.
54%
80%
84%
111%
62%
0% 20% 40% 60% 80% 100% 120%
Kenya
Ethiopia
Nigeria
Rwanda
Sub-Saharan Africa
Ethiopia’s Internet users, as % of the population: below regional peers,Catching up fast, but not nearly as fast as Rwanda:
Note: Indicator measures the gap between male and female access to the Internet. Higher values indicate larger gaps.
Facebook users (12/17)
83.8%
73.0%
3.8%
15.7%
13.4%
4.1%
8.5%Jj
When only 15% of the population uses the internet, the gender gap is further amplified in internet access – worse than Kenya and the African average

45
Ethiopia, Chad, DRC, SSA av.
Ethiopia, China, India, Bangladesh Ethiopia, Israel, Estonia, Korea
➢ Trajectory: Ethiopia gender disparity to less social media use by women, lower than the African average (top let), the region’s front countries (top right). But, slightly higher than in Bangladesh, and India (bottom left).
➢ Implications for Ethiopia’s Digital Readiness: Studies have found that internet usage has particularly helped working women in developing countries, more so than handsets (Bailur/Masiero 2017). This should be addressed.
Source: GSMA 2019, based on Facebook Audience Insights/Datareportal
Ethiopia, Rwanda, Nigeria, Kenya
And this gender gap is then reflected in social media use – a key by-product, and likely future enabler in some form, of the digital economy

46
Ethiopia, Chad, DRC, SSA av.
Ethiopia, China, India, Bangladesh Ethiopia, Israel, Estonia, Korea
➢ Trajectory: the African gender gap (top left) is narrower than in South Asia (bottom left), and Kenya and Nigeria are lear the global frontier (top right and bottom right). But, despite recent improvements, Ethiopia still lags behind Africa and is on par with Bangladesh and India.
Source: GSMA 2019, based on GSMA Intelligence/Gallup World Poll
Ethiopia, Rwanda, Nigeria, Kenya
The gender gap in internet access and social media use will be highly steered by the gender gap in mobile ownership, far lower than the SSA average

47
Source: GII, based on Average score of the top 3 universities at the QS worlduniversity ranking* | 2018 Average score of the top three universities per country. If fewer than three universities are listed in the QS ranking of the global top 1000 universities, the sum of the scores of the listed universities is divided by three, thus implying a score of zero for the non-listed universities. Source: QS Quacquarelli Symonds Ltd, QS World University Ranking 2017/2018, Top Universities. (https://www.topuniversities.com/university-rankings/ world-university-rankings/2018).
0
0.1
0.2
0.3
0.4
2013 2014 2015 2016 2017 2018 2019
Total computer software spending (% of GDP), Ethiopia and peers
2017-19
Ethiopia Kenya Rwanda Nigeria
0
0.2
0.4
0.6
2013 2014 2015 2016 2017 2018 2019
Total computer software spending (% of GDP),Ethiopia and new industrialized countries
2017-19
Ethiopia China India Bangladesh
0
0.1
0.2
0.3
0.4
2013 2014 2015 2016 2017 2018 2019
Total computer software spending (% of GDP),Ethiopia and advanced aspirational economies
2017-19
Ethiopia Israel Estonia Korea
Ethiopia is behind its regional peers in computer software spending, which could also indicate why the internet is predominantly used for entertainment and less for economically productive purposes

48
Source: GII, based on High-tech and medium-high-tech output (% of total manufactures output)a | 2016 – used rank indicesSource: United Nations Industrial Development Organization (UNIDO), Industrial Statistics Database, 3- and 4-digit level of International Standard Industrial Classification ISIC Revision 4 and Revision 3 (INDSTAT4 2018); OECD, Directorate for Science, Technology and Industry, Economic Analysis and Statistics Division, “ISIC Rev. 3 and Rev. 4 Technology Intensity Definition: Classification of Manufacturing Industries into Categories Based on R&D Intensities” (2008–16). (http://www.unido.org/statistics.html; http://stat.unido.org/content/focus/classification-of-manufacturing-sectors-by-technological-intensity-%2528isic-revision-4%2529;jsessionid=4DB1A3A5812144CACC956F4B8137C1CF;http://www.oecd.org/sti/ind/48350231.pdf).
But there is pause for optimism: Ethiopia is better ranked in higher proportion of high-tech and medium high-tech goods compared to some regional and international peers such as Kenya and Bangladesh
2015 2016 2017
China 15 18 14
India 32 36 40
Ethiopia 76 75 71
Kenya 84 82 78
Bangladesh 74 79 84
High-tech and medium high-tech output (rank indicator), 2015 – 2017
Ethiopia and new industrialisers
High-tech and medium high-tech output (rank indicator), 2015 – 2017
Ethiopia and advanced aspirational economies
2015 2016 2017
Korea 7 1 18
Estonia 23 24 30
Israel 37 41 37
Ethiopia 76 75 71
Ethiopia has improved its position in the ranking for High-techand medium high-tech output, which should provide it withthe capabilities to adopt new tech for productive purposes.

49
Ethiopia, Chad, DRC, SSA av.
Ethiopia, China, India, Bangladesh Ethiopia, Israel, Estonia, Korea
➢ Ethiopia’s scores have improved and are now on par with the regional SSA average.
➢ ICT leaders, are far ahead (top right). They are catching up with the global frontier (compare bottom right). Bangladesh also has better cyber security than Ethiopia (bottom left).
➢ Implications for Ethiopia’s Digital Readiness: Cyber security is a core 21st century asset. E.g. offshored BPO contracts have long hinged on it, and new manufacturing GVCs will increasingly demand secure data traffic.
Source: GSMA 2019 based on ITU
Ethiopia, Rwanda, Nigeria, Kenya
Another enabling system critical to digital readiness – and pertinent to services exports – is cyber security. Whilst Ethiopia is on a par with the SSA average, it is behind its regional peers that are currently better positioned for online services exports
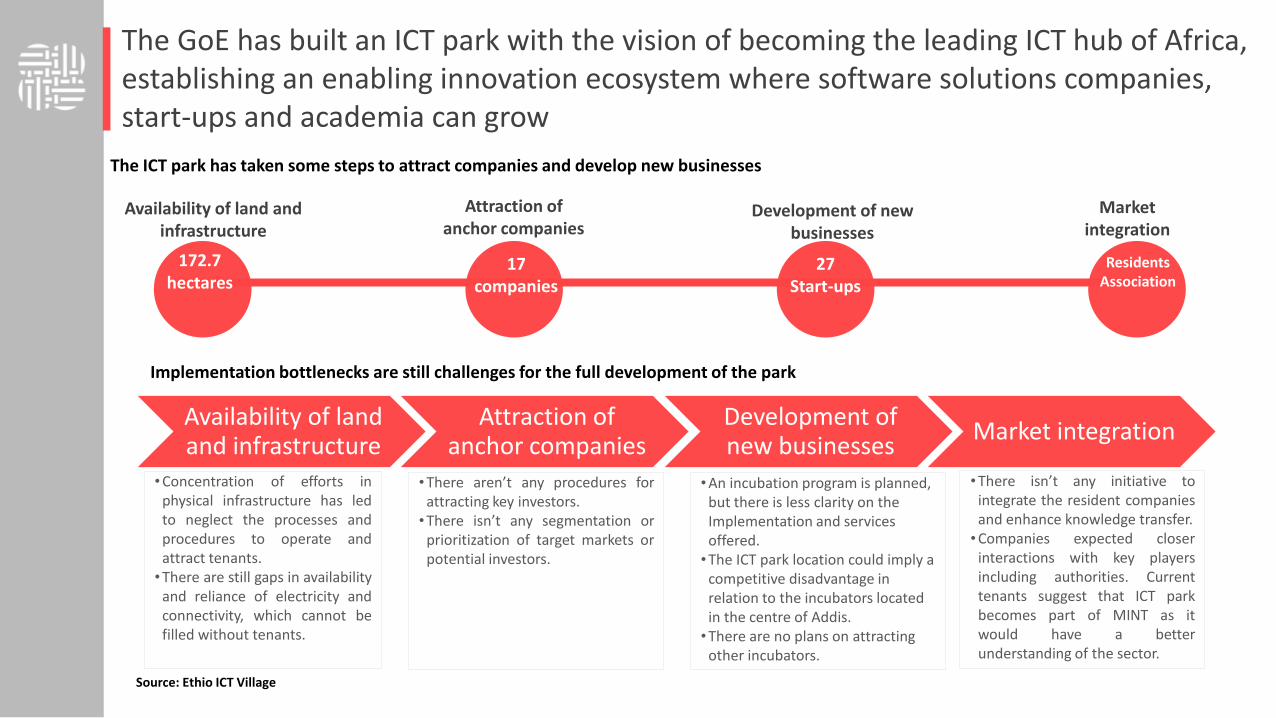
• Concentration of efforts inphysical infrastructure has ledto neglect the processes andprocedures to operate andattract tenants.
• There are still gaps in availabilityand reliance of electricity andconnectivity, which cannot befilled without tenants.
• There aren’t any procedures forattracting key investors.
• There isn’t any segmentation orprioritization of target markets orpotential investors.
• An incubation program is planned, but there is less clarity on the Implementation and services offered.
• The ICT park location could imply a competitive disadvantage in relation to the incubators located in the centre of Addis.
• There are no plans on attracting other incubators.
• There isn’t any initiative tointegrate the resident companiesand enhance knowledge transfer.
• Companies expected closerinteractions with key playersincluding authorities. Currenttenants suggest that ICT parkbecomes part of MINT as itwould have a betterunderstanding of the sector.
Availability of land and infrastructure
Attraction of anchor companies
Development of new businesses
Market integration
Source: Ethio ICT Village
The GoE has built an ICT park with the vision of becoming the leading ICT hub of Africa, establishing an enabling innovation ecosystem where software solutions companies, start-ups and academia can grow
172.7 hectares
17 companies
27 Start-ups
Residents Association
The ICT park has taken some steps to attract companies and develop new businesses
Implementation bottlenecks are still challenges for the full development of the park
Availability of land and infrastructure
Attraction of anchor companies
Development of new businesses
Market integration
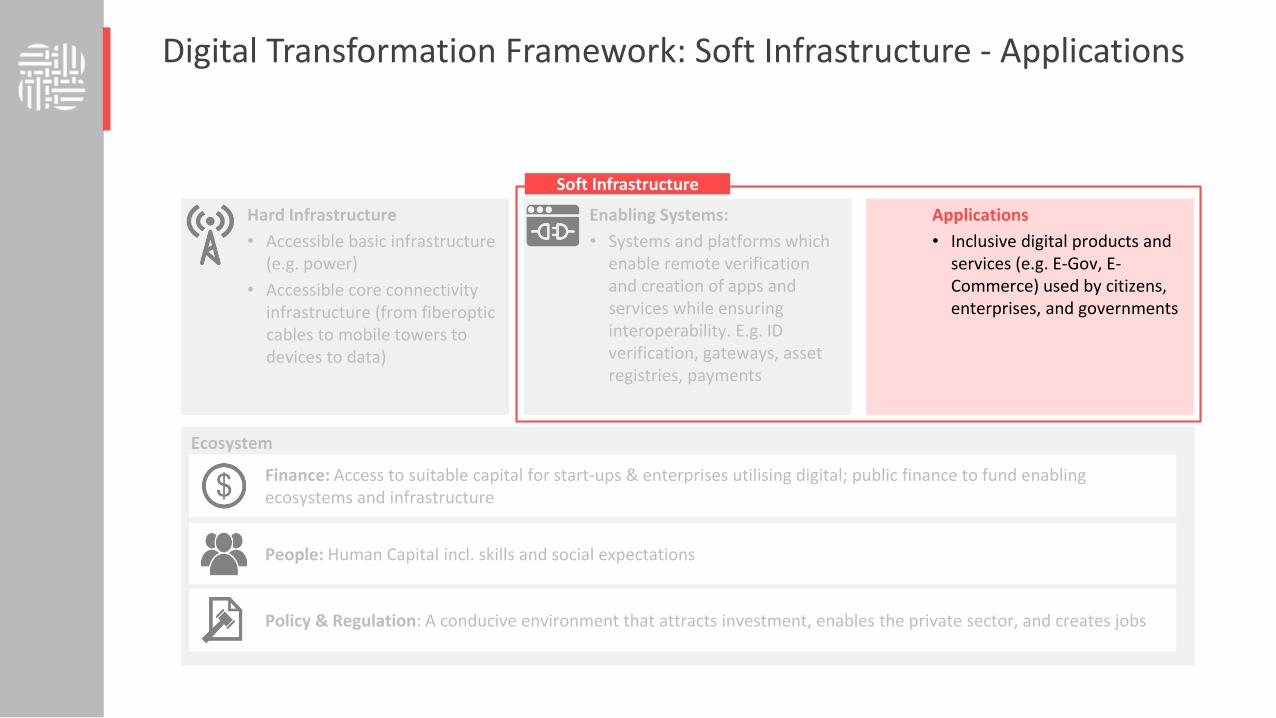
Digital Transformation Framework: Soft Infrastructure - Applications
Hard Infrastructure
• Accessible basic infrastructure (e.g. power)
• Accessible core connectivity infrastructure (from fiberoptic cables to mobile towers to devices to data)
Applications
• Inclusive digital products and services (e.g. E-Gov, E-Commerce) used by citizens, enterprises, and governments
Ecosystem
Finance: Access to suitable capital for start-ups & enterprises utilising digital; public finance to fund enabling ecosystems and infrastructure
People: Human Capital incl. skills and social expectations
Policy & Regulation: A conducive environment that attracts investment, enables the private sector, and creates jobs
Soft Infrastructure
Enabling Systems:
• Systems and platforms which enable remote verification and creation of apps and services while ensuring interoperability. E.g. ID verification, gateways, asset registries, payments

52
Ethiopia’s e-governance capacity is comparatively strong and steadily growing
•Due to speed and security issues, the GoE has exclusive access to adedicated network, called Woredanet. Services consist in voice,data, internet. The added value is the VPN.
•Woredanet was designed to create connectivity across publicinstitutions. It is the base to sustain e-governance projects.
•All digital public projects are sustained by WoredaNet, includingSchoolnet and e- health programs
•Capacity is equally allocated to each woreda (district) and cappedat 2MB; this is not based on demand. However, as demand isincreasing, Woredanet service speed is declining due to congestion.
•Woredanet is considered to be expanded and updated with amore efficient connection (migration to cloud within the options).
MInT is currently exploring new methods of rolling out connectionsto government institutions; private sector engagement throughpublic-private partnerships are considered for project finance anddevelopment.
Ethiopia has long been Africa’s developmental state
• Electronic offices• Development of the IT portal and information services
websites for more than 20 authorities• Radio projects: Community radio stations for inclusion• Automation for front office: (platforms, training and
engagement)• Concertation program: information management across the
government.
• The main challenge is the limited bandwidth capacity, and thelack of tools for monitoring the use of it. Currently, thegovernment lacks tools to know which woreda is more activein terms of use of bandwidth.
• There is a need of stablishing standards to distribute thecapacity. A study is being conducted by Addis AbabaUniversity.
• There is a need of technical support.
E – government initiatives face key challenges
Source: MINT
The Government of Ethiopia has a long history of e-governance initiatives, premised on its developmental state model

Government Online Service Index, 0–1
ICT use & gov’t efficiency, 1-7
Gov’t procurement of advanced tech, 1-7
Availability of e-Gov services in local
language, 0-2
Trust in Gov Websites and apps
Score 0 - 100
Source: Networked Readiness Index, 2016. EIU based on own surveys and country research
0.51
0.45
0.42
0.30
5.63
3.78
4.60
2.86
4.61
3.59
3.79
2.78
1
1
2
1
52
54
76
50
Compared to its leading regional peers, only Rwanda outperforms Ethiopia in its governments online services performance. However, it does still lag in providing these services in local languages, indicating they may not be as inclusive as could be

54
Ethiopia, Kenya, Rwanda, Nigeria
Ethiopia, Israel, Estonia, Korea
0
0.2
0.4
0.6
0.8
1
2013 2014 2015 2016 2017 2018 2019
Government Online Services Index, 2013-19, index value
Ethiopia Kenya Rwanda Nigeria
Source: GII, based on The Online Services Index component of the E-Government Development Index, which is a composite indicator measuring the use of ICTs by governments in delivering publicservices at the national level. Note: The precise meaning of these values varies from one edition of the Survey to the next as understanding of the potential of e-government changes and the underlying technology evolves. Read about the methodology at https://publicadministration.un.org/egovkb/Portals/egovkb/Documents/un/2018-Survey/E-Government%20Survey%202018_Annexes.pdf .Source: United Nations Public Administration Network, e-Government Survey 2018. (https://publicadministration.un.org/egovkb/en-us/About/Overview/-E-Government-Development-Index).
Ethiopia, China, India, Bangladesh
0
0.2
0.4
0.6
0.8
1
2013 2014 2015 2016 2017 2018 2019
Government Online Services Index, 2013-19, index value
Ethiopia China India Bangladesh
0
0.2
0.4
0.6
0.8
1
2013 2014 2015 2016 2017 2018 2019
Government Online Services Index, 2013-19, index value
Ethiopia Israel Estonia Korea
Beyond its regional peers, Ethiopia still lags behind its global comparator peers such as Bangladesh and India, in its government’s provision of online services
➢ Ethiopia’s e-governance efforts have placed it in a competitive point in relation to its regional peers. E-government capacity is comparatively strong and steadily growing
➢ The global competitors are, however, all stronger, including Bangladesh.
➢ Implications for Ethiopia’s Digital Readiness: Ethiopia has long been Africa’s developmental state. Woredanet, Schoolnet, and TeleCourt were all early indications of Ethiopia’s potential.
55
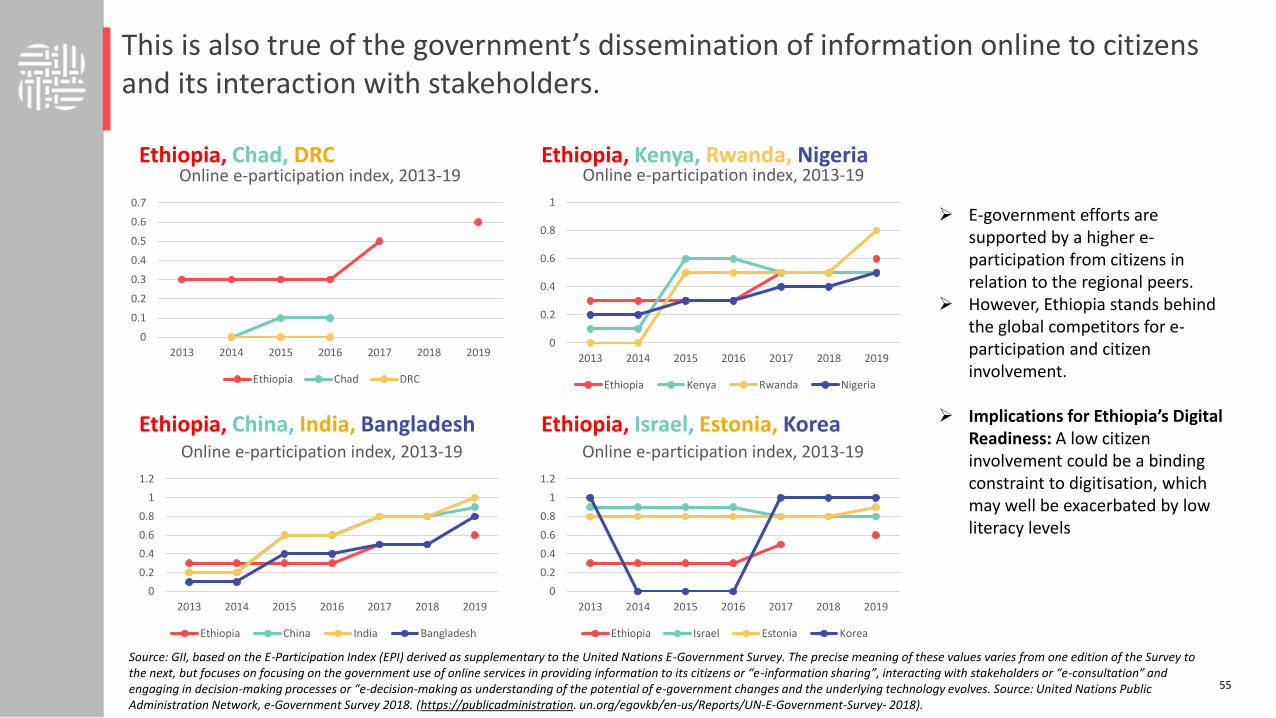
Ethiopia, Chad, DRC
Ethiopia, China, India, Bangladesh Ethiopia, Israel, Estonia, Korea
➢ E-government efforts are supported by a higher e-participation from citizens in relation to the regional peers.
➢ However, Ethiopia stands behind the global competitors for e-participation and citizen involvement.
➢ Implications for Ethiopia’s Digital Readiness: A low citizen involvement could be a binding constraint to digitisation, which may well be exacerbated by low literacy levels
Source: GII, based on the E-Participation Index (EPI) derived as supplementary to the United Nations E-Government Survey. The precise meaning of these values varies from one edition of the Survey to the next, but focuses on focusing on the government use of online services in providing information to its citizens or “e-information sharing”, interacting with stakeholders or “e-consultation” and engaging in decision-making processes or “e-decision-making as understanding of the potential of e-government changes and the underlying technology evolves. Source: United Nations Public Administration Network, e-Government Survey 2018. (https://publicadministration. un.org/egovkb/en-us/Reports/UN-E-Government-Survey- 2018).
Ethiopia, Kenya, Rwanda, Nigeria
0
0.2
0.4
0.6
0.8
1
2013 2014 2015 2016 2017 2018 2019
Online e-participation index, 2013-19
Ethiopia Kenya Rwanda Nigeria
0
0.1
0.2
0.3
0.4
0.5
0.6
0.7
2013 2014 2015 2016 2017 2018 2019
Online e-participation index, 2013-19
Ethiopia Chad DRC
0
0.2
0.4
0.6
0.8
1
1.2
2013 2014 2015 2016 2017 2018 2019
Online e-participation index, 2013-19
Ethiopia China India Bangladesh
0
0.2
0.4
0.6
0.8
1
1.2
2013 2014 2015 2016 2017 2018 2019
Online e-participation index, 2013-19
Ethiopia Israel Estonia Korea
This is also true of the government’s dissemination of information online to citizens and its interaction with stakeholders.

E-Commerce contentScore 0 – 100
E-commerce content
Rank / 86
E-commerce safety
Score 0 - 100
E-finance contentScore 0 - 2
E-finance contentRank / 86
Source: EIU based on UNCTAD and surveys & country research
16
45
46
63
84
51
50
37
1
2
2
61
56
35
33
169
59.5
69
74.5
E-commerce payment systems are a key application to facilitate digitisation of the economy. Ethiopia will need to make significant steps to improve it’s e-commerce position regionally, ranking below its peers Nigeria and Kenya

57
• .Ethiopian banks use debit cards and automated teller
machines (ATM) but have not begun to issue credit cards.
Most Ethiopians do not have credit cards and internet
connections are slow, expensive and unreliable.
• ATMs are interconnected with international banking
networks. International ATM cardholders are able to
withdraw funds from any ATM machine of the 18
commercial banks operating in Ethiopia.
• ET Switch S.C., a shared ownership company with the
commercial banks, was created to improve bank-to-bank
integration. According to sources at ET Switch S.C., the
service is expected to be used by over 5 million ATM card
holders across the country.
• Ethiopian banks have started using primary internet
transactions through mobile and card banking services.
These technologies followed the launch of centralized,
online real-time, electronic banking solutions that have
increased customers.
• There is still a long way to go to improve the digital
financial services delivery system.
• Currently, foreign firms are engaged as technology service
providers for various financial inclusion projects of the GOE.
Electronic commerce is in its infancy in Ethiopia and is rarely used
The instruments used by the financial sector in Ethiopia are not as modern as they could be and this has limited its ability to develop and benefit from e-commerce
Debit card ownership (% of population ages 15+)
Credit card use ownership (% of population ages 15+)
Source: World Bank. Global Findex. 2017.
4
5
32
38
Ethiopia
Rwanda
Nigeria
Kenya
0.3
1
3
6
Ethiopia
Rwanda
Nigeria
Kenya

Digital Transformation Framework: Finance
Hard Infrastructure
• Accessible basic infrastructure (e.g. power)
• Accessible core connectivity infrastructure (from fiberoptic cables to mobile towers to devices to data)
Enabling Systems:
• Systems and platforms which enable remote verification and creation of apps and services while ensuring interoperability. E.g. ID verification, gateways, asset registries, payments
Applications
• Inclusive digital products and services (e.g. E-Gov, E-Commerce) used by citizens, enterprises, and governments
Ecosystem
Finance: Access to suitable capital for start-ups & enterprises utilising digital; public finance to fund enabling ecosystems and infrastructure
People: Human Capital incl. skills and social expectations
Policy & Regulation: A conducive environment that attracts investment, enables the private sector, and creates jobs
Soft Infrastructure

40
10 10
87 7
65
4
2
Access fofinance
Electricity Customs andregulations
Tax rates Corruption Taxadministration
Practices ofthe informal
sector
Access to landTransportation Inadequatelyeducatedworkforce
Top ten business constraints for enterprises in 2015 (in %)
Access to finance is identified as the top business constraint for enterprises in Ethiopia – a critical facilitator for innovation, regardless of the digital setting
" Firms in Ethiopia are much more likely to be fully credit constrained than firms elsewhere in
the world” Francesco Strobbe (WBG, 2015)
Source: World Bank (2015) Enterprise Survey
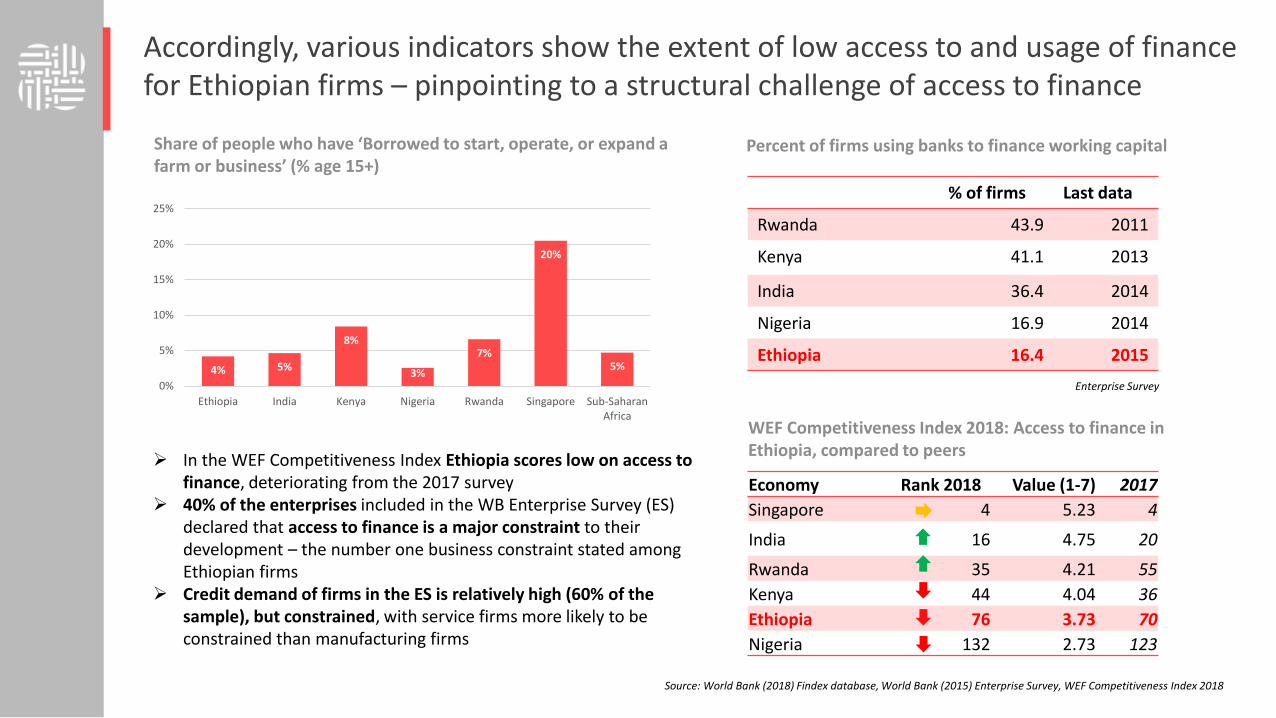
Percent of firms using banks to finance working capital
Source: World Bank (2018) Findex database, World Bank (2015) Enterprise Survey, WEF Competitiveness Index 2018
WEF Competitiveness Index 2018: Access to finance in Ethiopia, compared to peers
➢ In the WEF Competitiveness Index Ethiopia scores low on access to finance, deteriorating from the 2017 survey
➢ 40% of the enterprises included in the WB Enterprise Survey (ES) declared that access to finance is a major constraint to their development – the number one business constraint stated among Ethiopian firms
➢ Credit demand of firms in the ES is relatively high (60% of the sample), but constrained, with service firms more likely to be constrained than manufacturing firms
% of firms Last data
Rwanda 43.9 2011
Kenya 41.1 2013
India 36.4 2014
Nigeria 16.9 2014
Ethiopia 16.4 2015
Economy Rank 2018 Value (1-7) 2017
Singapore 4 5.23 4
India 16 4.75 20
Rwanda 35 4.21 55
Kenya 44 4.04 36
Ethiopia 76 3.73 70
Nigeria 132 2.73 123
4% 5%
8%
3%
7%
20%
5%
0%
5%
10%
15%
20%
25%
Ethiopia India Kenya Nigeria Rwanda Singapore Sub-SaharanAfrica
Enterprise Survey
Share of people who have ‘Borrowed to start, operate, or expand a farm or business’ (% age 15+)
Accordingly, various indicators show the extent of low access to and usage of finance for Ethiopian firms – pinpointing to a structural challenge of access to finance

61
Ethiopia, Chad, DRC
Ethiopia, China, India, Bangladesh
Source: GII, based on Ease of getting credit* | 2018 World Bank, Doing Business 2019: Training for Reform. (http://www.doingbusiness.org/en/reports/global- reports/doing-business-2019).The ranking of economies on the ease of getting credit is determined by sorting their scores for getting credit. These scores are the score for the sum of the strength of the legal rights index (range 0–12) and the depth of credit information index (range 0–8).
Ethiopia, Kenya, Rwanda, Nigeria
Ethiopia underperforms its regional comparators in the ease of accessing credit, and other less stable SSA countries too.
0
50
100
2013 2014 2015 2016 2017 2018 2019
Ease of getting credit score, 2013 -19
Ethiopia Kenya Rwanda Nigeria
0
50
100
2013 2014 2015 2016 2017 2018 2019
Ease of getting credit score, 2013 -19
Ethiopia China India Bangladesh
0
50
100
2013 2014 2015 2016 2017 2018 2019
Ease of getting credit score, 2013 -19
Ethiopia Israel Estonia Korea
Ethiopia, Israel, Estonia, Korea
0
10
20
30
40
50
60
2013 2014 2015 2016 2017 2018 2019
Ease of getting credit score, 2013 - 19
Ethiopia Chad DRC

62
Ethiopia, DRC, Chad
Ethiopia, Bangladesh, India
This could in part be based on the historic monopoly of the financial sector, as well as the FOREX challenges that were raised. However, further analysis is necessary to understand this
Source: World Development Indicators, World Bank (2018) Ethiopia Growth and Competitiveness (P168566) Program Document
Ethiopia, Kenya, Nigeria, Rwanda
Domestic credit to the private sector is low compared to other countries in Africa and globally, which is a major constraint to private-sector growth and job creation.
Ethiopia, Israel, Korea, Estonia
12%
29%
14%
21%
Ethiopia Kenya Nigeria Rwanda
12%
48% 49%
Ethiopia Bangladesh India
12%
5%
10%
Ethiopia Congo, Dem. Rep. Chad
12%
66%
145%
65%
Ethiopia Israel Korea, Rep. Estonia

• Surveys among Ethiopian manufacturing firms show that the majority
of start up financing is still from private sources and that formal banks
represent less than 5% of external financing
• Rejections of loan applications are common. In the EDRI manufacturing
SME survey, 39.4% applied for a loan. 70% of loan applications were
rejected and 20% of those without giving a reason for rejection
• In addition, the survey showed that the use of capital markets and
foreign investment for finance is relatively low among manufacturing
firms
Source: TBI Startup Ecosystem report, EDRI (2017) Baseline Survey Report: Main Features of manufacturing MSEs in Ethiopia, AACCSA & DAB DRT (2014) Survey of Ethiopian Manufacturing Firms
Source of finance for start up % %
Personal saving 66.8
Partners contribution 18.2
Borrowing from MFIs 4.9
Borrowing from friends/relatives 4.9
Borrowing from Savings and Credit Associations 2
Grant from relatives/friends 1.5
Support from NGO/government institution 1
Bank loan 0.5
Other 0.1
Source of finance for start up among manufacturing SMEs
Sources of finance for manufacturing firms
Domestic bank, 62.21%
Domestic capital market, 5.73%
Foreign investor / partner, 1.53%
Foreign investment / partner, 9.54%
Savings, 16.79%
Other source, 4.20%
Source of finance Loan for investment
Loan for working capital
Formal banks 4.0% 4.9%
MFIs 18.3% 20.4%
Government projects 0.7% 0.8%
NGOs 0.5% 0.6%
Saving and credit cooperatives 3.7% 4.3%
Informal sources 8.6% 12.2%
No access to external finance 64.2 56.8%
Sources of external finance for manufacturing SMEs
A closer look at manufacturing firms illustrates the difficulties in accessing formal sources of credit and finance by firms in Ethiopia

There are regional discrepancies in the submission and success rates for loan applications as well as stark gender discrepancies in accessing finance
18.8
42.1
23.127.1
48
15.4
57.1
25
15
49.8
61
74
40
53
69
48
63
5055
79
Adama AddisAbaba
Bahir Dar Dessie Dire Dawa Gondar Hawassa Jigjiga Jimma Mekelle
Applied for formal loan (%) Successful (%)
Applications and success rate (%) for formal loans by cities among manufacturing SMEs (2017 survey)
Source: Gebreeyesus and Ambachew (2017): Baseline Survey Report: Main Features of manufacturing MSEs in Ethiopia, Ethiopian Development Research Institute
Ethiopia SSA avg Global avg
Top manager is female 49.1% 40.9% 27.5%
Top manager is male 18.8% 38.2% 26.7%
Percent of firms identifying access to finance as a major constraint, women- vs male-owned firms (2015)
• According to the World Bank Enterprise Survey (2015),
female-owned or –managed firms face more constraints in
accessing finance
• The difference between men and women is particularly
stark in Ethiopia as compared to other SSA countries and
worldwide
• This difference matters, as loans have shown to help
female-owned firms grow by 25% in a recent study, while
those firms are also most likely to employ other female
employees, reducing gender inequalities in the labor
market (World Bank, 2019).
• Regional differences exist when it comes to the share of
manufacturing SMEs submitting and succeeding in loan
applications, with firms in larger cities Addis Ababa, Dire
Dawa and Mekelle having better access to loans

Source: IBEX Frontier (2018)
Top ten countries in Africa for 2018 tech and start up funding
Much innovation in the digital economy will be premised on start-ups – however SSA’s top destinations for tech and start up funding exceed Ethiopia roughly 10 times
• Looking into tech start ups, a recent comparison of investments
going into Sub-Saharan African start ups shows the extent of the
lack of investments in Ethiopian start ups, which lags behind
Kenya, Nigeria and South Africa in investment value by
approximately ten times
76.4%
8.5%
1.5% 1.0% 0.3% 0.0%
Fintech Agri-tech AI & Robotics
Logistics Ed-Tech Off-grid energy
Destination of disclosed funds by sectors
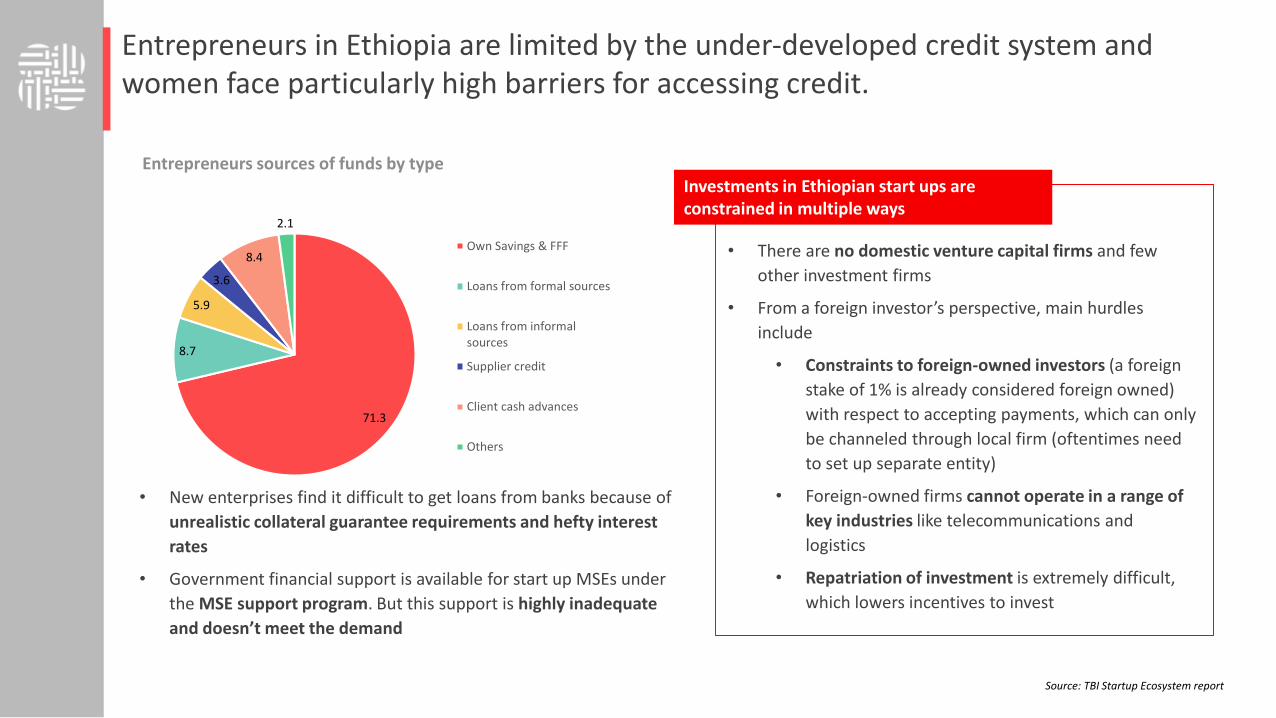
71.3
8.7
5.9
3.6
8.4
2.1
Own Savings & FFF
Loans from formal sources
Loans from informalsources
Supplier credit
Client cash advances
Others
• New enterprises find it difficult to get loans from banks because of
unrealistic collateral guarantee requirements and hefty interest
rates
• Government financial support is available for start up MSEs under
the MSE support program. But this support is highly inadequate
and doesn’t meet the demand
Entrepreneurs sources of funds by type
Source: TBI Startup Ecosystem report
Entrepreneurs in Ethiopia are limited by the under-developed credit system and women face particularly high barriers for accessing credit.
• There are no domestic venture capital firms and few
other investment firms
• From a foreign investor’s perspective, main hurdles
include
• Constraints to foreign-owned investors (a foreign
stake of 1% is already considered foreign owned)
with respect to accepting payments, which can only
be channeled through local firm (oftentimes need
to set up separate entity)
• Foreign-owned firms cannot operate in a range of
key industries like telecommunications and
logistics
• Repatriation of investment is extremely difficult,
which lowers incentives to invest
Investments in Ethiopian start ups are constrained in multiple ways

• Ethiopia is on par with peers, if not cheaper, in terms of affordability of financing for business activity and has been able to become more affordable in recent years
• Average lending rates for commercial banks are at 13.5%, low 7% and high 20% and increased in last ten years, which is in the same range as Kenya’s average lending rates and lower than those in Nigeria and Rwanda
• However, access to foreign exchange is very costly for many innovative firms, due to an overall shortage but also to government policy (see boxes below)
While the cost of borrowing is comparable to regional peers, bureaucratic hurdles and constrained access to foreign exchange impose significant costs to start ups.
As a result, many Ethiopian start-ups have decided to operate from Kenya to triangulate the payments and avoid the Forex constraints in Ethiopia.
You must have 2 accounts, one for birr and other for foreign currency, but if you want to have your money from the forex account, you can’t, you would have to convert it to birrs. […] The smart thing is to open an office in Kenya.
Access to foreign exchange is costly for many Ethiopian firms
• Foreign exchange allocation by Ethiopian banks is prioritized to imports of “essential goods,” including fuel, fertilizers, raw materials, and spare parts, among others, as well as for servicing approved foreign currency loans
• All payments abroad require permits and all transactions in foreign exchange must be carried out through authorized dealers supervised by the NBE
• State owned enterprises and government sponsored infrastructure projects usually are given priority over the private sector when competing for access to foreign exchange
Source: Personal interviews, World Bank (2019) Country Private Sector Diagnostic – Ethiopia, https://www.export.gov/article?id=Ethiopia-Foreign-Exchange-Controls, WEF Global Competitiveness Index 2010--2017
3.3 3.2 3.23.4
3.6 3.63.8
3.7
1.5
2
2.5
3
3.5
4
4.5
5
2010 2011 2012 2013 2014 2015 2016 2017
Ethiopia Kenya Nigeria Rwanda
Affordability of financial services in Ethiopia and regional peers (1-7)
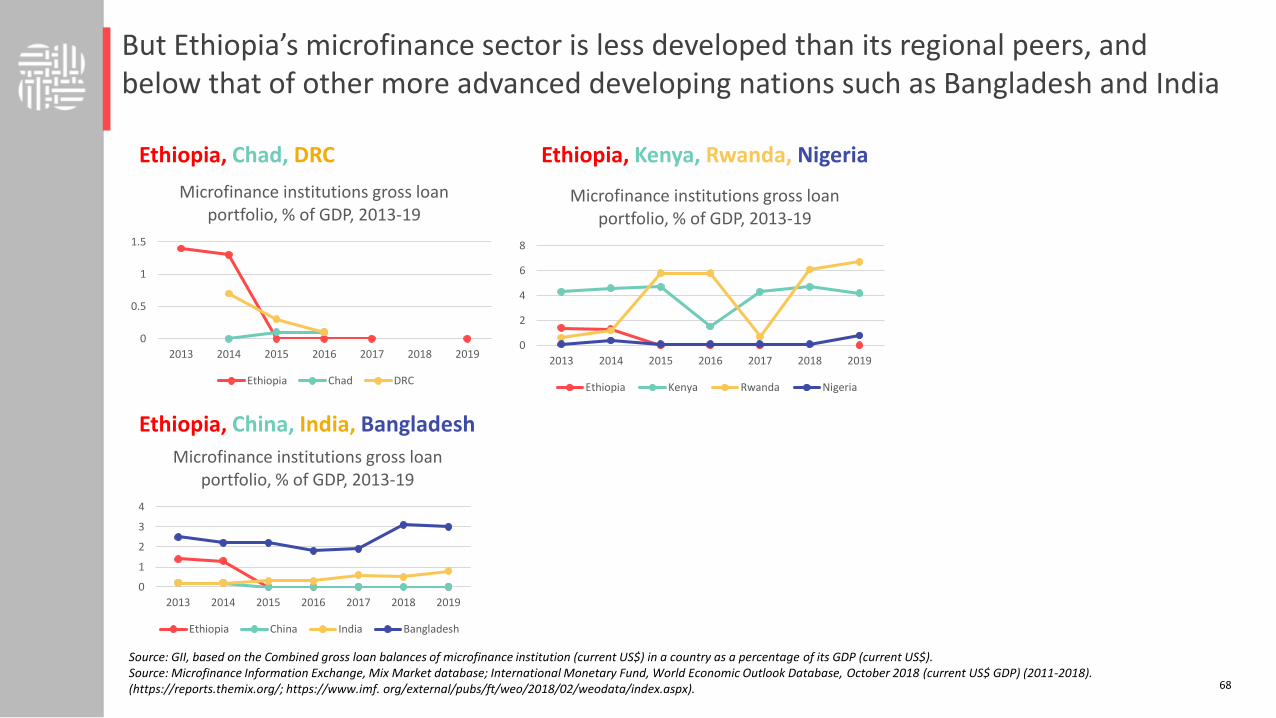
68
Ethiopia, Chad, DRC
Ethiopia, China, India, Bangladesh
Source: GII, based on the Combined gross loan balances of microfinance institution (current US$) in a country as a percentage of its GDP (current US$).Source: Microfinance Information Exchange, Mix Market database; International Monetary Fund, World Economic Outlook Database, October 2018 (current US$ GDP) (2011-2018). (https://reports.themix.org/; https://www.imf. org/external/pubs/ft/weo/2018/02/weodata/index.aspx).
Ethiopia, Kenya, Rwanda, Nigeria
But Ethiopia’s microfinance sector is less developed than its regional peers, and below that of other more advanced developing nations such as Bangladesh and India
0
0.5
1
1.5
2013 2014 2015 2016 2017 2018 2019
Microfinance institutions gross loan portfolio, % of GDP, 2013-19
Ethiopia Chad DRC
0
2
4
6
8
2013 2014 2015 2016 2017 2018 2019
Microfinance institutions gross loan portfolio, % of GDP, 2013-19
Ethiopia Kenya Rwanda Nigeria
0
1
2
3
4
2013 2014 2015 2016 2017 2018 2019
Microfinance institutions gross loan portfolio, % of GDP, 2013-19
Ethiopia China India Bangladesh

69
Ethiopia, China, India, Bangladesh Ethiopia, Israel, Estonia, Korea
Source: GII, based on Venture capital per investment location: Number of deals (per billion PPP$ GDP)a | 2018 – based on Thomson Reuters data on private equity deals, per deal, with information on the location of investment, investment company, investor firms, and funds, among other details. The series corresponds to a query on venture capital deals from January 1, 2018 to December 31, 2018, with the data collected by investment location, for a total of 14,856 deals in 78 countries in 2018. The data are reported per billion PPP$ GDP. Underlying sources: Thomson Reuters, Thomson One Banker Private Equity database; International Monetary Fund, World Economic Outlook Database October 2018 (PPP$ GDP). (https://www.thomsonone.com); https://www.imf.org/external/ pubs/ft/weo/2018/02/weodata/index.aspx).
Ethiopia, Kenya, Rwanda, Nigeria
Venture capital deals – indicative of entrepreneurial dynamism and the high growth potential of firms – are relatively low for Ethiopia, but also for its regional peers (bar Kenya). They are also relatively low for Bangladesh and India as well
0
0.1
0.2
0.3
0.4
0.5
2013 2014 2015 2016 2017 2018 2019
Venture capital deals, number of deals p/ billion PPP$ GDP
Ethiopia Kenya Rwanda Nigeria
0
0.1
0.2
0.3
0.4
0.5
2013 2014 2015 2016 2017 2018 2019
Venture capital deals, number of deals p/ billion PPP$ GDP
Ethiopia China India Bangladesh
0
0.2
0.4
0.6
0.8
1
2013 2014 2015 2016 2017 2018 2019
Venture capital deals, number of deals p/ billion PPP$ GDP
Ethiopia Israel Estonia Korea

Top 10 countries with the highest number of start-up incubators in Africa and youth population (aged 18-29) in
11 11 11
98
7
54 4
3
Kenya SouthAfrica
Nigeria Ghana Egypt Uganda Senegal Tanzania Coted'ivoire
Ethiopia
12 11 51 7 23 12 4 14 6 28
Youth Population in Millions
Source: TBI Startup Ecosystem report, 2019, Global Entrepreneurship Development Institute (2018) Global Entrepreneurship Index
Country Overall Index Sub-Index: Risk Capital
Korea 54.2 58.1
Singapore 52.7 79.6
India 28.4 15.2
Rwanda 21.5 6.8
Nigeria 19.7 15.3
Kenya 18.4 10.9
Ethiopia 18.3 5.8Notes: The underlying sample data for Ethiopia is from 2012. The results should therefore be interpreted with caution; Risk capital is measured by the informal investment in start-ups and the depth of the capital market
2018 Global Entrepreneurship Index compared to peers
• Ethiopia scores low – rank 110/137 – in the 2018 Global Entrepreneurship Index, which measures the health of the entrepreneurship ecosystems in 137 countries and particularly low on the availability of risk capital
• Cultural factors may serve as barriers, as “Ethiopians are conditioned not to be aggressive, assertive, demanding, go out of comfort zone, failure and rejections are considered taboos” (personal interview)
• Accordingly, Ethiopia scores lower than peers in business dynamism indicators such as attitudes towards entrepreneurial failure and willingness to delegate authority
4140
4643
20
25
30
35
40
45
50
55
60
65
70
Attitudes towardsentrepreneurial failure
Willingness to delegateauthority
Growth of innovativecompanies
Companies embracingdisruptive ideas
Ethiopia India Kenya Nigeria Rwanda Singapore
WEF Competitiveness Index: Business dynamism indicators (1-7)
The wider start-up ecosystem however is relatively under-developed compared to regional peers –cultural attitudes also play a role

Digital Transformation Framework: People
Hard Infrastructure
• Accessible basic infrastructure (e.g. power)
• Accessible core connectivity infrastructure (from fiberoptic cables to mobile towers to devices to data)
Enabling Systems:
• Systems and platforms which enable remote verification and creation of apps and services while ensuring interoperability. E.g. ID verification, gateways, asset registries, payments
Applications
• Inclusive digital products and services (e.g. E-Gov, E-Commerce) used by citizens, enterprises, and governments
Ecosystem
Finance: Access to suitable capital for start-ups & enterprises utilising digital; public finance to fund enabling ecosystems and infrastructure
People: Human Capital incl. skills and social expectations
Policy & Regulation: A conducive environment that attracts investment, enables the private sector, and creates jobs
Soft Infrastructure

72
• In line with related indicators, the under-five child mortality rate is dropping rapidly, from above 11% in 2005 to below 6% today (top left).
• At the same time, births per woman in Ethiopia are dropping rapidly: from 7 in 1995 to 4 today (top right).
• Thus, the population still grows at a steady rate of 2.5ppa, but for different reasons than in the past.
• Ethiopia’s age dependency ratio(how many 15-64-year-olds versus those older or younger), is rapidly falling: from 97% in 2005 to 77% today.
With improved child mortality rates, despite the fall in births per women, Ethiopia’s population is growing at a steady rate with a growing balloon towards young adults
Source: World Development Indicators 2019. Top left: Tradingeconomics.com, at: https://tradingeconomics.com/ethiopia/mortality-rate-under-5-per-1-000-wb-data.html, accessed 21 Aug 2019 based on World Bank World Development Indicators Development Definition: Under-five mortality rate is the probability per 1,000 that a new-born baby will die before reaching age five, if subject to current age-specific mortality rates. Top right: Google Public Data, at: https://www.google.com/publicdata/explore?ds=d5bncppjof8f9_&met_y=sp_dyn_tfrt_in&idim=country:ETH:NGA:TZA&hl=en&dl=en, accessed 21 Aug 2019, based on World Bank World Development Indicators. Bottom left: Google Public Data, at: https://www.google.com/publicdata/explore?ds=d5bncppjof8f9_&met_y=sp_pop_grow&idim=country:ETH:NGA:TZA&hl=en&dl=en accessed 21 Aug 2019, based on World Bank World Development Indicators; Bottom right: World Bank World Development Indicators, https://data.worldbank.org/indicator/SP.POP.DPND?locations=ET accessed 21 Aug 2019.
Mortality rate, under-5 (per 1,000) was at 58 in 2016 – drastically reduced from 112 in 2006
Fertility rate (av. number of births per woman) in Ethiopia – fell from 7.0 in 1995 to 4.2 in 2016
Population growth rate in Ethiopia peaked at 3.6ppa in 1992 and slowed to 2.44 by 2016
The age-dependency ratio in Ethiopia peaked at 99.1% in 1997 and fell fast to 77.1% 2018

73
• Ethiopia’s demographic “pyramid of children” is slowly turning into a demographic “bottle of workers” (top figure).
• By comparison, South Korea’s demographic transformation within 70 years went from a “pyramid” of children to a “mushroom” of elderly (middle figure). Developed countries are following Korea’s demographic trend. And, with a time lag, so are developing countries around the world.
• Let us compare all world regions by working-age men and women as proportions of their overall populations (bottom figure). This trend is not unique to Ethiopia (and, historically, it is not unique to Africa). But it is unique to Africa in the contemporary world.
• Coupled with ever-greater internet connectivity (and with the fact that OECD-world incomes are about 50 times higher than African incomes), these demographic trends suggest great opportunities for African trade in labour. This may take shape in a future version of IT-enabled services (e.g. VR-enabled online labour), or in some other, to date unforeseeable activity.
This is leading towards a possible demographic dividend for trade in labour, as the pyramid of children are becoming adults and workers
The working-age population will decline slightly in Asia and Latin America and the Caribbean, decrease more sharply in EBRD countries, and increase in Africa.
Ethiopia's population by age cohort and sex, showing a gradually aging society between 1990 through 2030
Comparison: The Demographic trend in South Korea
Evolution of the Working-Age Population as a Percentage of Total Population:

74
Sources:
Top graph: Admassi & Mcquire (2015), at https://www.newsecuritybeat.org/2015/12/ethiopia-progress-demographic-dividend/, based on UN Populatino Division World Population Prospects, 2015 Revision.
Middle graph: Rhee et al. (2015 p. 1321) Considering long-term care insurance for middle-income countries: comparing South Korea with Japan and Germany,Health Policy 119(10), pp. 1319-1329 at: https://www.sciencedirect.com/science/article/pii/S016885101500161X accessed 21 Aug 2019, based on The World Bank. Population estimates and projections. Health, Nutrition and Population Statistics 2013.
Bottom graph: Kapoor et al. (2018, p. 16) at: https://www.adb.org/sites/default/files/publication/481901/future-work-regional-perspectives.pdf, accessed 21 Aug 2019, based on ILO (2017).
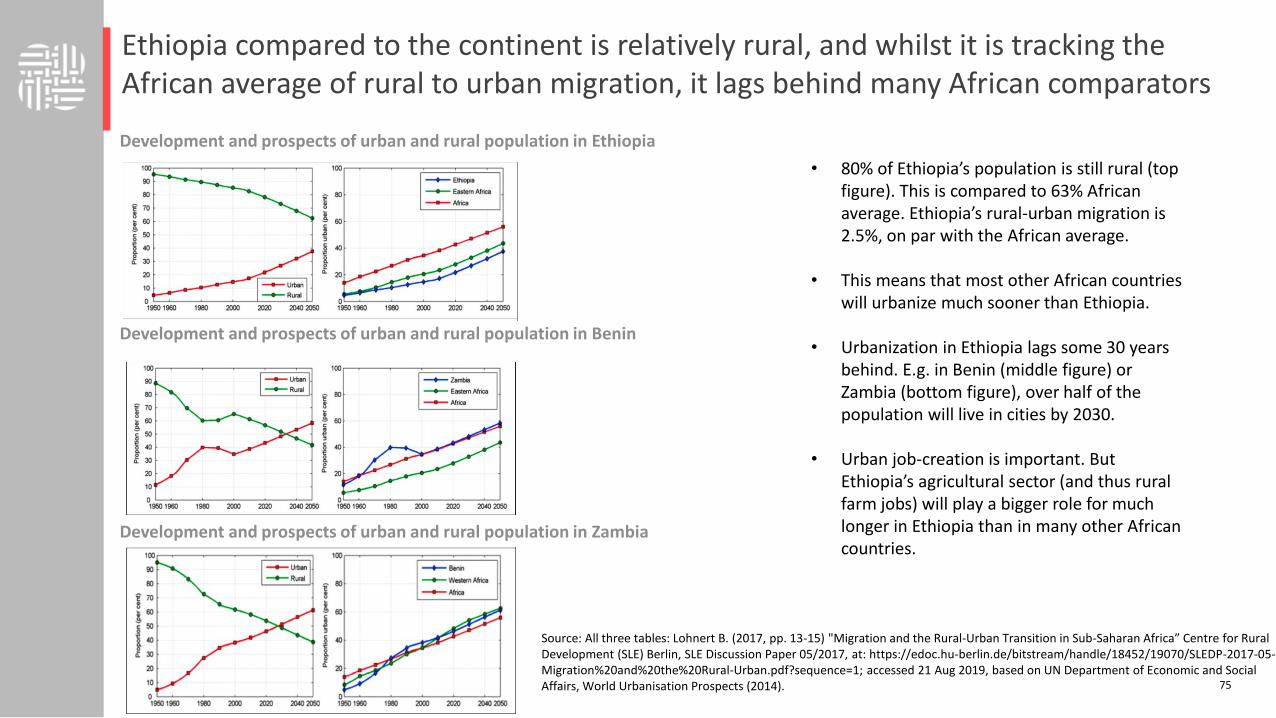
75
• 80% of Ethiopia’s population is still rural (top figure). This is compared to 63% African average. Ethiopia’s rural-urban migration is 2.5%, on par with the African average.
• This means that most other African countries will urbanize much sooner than Ethiopia.
• Urbanization in Ethiopia lags some 30 years behind. E.g. in Benin (middle figure) or Zambia (bottom figure), over half of the population will live in cities by 2030.
• Urban job-creation is important. But Ethiopia’s agricultural sector (and thus rural farm jobs) will play a bigger role for much longer in Ethiopia than in many other African countries.
Ethiopia compared to the continent is relatively rural, and whilst it is tracking the African average of rural to urban migration, it lags behind many African comparators
Source: All three tables: Lohnert B. (2017, pp. 13-15) "Migration and the Rural-Urban Transition in Sub-Saharan Africa” Centre for Rural Development (SLE) Berlin, SLE Discussion Paper 05/2017, at: https://edoc.hu-berlin.de/bitstream/handle/18452/19070/SLEDP-2017-05-Migration%20and%20the%20Rural-Urban.pdf?sequence=1; accessed 21 Aug 2019, based on UN Department of Economic and Social Affairs, World Urbanisation Prospects (2014).
Development and prospects of urban and rural population in Ethiopia
Development and prospects of urban and rural population in Benin
Development and prospects of urban and rural population in Zambia

76
➢ Addis Ababa dwarfs Nazret and Mekele by factors of 10. Comparison: Kenya’s Nairobi is only 3 times larger than Mombasa; as is Nigeria’s Lagos vis-à-vis Kano and Ibadan.
However, although Ethiopia’s rate of urbanisation will lag other SSA countries, its sheer population size – 5 times larger than the SSA average – will mean that its growing cities will also have comparatively large labour pools
Population of Ethiopia’s largest cities, (based on 2012 data, but the proportional differences remain)
Source: Lohnert B. (2017, p. 15) "Migration and the Rural-Urban Transition in Sub-Saharan Africa” Centre for Rural Development (SLE) Berlin, SLE Discussion Paper 05/2017, at: https://edoc.hu-berlin.de/bitstream/handle/18452/19070/SLEDP-2017-05-Migration%20and%20the%20Rural-Urban.pdf?sequence=1; accessed 21 Aug 2019, based on City Population (2017).

77
Ethiopia, Chad, DRC, SSA av.
Ethiopia, China, India, Bangladesh Ethiopia, Israel, Estonia, Korea
➢ Trajectory: Literacy is the best available proxy for digital readiness skills. This is Ethiopia’s great battle for the next decade. Lagging significantly behind the Africa average, the region’s frontrunners (top left and right), as well as Bangladesh (bottom left), Ethiopia’s task is to bridge the gap to universal access (bottom right).
➢ Implications for Ethiopia’s Digital Readiness: As the world moves ever-more into the digital realm, Ethiopians need to be able to read. Illiterate factory workers will not be the drivers of growth in the 21st
century.
➢ Possible remedies: spread the internet faster, coupled with local language applications.
Ethiopia, Rwanda, Nigeria, Kenya
Literacy rates will be one of Ethiopia’s greatest constraints. It trails behind its regional peers, Nigeria, Kenya and Ethiopia, and its past trajectory shows little sign of improvement
Source: GSMA 2019 based on UNDP and UNESCO

78
Ethiopia, Chad, DRC, SSA av.
Ethiopia, China, India, Bangladesh Ethiopia, Israel, Estonia, Korea
➢ Trajectory: In line with low literacy rates, Ethiopia lag behind the Africa average, the region’s frontrunners (top left and right), as well as Bangladesh (bottom left).
➢ Implications for Ethiopia’s Digital Readiness: As the 20th century education system has run its course, “years of schooling” may no longer be the best metric for gauging what children learn.
➢ Possible remedies: Hole-in-the-Wall, or Montessori type alternative schooling innovations may be the way forward for Ethiopia’s many children to enter the Fourth Industrial Revolution.
Ethiopia, Rwanda, Nigeria, Kenya
This could be driven by lower than the regional average in school life expectancy
Source: GSMA 2019 based on UNDP and UNESCO

79
Ethiopia, Chad, DRC
Ethiopia, India, Bangladesh Ethiopia, Israel, Estonia, Korea
Source: GII, based on Government expenditure on education (% of GDP) | 2015Total general (local, regional and central) government expenditure on education (current, capital, and transfers), expressed as a percentage of GDP. It includes expenditure funded by transfers from international sources to government. Source: UNESCO Institute for Statistics, UIS online database (2008–17). (http://data.uis.unesco.org/).
Ethiopia, Kenya, Rwanda
0
1
2
3
4
5
6
7
8
2013 2014 2015 2016 2017 2018 2019
Expenditure on education, 2013-19 (%GDP)
Ethiopia Kenya Rwanda
0
1
2
3
4
5
2013 2014 2015 2016 2017 2018 2019
Expenditure on education, 2013-19 (%GDP)
Ethiopia Chad DRC
0
1
2
3
4
5
2013 2014 2015 2016 2017 2018 2019
Expenditure on education, 2013-19 (%GDP)
Ethiopia India Bangladesh
0
2
4
6
8
2013 2014 2015 2016 2017 2018 2019
Expenditure on education, 2013-19 (%GDP)
Ethiopia Israel Estonia Korea
But Ethiopia is making significant investments in education, near par with Kenya and in the last year higher than Rwanda. And far higher than India and Bangladesh

80
Ethiopia, Chad, DRC
Ethiopia, China, India, Bangladesh Ethiopia, Israel, Estonia, Korea
Source: GII, based on Pupil-teacher ratio, secondary | 2017The number of pupils enrolled in secondary school divided by the number of secondary school teachers (regardless of their teaching assignment). Where the data are missing for some countries, the ratios for upper-secondary are reported; if these are also missing, the ratios for lower-secondary are reported instead. Argentina uses data for 2008. Source: UNESCO Institute for Statistics, UIS online database (2008–18). (http://data.uis.unesco.org).
Ethiopia, Kenya, Rwanda, Nigeria
0
10
20
30
40
50
2013 2014 2015 2016 2017 2018 2019
Pupil teacher ratio, 2013 - 2019
Ethiopia Kenya Rwanda Nigeria
0
10
20
30
40
50
2013 2014 2015 2016 2017 2018 2019
Pupil teacher ratio, 2013 - 2019
Ethiopia Chad DRC
0
10
20
30
40
50
2013 2014 2015 2016 2017 2018 2019
Pupil teacher ratio, 2013 - 2019
Ethiopia China India Bangladesh
0
10
20
30
40
50
2013 2014 2015 2016 2017 2018 2019
Pupil teacher ratio, 2013 - 2019
Ethiopia Israel Estonia Korea
And moreover its pupil teacher ratio is higher than its regional peers as well as higher than that in China, India and Bangladesh
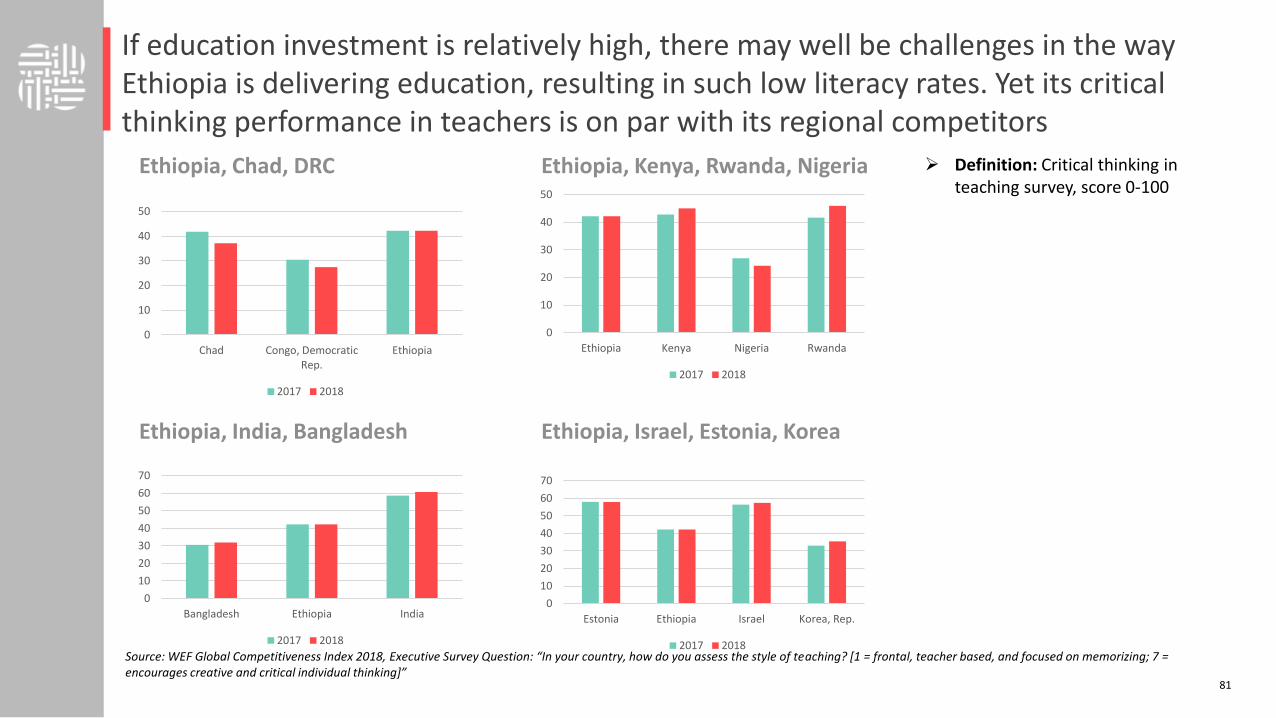
81
Ethiopia, Chad, DRC
Ethiopia, India, Bangladesh Ethiopia, Israel, Estonia, Korea
➢ Definition: Critical thinking in teaching survey, score 0-100
Ethiopia, Kenya, Rwanda, Nigeria
0
10
20
30
40
50
Chad Congo, DemocraticRep.
Ethiopia
2017 2018
0
10
20
30
40
50
Ethiopia Kenya Nigeria Rwanda
2017 2018
0
10
20
30
40
50
60
70
Bangladesh Ethiopia India
2017 2018
0
10
20
30
40
50
60
70
Estonia Ethiopia Israel Korea, Rep.
2017 2018Source: WEF Global Competitiveness Index 2018, Executive Survey Question: “In your country, how do you assess the style of teaching? [1 = frontal, teacher based, and focused on memorizing; 7 = encourages creative and critical individual thinking]”
If education investment is relatively high, there may well be challenges in the way Ethiopia is delivering education, resulting in such low literacy rates. Yet its critical thinking performance in teachers is on par with its regional competitors

82
Ethiopia, Chad, DRC, SSA av.
Ethiopia, China, India, Bangladesh Ethiopia, Israel, Estonia, Korea
➢ Trajectory: the number of university students in Ethiopia is nearly at the African average (top left) and nearly on par with the region’s tech countries (top right). The problem is that enrolment levels in the region as a whole significantly lag behind not merely the global frontrunners (bottom right), but also behind Bangladesh and India (bottom left).
➢ Implications for Ethiopia’s Digital Readiness: As the the world moves online, alternative ways to educate Ethiopia’s youngsters emerge. But tertiary education indicates a knowledge economy. Africa and Ethiopia will need to catch up.
Ethiopia, Rwanda, Nigeria, Kenya
Tertiary enrolment is a big problem across Africa, particularly as compared with developing country competitors such as Bangladesh and India
Source: GSMA 2019 based on UNDP and UNESCO

83
Ethiopia, Chad, DRC
Ethiopia, India, Bangladesh Ethiopia, Israel, Estonia, Korea
Ethiopia, Kenya, Rwanda, Nigeria
0
10
20
30
40
50
60
Chad Congo,Democratic Rep.
Ethiopia
2017 2018
0
10
20
30
40
50
60
Ethiopia Kenya Nigeria Rwanda
2017 2018
0
10
20
30
40
50
60
70
Bangladesh Ethiopia India
2017 2018
0
10
20
30
40
50
60
70
80
Estonia Ethiopia Israel Korea, Rep.
2017 2018
Source: WEF Global Competitiveness Index 2018, Executive Survey Question, Average score of the two following : In your country, to what extent do graduating students from secondary education possess the skills needed by businesses? and In your country, to what extent do graduating students from university possess the skills needed by businesses? In each case, the answer ranges from 1 [not at all] to 7 [to a great extent]In your country, how do you assess the quality of vocational training? [1 = extremely poor—among the worst in the world; 7 = excellent—among the best in the world]”
The skillsets of Ethiopian graduates are not ranked as highly as Kenya or Rwanda, though are on a par with Bangladesh. India, where graduates make up the BPO sector, outperforms all these countries

84
Ethiopia, China, India, Bangladesh Ethiopia, Israel, Estonia, Korea
Source: GII, based on Average score of the top 3 universities at the QS worlduniversity ranking* | 2018 Average score of the top three universities per country. If fewer than three universities are listed in the QS ranking of the global top 1000 universities, the sum of the scores of the listed universities is divided by three, thus implying a score of zero for the non-listed universities. Source: QS Quacquarelli Symonds Ltd, QS World University Ranking 2017/2018, Top Universities. (https://www.topuniversities.com/university-rankings/ world-university-rankings/2018).
Ethiopia, Kenya, Rwanda, Nigeria
0
1
2
3
4
5
2016 2017 2018 2019
Average score of the top 3 universities at the QS world university ranking, 2016-19
Ethiopia Kenya Rwanda Nigeria
0
20
40
60
80
100
2016 2017 2018 2019
Average score of the top 3 universities at the QS world university ranking, 2016-19
Ethiopia China India Bangladesh
0
20
40
60
80
100
2016 2017 2018 2019
Average score of the top 3 universities at the QS world university ranking, 2016-19
Ethiopia Israel Estonia Korea
Moreover Ethiopia’s top 3 universities do not fare well as compared to scores achieved by those universities in Kenya. This is again much higher for Bangladesh and India
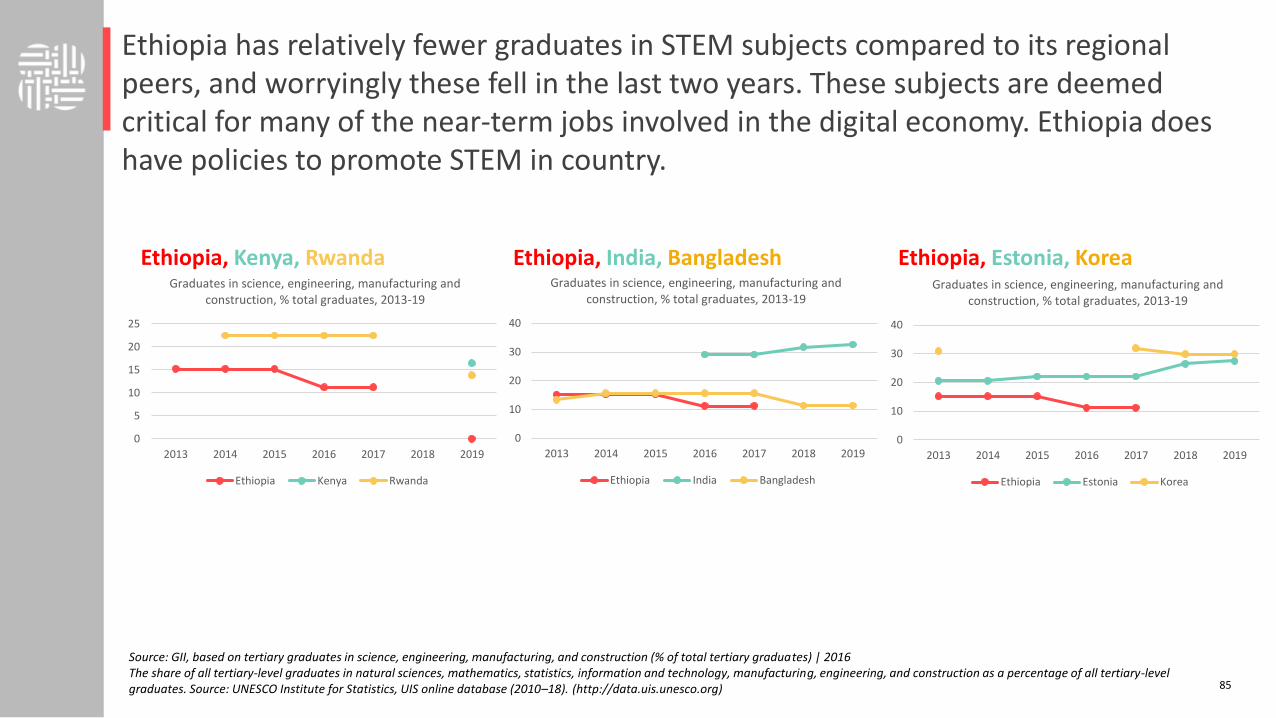
85
Ethiopia, India, Bangladesh Ethiopia, Estonia, Korea
Source: GII, based on tertiary graduates in science, engineering, manufacturing, and construction (% of total tertiary graduates) | 2016The share of all tertiary-level graduates in natural sciences, mathematics, statistics, information and technology, manufacturing, engineering, and construction as a percentage of all tertiary-level graduates. Source: UNESCO Institute for Statistics, UIS online database (2010–18). (http://data.uis.unesco.org)
Ethiopia, Kenya, Rwanda
0
5
10
15
20
25
2013 2014 2015 2016 2017 2018 2019
Graduates in science, engineering, manufacturing and construction, % total graduates, 2013-19
Ethiopia Kenya Rwanda
0
10
20
30
40
2013 2014 2015 2016 2017 2018 2019
Graduates in science, engineering, manufacturing and construction, % total graduates, 2013-19
Ethiopia India Bangladesh
0
10
20
30
40
2013 2014 2015 2016 2017 2018 2019
Graduates in science, engineering, manufacturing and construction, % total graduates, 2013-19
Ethiopia Estonia Korea
Ethiopia has relatively fewer graduates in STEM subjects compared to its regional peers, and worryingly these fell in the last two years. These subjects are deemed critical for many of the near-term jobs involved in the digital economy. Ethiopia does have policies to promote STEM in country.

86
Ethiopia, Chad, DRC
Ethiopia, India, Bangladesh Ethiopia, Israel, Estonia, Korea
Ethiopia, Kenya, Rwanda, Nigeria
0
10
20
30
40
50
60
Chad Congo,Democratic Rep.
Ethiopia
2018 2017
0
10
20
30
40
50
60
70
Ethiopia Kenya Nigeria Rwanda
2018 2017
0
10
20
30
40
50
60
70
Bangladesh Ethiopia India
2018 2017
0
20
40
60
80
Estonia Ethiopia Israel Korea, Rep.
2018 2017
Source: WEF Global Competitiveness Index 2018, Executive Survey Question: “In your country, to what extent can companies find people with the skills required to fill their vacancies? [1 = not at all; 7 = to a great extent]”
Ethiopia slightly underperforms its regional peers in companies’ perception of the ease of finding skilled employees. But it is on a par with Bangladesh, which at least relating to its existing light-manufacturing efforts, bodes well

87
Ethiopia, Chad, DRC
Ethiopia, India, Bangladesh Ethiopia, Israel, Estonia, Korea
Source: WEF Global Competitiveness Index 2018, Executive Survey Question “In your country, how do you assess the quality of vocational training? [1 = extremely poor—among the worst in the world; 7 = excellent—among the best in the world]”
Ethiopia, Kenya, Rwanda, Nigeria
05
101520253035404550
Chad Congo, DemocraticRep.
Ethiopia
2017 2018
0
10
20
30
40
50
60
Ethiopia Kenya Nigeria Rwanda
2017 2018
0
10
20
30
40
50
60
70
Bangladesh Ethiopia India
2017 2018
0
10
20
30
40
50
60
70
Estonia Ethiopia Israel Korea, Rep.
2017 2018
Beyond tertiary education, the quality of vocational training is also considered to be better in Ethiopia than some comparator companies, mainly Nigeria and Bangladesh. But Ethiopia still underperforms as compared to Kenya and Rwanda

88
Ethiopia, Chad, DRC, SSA av.
Ethiopia, China, India, Bangladesh Ethiopia, Israel, Estonia, Korea
• Trajectory: Ethiopia lags behind on gender parity in schooling, not only behind the Africa average, but behind the DRC, which has made significant progress over the past 5 years (top let).
• Implications for Ethiopia’s Digital Readiness: To become a digital ready knowledge economy, half the population will need be be brought along.
Source: GSMA 2019 based on UNDP and UNESCO
Ethiopia, Rwanda, Nigeria, Kenya
Gender inclusivity will be critical to meeting Ethiopia’s goals. At present schooling gender parity is much lower in Ethiopia than desired and below the SSA average

89
Ethiopia, Chad, DRC, SSA av.
Ethiopia, China, India, Bangladesh Ethiopia, Israel, Estonia, Korea
• Trajectory: Ethiopia’s stark gender disparity is reflected in its income differences that are starker than those of the African average (top let), or of the region’s frontrunner ICT countries (top right). But, for cultural reasons, Bangladesh, India and Korea (bottom left and right) have greater gender income disparities.
• Implications for Ethiopia’s Digital Readiness: As the education system as a whole needs to catch up, an opportunity exists to use gender equity to leapfrog toward the knowledge economy over other more advanced economies by simply doubling Ethiopia's brain power .
Source: GSMA 2019 based on UNDP
Ethiopia, Rwanda, Nigeria, Kenya
This inclusivity in education then plays out in poor income parity, lower than the SSA average – though surprisingly higher than in Bangladesh and India which is likely a poorer reflection of these comparator geographies
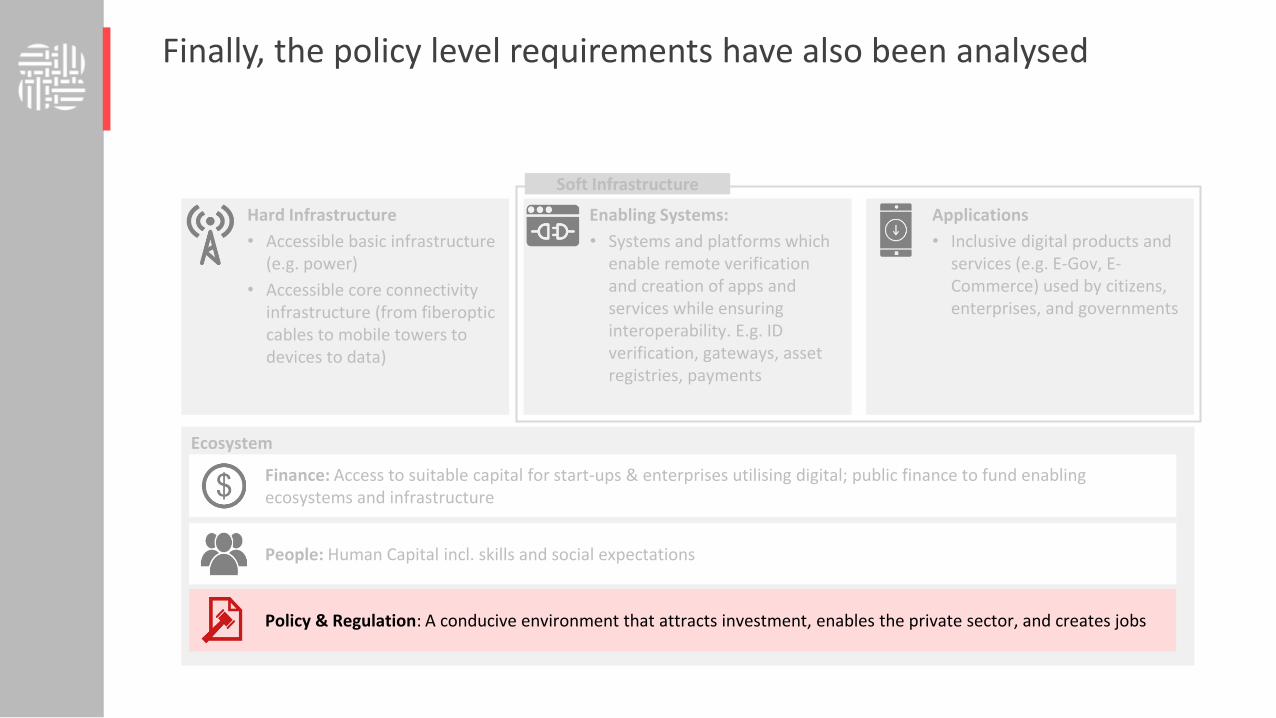
Finally, the policy level requirements have also been analysed
Hard Infrastructure
• Accessible basic infrastructure (e.g. power)
• Accessible core connectivity infrastructure (from fiberoptic cables to mobile towers to devices to data)
Enabling Systems:
• Systems and platforms which enable remote verification and creation of apps and services while ensuring interoperability. E.g. ID verification, gateways, asset registries, payments
Applications
• Inclusive digital products and services (e.g. E-Gov, E-Commerce) used by citizens, enterprises, and governments
Ecosystem
Finance: Access to suitable capital for start-ups & enterprises utilising digital; public finance to fund enabling ecosystems and infrastructure
People: Human Capital incl. skills and social expectations
Policy & Regulation: A conducive environment that attracts investment, enables the private sector, and creates jobs
Soft Infrastructure

In line with those initiatives, the perception of the future-orientation of government is largely on par with comparator countries world-wide
91
Ethiopia, Chad, DRC
Ethiopia, India, Bangladesh Ethiopia, Israel, Estonia, Korea
Source: WEF Global Competitiveness Index 2018; Average of the responses to the following four Executive Opinion Survey questions: 1) “In your country, how fast is the legal framework of your country in adapting to digital business models (e.g. e-commerce, sharing economy, fintech, etc.)?” [1 = not fast at all; 7 = very fast]; 2) “In your country, to what extent does the government ensure a stable policy environment for doing business?”; 3) “In your country, to what extent does the government respond effectively to change (e.g. technological changes, societal and demographic trends, security and economic challenges)?”; and 4) “In your country, to what extent does the government have a long-term vision in place?”. For the last three questions, the answer ranges from 1 (not at all) to 7 (to a great extent). | 2017–2018 weighted average or most recent period available
Ethiopia, Kenya, Rwanda, Nigeria
0
10
20
30
40
50
Chad Congo, DemocraticRep.
Ethiopia
Future orientation of government
2017 2018
0
10
20
30
40
50
60
70
80
Ethiopia Kenya Nigeria Rwanda
2017 2018
0
20
40
60
80
Bangladesh Ethiopia India
Future orientation of government
2017 2018
0
10
20
30
40
50
60
Estonia Ethiopia Israel Korea, Rep.
Future orientation of government
2017 2018

Perception of corruption improved in the last year and it is lower than in Kenya and Nigeria; however Ethiopia lags behind advanced economies
92
Ethiopia, Chad, DRC
Ethiopia, India, Bangladesh Ethiopia, Israel, Estonia, Korea
Ethiopia, Kenya, Rwanda, Nigeria
0
5
10
15
20
25
30
35
40
Chad Congo, DemocraticRep.
Ethiopia
2017 2018
0
10
20
30
40
50
60
Ethiopia Kenya Nigeria Rwanda
2017 2018
0
5
10
15
20
25
30
35
40
45
Bangladesh Ethiopia India
2017 2018
0
10
20
30
40
50
60
70
80
Estonia Ethiopia Israel Korea, Rep.
2017 2018
Source: WEF Global Competitiveness Index 2018, based on Transparency International’s composite Corruption Perception Index

Ethiopia is in the mid-range among peers when it comes to laws on the protection of intellectual property
93
Ethiopia, Chad, DRC
Ethiopia, India, Bangladesh Ethiopia, Israel, Estonia, Korea
Ethiopia, Kenya, Rwanda, Nigeria
0
0.5
1
1.5
2
2.5
3
3.5
4
20182017201620152014201320122011201020092008
Ethiopia Chad Congo, Democratic Rep.
0
1
2
3
4
5
6
20182017201620152014201320122011201020092008
Ethiopia Kenya Rwanda Nigeria
0
1
2
3
4
5
20182017201620152014201320122011201020092008
Ethiopia India Bangladesh
0
1
2
3
4
5
6
7
20182017201620152014201320122011201020092008
Ethiopia Israel Estonia Korea, Rep.
Source: WEF Global Competitiveness Index 2007-2018; Executive Survey Question: “In your country, to what extent is intellectual property protected? [1 = not at all; 7 = to a great extent]”

While public Gross Expenditure on R&D (GERD) is fairly high, private spending could be increased by incentivizing and strengthening the innovation ecosystem
94
NIGERIA CASE STUDY Special incentives for pioneer industriesPioneer status entitles qualifying entities and companies to an income tax “holiday” for up to five years (three years initially and renewable for an additional two years). In addition to the income tax holiday, pioneer companies may enjoy other benefits including an exemption from withholding tax on dividends paid out of “pioneer profits.” 27 industries eligible for pioneer status including software development and publishing; production and post-production of digital contents; music production, publishing and distribution; telecommunications; BPO; electricity supply and financial services.
0
1
2
3
4
5
2015 2016 2017 2018 2019
GERD financed by business enterprise (% of total GERD), 2015-19
Ethiopia Kenya Nigeria
0
20
40
60
80
100
2015 2016 2017 2018 2019
GERD financed by business enterprise (% of total GERD), 2015-19
Ethiopia Israel Estonia Korea China
0
10
20
30
40
50
2013 2014 2015 2016 2017 2018 2019
GERD financed by abroad (% of total GERD), 2015 - 19
Ethiopia Kenya Nigeria
0
10
20
30
40
50
60
2013 2014 2015 2016 2017 2018 2019
GERD financed by abroad (% of total GERD), 2015 - 19
Ethiopia Israel Estonia Korea China
Notes: Gross expenditure on R&D financed by business enterprise as % of total gross expenditure on R&D (business enterprise) and as % gross expenditure on R&D financed by abroad—that is, with foreign financing as a % of total gross expenditure on R&D in a country. Source: From Source: UNESCO Institute for Statistics, UIS online database; Eurostat, Eurostat database, 2019; OECD, Main Science and Technology Indicators MSTI database, 2019 (2008–17).

Overall, Ethiopia’s regulatory framework is less business-friendly than elsewhere, especially with respect to new, potentially innovative firms.
95
Ethiopia, Chad, DRC
Ethiopia, Israel, Estonia, Korea
Source: GII, based on Ease of starting a business (score) in 2018 World Bank, Doing Business 2019 (http://www.doingbusiness.org/en/reports/ global-reports/doing-business-2019).These scores are the simple average of the scores for each of the component indicators. The World Banks Doing Business records all procedures officially required, or commonly done in practice, for an entrepreneur to start up and formally operate an industrial or commercial business, as well as the time and cost to complete these procedures and the paid-in minimum capital requirement. Data arecollected from limited liability companies based in the largest business cities. For 11 economies, including Bangladesh, China and India, the data are also collected for the second-largest business city.
0
20
40
60
80
100
120
2013 2014 2015 2016 2017 2018 2019
Ease of starting a business (WB score), 2013 - 14
Ethiopia Kenya Rwanda Nigeria
Ethiopia, Kenya, Rwanda, Nigeria
0
20
40
60
80
100
2013 2014 2015 2016 2017 2018 2019
Ease of starting a business (WB score), 2013 - 14
Ethiopia Chad DRC
0
20
40
60
80
100
2013 2014 2015 2016 2017 2018 2019
Ease of starting a business (WB score), 2013 - 14
Ethiopia China India Bangladesh
Ethiopia, China, India, Bangladesh
0
20
40
60
80
100
120
2013 2014 2015 2016 2017 2018 2019
Ease of starting a business (WB score), 2013 - 14
Ethiopia Israel Estonia Korea
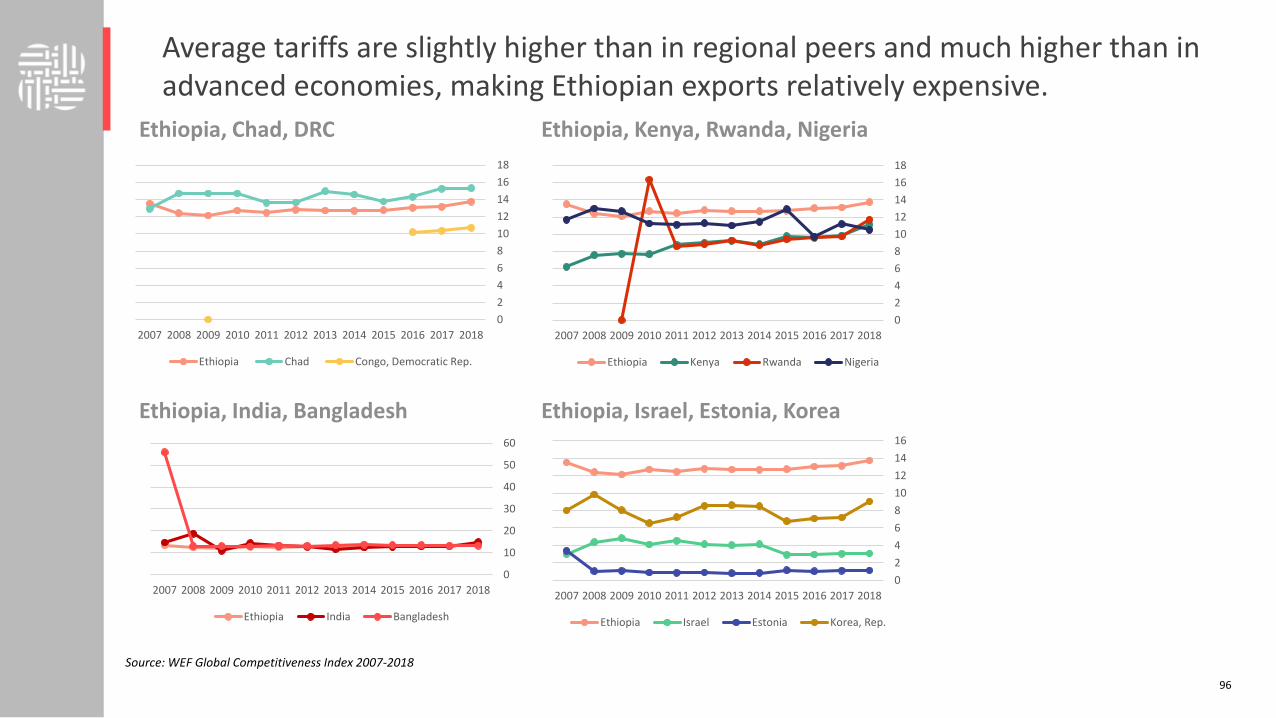
Average tariffs are slightly higher than in regional peers and much higher than in advanced economies, making Ethiopian exports relatively expensive.
96
Ethiopia, Chad, DRC
Ethiopia, India, Bangladesh Ethiopia, Israel, Estonia, Korea
Ethiopia, Kenya, Rwanda, Nigeria
0
2
4
6
8
10
12
14
16
18
201820172016201520142013201220112010200920082007
Ethiopia Chad Congo, Democratic Rep.
0
10
20
30
40
50
60
201820172016201520142013201220112010200920082007
Ethiopia India Bangladesh
0
2
4
6
8
10
12
14
16
18
201820172016201520142013201220112010200920082007
Ethiopia Kenya Rwanda Nigeria
0
2
4
6
8
10
12
14
16
201820172016201520142013201220112010200920082007
Ethiopia Israel Estonia Korea, Rep.
Source: WEF Global Competitiveness Index 2007-2018
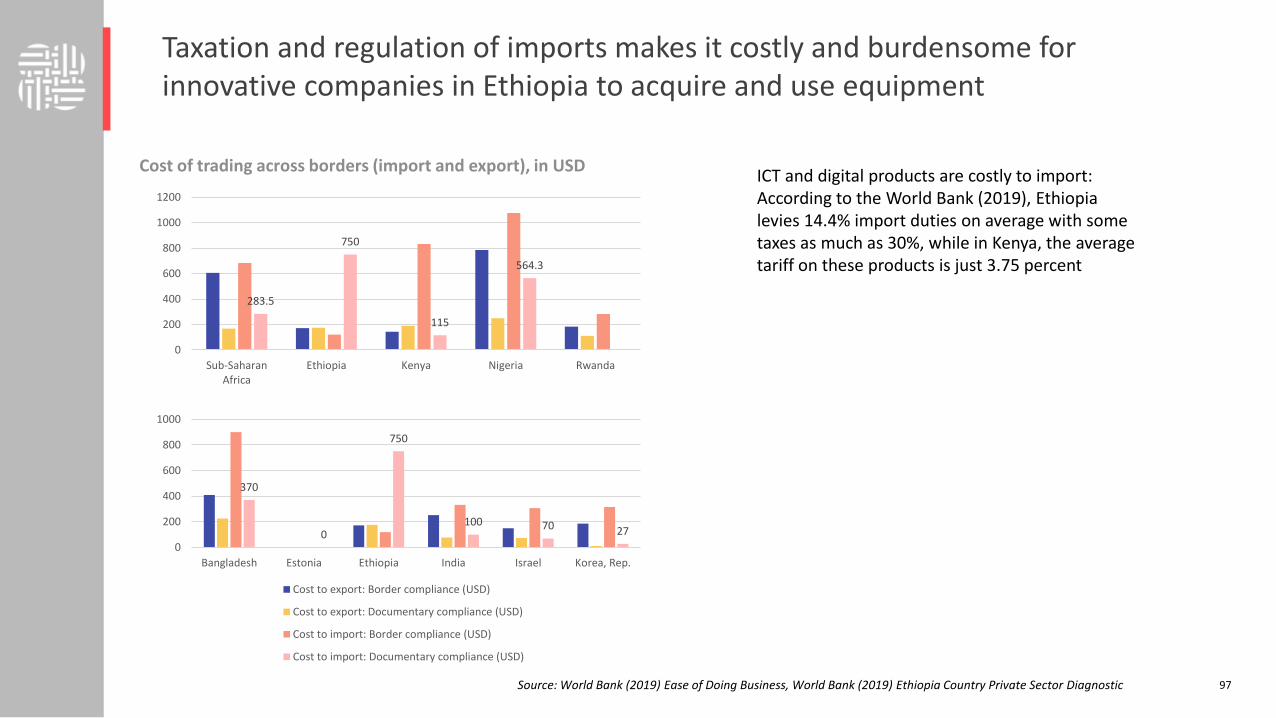
Taxation and regulation of imports makes it costly and burdensome for innovative companies in Ethiopia to acquire and use equipment
97
283.5
750
115
564.3
0
200
400
600
800
1000
1200
Sub-SaharanAfrica
Ethiopia Kenya Nigeria Rwanda
370
0
750
100 70 27
0
200
400
600
800
1000
Bangladesh Estonia Ethiopia India Israel Korea, Rep.
Cost to export: Border compliance (USD)
Cost to export: Documentary compliance (USD)
Cost to import: Border compliance (USD)
Cost to import: Documentary compliance (USD)
Cost of trading across borders (import and export), in USD
Source: World Bank (2019) Ease of Doing Business, World Bank (2019) Ethiopia Country Private Sector Diagnostic
ICT and digital products are costly to import: According to the World Bank (2019), Ethiopia levies 14.4% import duties on average with some taxes as much as 30%, while in Kenya, the average tariff on these products is just 3.75 percent
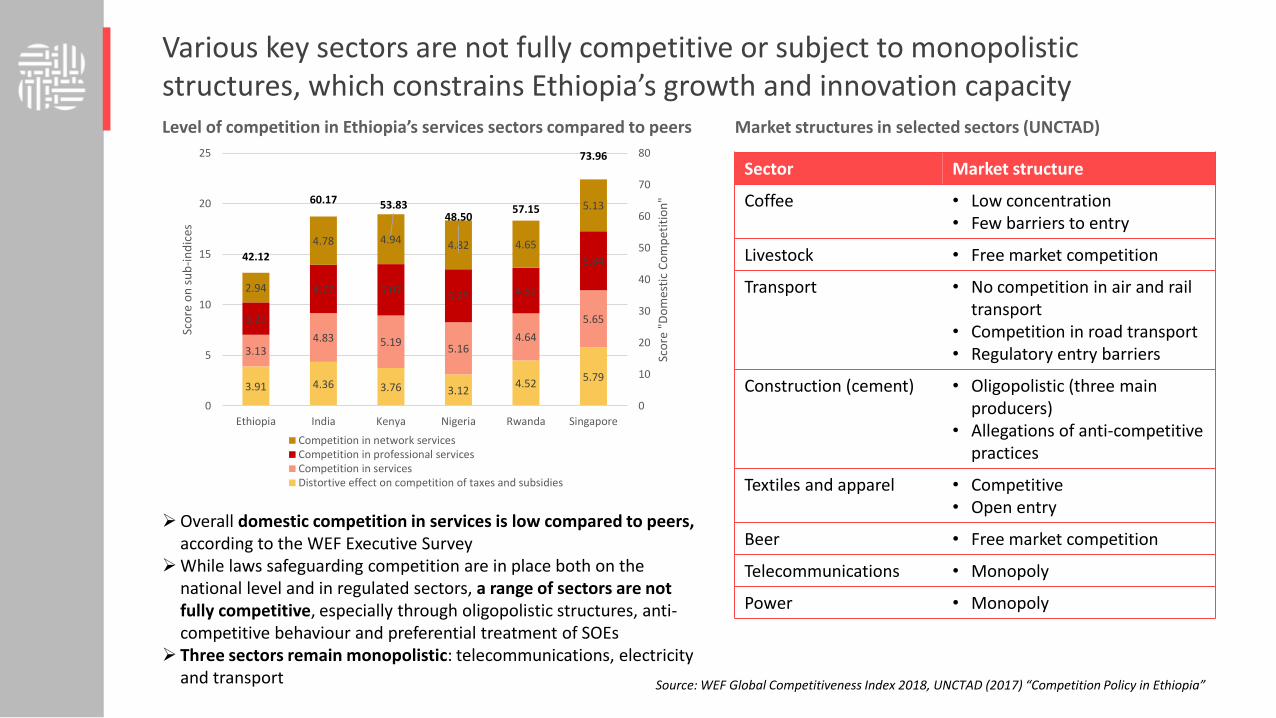
Various key sectors are not fully competitive or subject to monopolistic structures, which constrains Ethiopia’s growth and innovation capacity
Sector Market structure
Coffee • Low concentration• Few barriers to entry
Livestock • Free market competition
Transport • No competition in air and rail transport
• Competition in road transport• Regulatory entry barriers
Construction (cement) • Oligopolistic (three main producers)
• Allegations of anti-competitive practices
Textiles and apparel • Competitive• Open entry
Beer • Free market competition
Telecommunications • Monopoly
Power • Monopoly
3.91 4.36 3.76 3.124.52
5.79
3.134.83 5.19
5.164.64
5.653.20
4.77 5.07 5.25 4.51
5.84
2.94
4.78 4.94 4.82 4.65
5.13
42.12
60.17 53.8348.50
57.15
73.96
0
10
20
30
40
50
60
70
80
0
5
10
15
20
25
Ethiopia India Kenya Nigeria Rwanda Singapore
Sco
re "
Do
mes
tic
Co
mp
etit
ion
"
Sco
re o
n s
ub
-in
dic
es
Competition in network servicesCompetition in professional servicesCompetition in servicesDistortive effect on competition of taxes and subsidies
Level of competition in Ethiopia’s services sectors compared to peers
Source: WEF Global Competitiveness Index 2018, UNCTAD (2017) “Competition Policy in Ethiopia”
Market structures in selected sectors (UNCTAD)
➢Overall domestic competition in services is low compared to peers, according to the WEF Executive Survey
➢While laws safeguarding competition are in place both on the national level and in regulated sectors, a range of sectors are not fully competitive, especially through oligopolistic structures, anti-competitive behaviour and preferential treatment of SOEs
➢ Three sectors remain monopolistic: telecommunications, electricity and transport

As indicated below, local competition is seen as less intense than in both regional and international comparator countries
99
Ethiopia, Chad
Ethiopia, China, India, Bangladesh Ethiopia, Israel, Estonia, Korea
Source: GII
Ethiopia, Kenya, Rwanda, Nigeria
0
1
2
3
4
5
6
2013 2014 2015 2016 2017 2018 2019
Intensity of local competition (average survey response score, WB), 2013-2019
Ethiopia Kenya Rwanda Nigeria
0
1
2
3
4
5
2013 2014 2015 2016 2017 2018 2019
Intensity of local competition (average survey response score, WB), 2013-2019
Ethiopia Chad
0
1
2
3
4
5
6
2013 2014 2015 2016 2017 2018 2019
Intensity of local competition (average survey response score, WB), 2013-2019
Ethiopia China India Bangladesh
0
2
4
6
8
2013 2014 2015 2016 2017 2018 2019
Intensity of local competition (average survey response score, WB), 2013-2019
Ethiopia Israel Estonia Korea

While overall domestic competition is constrained, subsidies and taxes per se seem to be on par with international comparators in their effect on competition
100
Ethiopia, Chad, DRC
Ethiopia, India, Bangladesh Ethiopia, Israel, Estonia, Korea
Ethiopia, Kenya, Rwanda, Nigeria
0
10
20
30
40
50
60
Chad Congo, DemocraticRep.
Ethiopia
2017 2018
0
10
20
30
40
50
60
70
Ethiopia Kenya Nigeria Rwanda
2017 2018
0
10
20
30
40
50
60
Bangladesh Ethiopia India
2017 2018
0
10
20
30
40
50
60
Estonia Ethiopia Israel Korea, Rep.
2017 2018
Source: WEF Global Competitiveness Index 2018; Executive Survey Question: “In your country, to what extent do fiscal measures (subsidies, tax breaks, etc.) distort competition? [1 = distort competition to a great extent; 7 = do not distort competition at all]”

Relevant authorities for safeguarding competition in Ethiopia – sector regulators and the TCCPA – seem to be resource-constrained and, hence, have limited impact
101
Ethiopia has a Trade Competition and Consumers Protection Proclamation (813/2013), and a reinforcing agency: the Ethiopian Trade Competition and Consumer Protection Agency (TCCPA).
Potential challenges for the TCCPA
• Authority has lacked capacity to effectively enforce the Proclamation, which has contributed it not having published any supplementary regulations an guidelines which would facilitate the enforcement of Proclamation 813/2013 yet
• There is very little activity found in the public domain of the TCCPA, and as revealed from personal interviews with and internet research for this diagnostic
• The role, staffing and capacity of the TCCPA shall be further investigated in the dialogue phase, given the importance of a functioning body for ensuring effective competition on markets – particularly in the digital economy
Potential jurisdictional overlap (e.g. mergers)
EEA
ETA
NBE
Sector regulators, e.g.
Authority to regulate sectors
Ministry of Trade
TCCPA
Authority to investigate in competition-related matters in all
sectors
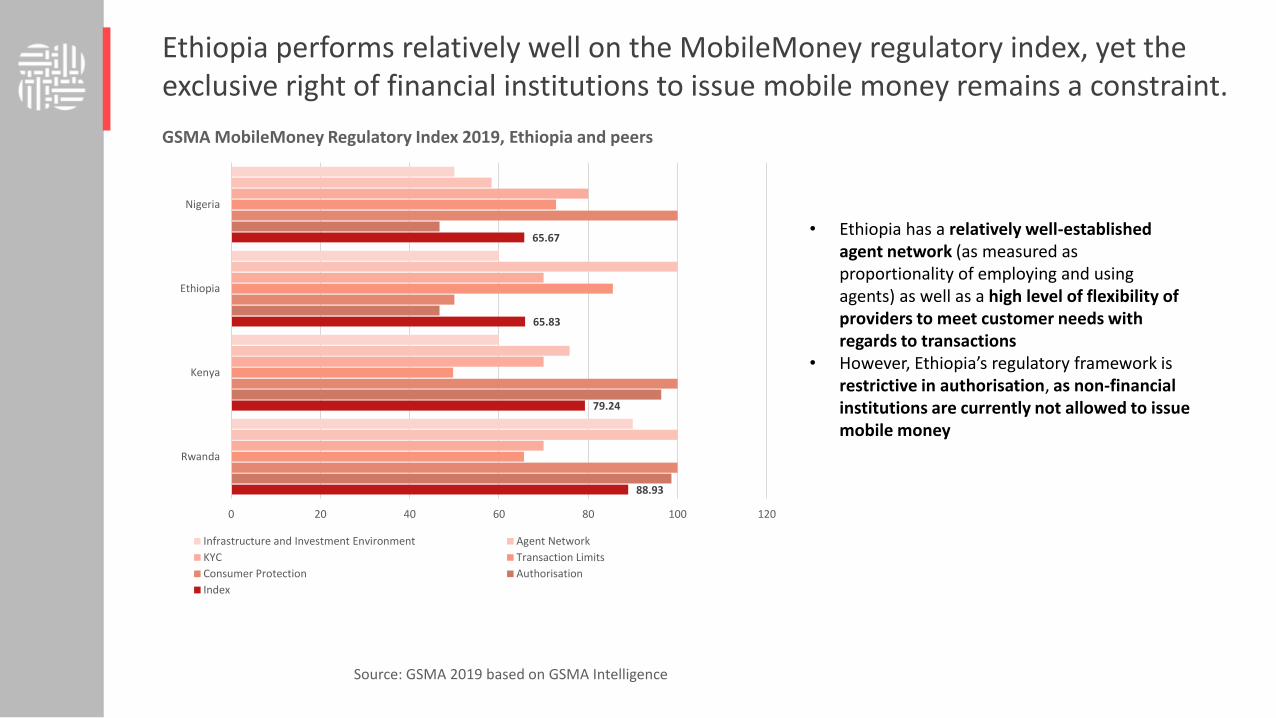
Ethiopia performs relatively well on the MobileMoney regulatory index, yet the exclusive right of financial institutions to issue mobile money remains a constraint.
88.93
79.24
65.83
65.67
0 20 40 60 80 100 120
Rwanda
Kenya
Ethiopia
Nigeria
Infrastructure and Investment Environment Agent Network
KYC Transaction Limits
Consumer Protection Authorisation
Index
GSMA MobileMoney Regulatory Index 2019, Ethiopia and peers
• Ethiopia has a relatively well-established agent network (as measured as proportionality of employing and using agents) as well as a high level of flexibility of providers to meet customer needs with regards to transactions
• However, Ethiopia’s regulatory framework is restrictive in authorisation, as non-financial institutions are currently not allowed to issue mobile money
Source: GSMA 2019 based on GSMA Intelligence

103
ProducersEEP
(100% of inst. capacity)
PPAs
EEP EEU
Consumersboth residential and industrial
EEP
IPP (currently no active in
the market)
▪ Regulation 810/2013 establishes EEP as the operator of the generation segment after the split of EEPCO
▪ Regulation 8210/2013 establishes EEP as the operator of the transmission segment
▪ Proclamations 303/2013, and 383/2016 establish EEU to operate the distribution segment
▪ PPP Proclamation 1076-2018 regulates public service concession arrangements and defines tenders as standard procedure for pubic service concessions
▪ Investment Proclamation 280/2002 prohibits the private sector from investing in the transmission and distributionsegments
Distribution CustomerTransmissionSingle buyer
▪ Regulations 86/1997, 810/2013 and 308/2014 establish EEA as the regulator of the power sector
SOEs
MA
IN R
EGU
LATI
ON
P
OW
ER S
YSTE
M
VA
LUE
CH
AIN
K
EY T
AK
EAW
AYS
Private sector
➢ Proclamations regarding the power sector make it clear that the private sector can be engaged in generation segment through the provision of licenses from EEA while transmission and distribution sectors remain exclusively managed by the public sector
➢ The EEP and EEU proclamations have contradictions and uncertainties which hampers regulatory certainty for private investors ➢ PPP proclamation establishes a tender procedure, managed by MOFEC, for the procurement of new infrastructures projects under
concession scheme but implementation is still at an early stage ➢New IPPs entering into the market must sign power purchase agreement (PPAs) with EEP which acts as the single buyer and sole
wholesale operator into the market
Ethiopia has recently opened to competition in the generation segment to accelerate sector development and support economic objectives but regulatory framework needs to be ameliorate and SOEs continue to play a dominant role
Source: PPP proclamation n.1076-2018, Ethiopia’s National Electrification Plan (NEP 2.0), EEU tariff review 2018, TBI intelligence

A comprehensive reform of power sector governance is under discussion to expand service, solve quality and reliability issues, and improve sector’s capabilities to sustain economic development. But tariff increases will likely be passed on
Main undergoing reforms ImplicationsPrivate sector participation▪ New legal and regulatory framework for PPPs is being
implemented with first tenders organized under the newregime, notably for renewable energy sources
▪ The GoE is intentioned to support PPPs for most of newgeneration projects in the future
▪ New National Electrification Plan (NEP 2.0) opened also toprivate sector participation into off-grid sector to achieveservice expansion targets and full electrification of the country
Electricity tariffs▪ A general review of electricity tariffs is undergoing to improve
the financial health of the sector▪ Tariffs will gradually achieve cost-reflectiveness to reduce
current budgetary burden of subsidies
Power sector reform▪ A comprehensive power sector reform roadmap is under
discussion covering mainly unbundling of the EEP, the creationof an independent system operator, the restructuring of publicutilities and the opening of T&D investments to private sector
Access to electricity and availability of power▪ Tenders for new generation capacity will trigger competition,
attract highly qualified IPPs and deliver new projects at the lowercosts when at regime
▪ Availability of power will increase for all consumers in line withthe reduction of current supply and demand deficit
▪ Economic damages of power shortages and interruptions will belimited
▪ New households will gain access to power services thanks to theinvestments in grid extension and off-grid tech.
Improvements in quality of service▪ Increased reliability and quality of electricity supply will
strengthen economic competitiveness of the country▪ New financial equilibrium for power sector utilities will support
further improvements in quality of service, as for connections,losses reduction, maintenance, billing and payment..
Higher costs for power supply▪ Private sector crowding-in and tariff review will rise electricity
service costs with the risk to jeopardize the competitiveadvantage of cheap power
▪ Power intensive industries (cement, steeling, chemicals) may bepenalized and less attracted by investing in Ethiopia
Source: PPP proclamation n.1076-2018, Ethiopia’s National Electrification Plan (NEP 2.0), EEU tariff review 2018, TBI intelligence
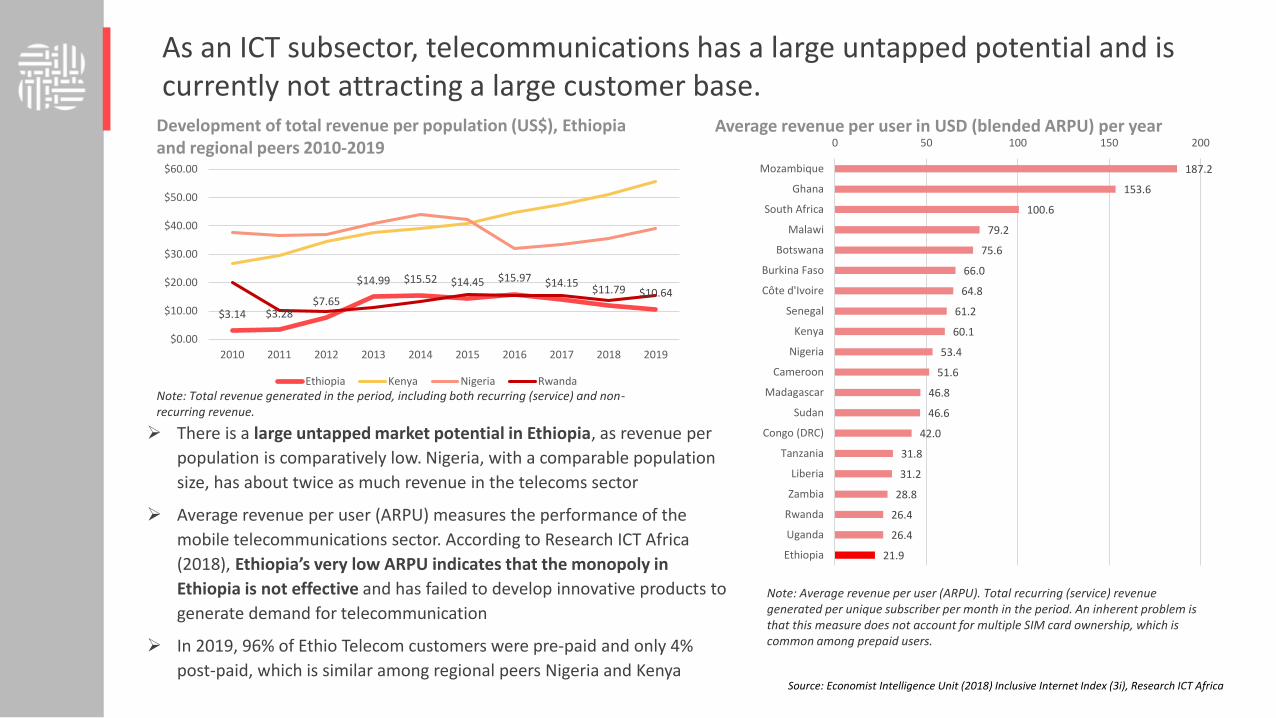
As an ICT subsector, telecommunications has a large untapped potential and is currently not attracting a large customer base.
187.2
153.6
100.6
79.2
75.6
66.0
64.8
61.2
60.1
53.4
51.6
46.8
46.6
42.0
31.8
31.2
28.8
26.4
26.4
21.9
0 50 100 150 200
Mozambique
Ghana
South Africa
Malawi
Botswana
Burkina Faso
Côte d'Ivoire
Senegal
Kenya
Nigeria
Cameroon
Madagascar
Sudan
Congo (DRC)
Tanzania
Liberia
Zambia
Rwanda
Uganda
Ethiopia
Average revenue per user in USD (blended ARPU) per year
Source: Economist Intelligence Unit (2018) Inclusive Internet Index (3i), Research ICT Africa
Note: Total revenue generated in the period, including both recurring (service) and non-recurring revenue.
$3.14 $3.28$7.65
$14.99 $15.52 $14.45 $15.97 $14.15$11.79 $10.64
$0.00
$10.00
$20.00
$30.00
$40.00
$50.00
$60.00
2010 2011 2012 2013 2014 2015 2016 2017 2018 2019
Ethiopia Kenya Nigeria Rwanda
Development of total revenue per population (US$), Ethiopia and regional peers 2010-2019
➢ There is a large untapped market potential in Ethiopia, as revenue per
population is comparatively low. Nigeria, with a comparable population
size, has about twice as much revenue in the telecoms sector
➢ Average revenue per user (ARPU) measures the performance of the
mobile telecommunications sector. According to Research ICT Africa
(2018), Ethiopia’s very low ARPU indicates that the monopoly in
Ethiopia is not effective and has failed to develop innovative products to
generate demand for telecommunication
➢ In 2019, 96% of Ethio Telecom customers were pre-paid and only 4%
post-paid, which is similar among regional peers Nigeria and Kenya
Note: Average revenue per user (ARPU). Total recurring (service) revenue generated per unique subscriber per month in the period. An inherent problem is that this measure does not account for multiple SIM card ownership, which is common among prepaid users.

Ethiopia needs to develop a more comprehensive, innovation-friendly regulatory framework for the ICT sector – currently government initiatives focus on inclusive access
Source: Economist Intelligence Unit (2018) Inclusive Internet Index (3i), WEF Global Information Technology Report 2016
Ethiopia Kenya Nigeria Rwanda
National female e-inclusion policies
75.0 25.0 50.0 75.0
Government e-inclusion strategy 100.0 100.0 100.0 100.0
National broadband strategy 100.0 0.0 100.0 50.0
Funding for broadband buildout 100.0 100.0 100.0 100.0
Spectrum policy approach 0.0 100.0 100.0 100.0
National digital identification system
50.0 100.0 100.0 100.0
Policy pillar of the inclusive internet index (3i) for Ethiopiaand regional peers (2019)
• However, in the Inclusive Internet Index (3i) published
by the Economist Intelligence Unit (EIU) and Facebook,
Ethiopia has been able to improve its policy readiness
ranking in 2019 – mainly by including “at least three
underserved groups” in its national ICT policy plan and
closing the gender gap in internet access
Scores for laws relating to ICTs in Ethiopia and regional peers (2018)
Overall score: POLICY
• According to the WEF Global Information Technology Report, the regulatory framework in the ICT sector is insufficient to encourage the levels of growth and job creation that Ethiopia could benefit from – this is measured by looking at how developed are a country's laws relating to the use of ICTs (e.g., e-commerce, digital signatures, consumer protection) are? [1 = not developed at all; 7 = extremely well developed]

107
The Ethiopian National ICT Policy can do more to encourage entrepreneurs particularly be creating more realistic requirements to obtain licensing
• Value Added Services refer to services which are not basic telecommunication services or additional services that will be provided using mobile, internet or fixed line telecommunication services.
• As most tech start-ups use mobile internet or fixed line telecommunication services, they are required to get a VAS license from MInT in addition to the Business Registration Certificate they obtain from MoTI
1. Two graduate professionals with first degree in Electrical or Computer Engineering, Computer or Information Science, or Information and Communication Technology, or in related fields and having two years experience in the sector;
2. One technician having a diploma from a recognized educational institution in Electricity, Electronics, Information Technology or related fields;
3. Routers, servers and other similar equipment applicable for the service;
4. Business registration certificate*
• Authenticated contract of office space lease
Requirements for obtaining VAS license
Source: Ministry of Communication and Information Technology; Value Added Services License Directive No. 3/2011; Interview of various start-ups
• The VAS types categorized by MCIT lack updating and don’t include current technological trends.
• If a tech start-up’s category falls outside of the VAS types above, a legal challenge usually happens on how to categorize the tech start-up.
• Then this creates a lengthy and time consuming (up-to six months) process for a tech start-ups to be registered and start operation
• As most tech start-ups begin with limited talent and very few computers, the requirements set by MCIT to obtain VAS license are discouraging for most tech start-ups
Key Challenges
VAS types1. Short Messaging Services2. Payment Transaction Services3. Entertainment& information services4. Location Based Services5. Call Center Services6. Virtual Internet Services

108
The liberalization will directly affect the sector by expanding mobile, fixed line and internet services communities, which in turn contribute to national strategic objectives…
→ International experience demonstrates that reform benefits are maximised when all three parts of the reform are implemented at the same time.
Support private sector growth
Help to connect
communities
Create new business oppor-tunities
Support the development
of a digital economy
Improve access to finance (mobile
banking and DFS)
Provide opportunities
to broaden access to
education and training
Effects of liberalization
Partial privatization
• Partial privatization of Ethio Telecom (selling of minority shares)
• Will introduce private capital and international expertise into the public enterprise resulting in an increase in value for the government
Establishment of regulator
• Establishment of a sector regulator, the Ethiopian Communications Authority
• Will issue sector regulation
• Will ensure that the sector has transparent pricing and effective competition
Market opening
• Issuing of licenses to at least two new service providers in an open, competitive and transparent process
• Will open the market to competition
The government of Ethiopia is following a three-tiered reform plan for the telecommunications sector
The telecommunications sector is a monopoly managed by EthioTelecom with regulatory oversight from MInT, which the government plans to reform in 2019
Prices are set by EthioTelecom
The government has control over networks
Current model
Source: ICT research Africa, TBI analysis,

Full liberalization: entry of two
foreign MNOs
Pricing and sales of
EthioTelecom stakes
ETA set up and issued
sector regulation
109
Ensuring an effective
liberalization process
• Prepare agencies for the privatization process by building capacity and in considering strategic options for Ethio Telecom, updating existing legislation, and drafting relevant regulations.
• Issues that need to be addressed include the timing of the privatization process, the mechanism to be used and the design and implementation of a program of support for staff.
Ensuring good regulatory
governance
• ETA empowered as independent agency to implement international best regulatory practice
• Increased capacity of ETA to effectively cover modern services such as mobile telephony and the internet
• ETA properly defined institutionally and aligned with Network Security Agency (INSA) to formulate and adopt regulations regarding information security
Ensuring healthy
competition
• Non-discriminatory access to the backbone network for all operators
• Mandatory infrastructure sharing (e.g., towers) and enabling wholesale carrier neutral broadband providers
• Enabling other players to enter the market with favourable conditions, such as subsidized spectrum, longer license tenors, and mandatory roaming in Ethio Telecom’s network
However, a sound regulatory framework and set-up of the sector regulator ETA are required to facilitate a competitive and open telecommunications sector
World Bank recommendations for telecommunications sector reform
Source: World Bank (2019) Ethiopia Country Private Sector Diagnostic, Interview with MOF advisor (July 2019)
Without the proper set up and functioning of the ETA, neither the privatization of Ethio Telecom nor the market entry of foreign MNOs will be possible…

Key points for the reform
Ethio Telecom’s privatisation should be designed to meet the following goals:• Fiscal improvements: Halt the dependence on supplier credit loans, reducethe foreign debt burden, promote access to capital to upgrade the networkand increase the government tax base.• Efficiency: Improve the efficiency and the performance of the telecomcompany by creating management autonomy and improving corporategovernance.• Competitive ICT ecosystem: Use privatisation to build a highly competitivetelecom market and ICT ecosystem that drives the local ICT sector, youthemployment and technology transfer.• Access and affordability: Use privatisation and its proceeds to increaseaccess to affordable universal broadband services for all, which will have asnowball effect on competitiveness in other sectors.• Workers productivity, quality of service and innovation: Leverageprivatisation to improve quality of service to consumers and to introducenew services and innovative technologies.• National security and privacy of citizens: Use privatisation as a means tohelp safeguard national security and uphold the privacy of citizens.• Participation: Encourage the Ethiopian people to become more involvedand to play a bigger role in the ownership and management of the telecombusiness in the country.
Source: Research ICT Africa
Experiences from telecoms privatization
• Studies reveal that privatization results in lower prices and higheroutput in competitive industries.
• Privatization combined with a separate regulator is positively correlatedwith connection capacity and payphone penetration.
• Economic growth: Since the revenues generated by thetelecommunication industry represent over 2% of world GDP,inefficient entry and high prices in the mobile segment generate largesocial costs.
• FUSS, MESCHI & WAVERMAN (2005), for instance, estimate that in atypical developing country, an increase of ten mobile phones per 100people boosts growth by 0.6 percentage points.
• Privatization is associated with a significant increase in labour productivity(42 percent).
• Privatized telecommunication firms seem to be more productive and toinvest more in network coverage. This is an improvement for thepopulation, which in turn gains access to the service. Yet they also get ridof redundant employees, increase prices and disconnect those whocannot pay Their bills (inclusivity).
Source: COMMUNICATIONS & STRATEGIES, Special issue, Nov. 2005, p. 31.
Partial privatisation of the sector should go some way to increase the sector’s efficiency and enable Ethiopia to improve its connectivity position with respect to regional and global peers

Telecommunications reform commenced in 1991 and continues, producing a variety of benefits to the economy.
Effects:• In 2014 Nigeria was the fastest growing
telecommunications market in Africa and amongst the ten fastest growing in the world.
• Private sector investment in the telecom sector increased from US$50m in 1991 to US$18 billion by the end of 2009, including foreign direct investment, through license fees, infrastructure development, building local capacity and by growing local companies that provided support services.
• In 2001, a spectrum auction for three digital mobile licenses generated US$285 million for each 15-year license.
• Mobile phone penetration increased significantly in the decade to 2011 from 266,461 to 122.5 million.
• Over a million new jobs were created directly and indirectly
Studies show the benefits of liberalisation to growth, employment, poverty reduction and capacity of firms to compete in foreign and domestic markets.
111
Studies show the benefits of telecommunications sector reform
Case Study: Nigeria
Obi Iwuagwa (2014): The quality and price of telecommunication
services not only affects business costs but the strength of firms
to network and compete in foreign and domestic markets.
Auriol (2005): In a typical developing country, an increase of ten mobile phones per 100 people boosts GDP growth by 0.06 percentage points.
El-Haddad (2017): A study on the liberalization of the telecommunications sector in Egypt noted the expansion of employment by new providers has outweighed any contractionary effects from seeking efficiency gains in the existing operator, if indeed such pressures apply.
Kane (2002): Liberalisation of the telecommunications sector in Kenya addresses the twin problems of access and affordability through both a macro level (attracting donor funds to Kenya) and a micro level (local limits to ICT-related poverty alleviation interventions due to uneven roll-out) effect..
Source: ICT research Africa, TBI analysis,