Destroy this report when no longer needed. Do not return · Destroy this report when no longer...
50
Transcript of Destroy this report when no longer needed. Do not return · Destroy this report when no longer...

Destroy this report when no longer needed. Do not return it to the origmator.
The findings in this report are not to be construed as an officisl Department of the Army position unless So designated
by other authorized documents.
The contents of this report are not to be used for adverhslng. publication. or promotional purposes.
Citation of trade names does not constitute an of+wal endorsement or aporoval of the use of
such commercial products.
The D-series of reports includes publications of the Environmental Effects of Dredamg PropramS:
Dredging Operations Technical Support
Long-Term Effects of Dredging Operations
Interagency Field Verification of Methodologies for Evaluarlng Dredged Material Disposal Alter”atw?s
(Field Veriflca!*on Program)

Unclassified
REPORT DOCUMENTATION PAGE Form Approved OM8 No. 0704-0188
la. REPORT SECURITY CLASSIFICATION Unclassified
!a. SECURITY CLASSIFICATION AUTHORITY
!b. DECLASSIFICATION/DOWNGRADING SCH,EDULE
3. DISTRIBUTION /AVAILABILITY OF REPORT
Approved for public release; distribution unlimited.
I. PERFORMING ORGANIZATION REPORT NUMBER(S) 5. MONITORING ORGANIZATION REPORT NUMBER(S)
Technical Report D-90-9 ia.;;f&$F~PERFORMING ORGANIZATION 6b. OFFICE SYMBOL ?a. NAME OF MONITORING ORGANIZATION
(if J&iCJb/J)
Environmental Laboratory CEWES-EE ic ADDRESS (C/ty, State, Jd Z//‘COCk) 7b. ADDRESS (C&y, StJtJ, Jd ZIPCode)
3909 Halls Ferry Road Vicksburg, MS 39180-6199
la. NAME OF FUNDING ISPONSORING Bb. OFFICE SYMBOL 9. PROCUREMENT INSTRUMENT IDENTIFICATION NUMBER ORGANIZATION c/f Jpp/iCJb/J)
US Army Corps of Engineers Ic ADDRES5 (City, $tJte, end z/P Code) 10. SOURCE OF FUNDING NUMBERS
PROGRAM EoJECT
TASK WORK UNIT ELEMENT NO. . NO. ACCESSION NO.
Washington, DC 20314-1000 1. TITLE /nc/ude Securtty Clarrlfkation)
Fiel 6 Areas:
Evaluation of the Quality of Effluent from Confined Dredged Material Disposal Supplemental Study - Houston Ship Channel
2. PERSONAL AUTHOR(S) Thackston, Edward L., Palermo, Michael R.
l3a. TYPE OF REPORT 13b. TIME COVERED Final report
16. SUPPLEMENTARY NOTATION
See reverse. 17. COSATI CODES 18. SUBJECT TERMS (Continue on reverse if necessary and khtify by block number)
FIELD GROUP SUB-GROUP Confined disposal Effluent Contaminants Elutriate test Dredged material Water quality
19. ABSTRACT (Continue on reverse if necessary and identify by block oumber)
Intended to supplement several previous studies, this report describes the results o a field evaluation of the method for predicting containment area effluent quality for a
dredging project on the Houston Ship Channel. cess are explained,
The project and field data collection pro-
ples. The along with details of laboratory tests run on sediment and water Sam-
resulting prediction of the tests are compared to the measured field data, and conclusions are drawn. racy,
This study furnished further verification of the validity, accu- and usefulness of the predictive method, especially in cases of consideration of
highly unusual local conditions.
!O. DlSTRlBUTlONlAVAlLABlLlTY OF ABSTRACT 21. ABSTRACT SECURITY CLASSIFICATION
0 UNCLASSIFIED/UNLIMITED t8 SAME AS RPT.
iJV rOVTll4/S, JUN Previous editions are obsolete SECURITY CLA)>IFICATION OF THIS PAGE
Unclassified

PREFACE
This work was conducted as part of the Long-Term Effects of Dredging
Operations (LEDO) Program at the Environmental Laboratory (EL), US Army Engi-
neer Waterways Experiment Station (WES). The LED0 Program, sponsored by
Headquarters, US Army Corps of Engineers (HQUSACE), is assigned to WES under
the purview of EL's Environmental Effects of Dredging Programs. This report
was written as part of LED0 Work Unit 31775, Techniques for Predicting
Effluent Quality of Diked Containment Areas. The technical monitors were
Drs. John Hall, William L. Klesch, and Robert Pierce, HQUSACE, and
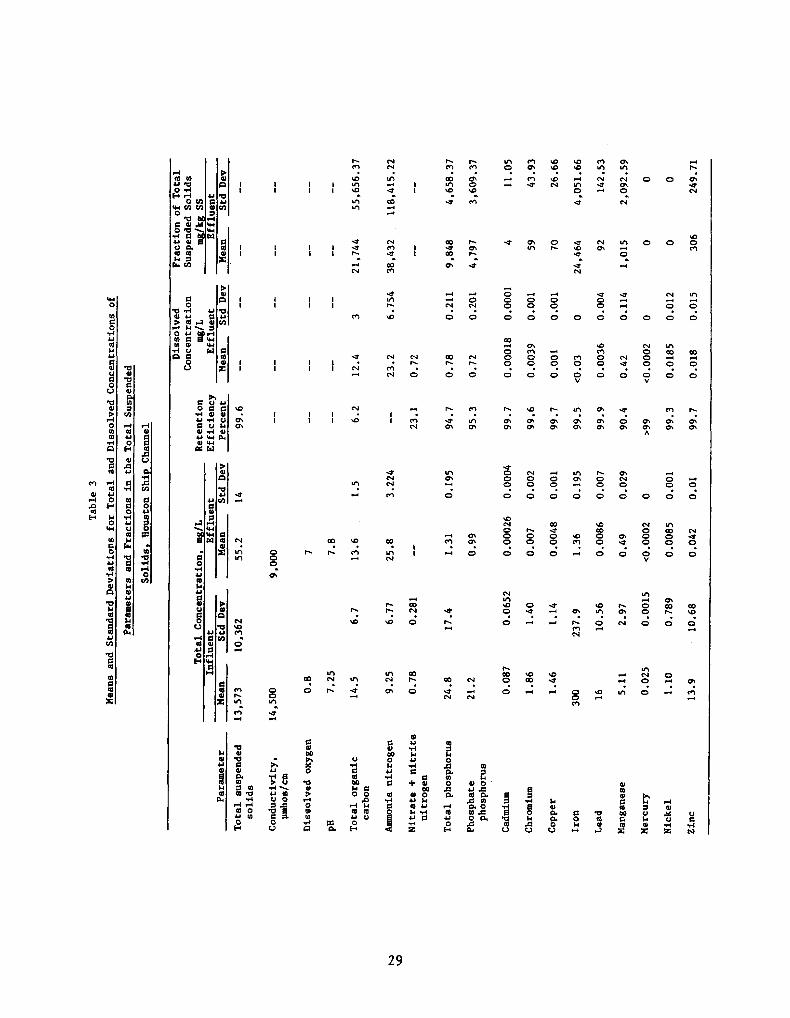
Mr. Charles W. Hummer, formerly of the Water Resources Support Center, Fort
Belvoir, VA.
The study was conducted by and this report was written by Dr. Edward L.
Thackston, Vanderbilt University, who participated under an Intergovernmental
Personnel Act agreement, and Dr. Michael R. Palermo, Research Projects Group,
Environmental Engineering Division (EED), EL. Dr. F. Douglas Shieids,
Dr. Paul R. Schroeder, and Mr. Daniel Averett, EED, were technical reviewers
for this report.
The assistance and cooperation of the US Army Engineer District,
Galveston, and the Port of Houston are gratefully acknowledged.
This work was performed in EL under the general supervision of
Dr. Raymond L. Montgomery, Chief, EED, and Dr. John Harrison, Chief, EL.
Dr. Robert M. Engler was manager of the LED0 Program. Final editing for
publication of this report was done by Ms. Gilda Miller, Information
Technology Laboratory, WES.
Commander and Director of WES is COL Larry B. Fulton, EN. Technical
Director is Dr. Robert W. Whalin.
This report should be cited as follows:
Thackston, Edward L., and Palermo, Michael R. 1990. "Field Evaluation of the Quality of Effluent from Confined Dredged Material Disposal Areas: Supplemental Study - Houston Ship Channel," Technical Report D-90-9, US Army Engineer Waterways Experiment Station, Vicksburg, MS.
1
CONTENTS
Pane
PREFACE ................................................................. 1
CONVERSION FACTORS, NON-SI ~0 SI (METRIC) UNITS 0~ MEASUREMENT .......... 3
PART I: INTRODUCTION ................................................. 4
Background ........................................................ 4 Purpose and Scope. ................................................ 6
PART II: PREDICTION METHODOLOGY ....................................... 8
Modified Elutriate Tests .......................................... 9 Column Settling Tests ............................................. 11 Laboratory Predictions of Effluent Quality ........................ 12
PART III: PROJECT DESCRIPTION .......................................... 14
Project Locatj-on .................................................. 14 Disposal Area ..................................................... I.4 Dredging Operation ................................................ 20
PART IV: FIELD SAMPLING AND TESTING ................................... 21
Dye Tracer Study .................................................. 21 Dredging Site Sediment and Water Sampling ......................... 22 Influent/Effluent Sampling ........................................ 24 Results ........................................................... 28
PART V: PREDICTION OF CONTAMINANT CONCENTRATIONS ..................... 33
Results of Laboratory Tests ....................................... 33 Predicted Contaminant Concentrations .............................. 34
PART VI: DISCUSSION OF RESULTS ........................................ 39
Nutrients ......................................................... 39 Heavy Metals ...................................................... 40
PART VII: CONCLUSIONS .................................................. 42
REFERENCES .............................................................. 43
APPENDIX A: PLOTS OF INFLUENT AND EFFLUENT CONTAMINANT CONCENTRATIONS (Reproduced on microfiche in back cover) .... Al
APPENDIX B: SUMMARY PLOTS OF PREDICTED AND MEASURED CONTAMINANT CONCENTRATIONS (Reproduced on microfiche in back cover) .... Bl
2

CONVERSION FACTORS, NON-S1 TO SI (METRIC) UNITS OF MEASUREMENT
Non-S1 units of measurement used in this report can be converted to SI
(metric) units as follows:
Multiply By
acres 4,046.873 acre-feet 1,233.489 cubic feet 0.02832 cubic yards 0.7646 degrees (angle) 0.01745329 feet 0.3048 gallons (US liquid) 3.785 inches 2.54 miles (US nautical) 1.852 pounds (mass) 0.4536
To Obtain
square metres cubic metres cubic metres cubic metres radians metres cubic decimetres centimetres kilometres kilograms
3

FIELD EVALUATION OF THE QUALITY OF EFFLUENT FROM CONFINED
DREDGED MATERIAL DISPOSAL AREAS: SUPPLEMENTAL
STUDY - HOUSTON SHIP CHANNEL
PART I: INTRODUCTION
Background
General
1. Confined dredged material disposal has increased in recent years,
chiefly because of environmental constraints on the open-water disposal of
sediments classified as polluted and unacceptable for unrestricted disposal.
Release of contaminants in the effluent from confined disposal areas* is
dependent upon a number of factors relating to the physical, geochemical, and
physicochemical characteristics of the dredged material and the variables of
the confined disposal process. The term effluent is defined for purposes of
this report as water that is discharged on a continuous or intermittent basis
from confined disposal areas as they are being hydraulically filled during
active disposal operations.
2. The effluent from confined disposal areas is considered a dredged
material discharge under Section 404 of the Clean Water Act. Regulatory guid-
ance and evaluation procedures have recently been developed to predict contam-
inant concentrations in effluents from confined disposal operations (Palermo
1986a, 1986b; Palermo and Thackston 1988a, 19888, 1988c). These guidelines
were also published as Environmental Effects of Dredging Programs Technical
Notes (Palermo 1985). The field evaluation described in this report was con-
ducted as a part of the overall study to provide further verification
of the applicability of the procedures to specific situations in the field.
Description of processes influencing effluent quality
3. A confined disposal area is a diked enclosure used to retain dredged
material hydraulically placed in the site. Confined disposal areas must be
* The terms confined disposal area, confined disposal site, diked disposal area, containment area, and confined disposal facility are used interchange- ably in the literature,
4

designed to provide both adequate storage capacity for the settled sediments
and efficient sedimentation to minimize the discharge of suspended solids
(Montgomery, Thackston, and Parker 1983). Figure 1 shows the supernatant
water interactions in an active confined disposal area. When hydraulic dredg-
ing occurs, the sediment is violently mixed with overlying water entrained by
the dredge, and it is then subjected to sedimentation within the disposal area
for a period ranging from a few hours to several weeks. Influent into the
confined disposal site is a mixture of predominantly anoxic, chemically
reduced sediment and aerobic entrained water from the overlying water column.
Sedimentation results in a "thickened" deposit of settled material overlain by
the clarified supernatant that normally contains dissolved oxygen. The physi-
cal and chemical conditions existing in both the sediment mass and the overly-
ing water column prior to dredging are therefore subject to major changes,
with resulting changes in contaminant mobility. Factors influencing the
mobility of contaminants (e.g., from particle-associated to dissolved) include
salinity, oxidation-reduction potential (Eh), hydrogen ion concentration (pH),
and chemical composition of the interstitial water (Gambrell, Khalid, and
Patrick 1976; Hoeppel, Myers, and Engler 1978). The physical properties of
the sediment, including grain size distribution, clay mineralogy, and the
presence of organic material, are also major factors.
4. The finer suspended particles are only partially removed from the
supernatant water by sedimentation. Also, some of the settled particles
reenter the supernatant water because of the upward flow of water through the
slurry mass during compaction (or thickening). Wind-induced currents and/or
surface wave action may also resuspend settled particles. All solids cannot
be retained, and both dissolved and particle-associated contaminants are dis-
charged in the effluent and transported to the receiving water. Design and
operation of the disposal area, particularly the discharge weir or structure,
also heavily influence the quality of the effluent. Methods for prediction of
contaminant concentrations in the disposal area effluents were developed so
that the potential for contaminant release and subsequent environmental
impacts resulting from these activities may be properly predicted and
evaluated.
5

DREDGED MATERIAL
Figure 1. Schematic of ponded-water interaction in an active confined disposal site
Purpose and Scope
5. The purpose of this report is to describe the results of a field
evaluation of the method for predicting effluent quality for a dredging
project on the Houston Ship Channel. This report is intended to supplement
several previous studies (Palermo 1988; Palermo and Thackston 1988b). The
predictive technique developed earlier is first briefly described for the
reader's understanding of the methodology, followed by an explanation of the
project and the field data collection process. The laboratory tests run on
the sediment and water samples are described, and their resulting predictions
are given. Finally, the measured field data are compared to the laboratory
predicted effluent concentrations. These comparisons are discussed, and con-
clusions are drawn.
6. The original intent was to perform the study at a dredging site in a
freshwater environment, because all previous verification studies have been at
saltwater sites. Although initial information indicated fresh water in the
upper reaches of the Houston Ship Channel, the water at the bottom of the
channel was brackish at the time of the study. However, these comparisons
serve as a further verification of the accuracy and precision of the predic-
tive techniques under brackish water conditions (salinity greater than 3 per-
cent), in which zone settling occurs. Another objective was to gather data
6

on the removal of manmade organic chemicals. Because the Houston Ship Channel
was known to have been heavily polluted in the past, it was hoped that the
sediments would contain sufficient quantities of manmade organics to be
studied. This, however, did not prove to be the case. It is hoped that a
future study can be made on organics at another site.
7. The field data include both dissolved and total concentrations of
contaminants. Also included is a discussion of the efficiency of a confined
disposal area containing a large amount of vegetative growth in retaining con-
taminants during active filling and effluent discharge operations.
8. Plots of individual contaminant concentrations as a function of time
for both influent and effluent are presented in Appendix A. Summary plots of
averages and standard deviations for both laboratory predicted concentrations
and measured field concentrations are included in Appendix B.
7

PART II: PREDICTION METHODOLOGY
9. A brief description of the predictive technique used on this pro-
cess is provided here, before a description of the dredging project or the
sampling and testing project, in order to give the reader an understanding of
the laboratory and field data required to make validated effluent quality pre-
dictions. A description of the dredging project and field and laboratory sam-
pling and testing follows in Parts IV and V and can be put in context more
easily.
10. The prediction methodology for this and previous studies combines a
modified elutriate test, a laboratory column settling test, and samples of
both sediments and water from the proposed dredging site. Both tests will be
briefly described in the following paragraphs, while more details can be found
in the referenced articles and reports.
11. Any method for the prediction of the quality of effluent from con-
fined dredged material disposal areas must account for both the dissolved con-
centration of contaminants and the solid contaminant fraction associated by
adsorption or ion exchange with the total suspended solids (TSS) released. A
modified elutriate test procedure recently developed for this purpose was used
in making the laboratory prediction of effluent quality for this study
(Palermo 1985, 1986b; Palermo and Thackston 1988a, 1988b). This test simu-
lates the geochemical changes occurring in the disposal area during active
disposal operations. The same test determines dissolved concentrations of
contaminants in milligrams per litre and particle-associated contaminant frac-
tions of the suspended solids in milligrams per kilogram of suspended solids
under quiescent settling conditions.
12. Refinements and extensions of column settling test procedures
(Montgomery 1978; Palermo, Montgomery, and Poindexter 1978; Palermo and
Thackston 1988c) were also used to predict the concentration of suspended
solids in the effluent for the given operational conditions at the Houston
field site (i.e., ponded area and depth, inflow rate, and hydraulic
efficiency). Using results from both the modified elutriate test and the
column settling test, . . a predlctlon of the total concentration of contaminants
in the effluent was made. Detailed procedures used for the predictions were
given by Palermo (1985).
8

Modified Elutriate Tests
Procedures
13. Modified elutriate tests were conducted on the sediment samples
taken from the channel prior to dredging using procedures described by Palermo
and Thackston (1988a). These tests generally consist of the following steps:
a. Mixing dredging site sediment and water to a concentration expected in the influent to the confined disposal site (the effluent from the dredge).
k* Aerating the mixture for 1 hr to simulate the oxidizing condi- tions present at the disposal site.
C. Settling the mixture for a time equal to the expected or mea- sured mean retention time of the disposal area, up to a maximum of 24 hr.
d* Extracting a sample of the supernatant water for analysis of dissolved and total contaminant concentrations. Detailed pro- cedures for the modified elutriate test and a schematic of the test are presented in Appendix A.
Selection of test factors
14. The modified elutriate test should be performed using a slurry con-
centration equal to that expected in the influent to the confined disposal
site to be evaluated. The settling time used for the test should be equal to
the mean field retention time in the confined disposal site, up to a maximum
of 24 hr. These test factors must be known or assumed prior to conducting the
tests. The modified elutriate tests for this field study were performed after
the field monitoring and sample collection. In this way, field data on influ-
ent solids concentration and mean retention time were available prior to the
tests, and these data were used as described in Appendix A in setting the test
factors. Therefore, the comparisons of laboratory predictions and measured
field data described in Part IV were not biased due to a poor selection of
test factors. In a real prediction, these factors will not be known and must
be predicted using the best available methods.
15. The field influent solids concentrations were determined from
influent samples taken as described in Part III. The average influent concen-
tration was used as a target concentration in making up the slurries for con-
ducting the modified elutriate tests. Slurry concentrations in the laboratory
can fluctuate with small variations in sediment sample water content. For
9
this reason, the slurry concentrations for the tests may vary somewhat from
the target concentrations.
16. The field mean retention time was determined by a dye tracer test.
At other sites, it may be estimated from the calculated or estimated theoreti-
cal retention time adjusted for the hydraulic efficiency normally associated
with confined disposal sites. Procedures for estimating the retention times
were described by Thackston, Shields, and Schroeder (1987). The field mean
retention time determined from the dye tracer test was 8 hr, so this time was
used in the modified elutriate test and column settling test.
Measurement of physicochemical parameters
17. Conductivity, dissolved oxygen concentration, and pH were measured
in the field laboratory using instruments. All instrument readings were taken
immediately upon sample extraction and processing.
Chemical analyses
18. All chemical analyses for this study were conducted according to
standard procedures (American Public Health Association 1981). Metals analy-
ses were performed using atomic adsorption spectrophotometers with heated
graphite furnace. Nutrient analyses were performed using Technicon Auto
Analyzers. Organic analyses were performed using high-resolution gas
chromotograph/mass spectrometers. The Analytical Laboratory at the US Army
Engineer Waterways Experiment Station (WES) performed the analyses.
Results
19. The chemical analysis of the modified elutriate samples provided
the data used to predict dissolved and total concentrations of contaminant
parameters in milligrams per litre. The total suspended solids concentration
was also determined. To predict the total concentration of each contaminant
in the effluent, it was necessary to first calculate the fraction of each con-
taminant associated with the total suspended solids in the elutriate samples.
These fractions were calculated using Equation 1
C F = (1 x 10⁶) total - 'diss
86 ss (1)
where
F ss
= fraction of contaminant in the total suspended solids, mg contaminant/kg of suspended solids
10

(1 x 10⁶) - conversion factor, mg/mg to mg/kg
C total s total concentration, mg contaminant/L of sample
C diss =
dissolved concentration, mg contaminant/L of sample
ss = total suspended solids concentration, mg solids/L of sample
Column Settling Tests
Procedures
20. Column settling tests on the composite sediment samples to predict
the concentration of suspended solids in the effluent generally consist of the
following steps:
a. Mixing the dredging site sediment and water to a slurry concen- tration expected in the influent.
b. Placing the slurry into an 8-in. -diam* settling column and allowing it to settle.
c. Taking samples of the supernatant water above the sediment- water interface that forms as settling progresses and repeating the process at various time intervals.
d. Analyzing the samples for suspended solids concentration.
21. As with the modified elutriate tests, the measured field influent
concentration for this study was known prior to the laboratory tests. This
value was used as a target concentration for mixing the slurries for the set-
tling tests. Detailed test procedures were given by Montgomery (1978) and
Palermo (1985).
Prediction of effluent suspended solids
22. Using the column settlin- E, test results, prediction of the effluent
suspended solids were made. The predictions were made by the following steps:
ii . Developing a relstfonship of column supernatant suspended solids versus settling time.
b. Selecting a column suyernatant suspended solids concentration corresponding to the expected mean field retention time.
c. Determining a predicted effluent suspended solids value by adjusting the column value for wind and turbulence under field settling conditions. This adjustment can be made by using a settling efficiency adjustment factor, a function of ponded surface area and ponded depth (Palermo 1986a; Palermo and Thackston 1988c).
* A table of factors for converting non-S1 units of measurement to SI (metric) units is presented in page 3.
11

Adjustment factors for turbulence and resuspension
23. The refined approach for prediction of effluent suspended solids
previously described by Palermo and Thackston (1988c) assumes that the con-
fined disposal area is well designed and operated, the weir has sufficient
crest length, and ponding conditions do not allow resuspension of settled
material. Good design assures adequate ponded surface area and sufficient
storage for the zone settling process to concentrate the dredged material, if
the entire slurry mass undergoes zone settling. However, the mean field
effluent concentration of suspended solids for well-designed and well-operated
sites would likely be higher than that indicated by quiescent laboratory
tests.
24. The predicted values of effluent suspended solids is, therefore,
normally considered the minimum value that can be achieved in the field under
the best possible conditions for settling (i.e., little turbulence and little
or no solids resuspension because of wind effects). Adjustment for turbulence
and anticipated solids resuspension due to wind is appropriate for most cases.
25. The recommended approach in selecting appropriate settling effici-
ency adjustment factors is based on both anticipated ponded areas and ponding
depths. The level of turbulence is related to advective flow velocities that
are inversely proportional to ponded surface area and ponded depth for a given
flowrate. However, wind can produce surface flow velocities in shallow, con-
fined disposal areas that greatly exceed advective velocities (Poindexter and
Perrier 1980). As the ponded area increases , the fetch distance for wind-
induced waves increases, and the potential for solids resuspension also
increases. As ponded depths and widths increase, the advective velocity is
reduced. Increasing depth reduces the influence of wave action at the inter-
face, and the potential for solids resuspension decreases. The recommended
adjustment factors vary from 1.5 to 2.5 and are presented in Table 1 (from
Palermo and Thackston 1988c). These settling efficiency adjustment factors
are considered sufficiently conservative for purposes of disposal area evalu-
ations under normally encountered wind conditions (excepting storms).
Laboratory Predictions of Effluent Quality
26. Predictions of the total contaminant concentrations in the effluent
were made using the results of both the modified elutriate tests and column
12

Table 1
Recommended Settling Efficiency Factors for Zone Settling Case
(Salt Water) for Various Ponded Areas and Depths
Anticipated Ponded Area
Less than 100 acres
Greater than 100 acres
Anticipated Average Ponded Depth Leso than 2 ft 2 ft o'r greater
2.0 1.5
2.5 2.0
settling tests. The predicted total concentrations are the sums of the pre-
dicted dissolved concentrations and the predicted particle-associated concen-
trations. Predicted dissolved concentrations are equal to those determined
directly by the modified elutriate tests. Predicted particle-associated con-
centrations were calculated using the contaminant fractions of the total
suspended solids determined by the modified elutriate tests and the predicted
effluent suspended solids concentrations determined by the column settling
tests. Using these tests results, the predicted total contaminant concentra-
tion in milligrams per litre in the effluent was estimated by Equation 2 as
F C 8s SSeff
total = 'diss + (1 x 10⁶) (2)
where
C total
= estimated total concentration in effluent, mg contaminant/L of water
C diss
= dissolved concentration determined by modified elutriate test, mg contaminant/L of sample
F ss = fraction of contaminant in the total suspended solids
calculated from modified elutriate test results, mg contaminant/kg of suspended solids
ss eff
= predicted suspended solids concentration of effluent esti- mated from evaluation of sedimentation performance in labo- ratory column settling test, adjusted for field conditions by factors from Table 1, mg suspended solids/L of water
(1 x lob> = conversion factor, mg/mg to mg/kg
13
PART III: PROJECT DESCRIPTION
Project Location
27. The Houston Ship Channel is approximately 60 miles long, from the
Gulf of Mexico near Galveston, TX, to near downtown Houston. The first
27 miles is in Galveston Bay, and the next 25 miles is through Buffalo Bayou
to the main turning basin at the Port of Houston headquarters on Clinton
Drive. A smaller channel, called the Light Draft Main Channel, runs westward
for approximately 4 miles. This channel, plus the Turkey Bend Channel, an old
bend now cut off and blocked at the upper end, were the sections dredged dur-
ing this project.
28. The total length of the project was 22,283 ft, with 4,110 ft being
in Turkey Bend. The location of the project is shown in Figure 2. Approxi-
mately 187,500 yd3 was dredged by an 18-in. cutterhead dredge in August and
September, 1988.
Disposal Area
29. The dredged material was placed in the Filter Bed Disposal Area on
Clinton Drive just east of the Houston Belt and Terminal Railroad yards. The
disposal area was approximately 1,100 ft by 3,200 ft, covering approximately
80 acres. It had been used several times in the past, and the bottom eleva-
tion had been built up to approximately 50 ft,* about 30 ft above the sur-
rounding terrain. It had not been used for about 15 years, and the interior
was covered with vegetation, including trees up to 8 in. in diameter. About
10 acres in the southwest corner had been used to dump construction debris and
was 8 to 10 ft higher in elevation.
30. For this project, the dikes were raised by borrowing material from
a strip 100 to 200 ft wide just inside the dikes. Also, an area of approxi-
mately 20 acres in the northern end, the lowest part of the area, was cleared.
The rest of the area was left undisturbed, and remained covered by vegetation,
varying from cattail swamps to dense trees and brush. There were some
* All elevations (el) cited herein are in feet referred to National Geodetic Vertical Datum (NGVD) of 1929.
14

m-/ 10’ x 60’ CHANNEL COMPLETED TO FILTER BED
- THIS POINT DISPOSAL AREA \ h
SCALE
0.6 0 0.6 1.0 MI I-- l
Figure 2. Project location
distinct internal drainage channels, including one through a culvert under an
internal road.
31. An outlet consisting of a box with adjustable weirs on three sides
was constructed near the northwest corner. A plan of the area is shown in
Figure 3, and a photograph of the outlet structure before the area was filled,
without the weir boards, is shown in Figure 4. A photograph showing how the
weir boards were placed is shown in Figure 5.
32. Hydraulically, the disposal area was very inefficient. Only about
20 percent of the area was ponded, and much of the ponded area was to the east
of the outlet weir and was past the outlet , therefore becoming essentially
dead zone. The channel between the small ponded area in the southern end and
the larger ponded dead zone was quite narrow and had high velocities and
essentially no sedimentation. On the other hand, the southerly ponded area
was covered by dense vegetation that slowed flow velocities, created numerous
small quiescent dead zones, and enhanced sedimentation while also providing
opportunities for adsorption and nutrient uptake.
33. Photographs of the area during the sampling period are shown in
Figures 6 through 9. Figure 6 shows the southerly ponded area, looking north
from the southeast corner. The east dike is on the right, and the ponded area
extends into the swampy area in the woods on the left. Figure 7 shows the
large mound of coarse sediments that formed a large delta area in the south-
east corner during the previous 2 weeks of dredging. During the sampling
period, the influent crossed this area by overland flow.
15

G Y
t I
0 + 00 67 + 44 d PILES OF
f?y TREES
LIMITS OF PONDING
!I CROSS DIKE i
I ‘---EDGE OF I
1
I WOODS -q
I I I I
:6 + 60
4i INLET PIPE SCALE FR
200 400 Fr 0
Figure 3. Plan of filter bed
16

Figure 4. Outlet structure before filling
Figure 5. Outlet structure showing method of installing weir boards

Figure 6. Southerly ponded area, looking north from southeast corner
Figure 7. Southeast co-rner, looking southwest, showing delta formed by heavy sediments
18

._
Figure 8. Ponded area in front of outlet structure, looking south from northwest corner
Figure 9. Northerly ponded area, looking east from northwest corner
19

34. Figure 8 shows the ponded area immediately adjacent to the outlet
structure on the right of the photograph. Looking south, the west dike is on
the right, woods on the left, and the well-defined channel carrying flow from
the southerly ponded area to the northerly ponded area is in the background.
Figure 9 shows the outlet structure and the northerly ponded area, looking
east. Also shown are the piles of cleared brush and trees separating the area
immediately adjacent to the outlet structure from the bulk of the northerly
ponded area in the background, essentially a dead zone.
Dredging Operation
35. Field sampling for this study was conducted on August 10 and 11,
1988. During this period, the dredge was operating between stations 137 and
140, in the Turkey Bend Channel. This is only 700 ft from the end of the bend
and about 16,000 ft from the disposal area. A construction materials firm is
on the west bank at this point, and sand, shells, gravel, and cement from
their operations had washed into the channel over the past 15 years. The com-
bination of very heavy sediments and long pipeline length caused serious prob-
lems for the dredge. The pipeline plugged several times, but finally, an
operational adjustment in which the cutterhead was raised every minute or so
to pump clear water for a minute before lowering it again was adopted, and
this allowed the dredge to proceed slowly. However, this method of operation
resulted in much lower than normal average slurry concentrations (about
13 g/L versus 100 to 150 g/L normally), and the hydraulic resistance of the
long pipeline resulted in lower than normal velocities (about 5 to 10 fps ver-
sus 12 to 18 fps normally).
20

PART IV: FIELD SAMPLING AND TESTING
36. This part of the report describes sampling and laboratory testing
to predict effluent quality at the confined disposal site used for the field
evaluation in this study. Part IV also documents the actual influent and
effluent quality for comparison. Samples of sediment and water were collected
and used to conduct modified elutriate and column settling tests. Results
were used to predict both dissolved and total concentrations of contaminants
in the effluent. Samples of the influent and effluent were tested, and the
laboratory predictions are compared with measured field data in Part V.
37. Because this project was conducted for research purposes and to
help validate the predictive procedures, all sampling and data collection was
done at one time for the sake of simplicity and economy. Thus, "predictions"
were not made until after the actual field data were collected. In routine
operational use of this prediction technique, two field sampling operations
would be necessary. The first would be for collection of water and sediment
samples for the laboratory column settling test and the modified elutriate
test prior to dredging. Then, after the data from these tests were used to
make the predictions of effluent quality (perhaps leading to modification of
the disposal area design), the dredging project would begin. Then, a second
field sampling operation would be conducted to check the predictions and moni-
tor compliance with discharge permits.
Dye Tracer Study
38. A dye tracer study was initiated at the same time as was sampling
of the influent to the disposal area in order to provide an estimate of mean
retention time, so sampling of the effluent could be lagged behind influent
sampling by approximately that same length of time. In that manner, approxi-
mately the same parcel of water would be sampled, first at the influent, then
at the effluent after it had been subjected to "treatment" in the disposal
area (sedimentation, adsorption by plants, etc.).
39. Approximately 20 gal of Rhodamine WT florescent dye (20 percent
solution, by weight in water) was poured into the swift, narrow stream leading
away from the influent pipe at 0930 hr on August 10. Total injection time was
21
less than 5 min, and proper mixing was obtained because of the turbulent flow
near the inlet.
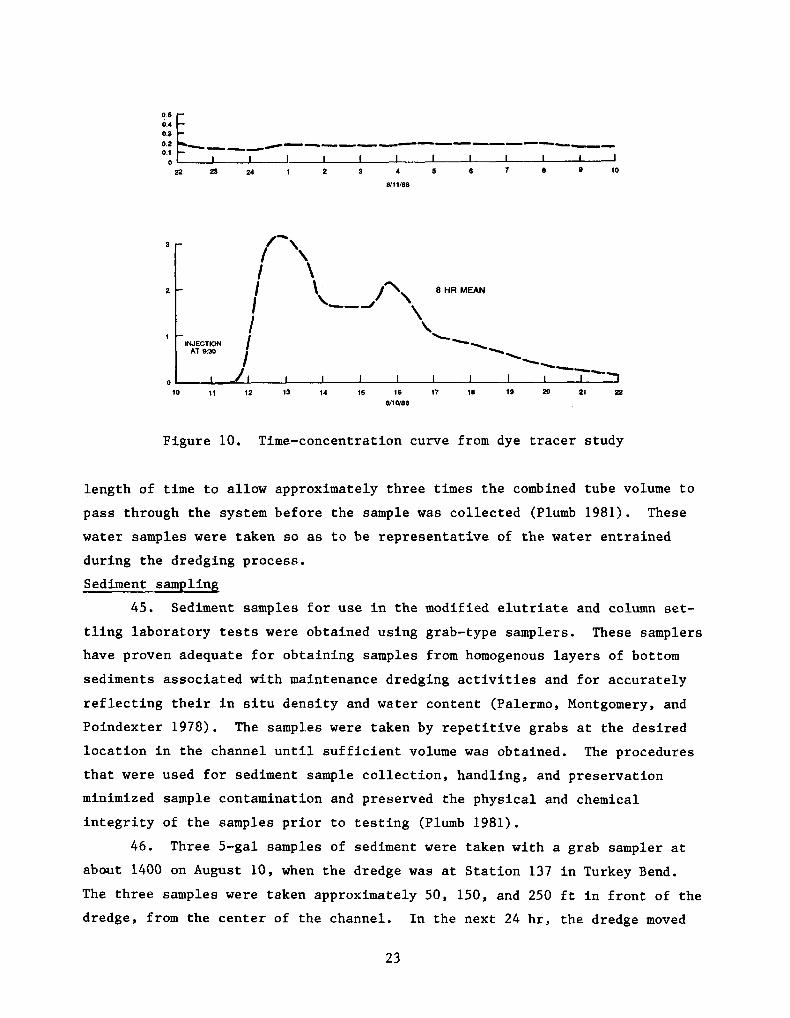
40. Grab samples were taken approximately every half hour at the end of
the discharge pipe from the weir box and analyzed within 15 min on a Turner
Model 10 fluorometer. The results were plotted as a time-concentration (T-C)
curve as the sampling proceeded. The concentration rose sharply at about
2.5 hr, peaked at 3.5 hr, and then declined slowly until about 8 hr, after
which it dropped rapidly. The T-C curve is shown in Figure 10. As the T-C
curve was being plotted, the mean retention time was estimated at about 10 hr,
so effluent sampling was initiated at 1900 hr on August 10. The mean field
retention time calculated from the centroid of the entire plotted part of the
curve was approximately 8 hr. The actual mean retention time was probably
slightly more, because the dye concentration had not quite returned to back-
ground at the termination of the test.
41. This shape of curve is indicative of extreme short-circuiting
caused by a relatively direct flow path between inlet and outlet, with large
amounts of dead zones off the main flow path. This behavior is consistent
with the physical description of the site given earlier and observed behavior
of the dye cloud.
42. The mean field retention time of 8 hr was calculated prior to con-
ducting the modified elutriate tests described in Part II so that the esti-
mated retention time could be used in setting the laboratory retention time
for the tests. The 8-hr field mean retention time was used along with the
column settling test results in estimating the effluent suspended solids
concentrations.
Dredging Site Sediment and Water Sampling
43. The purpose of sediment and water sampling at the dredging site was
to obtain adequate quantities of material for sediment characterization and
for conducting the laboratory tests required for prediction of effluent
quality.
Water sampling
44. Water samples for use in the laboratory tests were obtained using a
positive displacement pump , with the intake within 1 m of the sediment-water
interface. Care was taken to run the pumping apparatus for a sufficient
22
1 INJECTION
AT 930
Figure 10. Time-concentration curve from dye tracer study
length of time to allow approximately three times the combined tube volume to
pass through the system before the sample was collected (Plumb 1981). These
water samples were taken so as to be representative of the water entrained
during the dredging process.
Sediment sampling
45. Sediment samples for use in the modified elutriate and column set-
tling laboratory tests were obtained using grab-type samplers. These samplers
have proven adequate for obtaining samples from homogenous layers of bottom
sediments associated with maintenance dredging activities and for accurately
reflecting their in situ density and water content (Palermo, Montgomery, and
Poindexter 1978). The samples were taken by repetitive grabs at the desired
location in the channel until sufficient volume was obtained. The procedures
that were used for sediment sample collection, handling, and preservation
minimized sample contamination and preserved the physical and chemical
integrity of the samples prior to testing (Plumb 1981).
46. Three 5-gal samples of sediment were taken with a grab sampler at
about 1400 on August 10, when the dredge was at Station 137 in Turkey Bend.
The three samples were taken approximately 50, 150, and 250 ft in front of the
dredge, from the center of the channel. In the next 24 hr, the dredge moved
23
250 ft, covering the area sampled, so the samples were representative of the
material placed in the disposal site during the field sampling. Dredging site
water samples were also collected at the same time.
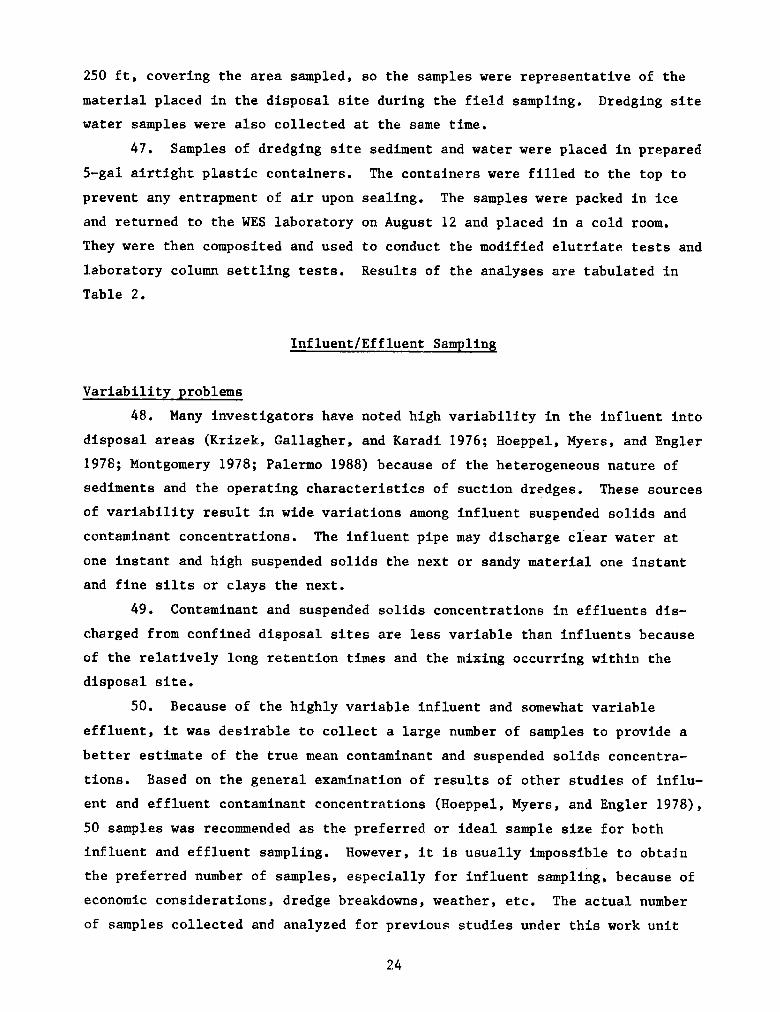
47. Samples of dredging site sediment and water were placed in prepared
5-gal airtight plastic containers. The containers were filled to the top to
prevent any entrapment of air upon sealing. The samples were packed in ice
and returned to the WES laboratory on August 12 and placed in a cold room.
They were then cornposited and used to conduct the modified elutriate tests and
laboratory column settling tests. Results of the analyses are tabulated in
Table 2.
Influent/Effluent Sampling
Variability problems
48. Many investigators have noted high variability in the influent into
disposal areas (Krizek, Gallagher, and Karadi 1976; Hoeppel, Myers, and Engler
1978; Montgomery 1978; Palermo 1988) because of the heterogeneous nature of
sediments and the operating characteristics of suction dredges. These sources
of variability result in wide variations among influent suspended solids and
contaminant concentrations. The influent pipe may discharge clear water at
one instant and high suspended solids the next or sandy material one instant
and fine silts or clays the next.
49. Contaminant and suspended solids concentrations in effluents dis-
charged from confined disposal sites are less variable than influents because
of the relatively long retention times and the mixing occurring within the
disposal site.
50. Because of the highly variable influent and somewhat variable
effluent, it was desirable to collect a large number of samples to provide a
better estimate of the true mean contaminant and suspended solids concentra-
tions. Based on the general examination of results of other studies of influ-
ent and effluent contaminant concentrations (Hoeppel, Myers, and Engler 1978),
50 samples was recommended as the preferred or ideal sample size for both
influent and effluent sampling. However, it is usually impossible to obtain
the preferred number of samples, especially for influent sampling, because of
economic considerations, dredge breakdowns, weather, etc. The actual number
of samples collected and analyzed for previous studies under this work unit
24
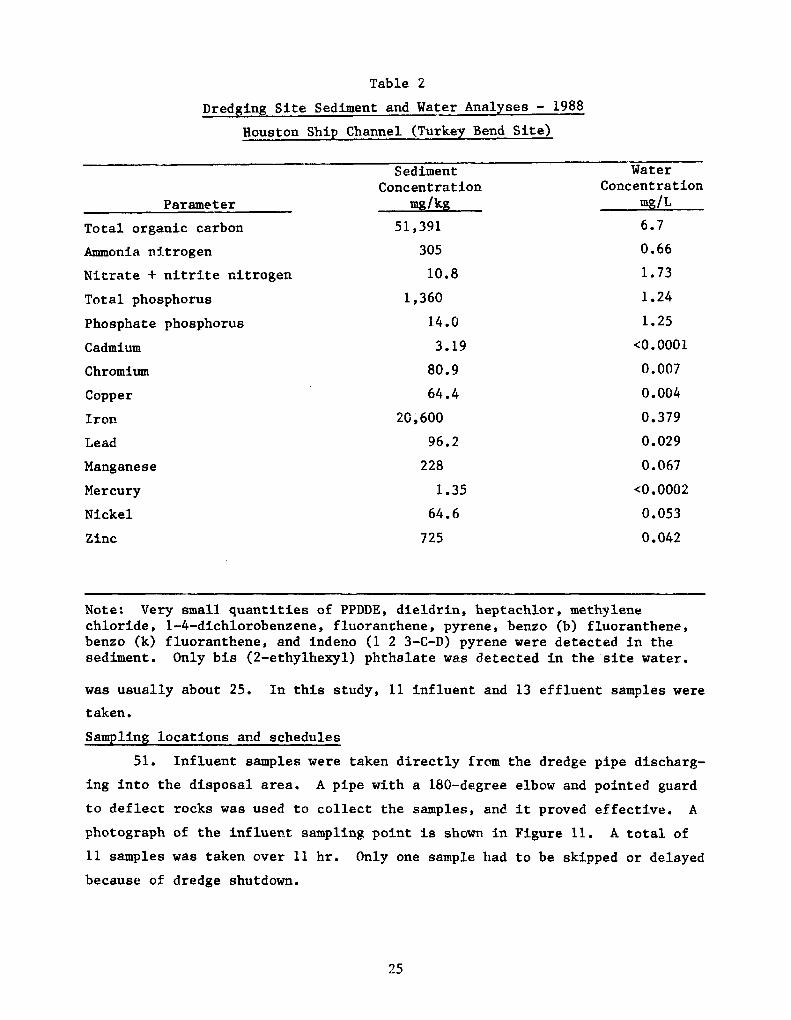
Table 2
Dredging Site Sediment and Water Analyses - 1988
Houston Ship Channel (Turkey Bend Site)
Parameter Total organic carbon
Ammonia nitrogen
Nitrate + nitrite nitrogen
Total phosphorus
Phosphate phosphorus
Cadmium
Chromium
Copper
Iron
Lead
Manganese
Mercury
Nickel
Zinc
Sediment .Water Concentration Concentration
m&g w/L
51,391 6.7
305 0.66
10.8 1.73
1,360 1.24
14.0 1.25
3.19 ~0.0001
80.9 0.007
64.4 0.004
20,600 0.379
96.2 0.029
228 0.067
1.35 <0.0002
64.6 0.053
725 0.042
Note: Very small quantities of PPDDE, dieldrin, heptachlor, methylena chloride, 1-4-dichlorobenzene, fluoranthene, pyrene, benzo (b) fluoranthene, benzo (k) fluoranthene, and indeno (1 2 3-C-D) pyrene were detected in the sediment. Only bis (2-ethylhexyl) phthalate was detected in the site water.
was usually about 25. In this study, 11 influent and 13 effluent samples were
taken.
Sampling locations and schedules
51. Influent samples were taken directly from the dredge pipe discharg-
ing into the disposal area. A pipe with a 180-degree elbow and pointed guard
to deflect rocks was used to collect the samples, and it proved effective. A
photograph of the influent sampling point is shown in Figure 11. A total of
11 samples was taken over 11 hr. Only one sample had to be skipped or delayed
because of dredge shutdown.
25
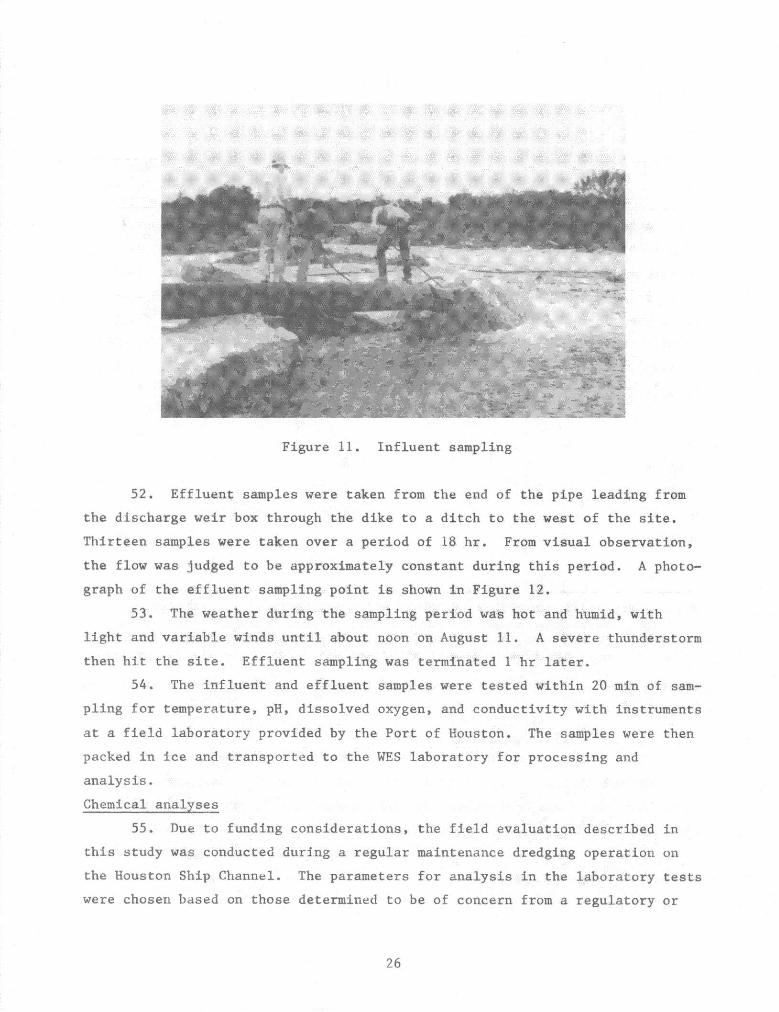
Figure 11. Influent sampling
52. Effluent samples were taken from the end of the pipe leading from
the discharge weir box through the dike to a ditch to the west of the site.
Thirteen samples were taken over a period of 1S hr. From visual observation,
the flow was judged to be approximately constant during this period. A photo-
graph of the effluent sampling point is shown in Figure 12.
53. The weather during the sampling period was hot and humid, with
light and variable winds until about noon on August 11. A severe thunderstorm
then hjt the site. Effluent sampling was terminated 1 hr later.
54. The influent and effluent samples were tested within 20 min of sam-
pling for temperature, pH, dissolved oxygen, and conductivity with instruments
at a field laboratory provided by the Port of Houston. The samples were then
packed in ice and transported to the WES laboratory for processing and
analysis.
Chemical analyses
55. Due to funding considerations, the field evaluation described in
this study was conducted during a regular maintenance dredging operation on
the Houston Ship Channel. The parameters for analysis in the laboratory tests
were chosen based on those determined to be of concern from a regulatory or
26
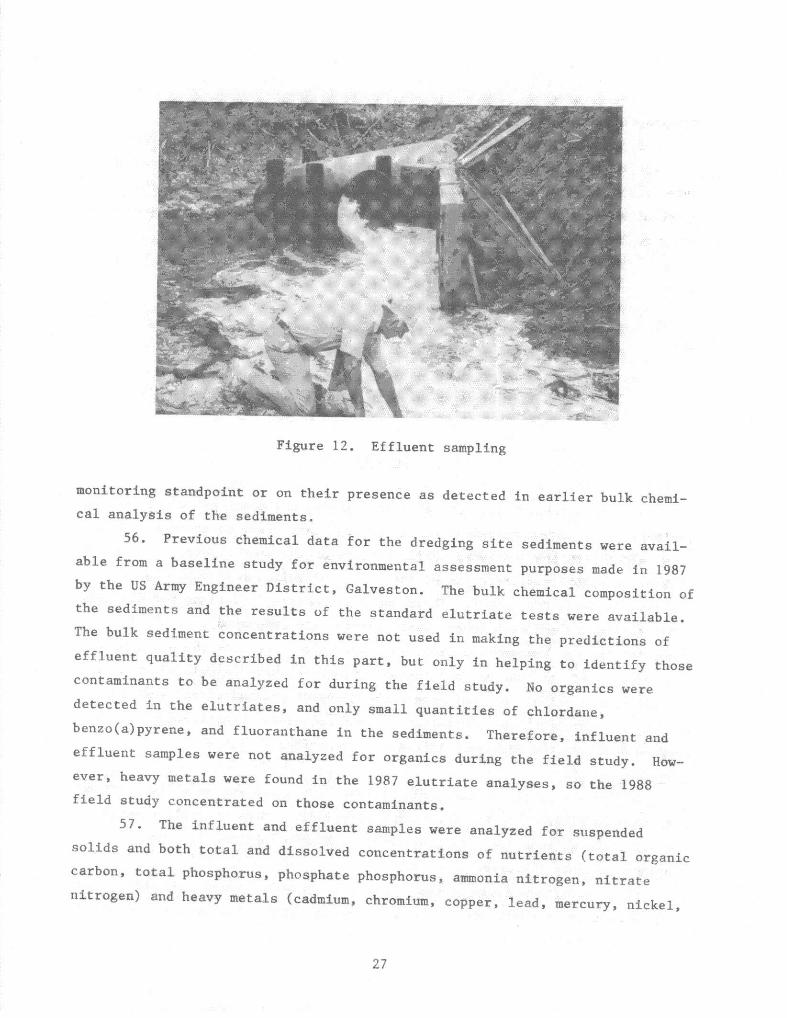
Figure 12. Effluent sampling
monitoring standpoint or on their presence as detected in earlier bulk chemi-
cal analysis of the sediments.
56. Previous chemical data for the dredging site sediments were avail-
able from a baseline study for environmental assessment purposes made in 1987
by the US Army Engineer District, Galveston. The bulk chemical composition of the sediments and the resulrs of the standard elutriate tests were available.
The bulk sediment concentrations were not used in making the predictions of
effluent quality described in this part , but only in helping to identify those contaminants to be analyzed for during the field study. No organic6 were detected in the elurriates, and only small quantities of chlordane,
benzo(a)pyrene, and fluoranthane in the sediments, Therefore, influent and effluent samples were not analyzed for organics during the field study. How- ever, heavy metals were found in the 1987 elutriate analyses, so the 1988 field study concentrated on those contaminants.
57, The influent and effluent samples were analyzed for suspended
solids and both total and dissolved concentrations of nutrients (total organic
carbon, total phosphorus, phosphate phosphorus, ammonia nitrogen, nitrate nitrogen) and heavy metals (cadmium, chromium , copper, lead, mercury, nickel,
27

zinc, iron, manganese). The dissolved subsample was obtained by filtering the
samples through a 0.45-urn membrane filter.
58. Total concentrations of contaminants were determined for both
influent and effluent at each site. This made possible the calculation of
retention percentage of contaminants. Retention of contaminants within the
disposal area was determined from the influent and effluent concentrations by
Equation 3
R= lCinfl - ['effl
[Cinfl (100)
where
R= retention in percent
[Cinfl = total concentration in influent, mg/L
ICeffl = total concentration in effluent, mg/L
(3)
Results
59. For each influent and effluent sample, the total and dissolved con-
centrations of each measured parameter (contaminant) were determined. These
data, along with the suspended solids content of the sample, were used to cal-
culate the contaminant fraction of the suspended solids for contaminants in
each sample using Equation 1. The means and standard deviations for all mea-
sured parameters and each contaminant fraction are tabulated in Table 3. The
means for the contaminant fractions were not calculated from the means of the
suspended solids and contaminant concentrations but were calculated by averag-
ing all of the calculated contaminant fractions of the individual samples.
Results for the dissolved concentrations and calculated fractions in the total
suspended solids for each containment are summarized in Table 3.
Suspended solids
60. Plots of the influent and effluent suspended solids concentrations
are shown in Figure 13. The influent concentrations were typically highly
variable, though much lower than typical, because of the peculiar operating
procedure used by the dredge.
61. The effluent concentrations were relatively steady and low, typical
of an effective disposal area. The mean concentration of suspended solids in
28
Table
3
Mea
ns
and
Stan
dard
D
evia
tions
fo
r To
tal
and
Diss
olve
d C
once
ntra
tions
of
Para
met
ers
and
Frac
tions
in
th
e To
tal
Susp
ende
d
Solid
s,
Eous
ton
Ship
C
hann
el
Para
met
er
Tota
l su
spen
ded
solid
s
Con
duct
ivity
, w
ahos
/cm
Diss
olve
d ox
ygen
PR
Tota
l or
gani
c ca
rbon
Amm
onia
nitro
gen
Nitr
ate
+ ni
trite
ni
troge
n
Tota
l ph
osph
orus
Phos
phat
e ph
osph
orus
Cadm
ium
Chro
mium
Cop
per
Iron
Lead
Man
gane
se
Mer
cury
Nick
el
Zinc
Tota
l C
once
ntra
tion,
la
g/L
Influ
ent
Efflu
ent
Mea
n St
d D
ev
Mea
n St
d D
ev
13,5
73
10,3
62
55.2
14
Rete
ntio
n Ef
ficie
ncy
Perc
ent
99.6
Diss
olve
d Fr
actio
n of
To
tals
Con
cent
ratio
n Su
spen
ded
Solid
s W
idL
s&kg
SS
Ef
fluen
t Ef
fluen
t He
an
Std
Dev
M
ean
Std
Dev
-
- y
-- --
14,5
00
9.00
0 --
--
--
0.8
7.25
14.5
--
--
--
-- --
6.7
7 7.8
13.6
1.
5 6.
2 12
.4
--
3 21
,744
--
55.6
56.3
7
9.25
6.
77
0.78
0.
281
25.8
3.
224
--
23.2
6.
754
38,4
32
118.
415.
22
--
23.1
0.
72
--
--
24.8
21.2
17.4
1.
31
0.99
0.19
5 94
.7
95.3
0.78
9,
848
0.12
0.21
1
0.20
1 4,
797
4.65
8.37
3,60
9.37
0.08
7 0.
0652
0.
0002
6 0.
0004
99
.7
0.00
018
0.00
01
4 11
.05
1.86
1.
40
0.00
7 0.
002
99.6
0.
0039
0.
001
59
43.9
3
1.46
1.
14
0.00
48
0.00
1 99
.7
0.00
1 0.
001
70
26.6
6
300
237.
9 1.
36
0.19
5 99
.5
co.0
3 0
24,4
64
4,05
1.66
16
10.5
6 0.
0086
0.
007
99.9
0.
0036
0.
004
92
142.
53
5.11
2.
97
0.49
0.
029
90.4
0.
42
0.11
4 1,
015
2,09
2.59
0.02
5 0.
0015
~0
.000
2 0
>99
<0.0
002
0 0
0
1.10
0.
789
0.00
85
0.00
1 99
.3
0.01
85
0.01
2 0
0
13.9
10
.68
0.04
2 0.
01
99.7
0.
018
0.01
5 30
6 24
9.71

9 10 11 12 13 (4 15 18 17 18 19 20 2, 22
TIME. WR (AUG 10. ,999)
19 21 23 , 3 5 7 8 1, 13
TIME. HR (AUG 10-11. 1986)
Figure 13. Total suspended solids variation
the influent was 13,570 mg/L, and the mean concentration in the effluent was
55 mg/L. This represents a good retention efficiency of 99,6 percent.
Conductivity
62. The mean influent conductivity was 14,500 pmhos/cm, and the mean
effluent value was 9,000 pmhos/cm. Both were very consistent. The mean
influent salinity was 8.2 ppt, about 25 percent the value of seawater, and the
mean effluent value was 5.1 ppt. There is no present explanation for the
effluent being significantly less saline than the influent, unless the
disposal area was full of less saline water when the testing began. However,
the effluent salinity fell slightly as the study proceeded, just the opposite
of what one would expect to result from this explanation.
30

Dissolved oxygen
63. The mean influent dissolved oxygen (DO) was 0.8 x&L, and only 2 of
11 values were over 1.0 mg/L. They were associated with the two lowest values
of suspended solids. The median value was 0.5 mg/L.
64. The mean effluent DO was 7.0 mg/L, with little variation. TO indi-
cate whether a significant portion of the dissolved oxygen entered the water
during its fall over the weir and flow through the outlet pipe (the DO was
measured at the exit from the pipe) , the oxygen content was measured once at
several places at one time during the first day of sampling. The oxygen con-
tent of the water in the disposal area directly outside the weir box was
4.7 mg/L; that inside the weir box was 5.8 mg/L; and that at the end of the
weir box discharge pipe was 6.3 mg/L. This indicates that, while a signifi-
cant part of the effluent DO entered the water during its flow though the out-
let structure (approximately 25 percent), the water in the disposal area
itself was also well oxygenated.
PH 65. The mean pH of the influent was 7.25, with little variation. The
mean pH of the effluent was 7.8, with slightly higher values during the first
day and slightly lower values during the night and second day. This data pat-
tern may indicate a slight amount of algal activity. This was also visually
indicated by the fact that the water in the disposal area near the outlet
structures had a green tint.
Nutrients
66. The mean total organic carbon (TOC) content of the influent was
14.5 mg/L, and the mean value of the effluent was 13.6 mg/L, indicating little
removal. Most TOC in the influent was in the dissolved form (86 percent) and
presumably not subject to removal by sedimentation. Also, some soluble TOC
was probably ffushed from the swampy vegetated area by water flow through the
disposal area, and a small amount could have been produced by algae growing in
the disposal area.
67. The mean ammonia nitrogen content rose from 9.25 mg/L to 25.8 mg/L,
indicating that some organic nitrogen was being partially degraded during its
residence in the disposal area or that soluble ammonia nitrogen was being
flushed-out of the vegetated area. The mean value of nitrate plus nitrite
nitrogen was reduced only from 0.78 mg/L to 0.60 mg/L. Both of these values
are low, and nitrates are relatively unimportant in this situation.
31

68. The mean concentration of total phosphorus was reduced from
24.8 mg/L in the influent to 1.31 mg/L in the effluent (a 94.7-percent reduc-
tion), indicating good reduction but not nearly as great as the reduction in
suspended solids (99.6 percent). This indicates that, while most of the phos-
phorus is associated with the suspended solids and is removed along with them,
there is a significant amount in the dissolved form (0.78 mg/L in the efflu-
ent) or associated with the colloidal solids in the effluent that passed
through the 0.45um filter and was reported as dissolved. The pattern for
phosphate phosphorus was very similar.
Heavy metals
69. All heavy metals were removed efficiently in the disposal area.
All experienced removals of over 90 percent, and all except manganese experi-
enced removals of over 99 percent. These data indicate that most heavy
metals, except manganese, are closely associated with the suspended solids and
are removed in a percentage closely approximating the percentage removal for
suspended solids. Except for manganese, the heavy metals tested for were
removed at percentages varying from 99.3 percent for nickel to 99.9 percent
for lead, compared to 99.6 percent for total suspended solids.
32

PART V: PREDICTION OF CONTAMINANT CONCENTRATIONS
Results of Laboratory Tests
Modified elutriate tests
70. Three replicates of the modified elutriate test described in
Part II were performed on sediment and water mixtures taken from the dredging
site prior to dredging as described in Part IV. The sediment and water were
mixed to a concentration of 13,500 mg/L, approximately the mean influent
suspended solids concentration determined during the field study. The set-
tling time was set at 8 hr, the mean retention time determined by the dye
tracer test.
71. The three tests produced suspended solids concentrations of 83, 46,
and 34 mg/L after 8 hr. The supernatant was analyzed for both dissolved and
total concentrations of each contaminant according to the procedure outlined
in Part II. The data resulting from the modified elutriate tests are tabu-
lated in Table 4. The mean dissolved concentration found in the laboratory is
the predicted dissolved concentration for the field. Each total concentration
was used, along with its value of suspended solids , to calculate the contami-
nant fraction according to Equation 1.
72. To calculate the predicted total concentration of each contaminant
according to Equation 2, the mean contaminant fraction was then multiplied by
the predicted value of effluent suspended solids determined from the labora-
tory column settling test and the recommended settling efficiency factor, as
described in Part II. The laboratory column settling test is described in
paragraph 73.
Laboratory column settling test
73. A laboratory column settling test was performed according to the
procedures outlined in Part II. The initial slurry concentration was set at
13,500 mg/L, approximately the mean influent suspended solids concentration
determined during the field study.
74. The plot of mean supernatant suspended solids versus time is shown
in Figure 14. At 8 hr, the mean retention time determined by the dye tracer
test, the concentration was approximately 100 mg/L. This value was multiplied
by the recommended settling efficiency adjustment factor of 1.5 from Table 1,
because the ponded depth of the main body of water near the weir was greater
33
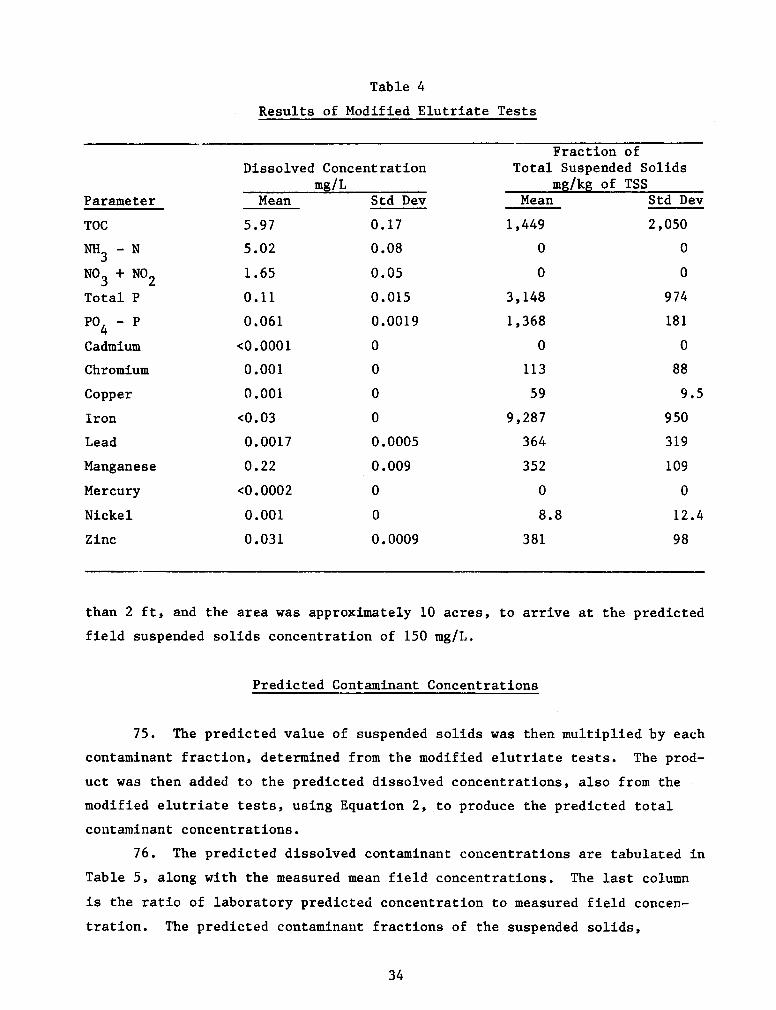
Table 4
Results of Modified Elutriate Tests
Dissolved Concentration Fraction of
Total Suspended Solids
Parameter mg/L mg/kg of TSS
Mean Std Dev Mean Std Dev
TOC 5.97 0.17 1,449 2,050
NH3 - N 5.02 0.08 0 0
NO3 + NO2 1.65 0.05 0 0
Total P 0.11 0.015 3,148 974
PO4 - P 0.061 0.0019 1,368 181
Cadmium ~0.0001 0 0 0
Chromium 0.001 0 113 88
Copper 0.001 0 59 9.5
Iron co.03 0 9,287 950
Lead 0.0017 0.0005 364 319
Manganese 0.22 0.009 352 109
Mercury <0.0002 0 0 0
Nickel 0.001 0 8.8 12.4
Zinc 0.031 0.0009 381 98
than 2 ft, and the area was approximately 10 acres, to arrive at the predicted
field suspended solids concentration of 150 mg/L.
Predicted Contaminant Concentrations
75. The predicted value of suspended solids was then multiplied by each
contaminant fraction, determined from the modified elutriate tests. The prod-
uct was then added to the predicted dissolved concentrations, also from the
modified elutriate tests, using Equation 2, to produce the predicted total
contaminant concentrations.
76. The predicted dissolved contaminant concentrations are tabulated in
Table 5, along with the measured mean field concentrations. The last column
is the ratio of laboratory predicted concentration to measured field concen-
tration. The predicted contaminant fractions of the suspended solids,
34

0 w 100 200
TIME. HRS
Figure 14. Plot of supernatant suspended solids in Houston Settling Test
determined in the modified elutriate test, are compared to the field-measured
contaminant fractions in Table 6.
77. The predicted total contaminant concentrations are tabulated in
Table 7, along with the measured mean field concentrations. Also included are
the ratios of laboratory predicted concentrations to measured mean field
concentrations.
35

Table 5
Mean Measured and Predicted Dissolved Contaminants
Parameter
TOC
NH3 - N
NO3 + NO2
Total P
PO4 - P
Cadmium
Chromium
Copper
Iron
Lead
Manganese
Mercury
Nickel
Zinc
Mean Measured Mean Lab Field Predicted
Concentration Concentration IQ/L mg/L
12.4 6.0
Ratio of Predicted
to Measured
0.5
23.2 5.0 0.2
0.72 1.6 2.2
0.78 0.11 0.1
0.72 0.06 0.1
0.00018 <0.0001 0.5
0.0039 0.001 0.3
0.001 <O.OOl 1.0
eo.03 <0.03 1.0
0.0036 0.0017 0.5
0.42 0.225 0.5
<0.0002 <0.0002 1.0
0.0185 <O.OOl 0.1
0.018 0.03 1.7
Note : Mean ratio 0.7 Median ratio 0.5 9/14 ratios below 1.0; 4/5 nutrients, 5/9 metals 5/14 ratios equal to or greater than 1.0 8/14 ratios between 0.5 and 2.0 9/14 ratios between 0.33 and 3.0
36

Table 6
Mean Measured and Predicted Contaminant Fractions
Parameter
TOC
NH3 - N
NO3 + NO2
Total P
PO4 - P
Cadmium
Chromium
Copper
Iron
Lead
Manganese
Mercury
Nickel
Zinc
Mean Measured Mean Lab Field Fraction Predicted Fraction
mgk mg/kg
21,745 1,449
38,432 0
0 0
9,848 3,148
4,797 1,368
4 0
59 113
70 59
24,464 9,287
92 364
1,015 352
0 0
0 9
305 381
Ratio of Predicted
to Measured
0.1
0.0
1.0
0.3
0.3
0.0
1.9
0.8
0.4
4.0
0.3
1.0
1.2
Note:
Mean ratio (omitting Ni) 0.9 Median ratio 0.4 8/14 ratios below 1.0; 4/5 nutrj.ents; 4/9 metals 6/14 ratios equal to or greater than 1.0; l/5 nutrients; 5/9 metals
6/14 ratios between 0.5 and 2.0 8/14 ratios between 0.33 and 3.0
37
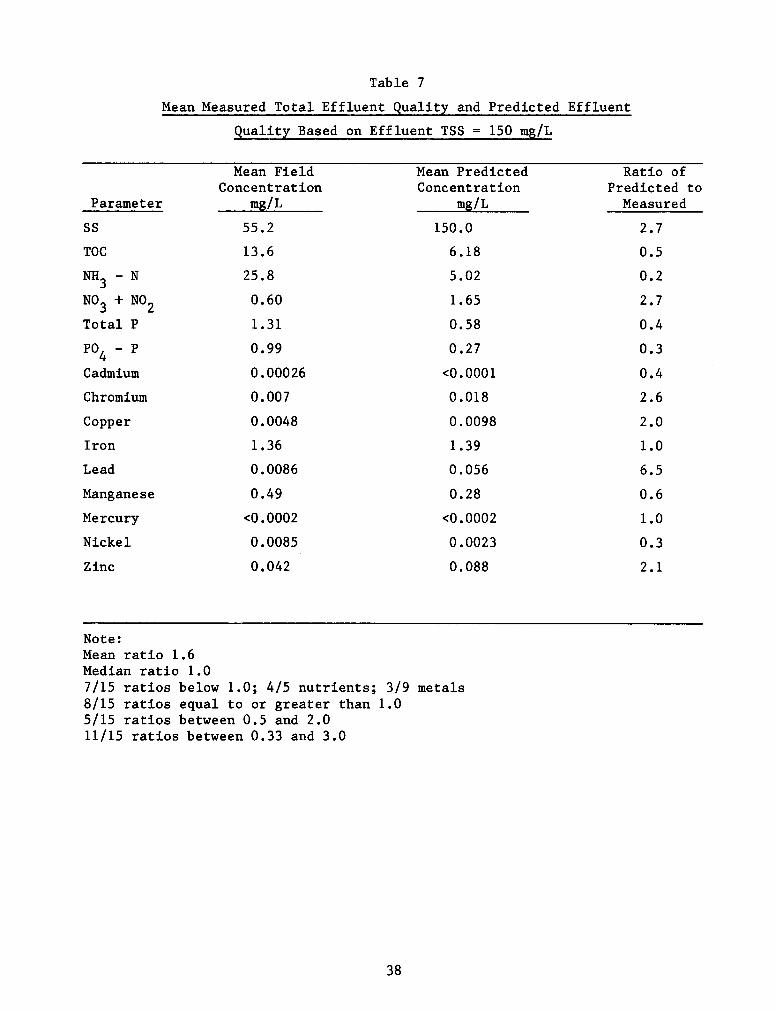
Table 7
Mean Measured Total Effluent Quality and Predicted Effluent
Quality Based on Effluent TSS = 150 mg/L
Parameter
ss
TOC
NH3 - N
NO3 + NO2
Total P
PO4 - P
Cadmium
Chromium
Copper
Iron
Lead
Manganese
Mercury
Nickel
Zinc
Mean Field Mean Predicted Ratio of Concentration Concentration Predicted to
q/L mg/L Measured
55.2 150.0 2.7
13.6 6.18 0.5
25.8 5.02 0.2
0.60 1.65 2.7
1.31 0.58 0.4
0.99 0.27 0.3
0.00026 ~0.0001 0.4
0.007 0.018 2.6
0.0048 0.0098 2.0
1.36 1.39 1.0
0.0086 0.056 6.5
0.49 0.28 0.6
~0.0002 <0.0002 1.0
0.0085 0.0023 0.3
0.042 0.088 2.1
Note: Mean ratio 1.6 Median ratio 1.0 7/15 ratios below 1.0; 4/5 nutrients; 3/9 metals 8/15 ratios equal to or greater than 1.0 5/15 ratios between 0.5 and 2.0 11/15 ratios between 0.33 and 3.0
38

PART VI: DISCUSSION OF RESULTS
78. The data in Tables 5 through 7 show that the recommended method for
predicting contaminant concentrations in the effluent from dredged material
containment areas did a fair job from an overall standpoint, but individual
predictions varied widely in accuracy. Both dissolved concentrations and con-
taminant fractions of nutrients were underpredicted, except for nitrates.
Dissolved concentrations of heavy metals were either very accurate or under-
predicted, while contaminant fractions predictions were quite variable. Pre-
dictions of total concentrations of heavy metals were quite variable, but the
mean ratio of predicted to measured concentrations was near 1.0.
79. Some of the large deviation in ratios of laboratory predicted con-
centrations to measured field concentrations and contaminant fractions can be
easily explained by the peculiar conditions at this site or by particular cir-
cumstances having to do with the analytical results, but others cannot be
explained by the available data.
Nutrients
80. Total organic carbon and ammonia nitrogen concentrations were both
underpredicted, in spite of the suspended solids concentrations being overpre-
dieted. Almost all of both nutrients were in the dissolved form, so the error
in laboratory predicted contaminant fractions did not strongly influence the
predicted total concentration. The effluent dissolved concentrations of these
nutrients were so much higher than predicted probably because large quantities
of dissolved and fine colloidal material already in the disposal area (in the
swampy vegetated areas) were washed out by the flow of water through the area.
Although contaminant fractions were widely underpredicted, an examination of
the actual concentrations shows that they were quite large, with relatively
small differences between total and dissolved concentrations. Therefore,
small errors or inaccuracies in either could cause large changes in calculated
contaminant fractions. The large overprediction of nitrate concentrations
could be due to reduction and uptake of soluble nitrates by the large amount
of veg&ation in the disposal area. In addition, the original soils in the
swampy vegetated area very likely remained anaerobic, at least in some areas,
and nitrates in the water over these areas could have diffused into these
39

organic anaerobic sediments and been reduced to nitrogen gas. Because these
sediments were not present in the modified elutriate test, this process was
not simulated in the laboratory. Both of these processes would have lowered
the effluent nitrate concentrations, leading to overprediction.
81. Both dissolved concentrations and contaminant fractions of phos-
phorus measured in the field were much greater than predicted, especially the
dissolved concentrations. Almost all phosphorus was in the form of phosphate,
usually tightly bound to solids. However, effluent data show that 60 percent
of the total phosphorus and 73 percent of the phosphate was in the dissolved
form. The tentative conclusion is that much of this phosphate is in fact
adsorbed on fine colloidal particles that passed through the 0.45~urn filter
used to produce the dissolved subsample and is not truly in the dissolved
form.
82. Although the effluent suspended solids concentration was somewhat
lower than predicted, if much of the actual effluent suspended solids were in
the form of very fine colloids with a low mass but high specific surface, this
would explain the large errors in phosphorus predictions. These extremely
fine colloids are the size particles that settle much more poorly in the field
than in the lab column, where the quiescent conditions are much more conducive
to colloidal flocculation and settling. Larger particles making up the bulk
of the weight of suspended solids settle well in both environments, but the
fine colloids settle better in the laboratory column. Previous data from
other sites (Palermo and Thackston 1988b) also reveal that phosphorus concen-
trations and contaminant fractions were consistently underpredicted.
Heavy Metals
83. The recommended prediction method did a very good job of predicting
heavy metal dissolved concentrations, contaminant fractions, and total concen-
trations. Ratios of laboratory predicted to measured field concentrations of
dissolved metals ranged from 0.5 to 1.0, except for chromium at 0.3, nickel at
0.1, and zinc at 1.7. All dissolved concentrations were extremely small, and
most were close to the detection limit, so precision was not great, and large
changes in ratios could result from small errors in analysis.
84. Contaminant fractions of metals were somewhat more variable in
accuracy, but the mean ratio was 0.9, not counting that for nickel, which was
40

infinity (or indeterminate). The ratio for cadmium was zero, but the measured
field contaminant fraction of 4 mg/kg is extremely small and is based on posi-
tive tests for cadmium in only 2 of 13 effluent samples. The measured field
contaminant fraction for nickel of zero is based on the fact that effluent
concentrations of total nickel were each slightly smaller than the dissolved
concentrations. Both were quite low, however, so this anomaly can be attrib-
uted to analytical error.
85. The dissolved concentrations of heavy metals are probably of more
importance, because dissolved metals are more readily bioavailable to aquatic
plants and animals. Those associated with solids are more likely to settle to
the bottom and again be incorporated into sediments, then to be covered by
later sediments, sealing them off from most aquatic life. Although dissolved
concentrations of heavy metals were slightly underpredicted in this study,
this pattern is not consistently present in earlier data (Palermo and
Thackston 1988b), so no change in methodology seems warranted.
41

PART VII: CONCLUSIONS
86. The recommended method for predicting contaminant concentrations in
effluent from dredged material containment areas has been shown again to pro-
vide generally accurate predictions. Mean ratios of laboratory predicted to
measured field concentrations were near 1.0. Although some predictions were
not exact and some ratios were quite different from 1.0, some instances are
due to the particular local circumstances of this study, and others are based
on extremely small concentrations and, therefore, perhaps imprecise analyses.
In these later cases, concentrations of contaminants discharged are so small
they are negligible in most cases.
87. More research is needed to fully define relationships between con-
taminant concentrations and size distribution of particles. This would help
explain some inconsistencies in predictions, especially those relating to
nutrients, and perhaps lead to improvements in methods and more accurate and
more consistent predictions. In the meantime, only one consistent underpre-
diction has been identified as a result of the current procedure. Both in
these and previous results, it has been noted that predicted concentrations of
dissolved phosphate and total dissolved phosphorus are underpredicted by a
factor of 4.0, possibly due to the fact that much colloidal phosphorus (mea-
sured as dissolved phosphorus) appears in the field effluents but not in the
modified elutriate test because of better settling of fine colloids in the
laboratory test. With that exception, it can be concluded that this study
furnished further verification of the validity, accuracy, and usefulness of
the predictive method, especially when the highly unusual local conditions are
considered.
42

REFERENCES
American Public Health Association. 1981. Standard Methods for the Examina- tion of Water and Wastewater, 15th ed., American Water Works Association,
Control Federation, Washington, DC. Water Pollution (
Gambrell, R. P., Khalid, R. A., and Patrick, W. H., Jr. 1976 (Jan). 'Physico-Chemical Parameters that Regulate Mobilization and Immobilization of Toxic Heavy Metals," Proceedings, American Society of Civil Engineers Spe- cialty Conference on Dredging and its Environmental Effects, Mobile, AL.
Hoeppel, R. E., Myers, T. E., and Engler, R. M. 1978. 'Physical and Chemical Characterization of Dredged Material Influents and Effluents in Confined Land Disposal Areas," Technical Report D-78-24, US Army Engineer Waterways Experi- ment Station, Vicksburg, MS.
Krizek, R. J., Gallagher, B. J., and Karadi, G. N. 1976. "Water Quality Effects of a Dredging Disposal Area,' Journal, Environmental Engineering Divi- sion, American Society of Civil Engineers, Vol EEZ.
Montgomery, R. L. 1978. 'Methodology for Design of Fine-Grained Dredged Material Containment Areas for Solids Retention," Technical Report D-78-56, US Army Engineer Waterways Experiment Station, Vicksburg, MS.
Montgomery, R. L., Thackston, E. L., and Parker, F. E. 1983 (Apr). "Dredged Material Sedimentation Basin Design,' Journal of Environmental Engineering, American Society of Civil Engineers, Vol 109.
Palermo, M. R. 1985. "Interim Guidance for Predicting Quality of Effluent Discharged from Confined Dredged Material Disposal Areas,' Environmental Effects of Dredging Technical Notes EEDP-04-l through 04-4, US Army Engineer Waterways Experiment Station, Vicksburg, MS.
. 1986a. 'Interim Guidance for Predicting the Quality of Effluent from Confined Dredged Material Disposal Areas," Miscellaneous Paper D-86-1, US Army Engineer Waterways Experiment Station, Vicksburg, MS.
. 1986b. 'Development of a Modified Elutriate Test for Predicting the Quality of Effluent from Confined Dredged Material Disposal Areas,' Tech- nical Report D-86-4, US Army Engineer Waterways Experiment Station, Vicksburg, MS.
1988. 'Field Evaluation of the Quality of Effluent from Confined Dredged Maierial Disposal Areas," Technical Report DS-88-1, US Army Engineer Waterways Experiment Station, Vicksburg, MS.
Palermo, M. R., Montgomery, R. L., and Poindexter, M. 1978. "Guidelines for Designing, Operating, and Managing Dredged Material Containment Areas,' Tech- nical Report DS-78-10, US Army Engineer Waterways Experiment Station, Vicksburg, MS.
Palermo, M. R., and Thackston, E. L. 1988a (Dee). Effluent Quality,"
"Test for Dredged Material Journal of Environmental Engineering, American Society of
Civil Engineers, Vol 114.
43
1988b (Dee). Effluent Qiality,"
"Verification of Predictions of Dredged Material Journal of Environmental Engineering, American Society of
Civil Engineers, Vol 114.
. 1988c (Aug). "Flocculent Settling Above Zone Settling Inter- face," Journal of Environmental Engineering, American Society of Civil Engineers, Vol 114.
Plumb, R. H. 1981. "Procedures for Handling and Chemical Analysis of Sedi- ment and Water Samples," EPA/CE Technical Committee on Criteria for Dredged and Fill Material, US Army Engineer Waterways Experiment Station, Vicksburg, MS.
Poindexter, M. E., and Perrier, E. R. 1980. 'Hydraulic Efficiency of Dredged Material Impoundments: A Field Evaluation,' Proceedings, American Society of Civil Engineers Symposium on Surface Water Impoundments, Minneapolis, MN.
Thackston, E. L., Shields, F. D., Jr., and Schroeder, P. R. 1987 (Dee). 'Residence Time Distributions of Shallow Basins,' Journal of Environmental Engineering, American Society of Civil Engineers, Vol 113.
44

APPENDIX A: PLOTS OF INFLUENT AND EFFLUENT CONTAMINANT CONCENTRATIONS
Plots of influent and effluent dissolved and total concentrations and
contaminant fractions are reproduced on microfiche in the back cover of this
report.
Al

APPENDIX B: SUMMARY OF PLOTS OF MODIFIED ELUTRIATE AND EFFLUENT CONTAMINANT CONCENTRATIONS
Summary plots of modified elutriate and effluent contaminant
concentrations are reproduced on microfiche in the back cover of this report.
Bl

Unclassified IfCURlTY CLASSIFICATION OF THIS PAGE
16. SUPPLEMENTARY NOTATION (Continued).
Available from National Technical Information Service, 5285 Port Royal Road, Springfield, VA 22161. Plots of influent and effluent dissolved and total concentrations and contaminant fractions and summary plots of modified elutriate and effluent contaminant concentrations are reproduced on microfiche in the back cover of this report.
Unclassified
SECURITY CLASSIFICATION OF THIS PAGE