Design trends and expectations for 2014 - Hay Group webinar jan 14 2014.pdf · Enterprise Sales...
22
Enterprise Sales Effectiveness Webinar Design trends and expectations for 2014 JANUARY 2014 MARC WALLACE & AMANDA WETHINGTON
Transcript of Design trends and expectations for 2014 - Hay Group webinar jan 14 2014.pdf · Enterprise Sales...
Enterprise Sales Effectiveness Webinar Design trends and expectations for 2014
JANUARY 2014 MARC WALLACE & AMANDA WETHINGTON

2 © 2014 Hay Group. All rights reserved
Agenda
2013 Sales Plan Design & Practices Survey
Sales Effectiveness Insights
Expectations for 2014
Q & A
1
2
3
4

2013 Sales Plan Design & Practices Survey
4 © 2014 Hay Group. All rights reserved
Hay Group sales survey
Our 2013 Sales Compensation, Plan
Design & Practices survey
More than 400 organizations in the overall database
259 organizations submitted plan design information

5 © 2014 Hay Group. All rights reserved
Plan design by role
Plan design
Position
Percent offering
performance-based
bonus
Percent offering
commission
Sales Director 48% 40%
Sales Manager 81% 57%
Key Account Manager 71% 49%
Business Developer 54% 46%
Sales Representative 71% 74%
Account Manager 56% 49%
Inside Sales 45% 55%

6 © 2014 Hay Group. All rights reserved
Elasticity
Level
Pay performance matrix
Median value Average Range (low) Range (high)
Threshold
Performance 80% 73% 10% 99%
Threshold
Payout 50% 45% 0% 96%
Maximum
Performance 150% 155% 100% 300%
Maximum
payout 200% 200% 100% 1000%
The table below outlines the typical pay for performance elasticity.

7 © 2014 Hay Group. All rights reserved
Plan components & measures
Plan Components –
Performance level Prevalence
Individual 78%
Business Unit / Division 23%
District / Region 11%
Country 21%
Corporate / Global 22%
Team 15%
Other 5%
Most Common
Measures Prevalence
Revenue / Growth 71%
Profit / Profit Growth 58%
Units Sold 22%
Market Share 9%
Acct Rec / DRO 9%
Objectives 8%
Customer Satisfaction 9%
Discretionary 13%
Other 4%

8 © 2014 Hay Group. All rights reserved
Commission design
Mechanism Prevalence
Straight commission 56%
Commission with a
quota 68%
Other form 12%
Design type Prevalence
Flat design 44%
Accelerating design 51%
Decelerating design 4%
Other 12%

9 © 2014 Hay Group. All rights reserved
Performance results
Design type 2011
Results
2012
Results
2013
Results
Below threshold 11% 13% 15%
Threshold to target 42% 42% 44%
Target to 1.5x target 35% 41% 35%
Maximum 12% 4% 5%

2013 Challenges
11 © 2014 Hay Group. All rights reserved
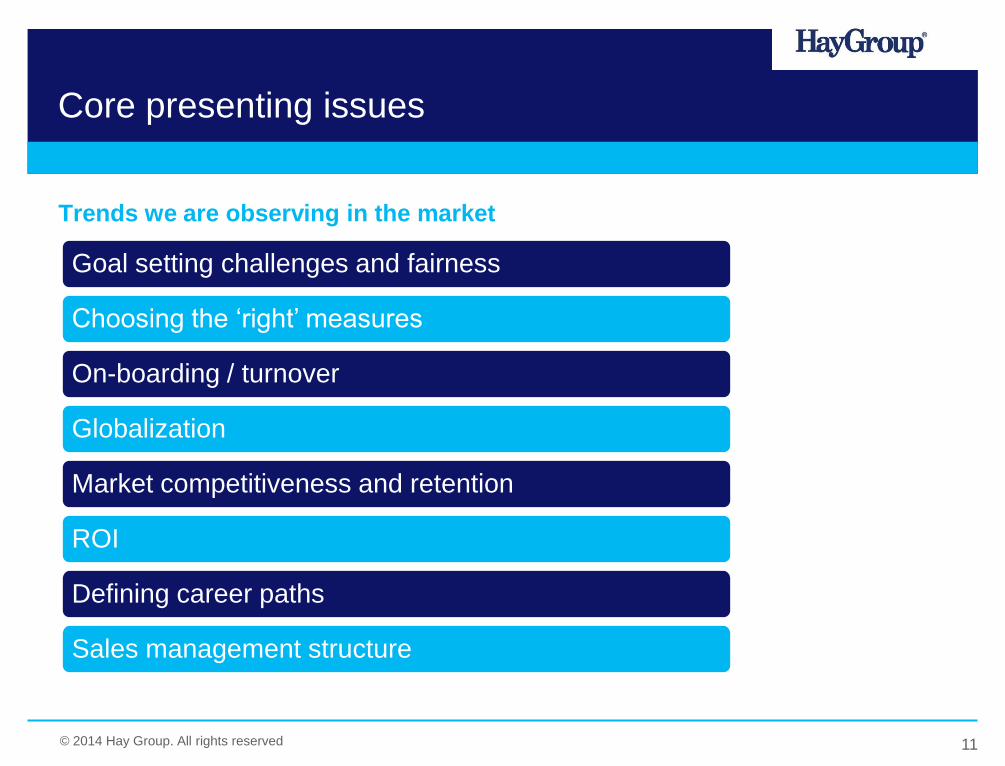
Core presenting issues
Trends we are observing in the market
Goal setting challenges and fairness
Choosing the ‘right’ measures
On-boarding / turnover
Globalization
Market competitiveness and retention
ROI
Defining career paths
Sales management structure

12 © 2014 Hay Group. All rights reserved
CASE STUDY: goal setting
What we did
Leadership felt the current incentive plans did not distinguish top performers from
average ones.
The existing plan structure had a large discretionary component and budgeting for
goals was extremely challenging.
Hay Group evaluated the positions to our sales models, discussed plan options with
leadership.
The result was
We were able to construct an incentive arrangement that recognized annual and
medium-term performance periods.
A Chemicals company sought to create a motivating
incentive plan for its Account managers.

13 © 2014 Hay Group. All rights reserved
CASE STUDY: Choosing the right measures
A large retail company had multiple recognition plans in
place, but were concerned the these legacy plans did garner
focus nor support the desired customer experience in either
the boutiques or factory stores
What we did
Hay Group reviewed the recognition plans and compared to best practice. We established that
there was an opportunity to combine the plans and still reflect volume and margin differences
between different types of stores.
Hay Group developed streamlined plans based on interviews with managers and top performing
associates. We tested these plans against other plans in the retail industry to ensure strategic fit.
The retail practice at Hay Group was able to further identify and implement best practices for all
compensation vehicles, ensuring that the recognition plans were in the appropriate context.
The result was
The organization was able to implement a more impactful, visual and strategically relevant
recognition plan while saving on the spend by 10% to 15%.

14 © 2014 Hay Group. All rights reserved
CASE STUDY: global sales incentive design
A global financial services organization sought to
make its country incentive plans consistent across
regions and further align to its U.S. framework
What we did
Hay Group leveraged our presence in over 40 countries world wide to provide
benchmarking data, then applied best practices based on Enterprise Sales
Effectiveness research.
We conducted a comprehensive survey of plans in similar organizations to understand
practices overall.
We worked with the leadership team to understand how these roles work as a team
and region and to assess the impact each role has on individual performance.
The result was
We identified several plan design options and provided recommendations for moving
forward. Through working sessions, we assisted with finalizing the designs.

15 © 2014 Hay Group. All rights reserved
CASE STUDY: Role analysis
This organization sought to assess the levels of work within
its sales operations function following a centralization of the
various groups to ensure they were fair and consistent to all
employees.
What we did
Employees completed a position description questionnaire to describe their role.
Hay Group met with the managers to learn about the roles within the sales operations
functions.
Using Hay Group’s work measurement methodology, we assigned levels of over 75
unique positions within sales operations.
The result was
A consistent leveling structure within centralized sales operations to assist with
compensation decisions, career path design and organizational development.

16 © 2014 Hay Group. All rights reserved
CASE STUDY: market competitiveness
One organization sought to update their incentive plans to
more deeply support the Sales and Professional Service
groups individually, while also creating alignment and
collaboration across the two groups.
What we did
Hay Group facilitated two onsite roundtable session to understand the current roles,
reviewed the goals and objectives of the organization and developed plan design
frameworks to support the organization’s strategy.
Hay Group assessed the market compensation levels of base salary, total cash, target
incentive percent and pay-mix. We also provided plan design benchmarking data for
the roles using information from our annual sales design survey.
The result was
The result was a greater alignment of the roles within the two groups and across the
incentive plans to drive the desired behaviors in support of the organization strategy.

Expectations for 2014

18 © 2014 Hay Group. All rights reserved
How to approach 2014
Steps for an effective 2014
Communicate plan changes – what stays the same vs. what is different
Determine how you will measure the plan effectiveness
Review the tools in place to hire the most effective people
Support development and leadership training opportunities

19 © 2014 Hay Group. All rights reserved
Sales incentive and effectiveness audit
Attribute Level one questions (triage)
1. Sales strategy Is the sales strategy clear, consistent and well understood?
2. Process Does the sales process meet business objectives and create customer
value?
3. Roles &
competencies
Are sales roles, competency models and job definitions comprehensive and
actionable?
4. Size & structure Is the sales force designed for optimal effectiveness and efficiency?
5. Motivation Are sales people motivated by an appropriate mix of incentives and
rewards?
6. Management Is sales management disciplined and focused on performance?
7. Culture Is the required sales culture defined, cultivated and managed?
8. Implementation Is seamless integration achieved within sales and across functions?

20 © 2014 Hay Group. All rights reserved
Our sales effectiveness framework
Optimal
alignment of
inputs for sales
effectiveness
Sales process &
training
Size, structure &
career paths
Hay Group’s ESE
team advises on
all aspects of
sales
effectiveness.
We make sure an
organization’s
sales strategy is
aligned with its
overall strategy
and is as
effective as
possible

Questions?

22 © 2014 Hay Group. All rights reserved
Let’s talk - Contact our team [email protected] +1.312.228.1816 [email protected] +1.312.228.1853 www.haygroup.com/us/ESE