DESIGN GUIDANCE - stacks.stanford.edu
83
DESIGN GUIDANCE: ASSESSING PROCESS CHALLENGE, STRATEGY, AND EXPLORATION A DISSERTATION SUBMITTED TO THE DEPARTMENT OF CIVIL AND ENVIRONMENTAL ENGINEERING AND THE COMMITTEE ON GRADUATE STUDIES OF STANFORD UNIVERSITY IN PARTIAL FULFILLMENT OF THE REQUIREMENTS FOR THE DEGREE OF DOCTOR OF PHILOSOPHY Caroline Murrie Clevenger June 2010
Transcript of DESIGN GUIDANCE - stacks.stanford.edu

DESIGN GUIDANCE:
ASSESSING PROCESS CHALLENGE, STRATEGY, AND EXPLORATION
A DISSERTATION
SUBMITTED TO THE DEPARTMENT OF
CIVIL AND ENVIRONMENTAL ENGINEERING
AND THE COMMITTEE ON GRADUATE STUDIES
OF STANFORD UNIVERSITY
IN PARTIAL FULFILLMENT OF THE REQUIREMENTS
FOR THE DEGREE OF
DOCTOR OF PHILOSOPHY
Caroline Murrie Clevenger June 2010

http://creativecommons.org/licenses/by-nc/3.0/us/
This dissertation is online at: http://purl.stanford.edu/zd732cs2735
© 2010 by Caroline Murrie Clevenger. All Rights Reserved.
Re-distributed by Stanford University under license with the author.
This work is licensed under a Creative Commons Attribution-Noncommercial 3.0 United States License.
ii

I certify that I have read this dissertation and that, in my opinion, it is fully adequatein scope and quality as a dissertation for the degree of Doctor of Philosophy.
John Haymaker, Primary Adviser
I certify that I have read this dissertation and that, in my opinion, it is fully adequatein scope and quality as a dissertation for the degree of Doctor of Philosophy.
Ronald Howard
I certify that I have read this dissertation and that, in my opinion, it is fully adequatein scope and quality as a dissertation for the degree of Doctor of Philosophy.
John Kunz
I certify that I have read this dissertation and that, in my opinion, it is fully adequatein scope and quality as a dissertation for the degree of Doctor of Philosophy.
James Sweeney
Approved for the Stanford University Committee on Graduate Studies.
Patricia J. Gumport, Vice Provost Graduate Education
This signature page was generated electronically upon submission of this dissertation in electronic format. An original signed hard copy of the signature page is on file inUniversity Archives.
iii

iv
ABSTRACT:
Performance-based design processes are explorations guided by objectives and
analyses of alternatives. Historically, building design teams have relied on precedent-
based strategies to guide limited and informal exploration. Today they use more
advanced strategies to guide more systematic and extensive explorations. We define
design Guidance as the relative impact of strategy on exploration for a given challenge.
As strategies are implemented or proposed, the need arises to measure and compare
the Guidance provided by competing strategies on different challenges to support their
selection and improvement. Design theory lacks precise definition and metrics for design
processes and the Guidance achieved. This research addresses the questions:
How can we measure the Guidance of a design process? More specifically, how can we
assess the challenges addressed, strategies implemented, and explorations executed?
I use building energy-efficiency as the domain of the study. The larger opportunity is to
provide greater Guidance across objectives. Through case studies, I identify the
problem. Through literature review I synthesize a framework and set of metrics. I
develop the Design Exploration Assessment Methodology (DEAM) to support the
comparison of Guidance across design processes. Using laboratory testing with
professional designers, I evaluate explorations afforded by six strategies with respect to
two challenges (renovation and new construction of a mid-rise office building).
Experimental findings suggest to the order of design strategies’ ability to improve
exploration from worst to best is: random guessing, tacit knowledge, point analysis,
combined point and trend analysis, trend analysis alone, and full analysis. These results
question the proposition that more data provide better Guidance. I conclude by adding
process cost to my metrics and assessing the value of information generated by various
strategies relative to challenge.
The contributions of this research are the metrics, DEAM, and the evaluation of design
processes. I provide evidence that Guidance can be quantitatively assessed. I
demonstrate power by measuring and comparing Guidance of strategies on a challenge.
I demonstrate generality across a range of strategies and challenges. Initial findings
show advanced strategies support better exploration and suggest further development of
such strategies. The value of information generated, however, varies. This work
motivates further research to provide greater understanding of the relative value of
individual strategies to specific challenges.

v
ACKNOWLEDGEMENTS
I would like to acknowledge the following organizations and individuals as contributing to
this research: the Center for Integrated Facility Engineering (CIFE), the Precourt Energy
Efficiency Center (PEEC), Benjamin Welle, Andrew Ehrich, Tobias Maile, Peggy Ho,
Victor Gane, Reid Senescu, and Forest Flager, Stanford University; Grant Soremekun,
Phoenix Integration; Surya Swamy, Lumina Decision Systems; General Services
Administration (GSA); Architectural Energy Corporation (AEC); and the Department of
Construction Management, Colorado State University.
I am grateful to the members of my dissertation committee: James L. Sweeny, John C.
Kunz and Ronald A. Howard.
This research was performed in collaboration with my adviser, John R. Haymaker.
Without his Guidance and friendship, it would not have succeeded. I am indebted to and
thankful for this partnership.
Finally, I would like to thank Melia Heimbuck and the rest of my family and friends for
making work worthwhile.

vi
TABLE OF CONTENTS
CHAPTER 1: INTRODUCTION– THE NEED TO MEASURE THE GUIDANCE AFFORDED BY DESIGN STRATEGIES……………………………………………….1-6 CHAPTER 2: METRICS TO ASSESS DESIGN GUIDANCE…………………………1-26 CHAPTER 3: DESIGN EXPLORATION ASSESSMENT METHODOLOGY: TESTING THE GUIDANCE OF DESIGN PROCESSES……………………..............1-21 CHAPTER 4: CALCULATING THE VALUE OF STRATEGY TO CHALLENGE……1-15
CHAPTER 5: CONCLUSION- CONTRIBUTIONS AND FUTURE WORK………..... 1-2

vii
TABLE OF TABLES
CHAPTER 1
CHAPTER 2
TABLE 1: DESIGN PROCESS TERMS
……………………………………………CHAPTER 2, P. 8
TABLE 2: METRICS EVALUATED COMPARING TRADITIONAL PROFESSIONAL DESIGN PROCESSES TO ADVANCED DESIGN PROCESSES IN PURSUIT OF HIGH PERFORMING BUILDING DESIGN.
....…………………….…………………………………………..CHAPTER 2, P. 15
CHAPTER 3
TABLE 1: OPTIONS MODELLED FOR RENOVATION PROJECT, PHOENIX, ARIZONA. ...…………………….…………………………………………..CHAPTER 3, P. 6
TABLE 2: OPTIONS MODELED FOR NEW CONSTRUCTION PROJECT, BURLINGTON VERMONT.
....…………………….…………………………………………..CHAPTER 3, P. 6
TABLE 3: CHALLENGE METRICS EVALUATED FOR RENOVATION AND NEW CONSTRUCTION CHALLENGES.
....…………………….…………………………………………..CHAPTER 3, P. 8
TABLE 4: STRATEGY METRICS EVALUATED FOR SIX STRATEGIES TESTED.
....…………………….…………………………………………..CHAPTER 3, P. 13
TABLE 5: EXPLORATION METRICS EVALUATED FOR THE SIX STRATEGIES AND TWO CHALLENGES TESTED.
....…………………….…………………………………………..CHAPTER 3, P. 15

viii
CHAPTER 4
TABLE 1: PROCESS COST ESTIMATES FOR STRATEGIES
....…………………….…………………………………………..CHAPTER 4, P. 5
TABLE 2: VARIABLES AND THEIR OPTIONS IN A RECTILINEAR OFFICE BUILDING NEW CONSTRUCTION PROJECT.
....…………………….…………………………………………..CHAPTER 4, P. 6
TABLE 3: COMPUTER EXPERIMENT RESULTS SHOWING VARIABLE DOMINANCE IN ENERGY EFFICIENT DECISIONS FOR RECTILINEAR OFFICE BUILDING DESIGN ACROSS CLIMATE TYPES.
....…………………….…………………………………………..CHAPTER 4, P. 7
TABLE 4: CHALLENGE METRICS EVALUATED FOR RECTILINEAR OFFICE BUILDING SHOWING UNIQUE CHALLENGES ACROSS CLIMATE TYPES.
....…………………….…………………………………………..CHAPTER 4, P. 7
TABLE 5: CHALLENGE METRICS EVALUATED FOR A RENOVATION OR NEW CONSTRUCTION OF A RECTILINEAR OFFICE BUILDING.
....…………………….……………………………………………..CHAPTER 4, P. 9
TABLE 6: VALUE OF INFORMATION (VOI) ASSESSED FOR SIX STRATEGIES ACROSS TWO CHALLENGES.
....…………………….…………………………………………...CHAPTER 4, P. 10
CHAPTER 5

ix
TABLE OF FIGURES
CHAPTER 1
FIGURE 1: SURVEY RESULTS OF PROFESSIONALS ASKED TO USE TACIT KNOWLEDGE IN A SIMPLE DESIGN EXPLORATION.
....…………………….…………………………………………..CHAPTER 1, P. 2
FIGURE 2: GRAPHICAL REPRESENTATION OF A PROFESSIONAL EXPLORATION DURING SCHEMATIC DESIGN.
....…………………….…………………………………………..CHAPTER 1, P. 3
FIGURE 3: A SUMMARY OF THE RELATIONSHIPS OF THE CONTRIBUTIONS OF THIS RESEARCH.
....…………………….…………………………………………..CHAPTER 1, P. 4
CHAPTER 2
FIGURE 1: PERFORMANCE-BASED DESIGN FRAMEWORK
....…………………….…………………………………………..CHAPTER 2, P. 5
FIGURE 2: DIAGRAM OF DESIGN PROCESS DIMENSIONS
....…………………….…………………………………………..CHAPTER 2, P. 6
FIGURE 3: VALUE (NPV) AS A FUNCTION OF COMBINATIONS OF WINDOW TYPE, HVAC EFFICIENCY, AND ROOF INSULATION VARIABLES.
....…………………….…………………………………………..CHAPTER 2, P. 9
FIGURE 4: DIAGRAMS DEPICTING MINIMUM AND MAXIMUM DOMINANCE AMONG FIVE VARIABLES.
....…………………….…………………………………………..CHAPTER 2, P. 10
FIGURE 5: GRAPHICAL REPRESENTATION OF A PROFESSIONAL ENERGY MODELING PROCESS.
....…………………….…………………………………………..CHAPTER 2, P. 14
FIGURE 6: GRAPHICAL REPRESENTATION OF ADVANCED ENERGY MODELING PROCESS USING PIDO.
....…………………….…………………………………………..CHAPTER 2, P. 15
x
CHAPTER 3
FIGURE 1: NARRATIVE PROCESS MAP SHOWING THE 6 STEPS IN DESIGN EXPLORATION ASSESSMENT METHODOLOGY (DEAM) APPLIED IN SYNTHETIC EXPERIMENT TO A SINGLE CHALLENGE.
....…………………….……………………………………………CHAPTER 3, P. 4
FIGURE 2: FULL ANALYSIS OF ALTERNATIVES IN RENOVATION AND NEW CONSTRUCTION CHALLENGES ORDERED BY VALUE, NPV ($) PERFORMANCE.
....…………………….……………………………………………CHAPTER 3, P. 7
FIGURE 3: CUSTOM INTERFACE FOR ENERGY EXPLORER, AN INTERACTIVE SOFTWARE TOOL USED BY CHARRETTE PARTICIPANTS TO ANALYZE AND DOCUMENT EXPLORATIONS SUPPORTED BY VARIOUS STRATEGIES.
....…………………….……………………………………………CHAPTER 3, P. 9
FIGURE 4: SAMPLE ENERGY EXPLORER INTERFACE SHOWING A DESIGNER GENERATED NEW CONSTRUCTION ALTERNATIVE USING TACIT KNOWLEDGE.
....…………………….……………………………………………CHAPTER 3, P. 9
FIGURE 5: SAMPLE ENERGY EXPLORER INTERFACE SHOWING A DESIGNER GENERATED NEW CONSTRUCTION ALTERNATIVE WITH INSTANT ACCESS TO VALUE (NPV) POINT DATA.
....…………………….……………………………………………CHAPTER 3, P. 9
FIGURE 6: PROCESS MAP OF ALTERNATIVE GENERATION USING RANDOM GUESSING.
....…………………….……………………………………………CHAPTER 3, P. 10
FIGURE 7: PROCESS MAP OF ALTERNATIVE GENERATION USING DESIGNER TACIT KNOWLEDGE, NO ANALYSIS PROVIDED.
....…………………….……………………………………………CHAPTER 3, P. 11
FIGURE 8: PROCESS MAP OF ALTERNATIVE GENERATION USING POINT NPV DATA.
....…………………….……………………………………………CHAPTER 3, P. 11

xi
FIGURE 9: PROCESS MAP OF ALTERNATIVE GENERATION USING TREND NPV DATA.
....…………………….……………………………………………CHAPTER 3, P. 12
FIGURE 10: PROCESS MAP OF ALTERNATIVE GENERATED USING TREND NPV DATA AND POINT NPV DATA.
....…………………….……………………………………………CHAPTER 3, P. 12
FIGURE 11: PROCESS MAP OF ALTERNATIVE SELECTED BASED ON FULL ANALYSIS OF NPV PERFORMANCE.
....…………………….……………………………………………CHAPTER 3, P. 13
FIGURE 12: GRAPH OF AVERAGE MAXIMUM VALUE (VSM) FOR THE FIRST THREE ALTERNATIVES GENERATED BY ALL PARTICIPANTS USING FOUR DIFFERENT STRATEGIES TESTED (LEFT). DESIGNING NEW ALTERNATIVES (DNA) DIAGRAMS OF 4 EXPLORATIONS EACH CONSISTING OF 10 ALTERNATIVES GENERATED BY ONE DESIGNER USING FOUR DIFFERENT STRATEGIES (RIGHT).
....…………………….……………………………………………CHAPTER 3, P. 18
CHAPTER 4
FIGURE 1: NARRATIVE (HAYMAKER, 2006) PROCESS MAP SHOWING THE INFORMATION FLOW REQUIRED TO EVALUATE THE VALUE OF INFORMATION GENERATED FROM APPLYING A STRATEGY TO A CHALLENGE.
....…………………….……………………………………………CHAPTER 4, P. 9
FIGURE 2: NORMALIZED VALUE OF INFORMATION (VOI) ASSESSED FOR SIX STRATEGIES ACROSS TWO CHALLENGES.
....…………………….……………………………………………CHAPTER 4, P. 10
CHAPTER 5
FIGURE 1: DIAGRAM OUTLINING THE CONTRIBUTIONS OF DISSERTATION.
....…………………….……………………………………………CHAPTER 5, P. 1

Introduction 1
CHAPTER 1: INTRODUCTION– THE NEED TO MEASURE THE GUIDANCE
AFFORDED BY DESIGN STRATEGIES
Arguably, all design is performance-based exploration guided by objectives and analysis
of alternatives. Design Guidance is the relative impact of strategy on exploration for a
given challenge. Historically building design has involved few formally defined objectives
and alternatives, and relied on precedent-based analysis for guidance (Watson &
Perera, 1997). Today, faced with increasing and more complex objectives and
alternatives, Architecture, Engineering and Construction (AEC) teams look to computer
simulation to guide exploration. However, practice today primarily relies on precedent or
point-based analysis to support manual design iteration (Gane & Haymaker, 2007),
(Flager & Haymaker, 2007), (Maile et al., 2007), (Clevenger et al, 2009).
Design challenges facing project teams continue to increase in complexity as industry
demands higher performance (AIA, 2007). Design teams are being asked to balance
multiple, potentially competing objectives (Ross & Hastings, 2005) while sifting through a
potentially vast number of interrelated variables (Clark, J.A., 2001). To address
increasingly complicated challenges, design teams are looking to use more advanced
strategies to define objectives, generate alternatives, analyze performance, and make
decisions. As design processes emerge, consisting of complicated challenges,
advanced strategies, and sophisticated explorations, design teams need a method to
assess the Guidance provided. This research develops, implements and evaluates a
method to effectively measure exploration and compare Guidance in design processes. I
use energy-efficiency as the domain of the study. The larger opportunity is to provide
greater Guidance across a range of objectives. To this end, I address the questions:
How can we measure the Guidance of a design process? More specifically, how can we
measure the challenges designers address, the strategies they implement, and the
explorations they execute?
I began my research by assessing whether the strategy of precedent-based design or
“point-based” performance verification typically provides sufficient Guidance to meet
recent energy performance objectives. To model its effectiveness, I conducted a simple
survey of 46 industry leaders averaging over 15 years of AEC experience on September
11, 2008. The survey tests how well tacit knowledge guides industry experts in a simple
design challenge with the goal of energy efficiency. Among those surveyed were: 13
architects, averaging over 21 years of experience and 4 mechanical engineers,
averaging over 26 years of experience, all working at firms of national prominence. The
participation of experts in the survey is meaningful since they should be the ones with
the ability to recognize underlying principles understood by industry (Cross, N. 2004).
The survey asked each practitioner to do the following (see Figure 1):

Introduction 2
Consider a “typical” two story rectangular 36,000 sf office building in a cold climate; assume an open, flat site. To the best of your ability, rank the following decisions from least to most important in terms of impact on energy savings
Changes to wall construction (example 2’x4’ construction vs. concrete)
Changes to windows area (example small windows vs. large windows)
Changes to glazing properties (example clear vs. spectrally-selective)
Changes in Heating, Ventilation and Air Conditioning (HVAC) system type (example Constant Volume vs. Variable Air Volume)
Changes to building orientation (example rotate the building on site)
Changes to building geometry (example relatively square vs. long and rectangular)
Changes to lighting design (upgrade efficiency for same lighting level)
In preparation, I performed a full analysis of all combinations of decision variables using
an Energy-Plus (Crawley et al, 2001) model. I then ranked the impact of each variable
using industry standard options (i.e., R-11 vs. R-19 insulation). Rank of variable impact
is shown from left to right in Figure 1. Results of the survey are similar across
participants; whether architects or engineers with significant or minimal experience:
using tacit knowledge alone, professionals are generally able to correctly identify the
variable with the most impact (in this case, window area). Professional estimates,
however, quickly deviate from simulation results for variables with lesser impact. After
identifying the variable with the most impact, the mean and standard deviation of
industry professional estimations approaches random guessing regardless of population!
Figure 1: Survey results of professionals asked to use tacit knowledge in a simple design exploration. Each dot shows mean and standard deviation of rank of variable impact on energy efficiency as estimated by participant populations. The blue line represents the mean, and the
grey area represents the standard deviation of random guessing. Results indicate a lack of consistency among industry professionals’ estimates and suggest that precedent-based design
does not provide significant Guidance when seeking energy efficiency.

Introduction 3
These survey results suggest industry professionals have highly inconsistent
assumptions about the variables impacting energy-performance regardless of
experience level, design background, or familiarity with climate. While the survey has a
relatively small sample size, results are consistent with other research that suggests that
professionals lack the tacit understanding necessary to guide energy efficient decision-
making in modern design projects (Papamichael & Protzen, 1993). Researchers
generally agree that building science underlying whole building performance presents a
complex, “wicked problem” with many challenges to modeling and rationalization in both
theory and in practice (Cross & Roozenburg, 1992). Maximizing whole building energy
performance requires understanding and successfully modeling stochastic, dynamic,
continuous event-based systems (Maile, 2007), and human capacity to intuit such
systems are bounded (Papamichael & Protzen, 1993). In conclusion, I observe that
precedent-based design strategies are ill-prepared to meet today’s challenges involving
energy efficiency. The level of complication and variation in challenge (climate,
orientation, building occupancy etc.) undermines the ability of even seasoned
professionals to intuit efficient designs without more advanced strategies to guide them.
I next investigated the design strategy of performance verification or “point-based”
analysis to assess its effectiveness to meet today’s energy efficiency challenges. My
case study documented professional energy analysis performed in 2006 during
schematic design of a 338,880 sf Federal Building with 10 floors and a parking sub-
basement sited in a mixed (hot cold), dry climate at an elevation of 4,220ft. Design
analysis occurred over a period of 27 months. At the beginning of the project, the client
set an annual energy usage target of 55 kBtu/sf/yr. A total of 13 energy simulation runs
were generated during 5 rounds of energy modeling. Figure 2 represents the alternatives
simulated and the associated estimates of annual energy savings (kBTU/sf/yr) with
regard to a professionally generated baseline building.
Figure 2: Graphical representation of a professional exploration during schematic design.
Variables are listed on the right. Alternatives are shown as vertical stacks of specific combinations of options (represented by different colors). Changes to options for each alternative
are shown by adjacent horizontal color changes. Estimated energy savings are shown with the red line. The dashed orange line shows target energy savings. The figure suggests that the
professional energy modeling performed on this project supported a slow, disjointed, unsystematic and relatively ineffective exploration of building performance.
Simulated
Performance
Target
(55 kBTU/sf/yr)
Design Alternatives Generated through Time
Variables
1 2 3 4 5 6 7 8 9 10 11 12 13
Energy Savings

Introduction 4
From this case study, I observe that only 13 out of a possible 12,288 design alternatives
were analyzed (~0.1%). Average iteration time for an energy analysis during the project
was approximately 2.1 months. Design improvements were relatively unsystematic with
only the last two alternatives meeting the performance target. In conclusion, I observe
that the “point-base” verification strategy provided only limited Guidance toward
maximizing energy efficiency. If both precedent-based processes and current practice
“point-base” strategies do not meet expectations, industry requires a new paradigm.
To meet current shortcomings in performance-based design, industry and research are
investigating several strategies. Among them, building optimization (Wetter, 2001;
Christensen et al, 2006), Trade-space analysis (Ross & Hastings, 2005) and Process
Integration Design Optimization (Flager et al, 2009). All strategies have an associated
process cost. However, it is difficult for designers and researchers alike to assess the
Guidance in exploration and ultimate value of such strategies. Specifically, little research
exists to test the Guidance provided by a strategy relative to challenge addressed.
Without such information designers are left to guess which strategy will have the
greatest value and what the payback will be.
A research opportunity emerges to develop a method to measure and compare existing
and emerging performance-based Design Processes. Designers need to be able to
quantitatively characterize challenge, strategy and exploration to facilitate performance-
based design process improvement. Review of literature reveals a lack of consistency in
terms and concepts used in design theory. In this research, I define terms to facilitate
clarity and consistency. I address my research questions in the following three chapters.
Figure 3 illustrates the contributions of and the relationship between of these chapters.
Figure 3: A summary of the relationships and contributions of this research. I synthesize a set of metrics for quantifying Design Processes (Chapter 2), and the Design Exploration Assessment
Methodology (DEAM) (Chapter 3) to support the evaluation and comparison of Guidance afforded. The power and generality of DEAM is demonstrated by the ability to measure the
Exploration enabled by applying six Strategies across two Challenges and to determine the Value of Information generated (Chapter 4).
1. Generate Value Space
2. Assess Challenge
3. Conduct Exploration
4. Assess Strategy
5. Assess Exploration
6. Evaluate Guidance
Objective Space Size, OSS
Alternative Space Interdependence, ASI
Impact Space Complexity, ISC
Objective Space Quality, OSQ
Alternative Space Sampling, ASS
Alternative Space Flexibility, ASF
Value Space Average, VSA
Value Space Range, VSR
Value Space Iterations, VSI
Value Space Dominance, VSD
Value Space Maximum, VSM
Value of InformationProcess Cost, PC
Chapter 2: Metrics
to Assess Design
Guidance
Chapter 3: DEAM-
Testing the Guidance of
Design Processes
Chapter 4: Calculating the
Value of Strategy to
Challenge

Introduction 5
In Chapter 2: Metrics to Assess Design Guidance, I lay the foundation for my research
by precisely establishing definitions and metrics for performance-based Design
Processes. These metrics provide a method for characterizing the challenge, strategy
and exploration embodied. The contribution is the synthesis from literature of a
framework of definitions and metrics to enable systematic and quantitative evaluation of
the Guidance afforded by a given Design Process.
In Chapter 3: Design Exploration Assessment Methodology: Testing the Guidance of
Design Processes, I develop and implement a Design Exploration Assessment
Methodology (DEAM). I present the results of a laboratory experiment where I study the
Explorations performed by professionals who implement six strategies, across two
challenges. I rank the strategies tested according to their ability to guide exploration as
follows: random guessing, tacit knowledge, combined point and trend analysis, point
analysis, and trend analysis alone. The results are surprising: more data does not
always help the designer. I discuss possible explanations, and conclude with a
discussion on the strengths and weaknesses of DEAM.
In Chapter 4: Calculating the Value of Strategy to Challenge, I perform further computer
experimentation to show that design challenges vary non-trivially. I introduce a new
metric for the process cost of strategies. I use empirical data to calculate and compare
the value of information generated by individual strategies across challenges. This work
illustrates that that the optimal selection of strategy varies relative to challenge and
motivates further development of advanced strategies.
AEC today is falling short of its potential to generate high performance designs.
Precedent-based and even point-based strategies prove inadequate. Evolving and
emerging advanced strategies create the need for methods to measure the Guidance
they enable for specific Challenges. This research illuminates the multidimensional
relationships between challenge, strategy and exploration. It provides evidence that
Guidance can be assessed. The power of this research is to demonstrate that DEAM is
an effective method to measure and compare the Guidance provided by various
strategies for energy efficient design. The generality is that DEAM works across various
design challenges and strategies, and is not domain specific. Initial findings support the
development and selection of advanced strategies since they are shown to provide
better Guidance economically. The value of information generated by Strategies,
however, varies across Challenges. This finding makes different strategies more or less
effective relative to the challenge addressed. This research motivates further work to
develop greater understanding of the relationships and relative value of individual
strategies to specific challenges.

Introduction 6
REFERENCES
AIA. (2007). National Association of Counties Adopts AIA Challenge of Carbon Neutral Public Buildings by 2030.
Christensen, C., Anderson, R., Horowitz, S., Courtney, A., Spencer, J. (2006) BEopt™ Software for Building Energy Optimization: Features and Capabilities. NREL/TP-550-39929. Golden, Colo.: National Renewable Energy Laboratory.
Clevenger, C., Haymaker, J., (2009). Framework and Metrics for Assessing the Guidance of Design Processes, The 17th International Conference on Engineering Design, Stanford, California.
Clarke, J. A. (2001). Energy simulation in building design (2 ed.): Butterworth-Heinemann
Crawley, D. B., Lawrie, L. K., Winkelmann, F. C., Buhl, W. F., Huang, Y. J., Pedersen, C. O., et al. (2001). EnergyPlus: creating a new-generation building energy simulation program.
Cross, N. (2004). Expertise in design: an overview. Design Studies, 25(5), 427-441.
Cross, R., & Roozenburg, N. (1992). Modeling the design process in engineering and architecture. Journal of Engineering Design, 3(4).
Dorst, K., & Cross, N. (2001). Creativity in the design process: Co-evolution of problem-solution. Design Studies, 22, 425-437.
Flager, F. and Haymaker, J. (2007). “A Comparison of Multidisciplinary Design, Analysis and Optimization Processes in the Building Construction and Aerospace Industries,” 24th International Conference on Information Technology in Construction, I. Smith (ed.), pp. 625-630.
Flager F, Welle B, Bansal P, Soremekun G, Haymaker J (2009) Multidisciplinary Process Integration and Design Optimization of a Classroom Building, Journal of Information Technology in Construction (ITcon), Vol. 14, pg. 595-612.
Gane, V., and Haymaker, J. (2007). “Conceptual Design of High-rises with Parametric Methods,” Predicting the Future, 25th eCAADe Conference Proceedings, ISBN 978-0-9541183-6-5 Frankfurt, Germany, pp. 293-301.
Gero, J. S. (1996). Creativity, emergence and evolution in design. Knowledge-Based Systems, 9, 435-448.
Maher, M. L., Poon, J., & Boulanger, S. (1996). Formalizing design exploration as co-evolution: A combined gene approach. Advances in Formal Design Methods for CAD.
Maile, T., Fischer, M. & Bazjanac, V., 2007. Building Energy Performance Simulation Tools – a Life-Cycle and Interoperable Perspective. CIFE Working Paper WP
107, Stanford University, 49. Papamichael, & Protzen. (1993). The limits of intelligence in design. Proceedings of the
Focus Symposium on Computer-Assisted Building Design Systems 4th International Symposium on Systems Research, Informatics and Cybernetics.
Ross, A. M., & Hastings, D. E. (2005). The tradespace exploration paradigm. INCOSE 2005 International Symposium.
Shah, J., Vargas-Hernandez, N., & Smith, S. (2003). Metrics for measuring ideation effectiveness. Design Studies, 24(2), 111-134.
Watson, I., & Perera, S. (1997). Case-based design: A review and analysis of building design applications. Journal of Artificial Intelligence for engineering Design, Analysis and Manufacturing AIEDAM, 11(1), 59-87.
Wetter, M. (2001) GenOpt "Generic Optimization Program,” Seventh International
IBPSAConference, Rio de Janeiro, Brazil. (http://www.ibpsa.org/bs_01.htm).

CHAPTER 2 1
METRICS TO ASSESS DESIGN GUIDANCE
Caroline M. Clevenger1, John Haymaker
Stanford University, 450 Serra Mall, Stanford, California, 94305, USA Corresponding author: Caroline Murrie Clevenger, caroline.clevenger@colostate,edu, (970) 491-7963
Heightened sustainability concerns and emerging technologies give building professionals the desire and ability to explore more alternatives for more objectives. As design challenges become more complicated, and as strategies become more advanced, the need and opportunity emerges to measure processes and to compare the guidance afforded. Through literature review and industry observations, we synthesize a comprehensive framework of definitions and metrics. We apply the metrics to two industry case studies to illustrate how they help communicate information about challenges, strategies, and explorations present in the domain of energy efficient design. We measure and compare the guidance provided by applying two strategies to one challenge. The ability to measure guidance marks a valuable first step for prescribing design process improvement.
Keywords: Metrics, Framework, Guidance, Design Space, Multidisciplinary Decision-making, Sustainable Design, Energy, Building
1 Present address: Colorado State University, 1291 W Laurel St., Fort Collins, CO, 80523, USA

CHAPTER 2 2
Managing and reducing the environmental impacts of buildings has become a priority of building stakeholders and the architecture, engineering and construction (AEC) community. For example, the American Institute of Architects (AIA) in the 2030 Challenge (AIA, 2007) and the Federal Government in the Energy Independence and Security Act (FEMP, 2007) both call for zero estimated net annual fossil fuel energy consumption for new building designs by the year 2030. Maximizing energy performance, however, has proven elusive to industry for years. The challenge embodies obstacles common to performance-based design: complex multi-criteria problems can quickly exceed the limits of human cognition and frequently involve trade-offs and interdependences among variables which make it difficult to elicit meaningful design guidance (Papamichael & Protzen, 1993; Ross & Hastings, 2005; Lewis et al.,
2007; Bazjanac, 2008). As project teams today are asked to face the daunting task of identifying transcendent, high performing solutions, the ability to evaluate design strategies becomes increasingly critical. Historically, much of the AEC industry has relied on variously named precedent-based design, experienced-based design or case-based design to help resolve design challenges (Watson & Perera, 1997). In general, precedent-based design is the process of creating a new design by combining and/or adapting previously tested design solutions. It benefits from tacit knowledge, and lessons learned. Many AEC designers today still adopt precedent-based methods to meet programmatic, economic and scheduling requirements (Flager & Haymaker, 2007; Gane & Haymaker, 2008; Haymaker et al, 2008; Clevenger & Haymaker, 2009). Using precedent to meet building performance objectives, however, has proven to be less than satisfactory with regard to energy efficiency, and little reason exists to assume that it will be any more effective in addressing the recently proposed, extremely aggressive energy performance goals. Research has shown that professionals generally lack the tacit understanding necessary to guide energy efficient decision-making in a typical design project (Papamichael et al., 1998). Building science underlying whole building performance embodies complex and “wicked problems,” and that human capacity to intuit such systems is bounded (Papamichael & Protzen, 1993). Maximizing energy performance, for example, requires understanding stochastic, dynamic, continuous event-based systems (Bazjanac, 2006). To date in the face of such complexity, the primary use of energy models in professional practice has been for performance verification of individual design alternatives. Computer simulation softwares that estimate the energy performance of buildings were introduced with some success in the 1970‟s (LBNL, 1982). While actual energy performance data frequently fails to meet operational design intent (Clark, 2001; Bazjanac, 2006; Kunz et al., 2009), this paper intentionally disregards potential impacts of sub-par construction or operational practices on building performance. In addition, the fidelity of individual energy modeling tools or modeling practices is not investigated. Rather, this research seeks to study and measure the effectiveness of distinct design strategies assuming available or emerging simulation tools are sound. Of promise, design strategies incorporating building information modeling (BIM), parametric modeling and advanced analysis techniques such as optimization and sensitivity analysis are expanding by orders of magnitude the number of alternatives it is possible to analyze within a reasonable amount of time (Wetter, 2001; Burry, 2003; Whitehead, 2003; Gane & Haymaker, 2007; Eastman et al, 2008; Flager et al, 2009). As innovative design processes emerge and result in new and powerful explorations, design teams need a method to assess the guidance provided.

CHAPTER 2 3
We propose to define design Guidance as the relative impact of Strategy on Exploration for a given Challenge (Figure 2). This research seeks to gain traction in answering the question:
How much guidance does a design strategy provide?
To answer this question, a designer needs to clearly delineate performance-based Design Processes in terms of the Challenges faced, the Strategies applied, and the Exploration achieved. A comparison across processes will enable assessment of relative guidance.
1 DESIGN THEORY
Review of literature describing design process reveals a lack of consistency in both terms and concepts. (Takeda et al, 1990) identify three model types for design process: descriptive, cognitive and computable. Love‟s review of nearly 400 texts showed a range of definitions for „design‟ or „design process‟ that are unique and insufficiently specific. He concludes that these important core concepts are indeterminate in Design Theory (Love, 2002). Design Theory and Design Research, in general, are vast fields with application(s) to a broad spectrum of disciplines due to the wide pervasiveness of design practice. For the purpose of this research, we focus on theory related to architectural design processes, frequently referred to as Design Methodology. A high degree of variability remains even for the terminology used within the field of Design Methodology. Cross‟s review of major historical developments in Design Methodology, observes a forty-year cycle in the characterization of the nature of design, oscillating between design as discipline and design as science (Cross, 2001). Eckert & Clark (2005) identify three classification schemes from literature in the field: staged based vs. activity-based models, solution-oriented vs. problem oriented literature, abstract vs. procedural vs. analytical approaches. Specific terminology within Design Methodology lacks precision. For example, Design Space, Problem Space, Solution Space, and Trade-space are all terms used in literature. However, „the set of all possible design options‟ called „Design Space‟ by Shah (2003), is called „Trade Space‟ by Ross & Hastings (2005). Conversely, Woodbury and Burrow (2006) state that Design Space is limited to „designs that are visited in an exploration process,‟ excluding unexplored options, in apparent disagreement with the previous definitions. Still other research emphasizes the dynamic rather than set nature of design spaces, stating that co-evolution or redefinition of spaces may, in fact, be the foundation of creativity (Gero, 1996; Maher et al., 1996; Dorst & Cross, 2001). Within Design Methodology numerous frameworks exist relating design variables. Approaches include fuzzy-logic (Ciftcioglu et al., 1998), set-based design (Simpson et al., 1998), and hierarchical systems (Wang & Liu, 2006). In this research, we take performance-based design to be an iterative cycle of objective identification, alternatives generation, impact analysis, and value assignment to maximize value. We do not distinguish a hierarchy among variables, nor do we consider uncertainty. In order to improve any process, it is first necessary to be able to measure it. Metrics have generally proven elusive for design processes (Brian et al., 1994; Bashir & Thompson, 1997). Researchers have proposed such metrics as quantity, variety, quality,

CHAPTER 2 4
and novelty to represent how well a design method explores Design Space (Shah et al., 2003); and flexibility, robustness, and survivability as characteristics of design strategy (McManus et al., 2007). Another researcher proposes design knowledge and design freedom to measure design process flexibility (Simpson et al., 1996). Still another proposes signal-to-noise ratios in design variables as the basis for evaluating robustness of a design challenge (Phadke & Taguchi, 1987). Review of existing metrics, however, reveals a lack of a complete set of metrics capable of full quantification of the three dimensions of Design Process. Literature provides numerous partial metrics for design Exploration, Strategy and Challenge. We observe that existing metrics address the nature of Challenge least well. Mathematical characterizations based on algorithm efficiency are used to evaluate analysis techniques, but limited research comprehensively compares Strategies. Finally, very limited data exist to compare professional design explorations since parallel Design Processes are rarely performed. In conclusion, significant research exists in Design Methodology, which provides preliminary description and characterization of Design Process. However, a lack of consistency exists across literature. Striving for clear communication, we begin our research by precisely defining the terms and relationships to explicitly characterize and measure performance-based design.
2 PERFORMANCE-BASED DESIGN DEFINITIONS
In his discussion of Design Research, Dorst (2008) proposes that explanatory frameworks can be used to prescribe improvement to practice. Here we develop a framework consisting of components and spaces to delineate clear and distinct elements and relationships for our Design Process metric definitions.
2.1 COMPONENTS
We aggregate and adapt the following definitions for the components of performance-based design. We present these definitions in reverse order to the framework diagrammed in Figure 1 to emphasize their cumulative nature. Examples of these terms are called out in the right column of Figure 1. Real-world examples are provided in the case study presented later in the paper. We use capitalization throughout this paper to indicate explicit reference to our definitions.
Stakeholder: Party with a stake in the selection of Alternatives. Preference: Weight assigned to a Goal by a Stakeholder (Payne et al., 1999;
Haymaker & Chachere, 2006). Goal: Declaration of intended properties of design solution(s) (Lamsweerde, 2001). Constraint: Limit placed on either an Option or an Impact.
Objective: the union of Stakeholders, Preferences, Goals and Constraints. Variable: A decision to be made. Frequently discrete, a Variable can also be
continuous (i.e., building length). Option: Individual Variable input(s). Alternative: Unique combination of Options. Impact: Alternative‟s estimated performance according to a specified Goal.
Estimates range from relatively quick and simple to elaborate and detailed and may or may not be easily quantifiable (Earl et al., 2005).
Value: Net performance of an Alternative as a function of Impact and Stakeholder
Preferences relative to all Goals (see Equation 1).

CHAPTER 2 5
In Figure 1, we diagram a framework to graphically illustrate the relationship of these components to one another. This framework builds upon previous research developing frameworks for design (Akin, 2001; McManus et al., 2007; Chachere & Haymaker, 2008.)
Figure 1: Performance-based Design Framework: Process Map for Components using the Design Process in Express-G Notation (ISO, 2004) The framework delineates design spaces (left) to illustrate the basic relationships between components of Performance-based Design (middle). Specific instances of these components are listed (right).
2.2 DESIGN SPACES
Building on the components, we define the following spaces illustrated in the left column of Figure 1. `
Objective Space { S, G, P, C }: Set of Stakeholders, Goals, Preferences and Constraints of a Challenge. Goals, Preferences and Constraints are inter-related since weights and acceptable ranges of performance can never be completely separated (Earl et al., 2005).
Alternative Space { A, uA }: All feasible Alternatives for a given Challenge.
Alternative Space includes both explored and unexplored Alternatives (Tate & Nordlund, 1998). It is sufficiently vast that it can be thought of effectively unbounded relative to designer‟s time and reasoning ability (Kotonya & Sommerville, 1997).
Example
Stakeholder
Constraint
Preference
Option
Alternative
Value
Objective Space
Alternative Space
Impact Space
Value Space
Impact
[1:?]
[?:?]
[?:1]
[1:?][1:?]
[1:?]
{ S, P, G, C}
{A, uA}
{I, uI}
{V}
Design Space Component and Relationship
Stakeholder: Owner
Goal: Minimize Energy
Preference: Moderate
Constraints: 1) Maximum Energy Usage: 55 kBtu/sf/yr2) Maximum First Cost: $ 2M
Variables; Options Window Type; Single Pane, Double Pane, Low-E Exterior Shading; Shade, No Shade
Energy Impact: Alternative 1) 50 kBtu/sf/yrAlternative 2) 54 kBtu/sf/yr
Value:Alternative 1) $ 2.4M NPVAlternative 2) $ 2.3M NPV
[?:1]
Variable[?:?]
Cost Impact:Alternative 1) $ 1.95MAlternative 2) $ 1.92M
Alternative 1) Single Pane, No Shade
Alternative 2) Single Pane, Shade
Component Flow of information[1:1]
[1:?]
1 of 1
1 of many
Goal[1:1]
[?:?]

CHAPTER 2 6
Impact Space { I, uI }: All analyzed Impacts for Alternatives relative to Goals, whether acceptable or unacceptable.
Value Space { V }: Values generated during an exploration. Individual Value is a
function of an Alternative‟s Impact and Stakeholder Preference relative to the Goal(s) evaluated.
2.3 PROCESS DIMENSIONS
Based on the components and spaces of design we characterize Design Process according to the following dimensions.
Challenge: A set of decisions to be made regarding Variables ranging from simple to complex.
Strategy: Set of steps used to generate the basis for decisions regarding Variables ranging from no steps (none) to an advanced sequence.
Exploration: A history of decisions made regarding Variables ranging from random to guided.
Guidance: Relative impact of a Strategy on Exploration for a given Challenge. Design Process: Implementation of a Strategy resulting in an Exploration for a given
Challenge. Figure 2 graphically illustrates the defined dimensions characterizing Design Process. We use these dimensions throughout related research to support the evaluation and comparison of Guidance (Clevenger et al., 2010b Table 3-5) and Value of Information (Clevenger & Haymaker, 2010c, Figure 1.)
Figure 2: Diagram of Design Process dimensions. Each axis represents a spectrum ranging from low to high levels of advancement, complication, and guidance for Strategy, Challenge and Exploration respectively. Based on these assessments it is possible to evaluate the level of Guidance afforded. The authors develop precise metrics based on performance-based design components (Figure 1) to assess each dimension.
Exp
lora
tio
n
Design Process
Design Guidance

CHAPTER 2 7
3 MEASURING DESIGN PROCESS
We use our defined components, design spaces and process dimensions to organize and develop Design Process metrics. Most metrics are normalized from 0 to 1 and, with a few noted exceptions, are intended to be maximized.
3.1 QUESTIONS MOTIVATING METRICS
The following questions motivate our metrics. Grounded in literature, these questions are organized according to Design Process dimensions and span performance-based design spaces. In the next section we individually address each of these questions by developing a corresponding numeric measure.
DESIGN PROCESS CHALLENGE
1) How many Objectives are included in the Challenge and how clearly are they defined? Designers need to assess the quantity and quality of project Objectives
(Chachere & Haymaker 2009). 2) To what extent do Objectives interact? Other researchers have noted that
performance Goals can be in competition (Ross, 2003; McManus et al., 2007). Designers need to understand the extent to which trade-offs exist when assessing the complexity of a Challenge. 3) To what extent do decisions interact? Building science is not a system of independent variables to be sub-optimized. (Deru & Torcellini, 2004; Wang & Liu, 2006; Bazjanac, 2008). Designers need a measure of the interactive effects between Variables when assessing Challenge. 4) What is the relative impact of each decision? Research has shown the important role
of screening and sensitivity analyses (Kleijnen, 1997.) Designers need a measure of the extent to which the Impact caused by any one or pair of Variables dominates Value.
DESIGN PROCESS STRATEGY
5) Of the Goals identified, what Goals does the design Strategy consider? Performance
Goals are fundamental to performance-based design, and previous research lays the groundwork for defining and assessing the completeness of the goals analyzed (Gero, 1990; Ross, 2003; Edvardsson & Hansson, 2005; Chachere & Haymaker 2009). 6) What Alternatives does the design Strategy consider? Discrete Alternatives have
been long considered the building-blocks of design (Gero, 1990; Smith & Eppinger,1997). Emerging automated and parametric modeling techniques test the boundaries of “discrete” design Alternatives (Gane & Haymaker, 2008; Hudson, 2009). Research predominantly supports the hypothesis that generating more Alternatives increase the chance of high performance (Akin, 2001; Ïpek et al., 2006). Designers need to understand the size and substance of the Alternative Space. 7) How diverse are the investigated Alternatives? Many researchers have written about
the role of creativity in design (Akin & Lin, 1995; J.S. Gero, 1996; Dorst & Cross, 2001;

CHAPTER 2 8
Shah et al., 2003). Designers need to assess the diversity of combinations of Options used to generate Alternatives in an Exploration.
DESIGN PROCESS EXPLORATION
8) What is the average performance of Alternatives generated? Common metrics in
descriptive statistics include mean and mode. 9) What is the range of performance of Alternatives generated? A common metric in
descriptive statistics is standard deviation to measure variability within a given data set. 10) How many Alternatives are generated before best analyzed performance is achieved? Other researchers have studied iterations as well as process efficiency to
understand how and how quickly a Strategy will converge on an solution(s) (Smith & Eppinger, 1997; Wang & Liu, 2006, Chen et al., 2008). 11) What is the best performing Alternative generated? A common metric in descriptive statistics is maximum value. Research in set-based design and pareto-fronts also provides the possibility of multiple optimums in design (Simpson et al, 1998; Ross & Hastings, 2005). Collectively these questions illuminate the information a designer needs to understand a Design Process. In the next section, we use our framework and this set of questions to develop Design Process metrics. We then use these metrics to compare the Guidance provided by two different Strategies in a real-world case study.
3.2 DESIGN PROCESS METRICS
We propose the following metrics to numerically characterize the dimensions of Design Process. Table 1 defines the specific terms we use to define our metrics. In certain instances a complete analysis of the Alternative Space and Value Space is required to evaluate the individual terms.
Table 1: Design Process Terms.
n, the number of Variables. ntrade-off, the number of Variables resulting in competing impacts. ninteract, the number of Variables with first order dependence (covariance). nimportant, the number of Variables with (>1%) impact on Value performance. oi, the number of Options for Variable, nj. For Variables with large or infinite (continuous
variable) number of Alternatives, oi is defined through analysis (i.e., how many Options were assigned to the variable in the model or simulation).
A, the number of Alternatives explored. As, statistically significant sample size for Alternative Space. uA, the number of unexplored Alternatives consisting of Options that meet the
Constraints. ∆oAiAj, the count of Variables using different Options when comparing two Alternatives. G, the number of Goals identified in the Objective Space. Ga, the number of Goals analyzed in the Impact Space. p1, . . . ,pG, Preference relative to each Goal analyzed.

CHAPTER 2 9
i11, . . . ,iAG, impact of individual Alternatives relative to Goals analyzed. t, total time required to generate and analyze all Options. c, the number of Constraints. I, importance, the ranked (% of 100) Impact of a Variable (or variable pair) on Value. IAVG, average rank of Impact for all Variables. IMEDIAN, median rank of Impact for all Variables. IHIGH, rank of Variable with the highest Impact. ItheorecticalHIGH, the highest percentage rank possible in a series, given the median rank of
Impact over all Variables. vA, Value of an Alternative, the aggregate Impact of an Alternative weighted according to
Stakeholder Preference. V, the set of Alternatives generated with acceptable Impacts.
Using the terms listed in Table 1, we develop the following metrics to measure Design Process.
OBJECTIVE SPACE SIZE, OSS = {Ga}
OSS is the number of Goals analyzed by a given Strategy. This metric is a count, and is not normalized. For example, energy simulation software tools may be capable of analyzing energy usage, thermal performance as well as first cost (LBNL, 1982). OSS = 3.
ALTERNATIVE SPACE INTERDEPENDENCE, ASI = n𝐢𝐧𝐭𝐞𝐫𝐚𝐜𝐭
𝒏𝟐
ASI is the number of first order interactions among Variables divided by the number of Variable pairs. A high ASI (0 to 1) indicates a higher number of interactions occurring among Variables. A high ASI contributes to the level of complication of a Challenge. In this example, we illustrate interdependence visually. A-symmetry about the X-Y diagonal indicates that an interaction is occurring among variables. Visual inspection of Figure 3 demonstrates interdependence between Window Type and HVAC Efficiency (left), HVAC Efficiency and Roof Insulation (center), but no significant interdependence between Window Type and Roof Insulation (right).
Figure 3: Value (NPV) as a function of combinations of Window Type, HVAC Efficiency, and Roof Insulation Variables. The asymmetry of the first two graphs shows two interactions of the first order among the three Variables.
From the data shown in Figure 3, ASI = 2 /3 = .66.
CHAPTER 2 10
IMPACT SPACE COMPLEXITY, ISC = nTRADE-OFFS / n
ISC is the number of Variables that result in performance trade-offs (divergent Impacts) divided by total number of Variables considered. ISC represents the percent of Variables for which Goals are competing. A high ISC (0 to 1) contributes to the level of complication of a Challenge. In the case where only one Goal is assessed, ISC, by definition equals zero. For example, consider the case where 3 Variables (HVAC Efficiency, Window Type and Exterior Shading) are evaluated relative to the goals to Minimize Energy Usage, and Minimize First Cost. Both HVAC Efficiency and Window Type show competing impacts- higher first costs resulting in lower energy usage. However, for Exterior Shading, the first cost increase of the Exterior Shading is offset by cost savings resulting from a downsized HVAC system. In the case of Exterior Shading impacts are not competing and the Option with the lower first cost also has lower energy usage. In this case ISC = 2 / 3 = .667.
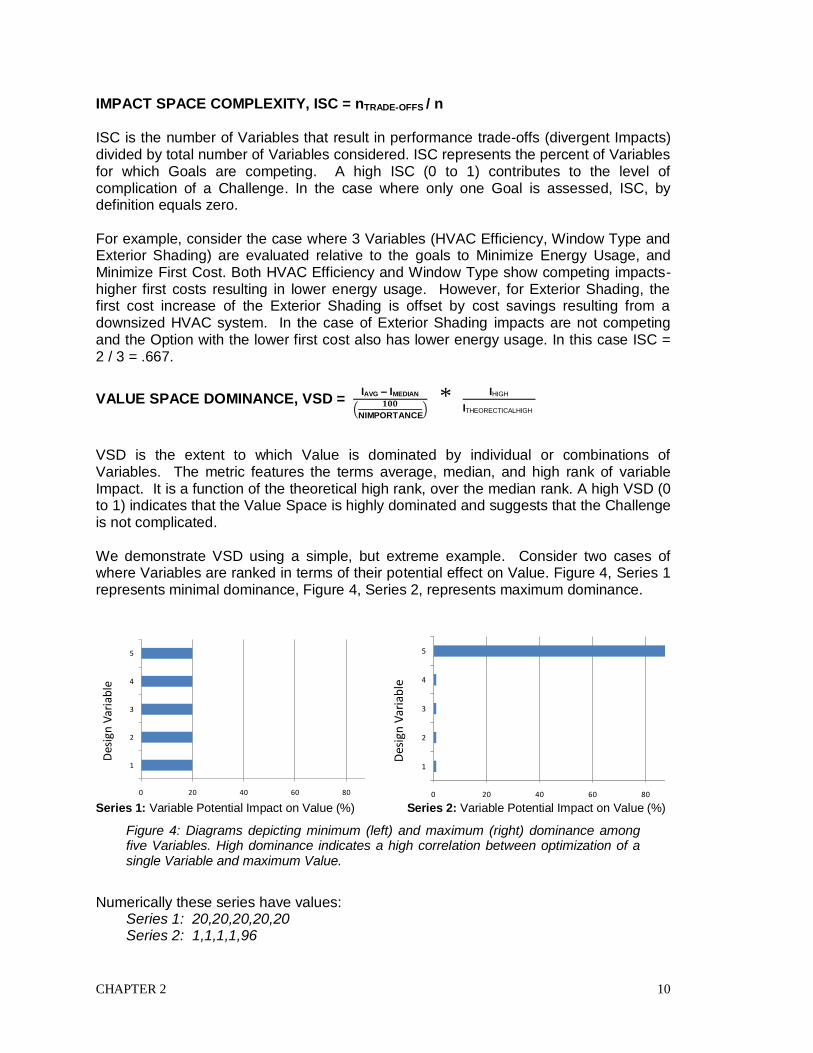
VALUE SPACE DOMINANCE, VSD = IAVG – IMEDIAN
𝟏𝟎𝟎
NIMPORTANCE *
IHIGH
ITHEORECTICALHIGH
VSD is the extent to which Value is dominated by individual or combinations of Variables. The metric features the terms average, median, and high rank of variable Impact. It is a function of the theoretical high rank, over the median rank. A high VSD (0 to 1) indicates that the Value Space is highly dominated and suggests that the Challenge is not complicated. We demonstrate VSD using a simple, but extreme example. Consider two cases of where Variables are ranked in terms of their potential effect on Value. Figure 4, Series 1 represents minimal dominance, Figure 4, Series 2, represents maximum dominance.
Series 1: Variable Potential Impact on Value (%)
Series 2: Variable Potential Impact on Value (%)
Figure 4: Diagrams depicting minimum (left) and maximum (right) dominance among five Variables. High dominance indicates a high correlation between optimization of a single Variable and maximum Value.
Numerically these series have values: Series 1: 20,20,20,20,20 Series 2: 1,1,1,1,96
Potential Impact on Value (%)
Des
ign
Var
iab
le
0 20 40 60 80 100
1
2
3
4
5
Potential Impact on Value (%)
Des
ign
Var
iab
le
0 20 40 60 80 100
1
2
3
4
5

CHAPTER 2 11
We add a third, less extreme series for illustrative purposes. Series 3: 5, 10, 15, 25, 45
In all cases, the numbers in the series sum to 100 since the numbers each represent a percentage impact. Here we calculate the VSD for the three series showing Series 1 being the least dominated, Series 2 the most, and Series 3 partially dominated:
VSDseries1 = 20 – 20
100
5 *
20
20
= 0
VSDseries2 = 20 – 1
100
5 *
96
96 = .95
VSDseries3 = 20 – 15
100
5 *
45
55
= .20
OBJECTIVE SPACE QUALITY, OSQ = Ga / G
OSQ is the ratio of the number of Goals analyzed to the number of Goals identified. It demonstrates the extent to which (0 to 1) the Strategy addresses project Goals. If, for example, in addition to energy usage, thermal performance and first cost, acoustic performance is important, then for a Strategy relying exclusively on energy simulation software has an OSQ = 3 / 4 because acoustic Impact is not assessed.
ALTERNATIVE SPACE SAMPLING, ASS = A / AS ~ A / (A + uA)
ASS is the number of Alternatives generated divided by the number of Alternatives required for “significant sampling” of the Alternative Space. It demonstrates the extent to which a Strategy‟s sampling is statistically significant. Significant sampling can be determined using standard mathematical calculations for a statistical “sample size.” Such mathematics, however, typically falls outside scope of this research. When the statistically significant sample size is unknown, the total number of possible Alternatives is used. If, for example, AS is unknown, but the Alternative Space includes 1000 feasible Alternatives, yet only four Alternatives are analyzed, then ASS = 4 / (4 + 996) = .004
ALTERNATIVE SPACE FLEXIBILITY, ASF = (∆oAiAj / 𝑨𝟐 ) / n
ASF is the average number of Option changes between any two Alternatives divided by the number of Variables. ASF measures the level of decision variation in a given Exploration. ASF is calculated by taking every pair of Alternatives in a Design Process and recording how many Variables have differing Options between them, and then taking the average of these values. By averaging across every combination of Alternatives, sequence of Exploration becomes immaterial. The metric represents the breadth or diversity of an Exploration, regardless of sequence.

CHAPTER 2 12
For example, the following Exploration consists of three Alternatives, each including three Variables. Alternative 1: Low Efficiency HVAC, Single Pane Windows, Low Roof Insulation
Alternative 2: Low Efficiency HVAC, Single Pane Windows, High Roof Insulation Alternative 3: Low Efficiency HVAC, Double Pane-LowE Windows, High Roof Insulation
Alternative 1 to Alternative 2: 1 Option change Alternative 1 to Alternative 3: 2 Option changes Alternative 2 to Alternative 3: 1 Option change ASF = ((1+2+1)/3) / 3 = .444
VALUE SPACE AVERAGE, VSA = 𝐀
𝐢=𝟎 (vi)
A
VSA is the mean Value for the set of Alternatives analyzed. It characterizes the average Alternative generated in an Exploration.
For example, NPVAlternative1 = $25
NPVAlternative2 = $32
NPVAlternative3 = $30
VSA = $29
VALUE SPACE RANGE, VSR = STDEV(vI) VSR is the standard deviation of all values for the set of Alternatives analyzed. It characterizes the dispersion of Alternatives generated in an Exploration.
For example, NPVAlternative1 = $25
NPVAlternative2 = $32
NPVAlternative3 = $30
VSR = $3.6
VALUE SPACE ITERATIONS,VSI= No. of Alternatives Generated prior to achieving Maximum Value
VSI is the number of Alternatives generated before the highest Value is reached. It characterizes the efficiency of an Exploration and is to be minimized
For example, NPVAlternative1 = $25
NPVAlternative2 = $32
NPVAlternative3 = $30
VSI = 2

CHAPTER 2 13
VALUE SPACE MAXIMUM, VSM = MAX(vi) VSM is the highest Value of all Alternatives generated. It identifies the maximum performance achieved in an Exploration.
For example, NPVAlternative1 = $25
NPVAlternative2 = $32
NPVAlternative3 = $30 VSM = $32
In the next section we use these metrics to measure and compare Design Processes in real-world case studies.
4 INDUSTRY CASE STUDIES
To test and illustrate our metrics, we applied them to two industry case studies. Our case study documents a professional energy analysis performed in 2006 during schematic design of a 338,880 sf Federal Building with 10 floors and a parking sub-basement sited in a mixed (hot in summer, cold in winter), dry climate at an elevation of 4220ft. At the beginning of the project, the client set an annual energy usage target of 55 kBtu/sf/yr as a Goal for the project. Additional goals were low first cost, and pleasing aesthetics. The mechanical engineer on the project used DOE-2 (LBNL, 1982) to simulate energy performance. A total of 13 energy simulation runs were generated during 4 rounds of energy modeling. Figure 5 represents the Alternatives modeled and associated annual energy savings (kBTU/sf/yr) estimates as generated by professional energy modelers. These results were delivered to the project team in several reports in table or written narrative format.
Professional Design Process
Results from the 13 energy simulations, generated over a 27 month period are summarized in Figure 5. The red line shows estimated annual energy savings (kBTU/sf/yr) for individual whole building simulations during Schematic Design. The Strategy for generating and analyzing the Alternatives can primarily be characterized as performance verification: performance “point-data” is provided as individual design Alternatives are generated for the primary purpose of verifying performance relative to the performance target as well as the previous runs.

CHAPTER 2 14
Figure 5: Graphical representation of a professional energy modeling process. Variables are listed on the right. Alternatives are shown as vertical stacks of specific combinations of Options (represented by various colors.) Changes in Options for each Alternative can be observed through horizontally adjacent color changes. Estimated energy saving performance is depicted with the solid red line. The dashed orange line shows target energy savings. All Energy performance estimates were calculated using DOE2 simulations. The figure suggests that the professional energy modeling performed on this project supported a slow, disjointed, unsystematic and relatively ineffective exploration of building performance.
Additional detail regarding the Variables and Options analyzed in the professional exploration case is provided in Table 3 in the appendix. Energy savings are calculated relative to a professionally estimated baseline.
Advanced Design Process
Researchers at Stanford University are leading efforts to develop a suite of new technologies and methodologies in support of multidisciplinary design, analysis and optimization (Flager et al, 2009.) This strategy uses Process Integration and Design Optimization (PIDO) tools as a platform for analysis management to integrate existing AEC analysis tools, in this case EnergyPlus (LNBL, 2008.) We used such an analysis technique to support application of an advanced Strategy to the case study. We implemented a Design of Experiment (DOE) exploration to estimate annual energy savings (Figure 6), and evaluate trade-offs between first cost and energy usage. For additional detail regarding the Variables and Options analyzed in the professional exploration case, see Table 4 in the appendix. Energy savings are calculated relative to the professionally estimated baseline used in the previous case study (Figure 5).
Simulated
Performance
Target
(55 kBTU/sf/yr)
Alternatives Generated by Professionals through Time
1 2 3 4 5 6 7 8 9 10 11 12 13
Energy Savings
CHAPTER 2 15
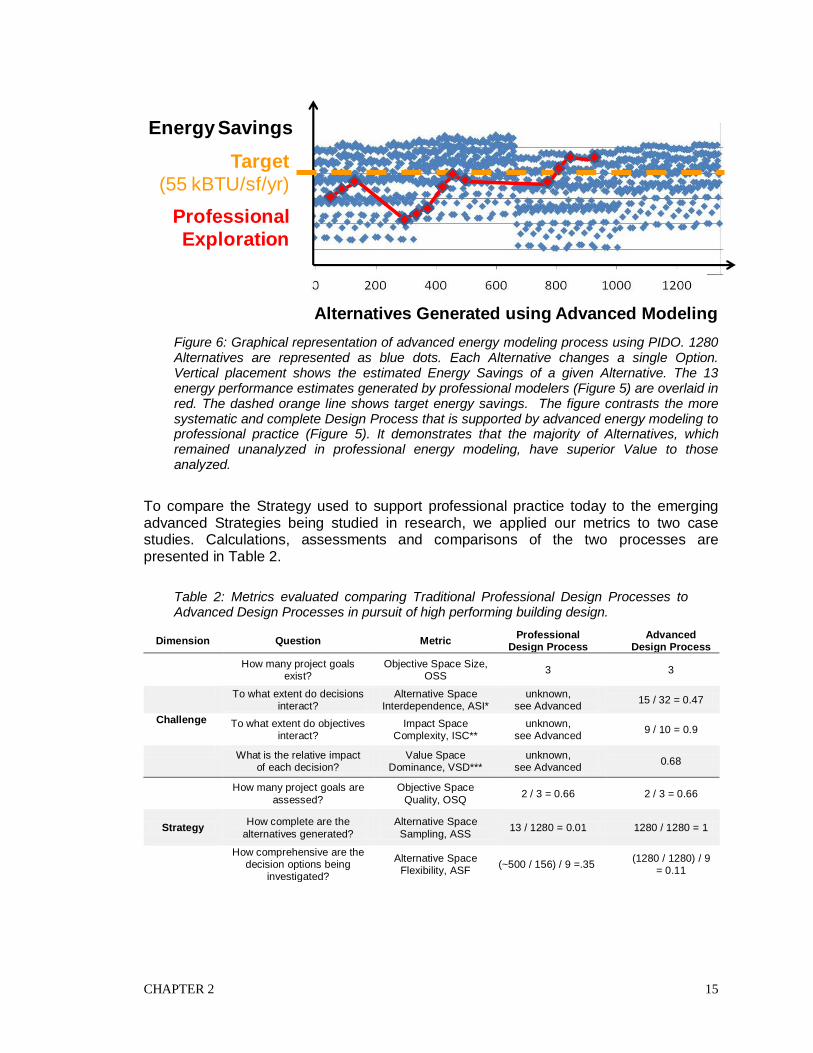
Figure 6: Graphical representation of advanced energy modeling process using PIDO. 1280 Alternatives are represented as blue dots. Each Alternative changes a single Option. Vertical placement shows the estimated Energy Savings of a given Alternative. The 13 energy performance estimates generated by professional modelers (Figure 5) are overlaid in red. The dashed orange line shows target energy savings. The figure contrasts the more systematic and complete Design Process that is supported by advanced energy modeling to professional practice (Figure 5). It demonstrates that the majority of Alternatives, which remained unanalyzed in professional energy modeling, have superior Value to those analyzed.
To compare the Strategy used to support professional practice today to the emerging advanced Strategies being studied in research, we applied our metrics to two case studies. Calculations, assessments and comparisons of the two processes are presented in Table 2.
Table 2: Metrics evaluated comparing Traditional Professional Design Processes to Advanced Design Processes in pursuit of high performing building design.
Alternatives Generated using Advanced Modeling
Professional
Exploration
Target
(55 kBTU/sf/yr)
Energy Savings
Dimension Question Metric Professional
Design Process Advanced
Design Process
How many project goals exist?
Objective Space Size, OSS
3 3
To what extent do decisions interact?
Alternative Space Interdependence, ASI*
unknown, see Advanced
15 / 32 = 0.47
Challenge To what extent do objectives interact?
Impact Space Complexity, ISC**
unknown, see Advanced
9 / 10 = 0.9
What is the relative impact of each decision?
Value Space Dominance, VSD***
unknown, see Advanced
0.68
How many project goals are
assessed?
Objective Space
Quality, OSQ 2 / 3 = 0.66 2 / 3 = 0.66
Strategy How complete are the
alternatives generated?
Alternative Space
Sampling, ASS 13 / 1280 = 0.01 1280 / 1280 = 1
How comprehensive are the decision options being
investigated?
Alternative Space Flexibility, ASF
(~500 / 156) / 9 =.35 (1280 / 1280) / 9
= 0.11

CHAPTER 2 16
* see appendix, Figure 6, ** see appendix, Figure 7, *** see appendix, Figure 8
Challenge metrics for the two case studies are presumed to be closely aligned. In traditional energy modeling, however, neither statistical sampling nor full analysis is performed and direct assessment of Challenge metrics is not possible. Instead we assume the Challenge metrics assessed using the advanced Strategy apply to both case studies since the Challenges contain only minor modeling differences driven by PIDO prototype limitations. The advanced Strategy reveals that Value in the case study is highly dominated (VSD = .68) by one decision, window area (see Appendix, Figure 8). In the traditional case study, the architects displayed a strong Preference for an all-glass exterior having qualitative but not quantitative knowledge of the extent of its dominance. The high impact of the decision regarding window area is observable in Figure 6, where estimated energy savings dramatically drops between Alternative 3 and Alternative 4 due to a change (increase) in window area. . Interestingly, in traditional practice the designers never revisited the decision regarding “window area,” but maintained the 95% exterior glass Option for all remaining Alternatives explored. Alternative Space Interdependence (ASI) from the advanced Strategy reveals that nearly half of the Variables modeled have some level of dependency. This result is not surprising since building geometry was a design Variables that affects nearly every other Variable modeled. Finally Impact Space Complexity (ISC) from PIDO shows relatively little competition between first cost and energy savings. This result is unintuitive and may be a function of the “self-sizing” HVAC currently modeled in PIDO. In other words, although energy efficiency measures may have a higher first cost, these are partially offset by the cost savings that result from a smaller HVAC system. Strategy metrics are similar in Objective Space Quality (OSQ). Both Strategies quantify energy savings and first cost, but do not directly assess aesthetics. Such assessment is left to designer judgment. Alternative Space Sampling (ASS) score for the advanced Strategy is orders of magnitude better than the traditional Strategy. By scripting and queuing the execution of model simulation runs, the advanced Strategy performs full analysis (ASS = 1) for all feasible options of 9 Variables (1280 runs) in a fraction of the time (4 hours versus 2.3 mo.) compared to the traditional Design Processes, which relies upon manual model revision to execute a total of 13 runs. Alternative Space Flexibility (ASF), using the traditional Strategy, however, is higher. On average, each Alternative differs by three Options when manually selected while only one Variable at a time is changed according to the script of the advanced Strategy. Exploration metrics for the advanced Process show improved maximum and average Value generated. No additional human-driven Exploration was performed beyond
What is the average
performance of alternatives generated?
Value Space Average,
VSA $564,400 $669,400
Exploration What is the range of
performance of alternatives generated?
Value Space Range, VSR
$165,100 $398,060
How many alternatives are generated before best
performance?
Value Space Iterations,
VSI 12 1280
What is the best performing
alternative generated?
Value Space Maximum, VSM
[NPV $]
$720,600 ~$998,400

CHAPTER 2 17
automated analysis. We assume a designer would merely select the top performer identified. Since full analysis was performed, however, it required a large, and potentially exponential, number of runs. At a minimum, statistically significant sample size should be achieved. The metric, Value Space Iteration (VSI), therefore, was much higher than for the traditional Process. As advanced Strategies are honed, VSI will likely drop and/or become relatively insignificant relative to gains in computing power. Assessment of the metrics suggest that the advanced design Strategy tools being developed by researchers provide better Guidance than the traditional energy analysis being performed in industry today based on higher Value Space Average (VSA), Value Space Range (VSR) and Value Space Maximum (VSM). Our ability to apply the metrics to these test cases is evidence for the claim that the metrics clarify both relative and absolute design process performance assessment.
5 CONCLUSION
In the face of expanding Objectives and increasingly complex building science, Professionals need to execute Design Processes that generate high performing Alternatives. The use of precedent and point-based analysis Strategies has proven less than satisfactory in addressing energy efficiency. Significant opportunity exists for advanced Strategies to provide designers better Guidance that results in more effective Explorations. To realize this potential, designers need a language to compare and evaluate the ability of Strategies to meet their Challenges. Literature review provides a foundation, but not a complete basis for such comparison. In this paper, we define Design Process to consist of three dimensions: Challenge, Strategy and Exploration. We develop a framework to precisely define the components and spaces of performance-based design. We synthesize a set of metrics to consistently measure all dimensions of Design Process. Finally, we demonstrate the power of the framework and metrics by applying them to two real-world case studies, where two distinct Strategies are implemented. We observe that the framework and metrics facilitate comparison and illuminate differences in Design Processes. Strengths of the metrics include the ability to assess differences in Challenges not previously quantified using traditional point-based Design Processes. In addition, the metrics numerically assess the impact of Goals on both the formulation of a Challenge, and the suitability of a Strategy. Alternative Space Flexibility (ASF) is potentially the most important and controversial metric. One interpretation of ASF is as a proxy for creativity. In our case studies, the metric shows full analysis to be the least creative Strategy. Researchers have long recognized the antagonism between creativity and systematic search and the link between creativity and break-through performance. (Gero,1996; Dorst & Cross, 2001; Shah et al., 2003). Here, we recognize that creativity exists on at least two levels: within set bounds of project Constraints and beyond (re-formulated) project Constraints. Our ASF metric currently addresses the lesser level of creativity within the bounds of established project Constraints. The higher level of creativity is not addressed. Similar to the rationale for much computer-assisted design, however, we propose that by relieving designers of iterative tasks and by examining more Alternatives and Objectives, we potentially enable designers to be more creative.
We encountered several areas where improvement and future research is needed. Certainly, full analysis in all but the simplest Challenges is not possible in building

CHAPTER 2 18
design. We anticipate that advance Strategies in real-world applications will rely on sophisticated sampling techniques or modeling simplifications for Alternative and/or Objective formulation. Alternative Space Sampling, ASS, measures the degree to which the number of Alternatives generated is a representative, statistical sampling of Alternative Space, but says nothing of the distribution of this sampling. Finally, debate remains surrounding the role and potential supremacy of Value Space Maximum (VSM) as a design Exploration metric. Should a Process that produces the highest VSM be considered the best regardless of other Exploration metrics, such as Value Space Average (VSA) generated? We address this issue further in Clevenger & Haymaker, 2010c. In general, the relative weight of all of the metrics merits further clarification and research. Nevertheless, these metrics successfully address the eleven questions outlined in Section 3.1, and provide quantitative measure of the three dimensions of Design Process. In the authors‟ related paper Design Exploration Assessment Methodology: Testing the Guidance of Design Processes (Clevenger, et al, 2010b), we introduce the Design Exploration Assessment Methodology (DEAM) to collect and evaluate hard data involving Strategies and Explorations executed by real-world practitioners in a synthetic experiment. In a second related paper, Calculating the Value of Strategy to Challenge (Clevenger & Haymaker, 2010c), we complete a computer experiment to show that Challenges involving building energy efficiency and beyond, vary non-trivially. We introduce the concept of Process Cost to our metrics and evaluate the value of information produced by various Strategies relative to specific Challenges. This research allows designers to better evaluate existing and emerging Strategies and, potentially, to prescribe improvement to practice.

CHAPTER 2 19
References
Federal Energy Management Program (FEMP), (2007). Energy Independence And Security Act (EISA) of 2007 (pp. P.L. 110-140 (H.R.116.) ).
American Institute of Architects (AIA), (2007). National Association of Counties Adopts AIA Challenge of Carbon Neutral Public Buildings by 2030.
Akin, Ö. (2001). Variants in design cognition. In C. Eastman, M. McCracken & W. Newstetter(Eds.), Design knowing and learning: Cognition in design education (pp. 105-124). Amsterdam: Elsevier Science.
Akin, Ö., & Lin, C. (1995). Design protocol data and novel design decisions. Design Studies, 16(2), 211-236.
Bashir, H. A., & Thompson, V. (1997). Metrics for design projects: a review. Design Studies, 20(3), 163-277.
Bazjanac, V. (2006). Building energy performance simulation presentation.
Bazjanac, V. (2008). IFC BIM-based methodology for semi-automated building energy performance simulation. Lawrence Berkley National Laboratory (LBNL), 919E.
Briand, L., Morasca, S., & Basili, V. (1994). Defining and validating high-level design metrics.
Burry, M.C. (2003). Between Intuition and Process: Parametric Design and Rapid Prototyping. In Branko Koarevic (Ed.). Architecture in the Digital Age, Spon
Press, London. Chachere, J., & Haymaker, J. (2008). Framework for measuring rationale clarity of AEC
design decisions. CIFE Technical Report, TR177.
Chen, C. H., D. He, M. C. Fu, and L. H. Lee. (2008). Efficient simulation budget allocation for selecting an optimal subset. INFORMS Journal on Computing
accepted for publication. Ciftcioglu, O., Sariyildiz, S., & van der Veer, P. (1998). Integrated building design
decision support with fuzzy logic. Computational Mechanics Inc., 11-14.
Clarke, J. A. (2001). Energy simulation in building design, Butterworth-Heinemann. Clevenger, C., Haymaker, J., (2009). Framework and Metrics for Assessing the
Guidance of Design Processes, The 17th International Conference on Engineering Design, Stanford, California.
Clevenger, C., Haymaker, J., Ehrich, A. (2010b). Design Exploration Assessment Methodology: Testing the Guidance of Design Processes, submitted to Journal of
Engineering Design. Clevenger, C., Haymaker, J., (2010c). Calculating the Value of Strategy to Challenge,
submitted to Building and Environment Journal. Cross, N. (2001). Designerly Ways of Knowing: Design Discipline versus Design
Science, Design Issues, Vol. 17, No. 3, pp. 49-55, 2001. Cross, N. (2004). Expertise in design: an overview. Design Studies, 25(5), 427-441.
Cross, R., & Roozenburg, N. (1992). Modeling the design process in engineering and architecture. Journal of Engineering Design, 3(4).
Deru, M., & Torcellini, P. A. (2004). Improving sustainability of buildings through a performance-based design approach. 2004 Preprint, National Renewable Energy Laboratory (NREL) NREL/CP-550-36276.
Dorst, K. (2008) Design Research: A Revolution-waiting-to-happen, Design Studies, vol. 29, no. 1, pp 4-11.
Dorst, K., & Cross, N. (2001). Creativity in the design process: Co-evolution of problem-solution. Design Studies, 22, 425-437.
Earl, C., Johnson, J., & Eckert, C. (2005). Complexity, Chapter 7 Design Process Improvement: A Review of Current Practice.
CHAPTER 2 20
Eastman, C., Teicholz, P., Sacks, R., & Liston, K. (2008). BIM handbook: A guide to building information modeling for owners, managers, designers, engineers, and contractors.
Eckert, C., Clarkson, J. eds. (2005). Design Process Improvement: A Review of Current Practice, Springer.
Edvardsson, E., & Hansson, S. O. (2005). „When is a goal rational?‟ Social Choice and Welfare 24, 343-361.
Flager, F. and Haymaker, J. (2007). “A Comparison of Multidisciplinary Design, Analysis and Optimization Processes in the Building Construction and Aerospace Industries,” 24th International Conference on Information Technology in Construction, I. Smith (ed.), pp. 625-630.
Flager F, Welle B, Bansal P, Soremekun G, Haymaker J (2009). Multidisciplinary Process Integration and Design Optimization of a Classroom Building, Journal of Information Technology in Construction (ITcon), Vol. 14, pg. 595-612.
Galbraith, J. (1974). Organization Design: An Information Processing View, Interfaces,
Vol. 4, No. 3, pp. 28-36. Gane V., and Haymaker, J. (2008). Benchmarking Conceptual High-Rise Design
Processes, Accepted in Journal of Architectural Engineering.
Gane, V., Haymaker, J., (2007). Conceptual Design of High-rises with Parameteric Methods. Predicting the Future, 25th eCAADe Conference Proceedings, ISBN 978-0-9541183-6-5 Frankfurt, Germany, pp 293-301.
Gero, J. S. (1990). Design prototypes: A knowledge representation schema for design. AI Magazine, Special issue on AI based design systems, 11(4), 26-36.
Gero, J. S. (1996). Creativity, emergence and evolution in design. Knowledge-Based Systems, 9, 435-448.
Haymaker, J. (2006). Communicating, integrating, and improving multidisciplinary design narratives. International Conference on Design Computing and Cognition, 635-
653. Haymaker, J., & Chachere, J. (2006). Coordinating goals, preferences, options, and
analyses for the stanford living laboratory feasibility study. Springer Verlag, 320-327.
Haymaker, J., Chachere, J. and Senescu, R. (2008). Measuring and Improving Rationale Clarity in the Design of a University Office Building. Submitted to Advanced Engineering Informatics. Also available as Stanford University Center
for Integrated Facility Engineering Technical Report TR174 at http://cife.stanford.edu/online.publications/TR174.pdf Hudson, R. (2009). Parametric development of problem descriptions. International
Journal of Architectural Computing, 7(2), 199-216.
Ïpek, E., McKee, S., Caruana, R., de Supinski, B., & Schulz, M. (2006, October 21-25, 2006). Efficiently exploring architectural design spaces via predictive modeling.
Paper presented at the Proceedings of the 12th international conference on Architectural support for programming languages and operating systems.
ISO 10303-11:2004 Industrial automation systems and integration -- Product data representation and exchange -- Part 11: Description methods: The EXPRESS language reference manual.
Keeney, R., & Raiffa, H. (1993). Decisions with multiple objectives: Preferences and value tradeoffs. 2nd ed. Cambridge: Cambridge University Press.
Kleijnen JPC. Sensitivity analysis and related analyses: a review of some statistical techniques. J Stat Comput Simul 1997;57(1–4): 111–42.
Kotonya, G., & Sommerville, I. (1997). Requirements engineering: processes and techniques. Wiley, Chichester.

CHAPTER 2 21
Kunz, J., Maile, T. & Bazjanac, V. (2009). Summary of the Energy Analysis of the First year of the Stanford Jerry Yang & Akiko Yamazaki Environment & Energy (Y2E2) Building. CIFE Technical Report #TR183.
Lamsweerde, A. (2001). Goal-oriented requirements engineering: A guided tour. Proceedings RE’01, 5th IEEE International Symposium on Requirements Engineering, 249-263.
Lawrence Berkeley National Laboratory (LBNL) (1982). DOE-2 Engineers Manual, Version 2.1A. National Technical Information Service, Springfield Virginia, United States.
Lawrence Berkeley National Laboratory (LBNL) (2008). EnergyPlus Engineering Reference, The Reference to EnergyPlus Calculations. 20 April, Berkeley, California, United States.
Lewis, K.E., Chen, W., and Schmidt, L. (Eds.). (2007). Decision Making in Engineering Design. New York: ASME Press
Love, T. (2002). Constructing a coherent cross-disciplinary body of theory about designing and designs: some philosophical issues Design Studies, 23(3), 345-361.
Maher, M. L., Poon, J., & Boulanger, S. (1996). Formalizing design exploration as co-evolution: A combined gene approach. Advances in Formal Design Methods for CAD.
Maile, T., Fischer, M. & Bazjanac, V., (2007). Building Energy Performance Simulation Tools – a Life-Cycle and Interoperable Perspective. CIFE Working Paper WP 107, Stanford University, 49.
Mattson, C. A., & Messac, A. (2002). A non-deterministic approach to concept selection using s-Pareto frontiers. American Society of Mechanical Engineers, 859-870.
McManus, H., Richards, Ross, M., & Hastings, D. (2007). A Framework for incorporating "ilities" in tradespace studies. AIAA Space.
Papamichael, LaPorta, & Chauvert. (1998). Building design advisor: automated integration of multiple simulation tools., 6(4), 341-352.
Papamichael, & Protzen. (1993). The limits of intelligence in design. Proceedings of the Focus Symposium on Computer-Assisted Building Design Systems 4th International Symposium on Systems Research, Informatics and Cybernetics.
Payne, J., Bettman, J., & Schkade, D. (1999). Measuring constructed preferences: Towards a building code. Journal of Risk and Uncertainty, 19, 1-3.
Phadke, M. S., & Taguchi, G. (1987). Selection quality characteristics and s/n ratios for robust design. Ohmsha Ltd, 1002-1007.
Ross, A. (2003). Multi-attribute tradespace exploration with concurrent design as a value-centric framework for space system architecture and design. Dual-SM.
Ross, A. M., & Hastings, D. E. (2005). The tradespace exploration paradigm. INCOSE 2005 International Symposium.
Ross, A. M., Hastings, D. E., Warmkessel, J. M., & Diller, N. P. (2004). Multi-attribute tradespace exploration as front end for effective space system design. Journal of Spacecraft and Rockets, 41(1).
Shah, J., Vargas-Hernandez, N., & Smith, S. (2003). Metrics for measuring ideation effectiveness. Design Studies, 24(2), 111-134.
Simpson, T., Lautenschlager, U., Mistree, F. (1998). Mass customization in the age of information: The case for open engineering systems. The information revolution: Current and future consequences, 49-71.
Simpson, T., Rosen, D., Allen, J. K., & Mistree, F. (1996). Metrics for assessing design freedom and information certainty in the early stages of design. Proceeding of the 1996 ASME Design Engineering Technical Conferences and Computers in

CHAPTER 2 22
Engineering Conference.
Smith, R., & Eppinger, R. (1997). A predictive model of sequential iteration in engineering design. Management Science, 43(8).
Takeda, H., Veerkamp, P., Tomiyama, T., Yoshikawa, H., (1990). Modeling Design Processes, AI Magazine Vol. 11, No. 4. pp. 37-48.
Tate, D., & Nordlund, M. (1998). A design process roadmap as a general tool for structuring and supporting design activities. Journal of Integrated Design and Process, 2(3), 11-19.
Wang, W. C., & Liu, J. J. (2006). Modeling of design iterations through simulation. Automation in Construction 15(5), 589-603.
Watson, I., & Perera, S. (1997). Case-based design: A review and analysis of building design applications. Journal of Artificial Intelligence for engineering Design, Analysis and Manufacturing AIEDAM, 11(1), 59-87.
Wetter, M. (2001). GenOpt "Generic Optimization Program,” Seventh International IBPSAConference, Rio de Janeiro, Brazil. (http://www.ibpsa.org/bs_01.htm).
Whitehead, H. (2003). Laws of Form. Architecture in the Digital Age: Design and Manufacturing. Taylor & Francis.
Woodbury, R. F. and A. L. Burrow (2006). "Whither design science?" Artificial Intelligence for Engineering Design Analysis and Manufacturing 20(2): 63-82.

CHAPTER 2 23
APPENDIX
Table 3: Options for Variables explored in professional Design Process
Variables Options
Final Schematic Design Additional
Alternatives ASHRAE Baseline
Building Geometry A B, C A
Windows U-value: 0.30; SC: 0.44; SHCG: 0.378
U-value: 0.57; SC: 0.57; SHCG: 0.49
Roof U-value: 0.33 U-value: 0.65
Wall, Above Grade U-value: 0.083 (above grade)
U-value: 0.113
Wall Below Grade U-value: 0.056 U-value: 0.1
Percent Glass on Exterior
95% 40%
Percent Exterior with Shading
50% 38% 0%
Electric Lighting 1.10 w/sf 1.22 w/sf
Daylight Sensors Yes No
HVAC B: High efficiency, Heat
recovery Outside air minimum: 10%
A, C B: Standard Efficiency, Outside air minimum:
20%
For the purposes of comparison in our case studies, above and below grade wall Variables are modeled together.
Table 4: Options for Variables explored in advanced Design Process
Variables Options Building Geometry Square (100ft x 100ft) Rectangular (200ft x 50ft)
Building Orientation -90, -45, 0, 45, 90
Window Construction U-value: 0.30 SC: 0.44
SHCG: 0.378
U-value: 0.57 SC: 0.57
SHCG: 0.49
Exterior Wall U-value: 0.083 U-value: 0.113
Percent Glass on Exterior
95% 40%
Percent Exterior Shading
50% 0%
Electric Lighting 1.10 w/sf 1.22 w/sf
Daylight Sensors Yes No
HVAC High efficiency, Heat recovery, Outside air
minimum: 10%
Standard Efficiency, Outside air minimum: 20%
Alternatives = 2*5*2*2*2*2*2*2*2 = 1280

CHAPTER 2 24
Bld_Len 75
7065
6055
5045
4035
An
nu
al_
Op
_C
os
t_T
ota
l
120000
115000
110000
105000
100000
95000
90000
85000
80000
75000
70000
65000 win_to_wall_ratio1
0.9
0.85
0.8
0.75
0.7
0.65
0.6
0.55
0.5
0.45
0.4 Bld_Len 75
7065
605550
4540
35
An
nu
al_
Op
_C
os
t_T
ota
l
120000
115000
110000
105000
100000
95000
90000
85000
80000
75000
70000
65000 HVAC_System
9
8.8
8.6
8.4
8.2
8
7.8
7.6
7.4
7.2
7
Bld_Len 75
7065
605550
4540
35
An
nu
al_
Op
_C
os
t_T
ota
l
120000
115000
110000
105000
100000
95000
90000
85000
80000
75000
70000
65000 BuildingOrientation
300
250
200
150
100
50
0 Bld_Len 75
706560
5550
454035
An
nu
al_
Op
_C
os
t_T
ota
l
120000
115000
110000
105000
100000
95000
90000
85000
80000
75000
70000
65000 ExternalWallConstruction
1004
1003.9
1003.8
1003.7
1003.6
1003.5
1003.4
1003.3
1003.2
1003.1
1003
Bld_Len 75
706560
5550
454035
An
nu
al_
Op
_C
os
t_T
ota
l
120000
115000
110000
105000
100000
95000
90000
85000
80000
75000
70000
65000 WindowConstruction
4004
4003.8
4003.6
4003.4
4003.2
4003
4002.8
4002.6
4002.4
4002.2
4002 Bld_Len 75
7065
605550
4540
35
An
nu
al_
Op
_C
os
t_T
ota
l
120000
115000
110000
105000
100000
95000
90000
85000
80000
75000
70000
65000 LightingLoad
13.3
13.25
13.2
13.15
13.1
13.05
13
12.95
Bld_Len 75
7065
605550
4540
35
An
nu
al_
Op
_C
os
t_T
ota
l
120000
115000
110000
105000
100000
95000
90000
85000
80000
75000
70000
65000 ShadeControl
2
1.9
1.8
1.7
1.6
1.5
1.4
1.3
1.2
1.1
1 Bld_Len 75
706560
5550
454035
An
nu
al_
Op
_C
os
t_T
ota
l
120000
115000
110000
105000
100000
95000
90000
85000
80000
75000
70000
65000 DayThresh
100000
90000
80000
70000
60000
50000
40000
30000
20000
10000
win_to_wall_ratio1 0.90.850.8
0.750.70.650.60.550.50.450.4
An
nu
al_
Op
_C
ost_
To
tal
120000
115000
110000
105000
100000
95000
90000
85000
80000
75000
70000
65000 HVAC_System
9
8.8
8.6
8.4
8.2
8
7.8
7.6
7.4
7.2
7 win_to_wall_ratio1 0.90.850.8
0.750.70.650.60.550.50.450.4
An
nu
al_
Op
_C
ost_
To
tal
120000
115000
110000
105000
100000
95000
90000
85000
80000
75000
70000
65000 BuildingOrientation
300
250
200
150
100
50
0
win_to_wall_ratio1 0.90.850.8
0.750.70.650.60.550.50.450.4
An
nu
al_
Op
_C
ost_
To
tal
120000
115000
110000
105000
100000
95000
90000
85000
80000
75000
70000
65000 ExternalWallConstruction
1004
1003.9
1003.8
1003.7
1003.6
1003.5
1003.4
1003.3
1003.2
1003.1
1003 win_to_wall_ratio1 0.90.850.8
0.750.70.650.60.550.50.450.4
An
nu
al_
Op
_C
ost_
To
tal
120000
115000
110000
105000
100000
95000
90000
85000
80000
75000
70000
65000 WindowConstruction
4004
4003.8
4003.6
4003.4
4003.2
4003
4002.8
4002.6
4002.4
4002.2
4002
win_to_wall_ratio1 0.90.850.8
0.750.70.650.60.550.50.450.4
An
nu
al_
Op
_C
os
t_T
ota
l
120000
115000
110000
105000
100000
95000
90000
85000
80000
75000
70000
65000 LightingLoad
13.3
13.25
13.2
13.15
13.1
13.05
13
12.95win_to_wall_ratio1
0.90.850.80.750.70.650.6
0.550.50.450.4
An
nu
al_
Op
_C
os
t_T
ota
l
120000
115000
110000
105000
100000
95000
90000
85000
80000
75000
70000
65000 ShadeControl
2
1.9
1.8
1.7
1.6
1.5
1.4
1.3
1.2
1.1
1
win_to_wall_ratio1 0.90.850.8
0.750.70.650.60.550.50.450.4
An
nu
al_
Op
_C
os
t_T
ota
l
120000
115000
110000
105000
100000
95000
90000
85000
80000
75000
70000
65000 DayThresh
100000
90000
80000
70000
60000
50000
40000
30000
20000
10000HVAC_System
98.98.88.78.68.58.48.38.28.187.97.87.77.67.57.47.37.27.17
An
nu
al_
Op
_C
os
t_T
ota
l
120000
115000
110000
105000
100000
95000
90000
85000
80000
75000
70000
65000 BuildingOrientation
300
250
200
150
100
50
0
HVAC_System 98.98.88.78.68.58.48.38.28.187.97.87.77.67.57.47.37.27.17
An
nu
al_
Op
_C
os
t_T
ota
l
120000
115000
110000
105000
100000
95000
90000
85000
80000
75000
70000
65000 ExternalWallConstruction
1004
1003.9
1003.8
1003.7
1003.6
1003.5
1003.4
1003.3
1003.2
1003.1
1003 HVAC_System 98.98.88.78.68.58.48.38.28.187.97.87.77.67.57.47.37.27.17
An
nu
al_
Op
_C
os
t_T
ota
l
120000
115000
110000
105000
100000
95000
90000
85000
80000
75000
70000
65000 WindowConstruction
4004
4003.8
4003.6
4003.4
4003.2
4003
4002.8
4002.6
4002.4
4002.2
4002
HVAC_System 98.98.88.78.68.58.48.38.28.187.97.87.77.67.57.47.37.27.17
An
nu
al_
Op
_C
os
t_T
ota
l
120000
115000
110000
105000
100000
95000
90000
85000
80000
75000
70000
65000 LightingLoad
13.3
13.25
13.2
13.15
13.1
13.05
13
12.95HVAC_System
98.98.88.78.68.58.48.38.28.187.97.87.77.67.57.47.37.27.17
An
nu
al_
Op
_C
os
t_T
ota
l
120000
115000
110000
105000
100000
95000
90000
85000
80000
75000
70000
65000 ShadeControl
2
1.9
1.8
1.7
1.6
1.5
1.4
1.3
1.2
1.1
1
HVAC_System 98.98.88.78.68.58.48.38.28.187.97.87.77.67.57.47.37.27.17
An
nu
al_
Op
_C
os
t_T
ota
l
120000
115000
110000
105000
100000
95000
90000
85000
80000
75000
70000
65000 DayThresh
100000
90000
80000
70000
60000
50000
40000
30000
20000
10000
BuildingOrientation 300
250200
150100
500
An
nu
al_
Op
_C
os
t_T
ota
l
120000
115000
110000
105000
100000
95000
90000
85000
80000
75000
70000
65000 ExternalWallConstruction
1004
1003.9
1003.8
1003.7
1003.6
1003.5
1003.4
1003.3
1003.2
1003.1
1003
BuildingOrientation 300
250200
150100
500
An
nu
al_
Op
_C
ost_
To
tal
120000
115000
110000
105000
100000
95000
90000
85000
80000
75000
70000
65000 WindowConstruction
4004
4003.8
4003.6
4003.4
4003.2
4003
4002.8
4002.6
4002.4
4002.2
4002 BuildingOrientation 300
250200
150100
500
An
nu
al_
Op
_C
os
t_T
ota
l
120000
115000
110000
105000
100000
95000
90000
85000
80000
75000
70000
65000 LightingLoad
13.3
13.25
13.2
13.15
13.1
13.05
13
12.95
BuildingOrientation 300
250200
150100
500
An
nu
al_
Op
_C
os
t_T
ota
l
120000
115000
110000
105000
100000
95000
90000
85000
80000
75000
70000
65000 ShadeControl
2
1.9
1.8
1.7
1.6
1.5
1.4
1.3
1.2
1.1
1 BuildingOrientation 300
250200
150100
500
An
nu
al_
Op
_C
os
t_T
ota
l
120000
115000
110000
105000
100000
95000
90000
85000
80000
75000
70000
65000 DayThresh
100000
90000
80000
70000
60000
50000
40000
30000
20000
10000
ExternalWallConstruction 1004
1003.81003.6
1003.41003.2
1003
An
nu
al_
Op
_C
ost_
To
tal
120000
115000
110000
105000
100000
95000
90000
85000
80000
75000
70000
65000 WindowConstruction
4004
4003.8
4003.6
4003.4
4003.2
4003
4002.8
4002.6
4002.4
4002.2
4002 ExternalWallConstruction 1004
1003.81003.6
1003.41003.2
1003
An
nu
al_
Op
_C
ost_
To
tal
120000
115000
110000
105000
100000
95000
90000
85000
80000
75000
70000
65000 LightingLoad
13.3
13.25
13.2
13.15
13.1
13.05
13
12.95
ExternalWallConstruction 1004
1003.81003.6
1003.41003.2
1003
An
nu
al_
Op
_C
os
t_T
ota
l
120000
115000
110000
105000
100000
95000
90000
85000
80000
75000
70000
65000 ShadeControl
2
1.9
1.8
1.7
1.6
1.5
1.4
1.3
1.2
1.1
1 ExternalWallConstruction 1004
1003.81003.6
1003.41003.2
1003
An
nu
al_
Op
_C
os
t_T
ota
l
120000
115000
110000
105000
100000
95000
90000
85000
80000
75000
70000
65000 DayThresh
100000
90000
80000
70000
60000
50000
40000
30000
20000
10000
WindowConstruction 4004
4003.54003
4002.54002
An
nu
al_
Op
_C
os
t_T
ota
l
120000
115000
110000
105000
100000
95000
90000
85000
80000
75000
70000
65000 LightingLoad
13.3
13.25
13.2
13.15
13.1
13.05
13
12.95WindowConstruction
40044003.5
40034002.5
4002
An
nu
al_
Op
_C
os
t_T
ota
l
120000
115000
110000
105000
100000
95000
90000
85000
80000
75000
70000
65000 ShadeControl
2
1.9
1.8
1.7
1.6
1.5
1.4
1.3
1.2
1.1
1
WindowConstruction 4004
4003.54003
4002.54002
An
nu
al_
Op
_C
ost_
To
tal
120000
115000
110000
105000
100000
95000
90000
85000
80000
75000
70000
65000 DayThresh
100000
90000
80000
70000
60000
50000
40000
30000
20000
10000LightingLoad
13.313.2
13.113
An
nu
al_
Op
_C
ost_
To
tal
120000
115000
110000
105000
100000
95000
90000
85000
80000
75000
70000
65000 ShadeControl
2
1.9
1.8
1.7
1.6
1.5
1.4
1.3
1.2
1.1
1
LightingLoad 13.313.2
13.113
An
nu
al_
Op
_C
os
t_T
ota
l
120000
115000
110000
105000
100000
95000
90000
85000
80000
75000
70000
65000 DayThresh
100000
90000
80000
70000
60000
50000
40000
30000
20000
10000
ShadeControl 21.951.91.851.81.751.71.651.61.551.51.451.41.351.31.251.21.151.11.051
An
nu
al_
Op
_C
os
t_T
ota
l
120000
115000
110000
105000
100000
95000
90000
85000
80000
75000
70000
65000 DayThresh
100000
90000
80000
70000
60000
50000
40000
30000
20000
10000
Bld_Len 75
7065
6055
5045
4035
An
nu
al_
Op
_C
os
t_T
ota
l
120000
115000
110000
105000
100000
95000
90000
85000
80000
75000
70000
65000 win_to_wall_ratio1
0.9
0.85
0.8
0.75
0.7
0.65
0.6
0.55
0.5
0.45
0.4 Bld_Len 75
7065
605550
4540
35
An
nu
al_
Op
_C
os
t_T
ota
l
120000
115000
110000
105000
100000
95000
90000
85000
80000
75000
70000
65000 HVAC_System
9
8.8
8.6
8.4
8.2
8
7.8
7.6
7.4
7.2
7
Bld_Len 75
7065
605550
4540
35
An
nu
al_
Op
_C
os
t_T
ota
l
120000
115000
110000
105000
100000
95000
90000
85000
80000
75000
70000
65000 BuildingOrientation
300
250
200
150
100
50
0 Bld_Len 75
706560
5550
454035
An
nu
al_
Op
_C
os
t_T
ota
l
120000
115000
110000
105000
100000
95000
90000
85000
80000
75000
70000
65000 ExternalWallConstruction
1004
1003.9
1003.8
1003.7
1003.6
1003.5
1003.4
1003.3
1003.2
1003.1
1003
Bld_Len 75
706560
5550
454035
An
nu
al_
Op
_C
os
t_T
ota
l
120000
115000
110000
105000
100000
95000
90000
85000
80000
75000
70000
65000 WindowConstruction
4004
4003.8
4003.6
4003.4
4003.2
4003
4002.8
4002.6
4002.4
4002.2
4002 Bld_Len 75
7065
605550
4540
35
An
nu
al_
Op
_C
os
t_T
ota
l
120000
115000
110000
105000
100000
95000
90000
85000
80000
75000
70000
65000 LightingLoad
13.3
13.25
13.2
13.15
13.1
13.05
13
12.95
Bld_Len 75
7065
605550
4540
35
An
nu
al_
Op
_C
os
t_T
ota
l
120000
115000
110000
105000
100000
95000
90000
85000
80000
75000
70000
65000 ShadeControl
2
1.9
1.8
1.7
1.6
1.5
1.4
1.3
1.2
1.1
1 Bld_Len 75
706560
5550
454035
An
nu
al_
Op
_C
os
t_T
ota
l
120000
115000
110000
105000
100000
95000
90000
85000
80000
75000
70000
65000 DayThresh
100000
90000
80000
70000
60000
50000
40000
30000
20000
10000
win_to_wall_ratio1 0.90.850.8
0.750.70.650.60.550.50.450.4
An
nu
al_
Op
_C
ost_
To
tal
120000
115000
110000
105000
100000
95000
90000
85000
80000
75000
70000
65000 HVAC_System
9
8.8
8.6
8.4
8.2
8
7.8
7.6
7.4
7.2
7 win_to_wall_ratio1 0.90.850.8
0.750.70.650.60.550.50.450.4
An
nu
al_
Op
_C
ost_
To
tal
120000
115000
110000
105000
100000
95000
90000
85000
80000
75000
70000
65000 BuildingOrientation
300
250
200
150
100
50
0
win_to_wall_ratio1 0.90.850.8
0.750.70.650.60.550.50.450.4
An
nu
al_
Op
_C
os
t_T
ota
l
120000
115000
110000
105000
100000
95000
90000
85000
80000
75000
70000
65000 ExternalWallConstruction
1004
1003.9
1003.8
1003.7
1003.6
1003.5
1003.4
1003.3
1003.2
1003.1
1003 win_to_wall_ratio1 0.90.850.8
0.750.70.650.60.550.50.450.4
An
nu
al_
Op
_C
os
t_T
ota
l
120000
115000
110000
105000
100000
95000
90000
85000
80000
75000
70000
65000 WindowConstruction
4004
4003.8
4003.6
4003.4
4003.2
4003
4002.8
4002.6
4002.4
4002.2
4002
win_to_wall_ratio1 0.90.850.8
0.750.70.650.60.550.50.450.4
An
nu
al_
Op
_C
os
t_T
ota
l
120000
115000
110000
105000
100000
95000
90000
85000
80000
75000
70000
65000 LightingLoad
13.3
13.25
13.2
13.15
13.1
13.05
13
12.95win_to_wall_ratio1
0.90.850.80.750.70.650.6
0.550.50.450.4
An
nu
al_
Op
_C
os
t_T
ota
l
120000
115000
110000
105000
100000
95000
90000
85000
80000
75000
70000
65000 ShadeControl
2
1.9
1.8
1.7
1.6
1.5
1.4
1.3
1.2
1.1
1
win_to_wall_ratio1 0.90.850.8
0.750.70.650.60.550.50.450.4
An
nu
al_
Op
_C
os
t_T
ota
l
120000
115000
110000
105000
100000
95000
90000
85000
80000
75000
70000
65000 DayThresh
100000
90000
80000
70000
60000
50000
40000
30000
20000
10000HVAC_System
98.98.88.78.68.58.48.38.28.187.97.87.77.67.57.47.37.27.17
An
nu
al_
Op
_C
os
t_T
ota
l
120000
115000
110000
105000
100000
95000
90000
85000
80000
75000
70000
65000 BuildingOrientation
300
250
200
150
100
50
0
HVAC_System 98.98.88.78.68.58.48.38.28.187.97.87.77.67.57.47.37.27.17
An
nu
al_
Op
_C
os
t_T
ota
l
120000
115000
110000
105000
100000
95000
90000
85000
80000
75000
70000
65000 ExternalWallConstruction
1004
1003.9
1003.8
1003.7
1003.6
1003.5
1003.4
1003.3
1003.2
1003.1
1003 HVAC_System 98.98.88.78.68.58.48.38.28.187.97.87.77.67.57.47.37.27.17
An
nu
al_
Op
_C
os
t_T
ota
l
120000
115000
110000
105000
100000
95000
90000
85000
80000
75000
70000
65000 WindowConstruction
4004
4003.8
4003.6
4003.4
4003.2
4003
4002.8
4002.6
4002.4
4002.2
4002
HVAC_System 98.98.88.78.68.58.48.38.28.187.97.87.77.67.57.47.37.27.17
An
nu
al_
Op
_C
os
t_T
ota
l
120000
115000
110000
105000
100000
95000
90000
85000
80000
75000
70000
65000 LightingLoad
13.3
13.25
13.2
13.15
13.1
13.05
13
12.95HVAC_System
98.98.88.78.68.58.48.38.28.187.97.87.77.67.57.47.37.27.17
An
nu
al_
Op
_C
os
t_T
ota
l
120000
115000
110000
105000
100000
95000
90000
85000
80000
75000
70000
65000 ShadeControl
2
1.9
1.8
1.7
1.6
1.5
1.4
1.3
1.2
1.1
1
HVAC_System 98.98.88.78.68.58.48.38.28.187.97.87.77.67.57.47.37.27.17
An
nu
al_
Op
_C
os
t_T
ota
l
120000
115000
110000
105000
100000
95000
90000
85000
80000
75000
70000
65000 DayThresh
100000
90000
80000
70000
60000
50000
40000
30000
20000
10000
BuildingOrientation 300
250200
150100
500
An
nu
al_
Op
_C
os
t_T
ota
l
120000
115000
110000
105000
100000
95000
90000
85000
80000
75000
70000
65000 ExternalWallConstruction
1004
1003.9
1003.8
1003.7
1003.6
1003.5
1003.4
1003.3
1003.2
1003.1
1003
BuildingOrientation 300
250200
150100
500
An
nu
al_
Op
_C
os
t_T
ota
l
120000
115000
110000
105000
100000
95000
90000
85000
80000
75000
70000
65000 WindowConstruction
4004
4003.8
4003.6
4003.4
4003.2
4003
4002.8
4002.6
4002.4
4002.2
4002 BuildingOrientation 300
250200
150100
500
An
nu
al_
Op
_C
os
t_T
ota
l
120000
115000
110000
105000
100000
95000
90000
85000
80000
75000
70000
65000 LightingLoad
13.3
13.25
13.2
13.15
13.1
13.05
13
12.95
BuildingOrientation 300
250200
150100
500
An
nu
al_
Op
_C
os
t_T
ota
l
120000
115000
110000
105000
100000
95000
90000
85000
80000
75000
70000
65000 ShadeControl
2
1.9
1.8
1.7
1.6
1.5
1.4
1.3
1.2
1.1
1 BuildingOrientation 300
250200
150100
500
An
nu
al_
Op
_C
os
t_T
ota
l
120000
115000
110000
105000
100000
95000
90000
85000
80000
75000
70000
65000 DayThresh
100000
90000
80000
70000
60000
50000
40000
30000
20000
10000
ExternalWallConstruction 1004
1003.81003.6
1003.41003.2
1003
An
nu
al_
Op
_C
ost_
To
tal
120000
115000
110000
105000
100000
95000
90000
85000
80000
75000
70000
65000 WindowConstruction
4004
4003.8
4003.6
4003.4
4003.2
4003
4002.8
4002.6
4002.4
4002.2
4002 ExternalWallConstruction 1004
1003.81003.6
1003.41003.2
1003
An
nu
al_
Op
_C
ost_
To
tal
120000
115000
110000
105000
100000
95000
90000
85000
80000
75000
70000
65000 LightingLoad
13.3
13.25
13.2
13.15
13.1
13.05
13
12.95
ExternalWallConstruction 1004
1003.81003.6
1003.41003.2
1003
An
nu
al_
Op
_C
os
t_T
ota
l
120000
115000
110000
105000
100000
95000
90000
85000
80000
75000
70000
65000 ShadeControl
2
1.9
1.8
1.7
1.6
1.5
1.4
1.3
1.2
1.1
1 ExternalWallConstruction 1004
1003.81003.6
1003.41003.2
1003
An
nu
al_
Op
_C
os
t_T
ota
l
120000
115000
110000
105000
100000
95000
90000
85000
80000
75000
70000
65000 DayThresh
100000
90000
80000
70000
60000
50000
40000
30000
20000
10000
WindowConstruction 4004
4003.54003
4002.54002
An
nu
al_
Op
_C
os
t_T
ota
l
120000
115000
110000
105000
100000
95000
90000
85000
80000
75000
70000
65000 LightingLoad
13.3
13.25
13.2
13.15
13.1
13.05
13
12.95WindowConstruction
40044003.5
40034002.5
4002
An
nu
al_
Op
_C
os
t_T
ota
l
120000
115000
110000
105000
100000
95000
90000
85000
80000
75000
70000
65000 ShadeControl
2
1.9
1.8
1.7
1.6
1.5
1.4
1.3
1.2
1.1
1
WindowConstruction 4004
4003.54003
4002.54002
An
nu
al_
Op
_C
ost_
To
tal
120000
115000
110000
105000
100000
95000
90000
85000
80000
75000
70000
65000 DayThresh
100000
90000
80000
70000
60000
50000
40000
30000
20000
10000LightingLoad
13.313.2
13.113
An
nu
al_
Op
_C
ost_
To
tal
120000
115000
110000
105000
100000
95000
90000
85000
80000
75000
70000
65000 ShadeControl
2
1.9
1.8
1.7
1.6
1.5
1.4
1.3
1.2
1.1
1
LightingLoad 13.313.2
13.113
An
nu
al_
Op
_C
os
t_T
ota
l
120000
115000
110000
105000
100000
95000
90000
85000
80000
75000
70000
65000 DayThresh
100000
90000
80000
70000
60000
50000
40000
30000
20000
10000
ShadeControl 21.951.91.851.81.751.71.651.61.551.51.451.41.351.31.251.21.151.11.051
An
nu
al_
Op
_C
os
t_T
ota
l
120000
115000
110000
105000
100000
95000
90000
85000
80000
75000
70000
65000 DayThresh
100000
90000
80000
70000
60000
50000
40000
30000
20000
10000

CHAPTER 2 25
Figure 6: Asymmetries used to determine ASI for Advanced Design Process. First order interaction between all combinations of Variables. Graphs generated by PIDO technology.
First Cost
Energy Savings
First Cost
Energy Savings
Figure 7: Estimated Impact on annual operating costs and first cost by Variable. Diagrams, generated by PIDO, show that one Variable (window construction) out of nine has competing Impacts on project Goals (energy use vs. first cost). These results are used to determine ISC.
Bld_Len
74.766.458.149.841.5
120000
100000
80000
w in_to_w all_ratio1
0.90.80.70.60.50.4
120000
100000
80000
HVAC_System
8.88.487.67.2
120000
100000
80000
BuildingOrientation
315252189126630
120000
100000
80000
ExternalWallConstruction
10041003.51003
120000
100000
80000
Window Construction
40044003.540034002.54002
120000
100000
80000
LightingLoad
13.213
120000
100000
80000
ShadeControl
21.81.61.41.21
120000
100000
80000
DayThresh
10000050000
120000
100000
80000
Bld_Len
70605040
3.5e+006
3e+006
2.5e+006
2e+006
w in_to_w all_ratio1
0.90.80.70.60.50.4
3.5e+006
3e+006
2.5e+006
2e+006
HVAC_System
8.88.487.67.2
3.5e+006
3e+006
2.5e+006
2e+006
BuildingOrientation
315252189126630
3.5e+006
3e+006
2.5e+006
2e+006
ExternalWallConstruction
10041003.51003
3.5e+006
3e+006
2.5e+006
2e+006
Window Construction
40044003.540034002.54002
3.5e+006
3e+006
2.5e+006
2e+006
LightingLoad
13.313.213.113
3.5e+006
3e+006
2.5e+006
2e+006
ShadeControl
21.81.61.41.21
3.5e+006
3e+006
2.5e+006
2e+006
DayThresh
10000050000
3.5e+006
3e+006
2.5e+006
2e+006
Annual_Op_Cost_Total
Total_construction_cost
Bld_Len
74.766.458.149.841.5
120000
100000
80000
w in_to_w all_ratio1
0.90.80.70.60.50.4
120000
100000
80000
HVAC_System
8.88.487.67.2
120000
100000
80000
BuildingOrientation
315252189126630
120000
100000
80000
ExternalWallConstruction
10041003.51003
120000
100000
80000
Window Construction
40044003.540034002.54002
120000
100000
80000
LightingLoad
13.213
120000
100000
80000
ShadeControl
21.81.61.41.21
120000
100000
80000
DayThresh
10000050000
120000
100000
80000
Bld_Len
70605040
3.5e+006
3e+006
2.5e+006
2e+006
w in_to_w all_ratio1
0.90.80.70.60.50.4
3.5e+006
3e+006
2.5e+006
2e+006
HVAC_System
8.88.487.67.2
3.5e+006
3e+006
2.5e+006
2e+006
BuildingOrientation
315252189126630
3.5e+006
3e+006
2.5e+006
2e+006
ExternalWallConstruction
10041003.51003
3.5e+006
3e+006
2.5e+006
2e+006
Window Construction
40044003.540034002.54002
3.5e+006
3e+006
2.5e+006
2e+006
LightingLoad
13.313.213.113
3.5e+006
3e+006
2.5e+006
2e+006
ShadeControl
21.81.61.41.21
3.5e+006
3e+006
2.5e+006
2e+006
DayThresh
10000050000
3.5e+006
3e+006
2.5e+006
2e+006
Annual_Op_Cost_Total
Total_construction_cost

CHAPTER 2 26
Figure 8: Estimated percentage impact on Net Present Value ranked by Variable. Graph generated by PIDO. The following series of “importance percentages” were used to calculate VSD 0,1,4,8,10,14,15,16,32 for our case study according to the following equation.
Window Area
Geometry
HVAC System
Shading
Orientation
Daylighting
Window Type
Lighting
Wall Construction10098969492908886848280787674727068666462605856545250484644424038363432302826242220181614121086420
w in_to_w all_ratio1
Bld_Len
HVAC_System
ShadeControl
BuildingOrientation
DayThresh
Window Construction
LightingLoad
ExternalWallConstruction
32%
16%
15%
14%
10%
8%
4%
1%
0%
10098969492908886848280787674727068666462605856545250484644424038363432302826242220181614121086420
w in_to_w all_ratio1
Bld_Len
HVAC_System
ShadeControl
BuildingOrientation
DayThresh
Window Construction
LightingLoad
ExternalWallConstruction
32%
16%
15%
14%
10%
8%
4%
1%
0%
68.48
32
9100
102.11

CHAPTER 3 1
Design Exploration Assessment Methodology: Testing the Guidance of
Design Processes
Caroline M. Clevenger, John R. Haymaker, Andrew B. Ehrich
Department of Civil and Environmental Engineering, Stanford University, Stanford,
California, United States of America
[email protected] Colorado State University, 1291 W Laurel St., Fort
Collins, CO, 80523, USA
This paper introduces the Design Exploration Assessment Methodology (DEAM) for
documenting strategies, challenges, and resulting explorations of design processes. Current
practice lacks the ability to reliably generate high performing alternatives. Furthermore,
designers do not have systematic means to compare and evaluate existing or emerging practice. Researchers lack empirical data to test and evaluate the dimensions of design
process. We document and apply DEAM to professional implementation of six strategies
across two challenges using the charrette test method. Results rank strategies according to
their ability to guide exploration from worst to best: random guessing, tacit knowledge, point
analysis, combined point and trend analysis trend analysis alone, and full analysis. Results
are surprising - more data does not always help the designer- we discuss possible
explanations, and conclude with a discussion of the strengths and weaknesses of DEAM. Our
findings demonstrate that it is possible and instructive to apply DEAM in the domain of
energy efficiency to assess differences in guidance afforded by distinct design processes.
Keywords: guidance, strategy, challenge, exploration, design space, multidisciplinary decision-
making, sustainable design, building, energy
Introduction
Performance-based design consists of Exploration supported by design Strategies to
generate and analyze Alternatives, and address Challenges with explicit Objectives.
Strategies range from informal to formal. As Strategies emerge, designers currently lack a
method to assess the Guidance provided. We define design Guidance as the relative
impact of Strategy on Exploration for a given Challenge. To assess Guidance, designers
need comparisons of these dimensions across processes. In previous research, based on
literature review and industry observation, we synthesize a set of metrics and
comprehensive framework to describe and characterize Design Processes (Clevenger &
Haymaker, 2010a). Metrics enable quantitative evaluation and comparison. Frameworks,
structures which conceptually relate process components, are important because they can
be used to prescribe process improvement (Dorst, 2008).
While existing literature proposes metrics such as flexibility, robustness, survivability
(Phadke & Taguchi, 1987; Simpson et al., 1996; Shah et al., 2003; McManus et al., 2007)
to help assess design, none of the sets of metrics fully characterize all Design Process
dimensions- Challenge, Strategy and Exploration (Clevenger & Haymaker, 2010a).
Existing frameworks formalize and organize the components of design, but fail to fully
characterize their relationships (Akin, 2001; McManus et al., 2007; Chachere &
CHAPTER 3 2
Haymaker, 2008). Specifically they do not help to align specific Strategies with specific
Challenges. Our Design Exploration Assessment Methodology (DEAM) enables
quantitative and objective assessment of the Guidance provided by a Design Process.
In this paper, we describe our laboratory experiment to provide evidence for the power of
DEAM. In our experiment, we assess the Guidance resulting from six select design
Strategies across two design Challenges. The domain of the Challenges addressed is
energy efficiency, although other Challenges could be similarly tested. For this research
we adhere to the following definitions (Clevenger & Haymaker, 2010a). We present the
definitions in reverse order to our framework for performance-based design (Clevenger &
Haymaker, 2010a, Figure 1) to emphasize their cumulative nature. We use capitalization
throughout this paper to indicate explicit reference to these definitions.
Stakeholder: Party with a stake in the selection of Alternatives.
Preference: Weight assigned to a Goal by a Stakeholder.
Goal: Declaration of intended properties of design solution(s).
Constraint: Limit placed on either Options or Impacts.
Objective: Union of stakeholders, goals, preferences and constraints.
Variable: A decision to be made. Frequently discrete, a Variable can also be
continuous (i.e, building length).
Option: Individual Variable input(s).
Alternative: Unique combination of Options.
Impact: Alternative’s estimated performance according to a specified Goal.
Value: Net performance of an Alternative as a function of Impact and Stakeholder
Preferences relative to all Goals.
Challenge: A set of decisions to be made regarding Variables ranging from simple
to complex.
Strategy: Set of steps used to generate the basis for decisions regarding Variables
ranging from no steps (none) to an advanced sequence.
Exploration: A history of decisions made regarding Variables ranging from
random to guided.
Guidance: Relative impact of a Strategy on Exploration for a given Challenge.
Design Process: Implementation of a Strategy resulting in an Exploration for a
given Challenge.
We adopt the following Design Process metrics (Clevenger & Haymaker, 2010a):
Objective Space Size (OSS) is the count of the number of Goals being analyzed by a
given Strategy for the project.
Alternative Space Interdependence (ASI) is the number of first order interactions
among design Variables divided by total number of Variable combinations. It
represents the extent to which interactive affects Impact performance.

CHAPTER 3 3
Impact Space Complexity (ISC) is the number of Variables found to result in
performance trade-offs (divergent Impacts) divided by total number of Variables. It
represents the percent of Variables with competing Objectives.
Value Space Dominance (VSD) is the extent to which performance prospects are
dominated by individual Variables. It represents the importance of individual design
decisions.
Objective Space Quality (OSQ) is the extent to which (0 to 1) the Goals analyzed
match the goals proposed on a project.
Alternative Space Sampling, (ASS) is the number of Alternatives generated divided by
the number of Alternatives required for a “significant sampling” of the entire
Alternative Space (all feasible Alternatives.) It measures how the extent to which a
sampling is “representative” of the Alternative Space (Clevenger & Haymaker,
2010a). Significant sampling can be determined mathematically using standard
statistical techniques to calculate “sample size.” Such mathematics, however, is
beyond the scope of this research. For comparative purposes when the statistically
significant sample size is unknown, we use the total population of Alternatives.
Alternative Space Flexibility (ASF) is the average number of Option changes between
any two Alternatives divided by the number of Variables modelled. This metric
indicates the variety achieved in Alternatives generated in a given Exploration.
Value Space Average (VSA) is the mean Value for the set of Alternatives analyzed.
This metric characterizes the average performance of Alternatives generated in an
Exploration.
Value Space Range (VSR) is the standard deviation in Value for the set of Alternatives
analyzed. This metric characterizes the dispersion of Alternatives generated in an
Exploration.
Value Space Iterations (VSI) is the number of Alternatives generated before the
highest Value is reached. This metrics characterizes the efficiency of an
Exploration.
Value Space Maximum (VSM) is the top Value calculated for Alternatives generated
in a given design Exploration. This metric characterizes the maximum Value
generated in an Exploration.
Design Exploration Assessment Methodology (DEAM)
Using these terms and metrics and building on previous work (Clevenger et al, 2008), we
develop and implement Design Exploration Assessment Methodology (DEAM) to
measure and compare the Guidance afforded by distinct Design Processes. DEAM
consists of the following six steps:
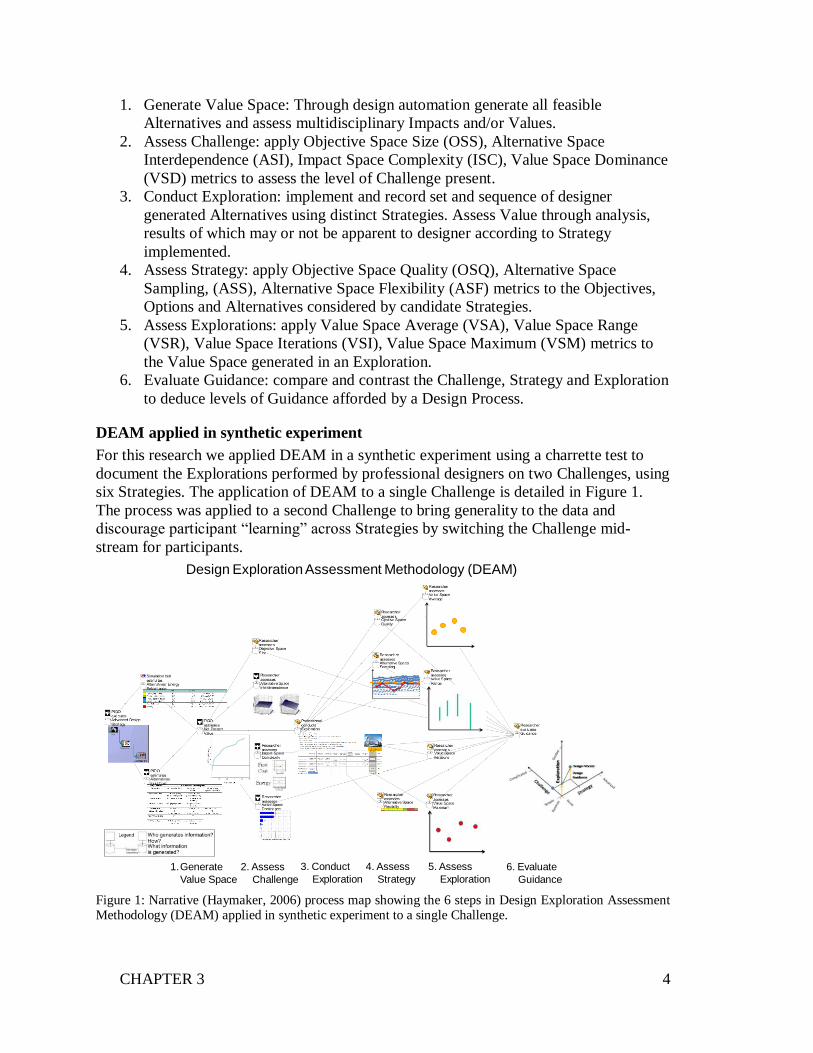
CHAPTER 3 4
1. Generate Value Space: Through design automation generate all feasible
Alternatives and assess multidisciplinary Impacts and/or Values.
2. Assess Challenge: apply Objective Space Size (OSS), Alternative Space
Interdependence (ASI), Impact Space Complexity (ISC), Value Space Dominance
(VSD) metrics to assess the level of Challenge present.
3. Conduct Exploration: implement and record set and sequence of designer
generated Alternatives using distinct Strategies. Assess Value through analysis,
results of which may or not be apparent to designer according to Strategy
implemented.
4. Assess Strategy: apply Objective Space Quality (OSQ), Alternative Space
Sampling, (ASS), Alternative Space Flexibility (ASF) metrics to the Objectives,
Options and Alternatives considered by candidate Strategies.
5. Assess Explorations: apply Value Space Average (VSA), Value Space Range
(VSR), Value Space Iterations (VSI), Value Space Maximum (VSM) metrics to
the Value Space generated in an Exploration.
6. Evaluate Guidance: compare and contrast the Challenge, Strategy and Exploration
to deduce levels of Guidance afforded by a Design Process.
DEAM applied in synthetic experiment
For this research we applied DEAM in a synthetic experiment using a charrette test to
document the Explorations performed by professional designers on two Challenges, using
six Strategies. The application of DEAM to a single Challenge is detailed in Figure 1.
The process was applied to a second Challenge to bring generality to the data and
discourage participant “learning” across Strategies by switching the Challenge mid-
stream for participants.
Figure 1: Narrative (Haymaker, 2006) process map showing the 6 steps in Design Exploration Assessment Methodology (DEAM) applied in synthetic experiment to a single Challenge.
Alternatives Generated using Advanced Modeling
Professional
Exploration
Target
(55 kBTU/sf/yr)
Energy Savings
Design Exploration Assessment Methodology (DEAM)
1.Generate
Value Space
2. Assess
Challenge
3. Conduct
Exploration
4. Assess
Strategy
5. Assess
Exploration
6. Evaluate
Guidance

CHAPTER 3 5
The following steps were completed in our synthetic experiment.
Step 1- Generate Value Space: we used Process Integration Design Optimization
software (PIDO) (Flager et al., 2009) to automate input generation and analysis of
EnergyPlus (LBNL, 2008) and to perform a full analysis of two simple building models,
representing new construction and renovation project Challenges. Full analysis provided
first cost and annual energy cost estimates. We assessed Value in units of Net Present
Value ($) for all feasible Alternatives, a total of 864 and 576 respectively, for the new
construction and renovation case studies.
Step 2- Assess Challenge: we applied our Challenge metrics to the results of our full
analysis for both Challenges modelled (See Clevenger & Haymaker, 2010a for additional
detail on all Metric calculations.)
Step 3- Conduct Exploration: we collected charrette test data using our custom software,
Energy Explorer, to generate and document professional design Explorations. Energy
Explorer is an interface providing easy “look-up” for energy model results (previously
simulated) as well as documentation of the Alternatives generated using various
Strategies (Figures 4-9).
Step 4- Assess Strategy: we applied our Strategy metrics to six Strategies implemented in
the experiment. The six Strategies evaluated include: random guessing, tacit knowledge,
point-based analysis, trend-based analysis, trend and point-based analysis, and full
analysis. Process diagrams of these Strategies are provided in Figures 4-9.
Step 5- Assess Exploration: we applied our Exploration metrics to charrette test results
for the six Strategies applied to two Challenges.
Step 6- Evaluate Guidance: we compared Explorations assessments relative to Strategy
and Challenge to evaluate Guidance afforded by each combination. We next provide
greater detail on the application of DEAM to this synthetic experiment in the following
sections.
Value Space Generated
The first step of DEAM is to generate and analyze all feasible Alternatives to establish
Value Space (Clevenger & Haymaker, 2010a). For this experiment, we executed full
analysis by applying a Design of Experiment (DoE) to our building performance models
(Box et al, 2005) using a PIDO script (Flager et al, 2009) to automate EnergyPlus energy
modelling software. We applied full analysis to two distinct Challenges. The Objective
of both Challenges was to maximize the Net Present Value (NPV) of decisions regarding
energy efficiency. The first case simulated the renovation of a 3 story, 100,000 sf,
rectilinear office building located in Phoenix, Arizona. Eight Variables were modelled to
represent potential decisions in an energy efficiency upgrade. Table 1 lists the Options for
the Variables modelled in the renovation test case with associated first cost implications.
The second case simulated the design of a new 3 story, 100,000 sf, rectilinear office
building located in Burlington, Vermont. Eight Variables were modelled to represent

CHAPTER 3 6
decisions with impacts on energy performance for new construction. Table 2 lists the
Options for the Variables and associated first cost estimates modelled in the new
construction case. The main difference between the renovation and new construction
cases is the inclusion of geometric Variables in the new construction case. While in
reality geometric variables are continuous, we modelled all Variables as discrete options.
Table 1: Options modelled for Renovation Project, Phoenix, Arizona.
Variable Existing Condition
(baseline cost )
Options
(cost delta)
Window Type double-pane
($0)
double-pane, Low-E
($879,580)
Argon filled, Low-E
($1,055,360)
Lighting Load 1.2 W/sf
($0)
1 W/sf
($74,980)
0.8W/sf
($330,000)
Exterior
Shading
No exterior shading
($0)
50% exterior shading
($760,890)
Daylight
Controls
No Daylight Controls
($0)
Daylight Controls
($3000)
Roof Type Uninsulated Concrete Roof
($0)
2" Rigid insulation on
Concrete Roof ($55,750)
Interior Office
Equipment
5W/sf
($0)
2W/sf
($66,900)
Wall
Insulation
R-11 Insulation
($0)
R-19 Insulation
($17,990)
HVAC
Efficiency
Existing VAV System
($0)
High Efficiency VAV
(~$3.1m - ~$4.9m)1
1. If the HVAC system is upgraded, the size (and cost) of the system depends on other Options. For the existing
system, size (and cost) is fixed and independent of other Options.
Table 2: Options modelled for New Construction Project, Burlington Vermont.
Variable Options
(first cost factor per sf)
Window Type double-pane
($19/sf) double-pane, Low-E
($32/sf) double-pane, low-e, argon filled ($39/ sf)
Lighting Load 1W/sf
($2/ sf building area)
0.8W/sf
($3.3/ sf building area)
Exterior
Shading
No exterior shading
($0/ sf)
50% exterior shading ($24/
sf)
Daylight
Controls
No Daylight Controls
($0/ft2)
Daylighting Controls
($125/unit)
Building
Shape
Square
[1:1 aspect ratio] ($0/ sf)
Rectangular
[1:2 aspect ratio] ($0/ sf)
Long-Skinny
[1:5 aspect ratio] ($0/sf)
Building
Orientation
0
(rotation from N)
45
(rotation from N)
90
(rotation from N)
Window to
Wall Ratio
40%
($/sf)1
90%
($/sf)1
HVAC System
Type
Constant Volume2
($8 / sf building area)
Variable-Air-Volume2
(~$9.3/ sf building area) 1. Cost dependent on window type and aspect ratio. 2. The size (and cost) of the HVAC system depends on other decisions.
PIDO and EnergyPlus were used to generate the Impacts of the Alternatives on first cost
and energy use. Full analysis was run for both Challenges. The following equations were

CHAPTER 3 7
used to calculate Value in units of NPV for the two Challenges. A $.10/kWh energy cost
and 3% inflation rate were assumed in both equations:
Equation 1:
Renovation NPV = 30 year Discounted Annual Energy Cost Savings ($) - First Cost ($)
Equation 2:
New Construction NPV = Baseline Budget - 30 year Discounted Annual Energy Costs
($) - First Cost($)
NPV estimates were intended to be internally consistent, rather than accurate
representations of true or full costs. For example, plumbing costs were not included, the
potential impact of site conditions relative to building orientation were not considered,
and utility rates were assumed to be fixed over the 30 years modelled. These abstractions
reduced calculation time, managed the number of Alternatives analyzed, and avoided
introducing uncertainty. We do not expect these abstractions to impact Exploration
results.
Results of the full analysis of the two Challenges are shown in Figure 2. Both models
varied eight Variables, however, the number of Options for the Variables differed for the
two cases. The renovation case modelled a total of 576 Alternatives. The new
construction case modelled a total of 864 Alternatives.
Figure 2: Full analysis of Alternatives in renovation and new construction Challenges ordered by Value,
NPV ($) performance. Inset shows clusters of Value generated by changing Options for individual
Variables in a given Challenge. In general, although the renovation case includes fewer Alternatives, there is a larger range of performance and a higher maximum Value than for the new construction case. For more
information regarding the performance of the sets of Alternatives which comprise the Value Spaces for
each Challenge see Table 5 characterization of the full analysis Strategy.
Alternative
New Construction
Renovation

CHAPTER 3 8
Challenge Assessed
After Value Space is generated, the next step in DEAM is to assess the Challenge
revealed. Table 3 shows Challenge metric evaluated for the renovation and new
construction cases.
Table 3: Challenge Metrics Evaluated for renovation and new construction Challenges. Results support
characterization and comparison of the two Challenges.
Challenge
Metric Renovation New Construction
Objective Space Size (OSS) 2 2
Alternative Space Interdependence (ASI) .58 .70
Impact Space Complexity (ISC) .25 .25
Value Space Dominance (VSD) .69 .37
Evaluation of these metrics supports the following observations about the two
Challenges:
1) Objective Space Size (OSS) is 2 for both cases since first cost and annual energy
cost are modelled in both cases.
2) Alternative Space Interdependence (ASI) is higher in the new construction case,
meaning more interactions exist among the 26 pairings of Variables in the new
construction design space than the renovation design space.
3) Impact Space Complexity (ISC) is equal in both cases meaning the renovation and
new construction design spaces include a similar number of design trade-offs.
Both Challenges have the same number of Goals (2) and Variables (8). Analysis
reveals that for both cases two Variables, window type and exterior shading, have
competing Impacts.
4) Value Space Dominance (VSD)is significantly higher for in the renovation case,
meaning select Variables in the renovation design space are more dominant than
select Variables in the new construction design space. Evaluation of ranked
Impacts of individual Variables on Value (NPV) demonstrates that one decision,
HVAC efficiency, is highly dominant in renovation. Two decisions, geometry
and window area, are, to a lesser degree, dominant in new construction.
Metrics indicates that the new construction Challenge is more complicated than the
renovation Challenge. Although the number of Objectives and complexity of Impacts is
comparable, more interactions occur between similarly influential Variables, in the new
construction case. Furthermore, a greater number of Alternatives exist in the new
construction design space.
Exploration Conducted
The next step in DEAM is to conduct the Exploration. To gather data, we used the Charrette Test
Method (Clayton et al, 1998)- an established research technique that “employs a short but intensive design problem and compares the performance of several designers in undertaking the
problem using various carefully defined design processes.” We developed a custom Excel

CHAPTER 3 9
spreadsheet we called the Energy Explorer (Figure 3). With this tool, designers are able to
quickly and easily generate and record Alternatives. Supporting the interactive interface are hidden libraries containing the results from pre-simulated full NPV analyses for both the new
construction and renovation Value spaces. Participants have either no access, or access to point or
trend data depending on which Strategy they implement (Table 4).
Figure 3: Custom interface for Energy Explorer, an interactive software tool used by charrette participants
to analyze and document Explorations supported by various Strategies.
The following two figures show sample new construction Alternatives generated by
participants using the Energy Explorer interface. Using the tacit knowledge Strategy,
participants do not have access to NPV data (Figure 4). Using the point data Strategy
they have access to individual Alternative’s NPV Value data (Figure 5).
Figure 4: Sample Energy Explorer interface showing a designer generated new construction
Alternative using tacit knowledge.
Figure 5: Sample Energy Explorer interface showing a designer generated new construction
Alternative with instant access to Value (NPV) Point Data.
Charrette tests were conducted on two different occasions, with 15 building industry
professional participants. These participants were asked to answer several questions
Calculated ”Real-time” Net Present Value
“Simulate” Button looks up pre-processed data
Net Present Value Calculation Call-out
Pull-down menu
Duplicate Button Short-cut
Window TypeLighting
Load
Exterior
Shading
Daylighting
Controls
Building Plan
Aspect Ratio
Building
Orientation
(from North)
Window-to-
Wall Ratio
HVAC System
Type
Design Alternative 1Double-Pane, Low-E
($346/m2)
1 W/sf
($22/m2
building area)
No Exterior Shading
($0)
Daylighting Controls
($125/unit)Rectangular (1:2) 0 0.4
VAV System ($100
/m2 building area)
Window Type Lighting LoadExterior
Shading
Daylighting
Controls
Building Plan
Aspect Ratio
Building
Orientation
(from North)
Window-to-
Wall Ratio
HVAC System
TypeNPV
Design Alternative 1Double-Pane, Low-E
($346/m2)
1 W/sf ($22/m2
building area)
No Exterior Shading
($0)
Daylighting
Controls
($125/unit)
Rectangular (1:2) 0 0.4VAV System ($100
/m2 building area)1 $1,323,405Simulate!

CHAPTER 3 10
regarding professional background. Information regarding professional background was
not used in the statistical analysis of results. Nevertheless, we briefly summarize
participant profiles here to highlight the diversity of professionals who participated in the
two charrettes. Professional roles of participants included: 4 Energy Analyst/Consultants
, 2 Construction Managers, 3 Mechanical Engineers, 4 Program Managers, 1
Designer/Architect, 1 Owner/operator; years of experience in industry ranged from 0-5 to
over 20; and, level of self-reported energy expertise ranged from low to high (with no
individuals claiming to be an expert although several worked as energy consultants). Not
surprisingly, given the variety of industry roles represented, participants had significantly
different exposure to energy modelling in practice with a few individuals reporting that
energy modelling was used on 0-5% of their projects and others reporting it was used on
>75% of their projects. Finally, on the real-world projects where energy modelling was
performed, nearly all professionals report that typically 2-5 energy simulations were run.
This estimate is consistent with the findings of other researchers (Flager & Haymaker,
2007), (Gane & Haymaker, 2009), although in another similar case study the authors
observed 13 simulations were performed (Clevenger & Haymaker, 2010a).
Strategies Assessed
Participants completed a total of four Explorations each using a different Strategy to
generate of up to 10 Alternatives. They generated Alternatives using a sequence of pull-
down menus to access look-up tables using the Energy Explorer interface. During the
charrette, the Energy Explorer tool recorded all Explorations performed. The Challenge
posed to designers (either renovation or new construction) was switched mid-charrette to
provide experimental redundancy and prevent participant “learning” between trials. In all
cases the stated Objective to participants is to maximize Value (NPV).
In addition, to bracket these empirical results, we provide theoretical Exploration results
based on random guessing and full analysis. Detailed descriptions of the six Strategies
and their process maps (Haymaker, 2006) are provided (Figures 6-11). . In the process
maps, an Alternative generated is represented by a vertical column of discrete color-
coded squares representing individual Option decisions.
Design Strategy 1: Random Guessing-- A random algorithm generates ten
Alternatives. Objectives are not required. Nevertheless, Value (NPV) is used to
evaluate the observed Explorations.
Figure 6: Process Map of Alternative generation using random guessing.
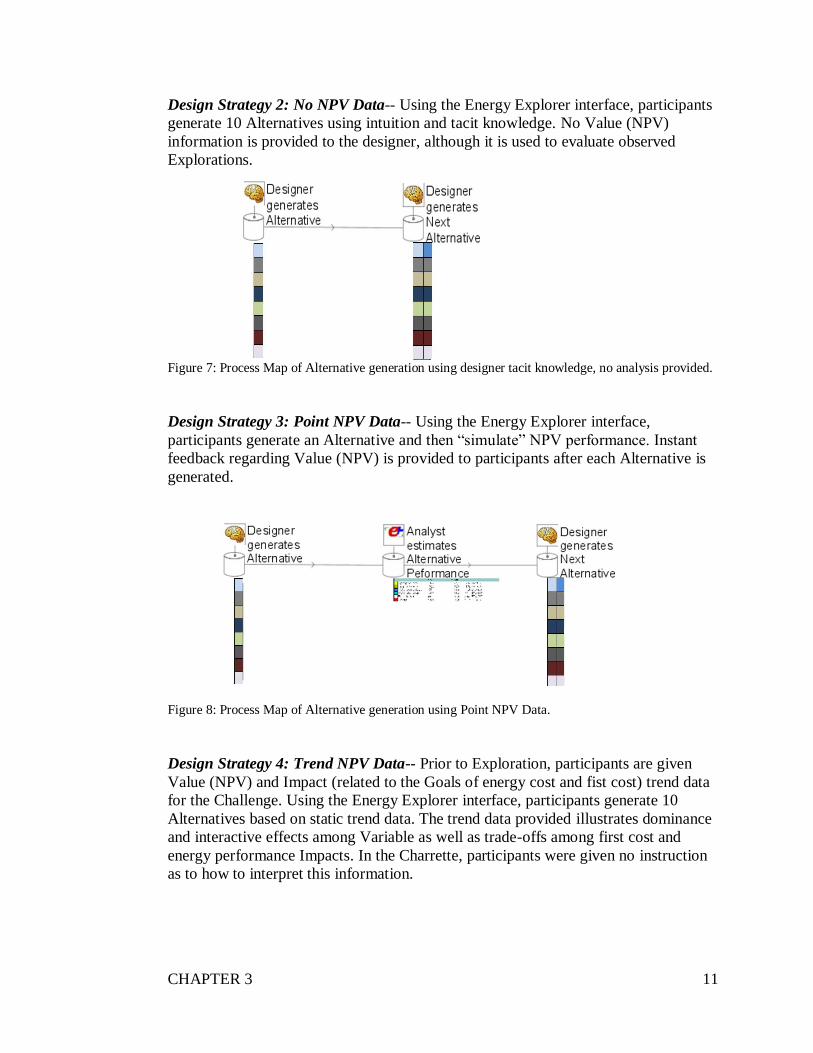
CHAPTER 3 11
Design Strategy 2: No NPV Data-- Using the Energy Explorer interface, participants
generate 10 Alternatives using intuition and tacit knowledge. No Value (NPV)
information is provided to the designer, although it is used to evaluate observed
Explorations.
Figure 7: Process Map of Alternative generation using designer tacit knowledge, no analysis provided.
Design Strategy 3: Point NPV Data-- Using the Energy Explorer interface,
participants generate an Alternative and then “simulate” NPV performance. Instant
feedback regarding Value (NPV) is provided to participants after each Alternative is
generated.
Figure 8: Process Map of Alternative generation using Point NPV Data.
Design Strategy 4: Trend NPV Data-- Prior to Exploration, participants are given
Value (NPV) and Impact (related to the Goals of energy cost and fist cost) trend data
for the Challenge. Using the Energy Explorer interface, participants generate 10
Alternatives based on static trend data. The trend data provided illustrates dominance
and interactive effects among Variable as well as trade-offs among first cost and
energy performance Impacts. In the Charrette, participants were given no instruction
as to how to interpret this information.

CHAPTER 3 12
Figure 9: Process Map of Alternative generation using Trend NPV Data.
Design Strategy 5: Trend + Point NPV Data-- Prior to Exploration, participants are
given Value (NPV) and Impact (related to the Goals of energy cost and fist cost)
trend data for the Challenge. Armed with this information, participants generate an
Alternative and then “simulate” NPV performance. Instant feedback regarding Value
(NPV) is provided to participants after each Alternative is generated.
Figure 10: Process Map of Alternative generated using Trend NPV Data and Point NPV Data.
Design Strategy 6: Full Analysis-- Prior to Exploration, a full DoE analysis of Value
(NPV) is completed. This strategy selects the Alternative(s) that full analysis
calculates to have maximum Value (NPV).

CHAPTER 3 13
Figure 11: Process Map of Alternative selected based on full analysis of NPV performance.
Table 4 shows the Strategy metrics evaluated for the six Strategies tested. The
Alternative Space Sampling (ASS) metric and Alternative Space Flexibility (ASF) metric
are assessed as averages for the Strategies applied to both renovation and new
construction Challenges. Individual calculations are shown beneath Alternative Space
Sampling (ASS) assessments. Alternative Space Flexibility (ASF)calculations are bases
on detailed evaluation of Alternatives generated by participants using a given Strategy.
For more information about how metrics are calculated see Clevenger & Haymaker,
2010a.
Table 4: Strategy Metrics Evaluated for six Strategies tested. Results support characterization and
comparison of Strategies.
Metric
Random Guessing
No NPV
Data (Tacit Knowledge)
Point
NPV Data
Trend
NPV Data
Trend +
Point
NPV Data
Full Analysis
Objective Space
Quality (OSQ) 0 ~.5 1 ~.5 1 1
Alternative Space
Sampling (ASS)
0
0
~.015
(10/576;
10/864)
~.40
(231/576;
266/864)
~.415
1
(576/576;
864/864)
Alternative Space
Flexibility (ASF) ~.5 .25 .19 .31 .23 0
Statistically significant sample sizes were calculated for confidence levels of 95% and confidence intervals of +/- 5%: 231 Alternatives for the Renovation case, 266 Alternatives for the New Construction case.
For the Strategies providing Value (NPV) results to designers, OSQ = 1 since both first
cost and energy usage costs Impacts are modelled. Neither tacit knowledge nor trend data
Strategies provides specific Impact results for first cost or energy costs. Although Impact
patterns are identified, without specific Impact data for individual Goals, we assign OSQ

CHAPTER 3 14
= .5 for these Strategies. While trend data in our initial application of PIDO was
calculated based on full analysis, ASS for trend (NPV) data in Table 4 is calculated
relative to statistical sampling. For additional research about the Value of Information
generated by various Strategies see Clevenger & Haymaker, 2010c. Finally, ASF for
random guessing is assumed to be ~.5, meaning a random generator would, on average,
change the Options for half of the Variables modelled. After random guessing, the
Strategies which resulted in Alternatives with more flexibility among Options in
Alternatives were trend data, followed by tacit knowledge and trend + point data. This
finding will be discussed more fully in the discussion of results section.
Overall assessment of the Strategies is multi-faceted and based on all three metrics.
Debate exists in design theory regarding the merits of such measurements. For example,
researchers have tried to determine if the depth versus breadth approach is better for the
generation of Alternatives. Most agree that design improvement and innovation are
generally supported by the generation of a greater quantity of Alternatives (Sutton, 2002).
For the purposes of this research, we assume that each Strategy metric is to be
maximized. By simply summing the three metrics for the three Strategies, we evaluate
the Strategies tested from least to most advanced as follows. Note the sum of metrics for
tacit knowledge and point data Strategies are nearly equal:
Least Advanced
Strategy 1: Random Guessing
Strategy 2: No NPV Data (Tacit Knowledge) / Strategy 3: Point NPV Data
Strategy 4: Trend NPV Data
Strategy 5: Trend + Point NPV Data
Strategy 6: Full Analysis
Most Advanced
This assessment of how advanced a given Strategy is, appears intuitive and aligns with
the amount of data provided by a given Strategy.
Explorations Assessed
The next step in DEAM is to analyze the Exploration guided by the Strategy tested. Table
5 summarizes the results of the application of our Exploration metrics to the six
Strategies and two Challenges. Results, originally NPVs, are normalized to percentages
of Value Space maximum. For example, Value Space Average (VSA) for an Exploration
shown in Table 5 is the Average Value achieved among Alternatives generated using a
given Strategy over the Maximum Value of the full Value Space generated by full
analysis. Value Space Iterations (VSI) is the exception; assessments represent the
number of iterations generated prior to achieving maximum Value in a given Exploration.
We present the results for both renovation and new construction Challenges.

CHAPTER 3 15
Table 5: Exploration Metrics evaluated for the six Strategies and two Challenges tested. Data is shown as a
percentage of the maximum Value of the Value Space. In the renovation case, full analysis reveals there are
a significant number of Alternatives with a low Value, which results in a low Value Space Average (VSA).
Conversely, in the new construction case, full analysis reveals there are a significant number of
Alternatives with a relatively high Value, which results in a high Value Space Average (VSA). Results for
Explorations supported by other Strategies are also shown and provide a basis of comparison.
Metric Challenge
Random
Guessing
No NPV
Data (Tacit
Knowledge)
Point
NPV
Data
Trend
NPV
Data
Trend +
Point
NPV Data
Full
Analysis
Value Space
Average
(VSA)
Renovation
New
Construction
~30%
~74%
51%
79%
58%
86%
73%
87%
53%
84%
30%
74%
Value Space
Range
(VSR)
Renovation
New
Construction
<37%
<18%
41%
15%
38%
13%
28%
17%
43%
24%
37%
18%
Value Space Iterations
(VSI)
Renovation
New
Construction
~5
~5
4.2
5.0
5.7
5.8
4.4
2.4
3.8
4.0
576
864
Value Space
Maximum
(VSM)
Renovation
New
Construction
~67%
~92%
92%
97%
92%
95%
93%
99%
76%
98%
100%
100%
Findings:
1. Tacit knowledge guides the generation of Alternatives with higher average Value
(VSA) than random guessing.
o Supporting evidence: The average Value (VSA) of Alternatives generated
using tacit knowledge was, on average, superior to the average Value of
Alternatives guided by random guessing. The improvement maintains
statistical significance by a margin of 44% for the renovation Challenge,
and 3% in the new construction Challenge.
2. Point data guides the generation of Alternatives with higher average Value (VSA)
than tacit knowledge.
o Supporting evidence: The average Value (VSA) of Alternatives generated
using point data was, on average, superior to the average Value of
Alternatives guided by tacit knowledge. The improvement maintains
statistical significance by a margin of 9% for the renovation Challenge,
and 5% in the new construction Challenge.
3. Trend data guides the generation of Alternatives of higher average Value (VSA)
than point data alone.
o Supporting evidence: The Alternatives generated by designers using trend
data in the renovation Challenge was, on average, superior to the

CHAPTER 3 16
Alternatives generated with point data. The improvement maintains
statistical significance by a margin of 11%. While no statistical
significance was demonstrated in the new construction Challenge, the
average Value of the Alternatives generated using trend data was higher
than those generated using point data.
4. Trend data guides the generation of Alternatives of higher average performance
(VSA) than performance trend + point data.
o Supporting evidence: The average Value (VSA) of Alternatives generated
using trend data in the renovation Challenge was superior to the average
Value (VSA) of Alternatives generated using performance trend + point
data. The improvement maintains statistical significance by a margin of
16%. While no statistical significance was demonstrated in the new
construction Challenge, the average Value (VSA) of Alternatives
generated using trend data in the new construction Challenge was superior
to the average Value (VSA) of Alternatives generated using performance
trend + point data.
5. Point data guidance requires generation of a higher number of Alternatives prior
to top performance (VSI) than other Strategies.
o Supportive reasoning: The number of iteration to the top (VSI) was
highest for Alternatives generated use point data in the both the new
construction and renovation Challenges.
6. Providing trend + point data guides the generation of Alternatives with a wider
range of performance (VSR) than any other strategy.
o Supportive reasoning: The normalized standard deviation in Value of
Alternatives generated using trend + point data is greater than for the
Alternatives using any other strategy.
7. Trend data guides the generation of Alternatives of higher maximum Value (VSM)
than point data alone.
o Supportive reasoning: The average maximum Value (VSM) of
Alternatives generated using trend data was superior to the average
maximum Value of Alternatives generated with point data for both the
new construction and renovation Challenges. Given the low sample size,
statistical significance was not demonstrated in either case.
8. Trend data guides the generation of Alternatives of higher maximum Value
(VSM) than performance trend + point data.

CHAPTER 3 17
o Supportive reasoning: The average maximum Value (VSM) of
Alternatives generated using trend data was better than the average
maximum Value (VSM) of the Alternatives generated with trend + point
data for both the new construction and renovation Challenges. Given the
low sample size, statistical significance was not demonstrated in either
case.
Guidance Evaluated
Based on Exploration metrics it is possible to compare the Guidance afforded by
individual Strategies relative to Challenge. Similar to other assessments using these
metrics, characterization is multi-faceted. Nevertheless, we can still draw a few
conclusions. If, for example, we chose to adopt the metric Value Space Maximum,
(VSM) as the most important indicator of the strength of an Exploration, the ranking of
the Guidance provided by the six Strategies tested is as follows. Overall assessments of
tacit knowledge and point data Strategies remain similar:
Least Guidance Strategy 1: Random Guessing
Strategy 2: No NPV Data (Tacit Knowledge) / Strategy 3: Point NPV Data
Strategy 5: Trend + Point NPV Data
Strategy 4: Trend NPV Data
Strategy 6: Full Analysis
Most Guidance
For more information on ranking Strategies relative to maximum Value (VSM) see
Clevenger & Haymaker, 2010c. Similar conclusions are reached using average Value
(VSA) or even the summation of the two metrics (VSM + VSA). This finding is, at first,
somewhat surprising since the amount of Guidance does not align the level of
advancement of Strategies. In general, this conclusion contradicts the theory that more
data are better for generating Alternatives. Finally, we interpret the findings as
suggestive evidence that the Guidance provided by Strategies is not always additive.
Discussion of Results
Empirical results from the use of DEAM are surprising because both intuition and our
Strategy metrics initially assess the trend + point NPV data Strategy as more advanced
than the trend NPV data Strategy. Here we propose three theories why the level of
Guidance provided by a Strategy might be different than the Strategy’s level of
advancement. These include:
Trend + point Value data Strategy enables designers to take more risks.
Trend + point Value data Strategy provides extraneous data that is
diminishingly useful to designers.

CHAPTER 3 18
Point Value data Strategy provides data that is difficult and/or misleading
for designers to interpret.
To illustrate and further examine these theories, we develop a graphic language,
Designing New Alternatives (DNA), to visually represent individual Explorations and
their performance through time. Figure 12 graphically shows an individual charrette
participant’s data regarding the maximum Value (VSM) of the first three Alternatives
generated (on left) and all 10 Alternatives generated with relative Value overlaid in red
(on right).
Figure 12: Graph of average maximum Value (VSM) for the first three Alternatives generated by all participants using four different Strategies tested (Left). Designing New Alternatives (DNA) diagrams of
4 Explorations each consisting of 10 Alternatives generated by one designer using four different Strategies
(Right). Each Alternative is represented by a vertical stack of Options. Horizontally adjacent color changes
denote Option changes. The red line represents the relative Value of the Alternative generated. The figure
(left) shows that limited or quick Explorations, which are supported by the trend data Strategy achieve
maximum Value (VSM). It also indicates (right) that designers supported by either no data or trend +
point data Strategies generate Alternatives with more divergent Values.
While it is difficult to conclusively support any of the proposed theories that explain
differences in Exploration based on risk or the value of the data provided, Figure 12
suggests that given trend + point NPV data designers do feel more at liberty to take risks.
This is observable in the large dip in Value that occurs near the end of the Exploration
where the designer is implementing the trend + point NPV data Strategy (bottom right). It
is also observable that the trend data Strategy aids designers significantly at the start of
Exploration since they generate Alternatives with significantly higher maximum Value
(VSM) in their first three Alternatives.
4002 4002 4003 4002 4002 4002 4004 4004 4004 4004
8.61 8.61 8.61 12.92 10.76 10.76 8.61 8.61 8.61 8.61
2 1 1 1 1 1 2 2 1 1
500 500 500 500 500 500 500 500 500 100000
2002 2002 2002 2001 2002 2001 2002 2002 2002 2001
21.52 21.52 21.52 21.52 21.52 21.52 21.52 21.52 21.52 53.8
1003 1003 1003 1003 1004 1004 1004 1004 1004 1003
8 8 8 9 8 8 8 9 8 9
4002 4002 4002 4002 4002 4003 4002 4003 4002 4002
12.92 8.61 8.61 8.61 8.61 8.61 8.61 8.61 10.76 8.61
1 1 1 1 1 1 2 2 2 2
500 500 500 500 500 500 500 500 500 500
2001 2001 2002 2001 2001 2001 2001 2001 2001 2001
21.52 21.52 21.52 21.52 21.52 21.52 21.52 21.52 21.52 53.8
1003 1003 1003 1004 1003 1003 1003 1003 1003 1003
9 9 9 9 8 8 8 8 8 8
4002 4002 4002 4002 4002 4002 4003 4002 4002 4003
8.61 8.61 10.76 10.76 12.92 8.61 8.61 8.61 8.61 8.61
1 1 1 1 1 1 1 1 1 1
100000 500 500 100000100000 500 100000 500 500 500
2001 2002 2001 2001 2001 2001 2001 2002 2001 2001
21.52 21.52 21.52 21.52 21.52 21.52 21.52 21.52 21.52 21.52
1003 1003 1003 1003 1003 1003 1003 1003 1003 1003
8 8 8 8 8 8 8 8 8 8
4002 4002 4002 4002 4002 4002 4002 4003 4002 4002
8.61 8.61 10.76 12.92 8.61 8.61 8.61 8.61 8.61 8.61
1 1 1 1 1 1 1 1 1 1
500 500 500 500 100000 500 500 500 100000 500
2002 2001 2002 2002 2002 2002 2002 2002 2001 2002
21.52 21.52 21.52 21.52 21.52 21.52 21.52 21.52 21.52 21.52
1003 1003 1003 1003 1003 1004 1003 1003 1003 1004
8 8 8 8 8 8 9 9 8 8
Point Data
Trend Data
Trend +
Point Data
No Data
No
Data
Po
int D
ata
Trend
Data
Trend
+ P
oin
t Data
Maximum Value
first three (3)
Alternatives
Strategy

CHAPTER 3 19
Conclusion
As performance-based design matures, Strategies will continue to advance and provide
greater opportunity to guide designers to generate higher performing Alternatives. To
meet this opportunity, need arises to distinguish and evaluate levels of Challenge,
Strategy and Exploration. Our application of DEAM using two case studies provides
evidence that it is possible and instructive to evaluate Design Process dimensions. By
implementing DEAM in a synthetic experiment, we found the surprising result that the
Guidance provided by a Strategy is not always aligned with its level of advancement or
correlated to the quantity of data provided. This seems to contradict intuition as well as
previous design theories that propose the more data generated or Alternatives explored,
the better (Sutton, 2002). We interpret our findings as evidence for the power of DEAM
to assess the quality of different kinds of Guidance, and for the generality of DEAM to
work across different types of Design Processes.
Our findings provide motivation for additional study of Design Processes across all
dimensions. The vastness of design spaces embodied by high performance design has
historically appeared intractable. Developers of advanced modelling strategies should be
encouraged if strategic sampling providing trend data proves effective. Conversely,
developers should take note that the point data Strategy tested did not appear to provide
more effective Guidance than tacit knowledge alone. In some instances, empirical
evidence indicated that point data actually decreased the level of Guidance provided. Of
potential concern is the fact that the point data Strategy tested most closely resembles the
implementation of energy modelling and many other performance-based design
Strategies used in the building industry today. Of promise, DEAM enables quantitative
and systematic evaluation and comparison of Design Processes. It can be used in the
future to help align specific Strategies to specific Challenges. While other frameworks
exist to characterize Design Process, DEAM is the first to characterize all dimensions-
Challenge, Strategy and Exploration.
In related work, we use the empirical data collected in the two case studies to quantify the
Value of Information provided by Strategies across Challenges (Clevenger & Haymaker,
2010c). We perform further computer experimentation to show that Challenges vary non-
trivially. We introduce a metric of Process Cost. By adding this new metric we are able
to rank Value of Information generated by Strategies across Challenges.
CHAPTER 3 20
Acknowledgements
The authors would like to acknowledge the following individuals and organizations as contributing to this
research: the Center for Integrated Facility Engineering (CIFE), Stanford University, the Precourt Energy
Efficiency Center (PEEC), Benjamin Welle, Stanford University, Grant Soremekun, Phoenix Integration,
General Services Administration (GSA), Architectural Energy Corporation (AEC).
Biographical Notes
Caroline M. Clevenger is an Assistant Professor in the Department of Construction Management at
Colorado State University. She is a PhD candidate at Stanford University. Her research has been funded
by the Precourt Energy Efficiency Center (PEEC) at Stanford University. As a graduate student, she served
as a Visiting Fellow to the General Services Administration (GSA) National 3D-4D-BIM Program. She is
a registered architect and licensed engineer with a background in energy efficiency.
References
Akin, Ö. (2001). Variants in design cognition. In C. Eastman, M. McCracken & W.
Newstetter(Eds.), Design knowing and learning: Cognition in design education (pp. 105-124). Amsterdam: Elsevier Science.
Bahrami A, Dagli CH (1993). Models of design process. In: Concurrent engineering:
contemporary issues and modern design tools. Chapman and Hall.
Box, G. E., Hunter,W.G., Hunter, J.S., Hunter,W.G., (2005) "Statistics for Experimenters: Design, Innovation, and Discovery", 2nd Edition, Wiley, 2005, ISBN 0471718130
Clarkson PJ, Melo A., Eckert CM (2000). Visualization in Routes in Design Process Planning.
IV’ 00 London, UK. Eckert, C., Clarkson, J. eds (2005) The reality of design. Design Process Improvement: A
Review of Current Practice, Springer.
Chachere, J., & Haymaker, J. (2008). Framework for measuring rationale clarity of AEC design decisions. CIFE Technical Report, TR177.
Clayton, M.J., Kunz, J.C., and Fischer, M.A. (1998). The Charrette Test Method. Technical
Report 120, Center for Integrated Facility Engineering, Stanford, California.
Clevenger, C., Haymaker, J., and Swamy, S. (2008). The Importance Process: Enabling Creativity in Performance-based Design through Systematic, Model-based search of
Multidisciplinary Impacts, World Sustainable Building (SB) Conference Proceedings,
Melbourne, Australia, 2008. Clevenger, C., Haymaker, J., (2010a). Metrics to Assess Design Guidance, submitted to Design
Studies.
Clevenger, C., Haymaker, J., (2010c). Calculating the Value of Strategy to Challenge, submitted to Building and Environment Journal.
Cross N., Roozenburg N. (1992). Modeling the design process in engineering and architecture.
Journal of Engineering Design, 3(4): 325-337. Dorst, K. (2008) Design Research: A Revolution-waiting-to-happen, Design Studies, vol. 29, no.
1, pp 4-11.
Gane, V., and Haymaker, J. (2007). Conceptual Design of High-rises with Parametric Methods,
Predicting the Future, 25th eCAADe Conference Proceedings, ISBN 978-0-9541183-6-5 Frankfurt, Germany, pp. 293-301.

CHAPTER 3 21
Haymaker, J., (2006). Communicating, Integrating and Improving Multidisciplinary Design and
Analysis Narratives, In JS Gero (ed), Design Computing and Cognition'06, Eindhoven, Netherlands, Springer. pp 635 – 654.
Lawrence Berkeley National Laboratory (LBNL) (2008). EnergyPlus Engineering Reference, The
Reference to EnergyPlus Calculations. 20 April, Berkeley, California, United States.
Flager, F. and Haymaker, J. (2007). A Comparison of Multidisciplinary Design, Analysis and Optimization Processes in the Building Construction and Aerospace Industries, 24th
International Conference on Information Technology in Construction, I. Smith (ed.), pp.
625-630. Flager F, Welle B, Bansal P, Soremekun G, Haymaker J (2009). Multidisciplinary Process
Integration and Design Optimization of a Classroom Building, Journal of Information
Technology in Construction (ITcon), Vol. 14, pg. 595-612. Frost RB (1992). A converging model of the design process: analysis and creativity, the
ingredients of synthesis. Journal of Engineering Design, 3(2): 117-126.
McManus, H., Richards, Ross, M., & Hastings, D. (2007). A Framework for incorporating
"ilities" in tradespace studies. AIAA Space. Phadke, M. S., & Taguchi, G. (1987). Selection quality characteristics and s/n ratios for robust
design. Ohmsha Ltd, 1002-1007.
Shah, J., Vargas-Hernandez, N., & Smith, S. (2003). Metrics for measuring ideation effectiveness. Design Studies, 24(2), 111-134.
Simpson, T., Rosen, D., Allen, J. K., & Mistree, F. (1996). Metrics for assessing design freedom
and information certainty in the early stages of design. Proceeding of the 1996 ASME Design Engineering Technical Conferences and Computers in Engineering Conference.
Sutton, R. (2002). Weird Ideas that Work - 11.5 practices for promoting, managing, and
sustaining innovation. The Free Press, New York, NY.


CHAPTER 4 1
Calculating the Value of Strategy to Challenge
Caroline M. Clevenger*, John Haymaker
*Department of Construction Management, Colorado State University, Fort Collins Colorado, 80523-1584 USA
Abstract Advanced design strategies expand the spaces designers can explore by orders of magnitude. Yet,
in the face of vast or ill-defined design challenges, it is not possible to replace building design
with automated search. Armed with limited time and resources, designers are left to choose among strategies of varying costs and capabilities to assist in the generation and selection of
alternatives. In this paper, we describe the current role and associated process costs of explicit
strategies such as validation, screening, sensitivity analysis, and optimization. We show that designers face non-trivially distinct challenges when pursuing energy efficient design
alternatives. We present a method for calculating the value of information a strategy provides
when addressing a given challenge. We empirically rank six strategies for two challenges to illustrate the method. We interpret our findings as suggestive evidence that advanced strategies
are valuable in energy efficient building design and dwarf the cost of implementation, particularly
when applied to complex challenges. Keywords Design, Strategy, Challenge, Exploration, High Performance, Value of Information, Process Cost,
Energy, Building Introduction Design is a sequence of events in which a problem is understood, and Alternatives are generated
and evaluated (Cross & Roozenburg, 1992), (Frost, 1992), (Clarkson & Eckert, 2005). Performance-based design involves selection of Variables to address formal performance
Objectives (Hazelrigg, 1998), (Foschi, et al. 2002). It seeks to maximize Value according to
Challenge addressed, by implementing a Strategy that leads to effective Exploration (Clevenger & Haymaker, 2010a). Today, owner, contractual and user demands in Architecture, Engineering
and Construction (AEC) industries increasingly address a wider variety of Objectives. Designers
are increasingly being challenged to reliably maximize value with respect to multiple criteria
(AIA, 2007).
Automation promises powerful assistance when applying advanced Strategies to complicated
Challenges, and is having significant impact on various building delivery processes (McGraw Hill, 2007). For example, advanced computer analysis is now used to support structural
engineering and design (Bai and Perron, 2003). In building performance research, computer
analyses in support of building optimization (Wetter, 2001; Christensen et al, 2006), Trade-space analysis (Ross & Hastings, 2005) and Process Integration Design Optimization (Flager et al,
2009) are being tested. Advanced computing Strategies provide capabilities well beyond those of
unaided humans and significantly extend designers’ ability to search large design spaces
(Woodbury & Burrow, 2006). To date, however, designers have met with relatively modest success in leveraging computer analysis to reliably improve building operational performance.
Obstacles include the significant time needed to prepare models, inaccuracies within the models,

CHAPTER 4 2
and the vast number of inputs and output estimates that are themselves inconsistent and highly
dependent on various assumptions (Majidi & Bauer 1995), (Clarke, 2001), (Bazjanac, 2008). In addition, designers may not leverage unfamiliar Strategies because they are unable to assess their
capabilities and know their value. Such obstacles currently limit the primary role of energy
modeling in professional practice to performance verification near the end of design.
Unfortunately, such analysis generally fails to reliably support effective Explorations (Papamichael & Pal, 2002), (de Wilde & van der Voorden, 2004), (Hensen, 2004).
This paper does not address the fidelity of building performance modeling- assumptions or
algorithms, but leaves such research to others (Willman, 1985), (Judkoff & Neymark, 1995),
(Crawley et al., 2001). Several other researchers have also examined the role of uncertainty in
energy modeling using either external or internal calculation methods (de Wit 1995), (Macdonald & Strachan 2001), (de Wit & Augenbroe, 2002), (Macdonald, 2002). This research does not
include uncertainty. This research addresses the choice of Strategy, assuming issues for
simulation tools and analyses are surmountable.
We start by summarizing the Design Process Metrics (Clevenger & Haymaker, 2010a) and the
Design Exploration Assessment Methodology (DEAM) (Clevenger & Haymaker, 2010b) previously developed. We use these metrics and method to generate and analyze data illustrating
variation among Challenges and to collect and evaluate empirical data documenting differences in
outcomes of Explorations achieved relative to Strategy and Challenge. We explain how to extend
our method using an estimation of process cost and an assessment of the value of the Guidance provided to enable a calculation of Value of Information (VoI) generated by a given Strategy. We
describe six design Strategies. We assess these Strategies for two Challenges using DEAM and
our VoI calculation to provide a preliminary ranking of Strategies. We use these findings to provide insight into the strengths and weaknesses of various design Strategies and hypothesize
about the relationships between design Strategy and Challenge. We conclude by proposing
opportunities for additional research. We discuss the potential and limitations for this method to enable Strategy selection or development.
Clevenger & Haymaker, 2010a synthesized the following definitions and metrics for this
research. We present our Design Process definitions in reverse order to our framework for performance-based design (Clevenger & Haymaker, 2010a, Figure 1) to emphasize their
cumulative nature. We use capitalization throughout this paper to indicate explicit reference to
these definitions.
Design Process Definitions Stakeholder: Party with a stake in the selection of Alternatives.
Preference: Weight assigned to a Goal by a Stakeholder. Goal: Declaration of intended properties of design solution(s).
Constraint: Limit placed on either Options or Impacts.
Variable: A decision to be made. Frequently discrete, a Variable can also be continuous (i.e.,, building length).
Option: Individual Variable input(s).
Alternative: Unique combination of Options. Impact: Alternative’s estimated performance according to a specified Goal.
Value: Net performance of an Alternative as a function of Impact and Stakeholder
Preferences relative to all Goals.
Challenge: A set of decisions to be made regarding Variables ranging from simple to complex.

CHAPTER 4 3
Strategy: Set of steps used to generate the basis for decisions regarding Variables ranging
from no steps (none) to an advanced sequence. Exploration: A history of decisions made regarding Variables ranging from random to
guided.
Guidance: Relative impact of a Strategy on Exploration for a given Challenge.
Design Process: Implementation of a Strategy resulting in an Exploration for a given Challenge.
Value of Information: difference between expected project Value with the information,
and expected project Value without the information, minus the Process Cost of acquiring the information (see Equation 2).
Metrics For additional information regarding these metrics and other Design Process metrics see
Clevenger & Haymaker, 2010a.
Objective Space Size (OSS) is the count of the number of Goals being analyzed by a given Strategy for the project.
Alternative Space Interdependence (ASI) is the number of first order interactions among Variables divided by total number of Variable combinations. It represents the extent to which
interactive effects impact design performance.
Impact Space Complexity (ISC) is the number of Variables found to result in performance trade-offs (divergent Impacts) divided by total number of Variables. It represents the percent
of Variables with competing Goals.
Value Space Dominance (VSD) is the extent to which performance is dominated by
individual Variables. It represents the importance of individual design decisions.
Process Cost (PC) Process Cost is the estimated cost of implementing a Strategy. We
estimate the number of hours required and multiply by an assumed labor rate ($100/hr).
Value Space Maximum (VSM) is the maximum Value calculated for Alternatives
generated in an Exploration. We use these metrics to characterize the Challenge (OSS, ASI, ISC,VSD), Strategy (PC) and
Exploration (VSM) dimensions of Design Process. We limit our research to value-centric design,
and will not address uncertainty or utility-driven decision-making in this work (Howard, 1998).
Strategies Design Strategies range from informal to exhaustive. Kleijnen suggests five main categories of analytical strategies exist in engineering: Validation, Screening, Sensitivity Analysis, Uncertainty
Analysis, and Optimization (Kleijnen, 1997). Ross introduces trade-off analysis as an emerging
Strategy, useful for assessing building performance (Ross and Hastings 2005). For purposes of
this research we also include random guessing and full analysis as possible Strategies to support the generation of Alternatives in design. We discuss these Strategies in specific regard to high
performance building design in the following paragraphs.
Validation, as defined by Kleinjnen consists of statistical tests demonstrating a model’s ability to
represent the real-world. It is typically the first concern for most modelers. While modelers of
building performance are no exception, a second definition of validation analysis fulfills Simon’s

CHAPTER 4 4
description as the search for “satisficing” solutions, or those solutions that are “good enough,” but
not necessarily optimum (Simon, 1987B). Validation analysis provides limited point data and relatively little to no information regarding the impact(s) of unanalyzed Alternatives. Research
shows that energy models used in Architecture, Engineering, and Construction (AEC) practice
today primarily perform Validation (Flager & Haymaker, 2007), (Gane & Haymaker, 2007)
(Clevenger et al., 2010b). Professionals using building performance modeling in such a fashion generally report low satisfaction with the tools and process. When polled, modelers and designers
identify development of expanded pre- and post-processing as top priority for energy modeling
(Crawley, et al. 1997).
Screening analysis is a Strategy consisting of numerical experiments to identify the few important
factors that influence performance. Typically, in a model with a large number of parameters, a few inputs dominate performance (Kleijnen 1997). Researchers in other fields (Sacks et al, 1989),
divide input variables into control factors and noise factors, and extensive research exists to
develop algorithms that successfully perform group screenings (e.g.; “one-factor-at-a-time”
(Morris 1991), two-level screening (Morris 1987), (Rahni & Ramdani, 1997), and sequential bifurcation (Bettonvil, 1990), (Kleijnen, 1997). Several studies have attempted to apply such
screening techniques to building energy modeling (O’neill & Crawley, 1991), (de Wit, 1995),
(Rahni & Ramdani, 1995), (Brown & Tapia, 2000). Despite such efforts, many building professionals today to have limited tacit knowledge of dominant factors influencing energy
performance (Clevenger & Haymaker, 2010a).
Sensitivity analysis consists of the systematic investigation of how a model’s outputs vary
according to model inputs. It is used to bracket individual Variables’ contribution to performance.
Sensitivity analysis builds upon screening analysis, and is typically calculated either locally,
varying one input at a time (high-low) while holding all others constant; or globally, assessing output variability for a single input across the variation of all other inputs. Some sensitivity
analyses analyze a model’s responses to extreme input values, while others may gauge the impact
of more probable inputs (Kleijnen, 1997). Researchers have applied sensitivity analysis to building performance simulation (Lomas & Eppel 1992), (Furbringer & Roulet, 1995), (Lam &
Hui, 1996), (Rahni et al, 1997), (Breesch & Janssens, 2004), (Clevenger & Haymaker, 2006),
(Harputlugil et al, 2007), (Mara & Tarantola, 2008). Due to the inherent complexity of building
simulation, most applications have been limited to one-factor-at-a-time and have excluded geometric decisions (Harputlugil et al., 2007). Research interest, however, in the application of
sensitivity analysis to building energy simulation is strong and increasing in conjunction with
advancements in computer modeling.
Uncertainty analysis consists of tests of probabilistic distributions to demonstrate potential
consequences of uncertainties or risks. To assess uncertainty or risk, inputs are typically modeled as probability distributions. Uncertainty analysis focuses on gauging the range of possible outputs
to evaluate risk potential. While it assesses relationships between outputs and inputs, it is possible
that a model is very sensitive to a specific input but that parameter is well known (certain) and
plays only a very limited role in uncertainty analysis (Macdonald 2002). While several researchers have examined the role of uncertainty in energy modeling using either external or
internal calculation methods (de Wit 1995), (Macdonald & Strachan 2001), (de Wit &
Augenbroe, 2002), (Macdonald, 2002), this research does not currently address uncertainty.
Optimization uses mathematical calculations to identify a single or set of top performers
(Kleijnen 1997), (Al-Homoud, 2001). Numerous mathematical algorithms exist or are under development to support optimization analysis across numerous engineering disciplines. In
building design, sets of Alternatives on Pareto frontiers may be considered optimal if no other

CHAPTER 4 5
Alternatives exist that are superior across all Objectives. A number of researchers are working to
apply optimization to multi-objective building design for building performance (Coley and Schukat 2002), (Wright et al., 2002), (Wetter, 2004), (Ross & Hastings, 2005), (Caldas, 2006),
(Christenson, Anderson et al. 2006), (Ellis, Griffith et al. 2006), (Flager et al, 2009).
Finally, trade-off analysis is an additional and emerging Strategy in building performance in addition to the ones listed by Kleijnen (Ross and Hastings 2005). Related but distinct from
sensitivity analysis, trade-off analysis identifies which Variables have competing Impacts relative
to Value. Researchers are currently exploring local points, frontier sub-sets, frontier sets, and full trade-space for such trade-offs.
While not exhaustive, we use the above list as the basis of Strategies to be tested which are currently implemented in high performance building design. In this research, also include random
guessing and full analysis, which estimates the Impacts of all possible Alternatives. We group
sensitivity analysis and trade-off analysis together as an analysis technique capable of identifying
performance patterns and call it trend data.
Cost of Strategies In the past, researchers choosing between various decision-making strategies have assumed that processing resources are consumed in proportion to amount of information transmitted (Galbraith,
1974). More recently, however, computer-aided, automated analysis begins to challenge such a
principle. Process costs are generally averaged over units produced during a period of time.
Process costs include direct costs of production and indirect costs including equipment, set-up time, and rework. In the case where units of production are simulations of Alternatives and
iteration time is in milliseconds, production costs may be insignificant relative to set-up or
equipment costs. In other words, once the computer model is built and equipment purchased the cost of running an additional simulation (producing more information) may be negligible.
To assess the Process Costs of applying the identified Strategies to a Challenge, the authors used professional estimates of the labor necessary to set-up and run the relatively simple model used in
each case. Estimates are informally based on the number of Objectives addressed and the
iterations required by a given Strategy. For more information about assessing Strategies see
Clevenger et al., 2010b Strategy Metrics. For these Process Cost estimates, we assume a labor rate of $100/hr. Simulation tools capable of complex automated search to support the advanced
Strategies are currently under development. A prototype tool is used for this research (Flager et
al., 2009). This paper assumes the availability of such tools. Tool development cost and equipment costs are not included in any of the Process Cost estimates.
Table 1: Process Cost estimates for Strategies. Costs are based on professional estimates of the labor hours
required to implement individual Strategies assuming a $100/hr labor rate. Costs do not include labor
estimates to develop a Strategy nor associated equipment costs.
Random
Guessing
Tacit
Knowledge Validation
Trend
Analysis
Trend
Analysis
+ Validation
Full
Analysis
Process
Cost $ - $ 100 $ 8,000 $16,000 $ 16,100 $ 40,000

CHAPTER 4 6
Challenge Our example is based on a real-world case-study, which consists of a 3 story, 100,000 sf, rectilinear office building. Table 2 shows the nine Variables we modeled to represent common
design decisions impacting energy performance in new building construction. Typically, the
number of Variables quickly translates into exponentially large number of Alternatives (Clarke, 2001). By limiting our Design Space we are able to perform a full analysis of the model and
systematically compare the nature of the Challenge embodied. Table 2 lists the Options
considered for each Variable.
Table 2: Variables and their Options in a rectilinear office building new construction project.
Variable Options
Window Type double-pane double-pane, Low-E
Wall Insulation R-11 R-19
Lighting Efficiency 10.76 W/m2 [1W/sf] 8.61W/m2 [0.8W/sf]
Exterior Shading No exterior shading 50% exterior shading
Daylighting Controls No Yes
Building Shape Square [1:1 aspect ratio] Rectangular [1:2 aspect ratio]
Building Orientation 0, +/-45, +/-90 (rotation from N)
Window to Wall Ratio 40% 90%
HVAC System Type Variable-Air-Volume (VAV) High Efficiency VAV
One kind of computer experiment is a study that perform multiple simulations with various configurations of inputs in order to learn about the relationship of inputs to outputs (Sacks, et al.,
1989). We perform a computer experiment for this Challenge to better understand the nature of a
simple building Challenge and to see if and how it might change with the type of variation that
commonly occurs in professional practice (e.g., designing a building in a different climate type). We evaluate these characteristic using our Challenge metrics (Clevenger & Haymaker, 2010a).
These metrics help quantify the comprehensiveness of the Objectives analyzed, how many
Variables depend upon one another, the number of Variables where change is good according for goal but problematic for another, and the level of dominance among Variables. If outcome is
highly dominated by one or two leading Variables, for example, significant gains in performance
can occur based on tuning one or two Variables alone.
Building performance for this experiment is characterized using NPV according to the following
equation:
Equation 1:
NPV = Baseline Budget - First Cost($) - 30 year Discounted Annual Energy Cost($) ($.10/kWh energy cost and 3% inflation rate assumed)
The variation in climate types tested is based on the proposed Climate Classification for Building Energy Codes and Standards (Briggs, et al., 2002). Our computer experiment analyzes our
metrics for one design, but locates the project in six distinct climate types.
Table 3 lists interactive Variables, Variables with competing Impacts and the three most
dominant Variables across climate types. Variables with competing Impacts make it difficult to
maximize NPV since low energy costs come at the expense of higher first costs. Highly dominant Variables indicate that optimizing for the Goals of one or two Variables is highly
correlated with maximizing NPV for the project. Table 4 shows the Challenge metrics evaluated.

CHAPTER 4 7
In general, low Objective Space Size (OSS), Alternative Space Interdependence (ASI) and Impact
Space Complexity (ISC) values, and high Value Space Dominance (VSD) value are associated with simple Challenges. Conversely, high Objective Space Size (OSS), Alternative Space
Interdependence (ASI) and Impact Space Complexity (ISC) values, and low Value Space
Dominance (VSD) value are associated with complicated Challenges.
Table 3: Computer experiment results showing Variable dominance in energy efficient decisions for
rectilinear office building design across climate types.
Zone
Climate
Type
Representative
City
Number of
Interactive
Variables
Variables with
competing Impacts
(tradeoffs) Dominant Variables
2A Hot-
Humid Houston, TX 8
1. Window Type 2. Building Length
3. Orientation
1. HVAC efficiency (29%) 2. Window Area (26%)
3. Shade Control (12%)
2B Hot-Dry Phoenix, AZ 8
1. Window Type
2. Orientation
3. Building Length
1. HVAC efficiency (28%)
2. Window Area (26%)
3. Shade Control (12%)
4A Mixed-
Humid Baltimore, MD 9
1. Window Type
2. Orientation
3. Daylighting
1. Window Area (28%)
2. HVAC efficiency (26%)
3. Building Length (13%)
4B Mixed-
Dry
Albuquerque,
NM 10
1. HVAC Efficiency
2. Building Length
3. Window Type
4. Lighting Load
1. Window Area (30%)
2. HVAC efficiency (20%)
3. Building Length (14%)
6A Cold-
Humid Burlington, VT 8
1. Window Type
2. Wall Insulation
3. Lighting Load
4. Daylighting
1. Window Area (35%)
2. Building Length (16%)
3. Shade Control (15%)
6B Cold-
Dry Helena, MT 9
1. Window Type
2. Daylighting
1. Window Area (33%)
2. Building Length (18%)
3. Shade Control (13%)
Table 4: Challenge Metrics evaluated for rectilinear office building showing unique Challenges across climate types.
Zone Climate Type
Representative
City
Objective
Space
Size
(OSS)
Alternative
Space
Interdependence
(ASI)
Impact
Space
Complexity
(ISC)
Value
Space
Dominance
(VSD)
2A Hot-Humid Houston, TX 2 .44 .33 .196
2B Hot-Dry Phoenix, AZ 2 .44 .33 .180
4A Mixed- Humid Baltimore, MD 2 .5 .33 .164
4B Mixed-Dry Albuquerque, NM 2 .55 .44 .158
6A Cold-Humid Burlington, VT 2 .44 .44 .136
6B Cold-Dry Helena, MT 2 .5 .22 .140
Results from this computer experiment show differences in the nature of the Challenge addressed
when designing the same rectilinear office building in different climates. Beyond favoring
different Options for Variables, Table 4 shows that characterization of Challenge is unique, and
that each metric varies independently. If this is the case, the basis for individual design decisions may differ. This finding supports previous research indicating that that tacit knowledge has
limited power and transferability between building projects. Specifically, we draw the following

CHAPTER 4 8
illustrative conclusions about the Challenges faced across climate types based on the computer
experiment results:
1. Objectives remain the same across climate types tested.
o Supportive reasoning: Objective Space Size (OSS) remains fixed.
2. Dry climates tend to have more interactions among Variables than humid ones.
o Supportive reasoning: In general, the Alternative Space Interdependence (ASI)
increases as the climate changes from humid to dry. This finding merits more
research since intuitively energy performance impacted by humidity as well as
temperature concerns suggests more interactive effects will occur among
Variables. For a designer such a finding more strongly discourages sub-
optimization of Variable Options in dry climates.
3. The number of trades-off for Impacts differs across climate type.
o Supportive reasoning: Changes in Impact Space Complexity (ISC) indicate
anywhere from 2 of 9 to 4 of 9 design decisions might competing impacts for the
same building, dependant on the climate type. For a designer this means the
number of decisions requiring a balancing act will differ, but may be
unpredictable based on climate.
4. Hot climates are more dominated by (one or two) Variables (in this case, HVAC
efficiency) than colder climates.
o Supportive reasoning: In general, the Value Space Dominance (VSD) decreases
across the climate types ranging from hot to cold. When designing in hotter
climates, the relevance may be that a good HVAC engineer is essential to good
building performance.
Given that Challenges differ, we investigated to see if different Challenges warrant different
Strategies. Next, we calculate the Value of Information generated by six Design Challenges relative to two distinct Challenges. We present a process map in Figure 1 to illustrate the
information flow required to calculate the value of applying a given Strategy to a given
Challenge. Figure 1 diagramming the evaluating the Value of Information is intended to contrast
the process map illustrating the Design Exploration Assessment Methodology (DEAM) evaluation of Guidance (Clevenger et al., 2010b, Figure 1).

CHAPTER 4 9
Figure 1: Narrative (Haymaker, 2006) process map showing the information flow required to evaluate the
Value of Information generated from applying a Strategy to a Challenge.
Value of Information provided by Strategy for Challenge The source data for our evaluation comes from two charrette tests conducted by the authors in
2009 using 15 building industry professional participants, and described in detail in Clevenger et al., 2010b. Variables impacting energy efficiency, with reasonable Options and associated costs
were modeled. While the focus was not accurate cost estimating, every effort was made to
include reasonable cost assumptions in order to support relative comparisons. During these charrettes, the authors used a synthetic experiment to record the Explorations executed by
professionals for two Challenges similar the challenge outlined in Table 2. Table 5 characterizes
both challenges using our design Challenge metrics.
Table 5: Challenge Metrics evaluated for a renovation or new construction of a rectilinear office building.
Results support characterization and comparison of the two Challenges.
Challenge
Objective
Space
Size
(OSS)
Alternative
Space
Interdependence
(ASI)
Impact
Space
Complexity
(ISC)
Value
Space
Dominance
(VSD)
Renovation 2 .58 .25 .69
New Construction 2 .70 .25 .37
Charrette participants used four Strategies individually to support their Explorations. The maximum Value, VSM, achieved using these Explorations are listed in Table 6. In addition,
results from implementation of random guessing and full analysis Strategies are also shown. In all
cases, Value is calculated using Equation 1. Process Costs are assumed to be those estimated in
Table 1.
We use the following equation to calculate the Value of Information (VoI) for each of these six
Strategies.

CHAPTER 4 10
Equation 2:
VoI= Maximum Value Generated (VSM) from Exploration supported by StrategyX, – VSM from Exploration supported by StrategyRandomGuessing– Process Cost (PC)StrategyX
Equation 2 calculates the Guidance afforded by a Strategy as measured solely by maximum Value
generated and subtract the cost of that Strategy. Table 6 summarizes the VoIs calculated per Strategy based on charrette data previously collected. The normalized VoI is also provided. The
normalized VoI relates the VoI achieved to its potential, TVfull analysis – TVrandom guessing.
Table 6: Value of Information (VoI) assessed for six Strategies across two Challenges. Findings based on
this data are summarized below.
Challenge
Random
Guessing
Tacit
Knowledge Validation
Trend
Analysis
Trend
Analysis
+ Validation
Full
Analysis
Top Value (TV)
(in Millions)
Renovation $ 2.622 $ 4.968 $ 4.981 $ 4.993 $ 4.120 $ 5.411
New Construction $ 4.829 $ 6.302 $ 6.141 $ 6.450 $ 6.430 $ 6.500
VoI ($)
(in Millions) Renovation $ - $2.345 $2.351 $2.354 $1.482 $2.749
New Construction $ - $1.473 $1.303 $1.604 $1.585 $1.631
VoI
Normalized (%) Renovation 0.0000 0.8411 0.8431 0.8443 0.5315 0.9857
New Construction 0.0000 0.8816 0.7803 0.9603 0.9486 0.9761
Figure 2: Normalized Value of Information (VoI) assessed for six Strategies across two Challenges.
Strategies applied the renovation, less complicated, Challenge are shown in red. Strategies applied the new
construction, more complicated, Challenge are shown in red.
Value of Information (VoI) results as summarized in Table 6 and diagramed in Figure 2 provide
empirical evidence for several insights relating Strategy to Challenge:
1. The more complicated a Challenge, the more Value provided by an advanced Strategy.
o Supportive reasoning: In our example, the new construction Challenge is more
complicated based on a higher Alternative Space Interdependence (ASI) and
lower Value Space Dominance (VSD) (Table 5). The normalized Value of
Information (VoI) is relatively higher across Strategies for the new construction
Challenge, than the renovation Challenge.
Value of Information
CHAPTER 4 11
2. Validation is a Strategy that decreases Value.
o Supportive reasoning: Data shows that generating point data for validation has
little to negative impact on the Value of Information (VoI) provided.
Specifically, the VoI of tacit knowledge and the VoI of trend analysis, two
Strategies providing no Impact data, are higher than similar Strategies providing
point data. Perhaps data consisting of such a limited sample size even in
Challenges of this scale (a total of 574 or 864 Alternatives) is misleading.
Alternatively, providing such additional data may simply overload rather than aid
the decision-maker (Galbraith, 1974).
3. Trend data provides Value.
o Supportive reasoning: For both Challenges, the second most valuable Strategy to
full analysis performed was trend data consisting of sensitivity and trade-off
analyses. This is an important finding, since in many cases full analysis may not
be a viable option.
4. The Value of advanced Strategies dwarf their Process Cost.
o Supportive reasoning: Even for our relatively small rectilinear office building
example, preliminary data shows that relatively inexpensive analysis Strategies
can bring potentially significant changes to a project’s expected Value (NPV).
These results suggest that advanced Strategies add Value, particularly when facing complicated Challenges.
Conclusion In this paper, we identify representative Strategies in building Design Process. We assign these
Strategies costs. We motivate assessment of these Strategies by demonstrating that even for a
relatively simple rectilinear office building project, the embodied Challenge can vary non-
trivially. Specifically, we demonstrate that siting the building in a different climate zone fundamentally changes the relationships of Variables. We then test the relationship of Strategy to
distinct Challenges using the measure of the Value of Information. In particular, we analyze the
VoI provided by six Strategies relative to two design Challenges using empirical data previously gathered (Clevenger et al, 2010b). These data are critical because, in the real world, design teams
rarely have the luxury of implementing several Strategies on the same Challenge to compare
effectiveness.
Based on the assessment of these data, we conclude that advanced Strategies are valuable in
building design, dwarf the cost of implementation and increase in value the more complicated the
Challenge. Such findings generally encourage the development and implementation of advance Strategies to support high performance building Design Processes. Furthermore, we observe the
currently performed point-based validation is generally an unproductive Strategy and, in many
cases, may even be a detriment. . The authors acknowledge, as have other researchers, that Value of Information calculations can result in overestimations because designers can choose not
to act on the information provided, rendering the Value of the information void. In fact, in the
real-world case study, which served as the basis for the Challenge tested (Table 2), the designers chose to do exactly that. Initial energy modeling results identified a leading, high performing
Alternative. Nevertheless, the designers chose another Alternative based on unanalyzed aesthetic

CHAPTER 4 12
considerations. In the vast design spaces of high performance building design it is
understandable and foreseeable that many decisions will involve unanalyzed Variables regardless of the level of advancement of the Strategy implemented. Therefore, perhaps the most
encouraging outcome of this research is the finding that there is a relatively high Value of
Information resulting from the Strategy using trend data, consisting of sensitivity or trade-off
analysis.
Future research will focus on allowing designers to more precisely align Strategy effectiveness
with the individual Challenges metrics. Additional computer experiments could be performed to test a wider range Variables such as occupancy, equipment schedule, or even uncertainty, to
further test variations in design scenarios commonly faced by designers. It may support the
selection of a custom Strategy(s) for high performance building projects. It will also provide more definitive valuations of how much a designer should be willing to pay for the information
generated by a specific Strategy.
CHAPTER 4 13
References
Alexander, S. Ishikawa, M. Silverstein, M. Jacobson, I. Fiksdahl-King and S. Angel: "A Pattern
Language". Oxford University Press, New York 1977. Al-Homoud, Mohammad Saad (2001). “Computer-aided Building Energy Analysis Techniques”.
Building and Environment 36, 421-433.
American Institute of Architects (AIA), Integrated project delivery: a guide, AIA California Council (2007).
Ballard, G. (2000). “Positive vs. Negative Iteration in Design.” Proc. 8th Ann. Conf. of the Int’l.
Group for Lean Construction (IGLC-8), Univ. of Sussex, Brighton, UK, 44-55.
Bai, J., Perron, P. (2003). Computation and Analysis of Multiple Structural Change Models Journal of Applied Econometrics, Vol. 18, No. 1, pp. 1-22.
Bazjanac, V. (2008). IFC BIM-cased methodology for semi-automated building energy
performance simulation. University of California, California, United States, Lawrence Berkeley National Laboratory.
Bettonvil, B. (1990). Detection of important factors by sequential bifurcation, Tilburg University
Press, Tilburg.
Breesch, H. and A. Janssens (2004). Uncertainty and sensitivity analysis of the performances of natural night ventilation. Proceedings of Roomvent 2004, 9th International Conference on
air distribution in rooms, Coimbra, Portugal.
Briggs, R., R. Lucas, et al. (2002). "Climate classification for building energy codes and standards." Pacific NW National Laboratory.
Brown, D. and C. M. Tapia (2000). Federal renewable energy screening assistant (FRESA) user's
manual: Version 2.5. U. S. D. o. E. Laboratory. Golden, Colorado, National Renewable Energy Laboratory.
Burry, M.C. (2003). “Between Intuition and Process: Parametric Design and Rapid Prototyping”.
In Branko Koarevic (Ed.). Architecture in the Digital Age, Spon Press, London.
Caldas, L. (2006). GENE_ARCH: An evolution-based generative design system for sustainable architecture.
Christenson, C., R. Anderson, et al. (2006). BEopt software for building energy optimization:
features and capabilities. U. S. D. o. Energy. Golden, Colorado, National Renewable Energy Laboratory 21.
Clarke, J. A. (2001). Energy simulation in building design, Butterworth-Heinemann.
Clayton, M.J., Kunz, J.C., and Fischer, M.A. (1998). "The Charrette Test Method."Technical
Report 120, Center for Integrated Facility Engineering, Stanford, California. Clevenger, C., Haymaker, J. (2006). The Impact of the Occupant on Building Energy
Simulations, Joint International Conference on Computing and Decision Making in Civil
and Building Engineering, Montreal, Canada. Clevenger, C., Haymaker, J., (2010a). Metrics to Assess Design Guidance, submitted to Design
Studies.
Clevenger, C., Haymaker, J., Ehrich, A. (2010b). Design Exploration Assessment Methodology: Testing the Guidance of Design Processes, submitted to Journal of Engineering Design.
Coleman, H.W. and Steele, W.G., (1989). Experimentation and Uncertainty Analysis for
Engineers, John Wiley & Sons, Inc., New York.
Coley, D. A. and S. Schukat (2002). "Low-energy design: Combining computer-based optimisation and human judgement." Building and Environment 37(12): 1241-1247.
Crawley, D., L. Lawrie, (1997). "What's next for building energy simulation - a glimpse of the
future." Proceeding of the National Passive Solar Conference 22: 309-314. Crawley, D. B., L. K. Lawrie (2001). EnergyPlus: creating a new-generation building energy
simulation program.

CHAPTER 4 14
Cross, R. and N. Roozenburg (1992). "Modeling the design process in engineering and
architecture." Journal of Engineering Design 3(4). de Wilde, P. and M. van der Voorden (2004). Providing computational support for the selection
of energy saving building components.
de Wit, M. S. (1995). Uncertainty analysis in building thermal modeling. International
Symposium SAMO95. Belgirate, Italy. de Wit, M. S. and G. Augenbroe (2002). Analysis of uncertainty in building design evaluations
and its implications.
Ellis, P. G., B. Griffith, et al. (2006). Automated multivariate optimization tool for energy analysis. IBPSA SimBuild 2006 Conference. Cambridge, Massachusetts.
Foschi, R. O., H. Li, et al. (2002). Reliability and performance-based design: a computational
approach and applications. Flager F, Aadya A,, Haymaker J (2009). AEC Multidisciplinary Design Optimization: Impact of
High Performance Computing, Technical Report 186, Center for Integrated Facility
Engineering, Stanford, CA.
Flager F., Welle B., Bansal P., Soremekun G., Haymaker J. (2009). Multidisciplinary Process Integration and Design Optimization of a Classroom Building, Journal of Information
Technology in Construction (ITcon), Vol. 14, pg. 595-612.
Frost, R.B. (1992). A converging model of the design process: analysis and creativity, the ingredients of synthesis. Journal of Engineering Design, 3(2): 117-126.
Furbringer, J. M. and C. A. Roulet (1995). "Comparison and combination of factorial and monte-
carlo design in sensitivity analysis." Building and Environment 30(4): 505-519. Galbraith, J.R. (1974). Organization Design: An Information Processing View Interfaces, Vol. 4,
No. 3, pp. 28-36.
Gane, V., and Haymaker, J. (2007). “Conceptual Design of High-rises with Parametric Methods,”
Predicting the Future, 25th eCAADe Conference Proceedings, ISBN 978-0-9541183-6-5 Frankfurt, Germany, pp. 293-301.
Harputlugil, G., J. Hensen, et al. (2007). "Simulation as a tool to develop guidelines for the design
of school schemes for four climatic regions of Turkiye." Proceedings: Building Simulation.
Hensen, J. L. M. (2004). "Towards more effective use of building performance simulation in
design." Developments in Design & Decision Support Systems in Architecture and Urban
Planning. Howard, R. A. (1988). "Decision analysis: Practice and promise," Management Science, Vol. 34,
No. 6 (June), pp. 679-695.
Judkoff, R. and J. Neymark (1995). "International energy agency building energy simulation test (BESTEST) and diagnostic method." IEA Energy Conservation in Buildings and
Community Systems Programme Annex 21 Subtask C and IEA Solar Heating and
Cooling Programme Task 12 Subtask B. Kleijnen, J. P. C. (1997). Sensitivity analysis and related analyses: A review of some statistical
techniques.
Lam, J. C. and S. C. M. Hui (1996). "Sensitivity analysis of energy performance of office
buildings." Building and Environment 31(1): 27-39. Lomas, K. J. and H. Eppel (1992). "Sensitivity analysis techniques for building thermal
simulation programs." Energy and Buildings 19(1): 21-44.
Macdonald, I. and P. Strachan (2001). Practical application of uncertainty analysis. Macdonald, I. A. (2002). Quantifying the effects of uncertainty in building simulation.
Department of Mechanical Engineering, University of Strathclyde. Degree of Doctor of
Philosophy: 267. Majidi, M. and M. Bauer (1995). How to overcome HVAC simulation obstacles. Building
Simulation, Fourth International Conference Proceedings, IBPSA.

CHAPTER 4 15
Mara, T. A. and S. Tarantola (2008). "Application of global sensitivity analysis of model output
to building thermal simulations." Building Simulation 1(4): 290-302. McGraw-Hill Construction. 2007. Interoperability in the Construction Industry, SmartMarket
Report. Available online at http://construction.ecnext.com/coms2/summary_0249-
259123_ITM. Published 24 Oct (2007). Last Accessed 30 Nov 2007.
Morris, M. D. (1987). "Two-stage factor screening procedures using multiple grouping assignments." Communications in Statistics - Theory and Methods 16(10): 3051-3067.
Morris, M. D. (1991). "Factorial sampling plans for preliminary computational experiments."
Technometrics 33(2): 161-174. O’Neill, P. J., D. B. Crawley (1991). Using regression equations to determine the relative
importance of inputs to energy simulations tools. Building Symposium, Nice, France.
Papamichael, K., J. La Porta (1997). "Building design advisor: Automated integration of multiple simulation tools." Automation in Construction 6(4): 341-352.
Papamichael, K. and V. Pal (2002). Barriers in developing and using simulation-based decision-
support software. Proceedings of the 2002 ACEEE Summer Study on Energy Efficiency
in Buildings, Asilomar Conference Center, Pacific Grove, California . Parish, J.-M. Wong, I.D. Tommelein, B. Stojadinovic, (2008) "Set-based design: case study on
innovative hospital design," Presented at 16th Annual Conference of the International
Group for Lean Construction (IGLC 16), Manchester, UK. Rahni, N., N. Ramdani, et al. (1995). Application of group screening to dynamic building energy
simulation models.
N. Rahni, N. Ramdani, Y. Candau and G. Guyon,"Exact Differential sensitivity analysis - Application to dynamic energy models developed on the CLIM 2000 software",
EUROTHERM, Vol.10, pp.99-106, Mons (Belgium), October 8-10, 1997 (ISBN 92-827-
5530-4).
Ross, A. and D. Hastings (2005). The tradespace exploration paradigm. INCOSE 2005 International Symposium. Rochester, New York.
Sacks, J., W. J. Welch, et al. (1989). "Design and analysis of computer experiments." Statistical
Science 4(4): 409-435. Sacks R, Eastman CM, Lee G. Parametric 3D modeling in building construction with examples
from precast concrete. Automation in Construction 2004;13(3):291-312.
Struck, C., de Wilde, P., Hopfe, C. and Hensen, J., (2009). “An investigation of the option space
in conceptual building design for advanced building simulation” Advanced Engineering Informatics, Volume 23, Issue 4, October 2009, Pages 386-395.
Simon, H. A. (1987b). Bounded rationality, pp. 266-8 in Eatwell, J., Milgatc, M. and Newman, P.
(eds), The New Palgrave, London, Macmillan. Wetter, M. (2004). Simulation-based building energy optimization. Mechanical Engineering.
Berkeley, California, University of California. Doctor of Philosophy: 989-999.
Willman, A. J. (1985). "Development of an evaluation procedure for building energy design tools." Proceedings of Buildings Energy Simulalationtion: 302-307.
Woodbury, R. F. and A. L. Burrow (2006). "Whither design science?" Artificial Intelligence for
Engineering Design Analysis and Manufacturing 20(2): 63-82.
Wright, J. A., H. A. Loosemore, et al. (2002). "Optimization of building thermal design and control by multi-criterion genetic algorithm."


Conclusion 1
CHAPTER 5: CONCLUSION- CONTRIBUTIONS AND FUTURE WORK
In this research I synthesize a set of metrics and framework for quantifying Design
Processes (Clevenger & Haymaker, 2010a), and develop the Design Exploration
Assessment Methodology (DEAM) (Clevenger et al., 2010b) to support their evaluation
and comparison. I claim the theory underlying DEAM - that Design Process consists of
measurable Challenge, Strategy and Exploration dimensions - enables a useful method
to assess Design Processes and compare Guidance. I provide evidence through
empirical testing using my Energy Explorer tool, that it is possible and instructive to
apply DEAM to assess the quality of Guidance. I demonstrate the power of DEAM by
measuring Explorations enabled by applying a Strategy to a Challenge and determining
the Value of Information generated (Clevenger & Haymaker, 2010c). I demonstrate the
generality of DEAM by assessing Guidance and calculating the Value of Information for
six Strategies across two Challenges.
Figure 1: Diagram outlining the contributions of this research. I developed a framework, metrics and software interface, Energy Explorer, to support my Design Exploration Assessment Method
(DEAM). I tested DEAM and provided evidence of its power and generality by enabling comparisons of the levels of Guidance and Value of Information afforded by twelve Design
Processes- six Strategies applied to two Challenges.
Without the ability to measure a process, it is not possible to identify improvement. This
research suggests that systematic and meaningful assessment is possible, and
motivates new research regarding improvement of Design Processes. Areas of future
work include: 1) further refinement and validation of the metrics. For example, additional
research to identify the level of statistical sampling required in building performance
analysis to generate meaningful trend data is important for both designers and tool
developers; 2) additional and broader application of DEAM to various Design Processes.
For example, future research can test how the findings of DEAM change for more
advanced Challenges and building models. Additionally, further data could help to more
Generate Value Space
Assess Challenge
Conduct Exploration
Assess Strategy
Assess Exploration
Evaluate Guidance
Value of Information
Energy Explorer
Calculated ”Real-time” Net Present Value
“Simulate” Button looks up pre-processed data
Net Present Value Calculation Call-out
Pull-down menu
Duplicate Button Short-cut
PIDO (Flager et al., 2009)
Metrics and FrameworkClevenger & Haymaker, 2010a
DEAMClevenger & Haymaker, 2010b
Design Guidance Clevenger & Haymaker, 2010c

Conclusion 2
precisely gauge the trade-offs between higher Process Costs and advanced Strategies;
3) use of DEAM to evaluate defining characteristics of Design Process in addition to
Guidance and Value of Information. For example, one of the most elusive characteristics
of Design Process identified by researchers to date is creativity. Future research will
build on DEAM to better understand and quantify the relationship of Design Process to
creativity.
As the complexity of building design Challenges continues to increase, design teams will
look to use more advanced Strategies to define Objectives, generate Alternatives,
analyze performance, and make decisions. This research, which enables the systematic
comparison and improvement of processes within the domain of building energy
performance, will continue to grow in importance as the Challenges facing designers
continue to expand.