
Design and Energy Consumption Analysis of Small Reverse ...
18
energies Article Design and Energy Consumption Analysis of Small Reverse Osmosis Seawater Desalination Equipment Zhuo Wang 1 , Yanjie Zhang 1, *, Tao Wang 2 , Bo Zhang 1 and Hongwen Ma 1 Citation: Wang, Z.; Zhang, Y.; Wang, T.; Zhang, B.; Ma, H. Design and Energy Consumption Analysis of Small Reverse Osmosis Seawater Desalination Equipment. Energies 2021, 14, 2275. https://doi.org/ 10.3390/en14082275 Academic Editor: Anastasios Dounis Received: 16 March 2021 Accepted: 14 April 2021 Published: 18 April 2021 Publisher’s Note: MDPI stays neutral with regard to jurisdictional claims in published maps and institutional affil- iations. Copyright: © 2021 by the authors. Licensee MDPI, Basel, Switzerland. This article is an open access article distributed under the terms and conditions of the Creative Commons Attribution (CC BY) license (https:// creativecommons.org/licenses/by/ 4.0/). 1 College of Mechanical and Electrical Engineering, Harbin Engineering University, Harbin 150001, China; [email protected] (Z.W.); [email protected] (B.Z.); [email protected] (H.M.) 2 School of Mechanical Engineering, Hebei University of Technology, Tianjin 300401, China; [email protected] * Correspondence: [email protected]; Tel.: +86-130-5900-1708 Abstract: The reverse osmosis method has developed extremely rapidly in recent years and has become the most competitive seawater desalination technology in the world, and it has been widely used in all aspects. Large-scale reverse osmosis desalination plants cannot provide fresh water resources in areas with insufficient water resources and limited space. Therefore, this paper proposes a research plan for a small seawater desalination device based on reverse osmosis, which is mainly suitable for handling emergencies, disaster relief, desert areas and outdoor activities and other needs for timely freshwater resources. It mainly includes pretreatment modules, a reaction infiltration module, a post-processing module and an energy supply module. Detailed design calculations are carried out for the small-scale reverse osmosis membrane system, including the selection and quantity and arrangement of membranes. Subsequently, the one-stage two-stage small-scale reverse osmosis membrane system was modeled, and its energy consumption was analyzed theoretically from the perspectives of specific energy consumption and energy utilization efficiency; the main influencing factors were clarified, and the optimal recovery rate for system operation was determined to be 20%–30%. Finally, an experimental prototype was built to conduct relevant experiments to determine the influence trend of pressure, temperature, concentration, and flow rate on the operating performance of the reverse osmosis system. Keywords: small capacity; seawater desalination; reverse osmosis; specific energy consumption; energy utilization efficiency 1. Introduction Water is an indispensable substance for the maintenance of life on the earth and the source of continuous progress and development of human society. Although water is a natural renewable resource, the freshwater resources on the earth only account for a small part of the total water resources, and the proportion of easily developed freshwater resources is even smaller, so the freshwater resources on the earth are very scarce. Due to population growth, rapid urbanization and global climate change, traditional water sources closely related to human life such as lakes, rivers and groundwater resources are insufficient to meet the increasing demand for high-quality drinking water [1,2]. The reverse osmosis method has developed rapidly in recent years. The pretreatment technology can reduce the pollution degree of the reverse osmosis membrane system and increase the life of the membrane. The efficiency of the high-pressure pump is constantly improving, making the reverse osmosis system perform well according to safety considera- tions and in lowering energy consumption. Its advantages such as convenience, convenient water production and low energy consumption make it advantageous compared to other methods in small seawater desalination equipment and reverse osmosis technology that has been widely used [3,4]. Energies 2021, 14, 2275. https://doi.org/10.3390/en14082275 https://www.mdpi.com/journal/energies
Transcript of Design and Energy Consumption Analysis of Small Reverse ...

energies
Article
Design and Energy Consumption Analysis of Small ReverseOsmosis Seawater Desalination Equipment
Zhuo Wang 1, Yanjie Zhang 1,*, Tao Wang 2, Bo Zhang 1 and Hongwen Ma 1
�����������������
Citation: Wang, Z.; Zhang, Y.; Wang,
T.; Zhang, B.; Ma, H. Design and
Energy Consumption Analysis of
Small Reverse Osmosis Seawater
Desalination Equipment. Energies
2021, 14, 2275. https://doi.org/
10.3390/en14082275
Academic Editor: Anastasios Dounis
Received: 16 March 2021
Accepted: 14 April 2021
Published: 18 April 2021
Publisher’s Note: MDPI stays neutral
with regard to jurisdictional claims in
published maps and institutional affil-
iations.
Copyright: © 2021 by the authors.
Licensee MDPI, Basel, Switzerland.
This article is an open access article
distributed under the terms and
conditions of the Creative Commons
Attribution (CC BY) license (https://
creativecommons.org/licenses/by/
4.0/).
1 College of Mechanical and Electrical Engineering, Harbin Engineering University, Harbin 150001, China;[email protected] (Z.W.); [email protected] (B.Z.); [email protected] (H.M.)
2 School of Mechanical Engineering, Hebei University of Technology, Tianjin 300401, China;[email protected]
* Correspondence: [email protected]; Tel.: +86-130-5900-1708
Abstract: The reverse osmosis method has developed extremely rapidly in recent years and hasbecome the most competitive seawater desalination technology in the world, and it has been widelyused in all aspects. Large-scale reverse osmosis desalination plants cannot provide fresh waterresources in areas with insufficient water resources and limited space. Therefore, this paper proposesa research plan for a small seawater desalination device based on reverse osmosis, which is mainlysuitable for handling emergencies, disaster relief, desert areas and outdoor activities and other needsfor timely freshwater resources. It mainly includes pretreatment modules, a reaction infiltrationmodule, a post-processing module and an energy supply module. Detailed design calculationsare carried out for the small-scale reverse osmosis membrane system, including the selection andquantity and arrangement of membranes. Subsequently, the one-stage two-stage small-scale reverseosmosis membrane system was modeled, and its energy consumption was analyzed theoreticallyfrom the perspectives of specific energy consumption and energy utilization efficiency; the maininfluencing factors were clarified, and the optimal recovery rate for system operation was determinedto be 20%–30%. Finally, an experimental prototype was built to conduct relevant experiments todetermine the influence trend of pressure, temperature, concentration, and flow rate on the operatingperformance of the reverse osmosis system.
Keywords: small capacity; seawater desalination; reverse osmosis; specific energy consumption;energy utilization efficiency
1. Introduction
Water is an indispensable substance for the maintenance of life on the earth and thesource of continuous progress and development of human society. Although water isa natural renewable resource, the freshwater resources on the earth only account for asmall part of the total water resources, and the proportion of easily developed freshwaterresources is even smaller, so the freshwater resources on the earth are very scarce. Dueto population growth, rapid urbanization and global climate change, traditional watersources closely related to human life such as lakes, rivers and groundwater resources areinsufficient to meet the increasing demand for high-quality drinking water [1,2].
The reverse osmosis method has developed rapidly in recent years. The pretreatmenttechnology can reduce the pollution degree of the reverse osmosis membrane system andincrease the life of the membrane. The efficiency of the high-pressure pump is constantlyimproving, making the reverse osmosis system perform well according to safety considera-tions and in lowering energy consumption. Its advantages such as convenience, convenientwater production and low energy consumption make it advantageous compared to othermethods in small seawater desalination equipment and reverse osmosis technology thathas been widely used [3,4].
Energies 2021, 14, 2275. https://doi.org/10.3390/en14082275 https://www.mdpi.com/journal/energies

Energies 2021, 14, 2275 2 of 18
In order to evaluate and improve the performance of the reverse osmosis systembased on thermodynamics, in the past few decades many scholars have developed math-ematical models for research and analysis. The main research method is to establish amathematical model and cooperate with software simulation, and finally compare andanalyze experimental data to verify the feasibility of the theory.
In 2007, Lu [5] of the Ocean University of China conducted a network design op-timization study on the reverse osmosis desalination system. The author established asuperstructure mathematical model using the state space method. This model can be de-rived from many methods such as equal pressure mixing constraints. The optimal schemeis solved in the design scheme. In 2011, Cui [6] of Texas Tech University in the UnitedStates defined ideal reverse osmosis as the most energy-efficient seawater desalinationreverse osmosis process under the required permeate flux, and then analyzed the cross-flowreverse osmosis process. The energy source is the minimum energy of thermodynamics,the additional energy required and the remaining energy of the retentate. Finally, theenergy efficiency of the cross-flow reverse osmosis process under different recovery ratesis evaluated. In 2012, Clarke et al. [7] of Edith Cowan University, Australia, conducted amodeling analysis of a small solar photovoltaic power generation system, verifying andconcluding that the use of media to store excess renewable energy has a greater impact onthe performance of small systems. In 2013, Rathore et al. [8] of Nehru National Instituteof Technology, India, established a reverse osmosis membrane material transport model,which was based on the concentration polarization coupling model of the unsteady statematerial balance. The concentration of concentration polarization layer on reverse osmosismembrane was studied from two aspects of concentration and solute concentration. In2014, Dimitrioua [9] of the Agricultural University of Athens, Greece et al. conductedsimulations and experimental research on seawater desalination equipment under fullload and partial load conditions. The experimental results show that the high specificenergy consumption occurs because of the low seawater temperature and the low powerfactor of the water supply motor. The operation of the seawater desalination unit underpartial load can result in lower specific energy consumption than full load operation. In2017, Karabelas [10] of the University of Thessaloniki, Greece et al. analyzed the effectsof various factors in the reverse osmosis desalination process versus energy consumption,and identified the factors with the greatest potential for energy reduction. Specific energyconsumption mainly comes from the osmotic pressure of the retentate, the resistance ofthe fluid through the membrane, the friction loss in the retentate of the reverse osmosismembrane element and the permeate channel, and the non-ideal operation of the high-pressure pump and the energy recovery device. In 2019, Zheng [11] of Hangzhou DianziUniversity conducted an analysis and research on the robust optimization scheduling ofreverse osmosis processes in uncertain environments. The author used a genetic-simulatedannealing algorithm to numerically solve the model and found that a robust schedulingscheme can optimize the reverse osmosis system better than a static scheduling scheme. In2019, Lacroix [12] introduced a new type of thermal power reverse osmosis desalinationprocess. This new thermal hydraulic process used solar energy to pressurize sea water andmade it exceed osmotic pressure, to desalinate it. This pressurization is due to the piston orfilm in the reservoir by following the working fluid movement of the thermodynamic cyclesimilar to the organic Rankine cycle. The device is designed for small-scale desalination ofbrackish water. The solar collector can produce 500 L of drinking water per square meterper day.
The operating parameters of the reverse osmosis system are also very important totheir working conditions. Many scholars have conducted theoretical model research andexperimental verification analysis to find the best operating parameters.
In 2012, Altaee [13] developed a calculation model for RO (Reverse Osmosis) systemdesign and performance prediction. The purpose of this model is to estimate the perfor-mance parameters of RO in a multi membrane pressure vessel. This study may be the firstto propose a systematic program to estimate the performance of multiple RO elements

Energies 2021, 14, 2275 3 of 18
in pressure vessels. In 2015, Choi et al. [14] of the Korea Institute of Building Technologydeveloped a design method based on simulation technology by analyzing the effects ofmaximizing permeation flux, minimizing energy consumption, and minimizing boronconcentration in the permeate trend to optimize the dual-pass reverse osmosis seawa-ter desalination system. In 2016, Wang [15] from the Zhejiang University of Technologyoptimized and compared the operating parameters of the marine desalination systemthrough an orthogonal experiment method and a neural network model method. It showedthat the neural network model method has a smaller optimization error for the relevantparameters of the reverse osmosis system, which provides a new way of thinking for theresearch on the performance of reverse osmosis. In 2020, Koutsou [16] of the Universityof Thessaloniki, Greece, studied the effect of feed water temperature on the performanceof a typical reverse osmosis device and found different conclusions about the range ofinfluence of seawater temperature with different salinity. For high salinity in seawater, thespecific energy consumption reaches the minimum at a temperature of about 30 ◦C, and thesignificant increase in osmotic pressure will offset the positive effects of temperature rise.
In 2017, Zhang [17] of the School of Mechanical Engineering of the Zhejiang Universityof Technology designed a set of island energy-saving integrated desalination deviceswith a daily fresh water output of 25 m3/d, and reduced the water production energyconsumption of the small desalination system. In 2019, Su et al. [18] from the TianjinDesalination and Comprehensive Utilization Research Institute developed a cabinet typereverse osmosis desalination equipment based on the previous device. The space occupiedby the equipment is about 20 m3, and the pretreatment process includes a multi-media filterand a precision filter. Compared with the previous device, the volume of the equipment isreduced by more than half, and the water yield can reach 55 m3/d.
In areas with insufficient water resources and small available space, seawater de-salination plants do not have sufficient conditions for application due to the large-scaleequipment, large water supply demand, and high energy consumption requirements.Therefore, considering the demand for mobile desalination devices in many cases, suchas islands, yachts and offshore operating platforms, as well as the need for timely fresh-water resources such as emergency handling, disaster relief, desert areas and outdoorentertainment, the research is applicable to the desalination technology of small-capacityand convenient equipment is of great significance [19,20].
The purpose of this paper is to put forward a convenient mobile design scheme basedon the reverse osmosis method, based on existing small seawater desalination equipment,which aims to increase the versatility of small seawater desalination equipment based onensuring fresh water production and fresh water quality, to meet the requirements of use inspecial environments. Compared with the devices designed by Zhang [17] and Su [18], thisdevice has more advantages in portability and volume. The small-scale reverse osmosismembrane system is designed in detail, and its energy consumption is analyzed in detail.Finally, the influence trend of different operating parameters on the performance of thereverse osmosis system is established through the experimental prototype.
2. Overall Design2.1. Design Specifications
The small-scale reverse osmosis desalination equipment proposed in this article has asmaller footprint, compact structure, and simple installation. It can be used for conventionaldesalination supplies, and is also suitable for emergency situations, outdoor entertainment,marine, island or desert use. It is both a desalinator and a water purifier, which can producehigh-quality, good-tasting drinking water from various water sources including sea water,river water, lake water, brackish water or polluted water sources.
The small-scale reverse osmosis seawater desalination device can meet the waterconsumption of two people in one day. According to the national and industrial standardsof reverse osmosis equipment [21,22], the specific design indicators are as follows:

Energies 2021, 14, 2275 4 of 18
• Volume: less than 0.3 m3;• Weight: less than 50 kg;• Target water production: 40 L/h, intermittent work;• System energy consumption: below 5 kWh/m3;• TDS (Total Dissolved Solids) of produced water quality: less than 500 mg/L;• Recovery rate: more than 15%;• Desalination rate: above 99%.
2.2. Process Flow
According to the design index of small reverse osmosis seawater desalination equip-ment, the following seawater desalination process flow is designed. The seawater ispressurized by the feed pump and enters the device through the first-stage sand filterpretreatment device, then through the accumulator, next it enters the second and third-stage fine filtration pretreatment devices in turn, and then increases the pressure by thehigh-pressure pump, and enters reverse osmosis membrane module. Part of the seawaterpassing through the reverse osmosis membrane passes through the post activated carbonfilter, and then flows into the fresh water storage tank after being purified by the ultravioletdisinfection device. The other part of the concentrated water is discharged through theflow control valve. The overall process flow of the equipment is shown in Figure 1.
Energies 2021, 14, 2275 4 of 20
can produce high-quality, good-tasting drinking water from various water sources includ-
ing sea water, river water, lake water, brackish water or polluted water sources.
The small-scale reverse osmosis seawater desalination device can meet the water con-
sumption of two people in one day. According to the national and industrial standards of
reverse osmosis equipment [21,22], the specific design indicators are as follows:
Volume: less than 0.3 m3;
Weight: less than 50 kg;
Target water production: 40 L/h, intermittent work;
System energy consumption: below 5 kWh/m3;
TDS (Total Dissolved Solids) of produced water quality: less than 500 mg/L;
Recovery rate: more than 15%;
Desalination rate: above 99%.
2.2. Process Flow
According to the design index of small reverse osmosis seawater desalination equip-
ment, the following seawater desalination process flow is designed. The seawater is pres-
surized by the feed pump and enters the device through the first-stage sand filter pretreat-
ment device, then through the accumulator, next it enters the second and third-stage fine
filtration pretreatment devices in turn, and then increases the pressure by the high-pres-
sure pump, and enters reverse osmosis membrane module. Part of the seawater passing
through the reverse osmosis membrane passes through the post activated carbon filter,
and then flows into the fresh water storage tank after being purified by the ultraviolet
disinfection device. The other part of the concentrated water is discharged through the
flow control valve. The overall process flow of the equipment is shown in Figure 1.
Figure 1. Process flow of a small reverse osmosis seawater desalination unit.
2.3. Overall Structure Integrated Design
According to the process flow of the small-scale reverse osmosis system and the
structural characteristics of the reverse osmosis device itself, adopting the progressive
structure method of the blocking filter principle, the preliminary design of the overall
structure scheme is shown in Figure 2. In order to ensure that the desalination equipment
is easy to move and carry, the overall structure of the small reverse osmosis seawater de-
salination device is integrated and designed; the required components are arranged as
small as possible and the structure is as compact as possible.
The equipment is built in a durable military-grade molded plastic shell, and it is
transported in a pull-box type, and solar power is added to the traditional small reverse
osmosis desalination device to improve its adaptability to different environments. The
small-scale reverse osmosis seawater desalination device is mainly composed of a pre-
treatment module, a reverse osmosis module, a post-treatment module and an energy
supply module. The components of each module are concentrated in the box in a folding
arrangement method, and the space in the box is fully utilized by the dense arrangement,
Figure 1. Process flow of a small reverse osmosis seawater desalination unit.
2.3. Overall Structure Integrated Design
According to the process flow of the small-scale reverse osmosis system and thestructural characteristics of the reverse osmosis device itself, adopting the progressivestructure method of the blocking filter principle, the preliminary design of the overallstructure scheme is shown in Figure 2. In order to ensure that the desalination equipmentis easy to move and carry, the overall structure of the small reverse osmosis seawaterdesalination device is integrated and designed; the required components are arranged assmall as possible and the structure is as compact as possible.
The equipment is built in a durable military-grade molded plastic shell, and it is trans-ported in a pull-box type, and solar power is added to the traditional small reverse osmosisdesalination device to improve its adaptability to different environments. The small-scalereverse osmosis seawater desalination device is mainly composed of a pretreatment mod-ule, a reverse osmosis module, a post-treatment module and an energy supply module.The components of each module are concentrated in the box in a folding arrangementmethod, and the space in the box is fully utilized by the dense arrangement, which caneffectively reduce the volume and facilitate carrying. In order to facilitate the disassemblyand assembly, most of the components are fixed by bolts, enabling easy replacement ofthe components. The size of the device is 800 × 600 × 460 mm, and the overall mass inworking condition is about 50 kg.

Energies 2021, 14, 2275 5 of 18
Energies 2021, 14, 2275 5 of 20
which can effectively reduce the volume and facilitate carrying. In order to facilitate the
disassembly and assembly, most of the components are fixed by bolts, enabling easy re-
placement of the components. The size of the device is 800 × 600 × 460 mm, and the overall
mass in working condition is about 50 kg.
Figure 2. Overall structure of a small reverse osmosis seawater desalination unit: 1—sand filter;
2—flow meter; 3—accumulator; 4—pressure gauge; 5—feed pump; 6—battery; 7—flow control
valve; 8—reverse osmosis membrane pressure vessel; 9—solar controller; 10—battery charger;
11—ultraviolet disinfector; 12—post-processing activated carbon; 13—solar photovoltaic panel;
14—check valve; 15—fine filter; 16—high pressure pump.
All module components, pipe fittings and boxes of the seawater desalination device
must be designed for corrosion protection, otherwise the corrosion products of the com-
ponents will affect the normal operation of the reverse osmosis system and affect the qual-
ity of the water produced. Pumps, meters and other components should not only use anti-
corrosion materials, but should also receive paint protection treatment. The military box
is made of materials that can withstand high pressure, high and low temperature changes
and seawater chloride ion corrosion. The high-pressure pipe fittings are made of SS316
stainless steel, which is widely used in the marine industry and has strong corrosion re-
sistance and chloride resistance. Low-pressure pipe fittings use high-quality UPVC (Un-
plasticized Polyvinyl Chloride) pipe fittings, which have the advantages of corrosion re-
sistance, heat resistance and impact resistance [23].
In addition to the conventional direct external DC power supply operation, the
power supply module is also designed with a power storage system that can charge the
battery through 220 V AC power or the photovoltaic system. The energy supply module
includes a battery (6), a solar controller (9), a battery charger (10) and a solar photovoltaic
panel (13). The photovoltaic system uses the photovoltaic effect of solar panels to convert
light energy into electrical energy, and then can directly supply power to the system to
drive the system to work; the remaining energy can be sent to the storage battery for stor-
age. The solar controller is the control element of the photovoltaic system, which regulates
and controls the charging and discharging conditions of the battery, and plays a protective
role when the system reaches either the overcharge or the over discharge state. The com-
ponent composition and principle of the energy supply module are shown in Figure 3.
Figure 2. Overall structure of a small reverse osmosis seawater desalination unit: 1—sand filter;2—flow meter; 3—accumulator; 4—pressure gauge; 5—feed pump; 6—battery; 7—flow controlvalve; 8—reverse osmosis membrane pressure vessel; 9—solar controller; 10—battery charger; 11—ultraviolet disinfector; 12—post-processing activated carbon; 13—solar photovoltaic panel; 14—checkvalve; 15—fine filter; 16—high pressure pump.
All module components, pipe fittings and boxes of the seawater desalination devicemust be designed for corrosion protection, otherwise the corrosion products of the compo-nents will affect the normal operation of the reverse osmosis system and affect the qualityof the water produced. Pumps, meters and other components should not only use anti-corrosion materials, but should also receive paint protection treatment. The military box ismade of materials that can withstand high pressure, high and low temperature changes andseawater chloride ion corrosion. The high-pressure pipe fittings are made of SS316 stainlesssteel, which is widely used in the marine industry and has strong corrosion resistanceand chloride resistance. Low-pressure pipe fittings use high-quality UPVC (UnplasticizedPolyvinyl Chloride) pipe fittings, which have the advantages of corrosion resistance, heatresistance and impact resistance [23].
In addition to the conventional direct external DC power supply operation, the powersupply module is also designed with a power storage system that can charge the batterythrough 220 V AC power or the photovoltaic system. The energy supply module includesa battery (6), a solar controller (9), a battery charger (10) and a solar photovoltaic panel(13). The photovoltaic system uses the photovoltaic effect of solar panels to convert lightenergy into electrical energy, and then can directly supply power to the system to drivethe system to work; the remaining energy can be sent to the storage battery for storage.The solar controller is the control element of the photovoltaic system, which regulates andcontrols the charging and discharging conditions of the battery, and plays a protective rolewhen the system reaches either the overcharge or the over discharge state. The componentcomposition and principle of the energy supply module are shown in Figure 3.

Energies 2021, 14, 2275 6 of 18Energies 2021, 14, 2275 6 of 20
Figure 3. Power supply module of the small reverse osmosis desalination unit.
2.4. Membrane System Design
Because it is a small system, the target water production is very small, only about 40
L/h, and a membrane element with a smaller membrane area should be selected. After com-
parative analysis, the reverse osmosis membrane element produced by Dow Company has
good performance and meets the design requirements. The Dow reverse osmosis membrane
is a polythiazide composite membrane, characterized by a high desalination rate, a theoret-
ical desalination rate of more than 99%, and has large water flux, strong anti-biological pol-
lution ability, low cost, large pH range and easy maintenance, etc. In addition to these ad-
vantages, the use of the latest precision processing technology for component sealing pro-
vides good reliability and stability. After selection, the effective length of SW30-2521 reverse
osmosis membrane produced by the Dow company is less than 600 mm, which meets the
requirements of small components. The product specifications are shown in Table 1.
Table 1. Product specifications of the SW30-2521 membrane module.
Stable (chenchen)
Desalination Rate
Effective
(chenchen)
Membrane Area
Work
(chenchen)
Pressure
Temperature
Water
(chenchen)
Production
pH Range
Molecular
(chenchen)
Cut Off
99.4% 1.2 m2 5.5 MPa 5–45 °C 1.1 m3/d 2–11 1000
The membrane flux that the reverse osmosis membrane system can generally bear is
not less than 50 L/(m2·h), and the size of the membrane flux has a great influence on the
performance of the reverse osmosis system. If the membrane flux is too small, the energy
utilization efficiency of the membrane system will decrease, leading to an increase in the
investment cost of the entire equipment. If the membrane flux is too high, it will increase
the degree of pollution of the membrane elements, and the increase in replacement fre-
quency of membrane elements will also increase the cost of seawater desalination.
For different types of raw water, the design guidelines for reverse osmosis systems
are different. Table 2 shows the average flux of membrane elements, the highest flux, and
the highest concentration polarization of the membrane system under standard conditions
of 25 °C.
Figure 3. Power supply module of the small reverse osmosis desalination unit.
2.4. Membrane System Design
Because it is a small system, the target water production is very small, only about 40L/h, and a membrane element with a smaller membrane area should be selected. Aftercomparative analysis, the reverse osmosis membrane element produced by Dow Companyhas good performance and meets the design requirements. The Dow reverse osmosismembrane is a polythiazide composite membrane, characterized by a high desalinationrate, a theoretical desalination rate of more than 99%, and has large water flux, stronganti-biological pollution ability, low cost, large pH range and easy maintenance, etc. Inaddition to these advantages, the use of the latest precision processing technology forcomponent sealing provides good reliability and stability. After selection, the effectivelength of SW30-2521 reverse osmosis membrane produced by the Dow company is less than600 mm, which meets the requirements of small components. The product specificationsare shown in Table 1.
Table 1. Product specifications of the SW30-2521 membrane module.
StableDesalination Rate
EffectiveMembrane Area
WorkPressure Temperature Water
Production pH Range MolecularCut Off
99.4% 1.2 m2 5.5 MPa 5–45 ◦C 1.1 m3/d 2–11 1000
The membrane flux that the reverse osmosis membrane system can generally bearis not less than 50 L/(m2·h), and the size of the membrane flux has a great influence onthe performance of the reverse osmosis system. If the membrane flux is too small, theenergy utilization efficiency of the membrane system will decrease, leading to an increasein the investment cost of the entire equipment. If the membrane flux is too high, it willincrease the degree of pollution of the membrane elements, and the increase in replacementfrequency of membrane elements will also increase the cost of seawater desalination.
For different types of raw water, the design guidelines for reverse osmosis systemsare different. Table 2 shows the average flux of membrane elements, the highest flux, andthe highest concentration polarization of the membrane system under standard conditionsof 25 ◦C.

Energies 2021, 14, 2275 7 of 18
Table 2. Design guidelines for membrane flux and other indicators under standard conditions of 25 ◦C.
Raw Water TypeInfluent
PollutionIndex (SDI 2)
InfluentTurbidity (NTU 1)
AverageMembrane Flux
(L/(m2·h))
MaximumMembrane Flux
(L/(m2·h))
ConcentrationPolarization (β)
Deep wellwater <2 0.2 30 46 1.2
Surface water <4 0.4 20 30 1.2Sea well
water <3 0.3 17 40 1.2
Sea water <4 0.4 15 34 1.21 NTU: Nephelometric Turbidity Unit. 2 SDI: Silt Density Index.
The small-scale reverse osmosis seawater desalination system designed in this paper isobject-oriented to multiple water sources, so according to the design guidelines, the averagemembrane flux is 20 L/(m2·h). The calculation formula for the number of membraneelements is:
NE =QP
J × SE(1)
where: NE is theoretical number of membrane elements; QP is the designed water produc-tion, 40 L/h; J is the average flux of the membrane; SE is the effective membrane area ofthe membrane module, 1.2 m2.
According to Equation (1), the number of membrane elements can be calculated tobe 1.67, so the number of membrane elements is 2. When using two SW30-2521 reverseosmosis membranes, the actual average membrane flux is 16.67 L/(m2·h). Because it is acompact system, the pressure vessel chooses 1 core, that is, two pressure vessels are used.The arrangement of membrane modules selects a one-stage two-stage system, and sendsthe concentrated water of the first membrane module to the membrane system again fordesalination, which improves the recovery rate of the small system.
3. Energy Consumption Analysis
The reverse osmosis desalination system is the most energy-consuming pressure-driven membrane process, and energy consumption is one of its main costs. The reverseosmosis process requires a large amount of energy to drive the water to complete thedesalination process. Therefore, minimizing energy consumption is one of the most ef-fective ways to reduce the cost of seawater reverse osmosis desalination, which is a moreeconomical and sustainable water supply method.
Small-scale reverse osmosis desalination equipment is used in outdoor environments.When there is no stable power supply and only photovoltaic power generation is available,there are higher requirements for the use of energy consumption. Reducing system energyconsumption can extend the working time of small reverse osmosis desalination equipment.Therefore, how to achieve the maximum desalination rate with the least energy loss is themost important part of the desalination process.
It is generally believed that the process of reverse osmosis material transfer is affectedby external resistance and internal resistance. The internal resistance is mainly the seawaterosmotic pressure that must be overcome during the reverse osmosis process, and theexternal resistance is the thermodynamic limit pressure. As the manufacturing technologyof reverse osmosis membrane elements has become increasingly mature in recent years,the thermodynamic limit resistance exceeding the transmembrane transmission resistancehas become the dominant factor limiting the flux of the reverse osmosis membranes [24].
3.1. Minimum SEC
SEC (Specific Energy Consumption) is the most important parameter to characterizethe performance of the reverse osmosis desalination process. The unit is kWh/m3, whichrepresents the energy required to produce 1 m3 of product water. It is also the stable opera-

Energies 2021, 14, 2275 8 of 18
tion of reverse osmosis desalination equipment. We aim to optimize the key parametersof the design. The main influencing factors of specific energy consumption include theosmotic pressure of concentrated water, the resistance of the fluid through the membrane,the friction loss in the concentrated water and fresh water channels of the reverse osmosismembrane, and the motor efficiency of the high-pressure pump.
Figure 4 shows a schematic diagram of a one-stage two-stage reverse osmosis process.Its characteristic is that the concentrated water of the first stage membrane element issent to the second stage membrane element for desalination, and two parts of fresh waterare obtained, which improves the system recovery rate. As a result of the main analysisof the influence of the transmembrane transfer resistance and the thermodynamic limitresistance on the reverse osmosis flux, the mathematical model is simplified, and the effectof concentration polarization is ignored. The pressure drops of the concentrated waterflowing out of the reverse osmosis membrane is ignored, the permeate water and the feedwater pressures are considered equal.
Energies 2021, 14, 2275 9 of 20
3.1. Minimum SEC
SEC (Specific Energy Consumption) is the most important parameter to characterize
the performance of the reverse osmosis desalination process. The unit is kWh/m3, which
represents the energy required to produce 1 m3 of product water. It is also the stable op-
eration of reverse osmosis desalination equipment. We aim to optimize the key parame-
ters of the design. The main influencing factors of specific energy consumption include
the osmotic pressure of concentrated water, the resistance of the fluid through the mem-
brane, the friction loss in the concentrated water and fresh water channels of the reverse
osmosis membrane, and the motor efficiency of the high-pressure pump.
Figure 4 shows a schematic diagram of a one-stage two-stage reverse osmosis pro-
cess. Its characteristic is that the concentrated water of the first stage membrane element
is sent to the second stage membrane element for desalination, and two parts of fresh
water are obtained, which improves the system recovery rate. As a result of the main anal-
ysis of the influence of the transmembrane transfer resistance and the thermodynamic
limit resistance on the reverse osmosis flux, the mathematical model is simplified, and the
effect of concentration polarization is ignored. The pressure drops of the concentrated wa-
ter flowing out of the reverse osmosis membrane is ignored, the permeate water and the
feed water pressures are considered equal.
Figure 4. Schematic diagram of the one-stage two-stage reverse osmosis process.
The high-pressure pump raises the feed seawater pressure from P0 to Pf to overcome
the seawater osmotic pressure. The efficiency of the high-pressure pump is expressed by
ηHP, and the energy consumption WHP of the high-pressure pump can be expressed as:
𝑊𝐻𝑃 =𝑄𝑓 × (𝑃𝑓 − 𝑃0)
𝜂𝐻𝑃 (2)
Then, SEC can be defined as:
𝑆𝐸𝐶 =𝑊𝐻𝑃
𝑄𝑝1 + 𝑄𝑝2 (3)
In addition, =𝑄𝑝
𝑄𝑓, SEC can be rewritten as:
𝑆𝐸𝐶 =𝛥𝑃𝑓
𝑌𝜂𝐻𝑃 (4)
In the entire desalination process, according to the law of conservation of materials,
there is a mass balance equation for solution and solute, that is, the feed water flow is
equal to the sum of the fresh water flow and the concentrated water flow:
𝑄𝑓 = 𝑄𝑝1 + 𝑄𝑝2 + 𝑄𝑏2 (5)
where: Qf is feed water flow, m3/h; Qp1 + Qp2 is the permeate flow, m3/h; and Qb2 is the
concentrate flow, m3/h.
Figure 4. Schematic diagram of the one-stage two-stage reverse osmosis process.
The high-pressure pump raises the feed seawater pressure from P0 to Pf to overcomethe seawater osmotic pressure. The efficiency of the high-pressure pump is expressed byηHP, and the energy consumption WHP of the high-pressure pump can be expressed as:
WHP =Q f ×
(Pf − P0
)ηHP
(2)
Then, SEC can be defined as:
SEC =WHP
Qp1 + Qp2(3)
In addition, = QpQ f
, SEC can be rewritten as:
SEC =∆Pf
YηHP(4)
In the entire desalination process, according to the law of conservation of materials,there is a mass balance equation for solution and solute, that is, the feed water flow is equalto the sum of the fresh water flow and the concentrated water flow:
Q f = Qp1 + Qp2 + Qb2 (5)
where: Qf is feed water flow, m3/h; Qp1 + Qp2 is the permeate flow, m3/h; and Qb2 is theconcentrate flow, m3/h.

Energies 2021, 14, 2275 9 of 18
Similarly, according to the conservation of salt quality, the salt content in the feedwater is equal to the sum of the salt content of the permeate water and the salt content ofthe concentrated water, namely:
Q f c f = QP1cP1 + QP2cP2 + Qb2cb2 (6)
where: cf is average salt concentration of the feed water, mg/L; cp1 + cp2 is the average saltconcentration of the osmotic water, mg/L; cb2 is the average concentration of salt in theconcentrated water, mg/L.
Define the desalination rate Rs of the reverse osmosis system as:
Rs = 1 −cp1 + cp2
c f(7)
Therefore, Equation (6) can be rewritten as:
Y(1 − Rs) + (1 − Y)cb2c f
− 1 = 0 (8)
The osmotic pressure of the solution can be calculated according to the Van’t Hoffequation [25]:
π = RT ∑ ci (9)
where: π is osmotic pressure of the solution, kPa; T is thermodynamic temperature, K; ci isthe concentration of ion i in the solute, mol/L; and R is the gas constant, 8.314 kPa·L/(mol·K).
According to Equation (9), it can be concluded that the osmotic pressure πexit at theconcentrated water outlet of the membrane element has the following relationship withthe original seawater osmotic pressure π0:
πexitπ0
=cb2c f
=1 − Y(1 − Rs)
1 − Y(10)
The osmotic pressure πp of the permeated water is ignored, that is, the osmoticpressure difference at the outlet of the membrane element is:
∆πexit = πexit − πp ∼=1 − Y(1 − Rs)
1 − Yπ0 (11)
Assuming that the salt concentration is the highest at the concentrated water outlet ofthe membrane element, the transmembrane pressure entering the membrane element mustbe greater than the osmotic pressure difference at the membrane outlet to ensure that themembrane element has permeation flux over the entire length, and the flux is only in themembrane. The exit of the component is reduced to 0 [26], namely:
∆Pf ≥ ∆πexit (12)
Equation (12) is the thermodynamic limit equation of the reverse osmosis processin cross-flow operation. By incorporating it into Equation (4), the minimum SEC for agiven recovery rate under the thermodynamic limit conditions can be obtained. Fromthen on, the permeate water production process can occur on the entire reverse osmosismembrane element until the exit of the membrane element tail where the effective drivingforce disappears:
SEC ≥ 1 − Y(1 − Rs)
Y(1 − Y)ηHPπ0 (13)
Standardizing the SEC relative to the osmotic pressure (π0) of the feed seawater,we obtain:
SECnorm =SECπ0
≥ 1 − Y(1 − Rs)
Y(1 − Y)ηHP(14)

Energies 2021, 14, 2275 10 of 18
From Equation (14), the relationship between SECnorm and the recovery rate Y andthe high-pressure pump efficiency ηHP can be obtained, so that the system desalinationrate Rs is 99%, the system recovery rate is 5–80%, and the high-pressure pump efficiency is50–90%. The trend of change is shown in Figure 5.
Energies 2021, 14, 2275 11 of 20
𝑆𝐸𝐶𝑛𝑜𝑟𝑚 =𝑆𝐸𝐶
𝜋0≥1 − 𝑌(1 − 𝑅𝑠)
𝑌(1 − 𝑌)𝜂𝐻𝑃 (14)
From Equation (14), the relationship between SECnorm and the recovery rate Y and the
high-pressure pump efficiency ηHP can be obtained, so that the system desalination rate Rs is
99%, the system recovery rate is 5–80%, and the high-pressure pump efficiency is 50–90%.
The trend of change is shown in Figure 5.
Figure 5. The relationship between the standard specific energy consumption and the recovery
rate and the efficiency of the high-pressure pump.
It can be seen from Figure 5 that the SECnorm of the reverse osmosis process decreases
with the increase of the high-pressure pump efficiency, and a target recovery rate that is
too high or too low will increase the SECnorm. Analysis of this process indicates that when
the target recovery rate increases, the feedwater pressure provided by the high-pressure
pump increases rapidly, resulting in an increase in specific energy consumption; when the
target recovery rate decreases, part of the energy in the concentrated water discharge will
be wasted, thereby increasing the large production water ratio energy consumption. Im-
proving the efficiency of the high-pressure pump will correspondingly reduce the specific
energy consumption of the system, thereby increasing the efficiency of the reverse osmo-
sis system.
In general, choosing a high-pressure pump with high safety performance and high
efficiency is critical to small desalination equipment. In addition, the selection of the re-
covery rate is also very important for the membrane system. The target recovery rate is
within the range of 20% to 60%. The specific energy consumption of the system is rela-
tively low. However, increasing the recovery rate of miniaturized equipment has other
aspects besides increasing energy consumption. Due to restrictions, too high values can-
not be selected; the target recovery rate is between 20% and 30%.
3.2. Energy Efficiency
In addition to reducing the specific energy consumption of the membrane process,
improving the energy utilization efficiency of the reverse osmosis process can also extend
the working time of the small reverse osmosis seawater desalination equipment. There-
fore, a mathematical model is established in this section to calculate the membrane energy
efficiency, permeate volume flow and desalination rate in a small system, which are
mainly related to the feed water concentration and the high-pressure pump.
Figure 5. The relationship between the standard specific energy consumption and the recovery rateand the efficiency of the high-pressure pump.
It can be seen from Figure 5 that the SECnorm of the reverse osmosis process decreaseswith the increase of the high-pressure pump efficiency, and a target recovery rate that istoo high or too low will increase the SECnorm. Analysis of this process indicates that whenthe target recovery rate increases, the feedwater pressure provided by the high-pressurepump increases rapidly, resulting in an increase in specific energy consumption; whenthe target recovery rate decreases, part of the energy in the concentrated water dischargewill be wasted, thereby increasing the large production water ratio energy consumption.Improving the efficiency of the high-pressure pump will correspondingly reduce thespecific energy consumption of the system, thereby increasing the efficiency of the reverseosmosis system.
In general, choosing a high-pressure pump with high safety performance and highefficiency is critical to small desalination equipment. In addition, the selection of therecovery rate is also very important for the membrane system. The target recovery rate iswithin the range of 20% to 60%. The specific energy consumption of the system is relativelylow. However, increasing the recovery rate of miniaturized equipment has other aspectsbesides increasing energy consumption. Due to restrictions, too high values cannot beselected; the target recovery rate is between 20% and 30%.
3.2. Energy Efficiency
In addition to reducing the specific energy consumption of the membrane process,improving the energy utilization efficiency of the reverse osmosis process can also extendthe working time of the small reverse osmosis seawater desalination equipment. Therefore,a mathematical model is established in this section to calculate the membrane energyefficiency, permeate volume flow and desalination rate in a small system, which are mainlyrelated to the feed water concentration and the high-pressure pump.

Energies 2021, 14, 2275 11 of 18
Due to the irreversible nature of the mixing process, the separation process of themembrane does not occur spontaneously. In order to carry out the process, the pressuredifference applied by the pump must take the form:
∆ppump = ∆π + ∆plosses (15)
where: ∆π is the osmotic pressure difference between the membrane inlet and outletsolution; ∆plosses is friction loss in the membrane system.
When the membrane loss in the reverse osmosis system is not considered, that is∆plosses = ∆π, the system consumes the least energy to complete the membrane separationwork in an ideal state. According to the second law of thermodynamics, considering theadiabatic mixing process, the minimum separation energy of the feed liquid salt and watercan be obtained from the following equation [27]:
wmin = −RT(ywln(yw) + ysln(ys)) (16)
where: ys is the molar fraction of the solute in the membrane inlet solution, that is, the ratioof the amount of solute to the amount of the entire solution; and yw is the mole fraction ofsolvent, yw = 1 − ys.
Therefore, the minimum separation work Wmin of the membrane can be expressed as:
Wmin = ρ f Q f wmin (17)
where: ρf is density of feed solution, kg/m−3.Wpump represents the actual work provided by the pump to the system due to friction
loss, which can be obtained by Equation (2).
Wpump =Q f
(Pf − P0
)ηp
(18)
The energy utilization efficiency of the membrane is defined as the ratio between theminimum separation work and the work done by the actual pump:
η =Wmin
Wpump(19)
Combining Equations (2) and (17), Equation (19) can be written as:
η =−ρ f RT[(1 − ys)ln(1 − ys) + ysln(ys)]
(Pf −P0)ηp
× 10−5 (20)
The concentration range of the membrane feed solution is 0–8 g/L, the feed waterpressure is 30–50 bar, the other quantities in Equation (20) are regarded as constants, andthe change trend of energy utilization efficiency η is analyzed, as shown in Figure 6.
It can be seen from Figure 6, when the feed concentration increases from 2 to 8 g/L,the energy utilization efficiency varies greatly between 25% and 75%, and when the feedwater pressure increases from 30 to 50 bar, the rate of change of efficiency is slow, and theefficiency is reduced from 75% to 50%. Therefore, the feed concentration has a significantpositive impact on the energy utilization efficiency of the system. The efficiency increasesalmost linearly with the feed concentration. This is because the minimum separation workWmin increases, while the actual work done by the pump remains unchanged, while thefeed water pressure is less affected. However, the increase in the feed concentration willalso lead to a decrease in the salt rejection rate, so in order to achieve the best reverseosmosis performance, the feed concentration must be selected at an appropriate value.
Energies 2021, 14, 2275 12 of 18Energies 2021, 14, 2275 13 of 20
Figure 6. The relationship of membrane energy utilization efficiency η with the concentration of
feed solution and feed water pressure.
It can be seen from Figure 6, when the feed concentration increases from 2 to 8 g/L,
the energy utilization efficiency varies greatly between 25% and 75%, and when the feed
water pressure increases from 30 to 50 bar, the rate of change of efficiency is slow, and the
efficiency is reduced from 75% to 50%. Therefore, the feed concentration has a significant
positive impact on the energy utilization efficiency of the system. The efficiency increases
almost linearly with the feed concentration. This is because the minimum separation work
Wmin increases, while the actual work done by the pump remains unchanged, while the
feed water pressure is less affected. However, the increase in the feed concentration will
also lead to a decrease in the salt rejection rate, so in order to achieve the best reverse
osmosis performance, the feed concentration must be selected at an appropriate value.
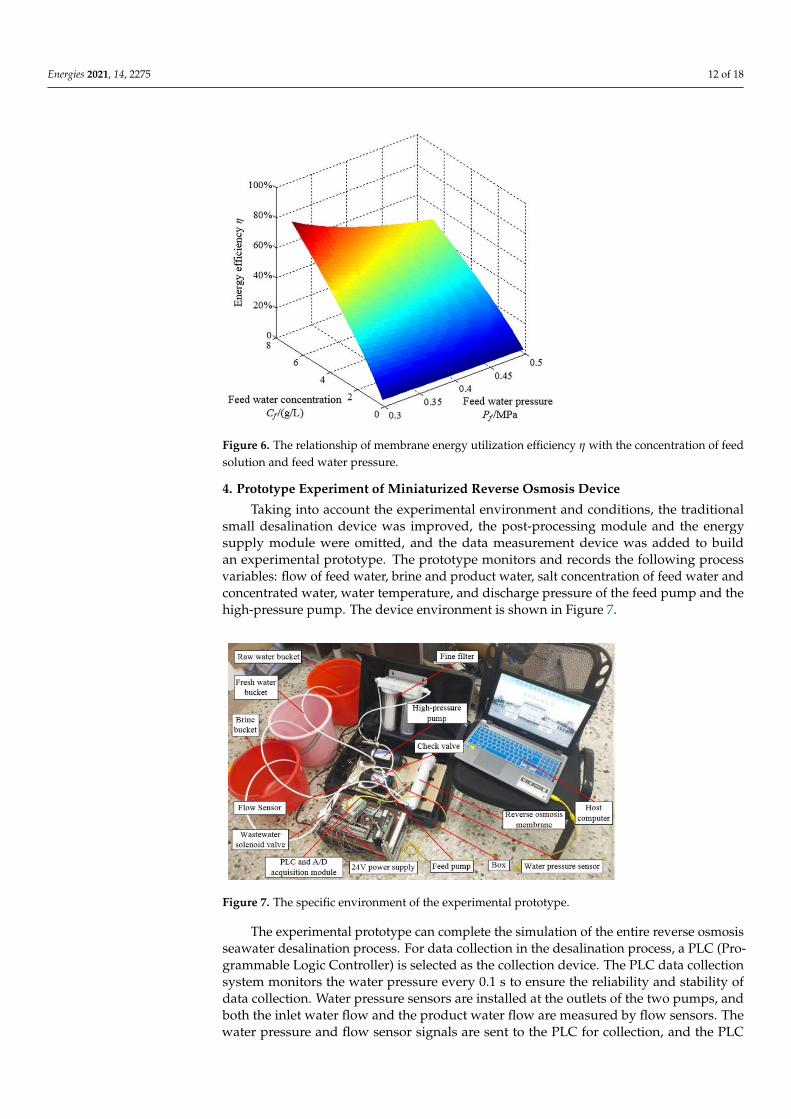
4. Prototype Experiment of Miniaturized Reverse Osmosis Device
Taking into account the experimental environment and conditions, the traditional
small desalination device was improved, the post-processing module and the energy sup-
ply module were omitted, and the data measurement device was added to build an ex-
perimental prototype. The prototype monitors and records the following process varia-
bles: flow of feed water, brine and product water, salt concentration of feed water and
concentrated water, water temperature, and discharge pressure of the feed pump and the
high-pressure pump. The device environment is shown in Figure 7.
Figure 6. The relationship of membrane energy utilization efficiency η with the concentration of feedsolution and feed water pressure.
4. Prototype Experiment of Miniaturized Reverse Osmosis Device
Taking into account the experimental environment and conditions, the traditionalsmall desalination device was improved, the post-processing module and the energysupply module were omitted, and the data measurement device was added to buildan experimental prototype. The prototype monitors and records the following processvariables: flow of feed water, brine and product water, salt concentration of feed water andconcentrated water, water temperature, and discharge pressure of the feed pump and thehigh-pressure pump. The device environment is shown in Figure 7.
Energies 2021, 14, 2275 14 of 20
Figure 7. The specific environment of the experimental prototype.
The experimental prototype can complete the simulation of the entire reverse osmo-
sis seawater desalination process. For data collection in the desalination process, a PLC
(Programmable Logic Controller) is selected as the collection device. The PLC data collec-
tion system monitors the water pressure every 0.1 s to ensure the reliability and stability
of data collection. Water pressure sensors are installed at the outlets of the two pumps,
and both the inlet water flow and the product water flow are measured by flow sensors.
The water pressure and flow sensor signals are sent to the PLC for collection, and the PLC
communicates with the upper computer PC to display and record the measured values in
real time. In addition, the salt concentration in feed water, product water and brine are
measured by a conductivity meter, which can also provide the temperature of the solu-
tion. The system energy consumption is calculated by the stable current measured by the
ammeter.
The laboratory simulation seawater uses sodium chloride solution prepared from
dechlorinated tap water. The TDS of the solution is measured and adjusted by the con-
ductivity meter. For the TDS level of the sodium chloride solution given in the experiment,
the osmotic pressure can be calculated using the following simple equation:
𝜋 = 𝐴 ⋅ 𝑐𝑓 (21)
where A = 7.8 × 10⁻⁵; Equation (21) is based on the results of the multi-electrolyte thermo-
dynamic simulator of 20 °C NaCl solution [28]. That is, when the feed concentration is
10,000 mg/L, the osmotic pressure is approximately 0.78 MPa. Therefore, the maximum
concentration of the experimental feed solution is 10,000 mg/L, so that the osmotic pres-
sure difference does not exceed the maximum pressure that the reverse osmosis mem-
brane can withstand or the maximum pressure that the high-pressure pump can provide.
The conductivity of the feed solution, concentrated water and product water was meas-
ured every 2 min. The feed solution samples were taken from the top and bottom of the
original water bucket to verify the uniformity of the solution. The concentrated water and
product water samples were taken from the system outlet.
4.1. Steady State Condition
First, test the stable conditions of the experimental prototype small reverse osmosis
system, and provide the steady state conditions of the running time collection data system
for subsequent experiments. In order to rule out contingency, three sets of parallel exper-
iments were carried out to monitor the relationship between the system’s water produc-
tion flow and water quality over time. In the first group of experiments, the inlet water
Figure 7. The specific environment of the experimental prototype.
The experimental prototype can complete the simulation of the entire reverse osmosisseawater desalination process. For data collection in the desalination process, a PLC (Pro-grammable Logic Controller) is selected as the collection device. The PLC data collectionsystem monitors the water pressure every 0.1 s to ensure the reliability and stability ofdata collection. Water pressure sensors are installed at the outlets of the two pumps, andboth the inlet water flow and the product water flow are measured by flow sensors. Thewater pressure and flow sensor signals are sent to the PLC for collection, and the PLC

Energies 2021, 14, 2275 13 of 18
communicates with the upper computer PC to display and record the measured valuesin real time. In addition, the salt concentration in feed water, product water and brineare measured by a conductivity meter, which can also provide the temperature of thesolution. The system energy consumption is calculated by the stable current measured bythe ammeter.
The laboratory simulation seawater uses sodium chloride solution prepared fromdechlorinated tap water. The TDS of the solution is measured and adjusted by the conduc-tivity meter. For the TDS level of the sodium chloride solution given in the experiment, theosmotic pressure can be calculated using the following simple equation:
π = A · c f (21)
where A = 7.8 × 10⁻⁵; Equation (21) is based on the results of the multi-electrolyte ther-modynamic simulator of 20 ◦C NaCl solution [28]. That is, when the feed concentration is10,000 mg/L, the osmotic pressure is approximately 0.78 MPa. Therefore, the maximumconcentration of the experimental feed solution is 10,000 mg/L, so that the osmotic pressuredifference does not exceed the maximum pressure that the reverse osmosis membranecan withstand or the maximum pressure that the high-pressure pump can provide. Theconductivity of the feed solution, concentrated water and product water was measuredevery 2 min. The feed solution samples were taken from the top and bottom of the originalwater bucket to verify the uniformity of the solution. The concentrated water and productwater samples were taken from the system outlet.
4.1. Steady State Condition
First, test the stable conditions of the experimental prototype small reverse osmosissystem, and provide the steady state conditions of the running time collection data systemfor subsequent experiments. In order to rule out contingency, three sets of parallel experi-ments were carried out to monitor the relationship between the system’s water productionflow and water quality over time. In the first group of experiments, the inlet water tem-perature was set to 15 ◦C, the feed concentration was 4000 mg/L, the feed flow rate was2 L/min, and the operating pressure was 0.6 MPa. The second group of experiments set theinlet water temperature to 20 ◦C, and other conditions remained unchanged. In the threegroups of experiments, the inlet water temperature was set at 25 ◦C, and other conditionsremained unchanged. The product water flow rate is given by the host computer interface.The test process of feed water, concentrated water and product water TDS is shown inFigures 8 and 9.
Energies 2021, 14, 2275 15 of 20
temperature was set to 15 °C, the feed concentration was 4000 mg/L, the feed flow rate
was 2 L/min, and the operating pressure was 0.6 MPa. The second group of experiments
set the inlet water temperature to 20 °C, and other conditions remained unchanged. In the
three groups of experiments, the inlet water temperature was set at 25 °C, and other con-
ditions remained unchanged. The product water flow rate is given by the host computer
interface. The test process of feed water, concentrated water and product water TDS is
shown in Figures 8 and 9.
Figure 8. Steady-state conditions of product water flow at 15, 20, and 25 °C.
Figure 9. Steady-state conditions of produced water quality at 15, 20, and 25 °C.
4.2. The Influence of Operating Parameters on System Performance
Figures 10–13 show the change trend of the recovery rate, desalination rate and spe-
cific energy consumption of the prototype reverse osmosis system under different oper-
ating parameters. Make the prototype run in a stable state. The standard conditions are
set for water supply pressure of 0.6 MPa, water temperature of 20 °C, water supply salinity
of 4000 mg/L, and water supply flow rate of 2 L/min.
Figure 8. Steady-state conditions of product water flow at 15, 20, and 25 ◦C.

Energies 2021, 14, 2275 14 of 18
Energies 2021, 14, 2275 15 of 20
temperature was set to 15 °C, the feed concentration was 4000 mg/L, the feed flow rate
was 2 L/min, and the operating pressure was 0.6 MPa. The second group of experiments
set the inlet water temperature to 20 °C, and other conditions remained unchanged. In the
three groups of experiments, the inlet water temperature was set at 25 °C, and other con-
ditions remained unchanged. The product water flow rate is given by the host computer
interface. The test process of feed water, concentrated water and product water TDS is
shown in Figures 8 and 9.
Figure 8. Steady-state conditions of product water flow at 15, 20, and 25 °C.
Figure 9. Steady-state conditions of produced water quality at 15, 20, and 25 °C.
4.2. The Influence of Operating Parameters on System Performance
Figures 10–13 show the change trend of the recovery rate, desalination rate and spe-
cific energy consumption of the prototype reverse osmosis system under different oper-
ating parameters. Make the prototype run in a stable state. The standard conditions are
set for water supply pressure of 0.6 MPa, water temperature of 20 °C, water supply salinity
of 4000 mg/L, and water supply flow rate of 2 L/min.
Figure 9. Steady-state conditions of produced water quality at 15, 20, and 25 ◦C.
4.2. The Influence of Operating Parameters on System Performance
Figures 10–13 show the change trend of the recovery rate, desalination rate and specificenergy consumption of the prototype reverse osmosis system under different operatingparameters. Make the prototype run in a stable state. The standard conditions are set forwater supply pressure of 0.6 MPa, water temperature of 20 ◦C, water supply salinity of4000 mg/L, and water supply flow rate of 2 L/min.
Energies 2021, 14, 2275 16 of 20
Figure 10. Variation trend of produced water flow, produced water TDS and specific energy con-
sumption under different feed water pressures.
Figure 11. Variation trends of produced water flow, produced water TDS and specific energy con-
sumption under different feed water temperatures.
Figure 10. Variation trend of produced water flow, produced water TDS and specific energy con-sumption under different feed water pressures.

Energies 2021, 14, 2275 15 of 18
Energies 2021, 14, 2275 16 of 20
Figure 10. Variation trend of produced water flow, produced water TDS and specific energy con-
sumption under different feed water pressures.
Figure 11. Variation trends of produced water flow, produced water TDS and specific energy con-
sumption under different feed water temperatures.
Figure 11. Variation trends of produced water flow, produced water TDS and specific energyconsumption under different feed water temperatures.
Energies 2021, 14, 2275 17 of 20
Figure 12. Variation trend of produced water flow, produced water TDS and specific energy con-
sumption under different feed water salinities.
Figure 13. Variation trends of produced water flow, produced water TDS and specific energy con-
sumption under different feed water flows.
It can be seen from Figure 10 that the recovery rate increases with the increase of feed
water pressure, and is basically linearly related. The desalination rate also increases with
the increase of the feed water pressure, so the conductivity of the product water quality
decreases, that is, the TDS of the product water decreases with the increase of the feed
water pressure. The production water TDS drops the fastest in 0.4–0.6 MPa, and slows
down in 0.6–0.8 MPa, and gradually stabilizes. The specific energy consumption of the
system decreases with the increase of water supply pressure, and is basically linearly re-
lated. Therefore, when the pressure reaches 0.8 MPa, the specific energy consumption of
the system is the smallest, the fresh water output is the highest, the water TDS is the low-
est, and the system performance is the best.
Figure 12. Variation trend of produced water flow, produced water TDS and specific energy con-sumption under different feed water salinities.

Energies 2021, 14, 2275 16 of 18
Energies 2021, 14, 2275 17 of 20
Figure 12. Variation trend of produced water flow, produced water TDS and specific energy con-
sumption under different feed water salinities.
Figure 13. Variation trends of produced water flow, produced water TDS and specific energy con-
sumption under different feed water flows.
It can be seen from Figure 10 that the recovery rate increases with the increase of feed
water pressure, and is basically linearly related. The desalination rate also increases with
the increase of the feed water pressure, so the conductivity of the product water quality
decreases, that is, the TDS of the product water decreases with the increase of the feed
water pressure. The production water TDS drops the fastest in 0.4–0.6 MPa, and slows
down in 0.6–0.8 MPa, and gradually stabilizes. The specific energy consumption of the
system decreases with the increase of water supply pressure, and is basically linearly re-
lated. Therefore, when the pressure reaches 0.8 MPa, the specific energy consumption of
the system is the smallest, the fresh water output is the highest, the water TDS is the low-
est, and the system performance is the best.
Figure 13. Variation trends of produced water flow, produced water TDS and specific energyconsumption under different feed water flows.
It can be seen from Figure 10 that the recovery rate increases with the increase of feedwater pressure, and is basically linearly related. The desalination rate also increases withthe increase of the feed water pressure, so the conductivity of the product water qualitydecreases, that is, the TDS of the product water decreases with the increase of the feedwater pressure. The production water TDS drops the fastest in 0.4–0.6 MPa, and slowsdown in 0.6–0.8 MPa, and gradually stabilizes. The specific energy consumption of thesystem decreases with the increase of water supply pressure, and is basically linearlyrelated. Therefore, when the pressure reaches 0.8 MPa, the specific energy consumptionof the system is the smallest, the fresh water output is the highest, the water TDS is thelowest, and the system performance is the best.
According to Figure 11, the recovery rate increases as the temperature rises, while thedesalination rate decreases as the temperature rises, and the specific energy consumptiondecreases as the temperature rises. In this experiment, although increasing the feed watertemperature will reduce the desalination rate, that is, reduce the quality of fresh water,the actual TDS value of the produced water is below the standard limit value. Therefore,when the water quality meets the requirements, increasing the feed water temperaturecan increase the water flow rate, reduce system energy consumption, and reduce desalina-tion costs.
It can be seen from Figure 12 that the increase in feed water salinity will lead toa substantial decrease in the recovery rate and desalination rate of the system, and asubstantial increase in specific energy consumption. Among them, the production waterTDS increases the most when it is 7000–8500 mg/L, and exceeds the drinking waterstandard, indicating that the water supply pressure is insufficient at this time and cannotproduce sufficient effective driving force. At this time, increasing the water supply pressurecan significantly improve the water quality.
It can be seen from Figure 13 that with the continuous increase of feed water flow, therecovery rate of the system is basically unchanged, the increase in desalination rate is smalland not obvious, and the specific energy consumption increases with the increase of feedwater flow. In the case of low feed water concentration, the positive benefit of increasingfeed water flow is very small, which will only slightly increase the salt rejection rate, butwill increase the energy consumption of the system.

Energies 2021, 14, 2275 17 of 18
5. Conclusions
This paper designs a small reverse osmosis seawater desalination plant and analyzesits energy consumption in detail. Then, related experiments were carried out according tothe built test prototype, and the influence trend of different operating parameters on theperformance of the reverse osmosis system was established.
Through the analysis of the specific energy consumption and energy utilization effi-ciency of the system, the formula for solving the minimum specific energy consumption ofthe reverse osmosis process and the relationship between the recovery rate and the effi-ciency of the high-pressure pump are found, as well as the formula for solving the energyutilization efficiency of the reverse osmosis process and water supply. The relationshipis between pressure and concentration. The target recovery rate of the reverse osmosissystem is 20–30%. The higher the efficiency of the high-pressure pump is, the lower thespecific energy consumption of the system. If the feed solution concentration is too low,it will reduce the energy utilization efficiency of the system. Therefore, seawater with acertain concentration has the value of desalination. In addition, if the feed water pressuremeets the requirements of the system, too high a feed solution concentration will reducethe energy utilization efficiency, but the reduction is small.
By building a test prototype, the influence of different operating parameters on theperformance of a small reverse osmosis system was studied. First, we conducted thesteady-state condition experiment of the reverse osmosis system to determine the time forthe reverse osmosis system to reach the steady state, to facilitate subsequent experimentsto collect valid data. Then we used the controlled variable method to analyze the influenceof feed water pressure, temperature, concentration and flow rate on the production waterflow, production water TDS and specific energy consumption of the system. Throughthe data processing and analysis of the experimental results, the influence trend of eachdynamic parameter change on the operating performance of the reverse osmosis system isbasically consistent with the theoretical calculation above.
Author Contributions: All the authors contributed to this paper. Conceptualization, Z.W.; methodol-ogy, B.Z.; software, T.W.; resources, H.M.; data curation, H.M.; writing—original draft preparation,Z.W.; writing—review and editing, Y.Z. All authors have read and agreed to the published version ofthe manuscript.
Funding: This paper was funded by NNSFC (National Natural Science Foundation of China), grantnumber 51879063.
Data Availability Statement: Not applicable.
Conflicts of Interest: The authors declare no conflict of interest.
Nomenclature
NaCl Sodium chlorideNTU Nephelometric Turbidity UnitSEC Specific Energy ConsumptionSDI Silt Density IndexRO Reverse OsmosisTDS Total Dissolved Solids
References1. Gao, C.K. Simple Talking about Desalination of Seawater. Chem. Technol. Econ. 2003, 21, 24–26. [CrossRef]2. Zioui, D.; Aburideh, H.; Tigrine, Z.; Hout, S.; Abbas, M.; Merzouk, N.K. Experimental study on a reverse osmosis device coupled
with solar energy for water desalination. In Proceedings of the 2017 International Renewable and Sustainable Energy Conference(IRSEC), Tangiers, Morocco, 4–7 December 2017; pp. 1–5.
3. Gao, C.K.; Zhou, Y.; Liu, L.F. Recent Development and Prospect of Seawater Reverse Osmosis Desalination Technology. J. OceanTechnol. 2016, 35, 1–14. [CrossRef]
4. Liu, L.; Cheng, Q. Mass transfer characteristic research on electrodialysis for desalination and regeneration of solution: Acomprehensive review. Renew. Sustain. Energy Rev. 2020, 134, 115. [CrossRef]

Energies 2021, 14, 2275 18 of 18
5. Lu, Y.Y. Research on Optimal Design of Seawater Desalination Process with Reverse Osmosis Membrane. Ph.D. Thesis, OceanUniversity of China, Beijing, China, 2007.
6. Liu, C.; Rainwater, K.; Song, L. Energy analysis and efficiency assessment of reverse osmosis desalination process. Desalination2011, 276, 352–358. [CrossRef]
7. Clarke, D.; Al-Abdeli, Y.; Kothapalli, G. The effects of including intricacies in the modelling of a small-scale solar-PV reverseosmosis desalination system. Desalination 2013, 311, 127–136. [CrossRef]
8. Rathore, N.S.; Kundariya, N.; Sadistap, S.; Narain, A. Mathematical modeling and simulation of concentration polarization layerin reverse osmosis process. In Proceedings of the 2013 Students Conference on Engineering and Systems (SCES), Allahabad,India, 12–14 April 2013; pp. 1–4.
9. Elsayed, M.; Refaey, H.A.; Abdellatif, O.E.; Sakr, R.Y.; Afify, R.I. Experimental investigation on the performance of a small reverseosmosis unit. J. Braz. Soc. Mech. Sci. Eng. 2018, 40, 218. [CrossRef]
10. Karabelas, A.; Koutsou, C.; Kostoglou, M.; Sioutopoulos, D. Analysis of specific energy consumption in reverse osmosisdesalination processes. Desalination 2017, 431, 6. [CrossRef]
11. Zheng, C. Research on Optimal Dispatching of Whole Process of Reverse Osmosis Desalination System. Ph.D. Thesis, HangzhouUniversity of Electronic Science and Technology, Hangzhou, China, 2019.
12. Lacroix, C.; Perier-Muzet, M.; Stitou, D. Dynamic Modeling and Preliminary Performance Analysis of a New Solar ThermalReverse Osmosis. Desalination Process. 2019, 12, 4015. [CrossRef]
13. Altaee, A. Computational model for estimating reverse osmosis system design and performance: Part-one binary feed solution. J.Desalination 2012, 291, 48–50. [CrossRef]
14. Choi, J.-S.; Kim, J.-T. Modeling of full-scale reverse osmosis desalination system: Influence of operational parameters. J. Ind. Eng.Chem. 2014, 21, 33. [CrossRef]
15. Wang, W. Research and Realization of Automatic Control Technology for Marine Reverse Osmosis Seawater Desalination. Ph.D.Thesis, Zhejiang University of Technology, Hangzhou, China, 2016.
16. Koutsou, C.; Kritikos, E.; Karabelas, A.; Kostoglou, M. Analysis of temperature effects on the specific energy consumption inreverse osmosis desalination processes. Desalination 2019, 476, 4213. [CrossRef]
17. Zhang, J.Z. Research on Island Energy Saving Integrated Desalination Device. Master’s Thesis, Zhejiang University of Technology,Hangzhou, China, 2017.
18. Su, H.C.; Wu, S.B.; Xu, J.M. Analysis on design points of box type reverse osmosis desalination unit. Water Treat. Technol. 2019, 45,120–122.
19. Pan, C.Y.; Li, L.; Zhou, Z.J.; Jin, S.P.; Wang, K.N.; Feng, T. Design points of small desalination equipment. Water Purif. Technol.2018, 37, 149–151. [CrossRef]
20. Song, J.; Li, T.; Wright-Contreras, L.; Law, A. A review of the current status of small-scale seawater reverse osmosis desalination.Water Int. 2017, 42, 1–14. [CrossRef]
21. Blue Star Environmental Engineering Co. Ltd. Reverse Osmosis Water Treatment Equipment; General Administration of QualitySupervision, Inspection and Quarantine of the People’ Republic of China: Beijing, China, 2017; p. 12.
22. Hangzhou Water Treatment Technology Research and Development Center Co., Ltd.; Tianjin Institute of Desalination andComprehensive Utilization, State Oceanic Administration. Specification for Design of Reverse Osmosis Seawater Desalination Project;Ministry of Natural Resources of the People’s Republic of China: Beijing, China, 2018; p. 28.
23. Wang, L.M.; Yang, F.; Zhou, S.Y.; Chen, T.Y.; Li, H.Q. Research on post-treatment of seawater desalination reverse osmosismembrane. Water Treat. Technol. 2013, 39, 83–84. [CrossRef]
24. Jiang, Z.Y.; Li, D.; Peng, F.B. Mass transfer theory and model of pervaporation (I) Mass transfer model through membrane. Membr.Sci. Technol. 2003, 23, 37–41. [CrossRef]
25. Bazhin, N.; Parmon, V. Hydro-Osmotic Pressure. DokPC 2019, 484, 1–3. [CrossRef]26. Xu, L.M.; Xia, G.; Bi, F.; van Loosdrecht, M.C.M.; Euverink, G.J.W. Influence of concentration polarization in reverse osmosis
system. Ind. Water Treat. 2004, 24, 63–65. [CrossRef]27. Song, L.; Hu, J.; Ong, S.-L.; Ng, J.; Elimelech, M.; Wilf, M. Emergence of thermodynamic restriction and its implications for
full-scale reverse osmosis processes. Desalination 2003, 155, 213–228. [CrossRef]28. Lyster, E.; Cohen, Y. Numerical study of concentration polarization in a rectangular reverse osmosis membrane channel: Permeate
flux variation and hydrodynamic end effects. J. Membr. Sci. 2007, 303, 140–153. [CrossRef]


![MN67175 ENG 1 - ADFWeb.comVmin Vmax Vmin Vmax 8V 24V 12V 35V Consumption at 24V DC: Device Consumption [W/VA] HD67175-xxx-A1 3.5 HD67175-xxx-B2 3.5 Caution: Not reverse the polarity](https://static.fdocuments.us/doc/165x107/5ea0f7ed5bfc5b663a081192/mn67175-eng-1-vmin-vmax-vmin-vmax-8v-24v-12v-35v-consumption-at-24v-dc-device.jpg)