Analysis of Electricity Consumption for Lighting and Small Power in
15
Advances in Forestry Letters (AFL) Volume 3 Issue 1, March 2014 www.afl-journal.org 1 Bioenergy: A sustainable Energy Option for Rural India Ramachandra T.V. *1 , Ganesh Hegde 2 , Bharath Setturu 3 , Gautham Krishnadas 4 Energy and Wetlands Research Group, Centre for Ecological Sciences, Indian Institute of Science, Bangalore 560012, India, http://ces.iisc.ernet.in/energy Centre for Sustainable Technologies [astra], Indian Institute of Science Centre for Infrastructure, Sustainable Transport and Urban Planning [CiSTUP], Indian Institute of Science, Bangalore 560 012, Karnataka, India *1 [email protected]; 2 [email protected]; 3 [email protected]; 4 [email protected] Abstract Rural population of India depends on bio-energy for cooking, space and water heating. Though most of the energy needs in India is harvested from fossil fuels, 70% of the rural population depends on the bio-energy for their domestic usage in the country. About 70% of the Indian population lives in rural area where 75% of the primary energy need is supplied by bio-energy resources. Also, about 22% of the urban households depend on firewood, 22% on kerosene and 44% on LPG for cooking in India. Bio-energy resources are renewable in nature and combustion would not produce poisonous gases and ash with sufficient oxygen supply. A village level study on the present scenario of domestic energy consumption will help to assess the demand and supply of bio-energy in the country. Uttara Kannada district in Karnataka state, India is chosen for bio- energy assessment which has evergreen as well as moist and dry deciduous forest, where the majority of the people live in rural area or in semi urban area, mostly dependent on forest, agricultural and livestock residues for domestic energy need. Bioresource availability is computed based on the compilation of data on the area and productivity of agriculture and horticulture crops, forests and plantations. Sector-wise energy demand is computed based on the National Sample Survey Organisation (NSSO study) data, primary survey data and from the literature. The ratio of bioresource availability to demand gives the bioresource status. The ratio greater than one indicates bioresource surplus zones, while a ratio less than one indicates scarcity. The supply/demand ratio in the district ranges from less than 0.5 to more than 2. If the ratio is less than 1 (demand more than supply) then that is fuel wood deficit place and where the ratio is more than 1 (supply more than demand) then it is referred to as fuel wood surplus region. In Uttara Kannada, most of the Taluks with ever green forest cover are fuel wood surplus regions where the supply/demand ratio is currently more than 2 (compared to 8-9 in early 1990’s). Dwindling resource base could be attributed to the decline in forest cover in the district. Keywords Total Primary Energy Supply (TPES); Bio-energy; Bioenergy Technologies (BETs); Agricultural and Horticultural Residues; Forest Residues; Sustainable Rural Energy Supply Introduction Energy is the fundamental need of human beings with air, water, shelter and food (energy). In ancient time energy used by human was about 2,500 kJ per day. After the invention of fire and other energy harvesting methods from sun, water and wind, energy usage has been increased to 30,000 kJ per day. At present, energy used by humans is more than 2 lakh kJ every day. As the energy demand has increased, exploitation of resources to produce energy is also increased where the fossil fuels hold the major share in generating energy. In India, more than 68% of the total primary energy supply (TPES) is supplied from non-renewable energy sources (coal, crude oil or natural gas) and around 18% is from hydro resources. Only about 12% of the energy basket is supplied by renewable energy sources which include solar, wind, geothermal, tidal, etc. Though most of the energy need is harvested from fossil fuels, 70% of the rural population depends on the bio energy for their domestic usage in the country. Bio-energy refers to the energy released when organic carbon reacts with oxygen. This energy may be harvested from plants or animals which are also called as biomass. During the process of photosynthesis some energy will be trapped and stored in the form of organic carbon in plants from which energy can be extracted through burning. Biomass is the most processed energy form of carbon and used as primary energy which can substitute the non-renewable energy sources. Bio-energy resources combine fuel wood from forest, biogas, bagasse, agricultural residues, livestock residues, feedstock residues, solid waste etc.
Transcript of Analysis of Electricity Consumption for Lighting and Small Power in
Advances in Forestry Letters (AFL) Volume 3 Issue 1, March 2014 www.afl-journal.org
1
Bioenergy: A sustainable Energy Option for Rural India Ramachandra T.V.*1, Ganesh Hegde2, Bharath Setturu3, Gautham Krishnadas4
Energy and Wetlands Research Group, Centre for Ecological Sciences, Indian Institute of Science, Bangalore 560012, India, http://ces.iisc.ernet.in/energy Centre for Sustainable Technologies [astra], Indian Institute of Science Centre for Infrastructure, Sustainable Transport and Urban Planning [CiSTUP], Indian Institute of Science, Bangalore 560 012, Karnataka, India *[email protected]; [email protected]; [email protected]; [email protected] Abstract
Rural population of India depends on bio-energy for cooking, space and water heating. Though most of the energy needs in India is harvested from fossil fuels, 70% of the rural population depends on the bio-energy for their domestic usage in the country. About 70% of the Indian population lives in rural area where 75% of the primary energy need is supplied by bio-energy resources. Also, about 22% of the urban households depend on firewood, 22% on kerosene and 44% on LPG for cooking in India. Bio-energy resources are renewable in nature and combustion would not produce poisonous gases and ash with sufficient oxygen supply. A village level study on the present scenario of domestic energy consumption will help to assess the demand and supply of bio-energy in the country. Uttara Kannada district in Karnataka state, India is chosen for bio-energy assessment which has evergreen as well as moist and dry deciduous forest, where the majority of the people live in rural area or in semi urban area, mostly dependent on forest, agricultural and livestock residues for domestic energy need.
Bioresource availability is computed based on the compilation of data on the area and productivity of agriculture and horticulture crops, forests and plantations. Sector-wise energy demand is computed based on the National Sample Survey Organisation (NSSO study) data, primary survey data and from the literature. The ratio of bioresource availability to demand gives the bioresource status. The ratio greater than one indicates bioresource surplus zones, while a ratio less than one indicates scarcity.
The supply/demand ratio in the district ranges from less than 0.5 to more than 2. If the ratio is less than 1 (demand more than supply) then that is fuel wood deficit place and where the ratio is more than 1 (supply more than demand) then it is referred to as fuel wood surplus region. In Uttara Kannada, most of the Taluks with ever green forest cover are fuel wood surplus regions where the supply/demand ratio is currently more than 2 (compared to 8-9 in early 1990’s). Dwindling resource base could be attributed to the decline in forest cover in the district.
Keywords
Total Primary Energy Supply (TPES); Bio-energy; Bioenergy Technologies (BETs); Agricultural and Horticultural Residues; Forest Residues; Sustainable Rural Energy Supply
Introduction
Energy is the fundamental need of human beings with air, water, shelter and food (energy). In ancient time energy used by human was about 2,500 kJ per day. After the invention of fire and other energy harvesting methods from sun, water and wind, energy usage has been increased to 30,000 kJ per day. At present, energy used by humans is more than 2 lakh kJ every day. As the energy demand has increased, exploitation of resources to produce energy is also increased where the fossil fuels hold the major share in generating energy. In India, more than 68% of the total primary energy supply (TPES) is supplied from non-renewable energy sources (coal, crude oil or natural gas) and around 18% is from hydro resources. Only about 12% of the energy basket is supplied by renewable energy sources which include solar, wind, geothermal, tidal, etc. Though most of the energy need is harvested from fossil fuels, 70% of the rural population depends on the bio energy for their domestic usage in the country.
Bio-energy refers to the energy released when organic carbon reacts with oxygen. This energy may be harvested from plants or animals which are also called as biomass. During the process of photosynthesis some energy will be trapped and stored in the form of organic carbon in plants from which energy can be extracted through burning. Biomass is the most processed energy form of carbon and used as primary energy which can substitute the non-renewable energy sources. Bio-energy resources combine fuel wood from forest, biogas, bagasse, agricultural residues, livestock residues, feedstock residues, solid waste etc.

www.afl-journal.org Advances in Forestry Letters (AFL) Volume 3 Issue 1, March 2014
2
Bio-energy plays a prominent role in country’s economy and an important component of TPES. Technical analysis of the bio energy technologies (BETs) would help to understand the recent developments and the need for the further research in the respective area. Cost of energy harvesting technology and the energy source is an important factor of consideration for its feasibility to common man. Bio energy is an in-exhaustive source, freely available in most of the situations (or very inexpensive). BETs mainly use the residues (byproducts) of forest, agriculture, horticulture etc. and animal waste which are abundantly available in rural areas. Biomass based power generation system requires less capital cost compared to other technologies since land, infrastructure and technology requirements are less expensive. However, bio energy utilization is techno-economically feasible and contributes significantly to the economic growth of the country. About 70% of the Indian population lives in rural area where 75% of the primary energy need is supplied by bio energy resources. About 70-85% of the rural households depend on firewood, 10% on dung cake and 5% on LPG for cooking where as 22% of the urban households depend on firewood, 22% on kerosene and 44% on LPG for cooking in the country. About 7,40,00,000 households in the country are yet to be electrified and more than 32,000 villages do not have access to electricity. The electric power supply in electrified villages is not reliable with frequent load shedding. About 50% of the rural households depend on kerosene and 48% of the households depend on electricity for lighting. This highlights the role of bio energy in meeting the region’s energy demand and the country’s economy.
Present Bio-energy Status in India
India is the 4th most energy producing country in the world with the population share of 17.5% of the world’s population. As the population increased, the energy requirement also increased over the years which has led to exploitation of resources at a higher rate. Per capita Total Primary Energy Supply (TPES) in India was about 540 kgoe (kilogram oil equivalent) in 2010 and World average was 1803 kgoe. Coal and peat are the major contributors to the TPES with a share of 42.30% followed by crude oil (23.60%) and natural gas (7.20%). Combustible Renewable and waste (CRW) is the 2nd prominent source of TPES with a share of 25%. FIG. I (a) gives the percentage share of energy sources in total primary energy supply in India. Residential sector gets around 78% of the energy from CRW
sources followed by Industries (17.40%). FIG. I(b) gives the sector wise usage of CRW in the country. It clearly shows that major part of the domestic energy consumption is supplied by the combustible renewable or bio energy.
FIG. I(a) SHARE OF ENERGY SOURCES IN TPES
FIG. I(b) SECTOR WISE SHARE OF CRW
TABLE I TRENDS IN DEMAND AND SUPPLY OF PRIMARY ENERGY (Mtoe)
Year Population (Millions)
TPES (Mtoe)
Net Imports (Mtoe)
% Imports
1960-61 439.23 117.2 6.04 5.15 1970-71 547.90 147.05 12.66 8.61 1980-81 685.20 208.3 24.63 11.82 1990-91 843.93 303.15 31.07 10.25 2000-01 1027 432.75 89.03 20.57 2006-07 1130 539.09 131.97 24.48 2007-08 1158 617.52 154.38 25.00 2008-09 1174 656.27 164.07 25.00 2009-10 1190 673.84 168.46 25.00 2010-11 1220 715.00 111.00 15.52
(Source: http://data.worldbank.org/country/india)
Energy demand is in direct relation with population, that is, demand increases with the population. Total primary energy demand in India was 117.2 Mtoe in 1960-61 and around 5.2% of the total demand was imported. Per capita energy demand was 266.82 kgoe in 1961 while the total population was about 43.9 crores. Total primary energy demand increased to twice in 45 years which was 539 Mtoe in 2007. Population in 2007 was 112.9 crores and per capita energy demand was about 477.12 kgoe. About 15.5% of the total energy is imported in the present day

Advances in Forestry Letters (AFL) Volume 3 Issue 1, March 2014 www.afl-journal.org
3
where the total demand has crossed 715 Mtoe. Table I gives the trends in demand and supply of primary energy in India from 1960-61 to 2011-12, which also shows the increase in population for the same duration.
Energy generation in the country depends mostly on fossil fuels which are limited in nature. Since India has fewer fossil fuel resources and these resources should be conserved for the future generation, the country is importing significant amount of petroleum oil, nuclear energy resources, coal, natural gas etc. This trade affects the economic growth of the country and also more and more fossil fuel extraction has adverse effects on sustainable development. Burning of fossil fuels emits enormous amount of carbon dioxide (CO2) and other gases (CO, SO2 or nuclear waste) which are the root cause for all global and ecological problems. However, renewable energy applications have negligible carbon dioxide emission and eco-friendly. About 25% of the primary energy demand is supplied by combustible renewable and wastes in India, where most of the rural population depends on bio energy.
Rural population of India mostly depends on bio energy for cooking, space and water heating. About 75% of the energy demand is supplied by bio energy in rural areas of the country where 70% of the total population live. The bio energy use in the country shows a decreasing trend over the years due to urbanization and rural electrification; nevertheless at present about 25% of the energy demand is met by bio energy. More than 50% of the primary energy demand was supplied by bio energy in 1983 which was about 25% in 2010. Bio energy has a significant share in the TPES, which affects the total energy generation of the country. Since energy independence and the per capita energy consumption are the prominent factors determining country’s development, bio energy also has a significant effect on developmental issues. Other important aspects associated with energy generation are regarding environmental pollution and waste disposal. Bio energy resources are renewable in nature and combustion would not produce poisonous gases and ash with sufficient oxygen supply. However, the CO2 generated during combustion of bio energy is used by plants in the process of photosynthesis. Hence the ecological balance is not disturbed by using bio energy [14]. This process leads to forestation which is the important part of ecological system to maintain the balance and to promote sustainability. Table II gives the share of Combustible Renewable and Waste (CRW) in TPES for the duration from 1983 to 2010 in the country.
TABLE II SHARE OF CRW IN TPES FOR THE DURATION OF 1983-2010
Year Share or CRW in
TPES (%) Year Share or CRW in
TPES (%) 1983 52.3 1997 34.6 1984 50.8 1998 34.2 1985 48.9 1999 32.7 1986 47.6 2000 32.6 1987 46.7 2001 32.5 1988 44.9 2002 32.0 1989 43.4 2003 31.5 1990 42.1 2004 30.2 1991 41.1 2005 29.5 1992 40.0 2006 28.4 1993 39.3 2007 27.3 1994 38.1 2008 26.5 1995 36.4 2009 24.9 1996 35.6 2010 24.6
(Source: The World Bank Data)
Investigations at village levels of domestic energy consumption will help to assess the demand and supply of bio energy in the country. For bio energy assessment Uttara Kannada district in Karnataka state, India is chosen which has evergreen as well as moist and dry deciduous forests. In the district majority of the people live in rural area or in semi urban area, are mostly dependent on forest, agricultural and livestock residues for domestic energy need.
Objectives
The primary objective of the study is to assess the bio energy status in Uttara Kannada district across the agroclimatic zones. This includes:
1. Identifying the bioenergy surplus and deficit places in the district;
2. Techno-economic analysis of bio energy appli-cations; and
3. The role of bio energy in sustainable development.
Materials and Method
Study Area
Uttara Kannada district located between 13° 55´ and 15° 31´ latitudes and 74° 9´ and 75° 10´ longitudes (FIG. II) is the 4th biggest district of the state having population of 14,36,847, with more than 70% of the people live in rural area or in semi urban area. It is located in the central Western Ghats region having rich ecology, flora and fauna. More than 75% of the geographical area is under forests.
The geographical heterogeneity is responsible for the diverse growth of vegetation in the district. Taluks of the district are categorized into 4 different types of
www.afl-journal.org Advances in Forestry Letters (AFL) Volume 3 Issue 1, March 2014
4
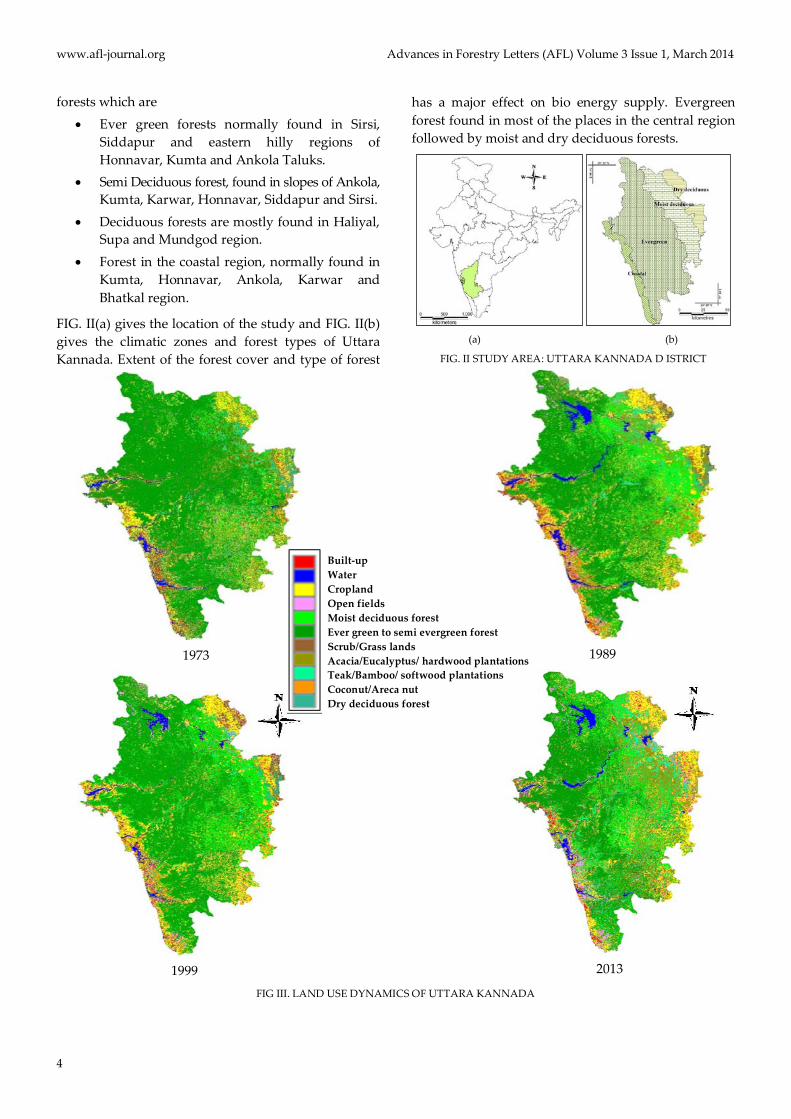
forests which are • Ever green forests normally found in Sirsi,
Siddapur and eastern hilly regions of Honnavar, Kumta and Ankola Taluks.
• Semi Deciduous forest, found in slopes of Ankola, Kumta, Karwar, Honnavar, Siddapur and Sirsi.
• Deciduous forests are mostly found in Haliyal, Supa and Mundgod region.
• Forest in the coastal region, normally found in Kumta, Honnavar, Ankola, Karwar and Bhatkal region.
FIG. II(a) gives the location of the study and FIG. II(b) gives the climatic zones and forest types of Uttara Kannada. Extent of the forest cover and type of forest
has a major effect on bio energy supply. Evergreen forest found in most of the places in the central region followed by moist and dry deciduous forests.
(a) (b)
FIG. II STUDY AREA: UTTARA KANNADA D ISTRICT
FIG III. LAND USE DYNAMICS OF UTTARA KANNADA
Built-up Water Cropland Open fields Moist deciduous forest Ever green to semi evergreen forest Scrub/Grass lands Acacia/Eucalyptus/ hardwood plantations Teak/Bamboo/ softwood plantations Coconut/Areca nut Dry deciduous forest
1973 1989
1999 2013

Advances in Forestry Letters (AFL) Volume 3 Issue 1, March 2014 www.afl-journal.org
5
Method and Data
Bioenergy status assessment is done based on the resource availability and bioenergy requirement in the district. Having the knowledge of current bioenergy usage pattern in different agroclimatic zones, demand for bioenergy is computed. Bioresourse mainly depends on the land use pattern, forest cover and yields of various crops. Using the earlier energy survey data and by spatio temporal land cover dynamics analysis availability of resources and corresponding demands are calculated. All the estimations are done taluk wise and aggregated for each agroclimatic zone.
LULC Dynamics of Uttara Kannada
Forest resources constitute the primary source of energy in the district. The analysis of land use dynamics during 1973 to 2013 shows that about 75.88% of area under evergreen forest (1973) has declined 53% in 2013. Areas under agriculture land and forest plantations have increased from 10.22% and 7.79% to 14.13% and 18.64% respectively. FIG III depicts the land use dynamics during 1979 to 2013 in Uttara Kannada district. It is evident that forest cover decreased and built up area and crop lands have increased over the years.
Results and Discussion
Bioenergy resources from various sources (forests, agriculture, and horticulture) are used for domestic applications (cooking, water heating) in the district. Fuel wood is mainly used for domestic cooking and water heating supplemented by horticultural and agricultural residues, forest biomass and biogas production from livestock. Majority of the fuel requirement for cooking, water and space heating is supplied by agricultural residues, animal residues or by forest in the district. More than 80% of the people are dependent on bio energy for their requirements such as food, fuel wood for traditional stoves, timber for houses and cattle sheds, poles for fencing and shelter construction, leaves to prepare manure and covering to control weed, wood to prepare all housing structures, ropes, herbal medicines and decorative articles. Study gives the village level details of supply and demand trend of bio energy in the district.
Supply and Demand trends of Bio Energy in Uttara Kannada
1) Fuel Wood
Fuel wood is one of the prominent forest by-
products collected (normally by women and children) which is used for cooking and water heating through burning. Major domestic energy need is shared by fuel wood in the rural regions where it is collected from nearby forest. The availability of the fuel wood for the consumers depends on the closeness of the forest, type of the forest and methods of extraction. FIG. IV gives the availability of fuel wood in the districts annually. Since fuel wood is the cheapest primary energy source hence the demand will be high depending upon the availability.
FIG IV AVAILABILITY OF FOREST BIOMASS (FUEL WOOD) IN
TONNES/ANNUM
If the demand for the fuel wood increases then it may lead to deforestation or consumers may switch over to other fuels such as LPG, electricity or kerosene due to the lack of availability. The annual fuel wood availability in the district ranges from less than 1,000 tonnes to 56,000 tonnes. In majority of the villages of Sirsi, Siddapur, Kumta and Honnavar taluks, availability of fuel wood ranges from 1,000 to 5,000 tonnes per annum. In northern villages of Haliyal and Supa taluks annual availability of forest biomass is less than 1,000 tonnes to 5,000 tonnes. Availability of fuel wood is high in the central region of the district due to the evergreen forest cover. In eastern part of Karwar and Ankola and southern part of Supa fuel wood availability is 10,000 to 25,000 tonnes per annum. There are few villages Supa and Yellapur Taluks where the bio-mass availability is 25,000 to 56,000 tonnes in a year.
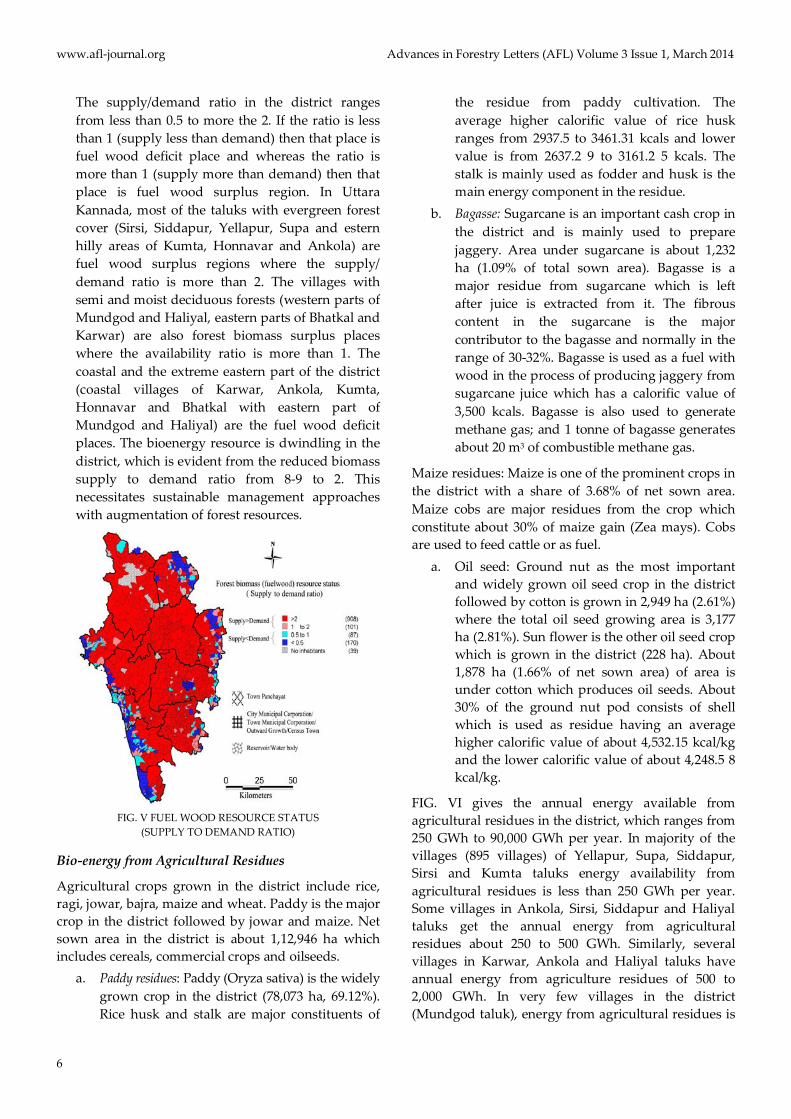
FIG. V gives the supply to demand ratio of available forest biomass (fuel wood) in the district.
www.afl-journal.org Advances in Forestry Letters (AFL) Volume 3 Issue 1, March 2014
6
The supply/demand ratio in the district ranges from less than 0.5 to more the 2. If the ratio is less than 1 (supply less than demand) then that place is fuel wood deficit place and whereas the ratio is more than 1 (supply more than demand) then that place is fuel wood surplus region. In Uttara Kannada, most of the taluks with evergreen forest cover (Sirsi, Siddapur, Yellapur, Supa and estern hilly areas of Kumta, Honnavar and Ankola) are fuel wood surplus regions where the supply/ demand ratio is more than 2. The villages with semi and moist deciduous forests (western parts of Mundgod and Haliyal, eastern parts of Bhatkal and Karwar) are also forest biomass surplus places where the availability ratio is more than 1. The coastal and the extreme eastern part of the district (coastal villages of Karwar, Ankola, Kumta, Honnavar and Bhatkal with eastern part of Mundgod and Haliyal) are the fuel wood deficit places. The bioenergy resource is dwindling in the district, which is evident from the reduced biomass supply to demand ratio from 8-9 to 2. This necessitates sustainable management approaches with augmentation of forest resources.
FIG. V FUEL WOOD RESOURCE STATUS
(SUPPLY TO DEMAND RATIO)
Bio-energy from Agricultural Residues
Agricultural crops grown in the district include rice, ragi, jowar, bajra, maize and wheat. Paddy is the major crop in the district followed by jowar and maize. Net sown area in the district is about 1,12,946 ha which includes cereals, commercial crops and oilseeds.
a. Paddy residues: Paddy (Oryza sativa) is the widely grown crop in the district (78,073 ha, 69.12%). Rice husk and stalk are major constituents of
the residue from paddy cultivation. The average higher calorific value of rice husk ranges from 2937.5 to 3461.31 kcals and lower value is from 2637.2 9 to 3161.2 5 kcals. The stalk is mainly used as fodder and husk is the main energy component in the residue.
b. Bagasse: Sugarcane is an important cash crop in the district and is mainly used to prepare jaggery. Area under sugarcane is about 1,232 ha (1.09% of total sown area). Bagasse is a major residue from sugarcane which is left after juice is extracted from it. The fibrous content in the sugarcane is the major contributor to the bagasse and normally in the range of 30-32%. Bagasse is used as a fuel with wood in the process of producing jaggery from sugarcane juice which has a calorific value of 3,500 kcals. Bagasse is also used to generate methane gas; and 1 tonne of bagasse generates about 20 m3 of combustible methane gas.
Maize residues: Maize is one of the prominent crops in the district with a share of 3.68% of net sown area. Maize cobs are major residues from the crop which constitute about 30% of maize gain (Zea mays). Cobs are used to feed cattle or as fuel.
a. Oil seed: Ground nut as the most important and widely grown oil seed crop in the district followed by cotton is grown in 2,949 ha (2.61%) where the total oil seed growing area is 3,177 ha (2.81%). Sun flower is the other oil seed crop which is grown in the district (228 ha). About 1,878 ha (1.66% of net sown area) of area is under cotton which produces oil seeds. About 30% of the ground nut pod consists of shell which is used as residue having an average higher calorific value of about 4,532.15 kcal/kg and the lower calorific value of about 4,248.5 8 kcal/kg.
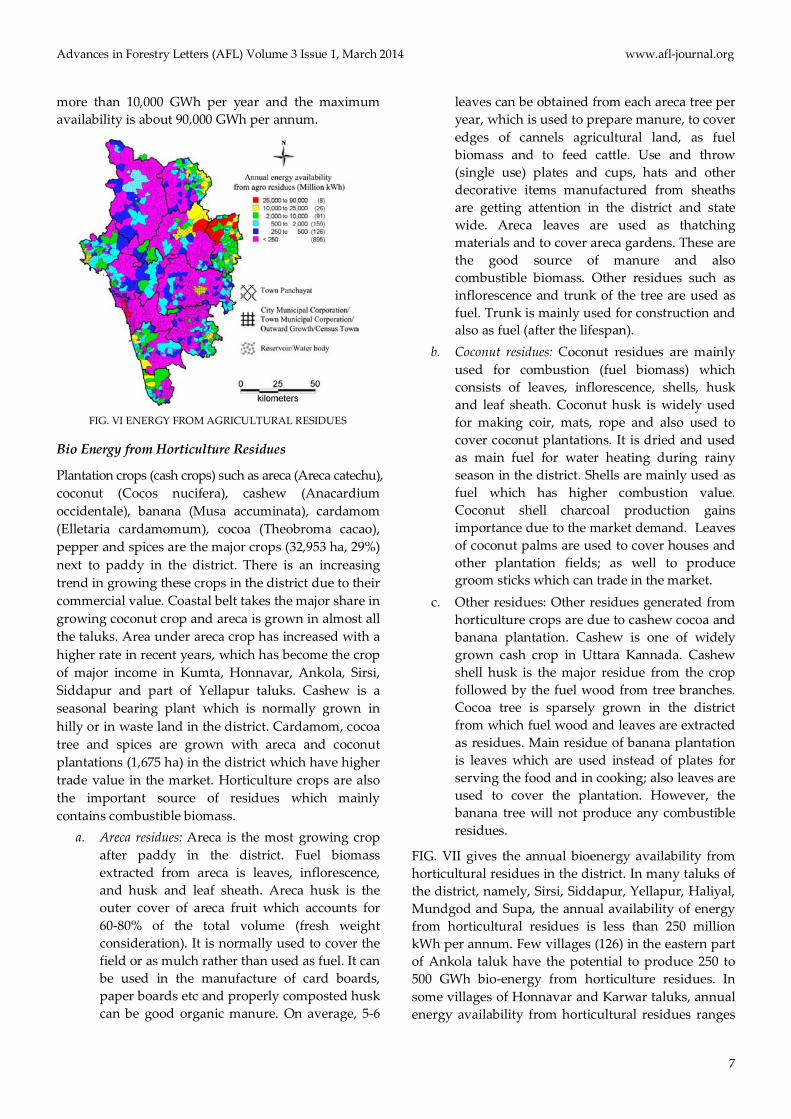
FIG. VI gives the annual energy available from agricultural residues in the district, which ranges from 250 GWh to 90,000 GWh per year. In majority of the villages (895 villages) of Yellapur, Supa, Siddapur, Sirsi and Kumta taluks energy availability from agricultural residues is less than 250 GWh per year. Some villages in Ankola, Sirsi, Siddapur and Haliyal taluks get the annual energy from agricultural residues about 250 to 500 GWh. Similarly, several villages in Karwar, Ankola and Haliyal taluks have annual energy from agriculture residues of 500 to 2,000 GWh. In very few villages in the district (Mundgod taluk), energy from agricultural residues is
Advances in Forestry Letters (AFL) Volume 3 Issue 1, March 2014 www.afl-journal.org
7
more than 10,000 GWh per year and the maximum availability is about 90,000 GWh per annum.
FIG. VI ENERGY FROM AGRICULTURAL RESIDUES
Bio Energy from Horticulture Residues
Plantation crops (cash crops) such as areca (Areca catechu), coconut (Cocos nucifera), cashew (Anacardium occidentale), banana (Musa accuminata), cardamom (Elletaria cardamomum), cocoa (Theobroma cacao), pepper and spices are the major crops (32,953 ha, 29%) next to paddy in the district. There is an increasing trend in growing these crops in the district due to their commercial value. Coastal belt takes the major share in growing coconut crop and areca is grown in almost all the taluks. Area under areca crop has increased with a higher rate in recent years, which has become the crop of major income in Kumta, Honnavar, Ankola, Sirsi, Siddapur and part of Yellapur taluks. Cashew is a seasonal bearing plant which is normally grown in hilly or in waste land in the district. Cardamom, cocoa tree and spices are grown with areca and coconut plantations (1,675 ha) in the district which have higher trade value in the market. Horticulture crops are also the important source of residues which mainly contains combustible biomass.
a. Areca residues: Areca is the most growing crop after paddy in the district. Fuel biomass extracted from areca is leaves, inflorescence, and husk and leaf sheath. Areca husk is the outer cover of areca fruit which accounts for 60-80% of the total volume (fresh weight consideration). It is normally used to cover the field or as mulch rather than used as fuel. It can be used in the manufacture of card boards, paper boards etc and properly composted husk can be good organic manure. On average, 5-6
leaves can be obtained from each areca tree per year, which is used to prepare manure, to cover edges of cannels agricultural land, as fuel biomass and to feed cattle. Use and throw (single use) plates and cups, hats and other decorative items manufactured from sheaths are getting attention in the district and state wide. Areca leaves are used as thatching materials and to cover areca gardens. These are the good source of manure and also combustible biomass. Other residues such as inflorescence and trunk of the tree are used as fuel. Trunk is mainly used for construction and also as fuel (after the lifespan).
b. Coconut residues: Coconut residues are mainly used for combustion (fuel biomass) which consists of leaves, inflorescence, shells, husk and leaf sheath. Coconut husk is widely used for making coir, mats, rope and also used to cover coconut plantations. It is dried and used as main fuel for water heating during rainy season in the district. Shells are mainly used as fuel which has higher combustion value. Coconut shell charcoal production gains importance due to the market demand. Leaves of coconut palms are used to cover houses and other plantation fields; as well to produce groom sticks which can trade in the market.
c. Other residues: Other residues generated from horticulture crops are due to cashew cocoa and banana plantation. Cashew is one of widely grown cash crop in Uttara Kannada. Cashew shell husk is the major residue from the crop followed by the fuel wood from tree branches. Cocoa tree is sparsely grown in the district from which fuel wood and leaves are extracted as residues. Main residue of banana plantation is leaves which are used instead of plates for serving the food and in cooking; also leaves are used to cover the plantation. However, the banana tree will not produce any combustible residues.
FIG. VII gives the annual bioenergy availability from horticultural residues in the district. In many taluks of the district, namely, Sirsi, Siddapur, Yellapur, Haliyal, Mundgod and Supa, the annual availability of energy from horticultural residues is less than 250 million kWh per annum. Few villages (126) in the eastern part of Ankola taluk have the potential to produce 250 to 500 GWh bio-energy from horticulture residues. In some villages of Honnavar and Karwar taluks, annual energy availability from horticultural residues ranges

www.afl-journal.org Advances in Forestry Letters (AFL) Volume 3 Issue 1, March 2014
8
from 500 to 2,000 GWh. Very few villages in the district have availability of energy from horticultural residues more than 10,000 GWh.
FIG. VII ENERGY FROM HORTICULTURAL RESIDUES
FIG. VIII ANNUAL ENERGY AVAILABILITY FROM
AGRICULTURAL AND HORTICULTURAL RESIDUES
FIG. VIII gives the combined annual energy
availability from agriculture and horticulture residues. In majority of the villages, annual energy availability is less than 250 GWh per annum. There are some villages in the district where energy availability ranges from 250 to 500 GWh (155 villages) and 500 to 2,000 GWh (225 villages). In 159 villages of eastern part of Ankola, Mundgod and Haliyal taluks, energy available from horticulture and agricultural residues is in the range of 2,000 to 10,000 GWh. In 9 villages, available bio-energy is more than 10,000 GWh which extends up to 90,000 GWh.
Biogas Resource Status
Livestock is a vital component of agrarian ecosystem provides milk and manure. Other uses of livestock are wool, meat, transportation and for ploughing (or sowing). Animal residues from livestock aid in recharging the essential nutrients of soil. It also boosts the quality of the organic manure which increases the soil fertility.
Farmers in Uttara Kannada are heavily dependent on livestock for their agriculture and horticulture practices. Animal residue is the main feedstock for the production of biogas as well as manure. There are about 3,66,949 cattle, 1,18,669 Buffaloes, 2,702 Sheep, 11,994 Goats in Uttara Kannada. Other members of livestock are Pigs (900), Dogs (93,403) and Rabbits (277) which are in a smaller number. Total livestock population in the district is about 5,94,929 and poultry population is 3,61,351. Dung available from each cattle varies from 3-4 kg to 8-10 kg (from coastal to hilly region). Similarly, average dung produced from a buffalo is 12-15 kg and from a hybrid one is 15-18 kg. By considering 3 kg dung production from a cattle in coastal area and 8 kg in hilly area, total dung production from cattle is about 6,32,058.46 tonnes per year. Similarly, by considering the dung production per buffalo as 12 kg/day, total dung obtained is
TABLE III TALUK WISE DUNG AND BIOGAS PRODUCTION IN UTTARA KANNADA
Taluk Cattle population
Dung Prod./ day (kg)
Dung Prod./yr (tonnes)
Buffalo population
Dung Prod./ day (kg)
Dung Prod./yr (tonnes)
Total biogas production (*1000 m3)
Ankola 28570 85710 31284.15 5967 71604 26135.46 2067.11 Bhatkal 24619 73857 26957.81 6094 73128 26691.72 1931.38 Haliyal 41485 124455 45426.08 20820 249840 91191.60 4918.24
Honnavar 47828 143484 52371.66 8849 106188 38758.62 3280.69 Karwar 11218 33654 12283.71 5460 65520 23914.80 1303.15 Kumta 35891 107673 39300.65 5820 69840 25491.60 2332.52
Mundgod 32122 96366 35173.59 8686 104232 38044.68 2635.86 Siddhapur 43881 351048 128132.52 18897 226764 82768.86 7592.45
Sirsi 52230 417840 152511.60 18845 226140 82541.10 8461.90 Supa 19052 57156 20861.94 8224 98688 36021.12 2047.79
Yellapur 30053 240424 87754.76 11007 132084 48210.66 4894.76 Total 366949 1731667 632058.46 118669 1424028 519770.22 41465.83

Advances in Forestry Letters (AFL) Volume 3 Issue 1, March 2014 www.afl-journal.org
9
5,19,770.22 tonnes per year. Assuming gas production of 0.036 m3 per kg of dung, total biogas generated will be 41,465 thousand m3 per year. National per capita natural gas consumption is about 54 m3 per annum; then the biogas produced from livestock residue could meet the 50% of the gas demand in Uttara Kannada district (100% dung produced is considered to generate biogas). Table III gives the Taluk wise livestock population with annual dung and biogas production in the district.
FIG. IX ANNUAL BIOGAS PRODUCTION FROM LIVESTOCK
RESIDUES IN UTTARA KANNADA
FIG. X: BIOGAS RESOURCE STATUS (SUPPLY
TO DEMAND RATIO)
FIG. IX gives the annual biogas production from livestock residues in Uttara Kannada. It is evident that in majority of the villages in the district, annual biogas energy generated from biogas ranges from 0.1 to 0.5 million kWh. In 340 villages of Mundgod, Haliyal, Karwar and Siddapur taluks biogas energy generation is 0.5 to 1 GWh. Few villages in Bhatkal, Honnavar
and Mundgod taluk have biogas based energy production of 1-12 GWh per annum.
FIG. X gives the availability to demand ratio of biogas resource in the district. In more than 50% of the villages (625 villages) the availability is less than demand, which are called biogas energy deficit regions. In 334 villages of Siddapur, Yellapur and Supa taluks supply to demand ratio is between 1 and 2. There are 275 villages in Ankola, Mundgod and eastern Yellapur taluk, availability is more than twice of biogas demand which are biogas surplus regions. About 40% of the villages have adequate biogas production potential to meet the domestic cooking and heating needs. These villages are to be considered for dissemination of biogas technology in the district.
Techno-Economic Analysis of Bio-energy Technologies (BETs)
The major applications of bio-energy in the country are
i. Domestic use i.e. for cooking, space heating (during winter), water heating (for bathing and livestock) and lighting;
ii. In rural industries (or home industries), for agricultural and horticultural crops processing, bricks and tiles manufacturing;
iii. Biogas production; and iv. Electricity production (stand alone community
level, micro grids and decentralized generation at few locations)
Forest biomass, agricultural and horticultural residues are the main sources of bio-energy applications in the country followed by biogas, since most of the bio-energy based application requires combustion and heat transfer. Normally, the fresh biomass containing about 20-60% of moisture (which cannot be burnt effectively), needs to be dried so that they are suitable for combustion. In Uttara Kannada, solar drying is adopted to remove moisture content in the biomass. However, the energy obtained from biomass depends on the content of the fuel as well as the efficiency of the stoves or combustion method used, analysis of fuel efficient BET would contribute to the improvement of the technologies.
1) Improved Cook Stoves (ICs)
The most commonly used stoves in the rural households are either made from mud or from stones (or both). These traditional stoves (TCs) are constructed by local people and have efficiency of

www.afl-journal.org Advances in Forestry Letters (AFL) Volume 3 Issue 1, March 2014
10
about 10% or less. Moreover, in traditional stoves, oxygen supply is inadequate leading to poor combustion with the release of CO (carbon monoxide), etc. It is estimated that 826 million Indians depend on TCs that burn fuel wood or coal which causes pollution and the maximum temperature obtained is limited to lower values. In order to overcome these barriers, CST (formerly ASTRA) of IISc has designed an Improved Cookstove (ICs) to give maximum heat transfer with improved efficiency (20-35%) which allows the complete combustion of fuel. There are many ICs available in market which give better efficiency than TCs and give complete combustion of fuel without CO gas emission. National Biomass Cookstoves Initiatives (NBCI) launched by MNRE (Ministry of New and Renewable Energy) on 2nd December 2009, has the primary aim to enhance the use of biomass ICs. MNRE perused the standards set by BIS (Bureau of Indian Standards) on solid biomass cookstoves– portable that was brought out by BIS in 1991 to examine the applicability of the standard and test protocols in view of the newer designs of cookstoves. This standard has been revised and draft was forwarded to BIS in November 2011 for further action. The ministry has suggested some standard performance factors for the cook stoves which are given in Table IV. Life span of traditional stoves built in rural areas is limited due to the usage of mud and stones. But ICs are constructed applying scientific technology and which gives longer lifetime. Due to thermal stress, cracks develop in the walls of a mud stove whereas ICs can withstand higher temperature. ICs are recommended due to higher efficiency, durability, high temperature applications and less GHG (Green House Gas) emission over traditional stoves (TCs).
TABLE IV PERFORMANCE PARAMETERS FOR IMPROVED COOK STOVES
Type of biomass
cookstove
Standard performance parameters Thermal
efficiency (%) CO
(g/MJd) Total Particulate Matter
(TPM)(mg/MJd)
Natural draft type >25 ≤ 5 ≤ 350
Forced draft type >35 ≤ 5 ≤ 150
2) Biomass Fueled Steam Generation
Steam is generated through direct combustion of biomass which is a viable energy carrier in many applications. Biomass fired power systems produce both heat as well as electrical energy mainly used in CHP (Combined Heat and Power) plants. These
systems have found application in many industries such as paper and pulp, sugar, steel and plywood industries. In many applications, steam of high pressure and temperature generated from biomass combustion is used to run the turbine which is coupled with alternator. Steam of low pressure and temperature is collected from the outlets of turbine and used for other applications such as heating, drying or primary heating of water. Co-firing of biomass in modern large scale coal power plants is efficient and cost effective. Efficiency of co-fired plants is more (35-45%) compared to the biomass dedicated plants. Using low cost biomass from solid waste, crop residues etc., payback period of the plant is lesser ranging from 3 to 5 years with higher return on investment (ROI)
3) Biogas Technology
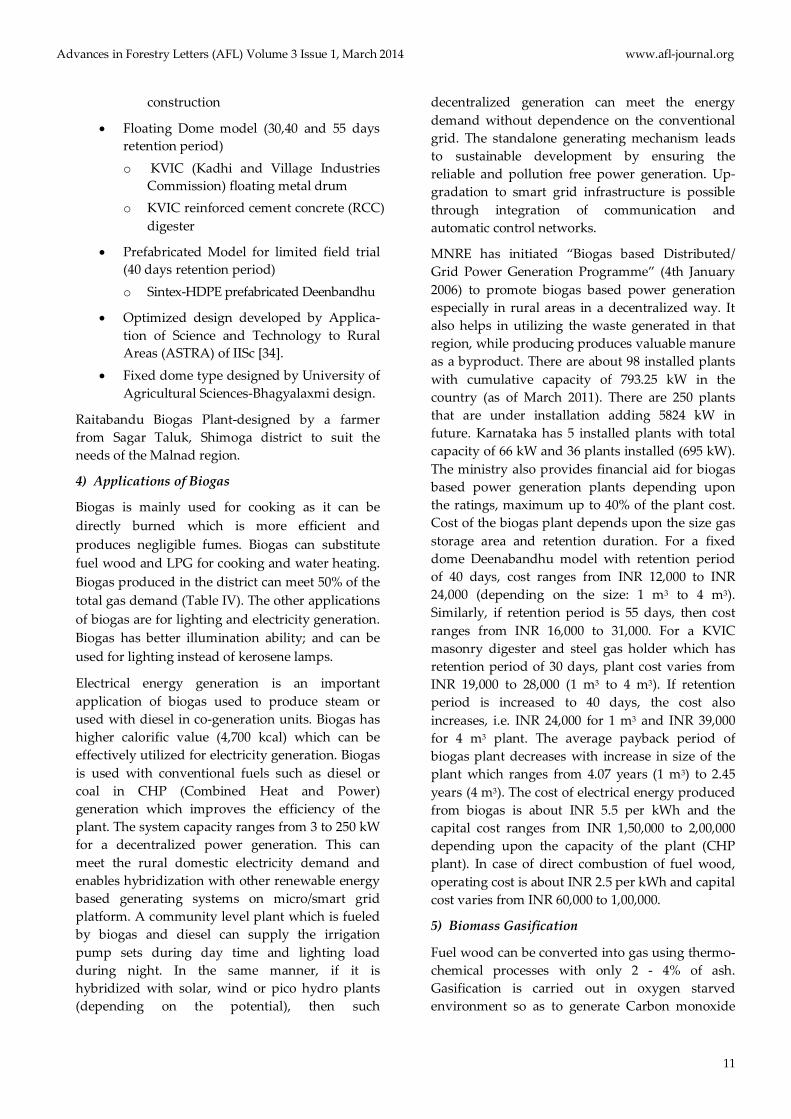
The district has significant livestock population which is the main source of dung production. Cattle dung offers a very high potential of biogas production which can meet the ever increasing domestic cooking fuel demand. The slurry generated in the biogas production is good manure which can be used to prepare compost or directly fed to agricultural or horticultural plantations. Biogas mainly comprises of methane (60-65%) and carbon dioxide (35-40%) having a small fraction Hydrogen sulphide and water vapor. Biogas is about 20% lighter than air which cannot be converted into liquid unlike LPG (Liquefied Petroleum Gas) under normal temperature and pressure (NTP). Biogas generation from dung or agricultural and horticultural residues is dependent on temperature, carbon: nitrogen ratio (C:N), pH and retention period. Temperature is the most prominent factor that affects the biogas generation; generation stops below the temperature of 10°C. The optimum conditions for biogas generation are: temperature 30-35°C, pH 6.8-7.5, carbon: nitrogen ratio (C:N) 20-30, solid contents 7-9%, retention time 20-40 days. The retention period determines the rate of digestion, and the longer the retention time is; the more the gas generated for a given amount of waste is. There are many technologies available for biogas generation depending upon the availability of resources. The most widely used technologies are:
• Fixed Dome model (40 and 55 days retention period) o Deenabandhu brick masonry o Deenabandhu ferro-cement in-situ
Advances in Forestry Letters (AFL) Volume 3 Issue 1, March 2014 www.afl-journal.org
11
construction
• Floating Dome model (30,40 and 55 days retention period) o KVIC (Kadhi and Village Industries
Commission) floating metal drum o KVIC reinforced cement concrete (RCC)
digester
• Prefabricated Model for limited field trial (40 days retention period) o Sintex-HDPE prefabricated Deenbandhu
• Optimized design developed by Applica-tion of Science and Technology to Rural Areas (ASTRA) of IISc [34].
• Fixed dome type designed by University of Agricultural Sciences-Bhagyalaxmi design.
Raitabandu Biogas Plant-designed by a farmer from Sagar Taluk, Shimoga district to suit the needs of the Malnad region.
4) Applications of Biogas
Biogas is mainly used for cooking as it can be directly burned which is more efficient and produces negligible fumes. Biogas can substitute fuel wood and LPG for cooking and water heating. Biogas produced in the district can meet 50% of the total gas demand (Table IV). The other applications of biogas are for lighting and electricity generation. Biogas has better illumination ability; and can be used for lighting instead of kerosene lamps.
Electrical energy generation is an important application of biogas used to produce steam or used with diesel in co-generation units. Biogas has higher calorific value (4,700 kcal) which can be effectively utilized for electricity generation. Biogas is used with conventional fuels such as diesel or coal in CHP (Combined Heat and Power) generation which improves the efficiency of the plant. The system capacity ranges from 3 to 250 kW for a decentralized power generation. This can meet the rural domestic electricity demand and enables hybridization with other renewable energy based generating systems on micro/smart grid platform. A community level plant which is fueled by biogas and diesel can supply the irrigation pump sets during day time and lighting load during night. In the same manner, if it is hybridized with solar, wind or pico hydro plants (depending on the potential), then such
decentralized generation can meet the energy demand without dependence on the conventional grid. The standalone generating mechanism leads to sustainable development by ensuring the reliable and pollution free power generation. Up-gradation to smart grid infrastructure is possible through integration of communication and automatic control networks.
MNRE has initiated “Biogas based Distributed/ Grid Power Generation Programme” (4th January 2006) to promote biogas based power generation especially in rural areas in a decentralized way. It also helps in utilizing the waste generated in that region, while producing produces valuable manure as a byproduct. There are about 98 installed plants with cumulative capacity of 793.25 kW in the country (as of March 2011). There are 250 plants that are under installation adding 5824 kW in future. Karnataka has 5 installed plants with total capacity of 66 kW and 36 plants installed (695 kW). The ministry also provides financial aid for biogas based power generation plants depending upon the ratings, maximum up to 40% of the plant cost. Cost of the biogas plant depends upon the size gas storage area and retention duration. For a fixed dome Deenabandhu model with retention period of 40 days, cost ranges from INR 12,000 to INR 24,000 (depending on the size: 1 m3 to 4 m3). Similarly, if retention period is 55 days, then cost ranges from INR 16,000 to 31,000. For a KVIC masonry digester and steel gas holder which has retention period of 30 days, plant cost varies from INR 19,000 to 28,000 (1 m3 to 4 m3). If retention period is increased to 40 days, the cost also increases, i.e. INR 24,000 for 1 m3 and INR 39,000 for 4 m3 plant. The average payback period of biogas plant decreases with increase in size of the plant which ranges from 4.07 years (1 m3) to 2.45 years (4 m3). The cost of electrical energy produced from biogas is about INR 5.5 per kWh and the capital cost ranges from INR 1,50,000 to 2,00,000 depending upon the capacity of the plant (CHP plant). In case of direct combustion of fuel wood, operating cost is about INR 2.5 per kWh and capital cost varies from INR 60,000 to 1,00,000.
5) Biomass Gasification
Fuel wood can be converted into gas using thermo-chemical processes with only 2 - 4% of ash. Gasification is carried out in oxygen starved environment so as to generate Carbon monoxide
www.afl-journal.org Advances in Forestry Letters (AFL) Volume 3 Issue 1, March 2014
12
and Hydrogen which are combustible. The reactions are carried out at elevated temperature of 500-1,400°C and pressure of 33 bar (480 psi). The main difference between biomass gasification and biogas generation is that wet organic feed stocks such as animal dung and sewage waste are used in biogas production. Mostly fuel wood, forest residues, agricultural and horticultural residues are the main sources for gasification. Air based gasifiers normally produce a gas with high nitrogen content, whose calorific value varies between 4 and 6 MJ/Nm3 (100-1200 kilocalories/ Nm3). Oxygen and steam based gasifiers produce a gas with relatively high calorific value of 10 to 20 MJ/Nm3. Gas generated from biomass is also called as Producer gas which is highly combustible.
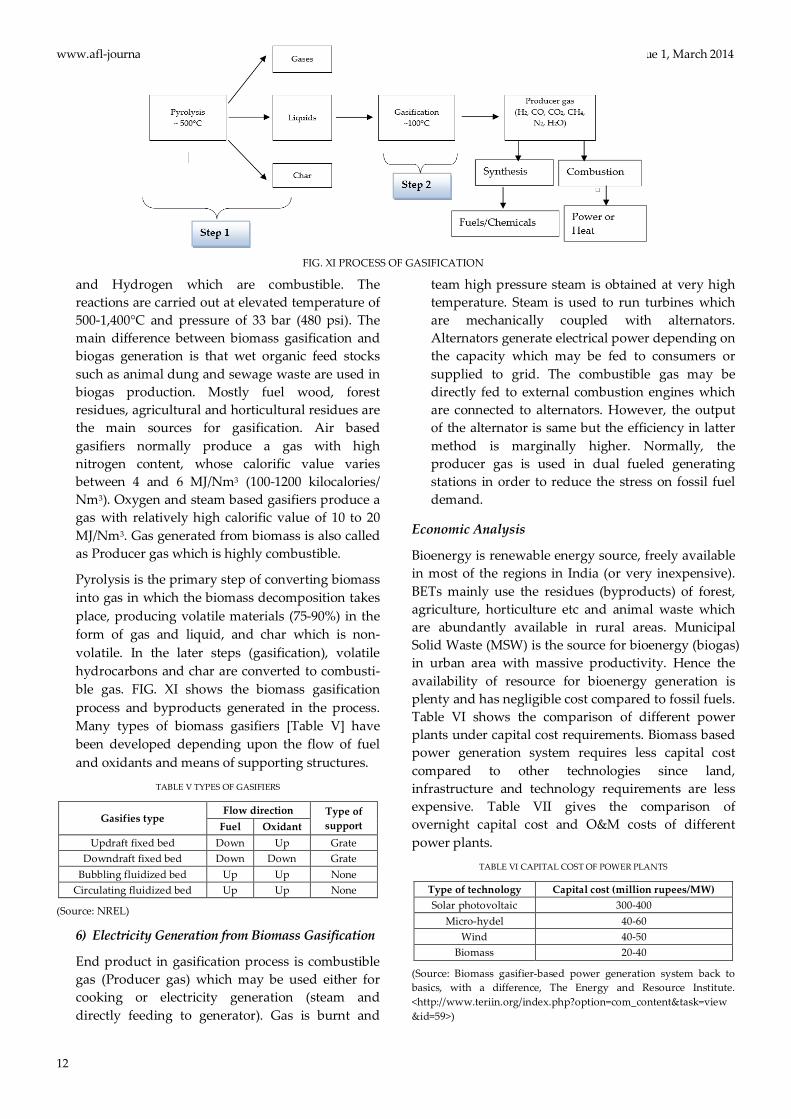
Pyrolysis is the primary step of converting biomass into gas in which the biomass decomposition takes place, producing volatile materials (75-90%) in the form of gas and liquid, and char which is non-volatile. In the later steps (gasification), volatile hydrocarbons and char are converted to combusti-ble gas. FIG. XI shows the biomass gasification process and byproducts generated in the process. Many types of biomass gasifiers [Table V] have been developed depending upon the flow of fuel and oxidants and means of supporting structures.
TABLE V TYPES OF GASIFIERS
Gasifies type Flow direction Type of
support Fuel Oxidant Updraft fixed bed Down Up Grate
Downdraft fixed bed Down Down Grate Bubbling fluidized bed Up Up None
Circulating fluidized bed Up Up None
(Source: NREL)
6) Electricity Generation from Biomass Gasification
End product in gasification process is combustible gas (Producer gas) which may be used either for cooking or electricity generation (steam and directly feeding to generator). Gas is burnt and
team high pressure steam is obtained at very high temperature. Steam is used to run turbines which are mechanically coupled with alternators. Alternators generate electrical power depending on the capacity which may be fed to consumers or supplied to grid. The combustible gas may be directly fed to external combustion engines which are connected to alternators. However, the output of the alternator is same but the efficiency in latter method is marginally higher. Normally, the producer gas is used in dual fueled generating stations in order to reduce the stress on fossil fuel demand.
Economic Analysis
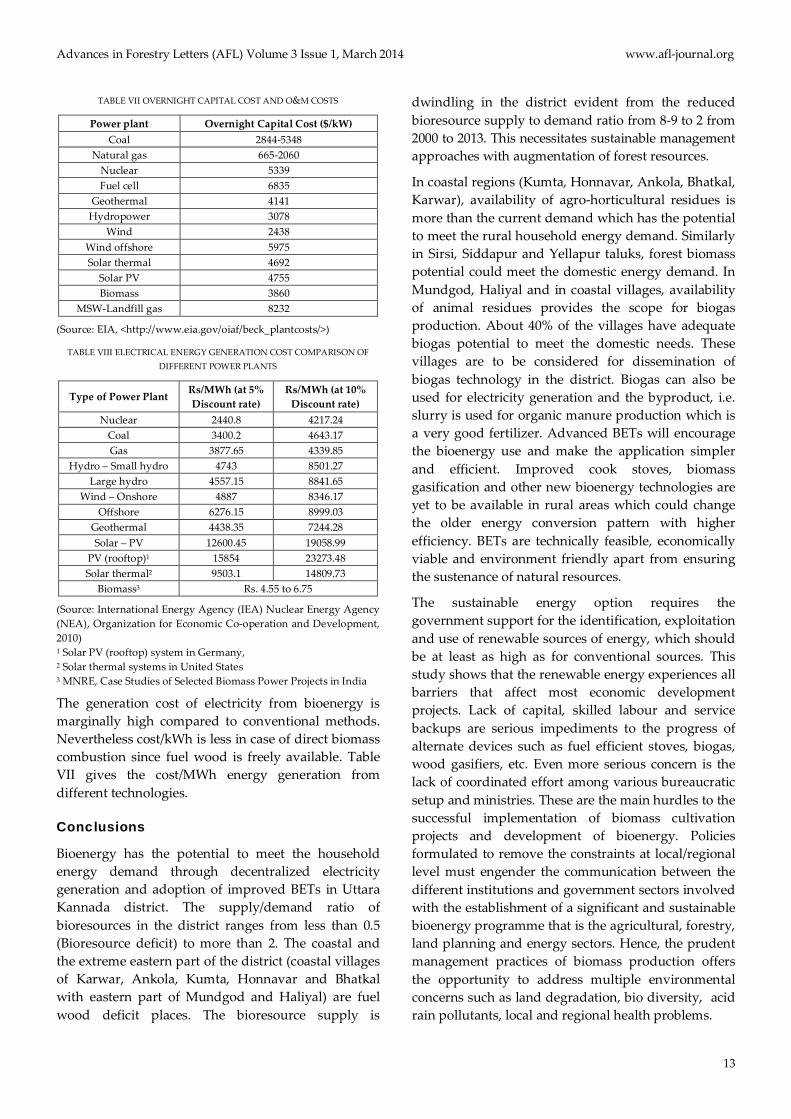
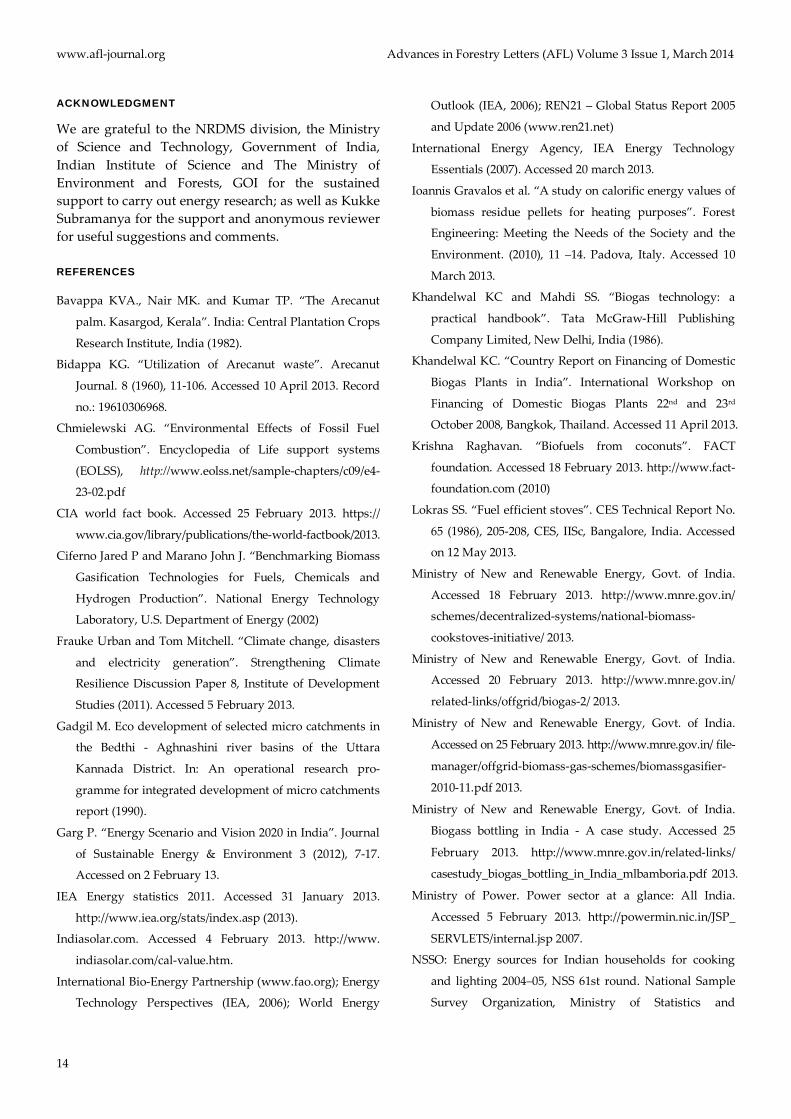
Bioenergy is renewable energy source, freely available in most of the regions in India (or very inexpensive). BETs mainly use the residues (byproducts) of forest, agriculture, horticulture etc and animal waste which are abundantly available in rural areas. Municipal Solid Waste (MSW) is the source for bioenergy (biogas) in urban area with massive productivity. Hence the availability of resource for bioenergy generation is plenty and has negligible cost compared to fossil fuels. Table VI shows the comparison of different power plants under capital cost requirements. Biomass based power generation system requires less capital cost compared to other technologies since land, infrastructure and technology requirements are less expensive. Table VII gives the comparison of overnight capital cost and O&M costs of different power plants.
TABLE VI CAPITAL COST OF POWER PLANTS
Type of technology Capital cost (million rupees/MW) Solar photovoltaic 300-400
Micro-hydel 40-60 Wind 40-50
Biomass 20-40
(Source: Biomass gasifier-based power generation system back to basics, with a difference, The Energy and Resource Institute. <http://www.teriin.org/index.php?option=com_content&task=view&id=59>)
FIG. XI PROCESS OF GASIFICATION
Advances in Forestry Letters (AFL) Volume 3 Issue 1, March 2014 www.afl-journal.org
13
TABLE VII OVERNIGHT CAPITAL COST AND O&M COSTS
Power plant Overnight Capital Cost ($/kW) Coal 2844-5348
Natural gas 665-2060 Nuclear 5339 Fuel cell 6835
Geothermal 4141 Hydropower 3078
Wind 2438 Wind offshore 5975 Solar thermal 4692
Solar PV 4755 Biomass 3860
MSW-Landfill gas 8232
(Source: EIA, <http://www.eia.gov/oiaf/beck_plantcosts/>)
TABLE VIII ELECTRICAL ENERGY GENERATION COST COMPARISON OF DIFFERENT POWER PLANTS
Type of Power Plant Rs/MWh (at 5% Discount rate)
Rs/MWh (at 10% Discount rate)
Nuclear 2440.8 4217.24 Coal 3400.2 4643.17 Gas 3877.65 4339.85
Hydro – Small hydro 4743 8501.27 Large hydro 4557.15 8841.65
Wind – Onshore 4887 8346.17 Offshore 6276.15 8999.03
Geothermal 4438.35 7244.28 Solar – PV 12600.45 19058.99
PV (rooftop)1 15854 23273.48 Solar thermal2 9503.1 14809.73
Biomass3 Rs. 4.55 to 6.75
(Source: International Energy Agency (IEA) Nuclear Energy Agency (NEA), Organization for Economic Co-operation and Development, 2010) 1 Solar PV (rooftop) system in Germany, 2 Solar thermal systems in United States 3 MNRE, Case Studies of Selected Biomass Power Projects in India
The generation cost of electricity from bioenergy is marginally high compared to conventional methods. Nevertheless cost/kWh is less in case of direct biomass combustion since fuel wood is freely available. Table VII gives the cost/MWh energy generation from different technologies.
Conclusions
Bioenergy has the potential to meet the household energy demand through decentralized electricity generation and adoption of improved BETs in Uttara Kannada district. The supply/demand ratio of bioresources in the district ranges from less than 0.5 (Bioresource deficit) to more than 2. The coastal and the extreme eastern part of the district (coastal villages of Karwar, Ankola, Kumta, Honnavar and Bhatkal with eastern part of Mundgod and Haliyal) are fuel wood deficit places. The bioresource supply is
dwindling in the district evident from the reduced bioresource supply to demand ratio from 8-9 to 2 from 2000 to 2013. This necessitates sustainable management approaches with augmentation of forest resources.
In coastal regions (Kumta, Honnavar, Ankola, Bhatkal, Karwar), availability of agro-horticultural residues is more than the current demand which has the potential to meet the rural household energy demand. Similarly in Sirsi, Siddapur and Yellapur taluks, forest biomass potential could meet the domestic energy demand. In Mundgod, Haliyal and in coastal villages, availability of animal residues provides the scope for biogas production. About 40% of the villages have adequate biogas potential to meet the domestic needs. These villages are to be considered for dissemination of biogas technology in the district. Biogas can also be used for electricity generation and the byproduct, i.e. slurry is used for organic manure production which is a very good fertilizer. Advanced BETs will encourage the bioenergy use and make the application simpler and efficient. Improved cook stoves, biomass gasification and other new bioenergy technologies are yet to be available in rural areas which could change the older energy conversion pattern with higher efficiency. BETs are technically feasible, economically viable and environment friendly apart from ensuring the sustenance of natural resources.
The sustainable energy option requires the government support for the identification, exploitation and use of renewable sources of energy, which should be at least as high as for conventional sources. This study shows that the renewable energy experiences all barriers that affect most economic development projects. Lack of capital, skilled labour and service backups are serious impediments to the progress of alternate devices such as fuel efficient stoves, biogas, wood gasifiers, etc. Even more serious concern is the lack of coordinated effort among various bureaucratic setup and ministries. These are the main hurdles to the successful implementation of biomass cultivation projects and development of bioenergy. Policies formulated to remove the constraints at local/regional level must engender the communication between the different institutions and government sectors involved with the establishment of a significant and sustainable bioenergy programme that is the agricultural, forestry, land planning and energy sectors. Hence, the prudent management practices of biomass production offers the opportunity to address multiple environmental concerns such as land degradation, bio diversity, acid rain pollutants, local and regional health problems.
www.afl-journal.org Advances in Forestry Letters (AFL) Volume 3 Issue 1, March 2014
14
ACKNOWLEDGMENT
We are grateful to the NRDMS division, the Ministry of Science and Technology, Government of India, Indian Institute of Science and The Ministry of Environment and Forests, GOI for the sustained support to carry out energy research; as well as Kukke Subramanya for the support and anonymous reviewer for useful suggestions and comments.
REFERENCES
Bavappa KVA., Nair MK. and Kumar TP. “The Arecanut
palm. Kasargod, Kerala”. India: Central Plantation Crops
Research Institute, India (1982).
Bidappa KG. “Utilization of Arecanut waste”. Arecanut
Journal. 8 (1960), 11-106. Accessed 10 April 2013. Record
no.: 19610306968.
Chmielewski AG. “Environmental Effects of Fossil Fuel
Combustion”. Encyclopedia of Life support systems
(EOLSS), http://www.eolss.net/sample-chapters/c09/e4-
23-02.pdf
CIA world fact book. Accessed 25 February 2013. https://
www.cia.gov/library/publications/the-world-factbook/2013.
Ciferno Jared P and Marano John J. “Benchmarking Biomass
Gasification Technologies for Fuels, Chemicals and
Hydrogen Production”. National Energy Technology
Laboratory, U.S. Department of Energy (2002)
Frauke Urban and Tom Mitchell. “Climate change, disasters
and electricity generation”. Strengthening Climate
Resilience Discussion Paper 8, Institute of Development
Studies (2011). Accessed 5 February 2013.
Gadgil M. Eco development of selected micro catchments in
the Bedthi - Aghnashini river basins of the Uttara
Kannada District. In: An operational research pro-
gramme for integrated development of micro catchments
report (1990).
Garg P. “Energy Scenario and Vision 2020 in India”. Journal
of Sustainable Energy & Environment 3 (2012), 7-17.
Accessed on 2 February 13.
IEA Energy statistics 2011. Accessed 31 January 2013.
http://www.iea.org/stats/index.asp (2013).
Indiasolar.com. Accessed 4 February 2013. http://www.
indiasolar.com/cal-value.htm.
International Bio-Energy Partnership (www.fao.org); Energy
Technology Perspectives (IEA, 2006); World Energy
Outlook (IEA, 2006); REN21 – Global Status Report 2005
and Update 2006 (www.ren21.net)
International Energy Agency, IEA Energy Technology
Essentials (2007). Accessed 20 march 2013.
Ioannis Gravalos et al. “A study on calorific energy values of
biomass residue pellets for heating purposes”. Forest
Engineering: Meeting the Needs of the Society and the
Environment. (2010), 11 –14. Padova, Italy. Accessed 10
March 2013.
Khandelwal KC and Mahdi SS. “Biogas technology: a
practical handbook”. Tata McGraw-Hill Publishing
Company Limited, New Delhi, India (1986).
Khandelwal KC. “Country Report on Financing of Domestic
Biogas Plants in India”. International Workshop on
Financing of Domestic Biogas Plants 22nd and 23rd
October 2008, Bangkok, Thailand. Accessed 11 April 2013.
Krishna Raghavan. “Biofuels from coconuts”. FACT
foundation. Accessed 18 February 2013. http://www.fact-
foundation.com (2010)
Lokras SS. “Fuel efficient stoves”. CES Technical Report No.
65 (1986), 205-208, CES, IISc, Bangalore, India. Accessed
on 12 May 2013.
Ministry of New and Renewable Energy, Govt. of India.
Accessed 18 February 2013. http://www.mnre.gov.in/
schemes/decentralized-systems/national-biomass-
cookstoves-initiative/ 2013.
Ministry of New and Renewable Energy, Govt. of India.
Accessed 20 February 2013. http://www.mnre.gov.in/
related-links/offgrid/biogas-2/ 2013.
Ministry of New and Renewable Energy, Govt. of India.
Accessed on 25 February 2013. http://www.mnre.gov.in/ file-
manager/offgrid-biomass-gas-schemes/biomassgasifier-
2010-11.pdf 2013.
Ministry of New and Renewable Energy, Govt. of India.
Biogass bottling in India - A case study. Accessed 25
February 2013. http://www.mnre.gov.in/related-links/
casestudy_biogas_bottling_in_India_mlbamboria.pdf 2013.
Ministry of Power. Power sector at a glance: All India.
Accessed 5 February 2013. http://powermin.nic.in/JSP_
SERVLETS/internal.jsp 2007.
NSSO: Energy sources for Indian households for cooking
and lighting 2004–05, NSS 61st round. National Sample
Survey Organization, Ministry of Statistics and
Advances in Forestry Letters (AFL) Volume 3 Issue 1, March 2014 www.afl-journal.org
15
Programme Implementation, Government of India, (2007)
Patra SK and Datta PP. “Insights into Biomass Gasification
Technology”. Technical Digest. 6 (2006). Accessed 2 April
2013.
Perry JH and Chilton CH. “Chemical Engineers’ Handbook”.
McGraw-Hill Kogakusha Limited, Tokyo, Japan (1973).
Prasad SB. “Biomass- fired steam power cogeneration
system: a theoretical study”, Energy Conversion and
Management 36 (1995), 65-77. Accessed 4 May 2013. doi: 0196-8904(94)00030-1
Raghavarao KSMS, Raghavendra SN and Rastogi NK.
“Potential of coconut dietary fiber”. Department of Food
Engineering, Central Food Technological Research
Institute, Mysore, India, (2008)
Ramachandra TV and Kamakshi G. “Bio resource Potential
of Karnataka [Taluk wise Inventory with Management
Options]”. CES Technical Report No.: 109, Indian
Institute of Science, Bangalore, India (2005).
Ramachandra TV, Joshi NV and Subramanian DK. “Present
and prospective role of bioenergy in regional energy
system”. Renewable and Sustainable Energy Reviews. 4
(2000), 375-430. Accessed 3 March 2013. doi: 10.1016/
S1364-0321(00)00002-2
Ramachandra TV, Rishabh Jain and Gautham Krishnadas.
“Hotspots of solar potential in India”. Renewable and
Sustainable Energy Reviews 15 (2011), 3178–3186.
Accessed 8 January 2013. doi: 10.1016/j.rser.2011.04.007
Ramachandra TV. “Energy Alternatives: Renewable energy
and energy conservation technologies”. Center for
Ecological Sciences, IISc Bangalore http://wgbis.ces.iisc.
ernet.in/energy/paper/alternative/energyalternative.html
2013. Accessed on 22 May 2013.
Ramachandra TV., Vamsee Krishna S. and Shruthi BV.
“Decision Support System for Regional Domestic Energy
Planning”. Journal of Scientific & Industrial Research 64
(2005), 163-174. Accessed 5 January 2013. doi: 10.1081/
GE-200038704
Ravindranath NH and Ramachandra TV. “Renewable
energy options for decentralized electricity generation”.
Ecology 11 (1996), 23-32. Accessed on 20 April 2013.
Subramanian DK. “Energy utilization in Karnataka. In: CJ
Saldanha ed.”. State of environment report Karnataka,
Karnataka, India (1984).
TERI: Bio energy in India, Prepared for International
Institute for Environment and Development (IIED), The
Energy Research Institute, New Delhi, India (2010).
The World Bank Data. Accessed 1 February 2013. http://
data.worldbank.org/indicator/EG.IMP.CONS.ZS/countri
es 2013.
The World Bank Data. Accessed 1 February 2013. http://
data.worldbank.org/indicator/EG.USE.COMM.KT.OE/co
untries 2013.
Uttara Kannada official website. Accessed 1 February 2013.
http://uttarakannada.nic.in/districtprofile.htm.
Vinoth Kumar K and Kasturi Bai R. “Plastic biodigesters – a
systematic study”. Energy for Sustainable Development
9 (2005), 40-49. Accessed 17 January 2013.
Worldwatch Institute, Washington, DC 20036 (202) 745-8092.
Accessed 1 March 2013. http://www.worldwatch.org/
node/6328 2013. Dr. Ramachandra T. V. has Ph.D. in energy and environment from Indian Institute of Science. At present, Coordinator of Energy and Wetlands Research Group (EWRG), Convener of Environmental Information System (ENVIS) at Centre for Ecological Sciences (CES), Indian Institute of Science (IISc). He has made significant contribution in the area of energy and environment. His research area includes wetlands, conservation, restoration and management of ecosystems, environmental manage-ment, GIS, remote sensing, regional planning and decision support systems. He teaches principles of remote sensing, digital image processing and Natural resources manage-ment. He has published over 207 research papers in reputed peer reviewed international and national journals, 38 book chapters, 178 papers in the international and national symposiums as well as 15 books. He is a fellow of Institution of Engineers (India), IEE (UK), Senior member, IEEE (USA) and many similar institutions. Details of his research and copies of publications are available at http://ces.iisc.ernet.in/ energy/
Ganesh Hegde doing Masters in Power and Energy Systems. His areas of interest are renewable energy, micro and smart grids, energy conservation, etc..
Bharath Setturu with masters in computer application currently persuing Ph.D. His area of interest are spatial analysis, landscape dynamics, spatial patterns analysis, modelling and simulation.
Gautham Krishnadas doing Masters in renewable energy. His areas of interest are renewable energy, energy conservation, etc.