Desert Locust Management (ICE2012, Daegu, Korea)
40
Desert Locust (harmless)
Transcript of Desert Locust Management (ICE2012, Daegu, Korea)
Desert Locust (harmless)

Desert Locust (dangerous)

Tracking locusts
FAO’s early warning system
Keith Cressman Senior Locust Forecasting Officer Rome

the problem
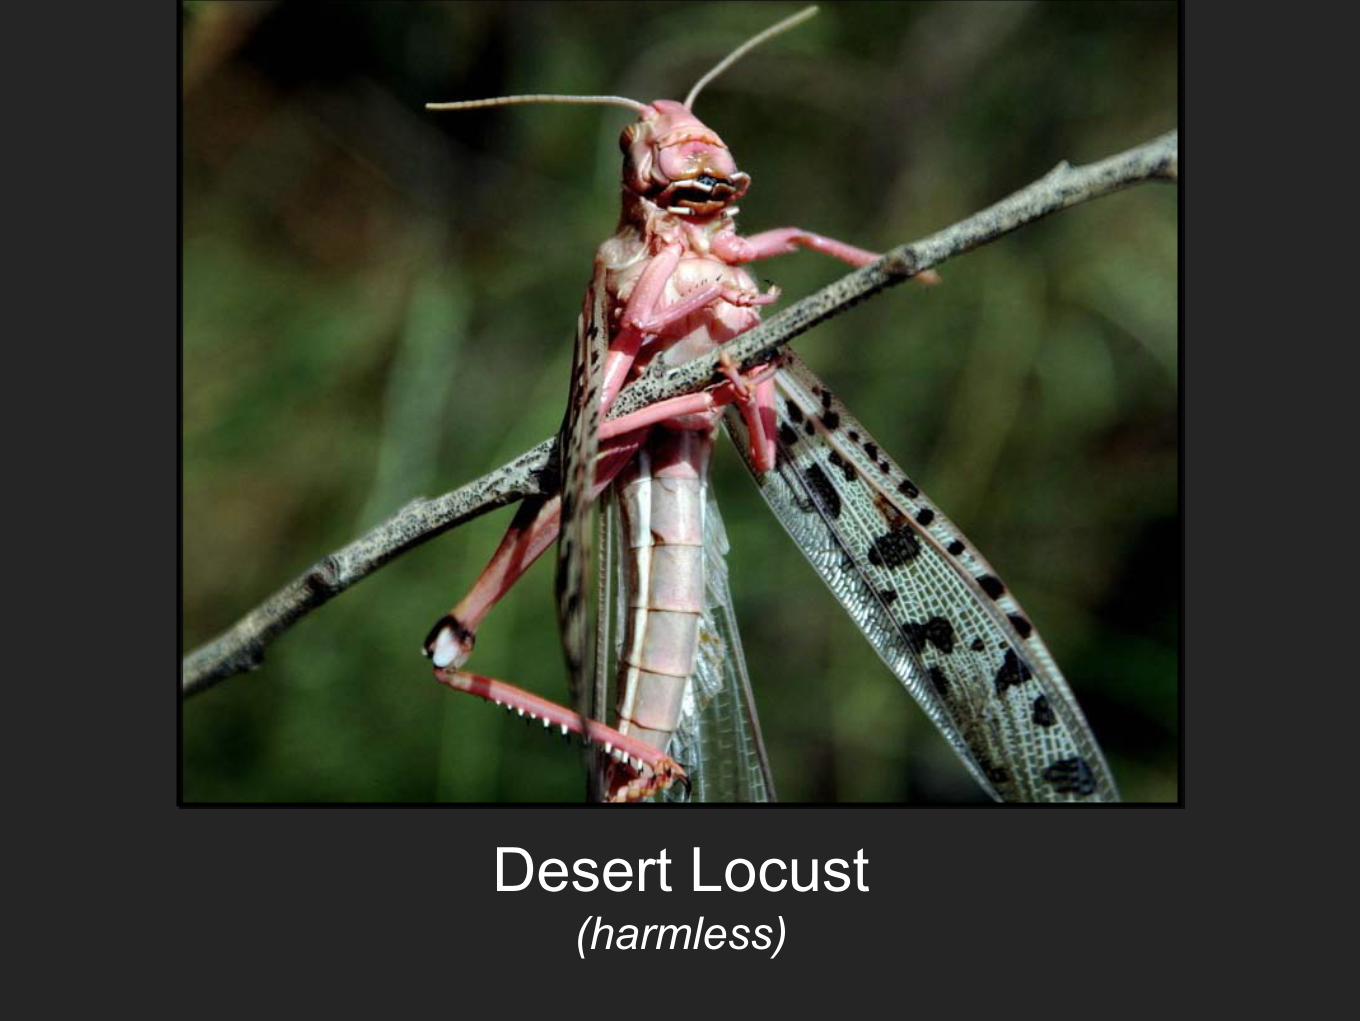
locusts are usually present somewhere within
16 million km2
Recession - calm period
( 1.6 billion ha )
25 countries

locusts invade up to 20% of Earth’s land mass
32 million km2
Plague
50 countries

Desert Locusts live 3 - 6 months
egg
hopper (bands)
adult (swarms) 1
2
3
10 days
40 days
25 days

plagues evolve �WKH\�GR�QRW�RFFXU�RYHUQLJKW
decline
recession
outbreak
upsurge
plague
good rains
control fails good rains
rains fail good control
control fails good rains

as hoppers increase they change their behaviour
GREGARIZATION
band group individual

as adults increase they change their behaviour
GREGARIZATION
swarm group individual

irregular recessions and plagues (1860 - 2011)
countries

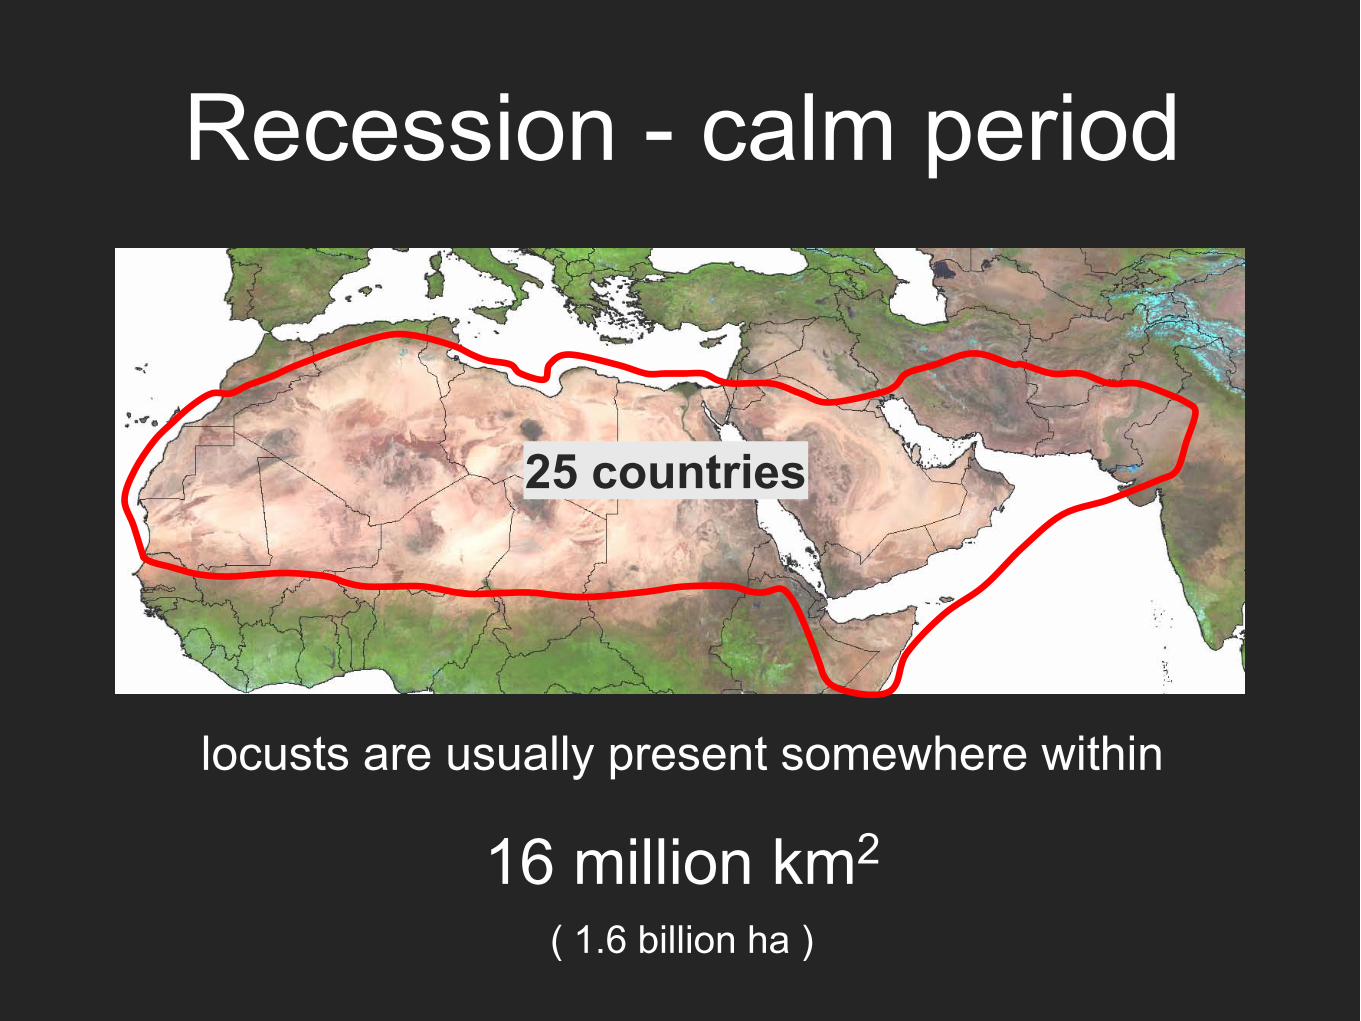
2003 – 2005 the worst situation in 15 years
it took $500 million & Mother Nature to stop this

southern Mauritania invasion (early summer 2004)

northern Senegal invasion (early summer 2004)

Morocco invasion (October 2004)
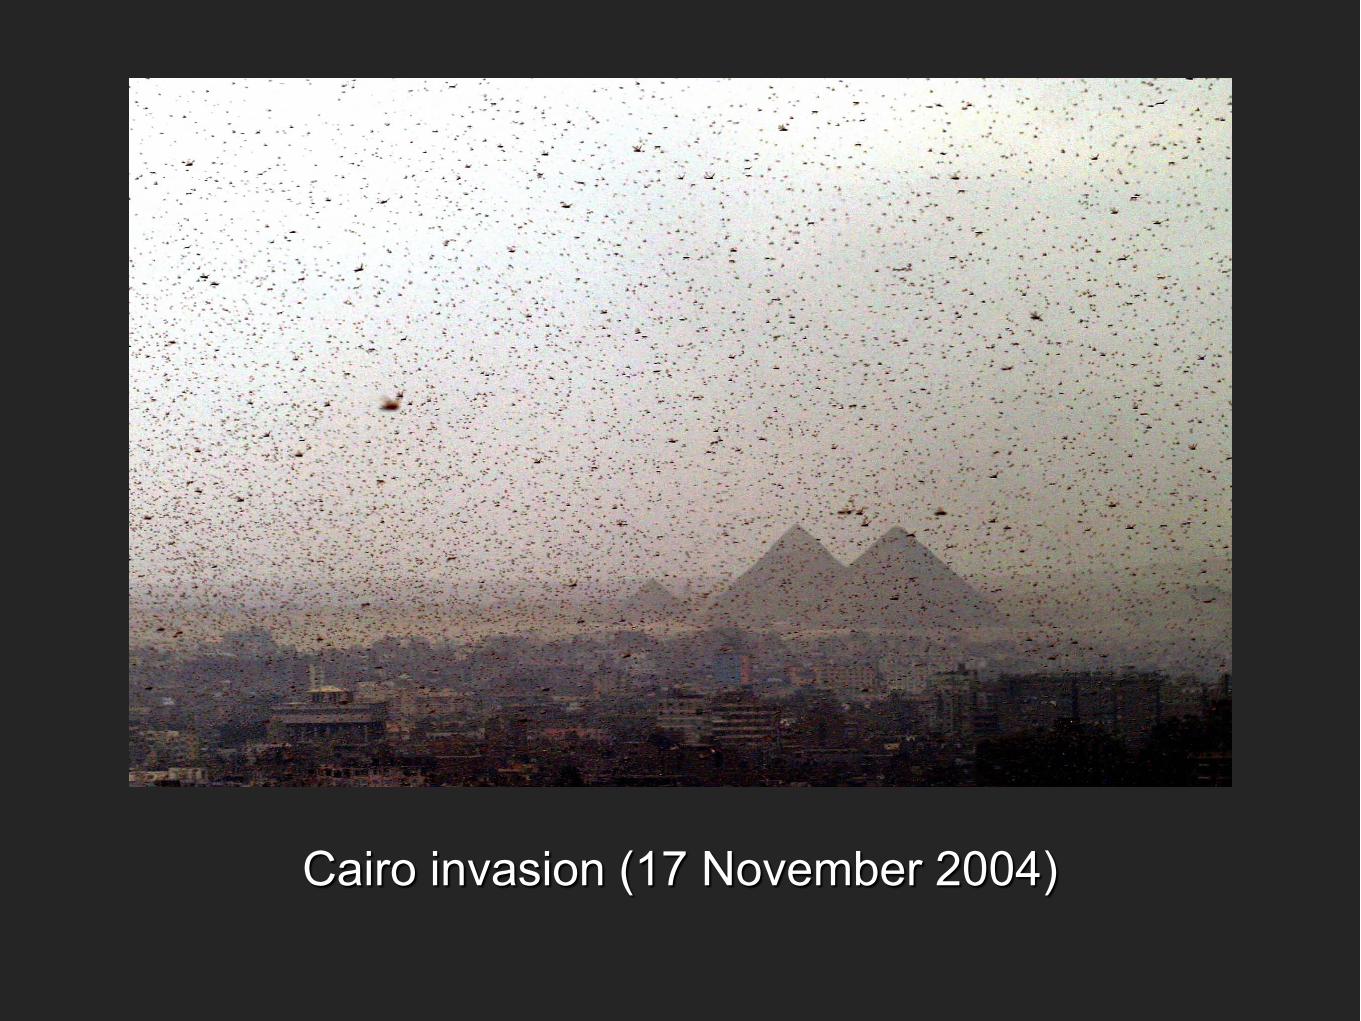
Cairo invasion (17 November 2004)

the economics

35,000
20
6 a 1 km2 Desert Locust swarm eats the same food in 1 day as ...
1,100 =

New York City
Paris
Sydney
38 million/day FRANCE/2 DAYS
42 million/day USA/1 WEEK
422 million/day AUSTRALIA/1.5 HOURS

Control ops in 23 countries October 2003 - November 2005
ha
13 million hectares

2004 2005
FAO appeal
FAO TCP
US$ million
9
50
7 months
4 months
funds received
$74.8m
Emergency funding delay
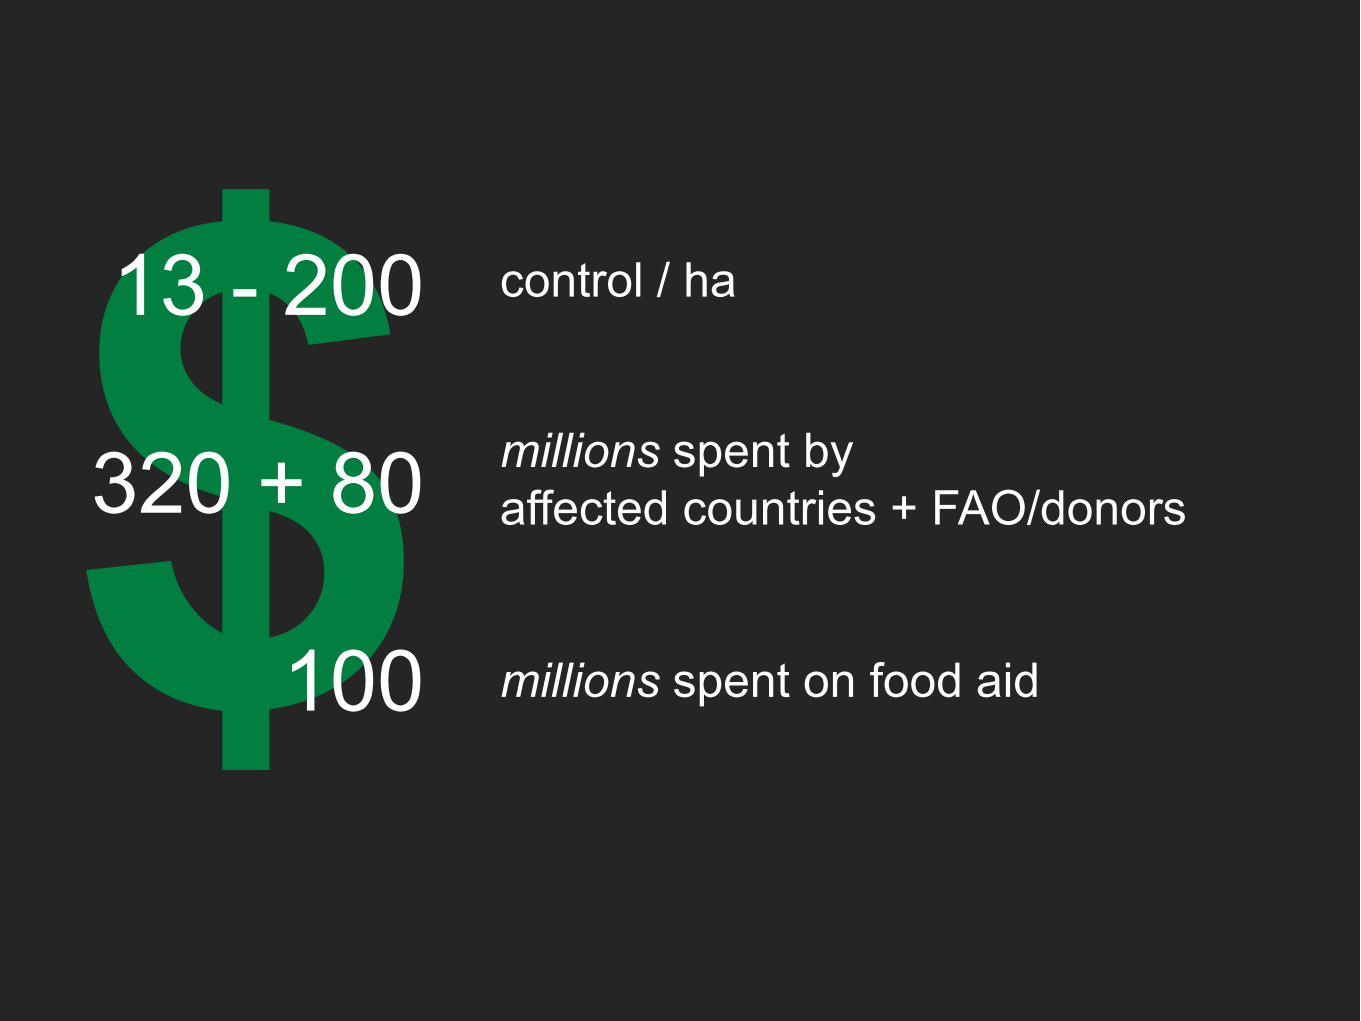
13 - 200
320 + 80
100
control / ha
millions spent by affected countries + FAO/donors millions spent on food aid

8.4 million people affected in West Africa
80-100 % cereal loss
85-90 % legume loss
33-85 % pasture loss

Debt household heads became indebted
60 % mauritania
45 % mali
33 % burkina faso

$90 million food aid in West Africa, 2004
90 % burkina faso
75 % mali
65 % mauritania
households receiving aid
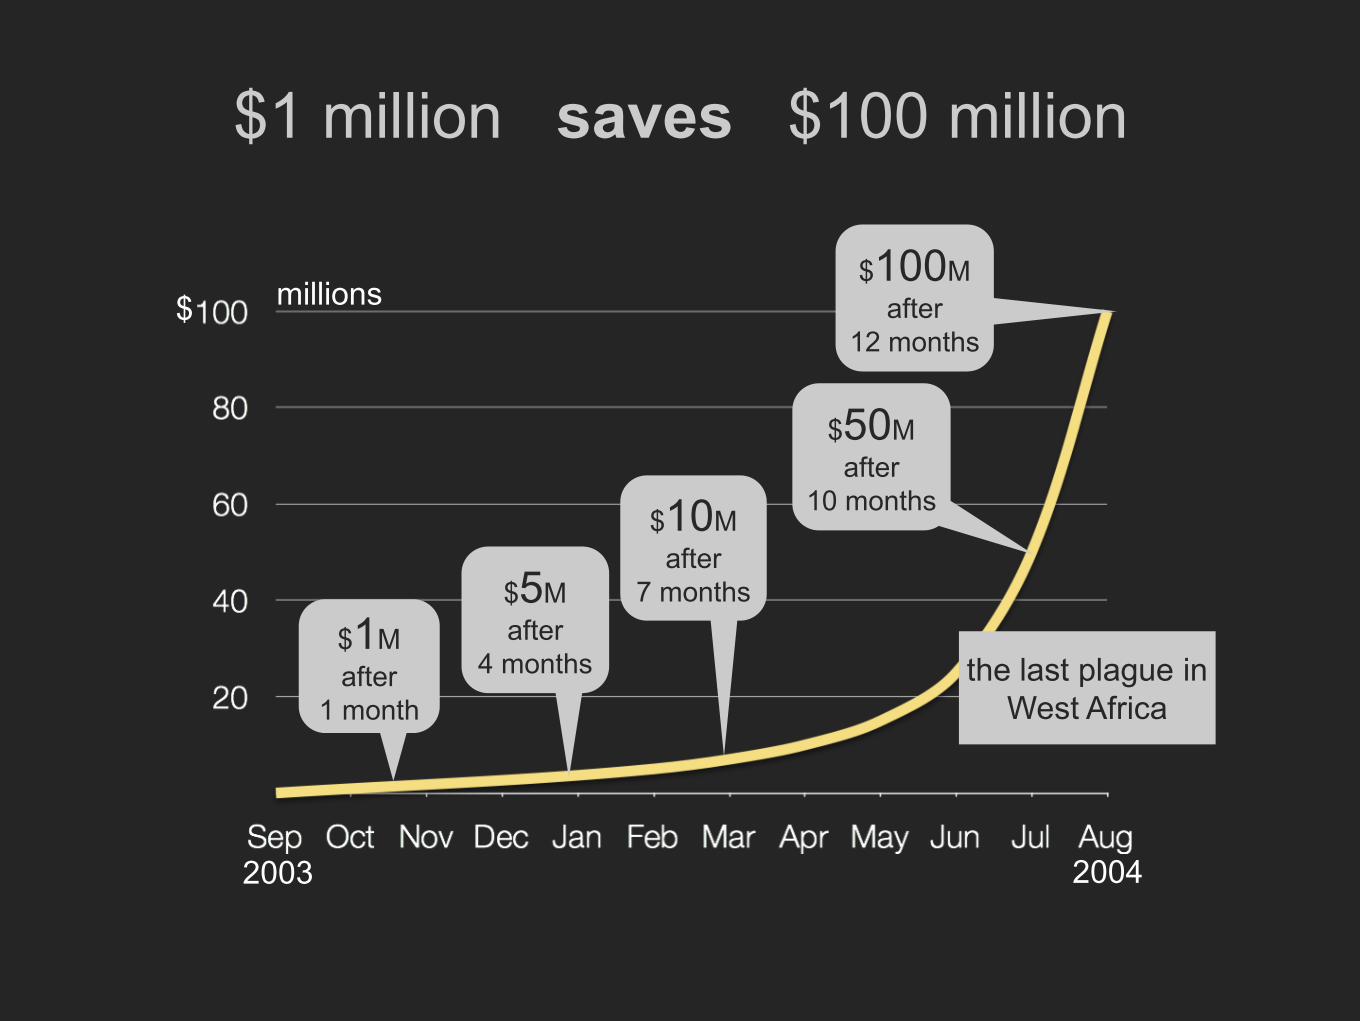
$1 million saves $100 million
millions $
$1M after
1 month
$5M after
4 months
$10M after
7 months
$50M after
10 months
$100M after
12 months
2003 2004
the last plague in West Africa

years of preventive control 170
$ 570 MILLION control operations (2003-2005)
$ 3.3 MILLION annual cost preventive control W & NW Africa

the solution

Desert Locust early warning system
National field teams
National Locust Control Centre
FAO Desert Locust Information Service

FAO Locust early warning network
front-line secondary invasion
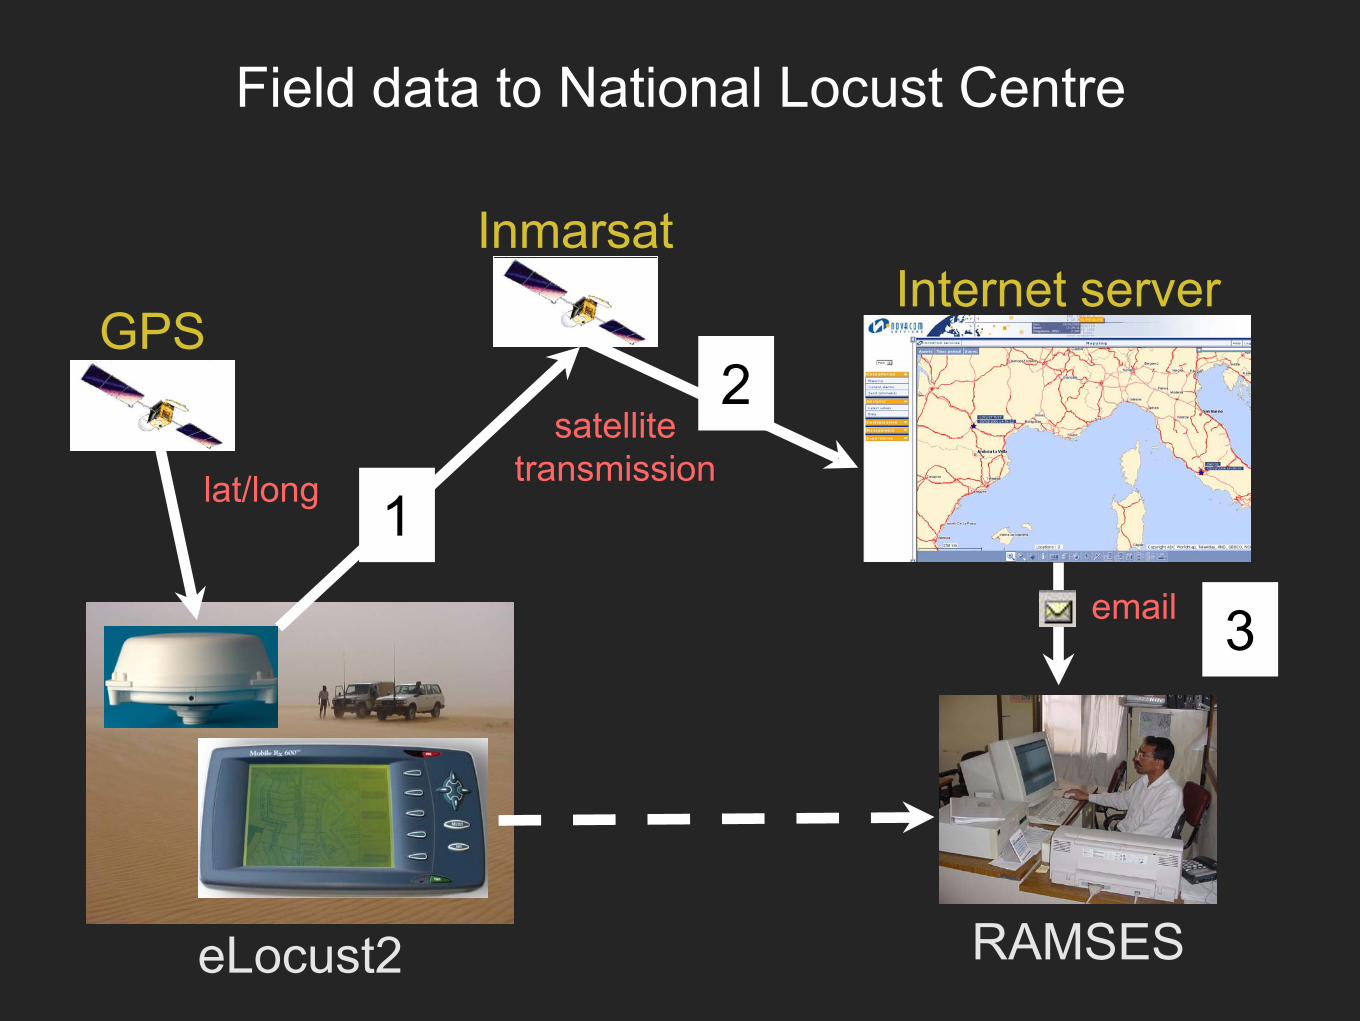
GPS
Inmarsat
eLocust2
Internet server
RAMSES
satellite transmission
lat/long
Field data to National Locust Centre
1
2
3

Internet access to field data in real time
latest position
see work rate
ID gaps
on your PC
24/7
secure

GIS at National Locust Centres
DATA ENTRY
DATA DISPLAY
RAMSES

GIS at FAO DLIS (Rome)
SWARMS

simple access to GIS data via Internet
Locust Mapper
www.fao.org/ag/locusts

calm
caution
threat
danger
www.fao.org/ag/locusts
informing people

advanced warning
warning reliability
outbreaks less than 1 month low-moderate
upsurges up to 3 months low
plagues up to 6 months moderate-high
provided by FAO/DLIS, Rome
Sustaining effective national surveillance ...
motivated individuals (energetic, curious)
well trained teams (survey, data collection)
well equipped teams (GPS, vehicles)
financial support (national budget, incentives)
becomes routine
teams receive feedback
data ownership

a successful early warning system
regular surveillance & accurate GPS field data
rapid data transmission & easy access
complete GIS analysis
simple well-targeted outputs
use social media
www.fao.org/ag/locusts www.facebook.com/faolocust twitter.com/faolocust
Keith Cressman Senior Locust Forecasting Officer, Rome [email protected]