Department of Industrial Economics and Management ...
30
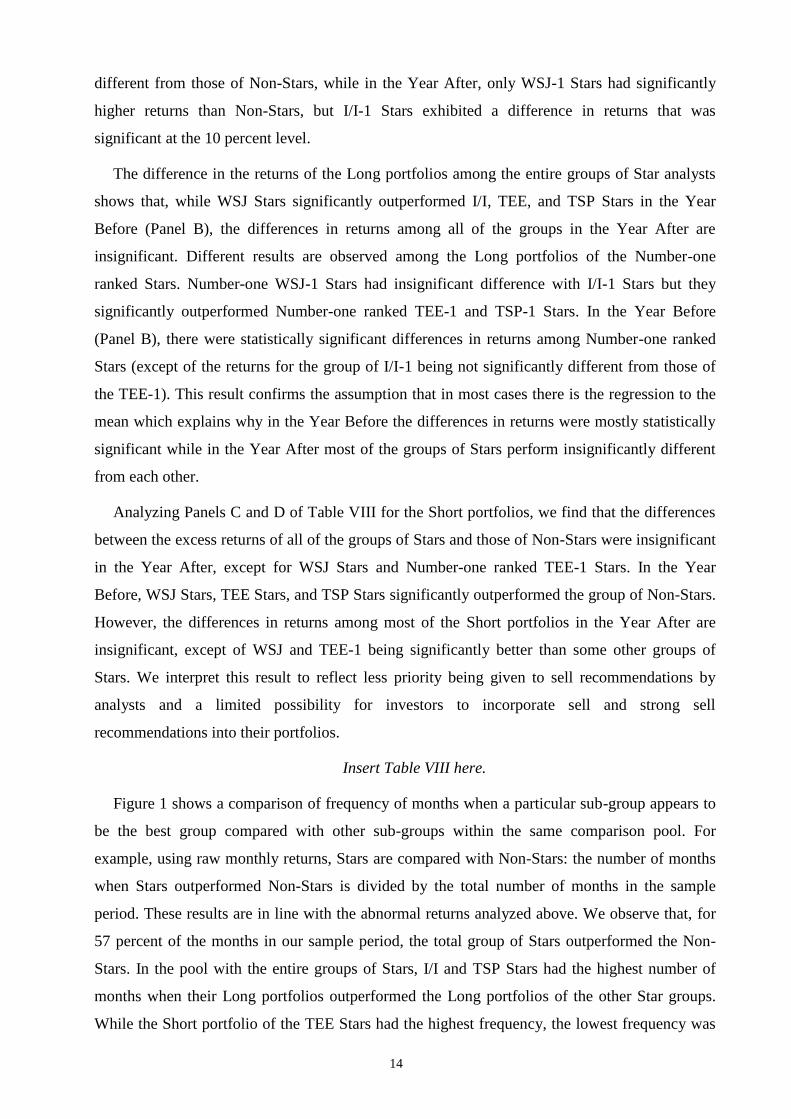
KTH ROYAL INSTITUTE OF TECHNOLOGY Department of Industrial Economics and Management Electronic Working Paper Series Paper no: 2015/11 Star sell-side analysts listed by Institutional Investor, The Wall Street Journal and StarMine. Whose recommendations are most profitable? Yury O. Kucheev, Felipe Ruiz & Tomas Sorensson 03-06-2015 INDUSTRIAL ENGINEERING AND MANAGEMENT Industrial Economics and Management
Transcript of Department of Industrial Economics and Management ...

KTH ROYAL INSTITUTE
OF TECHNOLOGY
Department of
Industrial Economics and Management
Electronic Working Paper Series
Paper no: 2015/11
Star sell-side analysts listed by
Institutional Investor, The Wall Street
Journal and StarMine.
Whose recommendations are most
profitable?
Yury O. Kucheev, Felipe Ruiz & Tomas Sorensson
03-06-2015
INDUSTRIAL ENGINEERING AND MANAGEMENT
Industrial Economics and Management

1
Star sell-side analysts listed by Institutional Investor,
The Wall Street Journal and StarMine.
Whose recommendations are most profitable?
Yury O. Kucheev1, 2, 3
, Felipe Ruiz1, Tomas Sorensson
2, 3
This draft: May 25th, 2015
Abstract: In this study, we compare the profitability of the investment recommendations of
analysts listed in four different star rankings: Institutional Investor magazine, StarMine’s “Top
Earnings Estimators” and “Top Stock Pickers” and The Wall Street Journal. We document that
the highest average monthly abnormal return of holding a long-short portfolio, 1.58 percent, is
obtained by following the recommendations of the group of star sell-side analysts rated by The
Wall Street Journal during the period from 2003-2013. The results indicate that the choice of
analyst ranking is economically important in making investment decisions.
Keywords: Star analysts; Analyst recommendations; StarMine; Institutional Investor; The Wall
Street Journal
JEL Code: G10; G20
Acknowledgement:
This research was conducted as part of the EMJD Programme European Doctorate in Industrial Management
(EDIM) and was funded by the European Commission, Erasmus Mundus Action, which is gratefully acknowledged.
We would like to thank Joaquin Ordieres of the Technical University of Madrid for help in data processing. Kathryn
M. Kaminski made valuable contributions at the beginning of this project, when she was at the Stockholm School of
Economics, which is gratefully acknowledged. We thank Per-Olof Edlund, Gustav Martinsson, Per Thulin and
seminar participants at KTH, Lund University, University of Gothenburg, and the Swedish House of Finance for
valuable comments. All errors are the responsibility of the authors.
1Department of Industrial Management, Business Administration and Statistics, School of Industrial Engineering,
Technical University of Madrid (UPM)/Universidad Politécnica de Madrid, c/ José Gutiérrez Abascal, 2, 28006
Madrid, Spain 2Department of Industrial Economics and Management, School of Industrial Engineering and Management, KTH-
Royal Institute of Technology, SE-100 44 Stockholm, Sweden 3Swedish House of Finance, Stockholm School of Economics, Stockholm, Sweden
2 Corresponding author´s contacts: [email protected]
2
1 Introduction
This study analyzes whether investors can profit from the recommendations of ranked security
analysts. We further examine whether an investor’s choice of a rating “agency” matters.
Academic theory and banks do not reach the same conclusions about the value of security
analysts. The semi-strong form of market efficiency states that investors should not be able to
earn excess returns from trading on publicly available information, such as analysts’
recommendations. However, banks and other firms spend large amounts of money on research
departments and security analysts, presumably because they and their clients believe that
security analysis can generate large abnormal returns. The importance of security analysis and
analysts is also manifest in the establishment, in 1998, and growth of StarMine, a competitor to
The Wall Street Journal and Institutional Investor’s rankings of analysts. StarMine states on their
homepage: “StarMine is the world's largest and most trusted source of objective equity research
performance ratings” (StarMine, 2015).
The above observations provide a strong motivation for our study and distinguish our analysis
from studies that focus on corporate actions. Studies of dividend policy, share repurchases, stock
splits, or firm characteristics such as recent firm performance and actions are not directly tied to
how people invest their funds. In our study, we analyze the economic value of security analysis –
an activity performed by thousands of professionals in the finance industry with the goal of
improving their clients’ return performance.
The possibility that there could be profitable investment strategies based on the published
recommendations of security analysts is supported by multiple studies (Stickel 1995; Womack
1996; Barber et al. 2001; Boni and Womack 2006; Barber, Lehavy, and Trueman 2010; Loh
2010) that show that favorable (unfavorable) changes in individual analysts’ recommendations
are accompanied by positive (negative) returns at the time of their announcements. Hence, early
work by Womack documents a post-recommendation stock price drift for upgrades that lasts up
to one month and for downgrades that lasts up to six months.
Our perspective, however, differs from that of the above-mentioned studies. While the studies
cited focus on measuring the average price reaction to changes in individual analysts’
recommendations, we compare the profitability of recommendations issued by different groups
of analysts. However, we pursue a common goal of providing evidence as to whether, assuming
no transaction costs, profitable investment strategies could potentially be based on the use of
analysts’ recommendations. Specifically, we focus on differences between the rankings of
security analysts by Institutional Investor, The Wall Street Journal and StarMine and on the
profitability of their recommendations. Using this approach, we can determine whether investors
3
can earn positive abnormal returns on the investigated strategies and whether differences in
profitability are associated with the use of different star rankings. Additionally, we compare star
analysts’ recommendations with those of non-star analysts.
We use data from the Thomson Financials Institutional Brokers’ Estimate System (I/B/E/S)
Detail Recommendations File for the period from 2002-2013. We manually collected lists of star
analysts from Institutional Investor magazine (October 2003 – October 2013), The Wall Street
Journal (May 2003 – April 2013), and StarMine (October 2003 – August 2013). The lists of
stars are matched with I/B/E/S by analysts’ names and broker affiliations. Our final database
contains 177,308 recommendations for 5,109 companies listed on the NYSE, AMEX and
NASDAQ markets that were announced between January 2002 and December 2013. The hand-
collected database enables us to conduct original research by comparing the profitability of
StarMine´s rankings of analysts with the rankings of Institutional Investor and The Wall Street
Journal.
Using this database, we measure and compare the investment values of portfolios formed by
recommendations of an entire group of star analysts (referred to as Stars), a group of non-star
analysts (Non-Stars), and groups of stars as indicated by the different rankings (groups of I/I,
TEE, TSP and WSJ). We divide our sample into two time frames, Year Before and Year After,
which correspond to the evaluation year and the one-year period after a particular star ranking is
announced, respectively. We only consider firms covered by star analysts during the Year After
or Year Before and identify all other analysts who cover the same firms (group of Non-Stars)
during the same time period (Year Before or Year After).
In line with Emery and Li (2009) and Fang and Yasuda (2013), we sort analysts according to
their star/non-star status and use a well-established buy-and-hold portfolio simulation with a
holding period of 30 calendar days to form a “Long” and “Short” portfolio for each group of
analysts. The portfolio composition is formed according to the recommendations issued by a
particular group of analysts. A Long portfolio includes all Buy and Strong Buy
recommendations, while a Short portfolio contains all Hold, Sell and Strong Sell
recommendations. Each time an analyst reports that he or she has started covering a firm or
changes his or her recommendation for a firm, the firm is included or excluded from the
portfolio at the close of the recommendation announcement day (or at the close of the next
trading day if the recommendation is issued after the closing of trading or on a non-trading day).
Any returns that investors might have earned from prior knowledge of recommendations or from
trading the recommended stocks during the recommendation day are not included in the return
4
calculations. Time series of daily returns were aggregated to monthly returns and used to
estimate average risk-adjusted monthly alphas for each portfolio.
For our sample period, we find that the recommendations of star analysts generated higher
monthly average excess returns (alphas) (1.40 percent) than recommendations by non-stars (0.89
percent).
Among the entire groups of stars, the best performance was observed for The Wall Street
Journal with a monthly excess return of 1.58 percent followed by StarMine’s “Top Earnings
Estimators” with 1.52 percent, and Institutional Investor with 1.42 percent. The worst
performance was observed for the StarMine’s “Top Stock Pickers” stars, with an excess return of
0.99 percent. However, on a detailed level, Institutional Investor’s Long portfolio is the number
one portfolio, but their Short portfolio is the number three portfolio, which we interpret as
suggesting that Institutional Investor might focus more on buy recommendations. Comparing the
Long portfolios of the top-ranked analysts, we find that the analyst ranked number one by The
Wall Street Journal had higher returns than the group of Non-Star analysts and that the
difference in returns was statistically significant.
Our results show that star analysts who are ranked in terms of the accuracy of their earnings
forecasts and the profitability of their recommendations, as in the methodology of StarMine’s
“Top Earnings Estimators”, show more consistent performance from the year of evaluation to the
year after than star analysts who are ranked exclusively based on the previous performance of
their recommendations (stars listed by The Wall Street Journal and StarMine’s “Top Stock
Picker”). This result reveals that focusing on EPS and recommendations in an evaluation
provides higher predictive power in selecting skilled analysts, while considering only the
profitability of the previous year’s recommendations leads to a large influence of luck.
Our contribution is in the comparison of four different star rankings with a focus on the
profitability of investment recommendations using a recent dataset with a unique (hand-
collected) list of star analysts. Emery and Li (2009) use the information ratio, which is the t-
statistic of the intercept of the regression estimation, rather than a direct performance measure of
the profitability of recommendations, as is used here. While Fang and Yasuda (2013) discuss the
returns of Institutional Investor stars compared with those of all other analysts (Non-Stars) and
include in their analysis firms not covered by stars, we only consider firms followed by star
analysts in our sample and primarily compare different rankings among these analysts.
In this study, we continue to explore the relationship between reputation/status and the
profitability of recommendations by examining various star rankings that utilize different
evaluative approaches in selecting analysts. While reputation is based on observable previous
5
performance, status is based on social recognition (Sorenson 2014). In view of this distinction,
we cover three reputation-based rankings (Top Earnings Estimators, Top Stock Pickers and The
Wall Street Journal) and one status-based ranking (Institutional Investor). As status is not
necessarily attributed to performance, Institutional Investor stars should not necessarily
outperform the group of Non-Stars. At the same time, reputation-based rankings reflect previous
performance and should reduce uncertainty about future profitability. However, we show that the
performance of recommendations by Institutional Investor stars does differ from that of Non-
Stars in the previous year. For rankings that reflect previous performance and are thus indicative
of reputation, it is important to select, as a proxy for reputation, appropriate performance
attributes that have reasonable predictive power with respect to the future performance of
recommendations.
1.1 Ranking evaluation approaches
An analyst is rated as a “star” based on the quality of his/her previous reports, the accuracy of
his/her forecasts and the returns that he/she has generated for his/her clients (Loh and Mian
2006). Ratings of sell-side analysts can mainly be divided into two groups according to the
evaluation approach used: (1) rankings based exclusively on the investment value of
recommendations, for example, “Best on the Street,” issued by The Wall Street Journal (WSJ),
and “Top Stock Pickers,” issued by Thomson Reuters’ StarMine (TSP); and (2) rankings that use
mixed evaluation methods, for example, the survey-based “All-America Research Team,” issued
by Institutional Investor (I/I) magazine, and “Top Earnings Estimators,” issued by StarMine
(TEE).
To select the members of the “All-America Research Team” ranking, Institutional Investor
(I/I) magazine sends a questionnaire to buy-side investment managers that asks them to evaluate
various attributes of sell-side analysts. Institutional Investor magazine ranks three analysts in
each industry and also provides names of so-called “runners-up” who are promising and could
possibly be chosen in subsequent years. This list of stars is published in October and is usually
supplemented by 12 attributes that investors view as the most important to possess. Attributes
such as industry knowledge and integrity are listed among the most important, while stock
selection and earnings estimates are among the lowest-ranked attributes. Thus, the I/I ranking is
not primarily focused on stock picking ability but rather covers a wide range of attributes that are
perceived to directly or indirectly relate to the ability of an analyst to make profitable
recommendations.
Previous research shows mixed results regarding the profitability of recommendations issued
by I/I stars. Measuring the investment value of recommendations during the period from 1994-
6
2009, Fang and Yasuda (2013) show that I/I stars outperformed the group of non-stars, finding
Carhart 4-factor monthly alphas of 1.25 percent for Long portfolios and –0.83 percent monthly
alphas for Short portfolios of I/I stars compared with 1.09 percent and –0.71 percent for Long
and Short portfolios for non-stars, respectively. Using historical data from 1993-2005, Emery
and Li (2009) investigate I/I and WSJ ratings. The authors identify the determinants of star status
and compare the two rankings on the basis of EPS accuracy and the industry-adjusted
performance of investment recommendations in the year before and one year after analysts
become stars. Emery and Li (2009) find, for the period from 1993-2005, that after becoming
stars, star analysts’ forecast accuracy of earnings per share (EPS) does not differ from that of
their non-star peers; the recommendations of I/I stars are not statistically better than those of
non-stars, while the recommendations of WSJ stars are significantly worse. They conclude that
both rankings are largely “Popularity Contests” and do not provide any significant investment
value. In contrast, Leone and Wu (2007) investigate the investment value of I/I stars’
recommendations issued from 1991 to 2000 and find that star analysts persistently issued
profitable recommendations and that this outperformance was due not to luck but to a superior
ability to pick stocks.
Since 1993, The Wall Street Journal (WSJ) has published a list of “Best on the Street”
analysts (before 2000, this ranking was named “All-Star Analysts”), with five analysts ranked in
each industry. This ranking is based on the score that an analyst obtained during the previous
year, calculated as the sum of one-day returns of recommendations (if an investor would invest
one day before a recommendation is announced and realize the return by the end of the
recommendation day). Such an evaluation methodology focuses on short-term price forecasts
and favors analysts who issue recommendations on days when a price changes the most. At the
same time, it penalizes analysts who issue their recommendations before or after such days of
sharp price changes. Additionally, to benefit from such recommendations, investors should be
able to receive a recommendation one day before it is announced, which could be the case for a
limited number of investors with privileged access to analysts’ recommendations. Additionally,
WSJ’s evaluation method is blind to avoiding analysts who announce their recommendations on
the same day but after a significant price change has already occurred (Yaros and Imielinski
2013). All of these considerations may generate significant randomness in the selection of
analysts into the WSJ star ranking. Emery and Li (2009) find that, after becoming stars, WSJ star
analysts issue recommendations that underperform the group of non-stars. They interpret this
result as an effect of regression to the mean, as the short-term recommendation performance
includes a substantial random component.
7
Thomson Reuters’ StarMine “Stock Picking Awards” (TSP) and “Earnings Estimate Awards”
(TEE), which include three analysts per industry and are based on a two-step measurement of the
previous year’s profitability, have been issued annually since 1998. The Coverage-Relative
Rating is the first evaluation step for both rankings, while the second step is different for TEE
and TSP. The Coverage-Relative Rating is based on the excess returns of a long-only portfolio
that is constructed according to all of the recommendations of each analyst and that measures
how well an analyst distinguishes among the stocks he/she covers. For the TSP’s second step, all
of the recommendations for each analyst are evaluated using the long and short buy-and-hold
portfolio method adjusted to the market capitalization-weighted portfolio for a given industry.
For the TEE’s second step, the accuracy and timing of earnings forecasts are evaluated.
Although StarMine’s rankings appeared much later, they play an essential role in sell-side
research by providing an “…influential and an important reference in the industry” (Kim and
Zapatero 2011). According to Beyer and Guttman (2011); Ertimur, Mayew, and Stubben (2011),
many Wall Street firms use StarMine rankings when defining payments to their analysts. Recent
work by Kerl and Ohlert (2015) investigates the accuracy of earnings per share forecasts and
target prices of StarMine analysts compared with their non-star peers one year after the analysts
became stars. They find that analysts possess a persistent ability to issue accurate earnings
forecasts, as after becoming stars, they continue to issue more accurate earnings forecasts than
non-star analysts. Regarding the accuracy of target prices (TP), the authors cannot find any
difference between the two groups of analysts. The insignificant difference in TP forecasts could
be due to the research methodology: star analysts with “Stock picking awards” and “Earnings
estimate awards” are grouped together to compare their accuracy with that of non-stars without
splitting the sample of StarMine’s stars into Top Stock Pickers and Top Earnings Estimators.
However, according to the StarMine methodology for determining the “Stock picking awards”,
analysts are not evaluated on the basis of accuracy of EPS. Thus, it is possible that, even in the
year before they receive an award, stars do not outperform non-star peers in terms of the
accuracy of their forecasts. Furthermore, Kerl and Ohlert (2015) focus solely on the accuracy of
EPS and TP and the factors that influence such accuracy and do not compare the performance of
recommendations issued by star analysts with that of non-stars.
2 Data and descriptive statistics
We use four data sources. The Thomson Financials Institutional Brokers’ Estimate System
(I/B/E/S) Detail Recommendations File provides standardized stock recommendations for all of
the various brokers’ scales by mapping all of the recommendations on a final scale from 1 to 5,
where 1 corresponds to “Strong Buy”, 2 to “Buy”, 3 to “Hold”, 4 to “Sell” and 5 to “Strong
8
Sell”. The Center for Research in Security Prices (CRSP) Daily Stock File provides daily
holding period stock returns, which include dividends, price and cash adjustments. The Fama-
French Factors – Monthly Frequency database provides monthly returns for the factors of value-
weighted market index, size, book-to-market and momentum. We manually collected lists of star
analysts from Institutional Investor magazine (October 2003 – October 2013), The Wall Street
Journal (May 2003 – April 2013), and StarMine (October 2003 – August 2013). The lists of
stars are matched with I/B/E/S by analysts’ names and broker affiliations and double-checked for
any possible inconsistencies (typos in names, analyst changes of broker in a given year, etc.).
Our sample does not include analysts from some brokerage houses, notably Lehman Brothers
and Merrill Lynch, as their recommendations are no longer available at I/B/E/S.
To enable a fair comparison of performance in different groups, we limit our sample to firms
that are followed by star analysts during a one-year period after a particular list of stars was
published or during the previous calendar year (that is, the evaluation year). As a result, our
sample contains only firm observations for which there is at least one recommendation by a star
analyst during the specified time period, that is, Year Before or Year After.
Our final database contains 177,308 recommendations for 5,109 companies listed on the
NYSE, AMEX and NASDAQ markets that were announced between January 2002 and
December 2013.
The entire sample of analysts is divided into the following groups:
(1) Stars and Non-Stars;
(2) Institutional Investor (I/I), The Wall Street Journal (WSJ), and StarMine Top Stock Pickers
(TSP) and Top Earnings Estimators (TEE);
(3) Analysts ranked as number one (Top-Ranked): WSJ-1, I/I-1, TSP-1, and TEE-1.
When a particular analyst is rated as a star in two different industries, the analyst is included
only once in a particular group of Stars. However, the same analyst can appear in more than one
ranking group. The similarities between the lists are discussed below and are reported in Table
IV.
We compare these groups using two time frames:
1) The Year Before is the calendar year before a ranking is announced. For example, the
WSJ list of stars is announced in May 2003. Thus, the previous calendar year, from
January 2002 through December 2002, is the evaluation year for the WSJ rating. As a
result, the whole sample period for Year Before spans from January 2002 until December
2012.
9
2) The Year After is the one-year period that begins on the day that a particular ranking is
announced. For example, if the WSJ announcement is on May 12, 2003, the Year After
begins on that day and ends on May 12, 2004. Although an entire sample period for Year
After spans from May 2003 until December 2013, we begin by comparing groups one
month after StarMine and I/I have published their lists, that is, from November 2003 (an
incomplete month, October, is excluded from the regression analysis). Because the last
month is December 2013, we do not cover the whole Year After for groups of stars
selected in 2013 due to data availability.
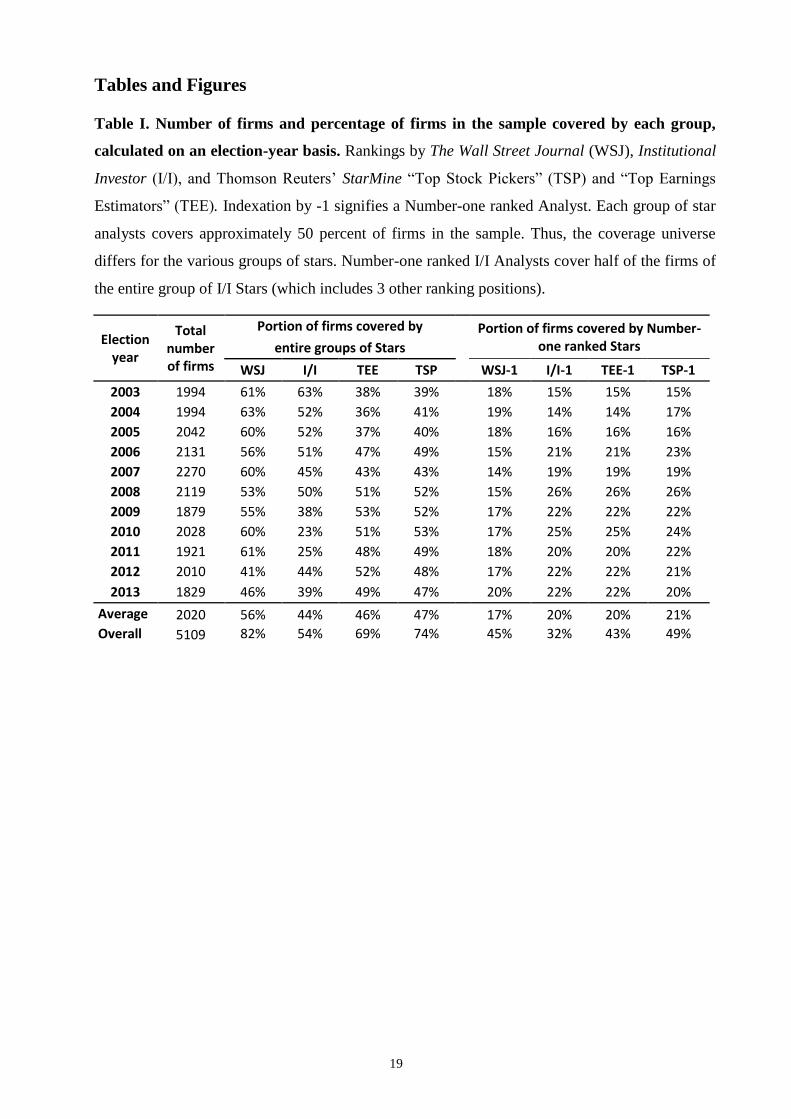
Table I shows the number of firms in the sample, which ranged from 1,829 for 2013 to 2,270
for 2007, and the percentage of firms covered by each group. On average, each group of star
analysts covers approximately 50 percent of the firms in the sample (WSJ covers 56 percent, I/I
– 44 percent, TEE – 46 percent, TSP – 47 percent). This difference suggests that these groups
have different firm coverage (they issue recommendations for different universes of firms).
Insert Table I here
Table II displays the total number of analysts in the sample on an election-year basis. On
average, approximately 14 percent of analysts are listed as “stars” every year. The table shows
that for every one star analyst, there are approximately six non-star analysts in our sample.
Additionally, 14 percent of analysts among the non-stars have been chosen as stars in some other
year but not in the year under consideration.
Insert Table II here
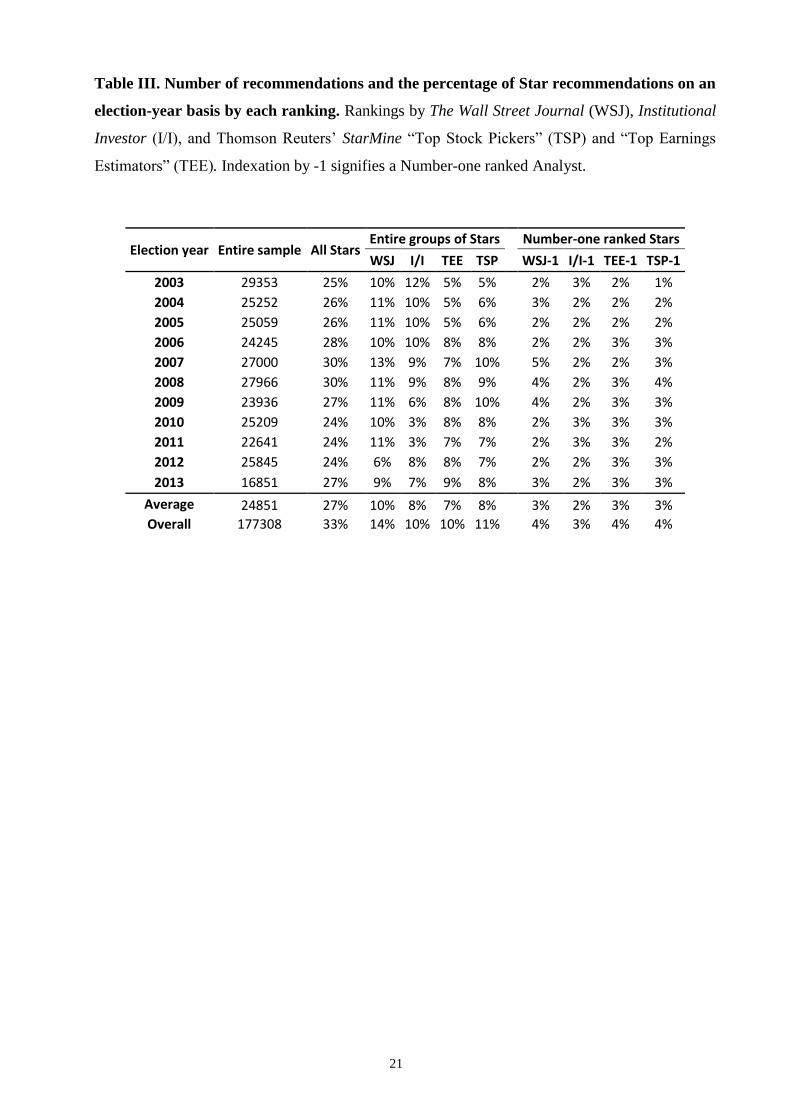
As seen in Table III, the group of Star analysts issues on average 27 percent of all
recommendations in our sample. Both WSJ and I/I Stars issue more recommendations than TEE
and TSP Stars.
Insert Table III here
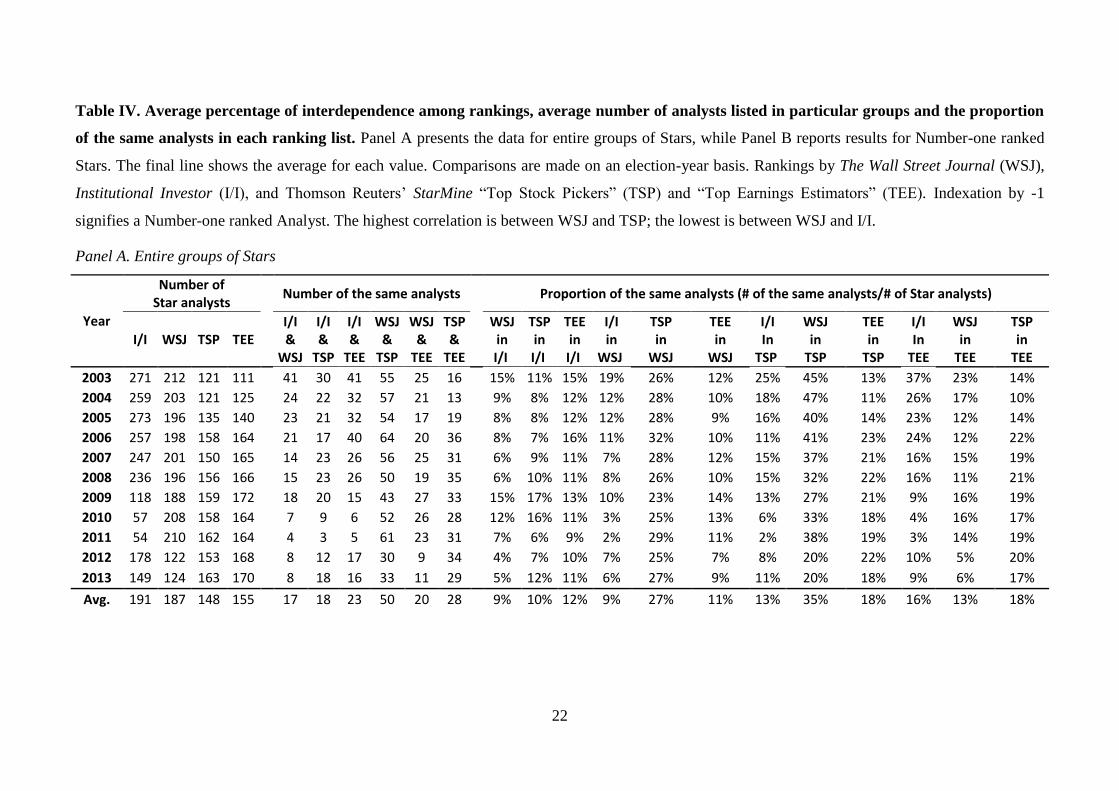
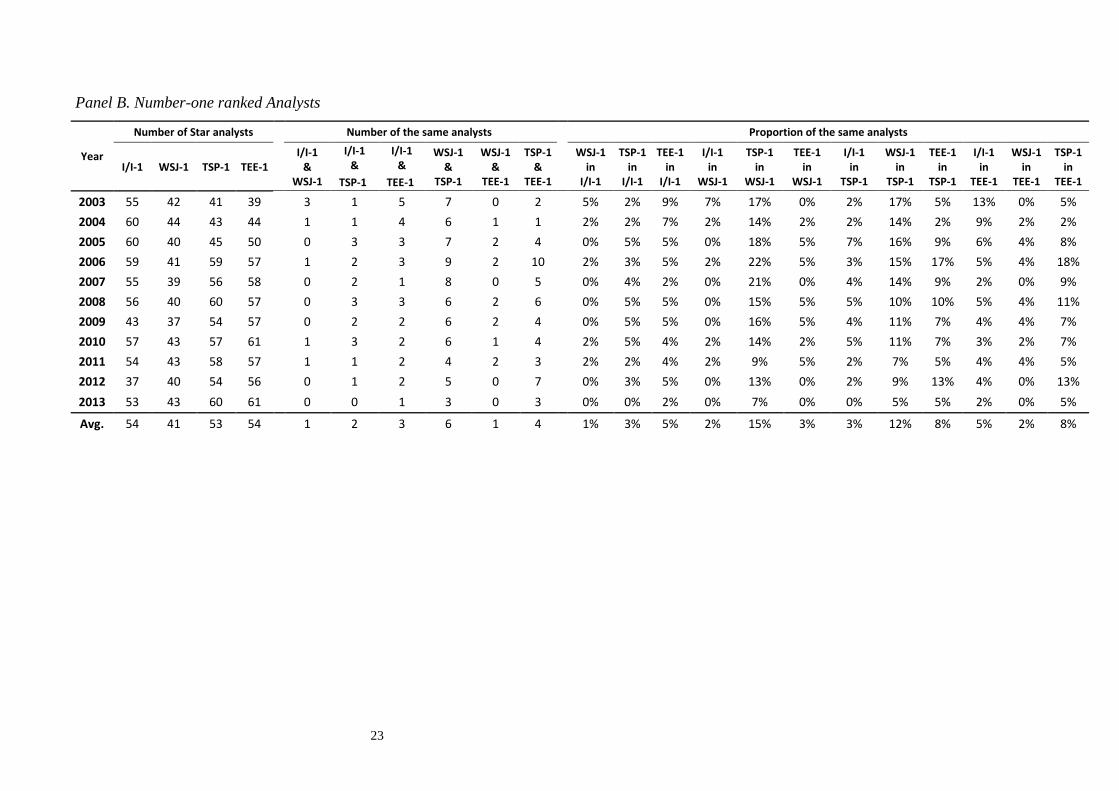
The average overlap among the ranking lists in each sample year is presented in Table IV. It
shows the number of analysts listed by different rankings, the number of the same analysts in
each pair of rankings, and the portion of the same analysts in each ranking list. Panel A presents
these data for the entire groups of Stars, while Panel B reports the results for the Number-one
ranked Stars. The table also presents the percentages of analysts who appear in another ranking.
For example, the Institutional Investor ranking has, on average, nine percent of analysts out of
191 unique names who were listed as “Top Stock Pickers” by StarMine in the same years. As
can be observed, Top Stock Pickers and The Wall Street Journal exhibit the highest similarity in
their published lists, while Institutional Investor and The Wall Street Journal have the lowest
10
similarity. Such interdependence is expected given the similarities in the evaluation methods
used. It also shows how different the lists of Star analysts are, which might explain the
differences in the returns from their recommendations.
Insert Table IV here
3 Results: risk-adjusted portfolio returns.
3.1 Methods
To measure the profitability of the recommendations, we apply a well-established portfolio
simulation method. We use a simulation of buy-and-hold “Long” and “Short” portfolios for each
sub-group of analysts in the year subsequent to the year in which the rankings were assigned
(referred to as Year After) and for the year during which the analysts were evaluated (referred to
as Year Before) (Barber et al. 2006; Fang and Yasuda 2013). For each new Strong Buy or Buy
recommendation, $1 is invested at the end of the recommendation announcement day (or at the
close of the next trading day if the recommendation is issued after the closing of trading or on a
non-trading day) into the “Long” portfolio. The stock is held in the portfolio for the following 30
calendar days if there are no recommendation revisions or recommendation changes by the same
analyst. If, during the following 30 days, the analyst changes his or her recommendation level
from Strong Buy or Buy to Hold or Sell or Strong Sell, then the stock is withdrawn from the
“Long” portfolio and placed in the “Short” portfolio by the end of the trading day on which the
new recommendation is issued (if the recommendation is issued after the closing of trading or on
a non-trading day). If there is a recommendation revision, but the new recommendation is on the
same level (that is, Buy or Strong Buy), then the stock is not kept in the same portfolio for an
additional 30 calendar days or until the next recommendation change. Thus, re-iterations of
recommendations are not included in the portfolio simulation.2 The same procedures are applied
to a “Short” portfolio that includes Hold, Sell, and Strong Sell recommendations. As a result of
this strategy, the calendar day t gross return on portfolio p includes from n=1 to Npt
recommendations and could be defined as:
,
1
1,
1
,1,
pt
pt
n
N
n
tn
N
n
titn
pt
X
RX
R (1)
2 We also performed the portfolio simulation by including re-iterations of recommendations in the portfolio
simulation and obtained lower returns, but with results that are qualitatively the same. These results remain
unpublished and are available upon request from the authors.
11
where Xn, t-1 is the cumulative total gross return of stock in from the next trading day after a
recommendation was added to the portfolio to day t-1, which is the previous trading day before t,
that is:
1,2,1,1, *...* trecdatirecdatirecdatitn nnnnnnRRRX (2)
Monthly portfolio returns are obtained from a geometric compounding of daily returns. Thus, a
raw monthly return of a portfolio p is:
11
n
t
tRr , (3)
where nτ is the number of trading days in month τ.
Monthly excess returns for each group´s “Long” and “Short” portfolios are estimated as an
intercept (alpha) that is calculated according to the four-factor model proposed by (Carhart
1997):
UMDmHMLhSMBsrfrmrfr )( , (4)
where rmτ is a monthly market return,
rfτ is the risk-free rate of return,
SMBτ is a size factor, that is, the difference between the value-weighted portfolio returns of
small and large stocks,
HMLτ is a book-to-market factor, that is, the difference between the value-weighted portfolio
returns of high book-to-market and low book-to-market stocks,
UMDτ is a momentum factor, that is, the difference in the returns of stocks with a positive
return momentum and those with a negative return momentum over months τ-12 and τ-2.
The alpha differentials (differences in alphas) are statistically tested using two approaches.
Alphas for groups in the same year, that is, Year After or Year Before, are compared using
monthly differences in gross returns, which are regressed on four factors according to Equation
(2). An intercept from this regression returns the difference in alpha, and a t-test indicates
whether this difference is statistically significant. To compare excess returns between Year After
with Year Before, the seemingly unrelated estimation is accompanied by a test for significant
differences in the intercepts from various regressions (suest and test procedures in STATA).
3.2 Results and discussion
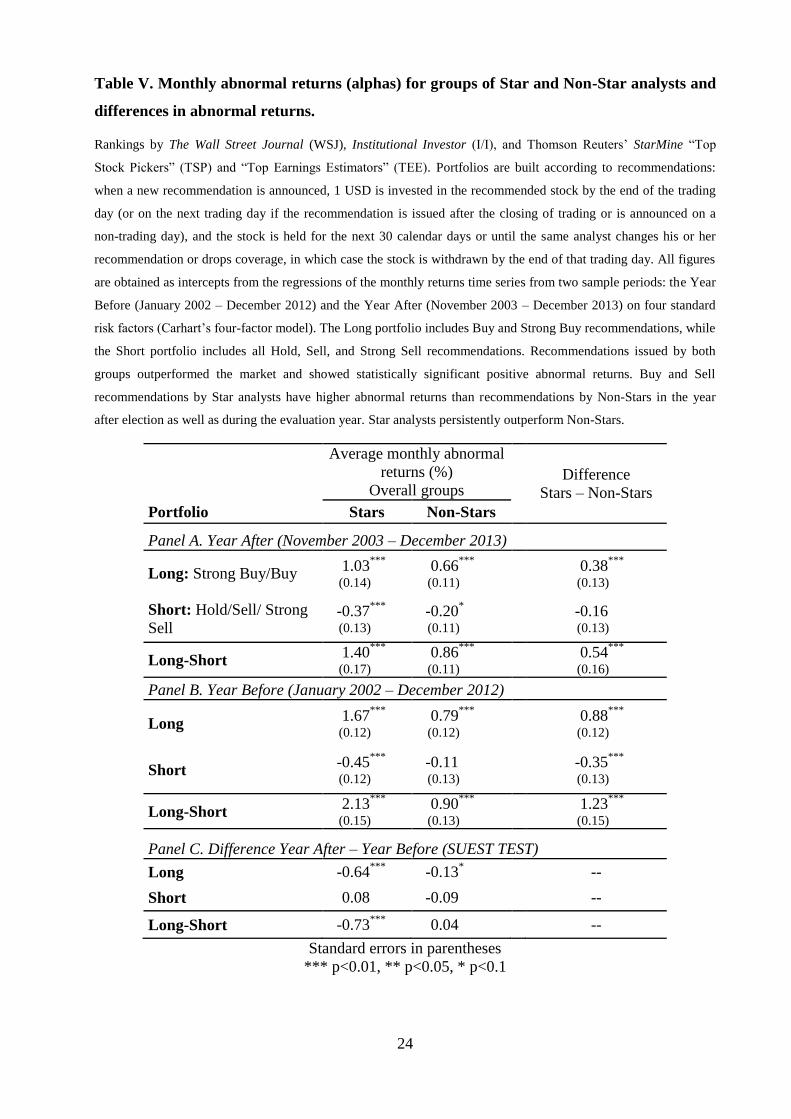
Table V represents the average monthly excess returns (alphas) for “Stars” and “Non-Stars”
during the year after rankings have been published (Panel A), during the evaluation year (Panel
12
B) and as a comparison of the returns in the Year After with those of the Year Before (Panel C).
The first two rows in each Panel of the table show the returns of the Long and Short portfolios,
while the third row (Long-Short) presents the total return on all of the recommendations for a
particular group, which is the Long minus the Short portfolio returns and that is the return of a
strategy where an investor goes long on all Buy and Strong Buy recommendations and short on
all Hold, Sell and Strong Sell recommendations.
As we see in Table V, Panel A, the Long-Short portfolio of Stars, with monthly alphas of
+1.40 percent, outperformed the Non-Stars, with monthly alphas of +0.86 percent, leading to a
statistically significant difference of 54 basis points in abnormal returns for a Long-Short
portfolio in the year after rankings were published. As can be expected, during the evaluation
year (Panel B in Table V), Stars had even higher recommendation returns, of +2.13 percent, than
Non-Stars, with +0.90 percent. When we analyze the differences in returns from the Year Before
to the Year After, as reported in Panel C, we conclude that the Stars do not continue to perform
on the same level, which is reflected as a significant difference in the returns on their Long-Short
portfolios, while the group of Non-Stars had an insignificant difference in the returns on their
Long-Short portfolios. Even with a lower result for the Year After the group of stars persistently
issues more profitable recommendations than their Non-Star peers, although the Stars show a
decrease in their performance in the Year After.
Insert Table V here.
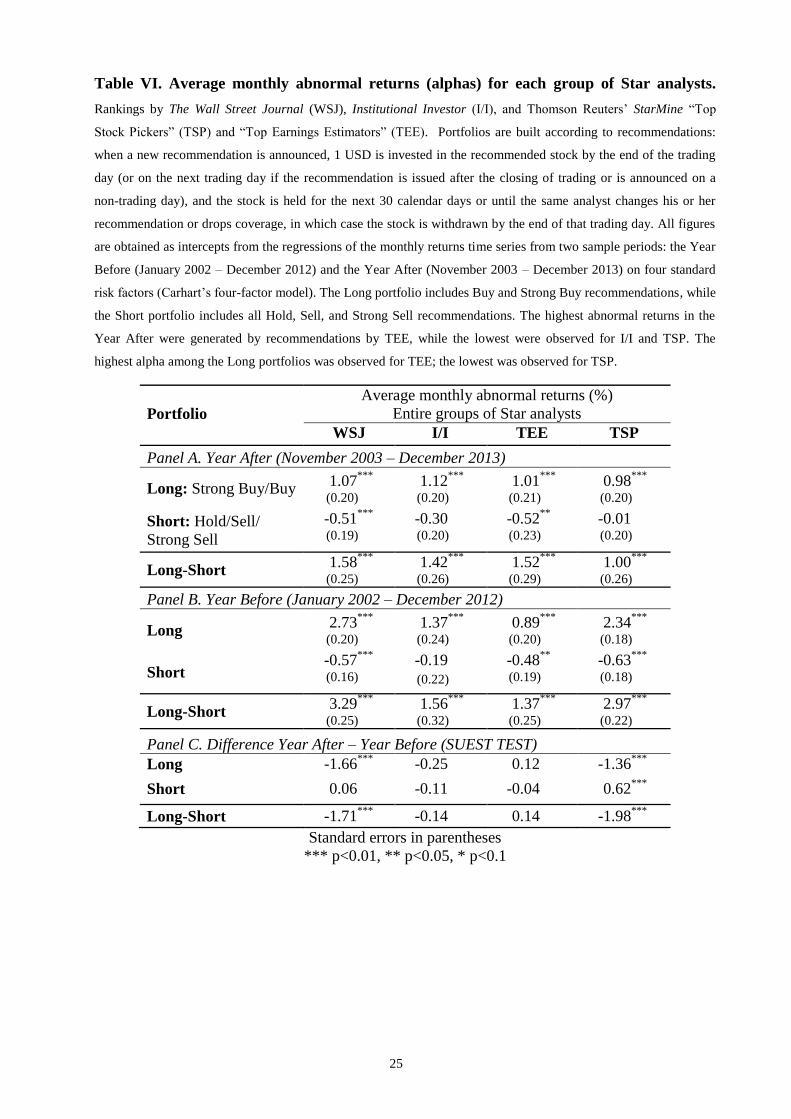
Table VI shows the excess returns from recommendations issued by entire groups of Stars:
“I/I”, “TSP”, “TEE” and “WSJ” in the Year After (Panel A) and Year Before (Panel B) and the
difference in returns between the Year After and Year Before (Panel C). In the Year After, the
highest average monthly excess returns of the Long-Short portfolios (Long minus Short), +1.58
percent, were exhibited by the WSJ group of Stars, followed by TEE group of Stars with 1.52
percent and by I/I group of Stars with 1.42 percent and the lowest returns, +0.99 percent, were
exhibited by the groups of TSP Stars. In the Year Before, the highest return, +3.29 percent, was
generated by recommendations issued by analysts who in the next year were listed by the WSJ,
and the lowest excess return, +1.38 percent, was generated by recommendations issued by the
next year’s TEE stars. This result is expected given the evaluation methodologies applied by the
WSJ and TEE: while the WSJ is focused on the investment value of recommendations, TEE
ranks stock picking ability as one attribute of several attributes in selecting their stars.
As seen in Panel C of Table VI, WSJ and TSP Stars exhibit the strongest decrease in
performance after election as a star, this can be explained as regression to the mean. At the same
time, the investment value of the recommendations of TEE analysts increases after the rankings
13
are published. This increase in profitability could be attributable to the influence of the analysts’
reputations on stock prices (Fang and Yasuda 2013).
Insert Table VI here.
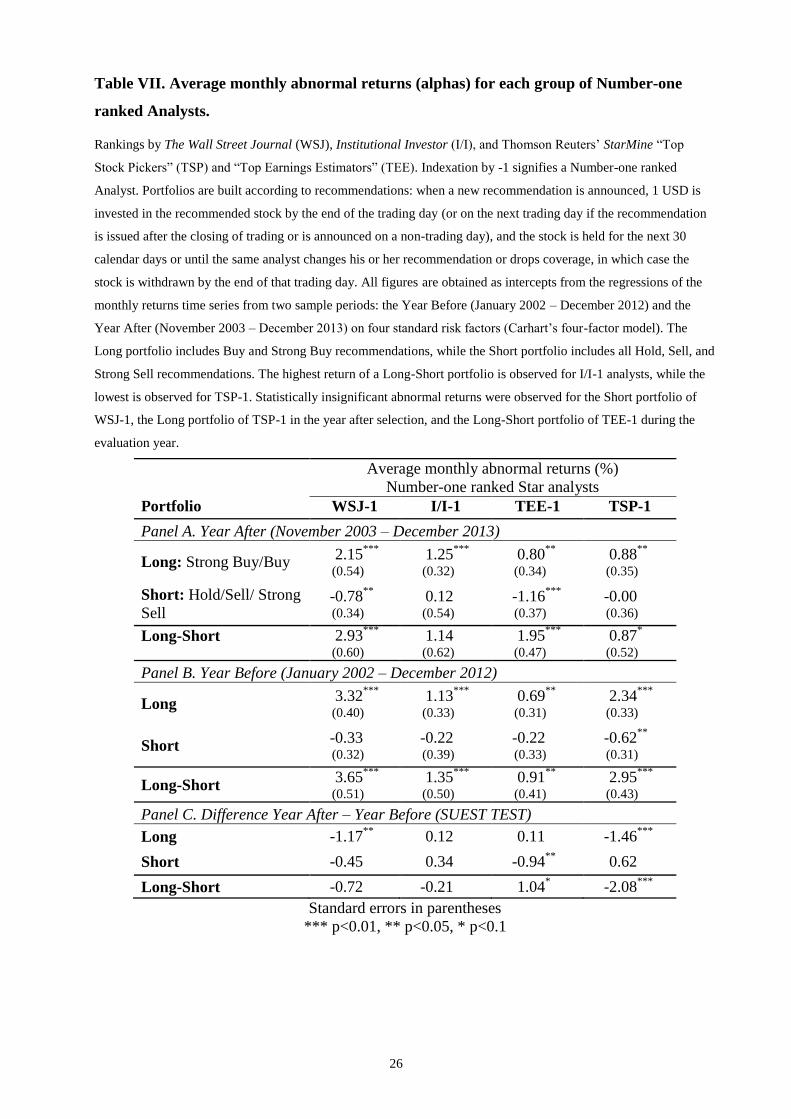
Table VII shows the average monthly excess returns for the top-ranked analysts (Number-one
ranked Analysts) for the Year After election (Panel A) and the Year Before (Panel B) and the
difference between the Year After and the Year Before (Panel C). In the Year After election, the
highest total return (Long-Short portfolio) was observed for WSJ-1, with +2.93 percent, while
the lowest total return, for TSP-1, was only +0.87 percent. The Short portfolio of the top-ranked
TSP-1 had a statistically insignificant return (excess return equal to zero). The highest return
among the Short portfolios in the Year After was generated by the TEE-1 group, with –1.16
percent, while the lowest return was generated by I/I-1, with 0.12 percent (statistically
insignificant). Among Long portfolios in the year after election, the highest excess return was
generated by the Long portfolio of the top-ranked WSJ-1 analysts, with +2.15 percent, and the
lowest excess return was generated by TEE-1, with 0.80 percent. In the Year Before, WSJ-1,
with an average monthly alpha of +3.65 percent, performed better than all of the other groups of
top-ranked analysts, while the TEE-1 group had the lowest excess return of +0.91 percent.
Comparing returns in the Year After election with the Year Before election in Panel C of Table
VII, the TEE-1 group improve the performance after election, while the returns of WJS-1, I/I-1
and TSP-1 decrease, with a significant difference of -2.08 percent between alphas in the Year
After and Year Before for the TSP-1 group.
Insert Table VII here.
In Table VIII, we report the alpha differentials obtained by comparing the abnormal returns
between groups of Stars in the Year After and Year Before for Long (Panel A and B) and Short
(Panel C and D) portfolios. First, we discuss whether each particular group of Stars
outperformed the Non-Stars; then we comment on the differences in performance among all of
the groups of Star analysts.
Comparing the returns of the Long portfolios of all of the groups of Stars with those of Non-
Stars in the Year After (first column in Panel A of Table VIII), we find that the returns of TEE
and TSP Stars did not significantly differ from those of the group of Non-Stars, while WSJ and
I/I Stars significantly outperformed Non-Stars. However, in the Year Before (Panel B), the
results are similar: WSJ, I/I and TSP Stars outperformed Non-Stars, while the returns of TEE
Stars do not significantly differ from those of Non-Stars. Similar results are found for the returns
of the Number-one ranked Stars: in the Year Before, the WSJ-1 and TSP-1 Stars significantly
outperformed the Non-Stars, but the returns of the I/I-1 and TEE-1 Stars were not significantly
14
different from those of Non-Stars, while in the Year After, only WSJ-1 Stars had significantly
higher returns than Non-Stars, but I/I-1 Stars exhibited a difference in returns that was
significant at the 10 percent level.
The difference in the returns of the Long portfolios among the entire groups of Star analysts
shows that, while WSJ Stars significantly outperformed I/I, TEE, and TSP Stars in the Year
Before (Panel B), the differences in returns among all of the groups in the Year After are
insignificant. Different results are observed among the Long portfolios of the Number-one
ranked Stars. Number-one WSJ-1 Stars had insignificant difference with I/I-1 Stars but they
significantly outperformed Number-one ranked TEE-1 and TSP-1 Stars. In the Year Before
(Panel B), there were statistically significant differences in returns among Number-one ranked
Stars (except of the returns for the group of I/I-1 being not significantly different from those of
the TEE-1). This result confirms the assumption that in most cases there is the regression to the
mean which explains why in the Year Before the differences in returns were mostly statistically
significant while in the Year After most of the groups of Stars perform insignificantly different
from each other.
Analyzing Panels C and D of Table VIII for the Short portfolios, we find that the differences
between the excess returns of all of the groups of Stars and those of Non-Stars were insignificant
in the Year After, except for WSJ Stars and Number-one ranked TEE-1 Stars. In the Year
Before, WSJ Stars, TEE Stars, and TSP Stars significantly outperformed the group of Non-Stars.
However, the differences in returns among most of the Short portfolios in the Year After are
insignificant, except of WSJ and TEE-1 being significantly better than some other groups of
Stars. We interpret this result to reflect less priority being given to sell recommendations by
analysts and a limited possibility for investors to incorporate sell and strong sell
recommendations into their portfolios.
Insert Table VIII here.
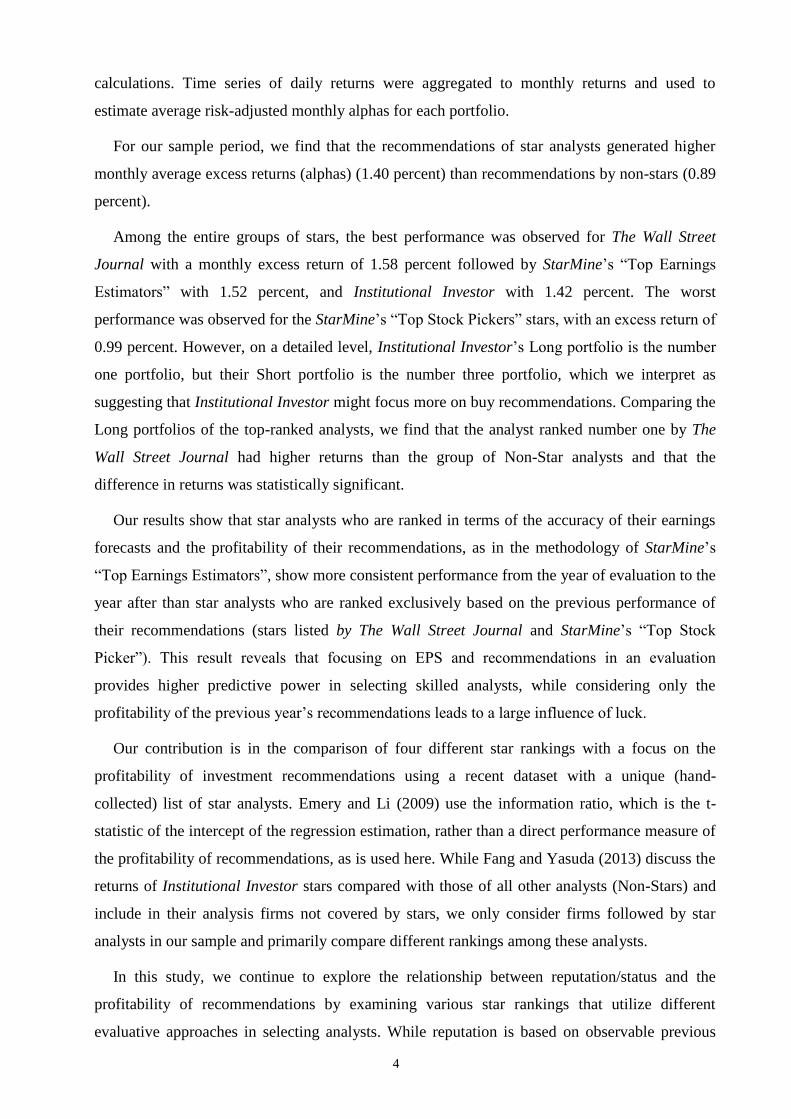
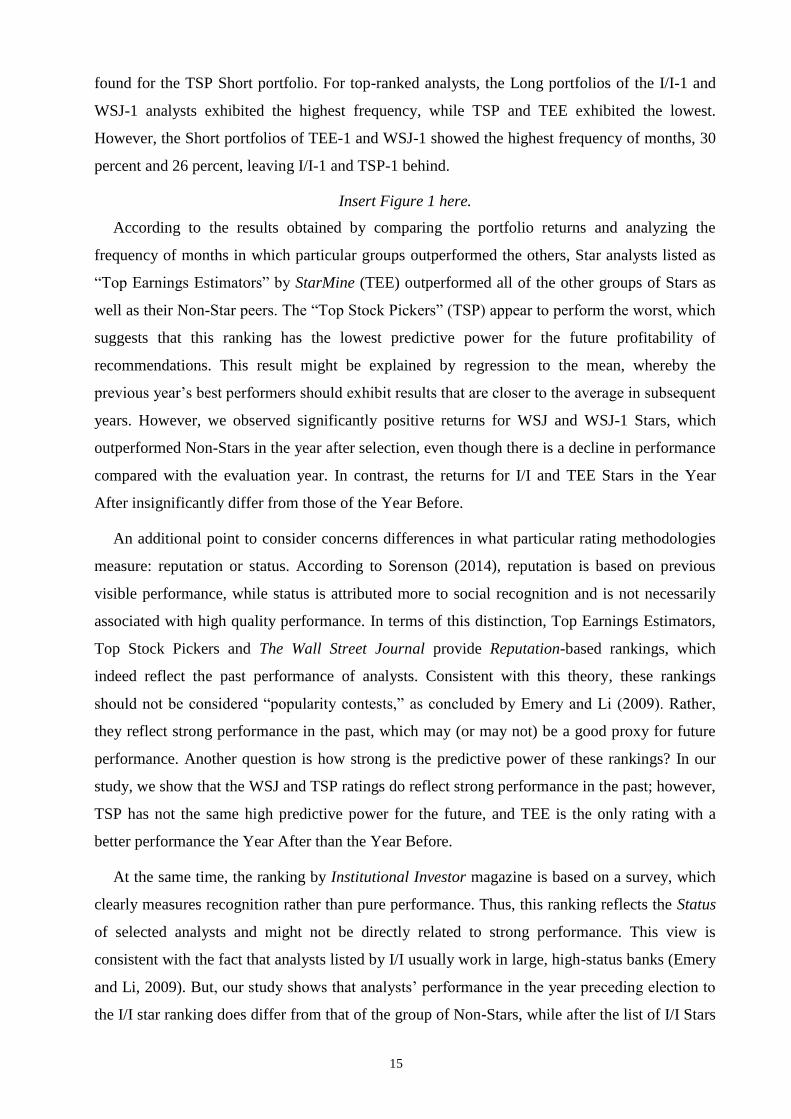
Figure 1 shows a comparison of frequency of months when a particular sub-group appears to
be the best group compared with other sub-groups within the same comparison pool. For
example, using raw monthly returns, Stars are compared with Non-Stars: the number of months
when Stars outperformed Non-Stars is divided by the total number of months in the sample
period. These results are in line with the abnormal returns analyzed above. We observe that, for
57 percent of the months in our sample period, the total group of Stars outperformed the Non-
Stars. In the pool with the entire groups of Stars, I/I and TSP Stars had the highest number of
months when their Long portfolios outperformed the Long portfolios of the other Star groups.
While the Short portfolio of the TEE Stars had the highest frequency, the lowest frequency was
15
found for the TSP Short portfolio. For top-ranked analysts, the Long portfolios of the I/I-1 and
WSJ-1 analysts exhibited the highest frequency, while TSP and TEE exhibited the lowest.
However, the Short portfolios of TEE-1 and WSJ-1 showed the highest frequency of months, 30
percent and 26 percent, leaving I/I-1 and TSP-1 behind.
Insert Figure 1 here.
According to the results obtained by comparing the portfolio returns and analyzing the
frequency of months in which particular groups outperformed the others, Star analysts listed as
“Top Earnings Estimators” by StarMine (TEE) outperformed all of the other groups of Stars as
well as their Non-Star peers. The “Top Stock Pickers” (TSP) appear to perform the worst, which
suggests that this ranking has the lowest predictive power for the future profitability of
recommendations. This result might be explained by regression to the mean, whereby the
previous year’s best performers should exhibit results that are closer to the average in subsequent
years. However, we observed significantly positive returns for WSJ and WSJ-1 Stars, which
outperformed Non-Stars in the year after selection, even though there is a decline in performance
compared with the evaluation year. In contrast, the returns for I/I and TEE Stars in the Year
After insignificantly differ from those of the Year Before.
An additional point to consider concerns differences in what particular rating methodologies
measure: reputation or status. According to Sorenson (2014), reputation is based on previous
visible performance, while status is attributed more to social recognition and is not necessarily
associated with high quality performance. In terms of this distinction, Top Earnings Estimators,
Top Stock Pickers and The Wall Street Journal provide Reputation-based rankings, which
indeed reflect the past performance of analysts. Consistent with this theory, these rankings
should not be considered “popularity contests,” as concluded by Emery and Li (2009). Rather,
they reflect strong performance in the past, which may (or may not) be a good proxy for future
performance. Another question is how strong is the predictive power of these rankings? In our
study, we show that the WSJ and TSP ratings do reflect strong performance in the past; however,
TSP has not the same high predictive power for the future, and TEE is the only rating with a
better performance the Year After than the Year Before.
At the same time, the ranking by Institutional Investor magazine is based on a survey, which
clearly measures recognition rather than pure performance. Thus, this ranking reflects the Status
of selected analysts and might not be directly related to strong performance. This view is
consistent with the fact that analysts listed by I/I usually work in large, high-status banks (Emery
and Li, 2009). But, our study shows that analysts’ performance in the year preceding election to
the I/I star ranking does differ from that of the group of Non-Stars, while after the list of I/I Stars
16
is published, the profitability from returns decreases slightly. We interpret this fact as it is
difficult to be ranked as a Star without performing better than Non-Stars in the Year Before.
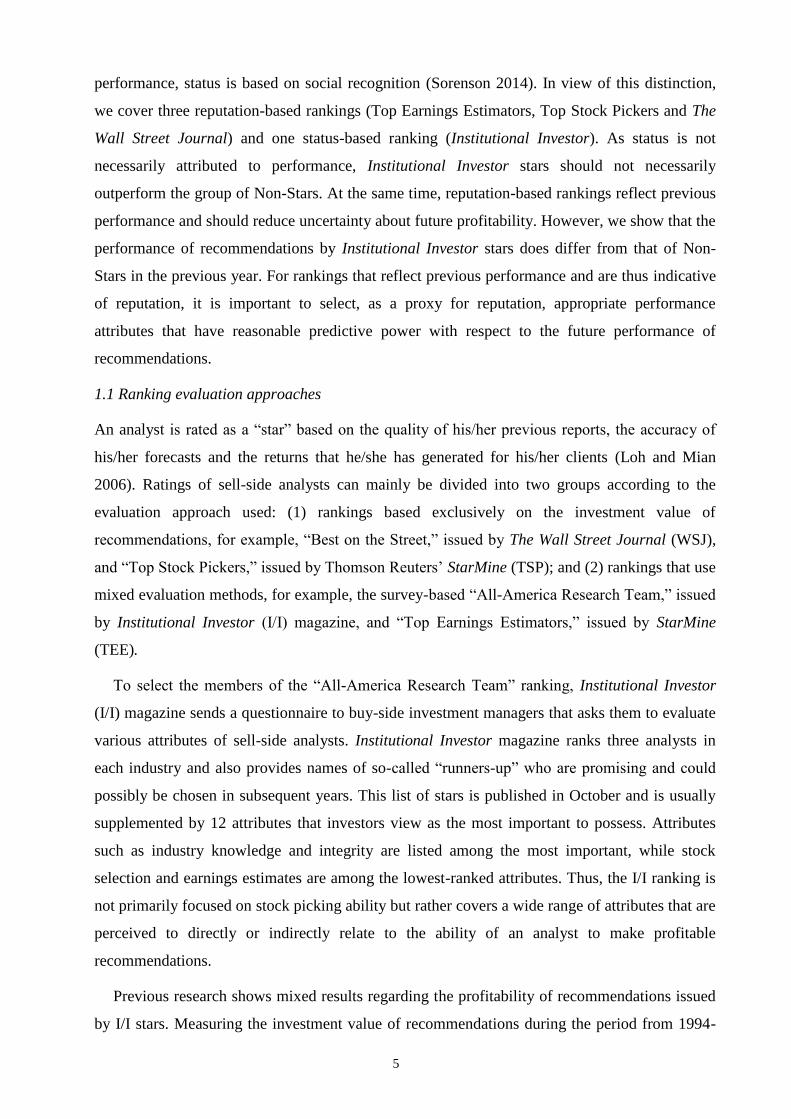
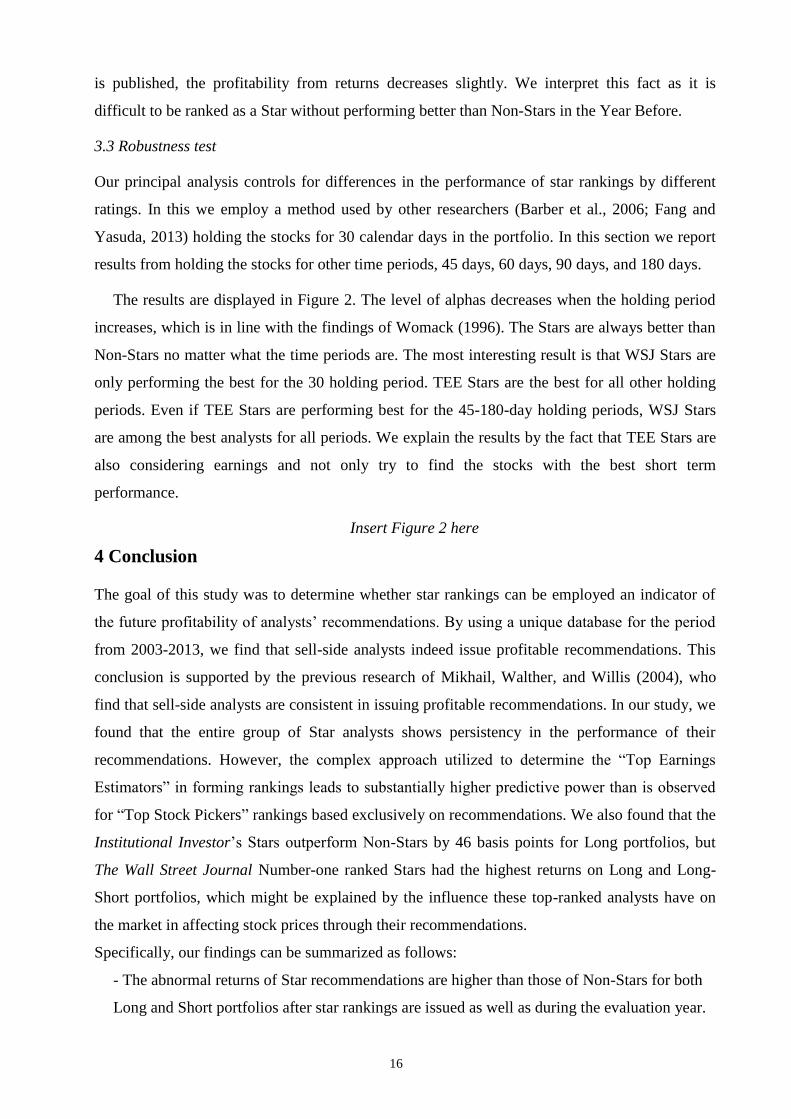
3.3 Robustness test
Our principal analysis controls for differences in the performance of star rankings by different
ratings. In this we employ a method used by other researchers (Barber et al., 2006; Fang and
Yasuda, 2013) holding the stocks for 30 calendar days in the portfolio. In this section we report
results from holding the stocks for other time periods, 45 days, 60 days, 90 days, and 180 days.
The results are displayed in Figure 2. The level of alphas decreases when the holding period
increases, which is in line with the findings of Womack (1996). The Stars are always better than
Non-Stars no matter what the time periods are. The most interesting result is that WSJ Stars are
only performing the best for the 30 holding period. TEE Stars are the best for all other holding
periods. Even if TEE Stars are performing best for the 45-180-day holding periods, WSJ Stars
are among the best analysts for all periods. We explain the results by the fact that TEE Stars are
also considering earnings and not only try to find the stocks with the best short term
performance.
Insert Figure 2 here
4 Conclusion
The goal of this study was to determine whether star rankings can be employed an indicator of
the future profitability of analysts’ recommendations. By using a unique database for the period
from 2003-2013, we find that sell-side analysts indeed issue profitable recommendations. This
conclusion is supported by the previous research of Mikhail, Walther, and Willis (2004), who
find that sell-side analysts are consistent in issuing profitable recommendations. In our study, we
found that the entire group of Star analysts shows persistency in the performance of their
recommendations. However, the complex approach utilized to determine the “Top Earnings
Estimators” in forming rankings leads to substantially higher predictive power than is observed
for “Top Stock Pickers” rankings based exclusively on recommendations. We also found that the
Institutional Investor’s Stars outperform Non-Stars by 46 basis points for Long portfolios, but
The Wall Street Journal Number-one ranked Stars had the highest returns on Long and Long-
Short portfolios, which might be explained by the influence these top-ranked analysts have on
the market in affecting stock prices through their recommendations.
Specifically, our findings can be summarized as follows:
- The abnormal returns of Star recommendations are higher than those of Non-Stars for both
Long and Short portfolios after star rankings are issued as well as during the evaluation year.
17
Additionally, Stars outperform Non-Stars as measured by the frequency of months in which
they have higher raw returns.
- Each “Long” portfolio of Star analysts (WSJ, I/I, TEE, and TSP) performed better than the
“Long” portfolio of Non-Stars. However, the “Short” portfolios of TSP had lower alphas. All
four overall portfolios (Long-Short) of the Stars perform better than the Long-Short portfolio
of Non-Stars.
- The “Long” portfolios of analysts ranked exclusively by the performance of their
recommendations (WSJ and TSP) had bigger drops in alphas than those of the TEE and I/I
Stars in the subsequent year.
- The WSJ and TSP have the highest percentages of the same analysts appearing in both
rankings in the same year (with an average of 31 percent of analysts), while the WSJ and I/I
have the lowest percentages of interdependence (9 percent on average). Similar results are
observed for Number-one ranked Analysts among the four investigated groups.
- The performance of the WSJ, I/I, and TSP analysts declines in the year following election as
a star, while TEE analysts show an increase in the investment value of their
recommendations.
- For investors not wanting to trade every month TEE analysts are the best to work with.
Thus, there is strong evidence that star rankings that employ a mixed evaluation approach can
identify analysts who have persistent stock picking ability. Their recommendations outperform
those of Non-Stars and of other groups ranked only according to the past profitability of their
recommendations except for analysts ranked by “The Wall Street Journal”. An important finding
is that the survey-based ranking of Institutional Investor magazine of Number-one ranked
Analysts shows the third highest investment value of recommendations, even though
Institutional Investor’s evaluation methodology is qualitative.
In summary, the choice of which analysts to work with is of great importance for the long-
term growth of an investor’s portfolio. In our study, we provided empirical evidence regarding
which star rankings of sell-side analysts a potential investor should have relied on, namely, “The
Wall Street Journal” and the StarMine “Top Earnings Estimators” Additionally, our results
show that stock picking ability reflects a set of skills that can be captured using mixed evaluation
methods such as surveys or other methods that consider recommendations and earnings forecasts
simultaneously.
18
References
Barber, B. M., R. Lehavy, M. McNichols, and B. Trueman, 2001, "Can Investors Profit from the
Prophets? Security Analyst Recommendations and Stock Returns," The Journal of Finance 56, 531–63.
Barber, B. M., R. Lehavy, M. McNichols, and B. Trueman, 2006, "Buys, Holds, and Sells: The
Distribution of Investment Banks’ Stock Ratings and the Implications for the Profitability of Analysts’
Recommendations," Journal of Accounting and Economics 41, 87–117.
Barber, B. M., R. Lehavy, and B. Trueman, 2010, "Ratings Changes, Ratings Levels, and the Predictive
Value of Analysts’ Recommendations," Financial Management 39, 533–53.
Beyer, A., and I. Guttman, 2011, "The Effect of Trading Volume on Analysts’ Forecast Bias," The
Accounting Review 86, 451–81.
Boni, L., and K. L. Womack, 2006, "Analysts, Industries, and Price Momentum," Journal of Financial
and Quantitative Analysis 41, 85–109.
Carhart, M. M., 1997, On Persistence in Mutual Fund Performance. Journal of Finance 52, 57–82.
Emery, D. R., and X. Li, 2009, "Are the Wall Street Analyst Rankings Popularity Contests?" Journal of
Financial and Quantitative Analysis 44, 411.
Ertimur, Y., W. J. Mayew, and S. R. Stubben, 2011, Analyst Reputation and the Issuance of
Disaggregated Earnings Forecasts to I/B/E/S. Review of Accounting Studies 16, 29–58.
Fang, L. H., and A. Yasuda, 2013, "Are Stars’ Opinions Worth More? The Relation Between Analyst
Reputation and Recommendation Values," Journal of Financial Services Research 46, 235-269.
Kerl, A., and M. Ohlert, 2015, "Star-Analysts’ Forecast Accuracy and the Role of Corporate
Governance," Journal of Financial Research 38, 93-120.
Kim, M. S., and F. Zapatero, 2011, "Competitive Compensation and Dispersion in Analysts’
Recommendations," Available at SSRN 1569888 .
Leone, A., and J. Wu., 2007, "What Does It Take to Become a Superstar? Evidence from Institutional
Investor Rankings of Financial Analysts. Evidence from Institutional Investor Rankings of Financial
Analysts," Simon School of Business Working Paper No. FR, 02–12.
Loh, R. K., 2010, "Investor Inattention and the Underreaction to Stock Recommendations." Financial
Management 39, 1223–52.
Loh, R. K., and G. M. Mian, 2006, "Do Accurate Earnings Forecasts Facilitate Superior Investment
Recommendations?" Journal of Financial Economics 80, 455–83.
Mikhail, M. B., B. R. Walther, and R. H. Willis, 2004, "Do Security Analysts Exhibit Persistent
Differences in Stock Picking Ability?" Journal of Financial Economics 74, 67–91.
Sorenson, O., 2014, "Status and Reputation: Synonyms or Separate Concepts?" Strategic Organization
12, 62–69.
Stickel, S. E., 1995, "Anatomy of the Performance of Buy and Sell Recommentastions." Financial
Analysts Journal 51, 25–39.
Womack, K. L. 1996. "Do Brokerage Analysts’ Recommendations Have Investment Value?" The Journal
of Finance 51, 137–67.
Yaros, J. R., and T. Imielinski, 2013, "A Monte Carlo Measure to Improve Fairness in Equity Analyst
Evaluation," Working Paper.
19
Tables and Figures
Table I. Number of firms and percentage of firms in the sample covered by each group,
calculated on an election-year basis. Rankings by The Wall Street Journal (WSJ), Institutional
Investor (I/I), and Thomson Reuters’ StarMine “Top Stock Pickers” (TSP) and “Top Earnings
Estimators” (TEE). Indexation by -1 signifies a Number-one ranked Analyst. Each group of star
analysts covers approximately 50 percent of firms in the sample. Thus, the coverage universe
differs for the various groups of stars. Number-one ranked I/I Analysts cover half of the firms of
the entire group of I/I Stars (which includes 3 other ranking positions).
Election year
Total number of firms
Portion of firms covered by Portion of firms covered by Number-one ranked Stars entire groups of Stars
WSJ I/I TEE TSP WSJ-1 I/I-1 TEE-1 TSP-1
2003 1994 61% 63% 38% 39%
18% 15% 15% 15%
2004 1994 63% 52% 36% 41%
19% 14% 14% 17%
2005 2042 60% 52% 37% 40%
18% 16% 16% 16%
2006 2131 56% 51% 47% 49%
15% 21% 21% 23%
2007 2270 60% 45% 43% 43%
14% 19% 19% 19%
2008 2119 53% 50% 51% 52%
15% 26% 26% 26%
2009 1879 55% 38% 53% 52%
17% 22% 22% 22%
2010 2028 60% 23% 51% 53%
17% 25% 25% 24%
2011 1921 61% 25% 48% 49%
18% 20% 20% 22%
2012 2010 41% 44% 52% 48%
17% 22% 22% 21%
2013 1829 46% 39% 49% 47% 20% 22% 22% 20%
Average 2020 56% 44% 46% 47%
17% 20% 20% 21%
Overall 5109 82% 54% 69% 74%
45% 32% 43% 49%

20
Table II. Number of analysts and the percentage of each group represented in the sample
on an election-year basis. Rankings by The Wall Street Journal (WSJ), Institutional Investor
(I/I), and Thomson Reuters’ StarMine “Top Stock Pickers” (TSP) and “Top Earnings
Estimators” (TEE). Indexation by -1 signifies a Number-one ranked Analyst. On average, there
were 13 percent of star analysts per year.
Election year
All analysts
Non-Stars ever elected
as stars
Portion of analysts in entire groups of Stars
Portion of analysts in
Number-one ranked Stars
Stars WSJ I/I TEE TSP WSJ-1 I/I-1 TEE-1 TSP-1
2003 4099 12% 13% 5% 6% 3% 3%
1% 1% 1% 1%
2004 3878 13% 14% 5% 6% 3% 3%
1% 1% 1% 1%
2005 3827 14% 15% 5% 7% 4% 3%
1% 2% 1% 1%
2006 3884 14% 15% 5% 6% 4% 4%
1% 1% 1% 1%
2007 3957 15% 15% 5% 6% 4% 4%
1% 1% 1% 1%
2008 3922 15% 15% 5% 6% 4% 4%
1% 1% 1% 1%
2009 3681 13% 13% 5% 3% 5% 4%
1% 1% 2% 1%
2010 3683 12% 13% 5% 2% 4% 4%
1% 2% 2% 1%
2011 3665 13% 13% 6% 1% 4% 4%
1% 1% 2% 2%
2012 3726 14% 13% 3% 5% 4% 4%
1% 1% 2% 1%
2013 3212 15% 15% 4% 4% 5% 5% 1% 2% 2% 2%
Average 3776 14% 14% 5% 5% 4% 4%
1% 1% 1% 1%
Overall 11286 21% 20% 12% 5% 9% 9%
3% 1% 4% 4%
21
Table III. Number of recommendations and the percentage of Star recommendations on an
election-year basis by each ranking. Rankings by The Wall Street Journal (WSJ), Institutional
Investor (I/I), and Thomson Reuters’ StarMine “Top Stock Pickers” (TSP) and “Top Earnings
Estimators” (TEE). Indexation by -1 signifies a Number-one ranked Analyst.
Election year Entire sample All Stars Entire groups of Stars Number-one ranked Stars
WSJ I/I TEE TSP WSJ-1 I/I-1 TEE-1 TSP-1
2003 29353 25% 10% 12% 5% 5%
2% 3% 2% 1%
2004 25252 26% 11% 10% 5% 6%
3% 2% 2% 2%
2005 25059 26% 11% 10% 5% 6%
2% 2% 2% 2%
2006 24245 28% 10% 10% 8% 8%
2% 2% 3% 3%
2007 27000 30% 13% 9% 7% 10%
5% 2% 2% 3%
2008 27966 30% 11% 9% 8% 9%
4% 2% 3% 4%
2009 23936 27% 11% 6% 8% 10%
4% 2% 3% 3%
2010 25209 24% 10% 3% 8% 8%
2% 3% 3% 3%
2011 22641 24% 11% 3% 7% 7%
2% 3% 3% 2%
2012 25845 24% 6% 8% 8% 7%
2% 2% 3% 3%
2013 16851 27% 9% 7% 9% 8% 3% 2% 3% 3%
Average 24851 27% 10% 8% 7% 8%
3% 2% 3% 3%
Overall 177308 33% 14% 10% 10% 11%
4% 3% 4% 4%
22
Table IV. Average percentage of interdependence among rankings, average number of analysts listed in particular groups and the proportion
of the same analysts in each ranking list. Panel A presents the data for entire groups of Stars, while Panel B reports results for Number-one ranked
Stars. The final line shows the average for each value. Comparisons are made on an election-year basis. Rankings by The Wall Street Journal (WSJ),
Institutional Investor (I/I), and Thomson Reuters’ StarMine “Top Stock Pickers” (TSP) and “Top Earnings Estimators” (TEE). Indexation by -1
signifies a Number-one ranked Analyst. The highest correlation is between WSJ and TSP; the lowest is between WSJ and I/I.
Panel A. Entire groups of Stars
Year
Number of Star analysts
Number of the same analysts
Proportion of the same analysts (# of the same analysts/# of Star analysts)
I/I WSJ TSP TEE I/I &
WSJ
I/I &
TSP
I/I &
TEE
WSJ &
TSP
WSJ &
TEE
TSP &
TEE
WSJ in I/I
TSP in I/I
TEE in I/I
I/I in
WSJ
TSP in
WSJ
TEE in
WSJ
I/I In
TSP
WSJ in
TSP
TEE in
TSP
I/I In
TEE
WSJ in
TEE
TSP in
TEE
2003 271 212 121 111
41 30 41 55 25 16
15% 11% 15% 19% 26% 12% 25% 45% 13% 37% 23% 14%
2004 259 203 121 125
24 22 32 57 21 13
9% 8% 12% 12% 28% 10% 18% 47% 11% 26% 17% 10%
2005 273 196 135 140
23 21 32 54 17 19
8% 8% 12% 12% 28% 9% 16% 40% 14% 23% 12% 14%
2006 257 198 158 164
21 17 40 64 20 36
8% 7% 16% 11% 32% 10% 11% 41% 23% 24% 12% 22%
2007 247 201 150 165
14 23 26 56 25 31
6% 9% 11% 7% 28% 12% 15% 37% 21% 16% 15% 19%
2008 236 196 156 166
15 23 26 50 19 35
6% 10% 11% 8% 26% 10% 15% 32% 22% 16% 11% 21%
2009 118 188 159 172
18 20 15 43 27 33
15% 17% 13% 10% 23% 14% 13% 27% 21% 9% 16% 19%
2010 57 208 158 164
7 9 6 52 26 28
12% 16% 11% 3% 25% 13% 6% 33% 18% 4% 16% 17%
2011 54 210 162 164
4 3 5 61 23 31
7% 6% 9% 2% 29% 11% 2% 38% 19% 3% 14% 19%
2012 178 122 153 168
8 12 17 30 9 34
4% 7% 10% 7% 25% 7% 8% 20% 22% 10% 5% 20%
2013 149 124 163 170
8 18 16 33 11 29
5% 12% 11% 6% 27% 9% 11% 20% 18% 9% 6% 17%
Avg. 191 187 148 155 17 18 23 50 20 28 9% 10% 12% 9% 27% 11% 13% 35% 18% 16% 13% 18%
23
Panel B. Number-one ranked Analysts
Year
Number of Star analysts
Number of the same analysts
Proportion of the same analysts
I/I-1 WSJ-1 TSP-1 TEE-1 I/I-1
& WSJ-1
I/I-1 &
TSP-1
I/I-1 &
TEE-1
WSJ-1 &
TSP-1
WSJ-1 &
TEE-1
TSP-1 &
TEE-1
WSJ-1 in
I/I-1
TSP-1 in
I/I-1
TEE-1 in
I/I-1
I/I-1 in
WSJ-1
TSP-1 in
WSJ-1
TEE-1 in
WSJ-1
I/I-1 in
TSP-1
WSJ-1 in
TSP-1
TEE-1 in
TSP-1
I/I-1 in
TEE-1
WSJ-1 in
TEE-1
TSP-1 in
TEE-1
2003 55 42 41 39
3 1 5 7 0 2
5% 2% 9% 7% 17% 0% 2% 17% 5% 13% 0% 5%
2004 60 44 43 44
1 1 4 6 1 1
2% 2% 7% 2% 14% 2% 2% 14% 2% 9% 2% 2%
2005 60 40 45 50
0 3 3 7 2 4
0% 5% 5% 0% 18% 5% 7% 16% 9% 6% 4% 8%
2006 59 41 59 57
1 2 3 9 2 10
2% 3% 5% 2% 22% 5% 3% 15% 17% 5% 4% 18%
2007 55 39 56 58
0 2 1 8 0 5
0% 4% 2% 0% 21% 0% 4% 14% 9% 2% 0% 9%
2008 56 40 60 57
0 3 3 6 2 6
0% 5% 5% 0% 15% 5% 5% 10% 10% 5% 4% 11%
2009 43 37 54 57
0 2 2 6 2 4
0% 5% 5% 0% 16% 5% 4% 11% 7% 4% 4% 7%
2010 57 43 57 61
1 3 2 6 1 4
2% 5% 4% 2% 14% 2% 5% 11% 7% 3% 2% 7%
2011 54 43 58 57
1 1 2 4 2 3
2% 2% 4% 2% 9% 5% 2% 7% 5% 4% 4% 5%
2012 37 40 54 56
0 1 2 5 0 7
0% 3% 5% 0% 13% 0% 2% 9% 13% 4% 0% 13%
2013 53 43 60 61
0 0 1 3 0 3
0% 0% 2% 0% 7% 0% 0% 5% 5% 2% 0% 5%
Avg. 54 41 53 54 1 2 3 6 1 4 1% 3% 5% 2% 15% 3% 3% 12% 8% 5% 2% 8%
24
Table V. Monthly abnormal returns (alphas) for groups of Star and Non-Star analysts and
differences in abnormal returns.
Rankings by The Wall Street Journal (WSJ), Institutional Investor (I/I), and Thomson Reuters’ StarMine “Top
Stock Pickers” (TSP) and “Top Earnings Estimators” (TEE). Portfolios are built according to recommendations:
when a new recommendation is announced, 1 USD is invested in the recommended stock by the end of the trading
day (or on the next trading day if the recommendation is issued after the closing of trading or is announced on a
non-trading day), and the stock is held for the next 30 calendar days or until the same analyst changes his or her
recommendation or drops coverage, in which case the stock is withdrawn by the end of that trading day. All figures
are obtained as intercepts from the regressions of the monthly returns time series from two sample periods: the Year
Before (January 2002 – December 2012) and the Year After (November 2003 – December 2013) on four standard
risk factors (Carhart’s four-factor model). The Long portfolio includes Buy and Strong Buy recommendations, while
the Short portfolio includes all Hold, Sell, and Strong Sell recommendations. Recommendations issued by both
groups outperformed the market and showed statistically significant positive abnormal returns. Buy and Sell
recommendations by Star analysts have higher abnormal returns than recommendations by Non-Stars in the year
after election as well as during the evaluation year. Star analysts persistently outperform Non-Stars.
Average monthly abnormal
returns (%)
Overall groups
Difference
Stars – Non-Stars
Portfolio Stars Non-Stars
Panel A. Year After (November 2003 – December 2013)
Long: Strong Buy/Buy 1.03
***
(0.14) 0.66
***
(0.11) 0.38
***
(0.13)
Short: Hold/Sell/ Strong
Sell -0.37
***
(0.13) -0.20
*
(0.11) -0.16
(0.13)
Long-Short 1.40
***
(0.17) 0.86
***
(0.11)
0.54***
(0.16)
Panel B. Year Before (January 2002 – December 2012)
Long 1.67
***
(0.12) 0.79
***
(0.12) 0.88
***
(0.12)
Short -0.45
***
(0.12) -0.11 (0.13)
-0.35***
(0.13)
Long-Short 2.13
***
(0.15) 0.90
***
(0.13)
1.23***
(0.15)
Panel C. Difference Year After – Year Before (SUEST TEST)
Long -0.64***
-0.13*
--
Short 0.08 -0.09 --
Long-Short -0.73***
0.04 --
Standard errors in parentheses
*** p<0.01, ** p<0.05, * p<0.1
25
Table VI. Average monthly abnormal returns (alphas) for each group of Star analysts.
Rankings by The Wall Street Journal (WSJ), Institutional Investor (I/I), and Thomson Reuters’ StarMine “Top
Stock Pickers” (TSP) and “Top Earnings Estimators” (TEE). Portfolios are built according to recommendations:
when a new recommendation is announced, 1 USD is invested in the recommended stock by the end of the trading
day (or on the next trading day if the recommendation is issued after the closing of trading or is announced on a
non-trading day), and the stock is held for the next 30 calendar days or until the same analyst changes his or her
recommendation or drops coverage, in which case the stock is withdrawn by the end of that trading day. All figures
are obtained as intercepts from the regressions of the monthly returns time series from two sample periods: the Year
Before (January 2002 – December 2012) and the Year After (November 2003 – December 2013) on four standard
risk factors (Carhart’s four-factor model). The Long portfolio includes Buy and Strong Buy recommendations, while
the Short portfolio includes all Hold, Sell, and Strong Sell recommendations. The highest abnormal returns in the
Year After were generated by recommendations by TEE, while the lowest were observed for I/I and TSP. The
highest alpha among the Long portfolios was observed for TEE; the lowest was observed for TSP.
Portfolio
Average monthly abnormal returns (%)
Entire groups of Star analysts
WSJ I/I TEE TSP
Panel A. Year After (November 2003 – December 2013)
Long: Strong Buy/Buy 1.07
***
(0.20) 1.12
***
(0.20) 1.01
***
(0.21) 0.98
***
(0.20)
Short: Hold/Sell/
Strong Sell
-0.51***
(0.19)
-0.30 (0.20)
-0.52**
(0.23)
-0.01 (0.20)
Long-Short 1.58
***
(0.25) 1.42
***
(0.26) 1.52
***
(0.29) 1.00
***
(0.26)
Panel B. Year Before (January 2002 – December 2012)
Long 2.73
***
(0.20) 1.37
***
(0.24) 0.89
***
(0.20) 2.34
***
(0.18)
Short -0.57
***
(0.16) -0.19 -0.48
**
(0.19) -0.63
***
(0.18) (0.22)
Long-Short 3.29
***
(0.25) 1.56
***
(0.32) 1.37
***
(0.25) 2.97
***
(0.22)
Panel C. Difference Year After – Year Before (SUEST TEST)
Long -1.66***
-0.25 0.12 -1.36***
Short 0.06 -0.11 -0.04 0.62***
Long-Short -1.71***
-0.14 0.14 -1.98***
Standard errors in parentheses
*** p<0.01, ** p<0.05, * p<0.1
26
Table VII. Average monthly abnormal returns (alphas) for each group of Number-one
ranked Analysts.
Rankings by The Wall Street Journal (WSJ), Institutional Investor (I/I), and Thomson Reuters’ StarMine “Top
Stock Pickers” (TSP) and “Top Earnings Estimators” (TEE). Indexation by -1 signifies a Number-one ranked
Analyst. Portfolios are built according to recommendations: when a new recommendation is announced, 1 USD is
invested in the recommended stock by the end of the trading day (or on the next trading day if the recommendation
is issued after the closing of trading or is announced on a non-trading day), and the stock is held for the next 30
calendar days or until the same analyst changes his or her recommendation or drops coverage, in which case the
stock is withdrawn by the end of that trading day. All figures are obtained as intercepts from the regressions of the
monthly returns time series from two sample periods: the Year Before (January 2002 – December 2012) and the
Year After (November 2003 – December 2013) on four standard risk factors (Carhart’s four-factor model). The
Long portfolio includes Buy and Strong Buy recommendations, while the Short portfolio includes all Hold, Sell, and
Strong Sell recommendations. The highest return of a Long-Short portfolio is observed for I/I-1 analysts, while the
lowest is observed for TSP-1. Statistically insignificant abnormal returns were observed for the Short portfolio of
WSJ-1, the Long portfolio of TSP-1 in the year after selection, and the Long-Short portfolio of TEE-1 during the
evaluation year.
Average monthly abnormal returns (%)
Number-one ranked Star analysts
Portfolio WSJ-1 I/I-1 TEE-1 TSP-1
Panel A. Year After (November 2003 – December 2013)
Long: Strong Buy/Buy 2.15
***
(0.54) 1.25
***
(0.32) 0.80
**
(0.34) 0.88
**
(0.35)
Short: Hold/Sell/ Strong
Sell -0.78
**
(0.34) 0.12 (0.54)
-1.16***
(0.37)
-0.00 (0.36)
Long-Short 2.93***
(0.60) 1.14 (0.62)
1.95***
(0.47) 0.87
*
(0.52)
Panel B. Year Before (January 2002 – December 2012)
Long 3.32
***
(0.40) 1.13
***
(0.33) 0.69
**
(0.31) 2.34
***
(0.33)
Short -0.33 (0.32)
-0.22 (0.39)
-0.22 (0.33)
-0.62**
(0.31)
Long-Short 3.65
***
(0.51) 1.35
***
(0.50)
0.91**
(0.41) 2.95
***
(0.43)
Panel C. Difference Year After – Year Before (SUEST TEST)
Long -1.17**
0.12 0.11 -1.46***
Short -0.45 0.34 -0.94**
0.62
Long-Short -0.72 -0.21 1.04* -2.08
***
Standard errors in parentheses
*** p<0.01, ** p<0.05, * p<0.1
27
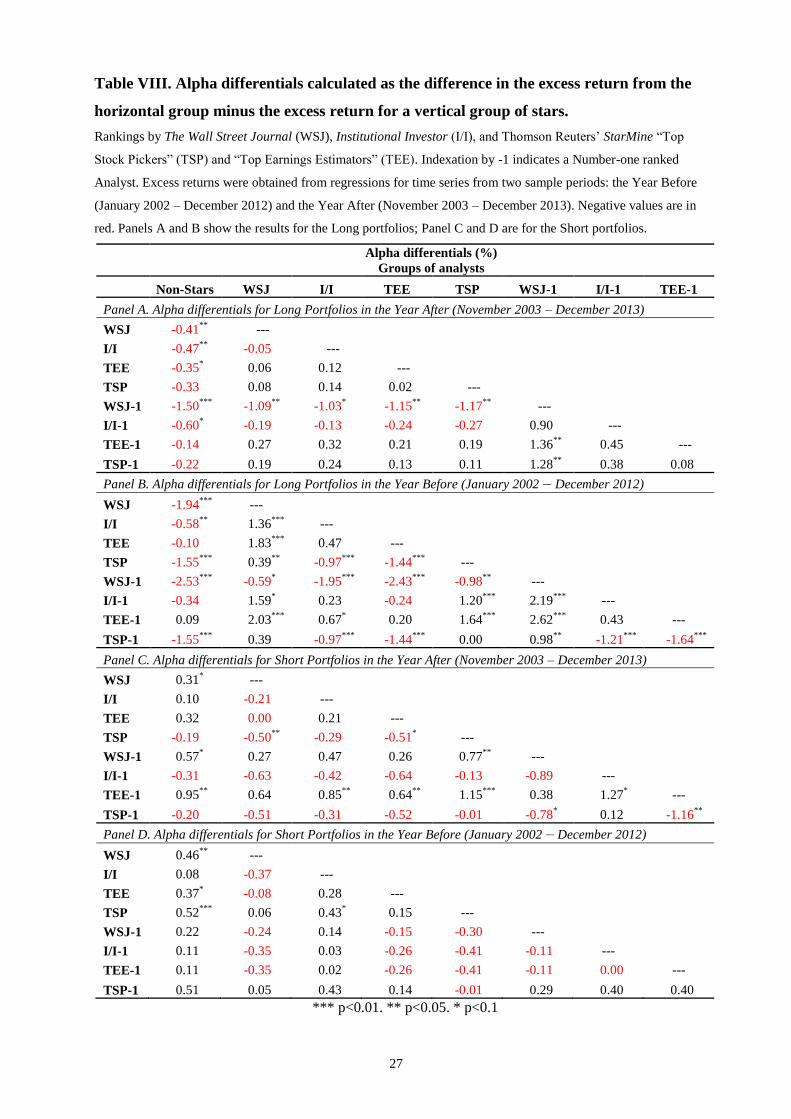
Table VIII. Alpha differentials calculated as the difference in the excess return from the
horizontal group minus the excess return for a vertical group of stars.
Rankings by The Wall Street Journal (WSJ), Institutional Investor (I/I), and Thomson Reuters’ StarMine “Top
Stock Pickers” (TSP) and “Top Earnings Estimators” (TEE). Indexation by -1 indicates a Number-one ranked
Analyst. Excess returns were obtained from regressions for time series from two sample periods: the Year Before
(January 2002 – December 2012) and the Year After (November 2003 – December 2013). Negative values are in
red. Panels A and B show the results for the Long portfolios; Panel C and D are for the Short portfolios.
Alpha differentials (%)
Groups of analysts
Non-Stars WSJ I/I TEE TSP WSJ-1 I/I-1 TEE-1
Panel A. Alpha differentials for Long Portfolios in the Year After (November 2003 – December 2013)
WSJ -0.41**
---
I/I -0.47**
-0.05 ---
TEE -0.35* 0.06 0.12 ---
TSP -0.33 0.08 0.14 0.02 ---
WSJ-1 -1.50***
-1.09**
-1.03* -1.15
** -1.17
** ---
I/I-1 -0.60* -0.19 -0.13 -0.24 -0.27 0.90 ---
TEE-1 -0.14 0.27 0.32 0.21 0.19 1.36**
0.45 ---
TSP-1 -0.22 0.19 0.24 0.13 0.11 1.28**
0.38 0.08
Panel B. Alpha differentials for Long Portfolios in the Year Before (January 2002 – December 2012)
WSJ -1.94***
---
I/I -0.58**
1.36***
---
TEE -0.10 1.83***
0.47 ---
TSP -1.55***
0.39**
-0.97***
-1.44***
---
WSJ-1 -2.53***
-0.59* -1.95
*** -2.43
*** -0.98
** ---
I/I-1 -0.34 1.59* 0.23 -0.24 1.20
*** 2.19
*** ---
TEE-1 0.09 2.03***
0.67* 0.20 1.64
*** 2.62
*** 0.43 ---
TSP-1 -1.55***
0.39 -0.97***
-1.44***
0.00 0.98**
-1.21***
-1.64***
Panel C. Alpha differentials for Short Portfolios in the Year After (November 2003 – December 2013)
WSJ 0.31* ---
I/I 0.10 -0.21 ---
TEE 0.32 0.00 0.21 ---
TSP -0.19 -0.50**
-0.29 -0.51* ---
WSJ-1 0.57* 0.27 0.47 0.26 0.77
** ---
I/I-1 -0.31 -0.63 -0.42 -0.64 -0.13 -0.89 ---
TEE-1 0.95**
0.64 0.85**
0.64**
1.15***
0.38 1.27* ---
TSP-1 -0.20 -0.51 -0.31 -0.52 -0.01 -0.78* 0.12 -1.16
**
Panel D. Alpha differentials for Short Portfolios in the Year Before (January 2002 – December 2012)
WSJ 0.46**
---
I/I 0.08 -0.37 ---
TEE 0.37* -0.08 0.28 ---
TSP 0.52***
0.06 0.43* 0.15 ---
WSJ-1 0.22 -0.24 0.14 -0.15 -0.30 ---
I/I-1 0.11 -0.35 0.03 -0.26 -0.41 -0.11 ---
TEE-1 0.11 -0.35 0.02 -0.26 -0.41 -0.11 0.00 ---
TSP-1 0.51 0.05 0.43 0.14 -0.01 0.29 0.40 0.40
*** p<0.01. ** p<0.05. * p<0.1

28
Figure 1. Frequency of months when a particular group of analysts outperformed the other
groups. Rankings by The Wall Street Journal (WSJ), Institutional Investor (I/I), and Thomson
Reuters’ StarMine “Top Stock Pickers” (TSP) and “Top Earnings Estimators” (TEE). Indexation
by -1 signifies a Number-one ranked Analyst.
44%
56%
42%
58%
0%
10%
20%
30%
40%
50%
60%
70%
NonStars Stars
Freq
ue
ncy
Group of Analysts
Stars and NonStars BuySell
25% 24% 27%
20%
27%
31%
18% 20%
0%
5%
10%
15%
20%
25%
30%
35%
I/I TEE TSP WSJ
Freq
uen
cy
Group of Analysts
Entire groups of Stars Buy Sell
28%
14%
21%
31%
21%
30%
19%
26%
0,0%
5,0%
10,0%
15,0%
20,0%
25,0%
30,0%
35,0%
I/I-1 TEE-1 TSP-1 WSJ-1
Freq
uen
cy
Group of Analysts
Top-Ranked Star anlysts Buy Sell

29
Figure 2. Monthly Excess returns (alphas) for different holding periods. Rankings by The
Wall Street Journal (WSJ), Institutional Investor (I/I), and Thomson Reuters’ StarMine “Top
Stock Pickers” (TSP) and “Top Earnings Estimators” (TEE).
0
0,2
0,4
0,6
0,8
1
1,2
1,4
1,6
1,8
30 45 60 90 180
Mo
nth
ly E
xc
es
s R
etu
rns (
alp
ha
s),
%
Holding period, days
Monthly Excess Returns for different holding periods
WSJ
TEE
IIA
TSP
Non Stars