Dongsoon Lim Department of Economics, Dongeui University ... · Department of Economics, Dongeui...
25
Dongsoon Lim Department of Economics, Dongeui University Youn-Hee Choi KIET(Korean Institute for Industrial Economic & Trade) Korea
-
Upload
hoanghuong -
Category
Documents
-
view
221 -
download
0
Transcript of Dongsoon Lim Department of Economics, Dongeui University ... · Department of Economics, Dongeui...
Dongsoon LimDepartment of Economics, Dongeui University
Youn-Hee ChoiKIET(Korean Institute for Industrial Economic & Trade)
Korea
I. Introduction
II. Brief History of Bio-Industry in Korea: A Statistical View of Survey• 2.1. Classification of Bio-industry Statistics in Korea • 2.2. Brief History of the Korean Bio-industry
III. Economic Impact of Bio-industries in Korea• 3.1. How to capture the Bio-industry in the perspective industrial structure• 3.2. The Economic Impacts of Bio-industry in Korea• 3.3. Forecast of total production in the Korean bio-industry: A strategic plan• 3.4. Non-economic Impacts of Bio-industries in Korea
IV. Concluding remarks

I. Introduction
I. Introduction
Biotechnology: shaping current industries into entirely new ones In our world as well as in Korea Enormous expectations concerning the economic potential of biotechnology.Most researches: based on industry surveys with R&D, Firms’ economic activities, target-oriented for forecasting
2004 OECD Workshop on the Economic Impacts of Biotechnology- insightful methodological approaches to estimate the impacts- introduced some pioneering researches- wide range of defining bio-industries- economic impact would vary depending on the choice of modeling scheme
We Introduce: - discussion on current Korean bio-industry statistics and measuring the economic
impact of biotechnology and the bio-industry- a brief discussion of non-economic and social impacts of the bio-industry in Korea- estimate the economic impact of the bio-industry within the Korean economy by
constructing a bio-industry augmented I-O Table- present the government’s strategic plan for the future of bio-industry and expert
opinions- some findings and implications for future research.
4
II. Brief History of Bio-Industry in Korea: A Statistical View of Survey
•2.1. Classification of Bio-industry Statistics in Korea •2.2. Brief History of the Korean Bio-industry

2.1. Classification of Bio-industry Statistics in Korea
Table 1. Structure of the biotechnology classification system in Korea
II. Brief History of Bio-Industry in Korea: A Statistical View of Survey
Biotechnology Classification system of 13 categoriesReflecting the status of the Korean Bio-industryStructure criteria: the main value-chains used & the object of the technology
Key BiotechnologiesPurpose of the technologiesValue chains
Safety and efficiency
Fusion
Biosecurity andsustainable development
Production
Bioinfornation analysis and application
Biological Material and Cell
Others
Evaluation
Production and Applications
R&D
G. Bioprocess
F. Metabolic engineering
M. Other biotechnology
L. Biosafety and bioefficiency
K. Bioelectronics
J. Nanobiotechnology
I. Envionmental and bioenergy
H. Bioresource production and utilization
E. Systems biology and bioinformatics
C. Other macromolecular engineering
B. Protein engineering
A. Genetic engineering
D. Cell and tissue engineering
6

II. Brief History of Bio-Industry in Korea: A Statistical View of Survey
Table 2. Structure of the bio-industry classification system in Korea
2.2. Brief History of the Korean Bio-industryBio-industry Classification System of 8 categoriesFacilitate Analysis of the Bio-industry & the Economic Impact on the Various Industrial SectorsStructure Criteria: Goods & Services
8. Bioassay, Bioinformatics and R&D service
7. Bioenergy and Bioresources
6. Bioprocesses and equipment
5. Bioelectronics
4. Bioenvironmental
3. Biofoods
2. Biochemicals
1. Biopharmaceuticals
R&D and assay service
Resource and energy
Commodity
Services
Goods
7

II. Brief History of Bio-Industry in Korea: A Statistical View of Survey
Year 1999 2000 2001 2002 2003 2004 CAGR(99-04)
Biopharmaceuticals 30.02 4.94 28.47 -8.92 33.94 13.15 13.23
Biochemicals -3.81 50.78 47.69 50.19 -11.18 42.51 33.46
Biofoods -7.07 65.99 -10.72 91.03 3.40 14.91 27.46
Bioenvironmental -33.44 41.62 138.88 45.56 -5.39 22.51 41.67
Bioelectronics N/A N/A 198.16 -10.80 -15.39 120.59 -
Bioprocesses and equipment 41.12 10.02 66.17 79.36 -37.61 5.79 16.70
Bioenergy and bioresources N/A N/A N/A N/A -68.43 -33.85 N/A
Bioassay, bioinformatics and R&D service N/A 180.05 707.85 -7.61 37.53 47.01 111.44
Total 11.37 29.19 18.27 35.73 9.81 16.39 21.52
Korean Bio-industry has been growing rapidly - CAGR 1999~2004: 22%
Major Driving Force - Political Support from the Government- Entrepreneurship of R&D Oriented Company
Table 3. Growth rate of the Korean bio-industry
8

II. Brief History of Bio-Industry in Korea: A Statistical View of Survey
The Annual Biotechnology Firm Survey by The Korean Ministry MOCIE - In 2004, 640 Companies were active in the Korean Bio-industry- Almost 70% of Biotechnology Firm were small, less than 50 Employees- Production Share: Bio-food 43 %, Bio-Pharmaceutical 40 %- An Average of US$550,000 per firm on Biotechnology R&D
Figure 1. Biotechnology products by area of application in 2004
Source: KIET, 2006.
Biopharmaceutical,40%
Biochemical, 6%
Bioenvironmental, 5%
Bioassay, bioinformatics andR&D service, 3%
Bioprocess andequipment, 2%
Bioelectronics, 1%
Biofood,43%
9
III. Economic Impact of Bio-industries in Korea•3.1. How to capture the Bio-industry in the perspective industrial structure•3.2. The Economic Impacts of Bio-industry in Korea•3.3. Forecast of total production in the Korean bio-industry: A strategic plan•3.4 Non-economic Impacts of Bio-industries in Korea
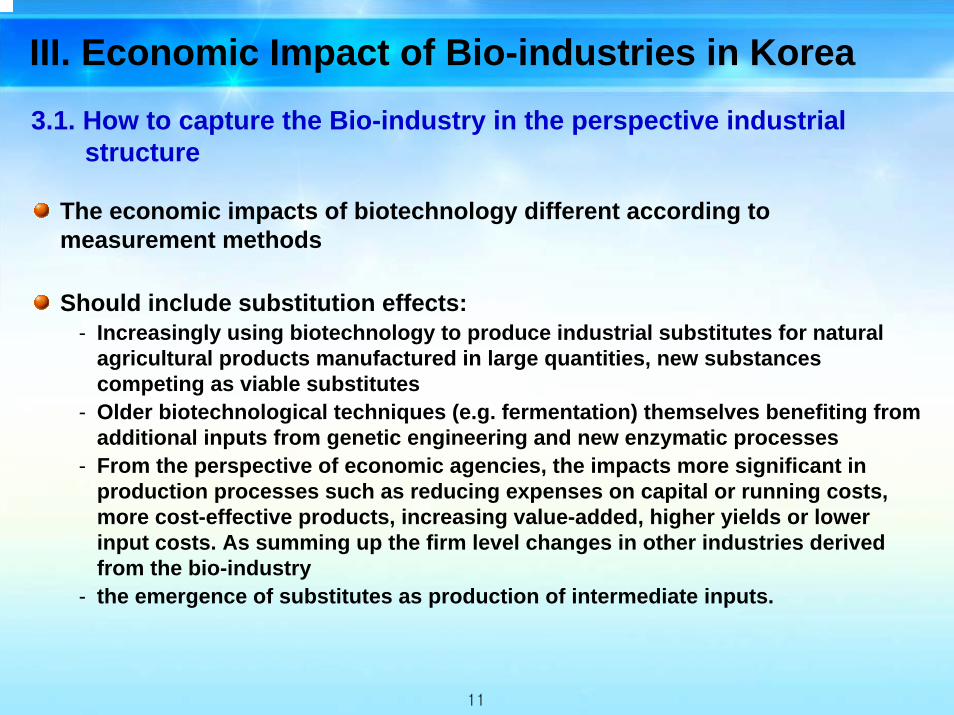
III. Economic Impact of Bio-industries in Korea3.1. How to capture the Bio-industry in the perspective industrial
structure
The economic impacts of biotechnology different according to measurement methods
Should include substitution effects:- Increasingly using biotechnology to produce industrial substitutes for natural
agricultural products manufactured in large quantities, new substances competing as viable substitutes
- Older biotechnological techniques (e.g. fermentation) themselves benefiting from additional inputs from genetic engineering and new enzymatic processes
- From the perspective of economic agencies, the impacts more significant in production processes such as reducing expenses on capital or running costs, more cost-effective products, increasing value-added, higher yields or lower input costs. As summing up the firm level changes in other industries derived from the bio-industry
- the emergence of substitutes as production of intermediate inputs.
11

III. Economic Impact of Bio-industries in KoreaShould include fabrication effects
- Referring to the altered proportion of value-added items of a sector’s total purchases
- Over time, a product of bio-relevant sectors such as Chemicals, Pharmaceuticals, Energy, and Foods depend more on bio-technology capital equipment and/or skilled labors
- a KRW (Korean Won)’s worth of the product embodies proportionately less conventional, industrial inputs and proportionally more value-added inputs
Considering the effects, an input-output analysis a useful tool in capturing the overall impacts of the biotechnology industry
- a static input-output model is sufficient to determine the impact of new technologies on economy (Duchin and Lange, 1994)
- In order to investigate the penetration of new technologies, a dynamic approach is required.
12
An optimal aggregation to include bio-industry as a separate sector also important
- may miss important information from over-aggregation within the bio-industry - may be violating the homogeneity hypothesis from under-aggregation

A1 = A1a + A1b, Y1 = Y1a + Y1b, VA1 = VA1a + VA1b
where,A: intermediate transactions, Y: final demand,VA: Value-added1: conventional sectors such as Chemicals, Pharmaceuticals,
Energy, and Foods,1a: conventional sectors – relevant bio-subsectors, 1b: relevant bio-subsectors
III. Economic Impact of Bio-industries in Korea3.2. The Economic Impacts of Bio-industry in Korea
To estimate the economic impact of the bio-industry on the Korean economy,
- Construct an I-O framework with augmentation of separate bio-industries- Include the bio-industries as new sectors, based on the survey results. - Within the existing I-O of n sectors, create bio-industry sectors as n+1st to n+m
sector.
To resolve the previous two questions, substitution and fabrication effects, - utilizes a survey of existing bio-firms in Korea and applies RAS to establish the
Korea Bio-augmented I-O (KB I-O) 13
III. Economic Impact of Bio-industries in Korea
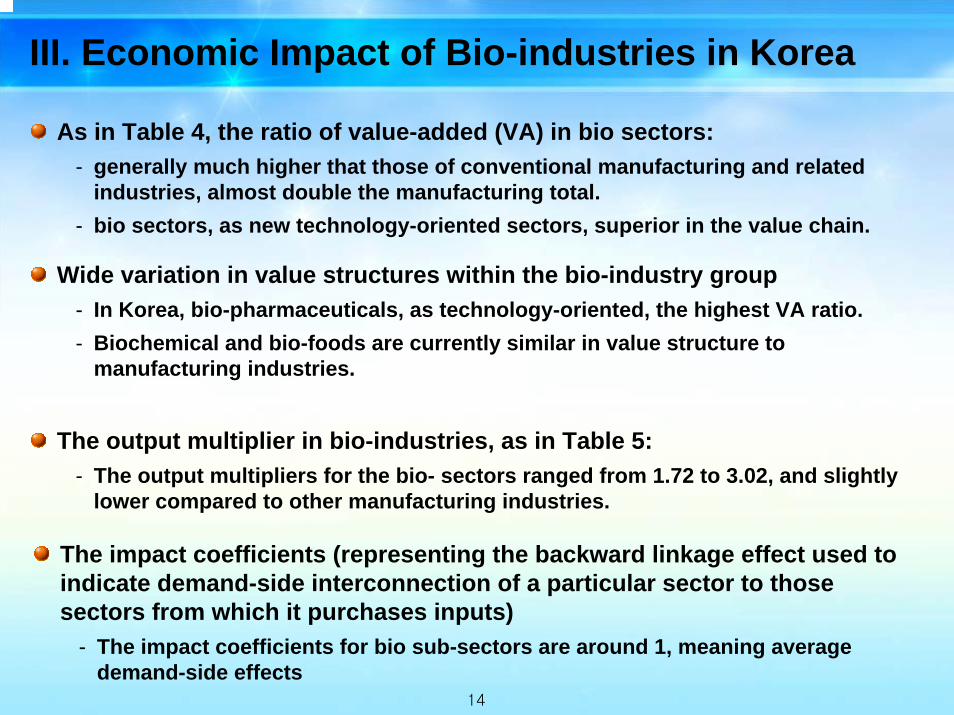
As in Table 4, the ratio of value-added (VA) in bio sectors: - generally much higher that those of conventional manufacturing and related
industries, almost double the manufacturing total. - bio sectors, as new technology-oriented sectors, superior in the value chain.
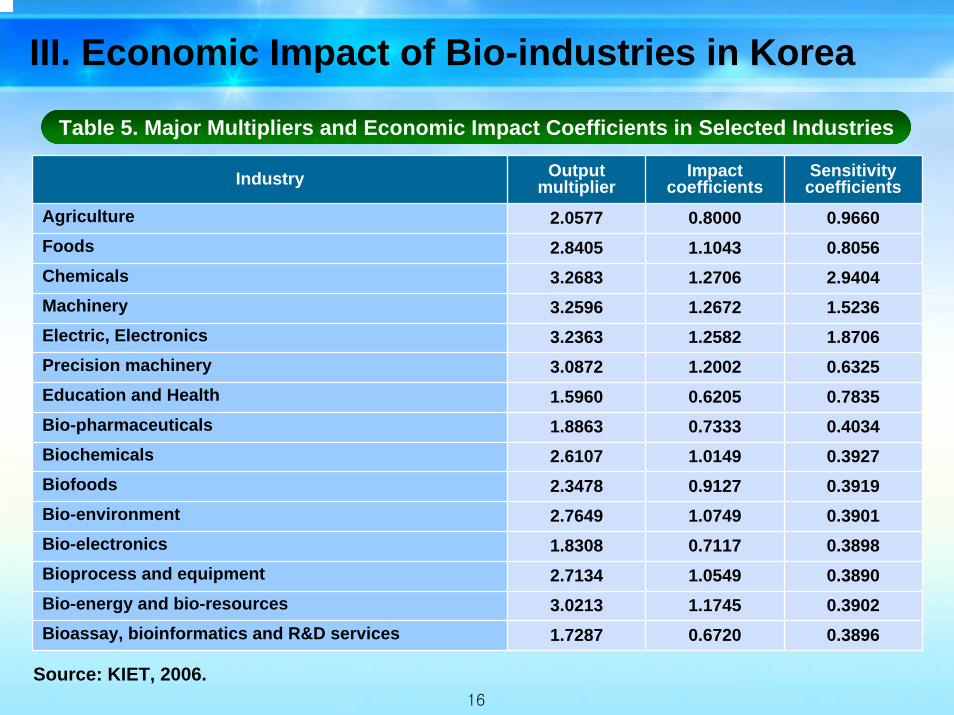
The output multiplier in bio-industries, as in Table 5: - The output multipliers for the bio- sectors ranged from 1.72 to 3.02, and slightly
lower compared to other manufacturing industries.
The impact coefficients (representing the backward linkage effect used to indicate demand-side interconnection of a particular sector to those sectors from which it purchases inputs)
- The impact coefficients for bio sub-sectors are around 1, meaning average demand-side effects
14
Wide variation in value structures within the bio-industry group- In Korea, bio-pharmaceuticals, as technology-oriented, the highest VA ratio.- Biochemical and bio-foods are currently similar in value structure to
manufacturing industries.
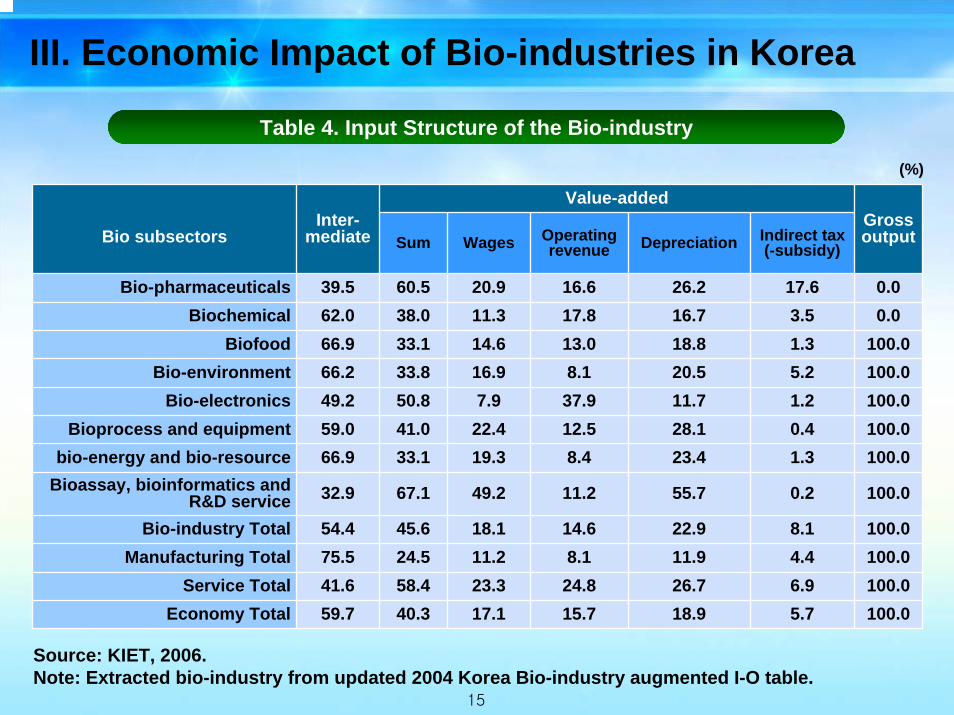
Value-added
Bio subsectorsInter-
mediate Sum Wages Operating revenue Depreciation Indirect tax
(-subsidy)
Bio-pharmaceuticals 39.5 60.5 20.9 16.6 26.2 17.6 0.0Biochemical 62.0 38.0 11.3 17.8 16.7 3.5 0.0
Biofood 66.9 33.1 14.6 13.0 18.8 1.3 100.0Bio-environment 66.2 33.8 16.9 8.1 20.5 5.2 100.0
Bio-electronics 49.2 50.8 7.9 37.9 11.7 1.2 100.0Bioprocess and equipment 59.0 41.0 22.4 12.5 28.1 0.4 100.0
bio-energy and bio-resource 66.9 33.1 19.3 8.4 23.4 1.3 100.0Bioassay, bioinformatics and
R&D service 32.9 67.1 49.2 11.2 55.7 0.2 100.0
Bio-industry Total 54.4 45.6 18.1 14.6 22.9 8.1 100.0Manufacturing Total 75.5 24.5 11.2 8.1 11.9 4.4 100.0
Service Total 41.6 58.4 23.3 24.8 26.7 6.9 100.0Economy Total 59.7 40.3 17.1 15.7 18.9 5.7 100.0
Gross output
Source: KIET, 2006. Note: Extracted bio-industry from updated 2004 Korea Bio-industry augmented I-O table.
III. Economic Impact of Bio-industries in Korea
Table 4. Input Structure of the Bio-industry
(%)
15
Industry Output multiplier
Impact coefficients
Sensitivity coefficients
Agriculture 2.0577 0.8000 0.9660Foods 2.8405 1.1043 0.8056Chemicals 3.2683 1.2706 2.9404Machinery 3.2596 1.2672 1.5236Electric, Electronics 3.2363 1.2582 1.8706Precision machinery 3.0872 1.2002 0.6325Education and Health 1.5960 0.6205 0.7835Bio-pharmaceuticals 1.8863 0.7333 0.4034Biochemicals 2.6107 1.0149 0.3927Biofoods 2.3478 0.9127 0.3919Bio-environment 2.7649 1.0749 0.3901Bio-electronics 1.8308 0.7117 0.3898Bioprocess and equipment 2.7134 1.0549 0.3890Bio-energy and bio-resources 3.0213 1.1745 0.3902Bioassay, bioinformatics and R&D services 1.7287 0.6720 0.3896
III. Economic Impact of Bio-industries in Korea
Source: KIET, 2006.
Table 5. Major Multipliers and Economic Impact Coefficients in Selected Industries
16
III. Economic Impact of Bio-industries in Korea
The sensitivity coefficient (supply-side interconnection)
- Since the bio sectors in Korea are in a developing stage, their coefficients not as high as those of other industries.
- More importantly, an optimal aggregation question, since a higher degree of disaggregation in a sector usually induces a lower sensitivity coefficient
Table 6 summarizes the estimates provided by the assumption that the final demand for Korean bio-industries has increased at a rate of 20 percent (reflecting recent growth rates and mid range of future growth targets)
- The economic activity of this 20 percent increase, or the 230 millions of US$ increase in final demand of bio products and services
- generate close to 524 millions of US$ in the Korean economy - estimated 86 millions of US$ in wages and 29 millions of US$ in tax revenues- The total employment impact approximately 3,335 jobs to the national economy
17
Industries Total Sales
Value-added
Employment
(persons)wages taxe
soperatio
nal profits
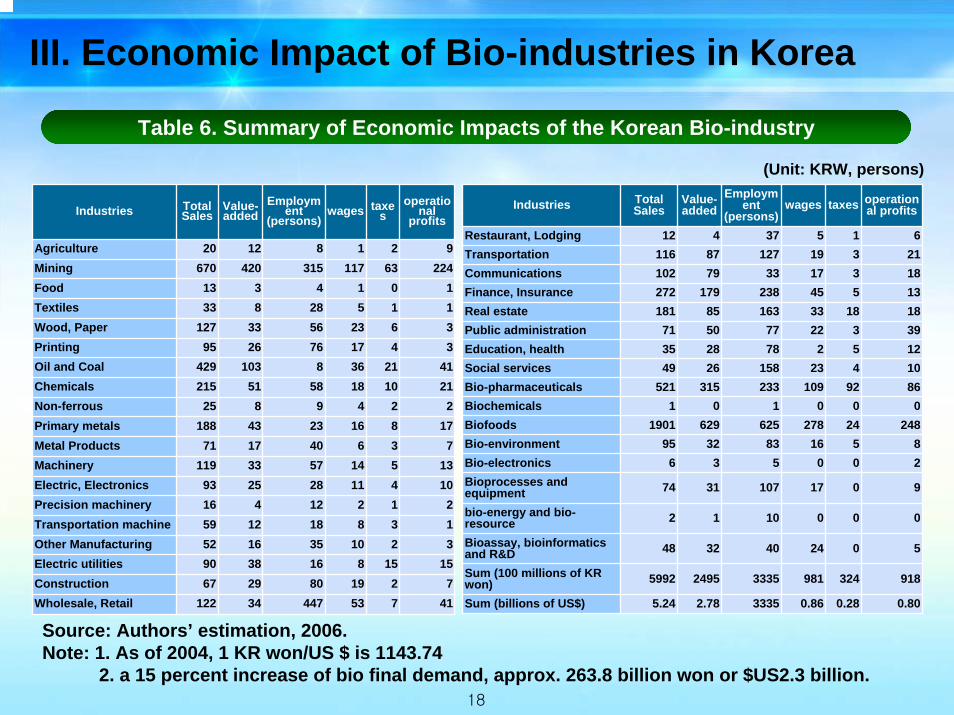
Agriculture 20 12 8 1 2 9Mining 670 420 315 117 63 224Food 13 3 4 1 0 1Textiles 33 8 28 5 1 1Wood, Paper 127 33 56 23 6 3Printing 95 26 76 17 4 3Oil and Coal 429 103 8 36 21 41Chemicals 215 51 58 18 10 21Non-ferrous 25 8 9 4 2 2Primary metals 188 43 23 16 8 17Metal Products 71 17 40 6 3 7Machinery 119 33 57 14 5 13Electric, Electronics 93 25 28 11 4 10Precision machinery 16 4 12 2 1 2Transportation machine 59 12 18 8 3 1Other Manufacturing 52 16 35 10 2 3Electric utilities 90 38 16 8 15 15Construction 67 29 80 19 2 7Wholesale, Retail 122 34 447 53 7 41
Industries Total Sales
Value-added
Employment
(persons)wages taxes operation
al profits
Restaurant, Lodging 12 4 37 5 1 6Transportation 116 87 127 19 3 21Communications 102 79 33 17 3 18Finance, Insurance 272 179 238 45 5 13Real estate 181 85 163 33 18 18Public administration 71 50 77 22 3 39Education, health 35 28 78 2 5 12Social services 49 26 158 23 4 10Bio-pharmaceuticals 521 315 233 109 92 86Biochemicals 1 0 1 0 0 0Biofoods 1901 629 625 278 24 248Bio-environment 95 32 83 16 5 8Bio-electronics 6 3 5 0 0 2Bioprocesses and equipment 74 31 107 17 0 9
bio-energy and bio-resource 2 1 10 0 0 0
Bioassay, bioinformatics and R&D 48 32 40 24 0 5
Sum (100 millions of KR won) 5992 2495 3335 981 324 918
Sum (billions of US$) 5.24 2.78 3335 0.86 0.28 0.80
III. Economic Impact of Bio-industries in Korea
Source: Authors’ estimation, 2006.Note: 1. As of 2004, 1 KR won/US $ is 1143.74
2. a 15 percent increase of bio final demand, approx. 263.8 billion won or $US2.3 billion.
Table 6. Summary of Economic Impacts of the Korean Bio-industry
(Unit: KRW, persons)
18

Total sales Value-added Employment Wages Taxes Operational profits
Direct 232 91 1,104 39 11 31
Indirect and induced 292 127 2,231 47 18 49
Total 524 218 3,335 86 29 80
III. Economic Impact of Bio-industries in Korea
Table 7 summarizes the bio-industries’ direct, indirect and induced economic impacts on the Korean economy
- The total impact on employment was 3,335 jobs, with 1,104 direct jobs, and 2,231 indirect and induced jobs.
- Other economic variables summarized as the same way.
Table 7. Summary of Economic Impacts of the Korean Bio-industry
19
Note: millions of US dollar, persons
2005 2016 Annual growth rate
billions of Korea won 2,941 48,078billions of US dollar 2.9 46.9
World Market2 billions of US dollar 910 3090 11.8billions of Korea won 600 3250billions of US dollar 0.59 3.57
16.6Government budget1
28.9Total production1
Sources: 1. MOST, 2006. The 2nd Bio-engineering Promotion Plan (A Proposal);2. MOCIE, 2005. A Vision for Bio-industry and Development Plan.
Note: 1. in constant terms as of 20052. exchange rate, 1024.14 won per US dollar.
III. Economic Impact of Bio-industries in Korea
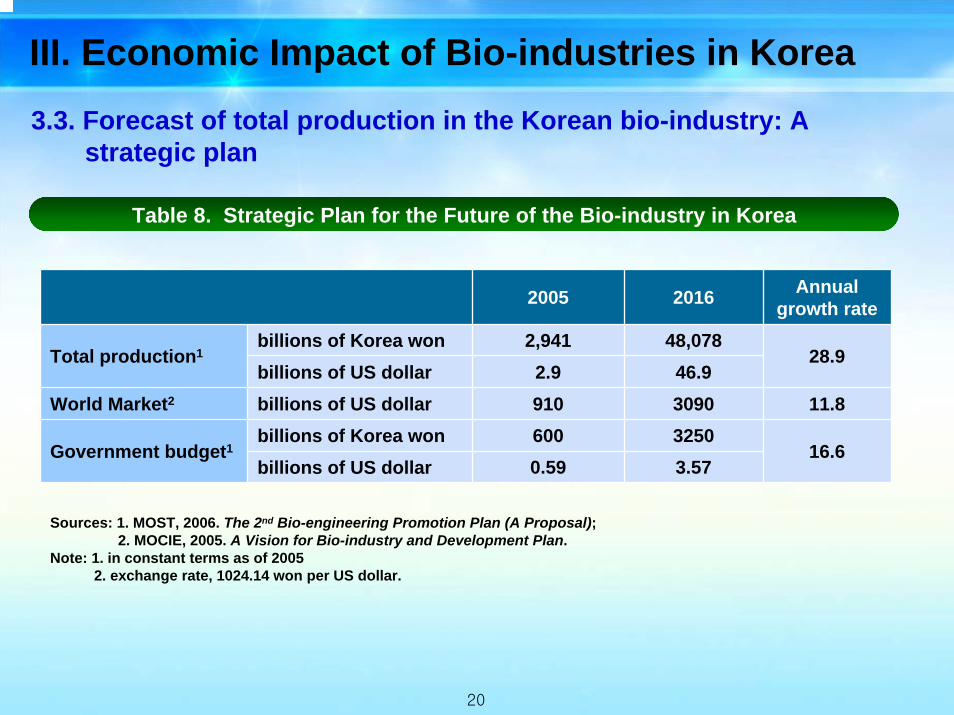
Table 8. Strategic Plan for the Future of the Bio-industry in Korea
20
3.3. Forecast of total production in the Korean bio-industry: A strategic plan
III. Economic Impact of Bio-industries in Korea
The Korean government estimates a total output of $US42.9 billion by 2016- a daunting task and would need 28.3 percent annual growth
- Due to limited data available for analytical forecasting of the Korean bio-industry, attempt to incorporate additional sources such as a Delphi survey and Korean government policies
As in Table 8, the forecast expects a target of $US 42.9 billion by 2016 under a long-term plan of continuous investment and R&D
- These market sizes are possible but require intensive promotion of the Korean biotechnology industries.
21
III. Economic Impact of Bio-industries in Korea3.4 Non-economic Impacts of Bio-industries in Korea
Non-economic Impacts of Biotechnology through the Convergence & Linkage Process
- Human Health & Welfare- Innovation in the Other Technologies & Industries
Main areas- Healthcare Strategy & related Impacts- IPR Impacts on Further Innovation- Co-evolution Impacts with Social Acceptance- Biotech-related Environmental Impacts: Bio-Safety, Bio-Security etc.
The Korean Government established infrastructures and laws related to bio-safety, bio-security, and bioethics.
Still More Infrastructure and Societal “Software” needed for the ELSI of Biotech Field
22

IV. Concluding remarks
IV. Concluding remarksThe main findings:
- According to the historical surveys in Korea, CAGR over the last 5 years = 22 %. - Major force behind the Korean bio-industry:
the synergy created by enthusiastic governmental policy & the entrepreneurship of the research-oriented companies
Wide variations in value structures within the bio-industry- Bio-pharmaceuticals, as a highly technology-oriented industry, the highest VA ratio- Bio-chemicals and bio-foods similar in value structure to that of manufacturing- Output multipliers for the bio-sectors ranged 1.72 ~ 3.02, slightly lower than other
manufacturing industries. - Impact coefficients for bio sub-sectors are around 1, average demand-side effects - Sensitivity coefficients of supply-side interconnection are not high stemming from
(1) by nature, (2) early stage of development, and/or (3) the higher degree of disaggregation in the bio-sectors.
A final demand of $US 2.3 billion - generate close to $US 5.24 billion for the Korean Economy- includes an estimated $0.86 billion in wages, $0.28 billion in tax revenue- the total job impact is close to 3,335 jobs
Need more survey for accuracy of data, more sophisticated modeling24
For Non-economic impacts, further infra and societal ‘software’ needed