DEPARTMENT OF ENVIRONMENTAL AND BIOSYSTEMS ENGINEERING › sites › default › files ›...
66
1 UNIVERSITY OF NAIROBI DEPARTMENT OF ENVIRONMENTAL AND BIOSYSTEMS ENGINEERING FEB 540: DESIGN PROJECT DRAFT REPORT 2014/2015 ACADEMIC YEAR TITLE: DESIGN OF A SOLAR POWERED PISTON PUMPING SYSTEM IN NKANDO VILLAGE, LAIKIPIA COUNTY SUBMITTED BY: OCHIENG RENATO AWUOR REG. NO.: F21/1715/2010 DATE OF SUBMISSION: 6 TH MARCH, 2015 NAME OF SUPERVISOR: MR. ORODI ODHIAMBO SUBMITTED IN PARTIAL FULFILLMENT OF THE REQUIREMENTS OF THE DEGREE OF BACHELOR OF SCIENCE IN ENVIRONMENTAL AND BIO SYSTEMS ENGINEERING
Transcript of DEPARTMENT OF ENVIRONMENTAL AND BIOSYSTEMS ENGINEERING › sites › default › files ›...
1
UNIVERSITY OF NAIROBI
DEPARTMENT OF ENVIRONMENTAL AND BIOSYSTEMS ENGINEERING
FEB 540: DESIGN PROJECT DRAFT REPORT
2014/2015 ACADEMIC YEAR
TITLE: DESIGN OF A SOLAR POWERED PISTON PUMPING SYSTEM IN
NKANDO VILLAGE, LAIKIPIA COUNTY
SUBMITTED BY: OCHIENG RENATO AWUOR
REG. NO.: F21/1715/2010
DATE OF SUBMISSION: 6TH MARCH, 2015
NAME OF SUPERVISOR: MR. ORODI ODHIAMBO
SUBMITTED IN PARTIAL FULFILLMENT OF THE REQUIREMENTS OF THE DEGREE
OF BACHELOR OF SCIENCE IN ENVIRONMENTAL AND BIO SYSTEMS ENGINEERING
OF UNIVERSITY OF NAIROBI
2
Contents
1. INTRODUCTION ..................................................................................................................................... 4
1.1 BACKGROUND ............................................................................................................................... 4
1.2 STATEMENT OF THE PROBLEM AND PROBLEM ANALYSIS ........................................................... 4
1.3 SITE ANALYSIS AND INVENTORY ................................................................................................... 5
1.4 OVERALL OBJECTIVE ...................................................................................................................... 5
1.4.1 SPECIFIC OBJECTIVES ............................................................................................................. 5
1.5 STATEMENT OF SCOPE .................................................................................................................. 5
2. LITERATURE REVIEW ............................................................................................................................. 6
Malawi Solar Powered Water Pump System ........................................................................................ 6
3. THEORETICAL FRAMEWORK ................................................................................................................. 9
Classification of pumps ......................................................................................................................... 9
The Photovoltaic System ..................................................................................................................... 11
The solar powered pumping system ................................................................................................... 12
Pump sizing and selection ................................................................................................................... 15
Photovoltaic array sizing: .................................................................................................................... 19
4) METHODOLOGY .................................................................................................................................. 20
A flowchart demonstrating the concept design process. ....................................................................... 22
5. RESULTS............................................................................................................................................... 23
5) DISCUSSION ......................................................................................................................................... 30
6) CONCLUSION AND RECOMMENDATIONS ........................................................................................... 31
7) BUDGET .................................................................................................. Error! Bookmark not defined.
8. WORK SCHEDULE (Ghant Chart ............................................................. Error! Bookmark not defined.
9) REFERENCES ........................................................................................................................................ 32
10. APPENDICES .................................................................................................................................... 35
APPENDIX 1: IMAGES OF THE SITE ......................................................................................................... 35
APPENDIX 2: map of the farm (google earth) ......................................................................................... 37
APPENDIX 3: A WATER PIPE SIZING CHART FOR PLASTIC (PVC) PIPES ................................................... 38
APPENDIX 4: ............................................................................................... Error! Bookmark not defined.
APPENDIX 5: ............................................................................................................................................ 39
APPENDIX 6: CLIMATE DATA ................................................................................................................... 40

3
APPENDIX 7: ............................................................................................................................................ 49
APPENDIX 8: DESIGN SKETCHES .............................................................................................................. 62

4
1. INTRODUCTION
1.1 BACKGROUND
Solar-powered water pumps have been implemented as an alternative water abstraction measure
in many parts of the world such as Malawi, India and Brazil. Kenya is slowly embracing the
concept of solar energy, in water abstraction projects especially, in an effort to curb the effects of
climate change on drought and famine. In 2012, the Kenyan government had plans to install
2000 solar powered piston pumps in the arid regions of Kenya in an aim to reduce the water
shortages caused by unpredictable rainfall, largely associated with climate change. One such
beneficiary of this initiative was Tseikuru District located 230 kilometers east of Nairobi. The
Ministry of Public Health and Sanitation had entered into a partnership with Bola Associates and
a US-based, DACC global, to supply and install the systems which comprised of solar panels,
submersible pumps, purification systems and holding tanks. The cost of each system was found
to be approximately 11 million Kenyan shillings including the borehole drilling cost. (Kamadi,
G. 2012). Solar powered pumping systems are a reliable and environmentally sustainable
solution to water abstraction problems in the country.
1.2 STATEMENT OF THE PROBLEM AND PROBLEM ANALYSIS
The local farmers in Nkando village, Laikipia County do not have in place any form of
machinery to abstract and convey water from the soon to be constructed water ponds to their
farms which will force them to manually collect and transport the water they need for irrigation
purposes. This will make it tedious and laborious to access the much needed daily quantities of
water.
A manually operated pumping system would provide a credible solution to the problem of
accessibility of water, because the system is simple to use and more affordable for the locals.
However, this pumping system is disadvantaged in terms of the time and energy that would be
required to operate it in order to provide the daily quantities of irrigation water for the farmers.
Consequently, the overall efficiency of the manually operated system is lower compared to the
efficiency of, for instance, an electric water pumping system.

5
Electric water pumping systems are run by the national grid or diesel generators. Fuel and
electricity are quite expensive, for example, the cost of diesel in Nanyuki town, as quoted by the
Energy Regulatory Board as from April 15th, 2015, to May 14, 2015 was Ksh 79.64 per liter.
This makes electric pumps run by diesel generators costly to install, operate and maintain
especially if they’re to be run continuously for a given number of hours a day, to pump enough
water for the locals to use and even store for future use.
1.3 SITE ANALYSIS AND INVENTORY
The proposed site for this design project is Nkando village near Nanyuki Town in Laikipia
County, Kenya. The site is located 0° 0'4.92"N and 37° 6'22.63"E of the equator and has an
elevation of approximately 6522 ft/ 1987m above sea level.
1.4 OVERALL OBJECTIVE
The overall objective is to design a solar-powered piston pumping system as a measure of
reducing the time and effort required by a low-scale farmer to access adequate amounts of water
for irrigation purposes.
1.4.1 SPECIFIC OBJECTIVES
i. To review existing data on the climate of the site area as well as the power requirements
of existing piston pumps.
ii. To determine the power requirements of the piston pumping system in order to size and
match the appropriate photovoltaic power system.
iii. To evaluate the cost and quantities of the materials required to construct the solar
pumping system.
1.5 STATEMENT OF SCOPE
There are a number of solar-powered pumps available in the market. This project aims to review
the existing data on solar-powered piston pumps that are available in the market as well as their
water pumping requirements with the aim of selecting the suitable size of pump that will be able
to abstract adequate amounts of water, for 7.2 hours a day, from a storm water harvesting pond

6
with a minimum capacity of 1000 m3, to an overhead storage tank which will be required to hold,
at least a three-day water supply, determined from the peak irrigation requirement during peak
sun hours. The solar panels that are to be used to power the piston pump will be sized and
matched according to the power requirements of the pump.
2. LITERATURE REVIEW
Malawi Solar Powered Water Pump System
A solar water pumping project was done by Mercer’s University Master’s Program for
Environmental Engineering in association with Mercer on a Mission, in an orphanage located in
the Chuluchosema community of Malawi, Africa (H. King 2010).
This project aimed at pumping water from a nearby well up to a water tower in the orphanage
center. The pump was designed to be powered using Solar Panels that capture the solar energy
from the sun. The community had a water pump that had ceased to work causing them to
manually pump the water that they required several times a day to a tank which was
approximately 160 feet away. The total head was estimated to be between 40-50 vertical feet
with the frictional losses assumed to be minimal. It was also estimated that the daily water use
was between 400-500 liters per day. The solar radiation amount was also estimated to be about
5-6 kWh/m2/day.
The students chose to use a solar panel design because of the limited energy resources
surrounding the orphanage which made it difficult for the orphanage to access fuel supplies on a
daily basis. The tree cover surrounding the area also made the possibility of using wind turbines
to produce sustainable wind power to be eliminated. The System was broken down to four parts:
the pump, the solar panel, the switches and controller and the water piping. The system in this
case was, however, built and tested at Mercer University before being disassembled and shipped
to Malawi where it would be reassembled by the team of students for permanent installation.
The pump that was selected was an 11ft2 Grundfos Submersible Pump (positive displacement
helical pump) capable of providing a maximum of 11 gallons of water per minute. It was to be
powered by 2-180W Trina Solar Panels in order to obtain the maximum flowrate at the minimum
voltage requirement of the pump. The panels were positioned on the roof of an adjacent building

7
for full exposure to the sun. The panels, attached in series, were also to be tinted at an angle
between 15o and 45o to the sun.
The controller used to monitor the power delivered to the pump as well as to switch the pump on
and off was the CU 200 Grundfos controller. It was designed to automatically alarm the residents
if an electrical overload occurred as well as monitor the water level in the storage tank (also
notified the residents if/when the pump was not working). A float switch was also incorporated
which communicated with the controller whenever the pump needed to be switched off or on
depending on the tank capacity. The electrical wiring used in the system was also described.
The pipe, through which water was to be transported from the well to the storage tank, that was
selected was a black Polyethylene Pipe with a diameter of 1.25 inches. The cost analysis was
then done of the entire system and the results listed in the table below:
Part Quantity Price (each, $) Total ($)
11 sqf2 Grundfos pump 1 1699 1699
180W Trina solar panel 2 450 900
CU 200 controller 1 320 320
Float switch 1 28.50 28.50
Black polyethylene pipe
(1.25 in)
2 100 200
AWG #12wire @ 25 in 1 20 20
AWG 10 wire @ 100 in 2 100 200
Total: $3367.5

8
Figure (i): Solar water pump Schematic (Hunter King, Dr. Andre Butler, 2010)
Challenges faced:
Delivery of all the parts and materials to the remote project site.
Difficulty in obtaining extra materials at the remote location in the event that a
mistake/miscalculation was made.
The site characteristics had to be as close to the measurements of the orphanage to
accurately determine how the pump and the solar panels would perform at the permanent
location.
Training for the local people on how to operate the pump once the Mercer on Mission
group left.

9
3. THEORETICAL FRAMEWORK
Classification of pumps
Pumps are classified based on:
The method of transmitting power to the fluid
The mechanical principle behind the energy transfer
The mechanical device for moving the fluid
However, the two major classes of pumps are:
Kinetic (dynamic or rotodynamic) and,
Positive displacement (reciprocating).
Roto-dynamic/centrifugal pumps consist of an impeller rotated within a pressure casing by a
shaft which produces energy that is then transferred to the fluid by the blades of the impeller.
The casing surrounding the rotor (rotating blades) forms an internal passageway through which
the fluid flows. They produce head and flow by increasing the velocity of the liquid through the
machine with the help of the rotating vane impeller. They’re of different types, including but not
limited to:
Regenerative pumps
Axial flow pumps
End suction pumps
Double suction pumps
Self-priming pumps
Positive displacement types of pumps operate by alternately filling a cavity and then displacing
a given volume of liquid. It delivers a constant volume of liquid for each cycle against a varying
discharge pressure/head. The various types of positive displacement pumps include:
Reciprocating
Power
Steam
Rotary pumps – gear, lobe, screw, vane, regenerative (peripheral) and progressive cavity
10
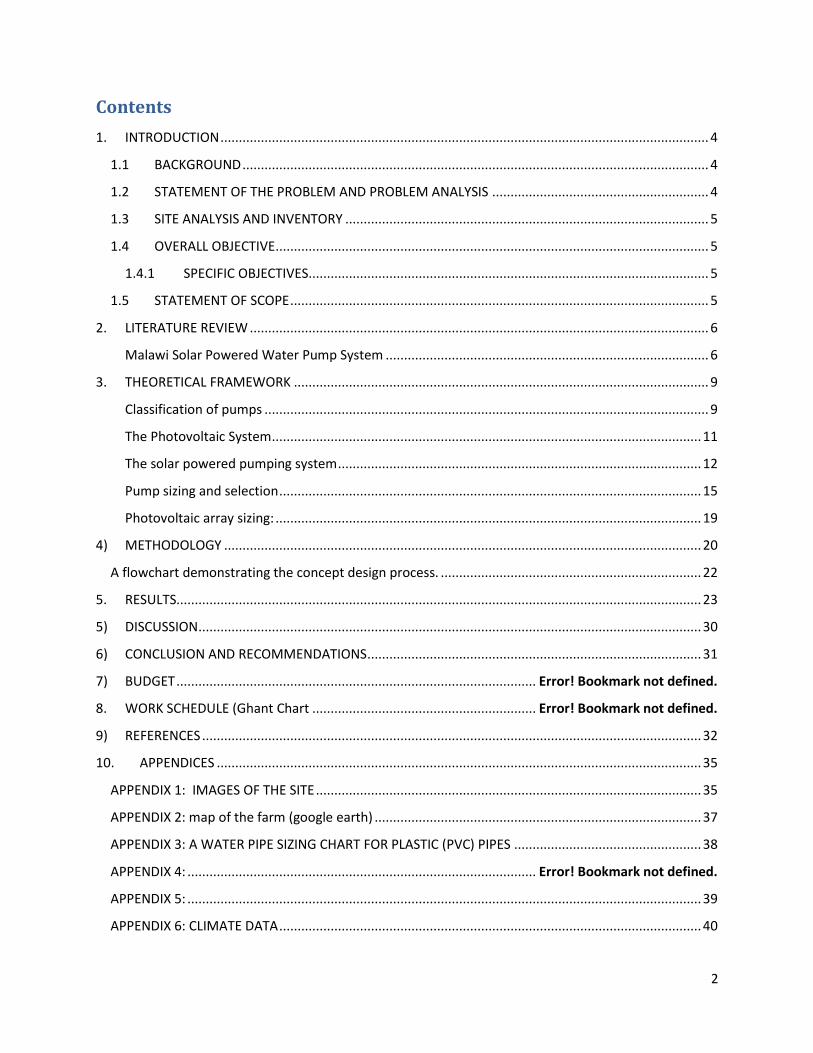
A simple piston pump is a type of reciprocating pump. It consists of a piston, two valves, a
suction pipe and a delivery pipe. It has two valves; an upper valve called the piston valve found
at the piston, and a lower one called the foot valve. The operating principle is that in the
downward stroke, the piston valve is opened and the water passes through it while the piston
moves downwards. During this stroke, the foot valve remains closed. In the upward stroke, the
piston valve is closed and water is lifted above the piston. In the meantime, the volume under the
piston is being depleted with water passing through the opened foot valve. This results in a
pulsating water flow.
The some common pumps used in remote areas include hand pumps, electric pumps with diesel
or gas generator and solar pumps. Their merits are demerits have been listed below:
TYPE OF
PUMP
ADVANTAGES DISADVANTAGES
Gravity Very low cost and
maintenance (has no fuel
costs or spills)
Easy to install
Simple and reliable
It’s practical in only a few
places.
Hand pumps Can be manufactured
locally
Easy to maintain
Low capital cost
No fuel cost
Leads to loss of human
productivity ie laborious and
tedious
Has low delivery rates
Diesel and/or
gasoline pumps
Quick and easy to install
More widely used
Can be portable
Low capital costs
Fuel supplies are erratic and
expensive
High maintenance costs
Have short life expectancies
Generate noise and fume
pollution

11
Solar pumps Can operate without
needing attendance
Simple and reliable
Has no fuel cost
Requires low maintenance
Easy to install
Has a long life expectancy
High capital (initial) costs
Water storage is required for
cloudy periods
Repairs often require skilled
technicians
The Photovoltaic System
A photovoltaic system or solar power system is a renewable energy system which uses
photovoltaic modules to convert sunlight into electricity which can then be stored, used directly,
fed back into the grid line or combined with one or more other electricity generators and/or more
renewable energy sources.
The principle behind the operation of solar power systems is the photoelectric effect. The
photoelectric effect occurs when incoming photons interact with a conductive surface such as a
silicon cell or a metal film resulting in the dislodging and liberation of the electrons within the
material. The electrons then move about the material producing a direct electric current.
Solar power systems are a very reliable and clean source of electricity that can suit a wide range
of applications such as residences, industries, agriculture etc.
The major components of a solar power system are:
Photovoltaic modules which convert sunlight into DC electricity.
Solar charge controller which acts as a regulator for the voltage and current coming from
the photovoltaic panels going to the battery thereby ensuring that the battery doesn’t get
overcharged and consequently, prolonging its life.
Inverter that converts DC output from the Photovoltaic panels into a clean AC current for
AC appliances or to be fed back into the grid line.

12
The battery which stores energy for supplying power to electrical appliances when there
is a demand.
The load that comprises all the electrical appliances that are connected to the solar power
system such as lights, radio, TVs, computers, refrigerators, electric pumps etc.
The solar powered pumping system
A solar-powered pump is a pump running on electricity generated by a solar powering system.
The solar-powered pumping system consists of the following components:
A. Photovoltaic array
A photovoltaic cell is made up of a semi-conducting material that can convert sunlight directly
into electricity. When sunlight strikes the cells electrons are dislodged and liberated and
therefore they are free to move within the material resulting in the production of direct current
(DC). PV cells are combined to make up a module encased in glass or clear plastic. The modules
are in turn aggregated to make a PV array. The types of PV cells available are mono-crystalline,
multi-crystalline and amorphous.
Mono-crystalline cells are made with silicon wafers cut from a single cylindrical crystal
of silicon. They’re the most efficient with approximately 15% efficiency (fraction of
sunlight converted to electrical power). They’re also most expensive to produce.
Multi-crystalline/polycrystalline cells are made by casting molten silicon into blocks
which crystallize into a solid block of inter-grown crystals. They’re less expensive to
produce than mono-crystalline ones because of the simpler manufacturing process and
lower purity requirements for the starting material. They’re however, less efficient with
average efficiency of about 12%.
Amorphous cells are made from a thin layer of non-crystalline silicon placed on a rigid or
flexible substrate. They’re relatively easy to manufacture making them less expensive
than mono and poly-crystalline cells. However, they’re efficiencies are less (about 6%).
Due to their low costs, they’re the best choice where high efficiency and space are not
important.

13
B. Pump and charge controllers
A pump controller is an electronic linear current booster that acts as an interface between the PV
array and the water pump. It provides optimum power to the pump despite wide variations in
energy production from the sun. A charge controller is installed when batteries (charged by the
solar array) are used in the system. Its purpose is to keep the batteries from overcharging or
becoming completely discharged.
C. Passive trackers
These are trackers that don’t require any energy input. Their source of energy is the heat from the
sun which causes Freon or a substitute refrigerant to move between cylinders in the tracker
assembly which in turn causes the panels to shift and maintain a constant 90o angle to the sun
throughout the day (Sinton C.2010) Their purpose is to ensure that the solar panels continuously
face the incoming sunlight. They do this by rotating the PV panel about its axis and sometimes
by controlling the panel tilt angle to keep the panels facing the sunlight throughout the year. The
advantages of using theses trackers include:
Increased energy production by up to 50% during some months
Can reduce the number of PV panels required
Can cause a reduction in pump stalling due to low light conditions during early mornings
and late afternoons when the sun angles are low.
D. Electric-powered pump
Electric- powered pumps are driven by an electric motor which can either be AC or DC. Solar
water pumps are designed to use direct current which is provided by the PV array.
The most efficient type of DC motor is the permanent magnet motor because DC motors that
have carbon brushes may require frequent replacement of the brushes due to wearing out.
However, brushless designs of DC motors exist which use electrical circuits instead of
commentators and brushes and have a higher efficiency than the brushed motor (Sinton C, 2010)
Conventional AC pumps use a centrifugal impeller. Where an AC pump is used, an inverter is
required to convert the direct current from the PV panels to alternating current and then a battery
to store the current. The disadvantages of the AC pumps are:

14
When an inverter is used to convert the DC from the PV panels to AC electrical losses
are experienced leading to less total energy being utilized.
An AC pump would require a battery to also be included in the system which makes the
system more costly to maintain.
When operating at low power, the amount of water pumped by these centrifugal pumps
drops dramatically thus making them a bit limited in solar applications.
Positive displacement pumps on the other hand, generally pump more slowly than other types of
pumps but have good performance under low power conditions and can achieve a high lift.
E. Storage tank
Solar water pumping systems require some storage system to store water rather than store
electricity in batteries. This reduces the cost and complexity of the system. As a general rule, the
tank size is selected so as to hold at least three day amount of water (Sinton C.2010). A food-
grade plastic placed at a high point for gravity feed to different fields may be used.
F. Supply pipes
The supply pipes include that piping from the water source to the pump and from the pump itself
to the storage tank. The pipes most commonly used are of circular cross-section. The
assumptions made when calculating the pipe parameters are that the fluid will completely fill the
cross-section and that there is no free surface of fluid. The losses in the pipes will vary
depending on the length, diameter and type of material used to make the pipe.
15
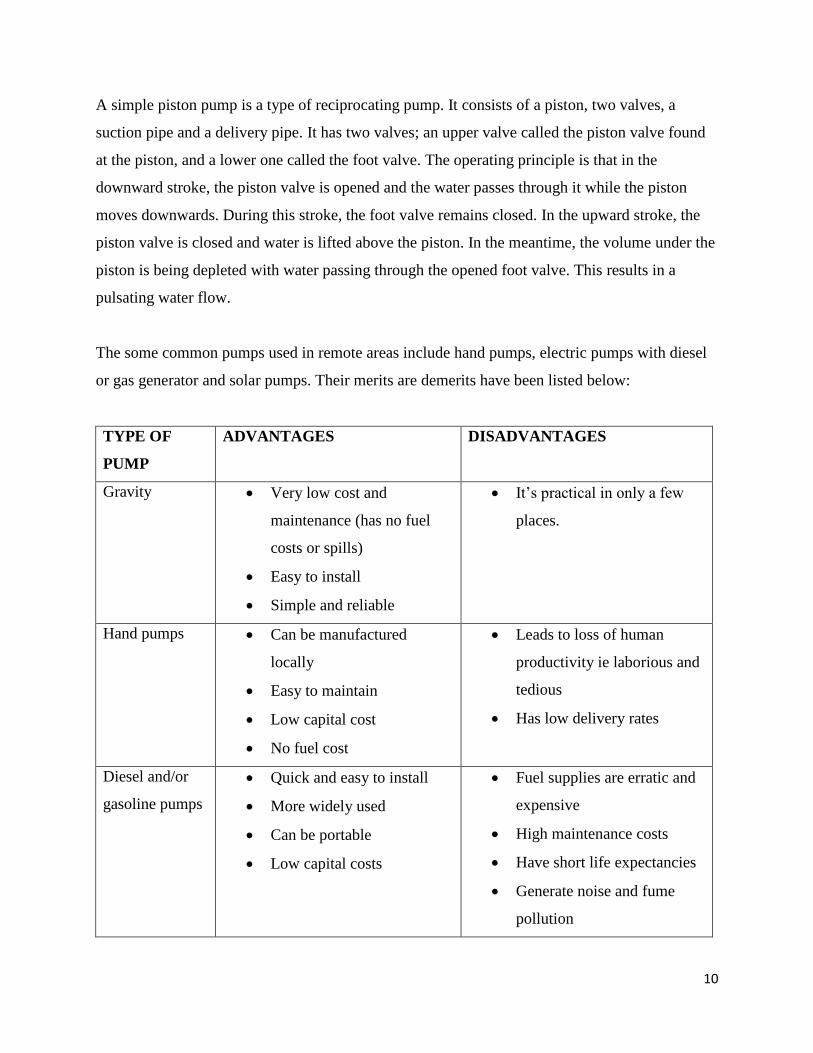
Fig 1: A typical solar-powered pumping system
Pump sizing and selection
Pump performance depends variedly on how much water the pump is moving and the pressure it
is creating. Pump characteristics allow you to control the operation of the pump. The primary
relationship worth noting is the fact that, as the flow increases, the fluid pressure decreases.
a) Flow rate of the liquid required to be pumped is determined by the amount of water
needed ie the demand obtained by
𝑄 = 𝑑𝑎𝑖𝑙𝑦 𝑤𝑎𝑡𝑒𝑟 𝑛𝑒𝑒𝑑𝑠 𝑜𝑓 𝑡ℎ𝑒 𝑜𝑝𝑒𝑟𝑎𝑡𝑖𝑜𝑛
𝑛𝑢𝑚𝑏𝑒𝑟 𝑜𝑓 𝑝𝑒𝑎𝑘 𝑠𝑢𝑛 ℎ𝑜𝑢𝑟𝑠 𝑝𝑒𝑟 𝑑𝑎𝑦 ………………………………………….(eqn 1)
where; Q is the daily water demand (liters/hour)

16
b) Total differential head (TDH) is determined by the flowrate required and the system
itself. It has two components, the static head across the pump (𝐻𝑠𝑡) and the total head loss
(𝐻𝐿). It’s given by:
𝑇𝐷𝐻 = 𝐻𝑠𝑡 + 𝐻𝐿………………………………………(eqn 2)
c) Static head difference which is the difference between the discharge static head and the
suction static head ie
Static head difference = discharge static head – suction static head
where
Discharge static head = Discharge vessel gas pressure head + elevation of discharge pipe
outlet – elevation of pump center line
Suction static head = Suction vessel gas pressure head + elevation of suction vessel liquid
surface – elevation of pump center line
d) Total head loss
The total energy losses in the entire pipeline system includes friction losses, Hf , and
minor losses, Hm, from bends, valves, meters, exit and entrance losses. The friction losses
are determined by: pipe (inside) diameter, length of the pipe, the flow rate and the pipe’s
roughness.
The head lost due to friction within the pipes can be determined using the Hazen-
Williams flow resistance formula for steady uniform flow;
The Hazen-Williams equation:
It was developed for water flow in larger pipes (diameters > 5cm) within a moderate
range of water velocity (V <3m/s)
Where Q is the flow rate, 𝑑ℎ is the hydraulic diameter, R is the hydraulic radius.
𝑣𝑒𝑙𝑜𝑐𝑖𝑡𝑦 𝑜𝑓 𝑓𝑙𝑜𝑤 𝑣 = 0.85 𝐶 𝑅0.63𝑆0.54………………………………..(eqn 3)

17
ℎ𝑒𝑎𝑑 𝑙𝑜𝑠𝑠, ℎ𝐿 = (𝜗𝐿2
𝐶(𝐷
4)
0.63)
1.85
……………………………………………(eqn 4)
Hazen-williams coefficient, C, which depends on surface roughness, is determined using
Reynold’s number
For total loss to be determined, the following parameters need to be known:
Length of the pipes
Diameters of the pipes
Number and types of fittings (valves, bends etc)
e) The actual head gained by the fluid (generated by the pump), HP, Can be determined
using Bernoulli’s equation as follows:
𝑃1
𝜌𝑔+
𝑉12
2𝑔+ 𝑍1 =
𝑃2
𝜌𝑔+
𝑉22
2𝑔+ 𝑍2 + 𝐻𝐿 (𝑝𝑢𝑚𝑝) − 𝐻𝑝………………..(eqn 5)
where 𝐻𝐿 (𝑝𝑢𝑚𝑝) is the head that is lost during the pumping operation.
𝐻𝑝 = 𝑃2
𝜌𝑔−
𝑃1
𝜌𝑔+
𝑉22
2𝑔−
𝑉12
2𝑔+ 𝑍2 − 𝑍1 + 𝐻𝐿 (𝑝𝑢𝑚𝑝) ………………………………(eqn 6)
where 𝑍2 − 𝑍1 is the difference in water levels between the pump sump and the header
tank
f) The Net Positive Suction Head
This is the energy available at the pump eye to push or force the fluid while it still
remains in liquid from. It is the difference between the absolute pressure at the pump
suction and the vapor pressure of the pumped liquid at the pumping temperature.
For the fluid to remain liquid while being pumped, the pressure at the suction should be
greater than the fluid’s vapor pressure. This helps prevent ‘cavitation’ (the existence of
vapour bubbles within the fluid in the pump). ‘Cavitation’ could lead to loss of pump
efficiency and significant pump damage.
The factors influencing it are:
The absolute pressure on the fluid exerted by an outside source such as the
atmosphere, 𝐻𝑎

18
The static suction pressure which is the head of the fluid above or below the pump
suction, 𝐻𝑠
The vapor pressure of the fluid at that particular temperature, 𝐻𝑣𝑝𝑎; it defines the
point which the liquid becomes vapor (the pressure at which a liquid and its vapor
exist in equilibrium)
The friction losses in the suction pipe, 𝐻𝑓
The velocity head at the pump suction port, 𝐻𝑣,which is usually very small and
thus can be ignored.
The NPSHA (available net positive suction head) should be greater than the NPSHR
(required net positive suction head – the minimum pressure required at the suction port of
the pump to keep the pump from cavitating) for the particular pump for correct pump
operation. It is given by:
𝑁𝑃𝑆𝐻𝐴 = 𝑎𝑏𝑠𝑜𝑙𝑢𝑡𝑒 𝑝𝑟𝑒𝑠𝑠𝑢𝑟𝑒 ℎ𝑒𝑎𝑑 𝑎𝑡 𝑝𝑢𝑚𝑝 𝑠𝑢𝑐𝑡𝑖𝑜𝑛 − 𝑙𝑖𝑞𝑢𝑖𝑑 𝑣𝑎𝑝𝑜𝑟 𝑝𝑟𝑒𝑠𝑠𝑢𝑟𝑒 ℎ𝑒𝑎𝑑
= 𝐻𝑎 − 𝐻𝑣𝑝𝑎………………………………………………………(eqn 7)
g) The theoretical power gained by the fluid, 𝑃𝑝, is given by:
𝑃𝑝 = 𝜌𝑔𝑄𝐻𝑝…………………………………………(eqn 8)
This value differs from the actual power consumed by the motor driving the pump due to
mechanical losses in the bearings and seals, leakages and/or fluid friction.
The static head, Hst, which is the difference in water levels in the pond/pump sump and
header tank together with HL, are system characteristics forming the equation:
𝐻𝑆 = 𝐻𝐿 + 𝐻𝑠𝑡 = 𝐾𝑄2 + 𝐻𝑠 ………………………………………..(eqn 9)
This is the equation that manufacturers use to generate the pump system curve as well as
the pump curve from the equation:
𝐻𝑝 = 𝐾 ′𝑄2…………………………………………………………..(eqn 10)
The actual pump power,𝑃𝑝(𝑎𝑐𝑡𝑢𝑎𝑙), is given as:
= 𝑓𝑙𝑜𝑤 𝑟𝑎𝑡𝑒 × 𝑑𝑖𝑓𝑓𝑒𝑟𝑒𝑛𝑡𝑖𝑎𝑙 ℎ𝑒𝑎𝑑 × 𝑙𝑖𝑞𝑢𝑖𝑑 𝑑𝑒𝑛𝑠𝑖𝑡𝑦 × 𝑔𝑟𝑎𝑣𝑖𝑡𝑎𝑡𝑖𝑜𝑛𝑎𝑙 𝑎𝑐𝑐𝑒𝑙𝑒𝑟𝑎𝑡𝑖𝑜𝑛
𝑝𝑢𝑚𝑝 𝑒𝑓𝑓𝑖𝑐𝑖𝑒𝑛𝑐𝑦
=𝑄𝐻𝑝𝜌𝑔
𝜂𝑝𝑢𝑚𝑝…………………………………………………………….(eqn 11)

19
Pump efficiency is usually given by the manufacturer but can also be given by:
𝑎𝑐𝑡𝑢𝑎𝑙 𝑝𝑢𝑚𝑝 𝑝𝑜𝑤𝑒𝑟
𝑖𝑛𝑝𝑢𝑡 𝑝𝑜𝑤𝑒𝑟 𝑎𝑡 𝑝𝑢𝑚𝑝 𝑠ℎ𝑎𝑓𝑡=
𝑄𝐻𝑝𝜌𝑔
𝑝𝑜𝑤𝑒𝑟 𝑐𝑜𝑛𝑠𝑢𝑚𝑒𝑑 𝑏𝑦 𝑡ℎ𝑒 𝑚𝑜𝑡𝑜𝑟…………………(eqn 12)
Photovoltaic array sizing:
1) The total power and energy consumption of all the loads that need to be supplied by the
solar power system is given as:
𝑀𝑖𝑛𝑖𝑚𝑢𝑚 𝑝𝑜𝑤𝑒𝑟 𝑟𝑒𝑞𝑢𝑖𝑟𝑒𝑑 = 𝑝𝑒𝑎𝑘 𝑝𝑢𝑚𝑝 𝑝𝑜𝑤𝑒𝑟 𝑟𝑒𝑞𝑢𝑖𝑟𝑒𝑚𝑒𝑛𝑡 ×
𝑓𝑎𝑐𝑡𝑜𝑟 𝑐𝑎𝑡𝑒𝑟𝑖𝑛𝑔 𝑓𝑜𝑟 𝑙𝑜𝑠𝑠𝑒𝑠………………………………………….(eqn 13)
2) The size of the PV modules is determined by (Morales, T., & Busch, J. 2010).
=𝑚𝑖𝑛𝑖𝑚𝑢𝑚 𝑝𝑜𝑤𝑒𝑟 𝑟𝑒𝑞𝑢𝑖𝑟𝑒𝑑
𝑝𝑒𝑎𝑘 𝑝𝑜𝑤𝑒𝑟 𝑜𝑢𝑡𝑝𝑢𝑡 𝑜𝑓 𝑡ℎ𝑒 𝑎𝑟𝑟𝑎𝑦…………………………………………(eqn 14)
The solar charge controller is rated against Ampereage and Voltage capacities. It is selected to
match the voltage of the PV array and batteries. The size collection is based on the short circuit
current of the PV array
𝑆𝑜𝑙𝑎𝑟 𝑐ℎ𝑎𝑟𝑔𝑒 𝑐𝑜𝑛𝑡𝑟𝑜𝑙𝑙𝑒𝑟 𝑟𝑎𝑡𝑖𝑛𝑔 = 𝑇𝑜𝑡𝑎𝑙 𝑠ℎ𝑜𝑟𝑡 𝑐𝑖𝑟𝑐𝑢𝑖𝑡 𝑐𝑢𝑟𝑟𝑒𝑛𝑡 𝑜𝑓 𝑃𝑉 𝑎𝑟𝑟𝑎𝑦 ×
1.3………………………………………………………………………….(eqn 15)

20
4) METHODOLOGY
1) Preliminary desk study which involved a review of existing information on piston water
pumps.
2) Collection of primary and secondary data on:
Climate data especially the amount of solar insolation experienced at the site location
through world weather websites and/or locally from the Kenya Meteorological
Department. The evaluation done yielded data on the daily and seasonal variations of
the solar insolation at the site.
The site coordinates and elevations using a GPS which aided in selecting the possible
sites for the various components of the piston pumping system.
3) Calculation of the daily water requirements using CROPWAT 8.0
CROPWAT 8.0 is a computer program used to calculate crop water requirements and
irrigation requirements based on the soil, climate and crop data of choice. The program
also enables one to develop an irrigation schedule for different management conditions as
well as the calculation of scheme water supply for varying crop patterns. The calculations
are done based on FAO (Food and Agriculture Organization) publications of irrigation
and drainage series namely, No 56 “Crop Evapotranspiration- Guidelines for computing
crop water requirements” and No 33 titled “Yield response to water”. (FAO, 2013)
4) Design and selection of the storage tank
The tank will be sized to store at least a three-day water supply during peak energy
production to meet the water needs during cloudy weather or maintenance issues with the
power system.
The tank material will be selected on the basis of UV resistance to maximize its lifespan.
5) Pump sizing and selection
The first step will be an examination of the existing solar pumps in the market.
Thereafter, the design flow rate for the pump will be calculated by dividing the daily
water needs of the operation and the peak sun hours experienced at the project location.

21
The sum of the vertical lift, pressure head and friction losses (piping and fittings between
the point of intake and the storage tank) will be calculated to yield the TDH using the
appropriate formulas.
Using the pump performance curves (such as the one in appendix 4), the peak power
requirements for the pump can be obtained for the calculated flow rate and TDH.
6) PV panel sizing and matching
From the peak power requirements, the solar panels or array of panels required to supply
this power can be sized.
The connection of the panels (series, parallel or a combination of both) can then be
determined to meet the voltage and ampereage requirements of the pump.
The total power produced by the array can then be obtained by summing up the
individual power outputs of each panel.
The support structure for the panels will also be designed although it is usually provided
for by the supplier.
7) Material cost analysis
The entire system will be analyzed based on the quantities and cost of the materials
required to design all the components.
.

22
A flowchart demonstrating the concept design process.
DESK STUDY: Identification of site location on maps, review of any existing information on the site.
COLLECTION OF SECONDARY DATA: Amounts of solar insolation received at the site area, the irrigation water requirements, site elevations
SIZING OF STORAGE TANK
PUMP SIZING: determination of pumping requirements, development of pump alternatives based on size
PV PANEL, SIZING & MATCHING
SELECTION OF OPTIMAL DESIGN
MATERIAL ANALYSIS: generation of bill of
quantities

23
5. RESULTS
MONTH RAINFALL
(mm)
MIN
TEMP
(oC)
MAX
TEMP
(oC)
RELATIVE
HUMIDITY
(%)
SUNSHINE
HOURS
WIND
SPEED
(m/sec)
JAN 29.4 9.5 25.9 55 8.5 3.9
FEB 14.2 9.6 27.3 48 9.7 4.1
MAR 47.9 10.8 27.2 55 6.4 3.9
APR 114.7 11.6 25.6 68 7.3 3.8
MAY 75.9 11.6 24.7 68 6.5 4.4
JUN 43.7 10.5 21.8 65 8.6 3.9
JUL 59.9 10.2 23.9 65 8.3 4.2
AUG 70.5 10.4 24.4 64 8.6 4.3
SEP 52.6 10.1 25.5 60 8.2 3.8
OCT 77.6 11.0 24.8 65 6.6 3.3
NOV 80.6 11.4 23.5 70 6.4 3.0
DEC 40.0 10.1 24.6 62 7.2 3.4
A review of the existing solar pumps available in the market was done (refer to the catalogue on
appendix 4)
PUMP SIZING AND SELECTION:
A. Daily water requirements
Using CROPWAT 8.0 the net irrigation water requirements for the driest months of the year,
selected on analysis of the climatic data, were designed as follows:
24
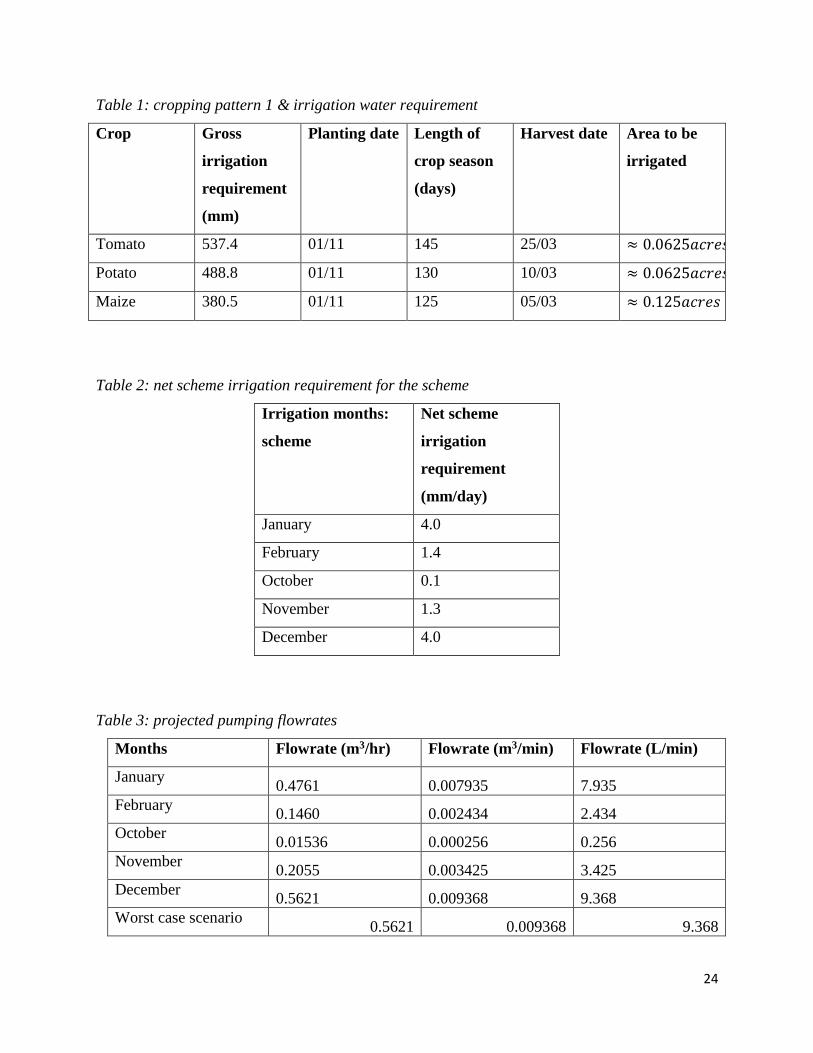
Table 1: cropping pattern 1 & irrigation water requirement
Crop Gross
irrigation
requirement
(mm)
Planting date Length of
crop season
(days)
Harvest date Area to be
irrigated
Tomato 537.4 01/11 145 25/03 ≈ 0.0625𝑎𝑐𝑟𝑒𝑠
Potato 488.8 01/11 130 10/03 ≈ 0.0625𝑎𝑐𝑟𝑒𝑠
Maize 380.5 01/11 125 05/03 ≈ 0.125𝑎𝑐𝑟𝑒𝑠
Table 2: net scheme irrigation requirement for the scheme
Irrigation months:
scheme
Net scheme
irrigation
requirement
(mm/day)
January 4.0
February 1.4
October 0.1
November 1.3
December 4.0
Table 3: projected pumping flowrates
Months Flowrate (m3/hr) Flowrate (m3/min) Flowrate (L/min)
January 0.4761 0.007935 7.935
February 0.1460 0.002434 2.434
October 0.01536 0.000256 0.256
November 0.2055 0.003425 3.425
December 0.5621 0.009368 9.368
Worst case scenario 0.5621 0.009368 9.368

25
B. Total Differential Head
Overhead storage tank will have a minimum capacity of 4.0
1000𝑚 × 1011.714𝑚2 ×
3𝑑𝑎𝑦𝑠 = 12.141𝑚3= 12141L
Tank selected = plastic cylindrical roto tank with a capacity of 16000L (312 cm high and
diameter of 240 cm)
Static head difference
The vertical linear distance between the water level and delivery outlet = 10m - 6m = 4m
Head loss
The pipe material that was selected was PVC pipes which have considerably low friction
losses, making them a suitable choice for long pipes because lower friction losses leads to
a reduced pump size and subsequent energy consumption. (Davis & Shirtliff, 2014
product manual, page 291)
Using Hazen-Williams equation, (equation 4) head loss, assuming the suction side of the
pump will use a bigger pipe diameter (pipe length =6m), generated is tabulated below:
Table 4: head loss for different pipe diameters, length = 6m, Q = 0.5621m3/hr
D (m) 𝝑 (𝒎
𝒔𝒆𝒄) 𝑯𝑳(m)
0.025 0.048 3.72985241
0.032 0.030 1.12217745
0.04 0.019 0.37891855
0.05 0.012 0.12794703
0.063 0.008 0.04156017
0.075 0.005 0.01779337
0.09 0.004 0.00732828
0.11 0.002 0.00276040

26
0.16 0.001 0.00044589
0.2 0.001 0.00015056
Assuming also that the rest of the pipe, will have the same diameter (length =10m) the
head loss generated is tabulated below:
Table 5: Head loss for different pipe diameters, length = 10m, Q=0.5621m3/hr
D (m) 𝝑 (𝒎
𝒔𝒆𝒄) 𝑯𝑳(m)
0.025 0.049 24.6906214
0.032 0.030 7.4285134
0.04 0.019 2.5083391
0.05 0.012 0.8469750
0.063 0.008 0.2751172
0.075 0.005 0.1177873
0.09 0.004 0.0485112
0.11 0.003 0.0182731
0.16 0.001 0.0029516
0.2 0.001 0.0009967
Pressure head
For this case, the pressure head was assumed to be negligible since the delivery
point is a tank and pressure delivery is not necessary.
Pipe size selection
The pipe diameter that was selected was 50mm/0.050m for the suction pipe and
40mm/0.040m for the rest of the pipe. The smaller diameters were selected
because for long pipes, the piping cost can be considerably more expensive than
the pumping installation and a pipe size smaller matched to a larger sized pump
can reduce the investment cost (Davis & Shirtliff 2014 product manual page 289 )
but increases the running cost.

27
𝑇𝐷𝐻 = 𝐻𝑆 + 𝐻𝐿 = 4𝑚 + 2.51𝑚 + 0.128𝑚 = 6.638𝑚
NPSH
Using equation 7 the available net positive suction head was calculated as
follows:
𝐻𝑣𝑝𝑎 of water was taken as 0.03 atmospheres at 25oC
(www.chem.purdue.edu/gchelp/liquids/vpress.html)
𝐻𝑎 − 𝐻𝑣𝑝𝑎 =101326
1000 × 9.81𝑚 −
3039.75
1000 × 9.81
Available net positive suction head = 13.67m
Pump selection
Available net positive suction head = 13.67m
Total differential head = 6.638m
Pumping flowrate, Q=0.5621m3/hr = 9.368L/min =
The piston pumps selected that closely met the above needs were:
Grundfos
BMP 1.0
Shurflo
2088 12V
SPB 2.5-
23C
Apollo model
102
SFPP model
3020, 12PV
Max flow 10L/min 13.333L/min 11.356L/min 10.2 L/min
(max)
17.8L/min
Voltage 3×380-415V,
50Hz
12V DC
power input
45-90V DC 24V DC 12,24,48 OR
90V DC
Energy
rating
4.0kW 7-120W 700W max 314W
Head (m) 10-35 15-30 6.7056
Power 0.75 HP 0.25HP

28
The pump model that was selected was the (SFPP) Surface Force Piston Pump model
3020, 12V
Pump power
Pump power = flow rate x total differential head x liquid density x acceleration
due to gravity ÷ pump efficiency
Assuming a pump efficiency of 70%
𝑇ℎ𝑒𝑜𝑟𝑒𝑡𝑖𝑐𝑎𝑙 𝑃𝑝𝑢𝑚𝑝 = 0.000156 × 6.638 × 1000 × 9.81
0.7= 14.5𝑊
Actual pump power required = 314 W
PV module sizing and selection
Minimum power needed to operate the pump = 314𝑊 × 1.2 = 376.8𝑊
𝑁𝑜. 𝑃𝑉 𝑝𝑎𝑛𝑒𝑙𝑠 = 376.8
125 = 4 panels (which is the most ideal choice)
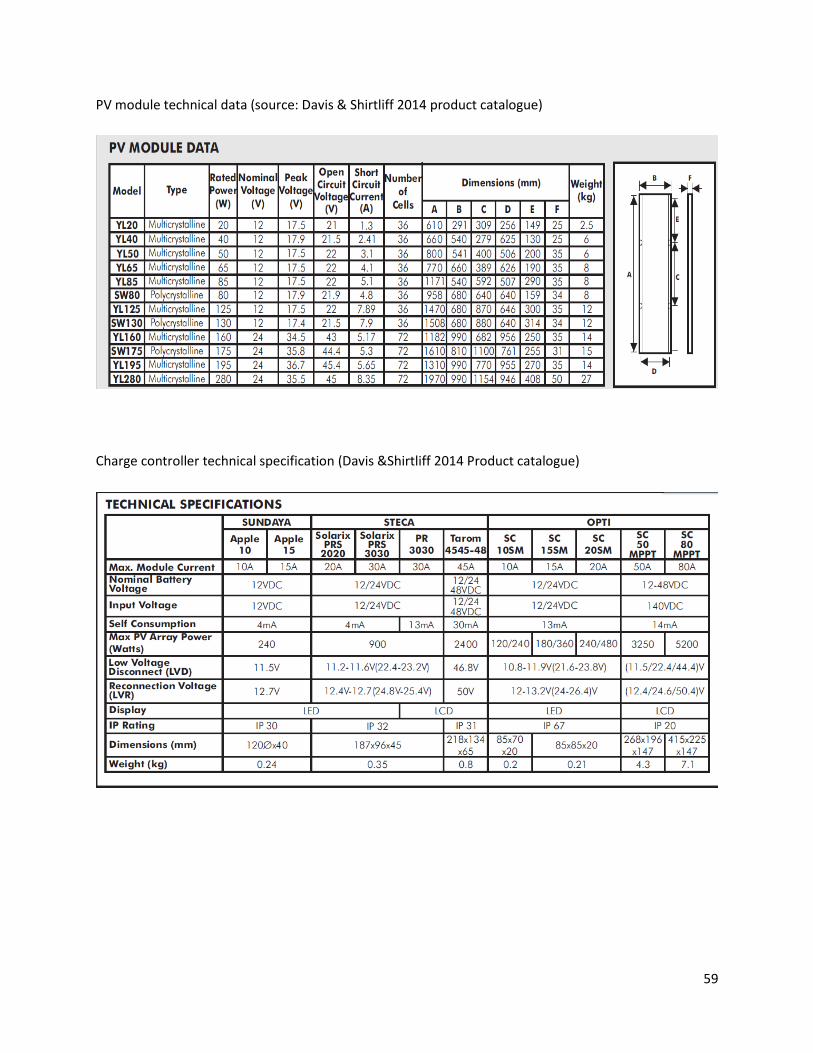
The panel model that was selected was YL125 with a rated power of `125 W and
open circuit voltage of 22V and total short circuit current of 7.89A
The solar charge controller selection
𝑆𝑜𝑙𝑎𝑟 𝑐ℎ𝑎𝑟𝑔𝑒 𝑐𝑜𝑛𝑡𝑟𝑜𝑙𝑙𝑒𝑟 𝑟𝑎𝑡𝑖𝑛𝑔
= 𝑇𝑜𝑡𝑎𝑙 𝑠ℎ𝑜𝑟𝑡 𝑐𝑖𝑟𝑐𝑢𝑖𝑡 𝑐𝑢𝑟𝑟𝑒𝑛𝑡 𝑜𝑓 𝑃𝑉 𝑎𝑟𝑟𝑎𝑦 × 1.3
= 7.89 × 1.3 = 10.257𝐴
The appropriate charge controllers would be the SUNDAYA Apple 15 and/or
OPTI SC 15A
The charge controller that was selected was the SUNDAYA Apple 15 charge
controller.

29
Cost estimates
Item Quantity Cost
PVC pipe D40 @ Shs 48 10 meters Shs 480
PVC pipe D50 @ Shs 58 per
meter
6 meters Shs 348
20,000 L tank 1 Shs 20000
YL-125 solar panel @ sh
14400 each (VAT excluded)
4 Sh 57600
SUNDAYA APPLE 15A
charge controller @ sh 5200
(VAT excluded)
1 Sh 5200
Surface Force Piston Pump
model 3020, 12V
1 Sh 239400
TOTAL = shs 323028

30
5) DISCUSSION
The data analysis done yielded the following results:
An irrigation water requirement of 4.0 mm/day in the month of December which was the
highest requirement calculated for an irrigation period between the months of October-
February.
This daily irrigation requirement was thereafter used to compute the pumping flowrate of
10.07L/min/ 0.60429m3/hr
Total Differential head of 6.638m
NPSHA of 13.67m
Cost of the entire system was found to be shs 308628
There were some assumptions that were made such as:
That the farmer’s cropping season would be from October to February which are
typically the driest months of the year in the area.
That the suction pipe will have a larger diameter than the delivery pipe because of the
low head and pressure requirements on the suction side of the pipe compared to the
delivery pipe.
That the crops to be irrigated by the farmer are tomatoes (25% of the irrigation land),
potatoes (25% of the irrigation land) and maize (50% irrigation land)
The selection of the solar powering system was based on the fact that a solar powering system is
an environmentally friendly source of alternative energy. An electric wind pump, another type of
alternative energy water abstraction method, would have been a credible solution but the
presence of tall trees in the site farm, which generally act as wind barriers, as well as the fact that
a long-lasting farm wind pump, manufactured from steel components and drive piston rods are
quite expensive in relation to their power output (FAO, ).Other than this, for the wind pump to
become economically attractive technology requires that the site have a mean wind speed of
5m/s.
A manually operated hand pump, although a cheap and clean abstraction method, on the other
hand, requires time and effort to operate. For example, a rope and washer pump can provide

31
1L/sec from a 5m depth when pumped by a child if pumped for 20 hours a week (enough to
irrigate a quarter acre) while an adult can pump 20L/min from a depth of 20m. this time and
effort can be reduced by installing the solar pump which doesn’t need to be manned while it
operates.
6) CONCLUSION AND RECOMMENDATIONS
The objectives of the design project were met. The review of existing climatic data on the site as
well the pumping requirements of the available solar pumps in the market revealed that solar
power as an alternative source of energy, is a viable solution for the water abstraction problems
experienced by the local farmers in Nkando village.
The solution offered was that of a SFPP 3020, 12PV pump powered by 4 YL-125 solar panels
each with a power rating of 125W operating for 7.2 hours a day and fitted with a 15A Sundaya
charge controller. The overhead tank which will be fitted 5m above the ground level will have a
storage capacity of 16000L.
My recommendations are that the water from the overhead tank can be supplied by gravity feed
to the farms to reduce the entire cost of supplying irrigation water.

32
9) REFERENCES
Bengtson, H. (2011, May 20). Uniform Open Channel Water Flow Rate Calculation with the
Manning Equation (L. Stonecypher, Ed.). Retrieved January 21, 2015, from
http://www.brighthubengineering.com/hydraulics-civil-engineering/52905-manning-
equation-for-uniform-open-channel-flow-calculations/
Food and Agriculture Organization (2013) CROPWAT 8.0. Retrieved from
www.fao.org/nr/water/infore_databases_cropwat.html
Engineering toolbox. Hazen-Williams Equation - calculating Friction Head Loss in Water
Pipes (Hazen-Williams Equation - calculating Friction Head Loss in Water Pipes)
http://www.engineeringtoolbox.com/hazen-williams-water-d_797.html
How To Size A Pump | Blackmonk Engineering. (2009, November 11). Retrieved February
22, 2015, from http://blackmonk.co.uk/2009/11/11/how-to-size-a-pump/
Kamadi, G. (2012, January 23). Solar pump project aims to ease Kenyan water shortages
(cb1f21c7-7d98-4ea3-903f-c5de10e41700). Retrieved February 12, 2015, from
http://www.trust.org/item/?map=solar-pump-project-aims-to-ease-kenyan-water-shortages
King, H. & Butler A. (2010, January 1). Malawi Solar Powered Water Pump System.
Retrieved April 26, 2015, from
http://se.asee.org/proceedings/ASEE2011/Papers/FP2011kin150_163.PDF
Kudela, H. (n.d.). Hydraulic losses in pipes. Retrieved January 19, 2015, from
http://fluid.itcmp.pwr.wroc.pl/~znmp/dydaktyka/fundam_FM/Lecture11_12.pdf
Maupoux, M. (Ed.). (2010). Solar (Photovoltaic) Water Pumping. Retrieved February 22,
2015, from http://www.mtnforum.org/sites/default/files/publication/files/3816.pdf

33
McFarland, M. (2001, January 1). Hazen-Williams Equation - calculating Friction Head Loss
in Water Pipes. Retrieved March 12, 2015, from http://www.engineeringtoolbox.com/hazen-
williams-water-d_797.html
Merkley & Allen (n.d. lecture 11, page 123). Sprinkle and Trickle Irrigation Lectures.
Retrieved March 4, 2015, from
http://ocw.usu.edu/Biological_and_Irrigation_Engineering/Sprinkle___Trickle_Irrigation/61
10__L11_Pumps_and_System_Curves.pdf
Morales, T., & Busch, J. (2010, October 1). Design of Small Photovoltaic (PV) Solar-
Powered Water Pump Systems (E. McDuff, Ed.). Retrieved February 24, 2015, from
http://www.nrcs.usda.gov/Internet/FSE_DOCUMENTS/nrcs142p2_046471.pdf =
nrcs142p2_046471.pdf
Ngalame, E. (2015, March 24). Solar water system douses risks in Cameroon's arid north:
TRFN. Retrieved April 28, 2015, from
http://af.reuters.com/article/topNews/idAFKBN0MK0K920150324?sp=true
Pumps, Pipes and Storage Resources for Drinking-water Assistance Programme. (2010,
December 1). Retrieved April 28, 2015, from
https://www.health.govt.nz/system/files/documents/publications/pumps-pipes-and-
storage2010_0.pdf
Romanyshyn, G. (2010, September 26). Part II: Optimizing Pumping Systems. Retrieved
February 22, 2015, from http://www.flowcontrolnetwork.com/articles/part-ii-optimizing-
pumping-systems
Sinton, C., Butler, R., & Winnett, R. (2010). Guide To Solar-Powered Water Pumping
Systems in New York State. Retrieved February 24, 2015, from
http://www.google.com/url?sa=t&rct=j&q=&esrc=s&source=web&cd=1&cad=rja&uact=8&
ved=0CB0QFjAA&url=http://www.nyserda.ny.gov/-/media/Files/EERP/Renewables/Guide-
solar-powered-pumping-systems-

34
NYS.pdf&ei=nCDsVL21PMjmUpe2gfAG&usg=AFQjCNGHdlX7fNVYHjKurGJ-
nW4_3YaJpA&sig2=SmULLL150n2F_JxAi_pcxg&bvm=bv.86475890,d.d24
Summary (Pump Power Calculation – Neutrium)(2012, July 9)
https://neutrium.net/equipment/pump-power-calculation/
Task 9:-Case Study: Drinking Water Supply with Photovoltaic Water Pumps (PVP). (2002,
September). Retrieved March 28, 2015, from
http://www.martinot.info/GTZ_drinking_PVPS.pdf
Understanding Net Positive Suction Head. (2007, January 1). Retrieved March 4, 2015, from
http://www.pumpschool.com/applications/NPSH.pdf
Wilson, S. (n.d.). Retrieved February 22, 2015, from
https://www.grundfos.com/content/dam/CBS/global/whitepapers/Net-Positive-Suction-Head-
NPSH.pdf

35
10. APPENDICES APPENDIX 1: IMAGES OF THE SITE

36
Runoff water flowing beside the farm: the pond will be supplied with Rainwater and runoff water

37
APPENDIX 2: MAP OF THE FARM
Pond location and storage tank location

38
APPENDIX 3: CATALOGUE OF EXISTING SOLAR PUMPS
Some of the existing solar pumps in the market (courtesy of Davis & Shirtliff product catalogue)
39
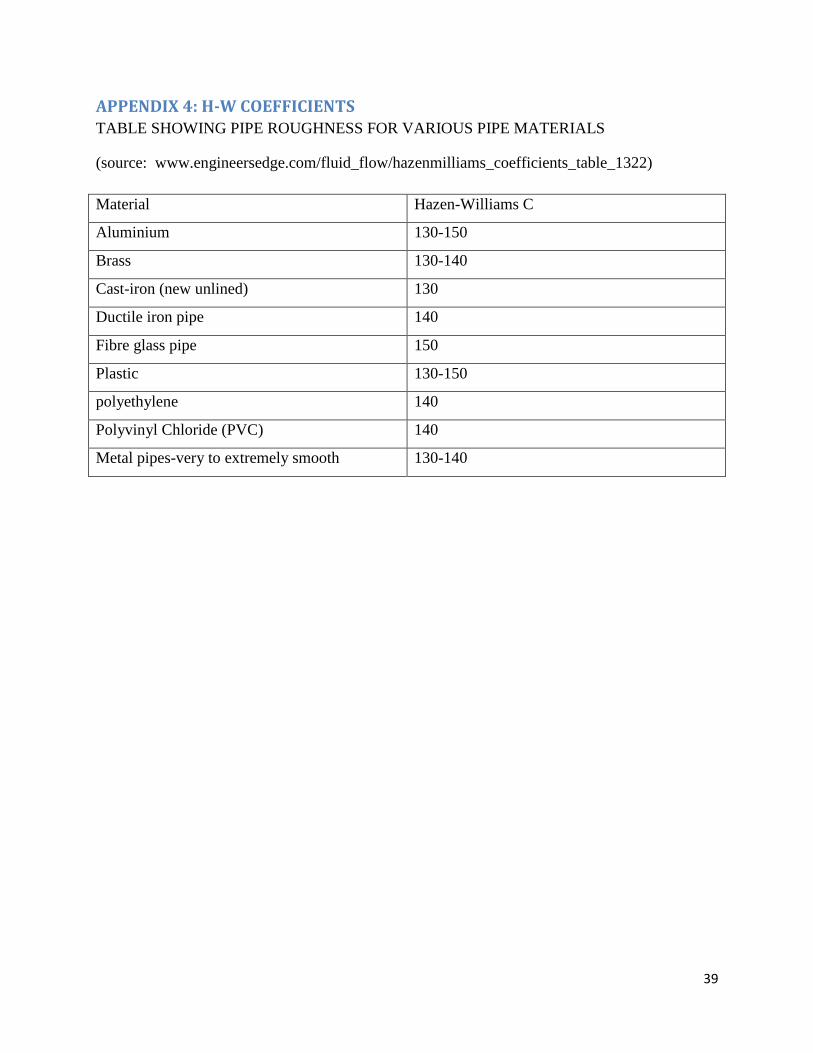
APPENDIX 4: H-W COEFFICIENTS
TABLE SHOWING PIPE ROUGHNESS FOR VARIOUS PIPE MATERIALS
(source: www.engineersedge.com/fluid_flow/hazenmilliams_coefficients_table_1322)
Material Hazen-Williams C
Aluminium 130-150
Brass 130-140
Cast-iron (new unlined) 130
Ductile iron pipe 140
Fibre glass pipe 150
Plastic 130-150
polyethylene 140
Polyvinyl Chloride (PVC) 140
Metal pipes-very to extremely smooth 130-140

40
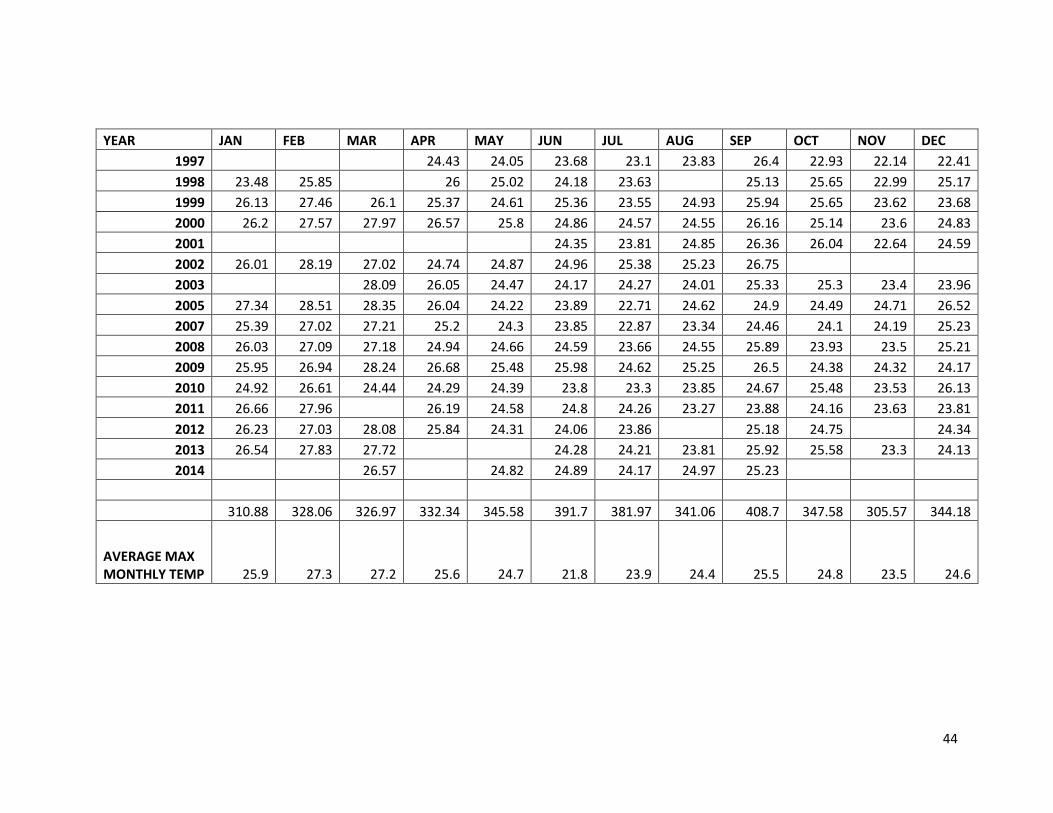
APPENDIX 6: CLIMATE DATA Sourced from Kenya Meteorological Department
YEAR JAN FEB MARCH APR MAY JUNE JULY AUG SEP OCT NOV DEC
1997 7.38 9.09 8.52 5.37 3.33 4.91
1998 5.94 8.97 7.55 6.71 7.96 7.95 8.27 7.25 6.53 8.95
1999 8.78 10.43 6.85 7.8 8.6 7.7 6.6 6.6
2000 10 10.4 0.9 7.7 8.5 9.1 8.1 7.1
2001 0.76 7.5 6.6
2002 9.7 7.3 5.9 0.73 7.9 9.2 8.9 8 6.5 7.1 6.3
2003 9.5 9.7 8.5 7.1 5.9 9 8.4 6.5 9.3 7.2
2005 8.8 10.34 8.52 7.27 6.93 8.54 7.7 8.43 7.78 7.03 6.69 9.2
2007 8.85 8.99 8.41 7.46 7.33 8.51 6.68 6.77 8.15
2008 8.22 9.63 7.35 7.05 7.89 8.39 7.91 8.72 7.57 5.29
2009 8.21 9.3 8.86 7.93 8.07 9.61 9.51 9.8 8.12 5.67 7.43 6.44
2010 8.28
76.58 87.46 57.45 65.76 52.06 60.5 58.05 51.44 90.27 72.39 44.45 50.55
AVERAGE MONTHLY SUNSHINE HOURS 8.5 9.7 6.4 7.3 6.5 8.6 8.3 8.6 8.2 6.6 6.4 7.2

41
YEAR 2008 2009 2010 2011 2012
AVERAGE WIND SPEED (Knots)
AVERAGE MONTHLY SPEED (km/day)
AVERAGE MONTHLY SPEED (m/sec)
JAN 7.4 7.4 7.0 8.7 7.0 7.5 334.1 3.9
FEB 8.0 9.7 7.0 7.9 7.6 8.0 357.0 4.1
MAR 6.9 8.2 6.5 8.6 7.9 7.6 338.5 3.9
APR 7.4 7.9 6.6 8.3 6.4 7.3 325.8 3.8
MAY 9.9 7.8 8.2 8.7 7.8 8.5 377.6 4.4
JUN 7.9 9.6 7.7 6.5 6.3 7.6 337.2 3.9
JUL 7.9 10.5 9.1 6.5 6.9 8.2 363.3 4.2
AUG 9.1 9.5 8.3 9.0 6.1 8.4 373.6 4.3
SEP 7.8 8.4 7.7 8.6 4.8 7.5 331.9 3.8
OCT 6.1 7.2 7.1 6.1 5.4 6.4 283.0 3.3
NOV 6.0 7.0 6.1 5.2 4.9 5.8 259.6 3.0
DEC 6.4 6.4 7.0 6.1 6.9 6.6 291.6 3.4
Mean monthly speed = 3.8
1 knot = 44.448001 km/day 1 knot = 0.514444 m/sec

42
YEAR JAN FEB MAR APR MAY JUN JUL AUG SEP OCT NOV DEC
1997 12.17 9.24 10.36 10.07 9.22 8.67 13 13.19 12.83
1998 12.88 10.06 11.88 12.02 9.61 9.65 9.21 9.37 10.38 7.1
1999 7.87 7.59 10.7 10.14 10.37 9.56 9.63 9.98 9.21 10.14 10.25 10.31
2000 7.81 8.33 9.87 11.06 11.45 10.78 10.49 10.76 10.16 11.14 11.95 10.71
2001 11.75 9.78 11.16 12.23 11.89 10.16 9.63 10.43 9.24 10.63 12.03 9.71
2002 9.67 9.54 10.93 11.93 11.67 9.7 9.62 10.25 10.07 10.75 11.34 12.16
2003 8.63 9.7 10.47 11.78 12.84 10.56 9.85 10.5 9.68 10.3 11.54 8.89
2005 9.91 9.49 11.07 11.79 12.36 10.92 10.42 10.44 10.96 10.55 10.26 9.12
2007 9.42 10.2 10.1 11.34 11.36 11.34 10.57 10.75 10.68 11.22 11.21 9.2
2008 9.21 9.8 11.03 11.04 10.94 9.73 10.99 10.53 10.35 12.11 11.45 9.14
2009 9.62 10.39 11.21 11.46 11.71 10.36 10.62 10.5 10.5 12.5 11.55 11.84
2010 10.72 12.16 12.58 12.56 12.47 11.4 10.59 11.05 10.07 11.18 10.49 8.62
2011 8.74 9.1 11.14 11.45 10.33 10.02 10.89 10.86 11.38 12.4 9.86
2012 7.2 8.96 9.79 12.23 11.99 10.45 10.16 9.67 10.98 10.87
2013 9.92 9.1 11.09 10.69 10.15 10.1 11.22 10.48 11.41 11.24
2014 11.03 12.11 11.56 10.79 10.83 10.36
133.35 134.2 141.03 162.75 173.87 167.51 163.25 146.23 160.91 165.73 159.45 151.6
AVERAGE MIN MONTHLY TEMP 9.5 9.6 10.8 11.6 11.6 10.5 10.2 10.4 10.1 11.0 11.4 10.1

43
YEAR JAN FEB MAR APR MAY JUN JUL AUG SEP OCT NOV DEC
1997 82.2 77.6 76.4 77.0 75.5 68.2 78.6 85.2 84.4
1998 86.4 76.3 79.4 82.4 78.8 78.0 72.0 71.5 77.0 71.0
1999 67.6 56.2 75.6 76.0 71.8 68.1 72.1 69.9 61.2 66.5 76.3 76.4
2000 59.9 46.9 58.9 69.8 68.9 67.5 72.4 68.7 63.3 66.5 78.5 65.6
2001 73.7 62.8 69.9 79.0 70.4 72.5 76.5 72.8 66.9 69.1 82.7 72.0
2002 66.0 59.1 72.7 82.3 78.7 76.8 70.5 68.5 60.2 70.3 75.9 80.5
2003 64.7 52.5 62.9 74.8 81.1 75.5 75.1 77.3 65.6 71.7 78.9 74.4
2005 64.8 62.2 62.2 71.5 78.9 76.1 72.3 72.4 73.2 69.8 68.4 58.7
2007 70.9 62.8 58.2 76.0 74.6 78.8 78.7 74.8 71.5 74.0 72.1 63.7
2008 64.8 56.5 65.2 75.7 69.2 70.0 73.4 69.3 65.5 76.8 71.4 65.7
2009 60.7 57.1 57.9 67.3 72.4 65.1 65.1 67.3 62.3 71.4 71.4 75.3
2010 66.7 72.4 77.9 78.1 76.5 72.5 73.8 72.7 64.8 68.4 75.6 64.0
2011 58.0 49.1 68.4 73.4 75.8 76.3 76.6 72.8 71.8 80.9 76.0
2012 53.6 55.0 53.2 75.8 76.8 77.6 81.6 70.7 73.7 74.1
2013 66.4 55.4 66.4 77.8 76.6 74.5 69.4 65.0 76.6 75.2
2014 69.0 71.9 71.2 73.8 68.0 66.9
AVERAGE MONTHLY R.H (%) 66.0 58.9 65.4 75.4 75.0 73.8 74.6 72.0 67.2 71.0 76.5 71.8
44
YEAR JAN FEB MAR APR MAY JUN JUL AUG SEP OCT NOV DEC
1997 24.43 24.05 23.68 23.1 23.83 26.4 22.93 22.14 22.41
1998 23.48 25.85 26 25.02 24.18 23.63 25.13 25.65 22.99 25.17
1999 26.13 27.46 26.1 25.37 24.61 25.36 23.55 24.93 25.94 25.65 23.62 23.68
2000 26.2 27.57 27.97 26.57 25.8 24.86 24.57 24.55 26.16 25.14 23.6 24.83
2001 24.35 23.81 24.85 26.36 26.04 22.64 24.59
2002 26.01 28.19 27.02 24.74 24.87 24.96 25.38 25.23 26.75
2003 28.09 26.05 24.47 24.17 24.27 24.01 25.33 25.3 23.4 23.96
2005 27.34 28.51 28.35 26.04 24.22 23.89 22.71 24.62 24.9 24.49 24.71 26.52
2007 25.39 27.02 27.21 25.2 24.3 23.85 22.87 23.34 24.46 24.1 24.19 25.23
2008 26.03 27.09 27.18 24.94 24.66 24.59 23.66 24.55 25.89 23.93 23.5 25.21
2009 25.95 26.94 28.24 26.68 25.48 25.98 24.62 25.25 26.5 24.38 24.32 24.17
2010 24.92 26.61 24.44 24.29 24.39 23.8 23.3 23.85 24.67 25.48 23.53 26.13
2011 26.66 27.96 26.19 24.58 24.8 24.26 23.27 23.88 24.16 23.63 23.81
2012 26.23 27.03 28.08 25.84 24.31 24.06 23.86 25.18 24.75 24.34
2013 26.54 27.83 27.72 24.28 24.21 23.81 25.92 25.58 23.3 24.13
2014 26.57 24.82 24.89 24.17 24.97 25.23
310.88 328.06 326.97 332.34 345.58 391.7 381.97 341.06 408.7 347.58 305.57 344.18
AVERAGE MAX MONTHLY TEMP 25.9 27.3 27.2 25.6 24.7 21.8 23.9 24.4 25.5 24.8 23.5 24.6

45
year Jan Feb Mar Apr May June July Aug Sep Oct Nov Dec
1998 11.6
2000 25.6 23.26 20.21 21.23 21.2 20.67 21.02 22 18.99 17.49 21.54
2001 20.34 24.87 19.47 19.05 20.92 19.46 20.97 21.23 19.51 18.52 15.34 20.43
2002 20.78 24.53 19.54 17.02 20.14 21.04 22.42 20.94 20.84 17.43 19.96 17.84
2003 23.58 23.92 21.83 18.92 19.03 20.22 20.08 18.61 22.67 17.27 16.27 21.1
2005 22.62 25.05 21.32 18.58 17.8 20.74 18.6 20.44 20.55 18.41 18.26 22.17
2007 21.32 21.8 21.07 17.54 17.81 18.1 18.75 19.51 20.08 17.18 17.46 19.69
2008 20.23 22.64 19.56 17.75 19.34 18.78 18.92 19.5 19.72 16.43 17.96 20.55
2009 21.05 21.59 22.24 18.33 18.61 20.89 20.57 21.94 20.14 16.53 19.27 17.13
2010 20.86 18.95 18.3 15.8 19.48 18.94 18.36 18.62 19.29 17.68 15.02 20.15
2011 22.01 23.29 18.19 19.04 19.01 20.26 19.33 19.72 18.16 16.14 20.68
2012 24.56 22.74 23.37 16.77 17.05 18.42 18.95 20.39 17.04 16.77
2013 20.45 22.95 18.82 18.26 19.14 19.29 19.94 18.48 15.25 18.33
2014 20.13 17.63 19.07 19.42 19.72 19.91
237.8 277.93 248.91 198.16 228.08 254.13 257.11 240.15 264.76 212.12 188.42 247.98
TOTAL MONTHLY RADIATION (Mj/m2/day) 21.62 23.16 20.74 18.01 19.01 19.55 19.78 20.01 20.37 17.68 17.13 19.08
Avg radiation (kwh/m2) 6.01 6.43 5.76 5.00 5.28 5.43 5.49 5.56 5.66 4.91 4.76 5.30

46
Month
Net scheme irrigation requirement (mm/day)
Area of land (acre)
Area (m^2)
Daily water needs (mm/day)
Daily water needs (L/day)
No sun hours (hrs/day)
Pump flow rate (l/min)
Pump flow rate (l/sec)
Pump flow rate (m^3/min)
Pump flow rate
(m^3/hr)
Jan 4.0 0.25 1011.714 4.0 4046.9 8.5 7.935 0.1322 0.007935 0.4761
Feb 1.4 0.25 1011.714 1.4 1416.4 9.7 2.434 0.0406 0.002434 0.1460
Mar 0 0.25 1011.714 0 0 6.4 0.000 0.0000 0.000 0.0000
Apr 0 0.25 1011.714 0 0 7.3 0.000 0.0000 0.000 0.0000
May 0 0.25 1011.714 0 0 6.5 0.000 0.0000 0.000 0.0000
Jun 0 0.25 1011.714 0 0 8.6 0.000 0.0000 0.000 0.0000
Jul 0 0.25 1011.714 0 0 8.3 0.000 0.0000 0.000 0.0000
Aug 0 0.25 1011.714 0 0 8.6 0.000 0.0000 0.000 0.0000
Sep 0 0.25 1011.714 0 0 8.2 0.000 0.0000 0.000 0.0000
Oct 0.1 0.25 1011.714 0.1 101.2 6.6 0.256 0.0043 0.000256 0.01536
Nov 1.3 0.25 1011.714 1.3 1315.2 6.4 3.425 0.0571 0.003425 0.2055
Dec 4.0 0.25 1011.714 4.0 4046.9 7.2 9.368 0.1561 0.009368 0.5621
1 ℎ𝑒𝑐𝑡𝑎𝑟𝑒 ≡ 2.4710 𝑎𝑐𝑟𝑒𝑠 ≡ 10000𝑚2
1
4 𝑜𝑓 𝑎𝑛 𝑎𝑐𝑟𝑒 ≡ 1011.714𝑚2

47
DIAMETER (m)
AREA, A (m^2)
FLOW RATE, Q (m^3/sec)
VELOCITY (m/sec)
PIPE LENGTH(m) ϑL^2 CR^0.63
HEADLOSS (m)
0.025 0.000491 0.000156 0.324
6 11.656
5.722 3.72985241
0.032 0.000805 0.000156 0.198
6 7.114
6.685 1.12217745
0.04 0.001257 0.000156 0.126
6 4.553
7.694 0.37891855
0.05 0.001964 0.000156 0.081
6 2.914
8.855 0.12794703
0.063 0.003119 0.000156 0.051
6 1.835
10.243 0.04156017
0.075 0.004420 0.000156 0.036
6 1.295
11.432 0.01779337
0.09 0.006364 0.000156 0.025
6 0.899
12.823 0.00732828
0.11 0.009507 0.000156 0.017
6 0.602
14.551 0.00276040
0.16 0.020114 0.000156 0.008
6 0.285
18.426 0.00044589
0.2 0.031429 0.000156 0.005
6 0.182
21.207 0.00015056
Where 𝜗 = 𝑄
𝐴

48
DIAMETER (m) AREA (m^2)
FLOW RATE (m^3/sec)
VELOCITY (m/sec)
PIPE LENGTH(m) ϑL^2 CR^0.63
HEADLOSS (m)
0.025 0.000491 0.000159 0.324
10 32.37818182
5.722 24.6906214
0.032 0.000805 0.000159 0.198
10 19.76207386
6.685 7.4285134
0.04 0.001257 0.000159 0.126
10 12.64772727
7.694 2.5083391
0.05 0.001964 0.000159 0.081
10 8.094545455
8.855 0.8469750
0.063 0.003119 0.000159 0.051
10 5.098605099
10.243 0.2751172
0.075 0.004420 0.000159 0.036
10 3.597575758
11.432 0.1177873
0.09 0.006364 0.000159 0.025
10 2.498316498
12.823 0.0485112
0.11 0.009507 0.000159 0.017
10 1.672426747
14.551 0.0182731
0.16 0.020114 0.000159 0.008
10 0.790482955
18.426 0.0029516
0.2 0.031429 0.000159 0.005
10 0.505909091
21.207 0.0009967

49
APPENDIX 7: DATA ANALYSIS
Determination of crop water requirements and irrigation requirements using CROPWAT 8.0

50

51

52

53

54

55

56

57
APPENDIX 8: SELECTION CHARTS
A WATER PIPE SIZING CHART FOR PLASTIC (PVC) PIPES
(Source: Dankoff Solar, Pipe Sizing Chart (Water) http://www.affordable-solar.com/Learning-
Center/Water-Pumping/pipe-sizing-chart)

58
PVC pipe technical specifications (Davis & Shirtliff product catalogue)
59
PV module technical data (source: Davis & Shirtliff 2014 product catalogue)
Charge controller technical specification (Davis &Shirtliff 2014 Product catalogue)

60
Shurflo Pumps (courtesy of Davis and Shirtliff 2014 product manual)
Price list for the SFPP model 3020 pump (source:

61
Image of the solar force piston pump (source:

62
APPENDIX 8: SYSTEM LAYOUT
AutoCAD drawing of the layout of the Solar powered Piston Pumping System
63
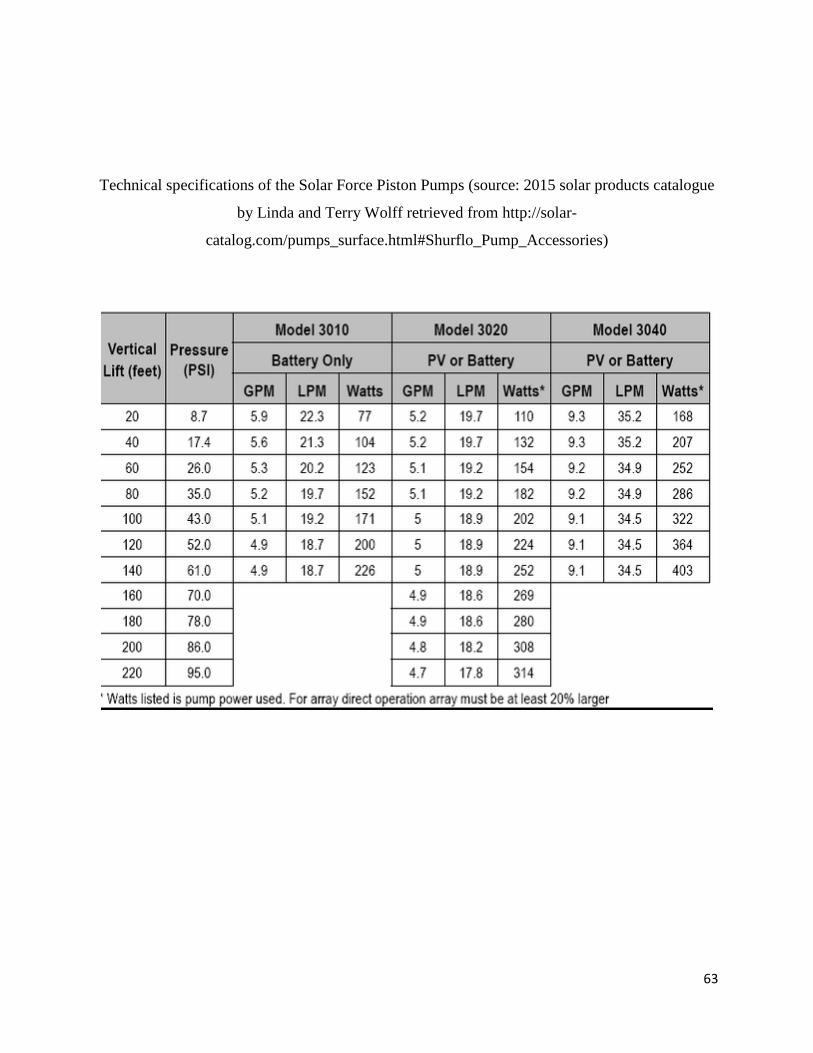
Technical specifications of the Solar Force Piston Pumps (source: 2015 solar products catalogue
by Linda and Terry Wolff retrieved from http://solar-
catalog.com/pumps_surface.html#Shurflo_Pump_Accessories)

64
APPENDIX 9: BUDGET
ACTIVITY
NO.
ACTIVITY ESTIMATED COSTS
(ksh)
1. Travel costs 850
2. Communication 1000
3. Stationery 1000
4. Documentation 1500
TOTAL = 6200

65
APPENDIX 10: WORK SCHEDULE
ACTIVITY WEEK NUMBER (16/02/2015 – 29/05/2015)
1 2 3 4 5 6 7 8 9 10 11 12 13 14 15
1
Preparation of
project proposal
2
Submit project
proposal
3
Project proposal
presentation
4 Site visit
5
Acquisition of
secondary data
6
Data analysis and
documentation
7
Development of
alternative designs
8
Selection of
optimal design
based on
performance
9
Testing and re-
designing
10 Cost analysis
11
Submit draft
project report
12
Submit final
project report

66