Department of Engineering Science Department of Zoology Soft partitioning in networks via Bayesian...
40
Department of Engineering Science Department of Zoology Soft partitioning in networks via Bayesian nonnegative matrix factorization Ioannis Psorakis, Steve Roberts, Mark Ebden , and Ben Sheldon [email protected] Pattern Analysis and Machine Learning Research Group (Engineering Science) Edward Grey Institute (Zoology)
-
Upload
elmer-wilkins -
Category
Documents
-
view
222 -
download
1
Transcript of Department of Engineering Science Department of Zoology Soft partitioning in networks via Bayesian...

Department of Engineering ScienceDepartment of Zoology
Soft partitioning innetworks via Bayesiannonnegative matrix factorization
Ioannis Psorakis, Steve Roberts, Mark Ebden, and Ben [email protected] Analysis and Machine Learning Research Group (Engineering Science)
Edward Grey Institute (Zoology)

Department of Engineering ScienceDepartment of Zoology
Soft partitioning innetworks via Bayesiannonnegative matrix factorization
Ioannis Psorakis, Steve Roberts, Mark Ebden, and Ben [email protected] Analysis and Machine Learning Research Group (Engineering Science)
Edward Grey Institute (Zoology)

Page 3
The Network Paradigm
An example artificial graph
Page 4
These are Erdős-Rényi random graphs and have been extensively studied in classic Graph Theory.

Real-world networks have a unique structure
Page 5
Neither fully ordered… …nor completely random

Page 6
Such structure emerges from the self-organizational mechanisms of their individual components.

Property 1: power-law degree distribution
Page 7

Property 2: small-world effect
Page 8
Increased transitivity – triangle formation High degree nodes (hubs) act as “shortcuts” between
individuals “Six degrees of separation” in popular culture
Small geodesic distances / shortest paths between node pairs
Source: Mark Newman, SIAM Review 2003

Property 3: Community Structure
A given real-world network is assumed to be clustered into a number of latent classes of nodes.
These nodes form regions of increased connectivity in the network.
These communities usually reflect functional modules that affect the overall behavior of the system.
Examples: friend cliques in social networks, similar proteins in a protein interaction network, research groups in a scientific collaboration network.
Page 9

The Stochastic Block Model
Page 10
Think of it as an ergodic Markov chain with transition matrix P
On average, a random walker will spend more time inside a community than outside, owing to increased link density.

Community detection
Page 11

Problems:
Community detection isn't quite graph partitioning – the number K of modules is not known a priori.
Unsupervised learning task; “ground truth” not available. The quality of our solution is usually expressed via some
quality function. B defines a large solution space, where brute force
explorations lead to combinatorial explosion in complexity.
Page 12
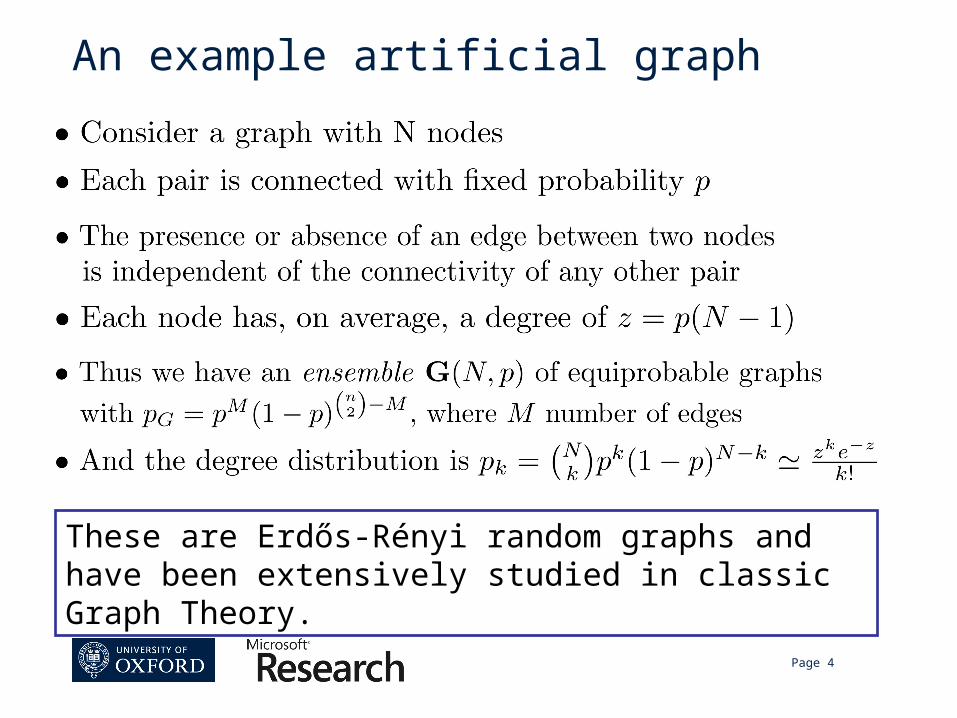
The Newman-Girvan modularity
Page 13
(the most popular quality function)
Key idea: a “good” grouping of nodes will be the one that yields statistically surprising link density.
For a network V: [N x N], we propose a community partitionB: [N x K].
We define a null network V(null), which has the same number of nodes as V, same degree per node, but edges fall at random without any regard to community cohesion.
Thus given B, for each group-k of nodes we measure how larger is the fraction of intra-community links in V compared to V(null).
The sum for all communities proposed in B is called modularity Q.

Formulation
Page 14

Some further notes on modularity
The theoretical value range of Q is from -1 to 1. Most real-work networks yield Q values from 0.3 to 0.7
(Newman and Girvan 2004). Modularity allows us to compare different divisions only for the
same network Modularity is a special case of the Hamiltonian in a K-state
Potts model (Reichardt et al. 2006) Modularity can't be applied to solutions B that describe
overlapping communities. Direct optimization of modularity is an NP-hard problem. Modularity tends to favour solutions with a small number of
communities – the “resolution limit problem” (Fortunato et al. 2007).
Page 15

Many popular community detection algorithms are based on approximating Qmax
Their main problem is that they cannot describe overlaps between communities…
… nor provide some measure of participation strength of nodes to groups
Page 16
Source: Mason Porter
Many of them have been applied with significant success on social and biological networks.

Nonnegative Matrix Factorization
Page 17
We decompose our data matrix V to a product of two other matrices W, H under nonnegativity constraints.
Nonnegativity constraints avoid the problem of an ill-posed solution. They also reflect the idea of parts-based representation: our data V can be
expressed as a additive combination of certain basis structures defined by w :k,
given an encoding hk:.
(Lee and Seung, 1999)

Nonnegative Matrix Factorization
Page 18
(Lee and Seung, 1999)

Application to networks
Page 19
The overall network structure can be seen as a summation of different subgraphs.
Nonnegative constraints arise naturally in many applications, where link weights denote interaction counts.
Factorization of the adjacency matrix can be seen as a bipartite expansion, where each factor is the community matrix B.
NMF is a low-rank approximation and community structure can be seen as a compressed representation of the original network.

The Poisson noise model
Page 20

The factorization
Page 21

Two issues to address:
Page 22
Inference problem
Model order selection problem

The graphical model
Page 23

Posterior:
Page 24

Likelihood function
Page 25

Priors on w,h
Page 26
Independent Half-Normal distributions with common precision parameters βk
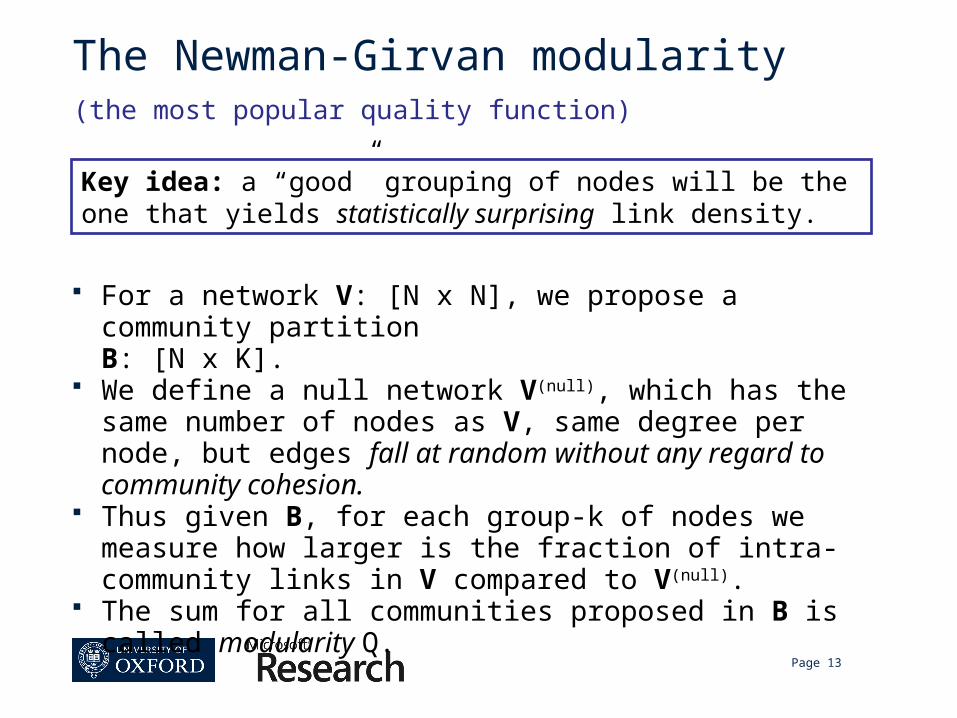
Hyper-priors on βk
Page 27
Conjugate Gamma with fixed hyper-hyper parameters α, b

Cost function:
Page 28

Page 29
Parameter inference:

Results
Page 30
[N X N] = [N X K*] [K* X N]
W*,H* describe a bipartite network of node allocations to communities. If our original adjacency matrix V is symmetric, then W* = H*
T. Each wik or hki denotes the participation strength of node i to community k. The i-th row of W or column of H describes a soft-membership distribution
of node i across communities. Varying node participation scores allow us to describe overlaps between
communities in a disciplined manner.

Example
Page 31

Example
Page 32
Given this toy network:
Many popular community detection algorithms do not agree on a single solution.

Example
Page 33
Our method allows communities to overlap.
“Broker” nodes are allowed to participate to multiple groups.

Example
Page 34
We not only allow community overlaps, but we also quantify how strongly an individual belongs to a certain group via the soft-membership distribution.
Additionally, we can quantify the degree of fuzziness in a community via the entropy of the soft-membership distributions.

Results of NG random graphs
Page 35
We retain state-of-the-art module identification accuracy regardless of how fuzzy community organization becomes.
We also quantify the network “fuzziness” via the mean entropy of the node soft-membership distributions.

Modularity results on benchmark datasets
Page 36

Page 37

You may want to have a look at:
“Overlapping Community Detection using Bayesian Nonnegative Matrix
Factorization” by I. Psorakis, S. J. Roberts M. Ebden and B. Sheldon
(2011), Phys. Rev. E (to appear).
“Finding and evaluating community structure in networks”, M.E.J.
Newman, M. Girvan (2004), Phys. Rev. E.
“Community Detection in Graphs” by Santo Fortunato (2010), Physics
Reports.
“Communities in Networks”, M. Porter, J.P. Onnella, P. Muncha, J. Gibbs
(2009), Notices of the American Mathematical Society.
Page 38

Extra slides
Page 39


![Nonnegative Tensor Factorization for Source Separation of ... · [Rafii, Liutkus, & Pardo 2014] NMF can handle many types of repetition: Method. Nonnegative tensor factorization](https://static.fdocuments.us/doc/165x107/5f73cd6a4279576c155c076c/nonnegative-tensor-factorization-for-source-separation-of-raii-liutkus.jpg)