Dental Practice Salary, Benefits & Operations...
13
2010 Dental Practice Salary, Benefits & Operations Questionnaire 1
-
Upload
nguyenphuc -
Category
Documents
-
view
217 -
download
4
Transcript of Dental Practice Salary, Benefits & Operations...

2010Dental Practice Salary, Benefits& Operations Questionnaire
1

Dear Clients and Friends,
�ank you for your participation in our 2010 Dental Questionnaire.
Bender, Weltman, �omas, Perry & Co, PC, CPAs has worked with the dental community since 1982providing accounting, tax, retirement plan and business advisory services leading to the financial successof our clients.
Sincerely,
Bender, Weltman, �omas, Perry & Co, PC
We are excited to present to you our 2010 Dental Questionnaire. We are confident our dentalquestionnaire will allow you to easily locate and interpret the information provided.
For a list of additional services we provide, please refer to the next page or visit our website atwww.bwtpcpa.com. Please contact Angela �omas, Director of Client Development, at 314.576.1350,913.681.1350, toll free at 877.253.5084 or [email protected], if you have any questions regardingour 2010 Dental Questionnaire.
1

Dental Industry Services
We are the only CPA firm in Missouri that is a member of the Academy of Dental CPAs(ADCPA), the most prestigious group of Dental CPAs in the country, representing over 6,000dental practices.
We offer comprehensive fee analyses for your practice to help you set the right fees and increaseprofit margins for your dental practice.
Our firm is proud to support future dental practitioners through our involvement at variousconventions and presentations.
•
•
•
Established in West St. Louis County, and now with a location in the Metropolitan Kansas City area,Bender Weltman, !omas, Perry & Co, PC (BWTP) has experienced exceptional growth since 1982. Inaddition to our most important role as trusted advisors for our clients, we provide comprehensiveaccounting, tax, retirement plan and financial planning services to numerous dental practices of all sizesconcentrated in the three state area [Illinois, Kansas and Missouri]. Since our inception in 1982, we havegrown from a two-man office to a medium size accounting firm.
Bender, Weltman, !omas, Perry & Co, PC, has the advantage of working with more than 290 dentalprofessionals. We take the time to provide you with specific dental information in order to assist and helpyou run a competent and efficient practice.
In addition:
1

Retirement Services
For more information on how Bender, Weltman, �omas, Perry & Co, PC, CPAs can help your dental
Proud Member of the Academy of Dental CPAs
Our ServicesOur firm provides a full range of cost effective services including the following:
Accounts Receivable AnalysisBilling Procedures AnalysisCertified Fraud ExaminerConsultingDental Specific Management Reports andFinancial StatementsDental Statistic CompilationDental Fee AnalysisDental Salary AnalysisEmbezzlement Controls Evaluationand DetectionEstate and Trust Tax PreparationFinancial Projections
•••••
••••
••
Gift Tax PreparationInternal Controls EvaluationMarketingNew Practice Set-UpPersonal Financial SpecialistPractice Management/Analyze Financial StatementsQualified Plan Financial ConsultantQuickBooks® Pro Advisor with Certified StaffRetirement Plan DesignSales and Use Tax ServicesStudy Club PresentationsValuation of a Dental PracticeWealth Accumulation
•••••••••••••
practice, please contact Angela �omas, Director of Client Development, at 314.576.1350, 913.681.1350,toll free at 877.253.5084 or [email protected].
• 401 (k) Plan Audits• Annual Notices and Employee Communication• Client Support• Distributions• Employee Education and Enrollment Meetings• Filing of Form 5500• IRS Representative for Audits or Notices
• Loans• Plan Administration• Plan Amendments• Plan Design and Implementation• Plan Document Preparation• Preparation of Summary Annual Report
1

Salaries
Lowest Highest Average Mode*National
average**
Self (salaried)
Associate (salaried)
Hourly numbers apply to the following:
Hygienist
Receptionist
Chairside assistant
Treatment Coordinator
OfÞce Manager
*Mode - most common number reported.
**National average was obtained from the November 2010 issue of the Dental Economics/Levin Group Practice Survey .
80% of the practices that have Associates said they treat their Associates as
W-2 employees vs. 1099 Independent Contractors (IC)
W-2 employed Associates were paid on average 31% of collections after lab while the IC were paid an average
of 30% of collections after lab
77% of the practices that have Associates said they pay based on Collection vs. Production
20% of practices paid for malpractice insurance for their Associates, 80% did not
27% of practices paid for professional dues for their Associates, 73% did not
$45,000
$24,000
$12.00
$10.25
$9.50
n/a
$14.00
$700,000
$250,000
$44.00
$27.00
$35.00
n/a
$33.06
$233,914
$108,570
$32.77
$18.00
$18.22
n/a
$24.51
$200,000
n/a
$32.00
$18.00
$18.00
n/a
$26.00
$226,265
n/a
$36.24
$18.05
$18.05
$18.97
$24.45
Average salaries based on years of experience
1 year 2 - 4 years 5 year 10 years
Hygienist
Chairside assistant
Receptionist
OfÞce manager
$27.00
$13.67
$14.83
n/a
$30.32
$14.60
$15.46
$23.44
$31.82
$16.75
$17.70
$22.15
$34.31
$20.35
$20.40
$25.26
© 2010 BWTP. This dental questionnaire may not be redistributed without the written consent of Bender, Weltman, Thomas, Perry Co, PC, 314-576-1350, 913-681-1350, 877-253-5084.
4

Benefits
Associates Hygienists Assistants ReceptionistsOfÞce
managersNot offered
Medical insurance
Life insurance
Retirement plan
401(k)
Paid sick leave
Paid vacation
Continuing ed
Uniforms
Bonus programs
The above percentages represent those practices that pay for each of the benefits listed above.
For example, 67% of the practices who responded to our survey pay medical insurance for their Associates.
For those practices that do provide beneÞts for medical insurance:
37% pay 100% of employee health care premiums
13% pay 75% of employee health care premiums
13% pay 70% of employee health care premiums
33% pay 50% of employee health care premiums
4% pay 25% of employee health care premiums
Due to the rising cost of medical insurance, some dental practices are paying a set amount towards the
employee’s insurance premiums on a monthly basis. For those dental practices that pay a portion of the
employee’s premium:
$90 per month, is the lowest amount paid
$200 per month, is the highest amount paid
$142.50 per month, is the average amount paid
$100 per month, is the most common amount paid
58% of the practices do not offer bonus programs. Bonus programs can be great for getting your team motivated.
There are several types of bonus programs that dentists use to motivate their team. Your bonus program does
not have to be complicated, but offering your team an incentive plan can help improve their dedication to their
job and the practice.
67%
25%
50%
42%
9%
58%
83%
58%
17%
52%
22%
54%
57%
54%
96%
67%
63%
39%
56%
20%
51%
60%
60%
84%
64%
65%
40%
60%
23%
50%
58%
52%
96%
71%
77%
38%
55%
24%
45%
52%
55%
94%
73%
67%
33%
50%
90%
52%
38%
44%
0%
14%
16%
58%
14% of the practices do not offer reimbursement for continuing education. Offering to pay for continuing education
would beneÞt both the employee and the practice. There are several types of continuing education classes and
seminars that help to motivate and teach various topics to all of those involved in promoting your practice.
© 2010 BWTP. This dental questionnaire may not be redistributed without the written consent of Bender, Weltman, Thomas, Perry Co, PC, 314-576-1350, 913-681-1350, 877-253-5084.
5

Benefits
Examples of common bonus programs currently being used in dental practices:
Employee raises:
45% of the practices give raises annually (year-end)
25% of the practices give raises annually (date of hire)
29% of the practices give raises other than on an annual basis, some examples are:
Sick days:
How many “paid” sick days do your team members receive after?
Lowest Highest Average
1 year 0 6 3
2 years
5 years
10+ years 1 10 4
Weeks of paid vacation based on years of service:
Lowest Highest Average Mode*
1 year
2 years
5 years
10+ years
All answers are based on a 40 hour work week, not days worked in a week. All answers are in week format.**Mode – most common number reported.
Year-end performance bonusSet percent if production goals are metHoliday bonusSet amount if daily and monthly goals are metAnnual bonus based on length of employment
Based on meritWhen ofÞce production and collection warrantsWhen fees are raisedDependent on year-end numbers and work ethic
0 6 3
1 6 4
0.5 2 1 1
1 4 2 2
1.5 4 3 2
1.5 5 3 3
61% of the people who answered this survey believe that bonus programs serve as a positive motivationalfactor for their team
Do You Have a Retirement Plan?
81% of the people who responded to this survey have a retirement plan.
© 2010 BWTP. This dental questionnaire may not be redistributed without the written consent of Bender, Weltman, Thomas, Perry Co, PC, 314-576-1350, 913-681-1350, 877-253-5084.
6
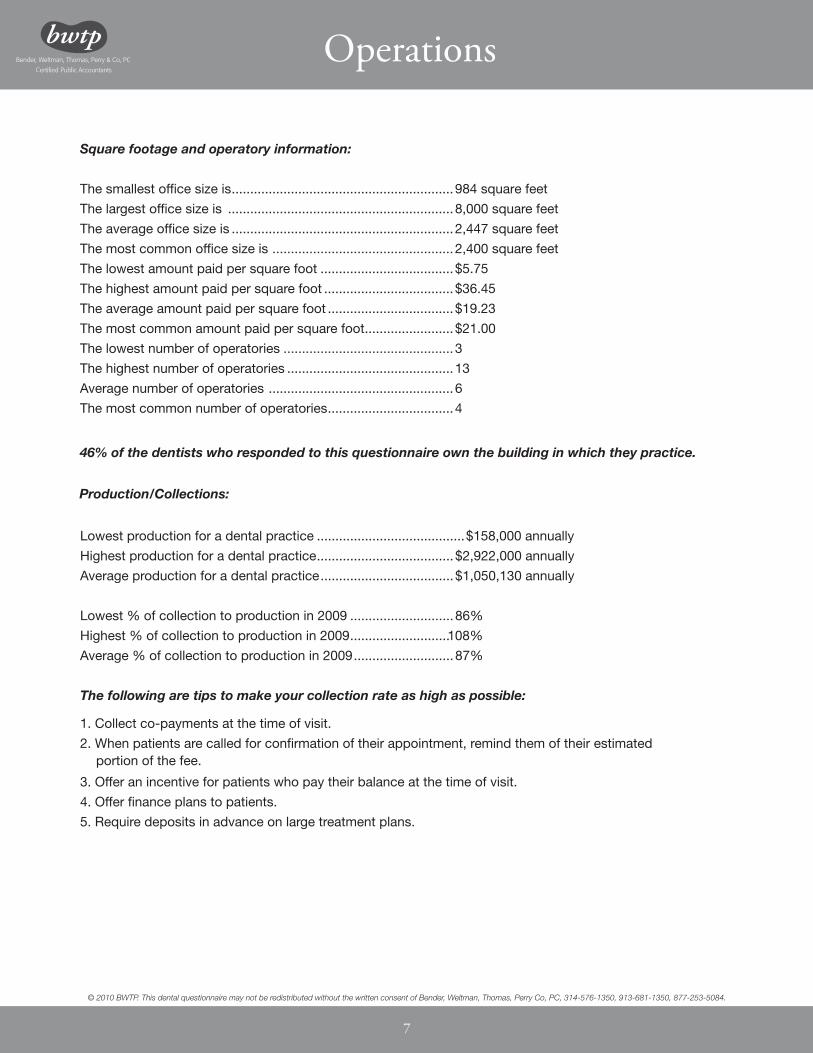
Square footage and operatory information:
The smallest ofÞce size is............................................................984 square feet
The largest ofÞce size is .............................................................8,000 square feet
The average ofÞce size is ............................................................2,447 square feet
The most common ofÞce size is .................................................2,400 square feet
The lowest amount paid per square foot ....................................$5.75
The highest amount paid per square foot ...................................$36.45
The average amount paid per square foot ..................................$19.23
The most common amount paid per square foot........................$21.00
The lowest number of operatories ..............................................3
The highest number of operatories .............................................13
Average number of operatories ..................................................6
The most common number of operatories..................................4
46% of the dentists who responded to this questionnaire own the building in which they practice.
Operations
Lowest production for a dental practice ........................................$158,000 annually
Highest production for a dental practice.....................................$2,922,000 annually
Average production for a dental practice....................................$1,050,130 annually
Lowest % of collection to production in 2009 ............................86%
Highest % of collection to production in 2009...........................108%
Average % of collection to production in 2009...........................87%
The following are tips to make your collection rate as high as possible:
1. Collect co-payments at the time of visit.
2. When patients are called for conÞrmation of their appointment, remind them of their estimatedportion of the fee.
3. Offer an incentive for patients who pay their balance at the time of visit.
4. Offer Þnance plans to patients.
5. Require deposits in advance on large treatment plans.
Production/Collections:
© 2010 BWTP. This dental questionnaire may not be redistributed without the written consent of Bender, Weltman, Thomas, Perry Co, PC, 314-576-1350, 913-681-1350, 877-253-5084.
7

Total number of patients seen per year by:
DENTIST
ASSOCIATE
HYGIENIST
840 7,500 2,492
200 3,420 1,321
565 4,017 2,037
Do you offer a discount to patients who pay at the time services are rendered?49% of dental practices offer a discount51% of dental practices do not offer a discount
For those dental practices that do offer a discount:
4% is the lowest discount offered10% is the highest discount offered7% is the average discount offered5% is the most common discount offered
What practice management software does your practice use?
44% Dentrix26% Eaglesoft11% Softdental5% EZ Dental4% Practice Works2% Data Tec8% Use other software programs such as Diamond Dental (formerly 2 Start),
Proprietary Software, etc.
How many hours a week do you work?
Do you provide your patients with a dental newsletter?
12% offer their patients a dental newsletter.
Highest hours worked
Lowest hours worked 24
34
40
32
Average hours worked
Most common answer
Lowest Highest Average
General Practice Information
© 2010 BWTP. This dental questionnaire may not be redistributed without the written consent of Bender, Weltman, Thomas, Perry Co, PC, 314-576-1350, 913-681-1350, 877-253-5084.
8

Fees
How often do you increase your fees?88% of the dentists increase their fees annually
4% of the dentists increase their fees semi-annually8% of the dentists increase their fees at other times
Contact Angela Thomas in our office at 314-576-1350, 913-681-1350 or toll free at 877-253-5084 if you are interestedin having a fee analysis prepared for your practice.
What percent do you increase your fees annually?Lowest: 2.5%Highest: 10%Average: 4%Most common answer: 3%
What months do you increase your fees annually?48% raise their fees in January14% raise their fees in February
8% raise their fees in November8% raise their fees in December
22% raise their fees in other months of the year. Some months commonly mentioned were April, June and July.
© 2010 BWTP. This dental questionnaire may not be redistributed without the written consent of Bender, Weltman, Thomas, Perry Co, PC, 314-576-1350, 913-681-1350, 877-253-5084.
9

Fees
Lowest Highest Average Mode*
0120 – Periodic oral evaluation
0274 – Bitewing, four Þlms
0330 – Panoramic Þlm
1110 – Adult prophy, including exam
1351 – Sealant, per tooth
2140 – Amalgam, 1 surface
2610 – Inlay, ceramic/porc., 1 surface
2750 – Crown, porcelain with high noble metal
2950 – Core buildup, including any pins
3110 – Pulp cap, direct, excl. restoration
3330 – RCT – molar
4210 – Gingivectomy, per quad, 4+
4341 – Scaling/root plan per quad 4+
5110 – Complete upper alone
5120 – Complete lower alone
7140 – Erupted tooth/exp root
7210 – Surgical – erupted tooth
9230 – Nitrous Oxide analgesia
9972 – External bleaching, per arch
9974 – Internal bleaching, per arch
We asked our participants to list their fee for each selected ADA procedure code (in whole dollars)
*Mode – most common number reported.
$85.00
$390.00
$125.00
$149.00
$60.00
$180.00
$1,155.00
$1,379.00
$369.00
$275.00
$1,050.00
$696.00
$308.00
$2,500.00
$2,500.00
$265.00
$402.00
$175.00
$829.00
$431.00
$25.00
$20.00
$45.00
$30.00
$16.00
$50.00
$300.00
$750.00
$105.00
$45.00
$701.00
$85.00
$30.00
$795.00
$155.00
$71.00
$150.00
$20.00
$100.00
$125.00
$46.47
$62.11
$100.47
$86.40
$46.34
$124.17
$807.50
$980.06
$238.44
$84.63
$905.58
$495.70
$227.00
$1,485.46
$1,460.93
$150.24
$254.21
$61.78
$236.87
$251.38
$46.00
$60.00
$108.00
$85.00
$50.00
$127.00
$850.00
$950.00
$250.00
$80.00
$950.00
$555.00
$250.00
$1,350.00
$1,350.00
$150.00
$250.00
$80.00
$150.00
$150.00
We want to thank everyone who participated in completing our dental questionnaire.
© 2010 BWTP. This dental questionnaire may not be redistributed without the written consent of Bender, Weltman, Thomas, Perry Co, PC, 314-576-1350, 913-681-1350, 877-253-5084.
10

Notes
© 2010 BWTP. This dental questionnaire may not be redistributed without the written consent of Bender, Weltman, Thomas, Perry Co, PC, 314-576-1350, 913-681-1350, 877-253-5084.
11

Notes
© 2010 BWTP. This dental questionnaire may not be redistributed without the written consent of Bender, Weltman, Thomas, Perry Co, PC, 314-576-1350, 913-681-1350, 877-253-5084.
12