
Demystifying College Costs: How Nudges Can and Can't Help
59
WORKING PAPER • No. 2021-7 Demystifying College Costs: How Nudges Can and Can’t Help Elizabeth Linos, Vikash Reddy, Jesse Rothstein November 2021 www.capolicylab.org @capolicylab peoplelab.berkeley.edu @UCB_PeopleLab
Transcript of Demystifying College Costs: How Nudges Can and Can't Help

WORKING PAPER • No. 2021-7
Demystifying College Costs: How Nudges Can and Can’t Help Elizabeth Linos, Vikash Reddy, Jesse Rothstein November 2021
www.capolicylab.org @capolicylab
peoplelab.berkeley.edu @UCB_PeopleLab

Demystifying College Costs: How Nudges Can and Can’t Help
Elizabeth Linos University of California, Berkeley
Vikash Reddy Campaign for College Opportunity
Jesse Rothstein University of California, Berkeley and NBER
November 2021
Abstract: As US college costs continue to rise, governments and institutions have quadrupled financial aid. Yet, the administrative process of receiving financial aid remains complex, raising costs for families and deterring students from enrolling. In two large-scale field experiments (N= 265,570), we test the impact of nudging high-school seniors in California to register for State scholarships. We find that simplifying communication and affirming belonging each significantly increase registrations, by 9 per cent and 11 per cent respectively. Yet, these nudges do not impact the final step of the financial aid process -- receiving the scholarship. In contrast, a simplified letter that affirms belonging while also making comparable cost calculations more salient significantly impacts college choice, increasing enrollment in the lowest-net-cost option by 10.4 per cent. Our findings suggest that different nudges are likely to address different types of administrative burdens, and their combination may be the most effective way to shift educational outcomes.
Acknowledgments: We are very grateful to the California Student Aid Commission for its role in this project. Lupita Alcalá, David O’Brien, Catalina Mistler, Jessica Moldoff, and Patrick Perry in particular, were close collaborators at every stage. We also thank Christian Osmeña for his assistance in fostering this collaboration. Miranda Boyden and Samantha Fu provided excellent research assistance. We are grateful to Laura Szabo-Kubitz, Jessica Thompson; seminar participants at the University of Nevada, Reno; and participants at a conference sponsored by The Institute for College Access and Success for feedback. Funding for this work came from the Abdul Latif Jameel Poverty Action Lab, Arnold Ventures (formerly the Laura and John Arnold Foundation), and the James Irvine Foundation. This work reflects the views of the authors and not necessarily the views of our funders, the Regents of the University of California, or the California Student Aid Commission.

2
Introduction
Fewer than two-thirds of US high school seniors enroll in college immediately
after completing high school (NCHEMS, n.d.). This share is much lower for students
from low-income families, for those whose parents did not go to college, and for those
from underrepresented minority groups (Wilbur and Roscigno, 2016). Indeed, the shares
of high-achieving, low-income students who go to college are lower than the equivalent
shares of lower-achieving students from higher income families (Fox, Connolly and
Snyder, 2005).
Cost is a key barrier to college access. Rapidly increasing college tuition affects
both the decision to go to college in the first place, leaving some students out of college
completely, and college selection, leading some students to enroll at less selective options
with lower tuition -- sometimes referred to as the “sticker price” -- despite evidence that
attending more selective schools is good for long-run outcomes (Cohodes and Goodman,
2014; Dynarski et al., 2021). In response, policymakers have made significant
investments in financial aid programs that aim to increase college access, particularly at
selective, four-year institutions. Total grant aid to students is roughly $125 billion per
year, quadruple (in real terms) its level a decade ago (Seltzer, 2017; Trends in Student
Aid, 2017). Nevertheless, aid programs fail to reach all students who would benefit from
them. One analysis found that more than 20 percent of California community college
students who were eligible for a Pell Grant did not receive it, leaving almost $130 million
in financial aid on the table in a single semester (Martorell and Friedmann, 2018).
Another study finds that students who do not fill out the FAFSA leave $24 billion on the
table (Kofoed, 2017).

3
One potential explanation for this gap in take-up is the burdens associated with
applying for and receiving financial aid, a process that is notoriously complex and
difficult to navigate. Herd and Moynihan (2019) provide a useful framework for
understanding these and other types of administrative barriers. First, there may be
learning costs: students may not take-up financial aid for which they are eligible because
they may incorrectly calculate the value of going to college or the true cost of going to
college for them. The latter is, in itself, a function of how aid is presented. Second, there
may be compliance costs: even for students who understand the rules and availability of
aid, the numerous actions required to qualify for financial aid may create too many
hurdles. Students must complete FAFSA forms, much more complex than annual income
tax returns (The Hamilton Project, 2007); comply with requests to verify their financial
and family details; and collect and combine grant and loan aid offers from federal, state,
and institutional sources that are not coordinated. Last, students may face psychological
barriers when making high-stakes college decisions that limit their ability to take up aid,
and have long-lasting effects for their lives.
Behavioral science evidence is mixed on whether outreach efforts to reduce such
barriers and increase take-up could impact student decision-making. Some studies have
found that direct assistance with aid applications (Bettinger et al., 2012) and a clear
guarantee about the specific amounts of aid availability (Dynarski et al., 2018) have
meaningful effects on college enrollment decisions, even without changes in the
underlying structure of aid. It is noteworthy that both of these successful interventions
tackle compliance burdens as well as informational barriers. In the former, direct
assistance is provided in filling out the FAFSA; in the latter, a guarantee of a full

4
“scholarship” eliminates the need to go through the complex aid process. On the other
hand, recent attempts to scale up successful “nudge” interventions aimed at encouraging
financial aid applications have shown no impact on take-up (Bird et al., 2019),
enrollment (Hyman, 2019), or school choice (Gurantz et al., 2019).
We contribute to this literature by explicitly testing whether nudges that reduce
psychological and learning barriers can impact decision-making on three margins --
accessing financial aid, going to college, and choosing which school to attend -- in a
setting where we can test these barriers head-to-head and in combination. Unlike other
studies, we can directly compare the effects of interventions that reframe college aid with
those providing concrete and personalized cost information, and can estimate effects both
on the outcomes being nudged and on longer term outcomes of greater long-run
importance. This allows us to assess the relative importance of different barriers at one
key stage in the process and to understand whether previous evidence that nudges fail
(Bird et al., 2019; Gurantz et al., 2019; Hyman, 2019) reflects the specific nudges that
were selected or represents a limit to what is possible through outreach campaigns.
In collaboration with the California Student Aid Commission (CSAC), which
administers state-level financial aid for California (known as the “Cal Grant”), we ran
two large-scale field experiments (total N=265,570) that aimed to increase knowledge
and take-up of financial aid. The Cal Grant both lowers the cost of college and changes
the relative cost of different school options, and past studies have found impacts on
enrollment, college completion, and earnings (Kane, 2003; Bettinger et al., 2019).

5
We test several variants of notification letters sent to eligible students, in the
middle of their senior years of high school. We find striking evidence that simplified,
behaviorally informed letters lead to increased Cal Grant account registration rates. In
year 1, simplifying the letter and adding language emphasizing social belonging
significantly increases registrations by 9 per cent and 11 per cent (5.5 and 6.8 percentage
points), respectively, compared to the baseline letter. In year 2, we find that both a
belonging message and a social norm message have small positive, albeit statistically
insignificant, effects on account registration, of 1.6 per cent and 2.6 per cent (1.1 and 1.7
p.p.), respectively, compared to the baseline simplified letter. However, combining the
belonging language with individualized information on net costs significantly increases
registration by 4.6 per cent (3.0 p.p.) over the simplified letter.
When we turn to Cal Grant payout, a proxy for enrollment, we do not see
statistically significant increases in overall payouts from any of the letter variants. That
is, despite sizeable changes in behavior in the first stage of the process -- registering for a
Cal Grant account – that indicates that one administrative barrier was meaningfully
lowered, we do not see second stage impacts on overall take-up of the grant. However,
we find evidence that the net cost letters, which aimed to also provide useful information
about later stages of the process, significantly changed decision-making on school choice.
Specifically, these letters caused increases in enrollment at community colleges, at the
lowest cost college of the student’s indicated options, and at colleges where they can live
at home. While this is only partly in line with the program’s goals,1 it does indicate that
1 There is evidence from other settings that students diverted from four-year to two-year colleges are negatively impacted (see, e.g., Long and Kurlaender 2009; Goodman, Hurwitz, and Smith 2017; Bleemer 2020). The Cal Grant is intended to make the four-year options affordable, but for many students cost of living differences mean that community colleges closer to home have lower net cost.
6
when students are given transparent, clear information that provides individualized
estimates of cost differences, they adjust their decision-making. This suggests that both
behavioral barriers and information constraints play roles in student decisions.
Our findings have both theoretical and practical implications. Contributing to the
literature on administrative burdens, we show that there are clear learning costs and
psychological barriers that prevent students from navigating the financial aid process and
that can be addressed through simple interventions. Affirming belonging and
strengthening a positive social norm can effectively nudge more students to take an
important proximate step in accessing financial aid for which they are eligible. Yet, our
studies show that unlocking these psychological barriers and jump-starting the process is
not sufficient to overcome future barriers, such as understanding complex and
personalized details about the costs of tuition. It is only when psychological nudges are
combined with salient information on net costs that school choice is affected. A strategy
for increasing take-up of student aid and other public benefit programs may involve
combining nudges at multiple key pain points with simplification of the overall process to
reduce the number of such points and with clearer concrete information on cost and
benefits at early stages.
Setting and Methods
The sample for these studies includes all letters mailed to students who were
eligible for the Cal Grant A and the Cal Grant B High School Entitlement Awards in
2017-2018 and again in 2018-2019. These awards cover all tuition and fees at public
four-year colleges in California for eligible students, with partial coverage at private

7
colleges and small stipends at community colleges,2 and are renewable for up to four
years. Students with high school grade point averages above 3.0 and family incomes
under $100,000 are eligible for the Cal Grant A, while those with GPAs above 2.0 and
incomes under $50,000 are eligible for the Cal Grant B. CSAC mails notification letters
to all high school students meeting these criteria on a rolling basis, beginning in mid-
November. A letter is triggered when (a) a high school submits a student’s name as
meeting the GPA criterion and (b) CSAC receives the student’s FAFSA indicating that
the income criterion is met. The earliest submitted FAFSAs arrive at CSAC in mid-
November and the initial letters are mailed shortly thereafter.
Treatment Design
In the two years of experiments, CSAC randomly allocated students to receive
letters that varied in language and content. Samples of each letter variant are included in
the supplementary materials. While the letters alone do not reduce compliance costs, the
specific letter variants combined insights from behavioral science with evidence on
school choice to address various forms of learning and psychological costs.
The baseline (control) letter was a notification letter produced by CSAC that
described the program and instructed recipients to register for Cal Grant accounts on a
website, WebGrants4Students, that CSAC maintains. CSAC worked internally to clarify
the language and presentation of the notification letter from letters used in prior years for
the 2017-18 version. Despite this, the letter remained quite dense and contained several
2 Community college tuition in California is very low -- around $500 per semester for in-state, full-time students. Many students qualify for a separate California Promise Grant that covers this, allowing them to apply the Cal Grant stipend ($1,672 in the years we study) to living expenses. For students attending private colleges, maximum Cal Grant awards are $9,084 per year.

8
undefined acronyms and terms. Moreover, figuring out what one needed to do next to
obtain a Cal Grant award required careful reading.
In Year 1, we tested variations of the baseline letter (T1) that measured the impact
of simplification (T2) and affirming belonging (T3). T2 drew on evidence from a wide
range of behavioral science and communications literature indicating that simplification
can have perhaps the biggest proportional change on behavioral outcomes (e.g. Bhargava
and Manoli, 2015; DellaVigna and Linos, 2020). Specifically, by making it easy to
understand the substance of the letter and, importantly, making it easy to take the next
step, simplification both reduces learning costs and removes frictions that may otherwise
lead to inaction. As such, T2 contained the same basic information as the baseline letter,
but presented it in a dramatically simplified manner, with far less text and with graphical
design features that drew attention to the specific action that students needed to take. In
particular, the Cal Grant was described as a scholarship, and the call to action to visit
WebGrants4Students was enclosed in a red box in the middle of the letter, along with the
ID numbers that students would need to create accounts.
T3, a letter aimed at affirming belonging, used the simplified language from T2
but added sentences that emphasized that the addressee belonged in college and that
CSAC perceived them as a likely college graduate. This treatment drew from studies that
show that reducing belonging uncertainty -- the anxiety related to cues of non-belonging
for otherwise underrepresented groups -- disproportionately improves educational
outcomes for African American students and women in STEM fields (Walton and Cohen,
2007; Walton et al., 2015). Although most of this literature emphasizes impacts on
college performance, the hypothesized mechanism operates through self-perceptions of

9
belonging in college and institutional expectations about a student’s potential success.
We anticipated that these mechanisms could be strong at earlier stages in the selection
process where students are asked to sort themselves into institutions where they may or
may not feel that they belong.
Study 2, the following year, was planned after preliminary results from the first
study were available. The early results, confirmed by the longer-run results presented
below, indicated that the Simplified letter produced dramatically higher account
registrations than the baseline letter, and that the Simplified+Belonging letter improved
even further on this. Accordingly, in 2018-9, the baseline letter from the initial study was
discarded. The Simplified (T4) and Simplified+Belonging letters (T5) were retained, the
first with a slight modification to remove some wording that could imply belonging in the
simplified letter, and new variants were added to test additional behavioral hypotheses.
We use the Simplified letter (T4) as our control condition in Study 2. Because treatment
contrasts were much smaller than in Study 1, we anticipated smaller impacts on
outcomes.
To explore additional behavioral interventions in year two, we replaced some
sentences of the “belonging” intervention with a clear descriptive social norm (T6),
emphasizing that many other high school students were enrolling and utilizing the Cal
Grant. A rich behavioral science literature provides wide-ranging evidence that
descriptive social norms can impact behavior in various policy areas, especially in
contexts where that behavior is relatively invisible to the target population (Cialdini and
Trost, 1085; Goldstein, Cialdini and Griskevicius, 2008; Gerber and Rogers, 2009;
Hallsworth et al., 2017). Whether these nudges are effective depends, in part, on whether

10
the target population thinks of the social norm as applicable to them and on whether it
changes expectations. As such, it was unclear a priori whether a social norm intervention
would be effective in this context.
Last, we tested the impact of going beyond a framing nudge to provide new
information about college costs that might help students understand the aid landscape.
Letter T7 looked similar to the belonging (T5) letter, but included on the back a table of
the amount of aid available, and the resulting net costs (including tuition and living
expenses), for the specific public colleges and universities in California that students
listed on their FAFSAs to receive their financial information (which we interpret as a
proxy for application). The table had one row for each school listed on the student’s
FAFSA and columns showing:
1. The student’s planned living situation (on campus, off campus, with parents)
2. Estimated tuition, fees, housing, and other costs
3. Estimated total grant aid
4. Estimated net cost, the difference between columns 2 and 3
Column 1 was taken from the student’s FAFSA while Columns 2-4 were taken from
colleges’ cost calculators, populated with the living situation and personalized family and
financial information from the student’s FAFSA (see supplemental materials for details).
We did not gather the cost information from private colleges, which used widely varying
forms that were often not easily scrapable and often requested information not on the
FAFSA; from five public colleges in California whose calculators we were not able to
scrape, or from out-of-state colleges. When students listed these colleges on their

11
FAFSAs, the table included rows for them but cost information was listed as “not
available.”
Financial aid is highly individualized, and learning about the net costs of different
types of colleges may be an important barrier. As such, we expected that most of the
students receiving CSAC notification letters overestimate the cost of attendance and
underestimate the aid available to them (e.g. Grodsky and Jones, 2007; Scott-Clayton,
2012). Our letters generally arrived several months before colleges’ official aid offers,
and were designed to help students be more informed in their planning and thinking about
college costs. All of the information that we provided in the comparison table was
already available to students -- it was taken from public net cost calculators on each
college’s website, mandated under a signature Obama Administration initiative that
aimed to support more informed decisions – but we suspected that many students had not
accessed the calculators and that many would have been confused by them if they had
(Hopkins, 2011; Nelson, 2012).3 As such, the table provided in T7 may have provided net
cost information that was not otherwise in students’ consideration.
3 All of our year-2 letters included a URL for a page with a list of links to California colleges’ calculators. Thus, students in all treatment groups had ready access to the information in our net cost letter, though this would have required several potentially daunting steps – collecting financial information, inputting it into college calculators, and compiling the results, often presented in incommensurate ways.

12
Table 1. Description of treatments. Year Letter Treatment Description 1 T1 Control Baseline letter created by CSAC
T2 Simplified Simplified language and clear call to action T3 Simplified + Belonging Additional sentence: "You have shown that
you're the kind of person who belongs in college. We've been working hard to help you get there!"
2 T4 Simplified Adjusted T2 served as baseline for Year 2 T5 Simplified + Belonging Identical letter to T3 T6 Simplified + Social Norm Additional sentence: "Join thousands of high
school seniors who have claimed their Cal Grant and are not college graduates!"
T7 Simplified + Belonging + Net Costs
Additional table that included the net cost (tuition and living expenses) of attending the specific colleges listed on student's FAFSA.
All the notification letters focused attention on one key decision, registering for
accounts on the CSAC website. While there are many additional compliance hurdles that
students face in accessing aid (see Supplementary Information for details), registering for
an account is a key step to receiving a Cal Grant scholarship and is a trigger for
additional communications about the process. Accordingly, the primary outcome of
interest in this study is registration for an account.
However, the main goal of the aid process is not to generate WebGrants4Students
accounts but to help students go to and pay for college, and the CSAC letters aim to help
students better understand their choices. As secondary outcomes, we measure whether a
Cal Grant was paid out for the student in the Fall of the following academic year, and, if
so, to what school. Payout of a grant at a particular school implies that the student was
admitted and decided to enroll, that she completed all verification processes for the Cal
Grant over the summer after high school graduation, and that the college claimed the Cal

13
Grant on her behalf (which is intended to be automatic, but may in practice require some
intervention by the student). By improving students’ understanding of the process, the
letters could plausibly affect all but the admissions decision, although they were not
timed to affect decisions on where to apply. We outline the process in greater detail in
Supplementary material.
Experimental Design
Both studies were pre-registered on Open Science Foundation before any outcome
data were available, on December 27, 2017 (https://osf.io/u4sdm) and November 29,
2018 (https://osf.io/g3jxk), respectively.
Students were randomly assigned to receive one of three (in 2017-18) or four
(2018-19) letter variants. In both experiments, randomization occurred at the school level,
and all students within a school received the same letter variant. This was done in order
to reduce the potential for contamination. Random assignment was within 8 strata, based
on the high school’s count of Cal Grant eligible students and the share whose awards
were paid out in the previous two years. Within each stratum, one-third (Study 1) or one-
quarter (Study 2) of high schools were assigned to each treatment arm. Randomization
was independent in the two years (table S2), and schools were assigned to treatment
groups before the first letters in that study were mailed.
We consider all letters sent by June 1st. In Study 1, this was roughly 134,000
letters; in Study 2, it was 131,000. Letters were mailed in batches, and, due to mailroom
constraints, the timing of mailing sometimes varied by a few days across treatment arms.
We discuss this at greater length in Supplementary Information; we find no evidence that

14
the timing of mailing affected our outcomes or that it confounds our estimates of
treatment effects.
CSAC sent a reminder e-mail in early February to all students who had received
letters to date, encouraging them to register for their account if they had not already done
so. This email was identical for all students across treatments. CSAC also makes other
efforts to reach out to students, including encouraging high school counselors to contact
students who have not yet registered (which the counselors can check via their own
WebGrants accounts). These too are likely to be similarly distributed across treatment
groups.
We estimate experimental impacts via simple OLS (linear probability) regressions
of each outcome on the assigned treatment, with fixed effects for assignment strata.
Studies 1 and 2 are analyzed separately, and for each the standard errors are clustered at
the level of the unit of assignment, the high school.
Most analyses use the full sample of students who received notification letters. In
some of our analyses of college choice, we limit the sample based either on the set of
colleges listed on the FAFSA (determined before the letter was sent) or to students whose
Cal Grants were paid out at some college. The latter is a post-treatment outcome, though
as we show there is no effect of the treatment assignment on this outcome.
Outcomes
We present results for three pre-registered primary outcomes: Registration on the
CSAC online portal, Cal Grant payout, and choice of specific college. Our pre-registered
analysis plan included a fourth primary outcome, enrollment in college, which we cannot

15
distinguish in the administrative data from payouts.4 As such, we do not consider it
separately here. Registration and payout are coded as binary outcomes. When we
examine college choice, we estimate impacts on enrollment at a college in each of several
specific segments (e.g., the UC), as well as enrollment (proxied by Cal Grant payout) at
the college that had the lowest indicated net cost among all those listed on the student’s
FAFSA for which we were able to obtain net cost information.
The last of these outcomes was the most complex to construct, as CSAC scraped
college cost calculators only for students in the Net Cost treatment arm. To examine
college choices, we need comparable measures for students in all arms. We therefore
need to impute net costs based on the information in the Net Cost treatment arm.
Fortunately, this is not too difficult, as the net cost calculators are deterministic so it is
necessary only to recover the formula that they use. To do this, we fit flexible statistical
models to the data from the Net Cost arm, then use these models, along with inputs to the
cost calculators (which we have for all students) to impute net costs. To ensure
comparability across treatment arms, we then use the imputed cost information for all
students, even those for whom non-imputed data is available.
The 34,610 students assigned to the net cost treatment listed 169,093 (non-
unique) colleges on their FAFSAs, of which 120,636 (71 per cent) were among the 138
public colleges where we could scrape net cost information. For each of these 138
colleges, we fit a random forest prediction model for net costs, using only students in the
Net Cost treatment arm who listed that college and using the FAFSA information that
4 Students who enroll at out-of-state colleges, who enroll less than half time, or who do not claim their Cal Grant awards will not appear as having received Cal Grant payouts.

16
was used to populate the calculators as explanatory variables. These random forest
models were highly successful at uncovering the college formulae, even in cases where
we had relatively few observations -- the predictions from the random forest models
correlate 0.996 with the cost calculator output in a hold-out sample. We then use these
models to predict net costs for each student-college combination in all treatment arms,
and used these predictions to identify the lowest cost school among all those that a
student listed for whom net cost information was available. Students who attended
schools other than this school, whether net cost information was available or not, are
coded as not attending the lowest net cost school.
Results Summary statistics
Table 2 shows summary statistics for the samples, separately for the two yearly
cohorts. In our sample, mean GPAs are a bit above 3.0, while mean family incomes are
under $30,000. Nearly 90% of students are eligible for the Cal Grant B, aimed at students
with family incomes below about $50,000 (depending on family size), while a little under
60% of students are eligible for the Cal Grant A, which has a higher income limit but
more demanding GPA requirements. The typical student attends a high school where
two-thirds of students are eligible for free- or reduced-price lunches. 57 per cent are
eligible for the Cal Grant A, while close to 90 per cent are eligible for the Cal Grant B.

17
Table 2. Summary Statistics. Year 1 Year 2
Mean Standard Deviation
Balance p-value
Mean Standard Deviation
Balance p-value
Number of observations 134,133 135,155
Student Characteristics
GPA 3.07 0.55 0.39 3.08 0.55 0.59 Parental income $27,832 21,383 0.75 $28,833 21,531 0.42 Female 58.9% 0.73 59.1% 0.69 Cal Grant A eligible 57.6% 0.54 57.2% 0.46 Cal Grant B eligible 89.3% 0.58 87.0% 0.31 High School Characteristics
Free-reduced price lunch share
65.2% 0.39 65.4% 0.83
Fraction Black/Hispanic 67.0% 0.39 67.4% 0.76
Number of letters sent 149 92 0.44 149 91 0.81
Fr. of Cal Grants paid out (prior year)
68.1% 9.7% 0.63 71.5% 9.7% 0.93
Colleges listed on FAFSA
No. of colleges listed 5.2 3.3 0.95 4.9 3.4 0.52
No. of segments listed 2.0 0.9 0.98 1.9 0.9 0.19
No. of colleges with net cost information
3.8 2.8 0.47
Outcomes Account registration 66.0% 0.00 65.6% 0.01 Payout (fall) 60.9% 0.70 49.8% 0.42 Payout (full year) 62.4% 0.69 Note: Parent incomes reported as below 0 or above 100,000 are set to missing. This accounts for 1.1 per cent of observations each year. Colleges listed on FAFSAs are classified into four segments: California community colleges, California State University, University of California, and private. Net cost information is available only for the first three of these.

18
The net cost treatment (T7) relies on information that students provide about
which colleges they are considering. Students list colleges on the FAFSA to designate
that their information be shared with those colleges for calculation of financial aid offers.
The average student lists around five colleges. In year 2, when we incorporated net cost
information, we were able to calculate net costs for an average of 3.8 colleges for each
student, all public. We explain the process of obtaining net cost information in the
Methods section and in Supplementary Information in more detail.
The last panel of the table shows average outcomes. About two-thirds of students
registered for Cal Grant accounts, our primary outcome. In year one, 61% had Cal Grants
paid out in the fall, with an additional 1.5 per cent paid out in the spring. In year two, we
have only fall payout data, with notably lower total rates than even the fall data from year
one, perhaps attributable to delayed reporting from colleges.
Columns 3 and 6 of the table report p-values for tests that the indicated variable
has identical means across treatment arms. These are well above standard thresholds for
all pre-treatment variables, indicating that randomization was successful. Previewing our
main results, we reject the null hypothesis of equality for account registration, but not for
grant payout.
Main outcomes
Table 3 presents our main results. In year one, 62 per cent of students who
received the control letter created accounts. The Simplified letter (T2) increased this by
8.9 per cent (5.5 percentage points), while the Simplified+Belonging letter (T3) increased
it by 11 percent (6.8 p.p.). Both are highly statistically significant, individually and
jointly. Effects of the two treatments on Fall Cal Grant payout are much smaller, around

19
0.5 percentage point, and not statistically significant. Estimates are nearly identical when
we include Spring payouts, shown in Supplementary Information. In year two, the
baseline letter (T4) was the Simplified letter from year one. The Simplified+Belonging
(T5) and Simplified + Social Norm (T6) treatments had small, statistically insignificant
effects on account registration relative to this, with point estimates of 1.1 and 1.7
percentage point, respectively.
Table 3. Effects on account registration and Cal Grant Payout. Year 1 Year 2
Account creation
Fall Payout
Account creation
Fall Payout
Control group mean 0.618 0.604 0.642 0.497
Simplified 0.055 0.006
(0.008) (0.007)
Simplified + Belonging 0.068 0.004 0.011 -0.007
(0.008) (0.007) (0.010) (0.009)
Social Norm 0.017 0.003
(0.010) (0.010)
Net Price 0.030 0.009
(0.009) (0.009)
N 134,138 134,138 135,701 135,701
p, all TEs=0 0.000 0.70 0.01 0.42
Notes: All specifications include stratum fixed effects. Standard errors are clustered at the high school level. The control group in year 2 received a similar letter as the Simplified treatment group in year 1.

20
The combined Net Cost letter (T7), however, did raise account creation by 4.6 per
cent (3.0 percentage points) over the baseline T4 letter.. This is statistically significant on
its own; in addition, a joint test of the significance of the three treatment effects together,
which is not subject to multiple testing issues, is significant at the 1 percent level. The
incremental effect of adding net price information to a letter that includes
Simplified+Belonging language is twice as large as the incremental effect of
Simplified+Belonging relative to Simplified in either year 1 or year 2. We can also reject
the null hypothesis that the Simplified+Belonging (T6) and Net Cost (T7) effects are the
same in year two, with a p-value of 0.03.
When we turn to effects on Cal Grant payout in year two, we again see small and
statistically insignificant effects. Suggestively, the largest point estimate, 0.9 percentage
point, comes from the Net Cost letter, but this is not statistically significant.
College choice
The results in Table 3 indicate that our behaviorally informed letters were
effective at getting students’ attention and inducing them to register accounts, but they do
not support the hypothesis that the letters increased overall college enrollment. As per our
pre-registration, we next investigate further whether the letters impacted school choice.
We are particularly interested here in the Net Cost letter, which aimed to make cost
differences among colleges that the student was already considering more transparent and
more salient.
Table 4 reports summary statistics for the gross prices and net costs that students
faced, at the student-by-school level. The average total price of college before aid is over
$23,000 per year, but the Cal Grant and other grant aid bring this down to a net cost of

21
just over $9,000. We also show estimates separately for each of California’s three public
education segments: the two-year community colleges (CCs); the four-year, moderately
selective California State University (CSUs); and the four-year, more selective University
of California (UC). Gross prices vary dramatically across the segments, from just over
$10,000 at the CCs, where students are more likely to plan to live with parents, to nearly
$35,000 at the UC. Net costs are much less variable, but on average are also lower at CCs
($5,500, vs. around $10,000 at the four-year segments). This masks a fair amount of
variability, however: For 41 per cent of students who listed a UC school the lowest price
was in this segment, falling to 33 per cent when we exclude students who listed no CSU
or CC schools.
Table 4. Detail about net prices.
All colleges
UC CSU CC
N - students 135,701 51,642 79,980 73,951 N - student-school pairs 669,791 163,520 232,370 109,779 N - student-school pairs with price information 511,785 163,520 232,181 108,019 Sticker price (full cost of attendance) 23,148 34,265 21,702 10,374 (10,059) (3,154) (5,582) (5,333) Aid / Discount 13,992 23,679 11,717 4,898 (7,646) (3,671) (2,298) (1,618) Net price (full cost) 9,156 10,585 9,985 5,475 (5,032) (2,111) (5,338) (5,518) Lowest sticker price school is in this segment 12% 63% 94% Lowest net price school is in this segment 41% 66% 72% Among those who listed multiple segments: Lowest sticker price school is in this segment 0.2% 53% 92% Lowest net price school is in this segment 33% 56% 41%
Notes: Estimates are based on random forest predictions of costs and aid reported by college cost calculators. Lowest costs are defined only over colleges for which calculator output is available.

22
Table 5 presents estimates of the impact of the letters on Cal Grant payout in each
of the three public segments and at private colleges. We present results for both year one
and year two, first for the full samples and then, to examine college choice as distinct
from college enrollment, for the subsample of students whose Cal Grants were paid
somewhere. We find evidence that the Net Cost letter (T7) shifted students towards
community colleges, both from the other public segments and from private colleges. This
is consistent with the evidence that community colleges are often the cheapest option and
the hypothesis that the Net Cost letter (T7) made comparable costs more salient.

23
Table 5. Effects on school choice. All Students Conditional on any payment
UC CSU CC Private UC CSU CC Private
Panel A: Year 1
Simplified -0.005 0.010 0.001 -0.000 -0.010 0.014 -0.002 -0.002
(0.005) (0.007) (0.007) (0.005) (0.008) (0.010) (0.012)
(0.008)
Simplified + -0.006 0.006 0.008 -0.004 -0.011 0.007 0.011 -0.007
Belonging (0.005) (0.007) (0.007) (0005) (0.008) (0.010) (0.013)
(0.008)
N 134,138 134,138 134,138 134,138 81,705 81,705 81,705 81,705
Control group mean
0.114 0.208 0.222 0.061 0.189 0.343 0.367 0.101
p, all TEs=0 0.44 0.33 0.52 0.72 0.27 0.40 0.56 0.67
Panel B: Year 2
Simplified + -0.003 -0.008 0.006 -0.002 -0.004 -0.011 0.017 -0.002
Belonging (0.005) (0.009) (0.008) (0.003) (0.010) (0.014) (0.015)
(0.006)
Social Norm -0.002 -0.009 0.015 -0.002 -0.004 -0.020 0.028 -0.005
(0.006) (0.009) (0.009) (0.003) (0.011) (0.014) (0.016)
(0.006)
Net Price -0.006 -0.001 0.019 -0.003 -0.015 -0.009 0.032 -0.008
(0.005) (0.009) (0.009) (0.003) (0.010) (0.015) (0.016)
(0.006)
N 135,701 135,701 135,701 135,701 67,591 67,591 67,591 67,591
Control group mean
0.104 0.198 0.156 0.040 0.208 0.397 0.314 0.081
p, all TEs=0 0.65 0.62 0.11 0.73 0.40 0.57 0.19 0.58
Notes: All specifications are linear probability models for payout of the Cal Grant at a school in the indicated category, and include strata fixed effects. Samples in columns 5-8 include only those students whose Cal Grants were paid out. Standard errors are clustered at the level of the high school.
To probe this further, Table 6 presents estimates of the effect of our various year-
2 treatments on the likelihood of enrolling at the school with the lowest net cost among
those listed on the FAFSA. Students who did not enroll at all, or who enrolled at a school

24
other than those listed schools for which we could calculate net costs, are treated as
failures for this outcome. In column 1, we see that the net cost letter raised the probability
of choosing the lowest net cost option by 10.4 percent (1.6 percentage point). This
coefficient is statistically significant considered on its own (p=0.03), though the joint test
of all of the treatment effects being zero is only marginally significant (p=0.07). The
effect is similar when we limit the sample to students who listed schools from at least two
segments on their FAFSAs, who typically face larger contrasts in net costs (column 2).
When we separate the sample by whether the lowest-net-cost option was a community
college (column 3) or some other choice (column 4), we see that the effect is
concentrated in the former.5 The effects generally grow when we limit our sample to
students who enrolled at some college, so that we are examining only the intensive
margin of choice between colleges rather than the extensive margin of going to college
(panel B).
5 This analysis was not included in our pre-analysis plan.

25
Table 6. Effects on likelihood of enrolling at the lowest net price option.
All students
Listed 2+ segments
CC was lowest net
cost
CC was not lowest net
cost
A. Unconditional
Simplified + Belonging 0.000 0.000 0.000 -0.002
(0.007) (0.007) (0.010) (0.009)
Social Norm -0.003 -0.004 0.009 -0.012
(0.008) (0.007) (0.011) (0.009)
Net Price 0.016 0.014 0.029 0.008
(0.008) (0.007) (0.011) (0.009)
N 135,701 80,219 53,512 73,953
p, all TEs=0 0.07 0.07 0.04 0.12
Control group mean 0.159 0.128 0.190 0.154
B. Conditional on any payment
Simplified + Belonging 0.005 0.001 0.002 -0.003
(0.013) (0.011) (0.020) (0.013)
Social Norm -0.008 -0.008 -0.002 -0.021
(0.013) (0.011) (0.019) (0.013)
Net Price 0.027 0.024 0.021 0.015
(0.013) (0.010) (0.020) (0.013)
N 67,591 47,186 18,040 46,186
p, all TEs=0 0.06 0.02 0.57 0.028
Control group mean 0.159 0.128 0.584 0.247
Notes: All specifications are linear probability models, including stratum fixed effects. In panel B, samples are limited to students whose Cal Grants were paid out somewhere. Standard errors are clustered at the level of the high school.
The supplementary materials include additional specifications probing the role of
living situations in driving these results. Net costs are generally lower when students
indicate that they will live at home than when they list the same schools but indicate
plans to live on or off campus. The net cost letter causes students to shift their enrollment
toward schools where they plan to live at home, and we find marginally significant

26
evidence that it increases overall Cal Grant payouts for students who listed at least one
live-at-home option on their FAFSAs.
Heterogeneity
In exploratory analyses, we examined heterogeneity of effects along several
dimensions. Table 7 presents estimates separately for students eligible for Cal Grant B,
with family incomes under $50,000 and high school GPAs over 2.0, and those who are
eligible for Cal Grant A but not Cal Grant B. Cal Grant B students come from lower-
income households. As such, they are likely to be more reliant on financial aid, and
perhaps less well informed, than non-Cal Grant B students. We find that the letters’
effects on account registration are somewhat larger for the Cal Grant B students,
particularly in year 2. Effects on enrollment at the cheapest college are also concentrated
in this group.

27
Table 7. Heterogeneity by Cal Grant B eligibility
Account registration Fall enrollment Cheapest school
CG B eligible
Not CG B eligible
CG B eligible
Not CG B
eligible
CG B eligible
Not CG B
eligible Panel A: Year 1 Control group mean 0.608 0.708 0.614 0.522 Simplified 0.054 0.071 0.006 0.006
(0.008) (0.010) (0.007) (0.013) Simplified + Belonging 0.068 0.065 0.006 -0.014
(0.008) (0.010) (0.007) (0.013) N 119,791 14,347 119,791 14,347 p, all TEs=0 0.000 0.000 0.661 0.274 Panel B: Year 2 Control group mean 0.635 0.688 0.503 0.459 0.162 0.136
Simplified + Belonging 0.010 0.014 -0.006 -0.014 0.002 -0.009
(0.010) (0.012) (0.010) (0.013) (0.007) (0.009) Social Norm 0.018 0.009 0.005 -0.013 -0.002 -0.010
(0.010) (0.013) (0.011) (0.014) (0.008) (0.009)
Net Price 0.032 0.016 0.010 -0.003 0.018 0.003
(0.009) (0.013) (0.010) (0.015) (0.008) (0.010)
N 118,069 17,632 118,069 17,632 118,069 17,632 p, all TEs=0 0.006 0.573 0.424 0.641 0.071 0.384
Notes: All specifications are linear probability models, including stratum fixed effects. Standard errors are clustered at the level of the high school.

28
Table 8 presents estimates of variation by the date that the notification letter was
sent. We distinguish letters sent before and after February 1. We hypothesized that later
notification letters might have less effect on college choice, as they may have arrived
after, or only shortly before, the financial aid letters that they were meant to preview. On
the other hand, late FAFSA filers may be substantively different on unobservables than
their early filer counterparts. For example, late FAFSA filers may be less familiar with
the overall aid process, may be less settled in their college-going plans, may be more
present biased, or may be less organized. The evidence is more supportive of the latter
hypothesis. Effects of letters on account registration are somewhat larger for the late
filers than for those who filed earlier. Similarly, the effect on payout at the cheapest
option is driven by the late FAFSA filers. In addition, for this subgroup (though not for
the overall population), we observe a statistically significant positive effect on Cal Grant
payout.

29
Table 8. Heterogeneity by FAFSA filing date. Account registration Fall enrollment Cheapest school
Early Late Early Late Early Late
Panel A: Year 1 Control group mean 0.720 0.474 0.657 0.530 Simplified 0.041 0.075 0.005 0.007 (0.008) (0.010) (0.008) (0.010) Simplified + Belonging 0.058 0.088 -0.003 0.015 (0.008) (0.011) (0.008) (0.010) N 78,339 55,799 78,339 55,799 p, all TEs=0 0.000 0.000 0.522 0.283 Panel B: Year 2 Control group mean 0.702 0.560 0.563 0.408 0.144 0.172
Simplified + Belonging 0.013 0.007 -0.007 -0.005 0.004 0.010
(0.010) (0.012) (0.010) (0.012) (0.008) (0.009) Social Norm 0.024 0.003 0.001 0.002 0.017 0.014
(0.011) (0.012) (0.011) (0.012) (0.009) (0.010) Net Price 0.005 0.063 -0.006 0.027 0.011 0.031
(0.010) (0.011) (0.010) (0.012) (0.009) (0.011) N 78,903 56,798 78,903 56,798 78,903 56,798 p, all TEs=0 0.131 0.000 0.828 0.043 0.232 0.034
Notes: All specifications are linear probability models, including stratum fixed effects. Standard errors are clustered at the level of the high school. Early and late FAFSA filers are defined based on letters sent before and after February 2.
Discussion
Students finishing high school must make highly consequential decisions about
whether to attend college and where to enroll, with enormous financial implications for

30
themselves and their families. Many lack access to quality college counseling, and may
not have accurate information about the costs of their different options or about how to
access available aid. Like many other financial aid programs, the Cal Grant program is
intended to make college affordable for low- and moderate- income students. However, it
can only have limited effects on these students’ educational attainment if students do not
know it exists, understand how to access it, understand how it affects their net costs of
enrollment, and believe it is for them.
We conducted two large scale randomized controlled trials to explore how low-
cost letter interventions could impact some of these barriers. Evidence from both studies
suggests that the language and framing of the letters can meaningfully impact student
decision-making. Those who received simplified letters were substantially more likely to
register for WebGrants4Students accounts by June of their senior year of high school.
Letters that added language emphasizing that the student belonged in college were even
more effective at prompting registration than the basic simplified letter. Changing letter
language is free, so the resulting 7 to 9 percent increases in take-up came at zero cost.
Importantly, those who received personalized information on the net cost of attending the
colleges they had chosen were not only much more likely to register, they were also
significantly more likely to choose a low-cost school.
Our findings contribute to three literatures. First, we contribute to a growing
literature on administrative burdens. We focus on financial aid, but the gap between
financial aid availability and aid take-up mirrors administrative burdens in other policy
areas: 12.5% of eligible SNAP recipients do not take-up SNAP (Crouse and Macartney,
2020), 20% of EITC-eligible households do not take-up the Earned Income Tax Credit
31
(Iselin, Mackay and Unrath, 2021); and 75.5% of TANF-eligible individuals don’t take-
up that program (Crouse and Macartney, 2020). Our findings suggest that vastly
simplifying communications and directly addressing psychological barriers may be
critical to helping people start a long and complicated process. This is particularly
important for the types of administrative processes where an early pain point (like
registering on a website, or registering to vote) can severely limit options down the line.
Moreover, although many recent studies show the impact of reducing learning costs by
informing people they are eligible to receive a program, our study emphasizes a very
different type of learning barrier: being able to carefully and correctly compare the costs
and benefits of different types of program offerings. In our setting, reducing learning
costs and psychological costs in tandem affects both short-term and longer-term behavior.
Second, our experiments point to both the promise and potential limitations of
using low-cost nudges to move behavior. Our findings are largely optimistic. A zero-cost
tweak to letters significantly increases the percentage of students who take the desired
action, in this case registering for an account. The magnitude of the observed effect on
our primary outcome is four to five times larger than the average effect of a government
nudge in the US (DellaVigna and Linos, 2020). Yet a successful nudge that moves
proximate behavior does not automatically affect behavior down the line. Future
unaddressed compliance costs can still limit the impact of a behavioral intervention.
Making costs more salient, in combination with other nudges, on the other hand, not only
moves immediate behavior, it also has long-term consequences on school choice.

32
Last, our findings contribute directly to the growing literature on the role of costs
in college decision-making. The explanations for why high-achieving low-income
students don’t go to college at rates that seem optimal span a wide range of literatures.
Some include emphasis on present bias (Dynarski et al., 2021); a scarcity mindset
(Mullainathan and Shafir, 2013); misunderstanding of the benefits (Hoxby and Turner,
2013), or negative social identities (Lavecchia, Liu and Oreopoulos, 2016). While many
of these factors play a critical role in whether students take action in a complicated
process, we show that at least among students who have shown some interest in going to
college, and have already navigated the complex FAFSA process, at the end of the day,
cost is still a primary driver of school choice. Whether or not students should be
encouraged to attend the lowest-cost university is a policy question outside the scope of
this study -- though enabling informed decision making was part of the intent of the
policy mandating creation of the cost calculators upon which we rely. Rather, this study
points to the relative importance of cost when costs are provided in a comparable and
clear way.
Our studies have several limitations. First, we could not vary the timing of
communication. The process of personalized communication from CSAC begins after a
student has already filled out the FAFSA, a complicated first step of the process that may
deter many students. As such, we cannot generalize our results beyond a population of
already motivated students who have managed to navigate the first step in a long process.
An earlier intervention may have been more effective or may have captured a different
subpopulation of high-achieving low-income students. Second, while we can observe Cal
Grant payouts, we cannot observe important related components of enrollment -- whether

33
students were admitted to the colleges of their choice, whether they enrolled but did not
take-up the Cal Grant, and whether they received other financial aid for which they were
eligible. Last, while we used existing information from college websites to populate our
Net Cost letters, we cannot separately verify if the college calculators correctly identify
the various costs associated with going to a specific college, and it is possible that more
accurate information would have larger effects.
Importantly, this study has practical implications for policymakers eager to use
insights from behavioral science to improve service delivery. While our effect sizes are
particularly large, relative both to the broader nudge literature and to their cost, we show
that different interventions may be most effective at targeting different barriers in a
larger, extremely complex administrative process. A range of nudges have positive
effects on the proximate outcome, account registration, but only our treatment making
comparable information about net costs more salient had an impact on college choice. A
policymaker aiming to fundamentally shift college access may consider interventions at
various pain points, that also consider different types of learning, compliance, or
psychological barriers at each stage in the process. These could include direct assistance
in filling out the FAFSA (Bettinger et al., 2012); early and inclusive language on
financial aid availability, such as that presented in this paper; as well as comparable and
salient information on costs either from financial aid agencies, as in this paper, or from
the colleges themselves (Dynarski et al., 2021). Policymakers could design and test
improvements to the compliance process itself, such as reducing the number of steps
required to receive financial aid, and introducing personalized targeting significantly
earlier in the process. Last, given the importance of cost comparisons in student decision-

34
making, policymakers may choose to emphasize the potential benefits of four-year
colleges in their communications if they aim to encourage attendance at four-year
institutions.
35
References
Bettinger, E. et al. (2019) “The Long-Run Impacts of Financial Aid: Evidence from California’s Cal Grant,” American Economic Journal: Economic Policy, 11(1), pp. 64–94.
Bettinger, E. P. et al. (2012) “The role of application assistance and information in college decisions: Results from the H&R Block FAFSA experiment,” The quarterly journal of economics. MIT Press, 127(3), pp. 1205–1242.
Bhargava, S. and Manoli, D. (2015) “Psychological Frictions and the Incomplete Take-Up of Social Benefits: Evidence from an IRS Field Experiment,” The American economic review, 105(11), pp. 3489–3529.
Bird, K. et al. (2019) Nudging at scale: Experimental evidence from FAFSA completion campaigns. Cambridge, MA: National Bureau of Economic Research. doi: 10.3386/w26158.
Bleemer, Z. (2020). Affirmative Action, Mismatch, and Economic Mobility after California's Proposition 209. Mismatch, and Economic Mobility after California's Proposition, 209.
Cialdini, R. B. and Trost, M. R. (1085) “Social influence: Social norms, conformity and compliance,” in Gilbert, D. T. (ed.) The handbook of social psychology, Vols. New York, NY, US: McGraw-Hill, x, pp. 1–2.
Cohodes, S. R. and Goodman, J. S. (2014) “Merit aid, college quality, and college completion: Massachusetts’ Adams scholarship as an in-kind subsidy,” American Economic Journal. Applied Economics. American Economic Association, 6(4), pp. 251–285.
College-Going Rates of High School Graduates - Directly from High School (no date) NCHEMS Information Center for Higher Education Policymaking and Analysis. Available at: http://www.higheredinfo.org/dbrowser/?year=2014&level=nation&mode=data&state=0&submeasure=63.
Crouse, G. and Macartney, S. (2020) Welfare Indicators and Risk Factors. 19. US Department of Health and Human Services. Available at: https://aspe.hhs.gov/system/files/pdf/265031/welfare-indicators-and-risk-factors-19th-report.pdf.
DellaVigna, S. and Linos, E. (2020) RCTs to scale: Comprehensive evidence from two nudge units. Cambridge, MA: National Bureau of Economic Research. doi: 10.3386/w27594.

36
Dynarski, S. et al. (2018) Closing the gap: The effect of a targeted, tuition-free promise on college choices of high-achieving, low-income students. Cambridge, MA: National Bureau of Economic Research. doi: 10.3386/w25349.
Dynarski, S. et al. (2021) “Closing the gap: The effect of reducing complexity and uncertainty in college pricing on the choices of low-income students,” American Economic Review. American Economic Association, 111(6), pp. 1721–1756.
Fox, M. A., Connolly, B. A. and Snyder, T. D. (2005) “Youth Indicators, 2005: Trends in the Well-Being of American Youth. NCES 2005-050,” NIH guide for grants and contracts / U.S. Department of Health, Education, and Welfare. ED Pubs, P.O. Box 1398, Jessup, MD 20794-1398. Tel: 877-433-7827 (Toll Free). Available at: http://files.eric.ed.gov/fulltext/ED485721.pdf (Accessed: August 9, 2021).
Gerber, A. S. and Rogers, T. (2009) “Descriptive Social Norms and Motivation to Vote: Everybody’s Voting and so Should You,” The journal of politics. The University of Chicago Press, 71(1), pp. 178–191.
Goldstein, N. J., Cialdini, R. B. and Griskevicius, V. (2008) “A Room with a Viewpoint: Using Social Norms to Motivate Environmental Conservation in Hotels,” The Journal of consumer research. Oxford Academic, 35(3), pp. 472–482.
Grodsky, E. and Jones, M. T. (2007) “Real and imagined barriers to college entry: Perceptions of cost,” Social science research, 36(2), pp. 745–766.
Gurantz, O. et al. (2019) “Realizing your college potential? Impacts of College Board’s RYCP campaign on postsecondary enrollment,” Annenberg Brown University EdWorkingPaper. Annenberg Institute at Brown University, 19–40. Available at: https://vtechworks.lib.vt.edu/handle/10919/96070 (Accessed: August 10, 2021).
Hallsworth, M. et al. (2017) “The behavioralist as tax collector: Using natural field experiments to enhance tax compliance,” Journal of public economics, 148, pp. 14–31.
Herd, P. and Moynihan, D. P. (2019) Administrative Burden: Policymaking by Other Means. Russell Sage Foundation.
Hopkins, K. (2011) 10 things you need to know about net price calculators, US News & World Report. Available at: https://www.usnews.com/education/best-colleges/paying-for-college/articles/2011/12/15/10-things-you-need-to-know-about-net-price-calculators.
Hoxby, C. and Turner, S. (2013) “Expanding college opportunities for high-achieving, low income students,” Stanford Institute for Economic Policy Research Discussion Paper, 12, p. 014.
Hyman, J. (2020). Can light‐touch college‐going interventions make a difference? Evidence from a statewide experiment in Michigan. Journal of Policy Analysis and Management, 39(1), 159-190.

37
Iselin, J., Mackay, T. and Unrath, M. (2021) “Measuring take-up of the California EITC with state administrative data,” California Policy Lab Working Paper, (2021–3), pp. 1–58.
Kane, T. (2003) A quasi-experimental estimate of the impact of financial aid on college-going. Cambridge, MA: National Bureau of Economic Research. doi: 10.3386/w9703.
Kofoed, M. S. (2017) “To apply or not to apply: FAFSA completion and financial aid gaps,” Research in higher education. Springer Science and Business Media LLC, 58(1), pp. 1–39.
Lavecchia, A. M., Liu, H. and Oreopoulos, P. (2016) “Chapter 1 - Behavioral Economics of Education: Progress and Possibilities,” in Hanushek, E. A., Machin, S., and Woessmann, L. (eds.) Handbook of the Economics of Education. Elsevier, pp. 1–74.
Martorell, P. and Friedmann, E. (2018) “Money left on the table: An analysis of Pell grant receipt among financially-eligible community college students in California,” Wheelhouse Research Brief, 3(3), pp. 1–8.
Mullainathan, S. and Shafir, E. (2013) Scarcity: Why Having Too Little Means So Much. Macmillan.
Nelson, L. (2012) Net price vs. out of pocket, Inside Higher Ed. Available at: https://www.insidehighered.com/news/2012/08/14/some-netprice-calculators-could-lead-students-take-debt.
Scott-Clayton, J. (2012) What Explains Trends in Labor Supply Among U.S. Undergraduates, 1970-2009? w17744. National Bureau of Economic Research. doi: 10.3386/w17744.
Seltzer, R. (2017) Net Price Keeps Creeping Up, Inside Higher Ed. Available at: https://www.insidehighered.com/news/2017/10/25/tuition-and-fees-still-rising-faster-aid-college-board-report-shows.
The Hamilton Project (2007) College Grants on a Postcard: A Proposal for Simple and Predictable Federal Student Aid. Available at: https://www.brookings.edu/wp-content/uploads/2016/06/200702dynarski-scott-clayton_pb.pdf (Accessed: August 18, 2021).
Trends in Student Aid 2017 (2017). College Board.
Walton, G. M. et al. (2015) “Two brief interventions to mitigate a ‘chilly climate’ transform women’s experience, relationships, and achievement in engineering,” Journal of Educational Psychology, pp. 468–485. doi: 10.1037/a0037461.
Walton, G. M. and Cohen, G. L. (2007) “A question of belonging: race, social fit, and achievement,” Journal of personality and social psychology, 92(1), pp. 82–96.

38
Wilbur, T. G. and Roscigno, V. J. (2016) “First-generation Disadvantage and College Enrollment/Completion,” Socius. SAGE Publications, 2. doi: 10.1177/2378023116664351.

39
Supplementary Text A. Letters Supplement Figures 1-7 reproduce the letters used in the various treatment arms. B. Description of Setting Financial Aid in California The higher education landscape in California is complex. The state hosts two independent four-year public university systems, the University of California and the California State University, as well as a now 116-campus community college system that is the largest higher education system in the United States. It also has a host of for-profit and not-for-profit private colleges and universities. Tuition and fees vary dramatically among these institutions, as do institutional financial aid programs. Among the public segments, tuition and fees at the UC are more than double those at the CSU, which in turn are more than triple those at the community colleges.
The state has a range of different public programs that provide college aid, operating under the collective name of Cal Grant. We focus on two varieties of Cal Grants, the Cal Grant A and Cal Grant B entitlement awards. These are entitlements for students who meet eligibility criteria, based on high school grades and family income, and who enroll in college within a year of graduating from high school. The Cal Grant A is for high-achieving, moderate-income students pursuing associate’s or bachelor’s degrees. Students must have a GPA above 3.0 and a household income of less than $100,000 (with some variation by family size). The Cal Grant B is for low-income students, with household incomes of less than $50,000, who meet a lower high school achievement threshold, with a GPA above 2.0.
The terms of the Cal Grant A and B differ in their details but are similar in broad strokes: Both cover the full cost of in-state tuition and required fees at a public institution. Thus, the generosity of the Cal Grant is tied to institutional tuition levels, so it is more generous at the high-cost UC than at the lower-cost CSU, and more generous at both than at community colleges, which have much lower fees. Students who attend private colleges in the state receive awards that do not generally cover full tuition but are nevertheless quite generous relative to comparable programs in other states. For example, the well-known Georgia HOPE scholarship is worth about $2,000 per semester (or half this at private institutions); the CalGrant is worth as much as $12,600 per year for a student attending UC, or $9,000 for a student attending a private, non-profit college.
The Cal Grant layers on top of the federal Pell Grant. The UC and to a lesser extent the CSU also have institutional aid programs; community college institutional aid budgets are much smaller. These can support living expenses, which are not covered by the Cal Grant (with the exception of a small payment for Cal Grant B students). The result is that for many students the net cost of attending college may be lower at the CSU and UC than at community colleges, despite the much higher sticker prices. Offsetting this for many students is the fact that there is much more likely to be a community college than a UC

40
within commuting distance of a student’s home, which can allow for substantial cost savings.
Colleges provide calculators on their websites that are meant to help students forecast the total amount of aid they will receive. Each college has its own calculator, and they vary in the information they solicit; sometimes colleges in the same system (e.g., different Cal State campuses) seem to use the same calculators, but in other cases they do not. In particular, the different UC campuses each seem to use different calculators. As an illustration, the fields solicited by the UC Berkeley web form for dependent students (the fields are somewhat different for independent students) are:
- Housing plans (on campus, off campus, with parents) - Parents’ marital status - Parents’ anticipated number of dependents in college - Number of people in parents’ household - Total parental assets - Total parental income - Parental earned income - Parental income tax paid - Parental other income - State of residency - Total student assets - Total student income - Student income tax paid - Student other income
A student who provides this information is given non-binding estimates of tuition costs, fees, housing costs, and other living expenses, along with estimates of total available grant aid, inclusive of federal, state, and campus sources. For our Net Cost (T7) letters, we use the information from students’ FAFSAs to populate the calculators for each of the colleges that the student listed on the FAFSA. All of the requested information from the UC, CSU, and CC calculators is available from the FAFSA, though some private colleges solicit information (like father’s occupation) that is not available. We draw estimates only from the public institutions. Supplement Table 1 presents a hypothetical example of a student from a family of four with income of $30,000, using real output from the college calculators. For this student, the net cost at UC Berkeley was almost 40% lower than at Long Beach Community College, reflecting the additional $11,000 value of the Cal Grant and an additional $13,000 in non-Cal Grant grant aid, even though the sticker price at Berkeley was nearly twice that at Long Beach. Anecdotally, the potential for this kind of ranking reversal is not widely appreciated. In our sample, 58% of students whose FAFSAs listed both a community college and a CSU or UC campus had lower estimated net costs at one of the four-year schools than at any of the community colleges. Discussions with CSAC and campus aid officials suggest that this largely reflects more generous institutional aid budgets at the CSU and, especially, the UC than at the community colleges.

41
Supplement Figure 7 – the example T7 letter – shows another illustration. This table shows a student who listed five UC campuses on their FAFSA. In this case, each of those campus’ calculators shows a different value for estimated costs and for estimated grant aid. This may reflect real differences among campuses in either their cost structure (particularly for housing costs) or their financial aid policies, or differences in the assumptions made by their respective calculators. We cannot be sure that the estimates are always accurate, but because they are drawn from the colleges’ own calculators we are assured that they reflect the information that colleges are providing to prospective students. The process of applying for aid The process of establishing eligibility for and claiming the Cal Grant has several steps and involves both the students and their colleges. High schools provide GPAs for all members of their senior classes to CSAC, usually at the beginning of the school year but sometimes later. Students must then submit FAFSAs, as early as October 1st of their senior year. These FAFSAs include student family and financial information. Students also provide a list of schools to which they would like their information to be sent. We interpret this as a weak proxy for where students actually apply (though note that community colleges do not require traditional applications – students can simply register for classes). For each listed school, students indicate whether they plan to live on campus, off campus, or with parents. CSAC receives FAFSA information from the federal Department of Education and uses this information to identify potentially eligible students. Once a student is identified as potentially eligible, CSAC mails the student a preliminary notification of his or her award eligibility. Notification letters include instructions about how students can claim their awards. They are sent by postal mail, with the first letters going out in mid-November of the senior year and additional letters processed on a rolling basis through the next spring as FAFSA information arrives to CSAC. Importantly, both UC and CSU admissions applications are due by the end of November, so notification letters will generally not arrive in time to influence application decisions.
The notification letters direct students to register for accounts on WebGrants4Students, CSAC’s online portal for students. On the portal, they must confirm their GPAs and eventually report the college or university they will be attending. Many students are contacted by federal programs or by colleges over the summer after the senior year and asked to provide documentation for the information provided on the FAFSA.
To receive the Cal Grant, students must enroll in a qualifying college program in the year following high school graduation (or, only for those who register for WebGrants4Students accounts in that year, in the following year). Following enrollment, institutions must verify both that the student meets the financial eligibility requirements and that the student is enrolled in a program that meets Cal Grant eligibility guidelines. In principle, colleges then claim the Cal Grant on the student’s behalf and apply it to the student’s tuition charge. However, CSAC reports that some colleges fail to claim awards

42
on behalf of all of their eligible students so it may be necessary for the student to advocate for herself at this stage as well. C. Mailing timing The first 2017-18 preliminary notification letters were printed in the second week of November for students who submitted FAFSAs shortly after they became available in October. By that point, over 30,000 students had been identified as eligible. To overcome internal logistical hurdles involved with printing and mailing so many letters, CSAC printed and mailed them in batches. The first large batch of 6,004 Baseline (T1) letters were mailed on November 20, 2017, with another 5,967 following on November 27-28. Following this, 12,041 Simplified (T2) letters were mailed November 28-30. The Simplified + Belonging (T3) letters were then mailed, with 4,002 on November 30 and December 1. By December 7, the mailings had evened out, with a cumulative total of between 17,000 and 18,000 in each treatment arm. New batches were sent approximately weekly thereafter as students filed their FAFSAs and were identified as eligible, with much smaller gaps between treatment arms. Baseline letters were typically mailed on Monday with Simplified and Simplified + Belonging letters following later in the week. In year 2, batching was reduced and the initial round of letters for three treatment arms (T4, T5, and T6) were mailed approximately simultaneously, between November 27 and December 3, 2018. However, bugs in the programs used to populate the Net Cost letters (T7) delayed the initial large batch of these letters until December 18-20. In each year, less than half of the letters were mailed by the end of December, with additional letters generated on a rolling basis as FAFSAs arrived to CSAC. We include in our analyses only students whose letters were mailed by June 1. Although in principle the federal FAFSA deadline is not until June 30, institutional aid deadlines are much earlier and there were relatively few letters mailed this late in the season. Supplement Figure 8 shows the distribution of mailing dates, indicating both the overall time pattern and the differences in mail dates across treatment arms early in the year. Vertical lines show key dates: The UC application deadline (November 30), the UC and CSU “priority deadline” for FAFSA submission (March 2), and the deadline for accepting UC admissions offers (May 1). In year 2, the Simplified treatment arm (T4) amounted to fewer total letters than the other arms. This arose randomly; approximately the same number of high schools were assigned to each arm, but the schools assigned to this arm generated fewer letters, on average, than the others. A test of the hypothesis that the average number of letters per school was the same in each treatment arm yields p=0.11. As discussed in the main text, we do not find any systematic differences in observable characteristics of students or high schools assigned to different arms in either year. When we measure account registration we include only accounts registered by September 1. Although a few account registrations trickle in after this time, the number is small, and is unlikely to be affected by letters sent months earlier.

43
The variation in mailing timing across treatment arms raises the possibility that this could contribute to (or mask) the effects of the letter content. If a letter received in early December is more likely to be read or acted upon than one received later in December, for example, that would lead us to understate the impact of our alternative treatments in year 1 relative to the control condition, or the impact of the net cost treatment relative to the other three in year 2. We have conducted extensive additional analyses to confirm that this is not a factor in our results. Specifically, we have estimated versions of our main specifications that control for flexible polynomials in the mailing date, and have estimated event study models that measure the treatment effects on account registrations based on registrations that occur within a few weeks of when the student’s letter was mailed (while controlling for calendar time patterns in registration). Neither of these yields qualitative changes in our results. D. Additional Results Supplement Table 2 shows the distribution of high schools across treatment arms in the two years. High schools are included in the table for a given year only if at least one letter was sent to a student at that school, and the treatment arm is indicated as missing otherwise. (Schools that received no letters in either year are excluded entirely.) A chi-square test of independence of the two years’ assignments, estimated only on schools included in each year, has a p-value of 0.516. Supplement Table 3 presents results for the impact of the letter variants on enrollment at any time in the academic year after high school graduation. The first two columns repeat the results for account creation and fall semester enrollment from Table 3. In the final column, we modify the column-2 dependent variable to code as 1 students who first enrolled in the spring following high school graduation. We do not have complete data for this for year 2, so we present results only for the year-1 experiment. The enrollment rate goes up only 1.5 percentage points when spring data are included, and not surprisingly our estimates of treatment effects do not change. Supplement Table 4 shows an analysis of the role of living at home as a moderator of the effect of the net cost letter. In columns 1 and 2, we take as the outcome the payout of the Cal Grant at a college where the student listed on the FAFSA a plan to live at home while attending. We see positive effects of the net cost letter on this outcome. In column 3, we estimate effects on any Cal Grant payout in the subsample of students who listed at least one college with the live-at-home option, while in column 4 we further limit the sample to students who listed at least one four-year college where they planned to live at home. We find marginally statistically significant effects of the net price letter on payout of the Cal Grant in column 3, though not in column 4. Supplement Table 5 presents an additional heterogeneity analysis, parallel to those in Table 7 and 8, that was specified in our project pre-registration. Here, we divide high schools by the share of the recipients of the prior year’s Cal Grant notification letters for whom the grant was eventually paid out, and estimate the impact of our treatments

44
separately for schools that are above and below median. We do not see meaningful differences in treatment effects across this dimension.

Cal Grant Preliminary Eligibility Notification
• Date 01/19/2018
• CSAC ID Number
•
Congratulations! You have been awarded a preliminary Cal Grant award for the 2018-19 academic year!
Governor Edmund G. Brown Jr., the Legislature and the California Student Aid Commission (CSAC) are investing in YOU because of your academic achievements and determination. Based on the information you provided to CSAC on your Free Application for Federal Student Aid (FAFSA) or California Dream Act Application (CADAA) as well as your GPA, you have been determined to be preliminarily eligible for a Cal Grant.
Cal Grant award amounts vary by the type of college you choose to attend and enrollment status. These are the current Cal Grant maximum amounts you could receive if you enroll at an eligible California campus in the following segments:
*Cal Grant B students may also receive a $1,672 access award in addition to the amount listed above.
In addition to a Cal Grant you are potentially eligible for a Federal Pell Grant, for approximately $ 5920These grants, and any other financial aid that you might receive, will help you cover the costs of attending college, which include tuition and fees, food and housing, and books and supplies.
The Cal Grant and Pell Grant do not require repayment and is only one part of your financial aid package. After you are admitted, the campus financial aid office will provide a full financial aid award notice. In addition to the Cal Grant and Pell Grant, you may also be eligible for one or more of the following:
Institutional grants or scholarships offered at public and private colleges and universities; California College Promise Grant; Work-Study Program or Federal Student Loans; Other types of financial aid offered at your campus of attendance, such as private scholarships and student loans.
This is an initial Cal Grant award notification only. You must still apply for admission to the campus you plan to attend. Your college makes the final eligibility determination for Cal Grant prior to disbursing your award. For questions about final eligibility determination and disbursement dates, reach out to the financial aid office at your chosen campus.
Lupita Cortez AlcaláExecutive Director E1PRP2 (11/17)
PRIVACY STATEMENT: Cal Grant information for students who are 18 years of age or older, or who have attended a postsecondary institution, will only be released to parents or guardians with written authorization from the student.
College Segment Maximum Cal Grant Award Amount California Community College (CCC): $1,672 California State University (CSU): $5,742*
University of California (UC): $12,630* Private, Non-Profit or WASC-accredited colleges: $9,084*
Non-WASC accredited For-Profit Colleges: $4,000*
Make California and your families proud by continuing and completing your education. Claim your Cal Grant Award by logging onto WebGrants for Students at www.csac.ca.gov/mygrantinfo
See enclosed flyer for more information
Supplement Figure 1: Treatment 1
45

• Date 01/19/2018
• CSAC ID Number
•
Dear ,
Congratulations! Based on your hard work and record of academic achievement, you have been preliminarily selected to receive a Cal Grant scholarship. This scholarship will help you pay for the costs of college for all four years if you remain eligible. It does not need to be repaid.
As you research different college options, remember that the Cal Grant is designed so that tuition cost doesn’t determine which college you choose to attend. The maximum amounts you would receive are listed below:
In addition you may be eligible for a living stipend of up to $1,672 per year, and for other grants, such as an estimated $ 1170 in a Federal Pell Grant.
Good luck with your applications! You are already on your way to becoming a college graduate!
Sincerely,
Lupita Cortez AlcaláExecutive Director California Student Aid Commission E1TG12 (11/17)
PRIVACY STATEMENT: Cal Grant information for students who are 18 years of age or older, or who have attended a postsecondary institution, will only be released to parents or guardians with written authorization from the student.
College Segment Maximum Cal Grant Award Amount California Community College (CCC): $1,672
California State University (CSU): $5,742
University of California (UC): $12,630 Private, Non-Profit or WASC-accredited colleges: $9,084
Non-WASC accredited For-Profit Colleges: $4,000
Go to www.csac.ca.gov/mycalgrantinfo and take the first step to claim your scholarship!
Grant ID number: CSAC ID number:
Supplement Figure 2: Treatment 2
46

• Date 01/19/2018
• CSAC ID Number
•
Dear ,
Congratulations! Based on your hard work and record of academic achievement, you have been preliminarily selected to receive a Cal Grant scholarship. This scholarship will help you pay for the costs of college for all four years if you remain eligible. It does not need to be repaid.
You have shown that you’re the kind of person who belongs in college. We’ve been working hard to help you get there!
As you research different college options, remember that the Cal Grant is designed so that tuition cost doesn’t determine which college you choose to attend. The maximum amounts you would receive are listed below:
In addition you may be eligible for a living stipend of up to $1,672 per year, and for other grants, such as an estimated $ 5920 in a Federal Pell Grant.
Good luck with your applications! You are already on your way to becoming a college graduate!
Sincerely,
Lupita Cortez AlcaláExecutive Director California Student Aid Commission E1TG22 (11/17)
PRIVACY STATEMENT: Cal Grant information for students who are 18 years of age or older, or who have attended a postsecondary institution, will only be released to parents or guardians with written authorization from the student.
College Segment Maximum Cal Grant Award Amount California Community College (CCC): $1,672
California State University (CSU): $5,742 University of California (UC): $12,630
Private, Non-Profit or WASC-accredited colleges: $9,084 Non-WASC accredited For-Profit Colleges: $4,000
Go to www.csac.ca.gov/calgrantinfo and take the first step to claim your scholarship!
Grant ID number: CSAC ID number:
Supplement Figure 3: Treatment 3
47

• Date 11/16/2018
• CSAC ID Number
•
Dear ,
Congratulations! You have been preliminarily selected to receive a Cal Grant. This scholarship will help you pay for the costs of college, and it does not need to be repaid.
As you research different college options, remember that the Cal Grant is designed so that tuition cost doesn’t determine which college you choose to attend. The maximum amounts you would receive are listed below:
College Segment Maximum Cal Grant Award Amount California Community College (CCC): $1,672
California State University (CSU): $5,742 University of California (UC): $12,570
Private Nonprofit College or University: $9,084 Private For-Profit College or University: $4,000 - $8,056
You are also eligible for other grants, such as an estimated $ in a Federal Pell Grant. You can learn more about your financial aid options at www.csac.ca.gov/netprice. Good luck with your applications!
Sincerely,
Lupita Cortez AlcaláExecutive DirectorCalifornia Student Aid Commission E1G191 (11/18)
PRIVACY STATEMENT: Cal Grant information for students who are 18 years of age or older, or who have attended a postsecondary institution, will only be released to parents or guardians with written authorization from the student.
Go to www.csac.ca.gov/2019calgrant and take the first step!
CSAC ID number:
Supplement Figure 4: Treatment 4
48
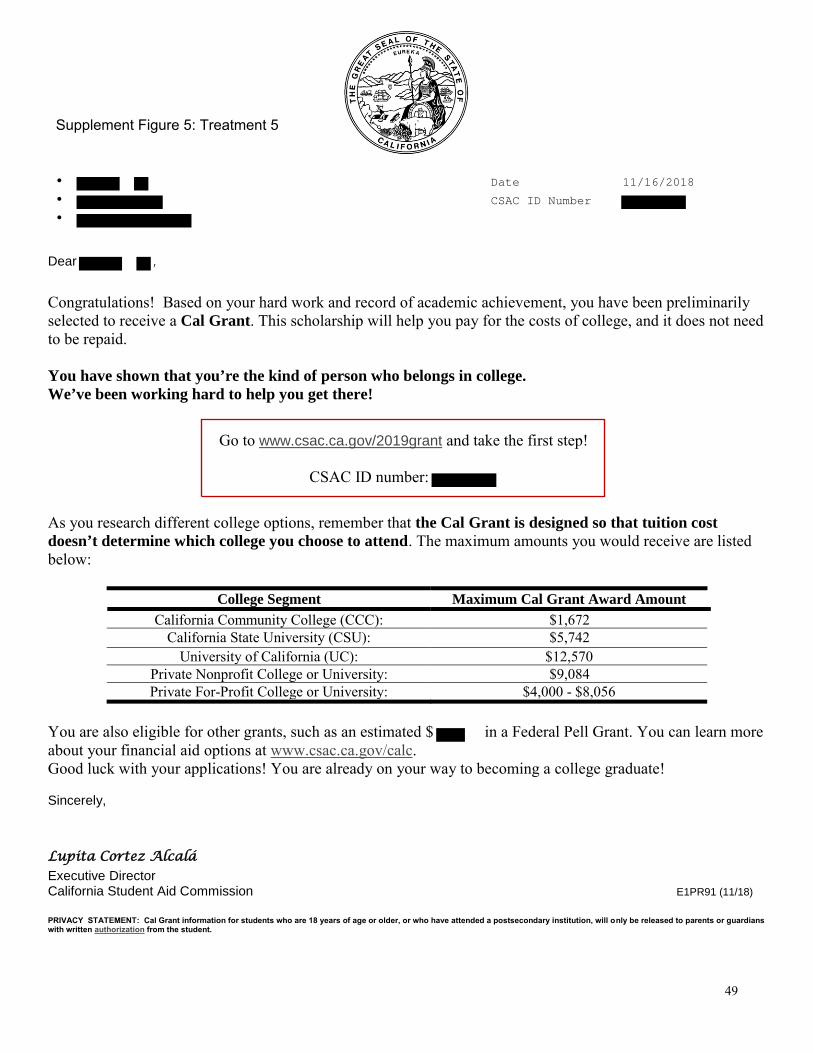
• Date 11/16/2018
• CSAC ID Number
•
Dear ,
Congratulations! Based on your hard work and record of academic achievement, you have been preliminarily selected to receive a Cal Grant. This scholarship will help you pay for the costs of college, and it does not need to be repaid.
You have shown that you’re the kind of person who belongs in college.
We’ve been working hard to help you get there!
As you research different college options, remember that the Cal Grant is designed so that tuition cost doesn’t determine which college you choose to attend. The maximum amounts you would receive are listed below:
College Segment Maximum Cal Grant Award Amount California Community College (CCC): $1,672
California State University (CSU): $5,742 University of California (UC): $12,570
Private Nonprofit College or University: $9,084 Private For-Profit College or University: $4,000 - $8,056
You are also eligible for other grants, such as an estimated $ in a Federal Pell Grant. You can learn more about your financial aid options at www.csac.ca.gov/calc. Good luck with your applications! You are already on your way to becoming a college graduate!
Sincerely,
Lupita Cortez AlcaláExecutive DirectorCalifornia Student Aid Commission E1PR91 (11/18)
PRIVACY STATEMENT: Cal Grant information for students who are 18 years of age or older, or who have attended a postsecondary institution, will only be released to parents or guardians with written authorization from the student.
Go to www.csac.ca.gov/2019grant and take the first step!
CSAC ID number:
Supplement Figure 5: Treatment 5
49

• Date 11/16/2018
• CSAC ID Number
•
Dear ,
Congratulations! Based on your hard work and record of academic achievement, you have been preliminarily selected to receive a Cal Grant. This scholarship will help you pay for the costs of college, and it does not need to be repaid.
Join thousands of high school seniors who have claimed their Cal Grant and are now college graduates!
As you research different college options, remember that the Cal Grant is designed so that tuition cost doesn’t determine which college you choose to attend. The maximum amounts you would receive are listed below:
College Segment Maximum Cal Grant Award Amount California Community College (CCC): $1,672
California State University (CSU): $5,742 University of California (UC): $12,570
Private Nonprofit College or University: $9,084 Private For-Profit College or University: $4,000 - $8,056
You are also eligible for other grants, such as an estimated $ in a Federal Pell Grant. You can learn more about your financial aid options at www.csac.ca.gov/cost.
Good luck with your applications! You are already on your way to becoming a college graduate!
Sincerely,
Lupita Cortez AlcaláExecutive DirectorCalifornia Student Aid Commission E1G291 (11/18)
PRIVACY STATEMENT: Cal Grant information for students who are 18 years of age or older, or who have attended a postsecondary institution, will only be released to parents or guardians with written authorization from the student.
Go to www.csac.ca.gov/2019award and take the first step!
CSAC ID number:
Supplement Figure 6: Treatment 6
50

) (*Ȁ+,Ȁ- ./0 .123
@Ȁ%- 0
<( &-%7A:%7"( BC 5%BȀ'( ;(A- 6%-' D(-E % ' -ȀF(-' (G%F%'Ȁ+"F %F6"Ȁ*Ȁ+Ȁ 70;(A 6%*Ȁ,ȀȀ 9-Ȁ:"+" %-":;BȀ:ȀF7Ȁ'7( -ȀFȀ"*Ȁ% HĀ6"BBF6(:%-B6"9D"::6Ȁ:9 ;(A 9%;G(-76ȀF(B7B(GF(::Ȁ&Ȁ0% ' "7'(ȀB (7 ȀȀ'7( ,Ȁ -Ȁ9%"'H
8B ;(A -ȀBȀ%-F6'"GGȀ-Ȁ 7F(::Ȁ&Ȁ(97"( B0-Ȁ+Ȁ+,Ȁ-76%7,ȀF%ABȀ(GG" % F"%:%"'H
5%BȀ'( 76Ȁ" G(-+%7"( ;(A :"B7Ȁ'( ;(A- I8IJ80 DȀȀB7"+%7Ȁ76%7;(A F(A:' ,Ȁ Ȁ:"&",:ȀG(-%B+AF6 %BK.?0?L2" G" % F"%:%"'76%7D(A:' -Ȁ'AFȀ;(A- F(B7B%776ȀF(::Ȁ&ȀB;(A :"B7Ȁ'% ' '(ȀB (7 ȀȀ' 7( ,Ȁ 9%"',%FEHĀ6Ȁ,%FE(G76"B:Ȁ77Ȁ-6%BȀB7"+%7ȀB(G76Ȁ%"';(A D(A:' -ȀFȀ"*Ȁ%776ȀBȀBF6((:B"G;(A %77Ȁ 'GA::7"+ȀH$(A F% :Ȁ%- +(-Ȁ %,(A7;(A- G" % F"%: %"'(97"( B %7DDDHFB%FHF%H&(*M9-"FȀH
N((' :AFED"76;(A- %99:"F%7"( BC$ (A %-Ȁ%:-Ȁ%';( ;(A- D%;7( ,ȀF(+" & %F(::Ȁ&Ȁ&-%'A%7ȀC
J" FȀ-Ȁ:;0
OPȀFA7"*Ȁ@"-ȀF7(-<%:"G(- "%J7A'Ȁ 78"' <(++"BB"(
N( 7( % ' 7%EȀ76ȀG"-B7B7Ȁ9C
<J 8< Q@ A+,Ȁ-R
Supplement Figure 7: Treatment 7
51

S"*" &B"7A%7"(
OB7"+%7Ȁ' 7A"7"( 0GȀȀB06(AB" &0% '
(76Ȁ-F(B7B
OB7"+%7Ȁ' &-% 7%"';(A D"::
-ȀFȀ"*ȀT"FȀU "*Ȁ-B"7; )(7 %*%":%,:Ȁ ) (7 %*%":%,:ȀSȀD"BV <:%-E<(::Ȁ&Ȁ )(7 %*%":%,:Ȁ ) (7 %*%":%,:ȀU "*Ȁ-B"7;WG<%:"G(- "%XJ% 7%<-A! KL/0L=/ K.L0>=/
U "*Ȁ-B"7;WG<%:"G(- "%XJ% 7%5%-, KL/0231 K.40/31
U "*Ȁ-B"7;WG<%:"G(- "%YU<S8Z KLL0/1> K.>031>U "*Ȁ-B"7;WG<%:"G(- "%X@%*"B KL40?L2 K.?0?L2<%:J7%7ȀXS( & 5Ȁ%F6 K.L0/21 K2.0=4?U "*Ȁ-B"7;WG<%:"G(- "%XJ% @"Ȁ&(
KL201=4 K.204=4
Ā6ȀȀB7"+%7ȀB%,(*ȀDȀ-ȀF-Ȁ%7Ȁ'AB" &76Ȁ Ȁ79-"FȀF%:FA:%7(-B( 76Ȁ" B7"7A7"( B[DȀ,B"7ȀBHI" %: %"''Ȁ7Ȁ-+" %7"( B%-Ȁ+%'Ȁ,; " B7"7A7"( BH$(A F% ȀP9ȀF7'Ȁ7%":B(G;(A- GA::G" % F"%:%"'9%FE%&ȀG-(+ ;(A-" B7"7A7"( ( FȀ ;(A 6%*Ȁ,ȀȀ %'+"77Ȁ'H
N-% 7%"'ȀB7"+%7ȀB" F:A'Ȁ%"'G-(+ +A:7"9:ȀB(A-FȀB0" F:A'" &76Ȁ<%:N-% 7% ' (76Ȁ-B7%7Ȁ0GȀ'Ȁ-%:0% '" B7"7A7"( %: %"'9-(&-%+BHN-% 7%"''(ȀB (7 ȀȀ' 7( ,Ȁ 9%"',%FEHS(% B(- D(-E B7A';+%; %:B(,Ȁ %*%":%,:Ȁ7( 6Ȁ:9;(A F(*Ȁ-F(B7BH
52

53
Supplement Figure 8
Notes: Figures show the cumulative distribution of letter mailing dates by treatment arm in the two years. Vertical lines indicate the University of California application deadline (November 30), the UC and CSU "priority deadline" for FAFSA submission (March 2), and the deadline for submitting statements of intent to register for students admitted to UC (May 1).

54
Supplement Table 1. Illustrative net price table.
UC Berkeley
San Francisco
State University
Cal State Los Angeles
Long Beach Community
College Housing plans On campus On campus Off campus Off campus
Costs Tuition & fees $ 17,048 $ 6,476 $ 6,632 $ 1,182 Room & board $ 18,144 $ 13,434 $ 14,502 $ 12,492 Books & supplies $ 916 $ 1,860 $ 1,948 $ 1,791 Other expenses $ 3,048 $ 2,878 $ 2,974 $ 4,399 Total cost of attendance $ 39,156 $ 24,648 $ 26,056 $ 19,864
Grant aid $ 12,630 $ 5,742 $ 5,742 $ 1,672
Other grants $ 17,726 $ 7,561 $ 7,215 $ 4,143 Total grant aid $ 30,356 $ 13,303 $ 12,957 $ 5,815
Estimated net price $ 8,800 $ 11,345 $ 13,099 $ 14,049
Notes: Table reflects actual output from four college cost calculators for a hypothetical student from a family of four with income $30,000 who lists the indicated housing plans on the FAFSA. Cost elements, total grant aid, and estimated net price (equal to total cost minus grant aid) are obtained from the calculators. We impute the value of the Cal Grant and compute the value of other grants based on this.

55
Supplement Table 2. Assignment of high schools in year 1 and year 2. Year 2 assignment Total
Simplified (control)
Simplified + Belonging
Simplified + SocialNorm
Simplified + Belonging+ Net Costs
Not in sample
Year 1 assignment
Control 185 183 159 176 54 757 7.5% 7.4% 6.4% 7.1% 2.2% 30.7%
Simplified 181 179 174 172 51 757 7.3% 7.3% 7.1% 7.0% 2.1% 30.7%
Simplified + 171 175 199 173 57 775 Belonging 6.9% 7.1% 8.1% 7.0% 2.3% 31.4%
Not in sample 47 51 42 39 0 179 1.9% 2.1% 1.7% 1.6% 0.0% 7.3%
Total 584 588 574 560 162 2468 23.7% 23.8% 23.3% 22.7% 6.6% 100.0%
Notes: Table shows unweighted counts of high schools assigned to each combination of treatments in years 1 and 2, among all schools with Cal Grant-eligible students in at least one year. Schools with Cal Grant-eligible students in only one year are listed as "not in sample" in the other year. Percentages are of the total count of 2,468 high schools that appear in either year. For schools that appear in both years, a χ2 test of independence of the two years' assignments is 5.219 (p=0.516).

56
Supplement Table 3. Effects on enrollment in any semester of the first year. Year 1
Account Fall Full-year Control group mean 0.618 0.604 0.619
Simplified 0.055 0.006 0.006 (0.008) (0.007) (0.007)
Simplified + Belonging 0.068 0.004 0.005 (0.008) (0.007) (0.007)
Social Norm
Net Price
N 134,138 134,138 134,138 p, all TEs=0 0.000 0.70 0.69
Notes: All specifications include stratum fixed effects, and standard errors are clustered at the high school level. Columns 1 and 2 repeat results from Table 3. Column 3 shows results where the dependent variable is enrollment in any semester/quarter of the academic year after high school graduation. This outcome is available only for year 1 of the experiment.

57
Supplement Table 4. Effects on Cal Grant payout in year 2, by availability of live-at-home options
Payout at school listed as live at home
Payout of Cal Grant
All Conditional on any payout
Students listing at least one
live-at-home school
Students listing at least one
live-at-home 4-year school
Control group mean 0.158 0.317 0.464 0.593 Simplified + Belonging
0.006 0.016 -0.004 0.008 (0.008) (0.015) (0.012) (0.014)
Social Norm 0.000 -0.001 0.004 0.004 (0.009) (0.016) (0.014) (0.016)
Net Price 0.020 0.034 0.022 0.004 (0.009) (0.015) (0.012) (0.014)
N 135,701 67,591 71,876 36,446 p, all TEs=0 0.11 0.08 0.18 0.94
Notes: All specifications are linear probability models, including stratum fixed effects. Standard errors are clustered at the level of the high school.

58
Supplement Table 5. Heterogeneity by high school prior-year enrollment rate.
Account registration Fall enrollment Cheapest school Low
enrollment High
enrollment Low
enrollment High
enrollment Low
enrollment High
enrollment Panel A: Year 1
Control group mean
0.603 0.637 0.576 0.644
Simplified 0.056 0.060 0.009 0.005 (0.010) (0.012) (0.008) (0.012)
Simplified + Belonging
0.074 0.064 0.006 0.000 (0.010) (0.013) (0.009) (0.012)
N 78,255 54,071 78,255 54,071 p, all TEs=0 0.000 0.000 0.580 0.868
Panel B: Year 2 Control group mean
0.616 0.662 0.454 0.530 0.153 0.163
Simplified + Belonging
0.020 0.002 -0.005 -0.009 0.001 0.001 (0.015) (0.013) (0.013) (0.013) (0.011) (0.010)
Social Norm 0.002 0.022 -0.017 0.010 -0.015 0.004 (0.016) (0.012) (0.013) (0.014) (0.010) (0.011)
Net Price 0.023 0.033 0.012 0.005 0.017 0.017 (0.014) (0.012) (0.012) (0.012) (0.012) (0.011)
N 54,856 78,757 54,856 78,757 54,856 78,757 p, all TEs=0 0.271 0.271 0.227 0.520 0.040 0.356
Notes: All specifications are linear probability models, including stratum fixed effects. Standard errors are clustered at the level of the high school. Low and high enrollment high schools are based on below and above median in the distribution of the share of the prior year's Cal Grant eligible seniors for whom the grants were paid out.