Behavioral Nudges Prevent Student Dropouts in the Pandemic
48
Working Paper No. 363 Behavioral Nudges Prevent Student Dropouts in the Pandemic Guilherme Lichand and Julien Christen Revised version, April 2021 University of Zurich Department of Economics Working Paper Series ISSN 1664-7041 (print) ISSN 1664-705X (online)
Transcript of Behavioral Nudges Prevent Student Dropouts in the Pandemic

Working Paper No. 363
Behavioral Nudges Prevent Student Dropouts in the Pandemic
Guilherme Lichand and Julien Christen
Revised version, April 2021
University of Zurich
Department of Economics
Working Paper Series
ISSN 1664-7041 (print) ISSN 1664-705X (online)

1 Department of Economics, University of Zurich, Zurich, Switzerland. 2 Center for Child Well-Being and Development, University of Zurich, Zurich, Switzerland. * e-mail: [email protected]; [email protected]
Behavioral Nudges Prevent Student Dropouts in the Pandemic Guilherme Lichand1* & Julien Christen2* ABSTRACT: 5 Background: Student dropouts are a major concern in developing countries; even before the pandemic, one out of three Brazilian students dropped out before graduating high school. School closures in the context of COVID-19 have been shown to magnify that problem, with at least seven million additional dropouts worldwide in 2020. Despite efforts from governments around the world to mitigate learning gaps by the time in-person classes return, 10 interventions to motivate students to remain in school until then have been overlooked. In particular, behavioral nudges sent to parents’ cell phones through text messages had shown promise in preventing student dropouts in developing countries before the pandemic. Having said that, such nudges typically work by leading parents to show up in school to a greater extent and monitor teachers more closely – a mechanism that might not be meaningful in the absence of in-person classes. 15 Methods: We conducted a cluster-randomized control trial with 18,256 high-school students in the State of Goiás, Brazil, randomizing 2/3 of them to receive behavioral nudges through text messages, between June and December 2020. The control group did not receive any messages. Within the treatment group, we additionally randomized students to variations in nudges’ content, to study whether behavioral insights linked to framing and 20 social pressure would lead to higher impacts. We estimate the impacts of nudges on dropout risk over the course of the school year, using administrative data from the State Secretariat of Education on whether students took math and Portuguese exams each school quarter. We also estimate heterogeneous impacts of nudges by risk levels (higher for boys, sophomore and junior students, and those below-median first-quarter Portuguese GPA), by whether messages were sent to parents’ phones or directly to students, and by whether schools already offered 25 online academic activities prior to the pandemic. Findings: Nudges decreased dropout risk by around 26% over the course of the school year. Effects increased with exposure, and were concentrated in students at the highest risk of dropouts. Nudges only worked when sent directly to students’ phones, and in schools that already offered online academic activities prior to the pandemic. 30 Framing content in terms of the upside of graduating high school led to higher impacts than framing it in terms of the downside of dropping out. Alluding to peer motivation to return to in-person classes to leverage social pressure had no additional effects on dropout risk. Interpretation: Results show that behavioral nudges can partially mitigate the dramatic increase in student 35 dropouts during school closures by keeping adolescents motivated to stay in school. The patterns of heterogeneous treatment effects are consistent with complementarities between motivation and academic instruction. All in all, our results showcase that insights from the science of adolescent psychology can be leveraged to shift developmental trajectories at a critical juncture, but also raise caution against indiscriminately applying behavioral insights derived from evaluations of similar interventions in contexts of in-person classes 40 or static decision-making.

1
Student dropouts are a major concern in developing countries: as of 2010, one out of three Brazilian students dropped out before graduating high school; in Ivory Coast, that figure was two out of three.1,2 Not finishing high school is associated with a lower probability of being employed, lower expected wages, and a higher probability of adverse outcomes such as teenage pregnancies, violence and incarceration.3,4,5,6,7,8 Such concerns loom even larger in the context of the COVID-5 19 pandemic, which forced 1.6 billion children and adolescents across 160 countries to stay at home while schools were shut down on sanitary grounds.9,10 Research on the impacts of similar historical events, such as the Spanish flu, Ebola and H1N1, documents that pandemics not only cost lives and employment, but also substantially deteriorate learning outcomes of school-age children,11,12,13 with persistent impacts on their future labor market outcomes.11 Multiple forces 10 combine to push children out of school in such settings: lower returns to education in face of the economic crunch, demand for child labor among poor families, violence against children in a context of stress and with children at home, and loss of motivation to go to school in the absence of face-to-face interactions with teachers and peers.14,15,16,17,18,19,20 As such, a surge in student dropouts is expected to take place unless drastic actions are put in place.10,21 In fact, recent evidence 15 showcases that dropout risk has increased during school closures by a factor of 2 or more;10,22 as a result, seven million additional dropouts are expected by the time in-person classes return.9
While significant attention has been devoted to interventions that can support remote learning, particularly to mitigate learning deficits by the time children come back to in-person classes,23,24,25,26 a large fraction of children and adolescents might never actually return.9,10 20 Nevertheless, interventions to motivate students to remain in school until then have been largely overlooked. Recent evidence shows that, in developing countries, behavioral nudges – typically sent through text messages to parents’ cell phones – have the potential to not only significantly improve learning outcomes,27,28,29,30,31,32 but also to drastically decrease dropouts before the pandemic.33 Having said that, it would be surprising if those effects replicated during school 25 closures, because such nudges typically work by inducing parents to show up in school to a greater extent and monitor teachers more closely33 – a mechanism that might not be meaningful in the absence of in-person classes.
Here we show that behavioral nudges to motivate high-school students to stay engaged with school activities during the pandemic substantially decreased dropout risk during school 30 closures in Brazil. Research Design and Intervention To study this question, we conducted a cluster-randomized control trial in the State of Goiás, Brazil (pre-registered as trial 5986 at the AEA RCT Registry), in partnership with Instituto Sonho Grande 35 and the Goiás State Secretariat of Education in the context of their full-time high school program (Ensino Médio em Tempo Integral). In Goiás, in-person classes were suspended in March 2020, and are not expected to resume until May 2021 (and even then, only if new COVID-19 cases in the State are kept under control). During school closures, classes switched to online, delivered through a video conferencing and team collaboration platform. Students were assigned daily 40 exercises that they had to hand in through the platform. For those without internet access, schools handed out assignments in plastic bags hung at the school gate, and students had to hand them back in the same way.
The intervention, powered by Movva, consisted of sending behavioral nudges twice a week over text messages (SMS) to high-school students or their primary caregivers. Nudges consisted 45

2
of encouragement messages meant to have students engage in remote learning activities (online and offline) and to keep them motivated about staying enrolled in school by the time in-person classes return; examples are provided in the supplementary materials. The intervention spanned the universe of State schools offering the full-time high-school program. The Education Secretariat had access to valid phone numbers for 18,256 students, roughly 40% of the total. While we do not 50 have data on students outside our sample, studies in other Brazilian States provide insight into the nature of selection: students whose phone numbers are known by the school tend to be from wealthier households and display higher grades.27,34 We discuss the implications of selection to the generalizability of our findings in the Discussion section.
In total, 12,056 high-school students across 57 public schools received nudges, while other 55 6,200 high-school students across 30 public schools received no nudges or other text messages from their schools over that period. Randomization was undertaken at the school level. 42% of treated students received nudges directly on their phones, whereas 58% had nudges targeted at their primary caregivers’ phones; this happened only when the Secretariat did not have access to students’ phone numbers directly. The intervention started on June 9th, during the second school 60 quarter, and continued through the end of the 2020 school year. No messages were sent during the winter break in July.
More students were assigned to treatment than control because we split treated students into additional treatment arms, varying nudges’ content across them. We cross-randomized treated students to (1) a framing experiment, and (2) a social pressure experiment. In the framing 65 experiment, half of treated students were assigned to messages framing the motivation to stay in school in terms of gains (the upside of high-school completion), and the other half, to messages framing the motivation to stay in school in terms of losses (the downside of school dropouts). In the social pressure experiment, half of treated students were assigned to messages stating that 80% of their fellow students wanted to return to in-person classes after school reopening (based on a 70 representative SMS survey; see below), and half, to messages that just stated the importance of returning to in-person classes without reference to or data on peers’ motivation to do so. These additional experiments took place only in the first month of the intervention, during the second school quarter (Q2). All treated students received exactly the same content throughout the third (Q3) and fourth school quarters (Q4). Randomization to these additional treatment arms was 75 undertaken at the individual level. Although these additional experiments were not pre-registered (because the implementing partner only decided the content of the additional treatment arms after the rollout of the experiment), we present their results in a separate section because they provide useful insights for the design of behavioral nudges to prevent student dropouts during the pandemic. 80 Definition of Outcomes and Estimation We evaluate the impacts of the intervention by monitoring dropout risk during school closures, based on administrative records shared by the Education Secretariat. While dropouts are typically defined by enrollment status, using this definition during the pandemic would be misleading: most 85 Education Secretariats in Brazil have re-enrolled students automatically in 2021. As a leading example, São Paulo State recorded 0% dropouts this year despite an average dropout rate of roughly 10% among middle- and high-school students in a typical year.22 Instead, we define high dropout risk at each school quarter as students with no math or Portuguese grades in that quarter. A student who has not even taken math and Portuguese tests, the two subjects used to assess 90

3
general proficiency across school systems, can be confidently assigned a high dropout risk; in fact, Instituto Sonho Grande uses this criterion as its main predictor of student dropouts, even before the pandemic. There is a vast literature that uses related measures – absenteeism and assignment completion – to predict dropouts.35,36,37,38 In supplementary materials, we validate this proxy using data for actual dropouts in 2019 from a different Brazilian State. As such, we define high dropout 95 risk equal to 1 if a student had no math grade and no Portuguese grade assigned to them in the administrative data for that quarter, and 0 otherwise. The distribution of this outcome over time and across groups suggests it is in fact a sensible proxy for student dropouts: it is nearly 0% at the first quarter, while in-person classes were still in place, and it gradually increases over time, reaching 2.5% by the end of the school year – 2.5-fold the average dropout rate among full-time 100 high-school students in a typical year, and consistent with estimates from national surveys in 2020 and with other studies in similar contexts.22 Dropout risk is concentrated on boys, and at the 1st and 2nd years of high school, again consistent with the distribution of dropouts in a typical year. We estimate average treatment effects on this outcome with Ordinary Least Squares regressions. Since we cannot verify whether students effectively received messages as intended, 105 we only estimate intention-to-treat (ITT) effects based on treatment assignment. Taking advantage of the fact that the program was not introduced until the second school quarter, we also estimate a differences-in-differences model, contrasting differences between treated and control students, before and after the onset of nudges. This allows us to estimate dose-response treatment effects. We cluster standard errors at the classroom level because our definition of high dropout risk is 110 based on grades, which are assigned by teachers. We also estimate heterogeneous treatment effects by students’ Q1 Portuguese GPA, gender and grade, by whether students’ or caregivers’ phones were targeted by nudges, and by whether schools already offered internet-based academic activities before the pandemic (according to the 2019 Brazilian School Census). We do not estimate treatment effects on quarterly attendance or grades because data on these outcomes suffer 115 from quality issues. In particular, the Secretariat shared no data on Q3 attendance or grades, and we estimate significant bunching on passing grades in Q4 – likely reflecting strategic behavior by teachers to prevent massive grade repetition in 2020.
The fact that teachers were aware of treatment assignment might have induced selective reporting across treated and control schools. To rule out that treatment effects are merely driven 120 by reporting biases, we complement these analyses with administrative data on students’ behavior and survey data on students’ motivation to return to school once in-person classes return (see supplementary materials).
Since data on Portuguese and math grades had not been made available by the Secretariat at the time of randomization, we could not stratify treatment assignment by those variables. Ex-125 post, we detect some small but systematic differences across the treatment and control groups with respect to average dropout risk at baseline. Another issue is that we were unable to recover information for 236 students who were no longer listed by the Education Secretariat after randomization was conducted. Since it is impossible to determine whether those students were originally included by mistake, transferred to private schools right after, or abandoned school, we 130 drop those observations from our dataset. Incidentally, that also leads to small but systematic baseline differences in the share of girls across the treatment and control groups. Our differences-in-differences strategy does not entirely overcome biases from such imbalances: different initial conditions are likely associated with different counterfactual trajectories over the course of the school year. Having said that, such differences are driven by outliers – schools for which the share 135 of girls and/or Q1 dropout risk were 1.5 times the inter-quantile range below p25 or above p75 of

4
the baseline distributions of those variables. Dropping all 22 outlier schools (corresponding to 4,105 students) leads to a balanced sample (13,915 students; 7,802 in the treatment group, and 6,113 in the control group), which we use throughout the paper. Supplementary materials document that, when treatment effects are estimated in the full sample, differences-in-differences 140 estimates are very similar, albeit somewhat less precisely estimated.
Effects on Dropout Risk During School Closures Table 1 displays average treatment effects on the indicator of high dropout risk. Column (1) contrasts the treatment and control groups at Q4, while columns (2-4) estimate a differences-in-145 differences model, contrasting dropout risk in the treatment and control groups, before and after the onset of the nudges. Column (2) considers only Q1 and Q4; column (3) considers all data made available by the Education Secretariat, and column (4) estimates dose-response treatment effects.
High dropout risk Q4 Q1 vs. Q4 Q1 vs. Q2-Q4 (1) (2) (3) (4) Nudges -0.0061* (0.0034) Nudges x After -0.0063* -0.0040 -0.0017 (0.0035) (0.0025) (0.0022) Nudges x Dose -0.0023 (0.0016) After 0.0242*** 0.0172*** 0.0101*** (0.0028) (0.0020) (0.0018) Dose 0.0070*** (0.0013) Classroom fixed-effects No Yes Yes Yes Control mean (After=1) 0.0242 0.0242 0.0172 0.0172 Observations 13,915 27,830 41,745 41,745 R-squared 0.0042 0.0453 0.0369 0.0392
150 Table 1: Treatment effects of behavioral nudges on dropout risk
Notes: ITT estimate from an Ordinary Least Squares (OLS) regression with high dropout risk = 1 if the student had no math and Portuguese grades in that quarter, and 0 otherwise. Nudges = 1 in schools where students were nudged, and 0 otherwise. After = 1 for Q2-Q4, 155 and 0 otherwise. In column (4), Dose = 0 for Q1 and Q2, and = 2 for Q4. Column (1) only considers observations at Q4; column (2), only at Q1 and Q4; and columns (3-4), at all available quarters. We dropped 22 schools (corresponding to 4,105 students) – outliers with respect to the baseline distributions of dropout risk and gender. All columns control for students' gender and grade; and whether s/he owns her/his own phone. Standard errors in 160 parentheses clustered at the classroom level. In supplementary materials, Table D.1 shows that student characteristics are balanced across the treatment and control groups after dropping outliers; Figure D.1 displays outlier schools dropped; and Tables D.2-D.3
5
document that results are similar when estimated with the full sample or with standard errors clustered at the school level, respectively (although slightly less precisely estimated). 165 * p<0.1, ** p<0.05, *** p<0.01.
Columns 1 and 2 document that nudges decreased dropout risk by roughly 26% relative to
the control group, an estimate significant at the 10% level. Contrasting columns (1-2) and column (3) shows that nudges’ effect size increased substantially over time. Column 4 confirms that 170 pattern: while nudges decreased dropout risk by less than 10% of its Q2-Q4 average immediately after their onset, their effect size increased over 3-fold throughout the school year (although the dose-response coefficient is imprecisely estimated).
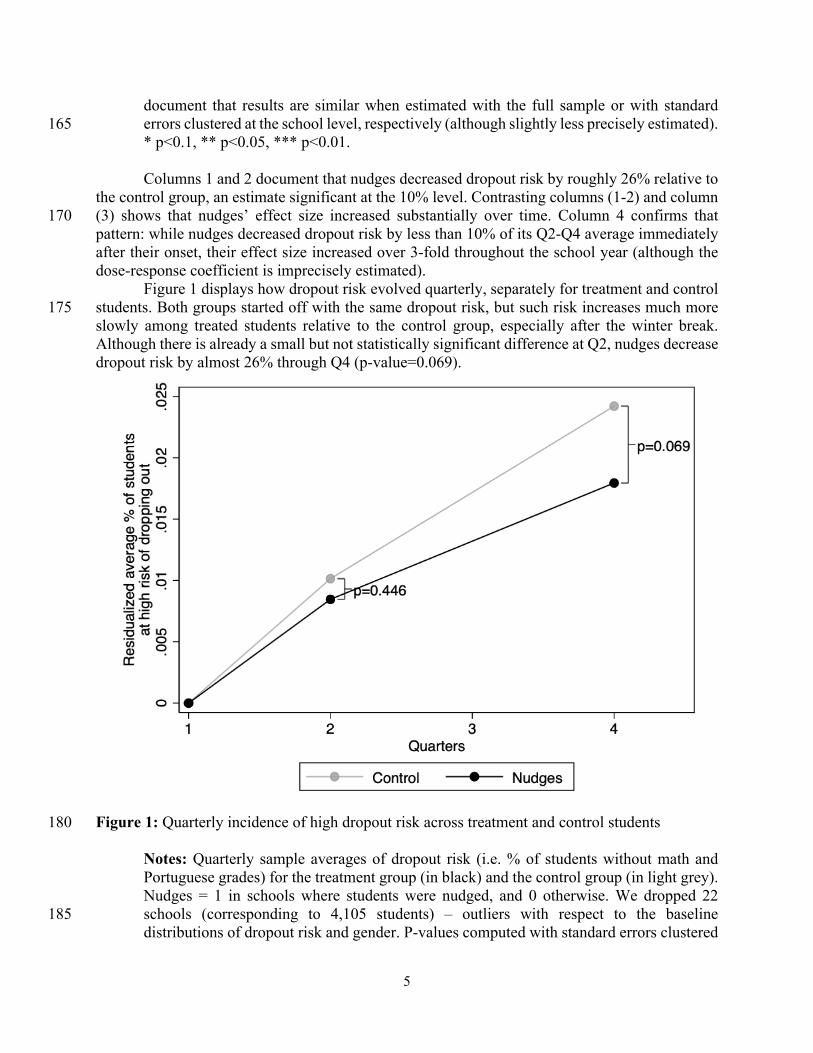
Figure 1 displays how dropout risk evolved quarterly, separately for treatment and control students. Both groups started off with the same dropout risk, but such risk increases much more 175 slowly among treated students relative to the control group, especially after the winter break. Although there is already a small but not statistically significant difference at Q2, nudges decrease dropout risk by almost 26% through Q4 (p-value=0.069).
Figure 1: Quarterly incidence of high dropout risk across treatment and control students 180
Notes: Quarterly sample averages of dropout risk (i.e. % of students without math and Portuguese grades) for the treatment group (in black) and the control group (in light grey). Nudges = 1 in schools where students were nudged, and 0 otherwise. We dropped 22 schools (corresponding to 4,105 students) – outliers with respect to the baseline 185 distributions of dropout risk and gender. P-values computed with standard errors clustered
6
at the classroom level. In supplementary materials, Table D.1 shows that student characteristics are balanced across the treatment and control groups after dropping outliers; Figure D.1 displays outlier schools dropped; and Figure E.1 documents the results using the full sample. 190
Targeting Insights: Heterogeneous Treatment Effects We shed light on the nature of treatment effects by estimating heterogeneous impacts of the nudges. Tables C.1 to C.5 in supplementary materials estimate the differences-in-differences model separately for different sub-samples defined by students’ and school characteristics, along 195 with statistical tests of whether effect sizes of nudges vary systematically across them. Table C.1 estimates treatment effects by students’ Q1 Portuguese GPA. As expected, in the control group, dropout risk is concentrated on those below-median baseline achievement, about 2.3-fold its prevalence among those above the median. Consistently, treatment effects are also much larger among the former: the effect of nudges is concentrated on worst-performing students, 200 for whom the interventions decreases dropout risk by about 1/3 (p-value of the difference = 0.06).
Next, Table C.2 estimates treatment effects by students’ gender. In the control group, dropout risk is concentrated on boys, about 2.4-fold its prevalence among girls. Consistently, treatment effects are also much larger among the former (p-value of the difference = 0.12), for whom the intervention decreases dropout risk by 1.1 p.p. (about 30% of its prevalence in the 205 control group, significant at the 10% level; column 2).
Table C.3 estimates treatment effects by grade. In the control group, dropout risk is concentrated on junior (1st graders) and sophomore students (2nd graders); for seniors (3rd graders), it is extremely low, roughly 1/3 of its prevalence in the other grades. Also consistently, treatment effects are concentrated on the first two grades (p-value of the difference = 0.05). The largest effect 210 size is on 1st graders, for whom nudges decrease dropout risk by 1.3 p.p. (42.4% of its prevalence in that grade, significant at the 5% level; column 1).
Table C.4 then estimates treatment effects by whether nudges were sent to caregivers’ cell phones or to students themselves. Even though targeting was not randomly assigned, we compare students for whom the Secretariat had access to their phone numbers (or only to their caregivers’ 215 phone numbers) across the treatment and control groups; importantly, students’ phone ownership is balanced across treatment and control. In the control group, dropout risk is similar across the two sub-samples (2.10 p.p. and 2.89 p.p., respectively). We find that treatment effects are much larger and precisely estimated when nudges are sent directly to students (p-value of the difference = 0.03). For the latter, nudges decrease dropout risk by 1.3 p.p. (45.3% of its prevalence, significant 220 at the 1% level; column 2). Incidentally, this result rules out that nudges work merely because teachers in treated schools know that students are being nudged. Within each treated school, there are always students who receive nudges directly and others who receive them via their caregivers, and teachers or school principals do not know what the individual assignment ultimately was.
Last, Table C.5 estimates treatment effects by whether the school offered students online 225 academic activities before the pandemic or not, based on 2019 Brazilian School Census data. In the control group, dropout risk is similar across the two sub-samples (2.7 p.p. and 2.3 p.p., respectively). For schools without online activities prior to the pandemic, if anything, treatment effects are actually positive (and imprecisely estimated). In contrast, they are negative and precisely estimated for schools that already featured online instruction even before (p-value of the 230
7
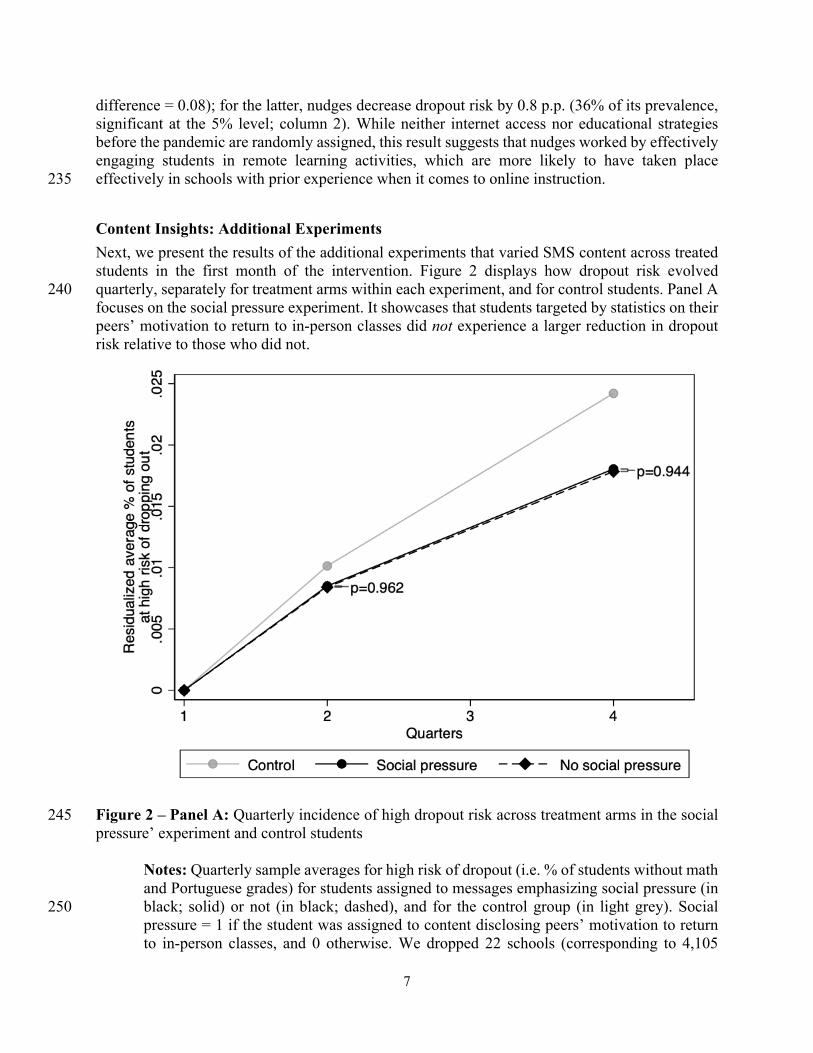
difference = 0.08); for the latter, nudges decrease dropout risk by 0.8 p.p. (36% of its prevalence, significant at the 5% level; column 2). While neither internet access nor educational strategies before the pandemic are randomly assigned, this result suggests that nudges worked by effectively engaging students in remote learning activities, which are more likely to have taken place effectively in schools with prior experience when it comes to online instruction. 235 Content Insights: Additional Experiments Next, we present the results of the additional experiments that varied SMS content across treated students in the first month of the intervention. Figure 2 displays how dropout risk evolved quarterly, separately for treatment arms within each experiment, and for control students. Panel A 240 focuses on the social pressure experiment. It showcases that students targeted by statistics on their peers’ motivation to return to in-person classes did not experience a larger reduction in dropout risk relative to those who did not.
Figure 2 – Panel A: Quarterly incidence of high dropout risk across treatment arms in the social 245 pressure’ experiment and control students
Notes: Quarterly sample averages for high risk of dropout (i.e. % of students without math and Portuguese grades) for students assigned to messages emphasizing social pressure (in black; solid) or not (in black; dashed), and for the control group (in light grey). Social 250 pressure = 1 if the student was assigned to content disclosing peers’ motivation to return to in-person classes, and 0 otherwise. We dropped 22 schools (corresponding to 4,105

8
students) – outliers with respect to the baseline distributions of dropout risk and gender. P-values computed with standard errors clustered at the classroom level. In supplementary materials, Table D.1 shows that student characteristics are balanced across the treatment 255 and control groups after dropping outliers; Figure D.1 displays outlier schools dropped; and Table C.6 formally estimates average effects by treatment arm of the social pressure experiment, controlling for students' gender and grade, and whether s/he owns her/his own phone.
260 Panel B in Figure 2 turns to the framing experiment. It showcases that students targeted by messages emphasizing the upside of remaining in school experience a higher reduction in dropout risk relative to those who were targeted by messages emphasizing the downside of school dropouts (p-value of the difference = 0.26). Interestingly, even though content only varied across groups in Q2, differences compound over time and become much larger and precisely estimated in Q4. 265
Figure 2 – Panel B: Quarterly incidence of high dropout risk across treatment arms in the framing experiment and control students
Notes: Quarterly sample averages for high risk of dropout (i.e. % of students without math 270 and Portuguese grades) for students assigned to messages emphasizing social pressure (in black; solid) or not (in black; dashed), and for the control group (in light grey). Framing gains = 1 if the student was assigned to content disclosing peers’ motivation to return to in-person classes, and 0 otherwise. We dropped 22 schools (corresponding to 4,105 students) – outliers with respect to the baseline distributions of dropout risk and gender. P-275
9
values computed with standard errors clustered at the classroom level. In supplementary materials, Figure D.1 displays outlier schools dropped; Table D.1 shows that student characteristics are slightly unbalanced across the treatment and control groups within the framing experiment, even after dropping outliers; and Table C.7 formally estimates average effects by treatment arm of the framing experiment, showing that results are very robust to 280 controlling for student gender and grade, whether s/he owns her/his own phone, as well as interactions between these variables and an indicator variable = 1 after the onset of the nudges (for Q2-Q4), and 0 otherwise.
Incidentally, differences in treatment effects within the additional experiments confirm that the 285 impacts of nudges are not merely driven by differential teacher behavior across treatment and control school, since content variations were assigned at the individual level and teachers were not aware of individual assignments within school. Discussion 290 Taken together, this work suggests that motivating adolescents to stay in school, particularly by making the upside of graduating high-school more salient, might be critical to mitigate some of the most dramatic effects of school closures due to Covid-19 in developing countries.
Results are all the more striking not only because behavioral nudges sent through SMS are cheap and easily scalable, but also because these interventions have been largely overlooked by 295 policy makers amidst efforts to keep curricular activities running in the absence of in-person classes. Cell phone penetration is very high worldwide,39 and text messages do not require smartphones or internet access. Even in face of illiteracy challenges, there is recent evidence that nudges over text messages can work just as well as audio messages.33 Our findings provide important lessons to address the global education crisis in the context of the pandemic: above and 300 beyond focusing on curricular knowledge to address learning deficits, public school systems should reach out to families to provide support and encouragement during challenging times.
At the same time, our finding that treatment effects are concentrated on schools that already featured online academic activities prior to the pandemic showcases that merely motivating students is unlikely to mitigate dropout risk. Effective remote learning activities might be 305 necessary – even if clearly not sufficient – to keep students engaged and motivated to return to in-person classes when the conditions allow.
Our experimental findings are based on the approximately 40% of students for whom the Education Secretariat had access to valid phone numbers, which leads to two important concerns. First, what keeps schools from establishing direct contact with the remaining 60% of public-school 310 students in the State? For most of the students whom the Secretariat was unable to reach, the problem was not that they did not have phone numbers on record, but rather that it is common among the poor to frequently change phone numbers – among other reasons, to avoid insistent calls from debt collection companies in a country where 2 out of 3 adults have a negative credit score. Distributing SIM cards with earmarked connectivity, a policy adopted by less than 20% of 315 Brazilian States in the 2020 school year,40 might have the added benefit of establishing a reliable communication line between schools and low-income parents. Second, to what extent are our findings expected to generalize in case that communication barrier could be overcome? Our estimates of heterogeneous treatment effects suggest that, if anything, the impacts of the intervention should be even larger in that case; after all, dropout risk is particularly high among 320
10
students from disadvantaged backgrounds, and the impacts of nudges are largely driven by students at the highest risk of dropping out.
Seminal work notes that neuro-biological changes during puberty redirect adolescents’ attention and motivational salience,41 with status-seeking behaviors, romantic interests and peer pressure often getting in the way of attending classes.41 As a result, adolescents are the ones most 325 likely to drop out,15 and presumably even more so in the context of school closures. If insights from adolescent psychology suggest that this population is the one most at risk of dropping out amidst the pandemic, they also lay out opportunities to intervene. In fact, motivational interventions have been shown to successfully improve adolescents’ choices, from healthy eating42 to school effort,43 with the potential to shift developmental trajectories. Our results showcase first-330 hand that, as with adult populations, and as in other decision domains44,45,46,47 behavioral nudges to keep adolescents in school can be effective, by rendering school activities top-of-mind and changing behavior accordingly. This comes across in our findings most clearly in two ways. First, the impacts of the intervention are concentrated on students who receive messages directly on their phones, rather than indirectly through their primary caregivers. Second, treatment effects are 335 sensitive to how messages are framed, even when their informational content is exactly the same.
Incidentally, the pattern that we document within the framing experiment goes in the opposite direction of loss-aversion – the tendency to react more to avoiding losses than to acquiring identical gains. Partly, this might be due to complex attention dynamics: the fact that differences between treatment arms keep increasing during the third and fourth school quarters even though 340 we only varied content across them in the second school quarter suggests that framing effects influence future attention allocation. While loss aversion has been documented as a systematic phenomenon in the context of static decision-making,48 in a dynamic setting, previous framings might influence how individuals consider all other future decisions, potentially reversing the intuition for expected effect sizes. Similarly, the small effect we document within the social 345 pressure experiment is at odds with typical effect sizes in the literature,49,50,51,52,53,54 what is perhaps unsurprising as peer pressure and social norms might be much less salient in the absence in-person classes. Last, while nudging primary caregivers has been shown to improve educational outcomes before the pandemic – even when it comes to adolescents27 –, our results show that, at least in the context of school closures, it might be crucial to reach out to students directly. 350
All in all, our findings suggest that behavioral sciences should inform the design and targeting of interventions to mitigate the educational impacts of school closures in the pandemic,32 but also raise caution against indiscriminately applying insights derived from evaluations of similar interventions in the context of in-person classes or from experimental settings that miss essential features of the decisions students actually face. 355

11
1. OECD (2021), Secondary graduation rate (indicator). doi: 10.1787/b858e05b-en (Accessed on 16 March 2021).
2. Institut National de la Statistique (INS) et Fonds des Nations Unies pour l'Enfance (UNICEF). Côte d'Ivoire - Multiple Indicator Cluster Survey 2016 (MICS) 2016, Ref. CIV_2016_MICS_v01_M. Dataset downloaded from http://mics.unicef.org/surveys on 360 March 16, 2021.
3. P.J. Cook, S. Kang, Birthdays, schooling, and crime: Regression-discontinuity analysis of school performance, delinquency, dropout, and crime initiation. American Economic Journal: Applied Economics. 8(1), 33-57 (2016).
4. E. Duflo, P. Dupas, M. Kremer, Education, HIV, and early fertility: Experimental 365 evidence from Kenya. American Economic Review. 105(9), 2757-97 (2015).
5. E. A. Hanushek, L. Woessmann, The role of cognitive skills in economic development. Journal of economic literature. 46(3), 607-68 (2008).
6. L. F. Katz, C. D. Goldin, The race between education and technology (Harvard university press, Cambridge, MA, 2008). 370
7. N. Döring, M. Lundberg, C. Dalman, T. Hemmingsson, F. Rasmussen, A. S. Wallin, S. Wicks, C. Magnusson, A. Lager. Labour market position of young people and premature mortality in adult life: A 26-year follow-up of 569 528 Swedish 18 year-olds. The Lancet Regional Health-Europe. 3, 100048 (2021).
8. J. R. Glynn, B. S. Sunny, B. DeStavola, A. Dube, M. Chihana, A. J. Price, A. C. Crampin. 375 Early school failure predicts teenage pregnancy and marriage: A large population-based cohort study in northern Malawi. PloS one. 13(5), e0196041 (2018).
9. J. P. Azevedo, A. Hasan, D. Goldemberg, S. A. Iqbal, K. Geven. Simulating the potential impacts of COVID-19 school closures on schooling and learning outcomes: A set of global estimates. (The World Bank, 2020). 380
10. World Bank. 2020. The COVID-19 Pandemic : Shocks to Education and Policy Responses. World Bank, Washington, DC. © World Bank. https://openknowledge.worldbank.org/handle/10986/33696 License: CC BY 3.0 IGO.
11. M. Percoco, Health shocks and human capital accumulation: the case of Spanish flu in Italian regions. Regional Studies. 50(9), 1496-1508 (2016). 385
12. J. W. T. Elston, C. Cartwright, P. Ndumbi, J. Wright, The health impact of the 2014– 15 Ebola outbreak. Public Health. 143, 60-70 (2017).
13. Amorim, Vivian; Piza, Caio; Lautharte Junior, Ildo Jose. 2020. The Effect of the H1N1 Pandemic on Learning : What to Expect with COVID-19. World Bank, Washington, DC. © World Bank. 390 https://openknowledge.worldbank.org/handle/10986/33997 License: CC BY 3.0 IGO.
14. D. Atkin, Endogenous skill acquisition and export manufacturing in Mexico. American Economic Review. 106(8), 2046-85 (2016). 15. S. Duryea, D. Lam, D. Levison, Effects of economic shocks on children's employment and schooling in Brazil. Journal of development economics. 84(1), 188-214 (2007). 395 16. T. M. Diette, A. H. Goldsmith, D. Hamilton, W. A. Darity Jr, Child abuse, sexual assault, community violence and high school graduation. Review of Behavioral Economics. 4(3), 215-240 (2017). 17. S. M. Kiefer, K. M. Alley, C. R. Ellerbrock, Teacher and peer support for young adolescents’ motivation, engagement, and school belonging. Rmle Online. 38(8), 1-18 400 (2015).
12
18. J. P. Allen, R. C. Pianta, A. Gregory, A. Y. Mikami, J. Lun, An interaction- based approach to enhancing secondary school instruction and student achievement. Science. 333(6045), 1034-1037 (2011). 19. K. R. Wentzel, Social relationships and motivation in middle school: The role of 405 parents, teachers, and peers. Journal of educational psychology. 90(2), 202 (1998).
20. C. Goodenow, K. E. Grady, The relationship of school belonging and friends' values to academic motivation among urban adolescent students. The Journal of Experimental Education. 62(1), 60-71 (1993).
21. E. Vegas, School closures, government responses, and learning inequality around the 410 world during COVID-19. Washington, DC: Brookings Institution (2020).
https://www.brookings.edu/research/school-closures-government-responses-and- learning-inequality-around-the-world-during-covid-19/
22. G. Lichand, C. Carneiro, O. Leal-Neto, J. Cossi, The Impacts of Schools Closures in the Pandemic: Evidence from Brazil. (2021). 415
23. I. Asanov, F. Flores, D. McKenzie, M. Mensmann, M. Schulte, Remote-learning, time-use, and mental health of Ecuadorian high-school students during the COVID-19 quarantine. World development. 138, 105225 (2021).
24. S. M. Hasan, A. Rehman, W. Zhang, Who can work and study from home in Pakistan: Evidence from a 2018–19 nationwide household survey. World Development. 138, 420 105197 (2021). 25. C. Doss, E. M. Fahle, S. Loeb, B. N. York, Supporting Parenting through Differentiated and Personalized Text-Messaging: Testing Effects on Learning during Kindergarten. Stanford Center for Education Policy Analysis CEPA Working Paper. 16-18 (2017). http://cepa.stanford.edu/wp16-18 425
26. N. Angrist, P. Bergman, C. Brewster, M. Matsheng, Stemming learning loss during the pandemic: A rapid randomized trial of a low-tech intervention in Botswana. Available at SSRN, 3663098 (2020)
27. E. Bettinger, N. Cunha, G. Lichand, R. Madeira, Are the Effects of Informational Interventions Driven by Salience? Working Paper Series. 350, Department of Economics, 430 University of Zurich (2020). http://www.econ.uzh.ch/static/wp/econwp350.pdf
28. P. Bergman, How behavioral science can empower parents to improve children's educational outcomes. Behavioral Science & Policy. 5(1), 52-67 (2019). 29. P. Oreopoulos, Promises and limitations of nudging in education. (2020). 30. L. C. Page, J. Scott-Clayton, Improving college access in the United States: Barriers 435 and policy responses. Economics of Education Review. 51, 4-22, (2016). 31. R. Jensen, (2010). The (perceived) returns to education and the demand for schooling. Quarterly Journal of Economics. 125(2), 515-548 (2010). 32. M. T. Damgaard, H. S. Nielsen, Nudging in education. Economics of Education Review. 64, 313-342 (2018). 440 33. G. Lichand, S. Wolf, Arm-Wrestling in the Classroom: The Non-Monotonic Effects of Monitoring Teachers. Working Paper Series. 357, Department of Economics, University of Zurich (2020). http://www.econ.uzh.ch/static/wp/econwp357.pdf 34. E. Bettinger, G. Lichand, M. Rege, A. Trindade, D. Yeager. What Is It About the Growth Mindset? Evidence From Brazil. 445 35. H. Lakkaraju, E. Aguiar, C. Shan, D. Miller, N. Bhanpuri, R. Ghani, K. L. Addison, A machine learning framework to identify students at risk of adverse academic outcomes. In

13
Proceedings of the 21th ACM SIGKDD international conference on knowledge discovery and data mining, 1909-1918 (2015). 36. A. Sales, L. Balby, A. Cajueiro, Exploiting academic records for predicting student 450 drop out: A case study in Brazilian higher education. Journal of Information and Data Management. 7(2), 166-166 (2016). 37. M. Kumar, A. J. Singh, D. Handa, Literature survey on educational dropout prediction. International Journal of Education and Management Engineering. 7(2), 8 (2017). 38. M. Fei, D. Y. Yeung, Temporal models for predicting student dropout in massive open 455 online courses. In 2015 IEEE International Conference on Data Mining Workshop (ICDMW). IEEE, 256-263 (2015). 39. World Bank. World Development Indicators. (Accessed on 16 March 2021). https://databank.worldbank.org/Mobile-penetration-/id/5494af8e. 40. L. G. Barberia, L. Cantarelli, P. H. S. S. Schmalz, An Assessment of Brazilian States 460 and State Capitals Remote Public Education Programs during the COVID-19 Pandemic. Available at SSRN, 3776366 (2021). 41. R. E. Dahl, N. B. Allen, L. Wilbrecht, A. B. Suleiman, Importance of investing in adolescence from a developmental science perspective. Nature. 554(7693), 441-450 (2018). 465 42. C. J. Bryan, D. S. Yeager, C. P. Hinojosa, A. Chabot, H. Bergen, M. Kawamura, F. Steubing, Harnessing adolescent values to motivate healthier eating. Proceedings of the National Academy of Science. 113(39), 10830-10835 (2016). 43. D. S Yeager, P. Hanselman, G. M Walton, J. S. Murray, R. Crosnoe, C. Muller, E. Tipton, B. Schneider, C. S. Hulleman, C. P. Hinojosa, D. Paunesku, C. Romero, K. Flint, 470 A. Roberts, J. Trott, R. Iachan, J. Buontempo, S. M. Yang, C. M. Carvalho, P. R. Hahn, M. Gopalan, P. Mhatre, R. Ferguson, A. L. Duckworth, C. S. Dweck, A national experiment reveals where a growth mindset improves achievement. Nature. 573(7774), 364-369 (2019). 44. R. H. Thaler, C. R. Sunstein. Nudge: Improving Decisions about Health, Wealth, and 475 Happiness. (Penguin Books, New York, NY, 2009). 45. D. Karlan, M. McConnell, S. Mullainathan, J. Zinman, Getting to the top of mind: How reminders increase saving. Management Science. 62(12), 3393-3411 (2016). 46. P. Bordalo, N. Gennaioli, A. Shleifer, Memory, Attention, and Choice. Quarterly Journal of Economics. 135(3), 1399–1442 (2020). 480 47. A. Fishbane, A. Ouss, A. K. Shah, Behavioral nudges reduce failure to appear for court. Science, 370(6517), (2020). 48. A. L. Brown, T. Imai, F. Vieider, C. Camerer, Meta-analysis of Empirical Estimates of Loss-aversion. (2021).
49. V. Wagner, G. Riener, Peers or parents? On non-monetary incentives in schools. 485 DICE Discussion Paper, No. 203, (2015). 50. L. Bursztyn, R. Jensen, How does peer pressure affect educational investments?. The quarterly journal of economics. 130(3), 1329-1367, (2015). 51. N. Jalava, J. S. Joensen, E. Pellas, Grades and rank: Impacts of non-financial incentives on test performance. Journal of Economic Behavior & Organization, 115, 161-490 196, (2015).

14
52. G. Azmat, N. Iriberri, The importance of relative performance feedback information: Evidence from a natural experiment using high school students. Journal of Public Economics. 94(7-8), 435-452, (2010). 53. D. S. Yeager, G. M. Walton, S. T. Brady, E. N. Akcinar, D. Paunesku, L. Keane, D. 495 Kamentz, G. Ritter, A. Lee Duckworth, R. Urstein, E. M. Gomez, H. Rose Markus, G. L. Cohen, C. S. Dweck, Teaching a lay theory before college narrows achievement gaps at scale. Proceedings of the National Academy of Sciences. 113(24), E3341-E3348 (2016). 54. M. Broda, J. Yun, B. Schneider, D. S. Yeager, G. M. Walton, M. Diemer, Reducing inequality in academic success for incoming college students: A randomized trial of 500 growth mindset and belonging interventions. Journal of Research on Educational Effectiveness. 11(3), 317-338, (2018). METHODS Ethics Approval. Approval for this study was obtained from the Institutional Review Board of 505 the Department of Economics at the University of Zurich (2020-033). This experiment was conducted in the context of the full-time high school program "Ensino Médio em Tempo Integral" of the Goiás State Secretariat of Education. When it comes to informed consent, since participants are minors, broad consent was obtained from their legal guardians directly by the Education Secretariat (at the time of school enrollment), allowing researchers to use secondary information 510 from administrative records without eliciting further consent. Our implementing partner Movva further obtained students’ assent directly via text messages (SMS): participants were informed and reminded of the fact that they could opt-out from the intervention and SMS surveys at any point (by simply replying ‘STOP’ or ‘CANCEL’, free of charge), without consequence. Participants. Participants consist of public school students enrolled in grades 10-12; typical age 515 is 15-18 years old. All contacts were provided to Movva by the Goiás State Secretariat of Education. The total number of contacts in the database correspond to 18,256 students, 12,056 of which randomly assigned, across 57 schools, to receive SMS nudges between June 9th and December 31st, and 6,200 across 30 schools assigned not to receive nudges or any other SMS communication from their schools. Power calculations before the onset of the intervention pointed 520 out this sample size was large enough to detect relevant minimum effects on the outcomes of interest. Data collection. Before the start of the intervention, the contacts’ database was shared with the authors to complete the randomization at the school level, stratified by gender, grade and phone ownership. Schools were randomly assigned to either a treatment or a control group, following the 525 group sizes above and using the statistical software Stata. The database including a treatment assignment indicator was then returned to Movva such that SMS nudges could be sent accordingly to the treatment group, but not to the control group. Data on online access to the platform and participation in offline school activities was shared by the Secretariat of Education with Movva, while data on motivation to return to regular classes once 530 they resume was collected by Movva directly over SMS surveys, from rotating sub-samples of approximately 280 students in the treatment and control groups every week – from the week after the intervention started until 3 weeks after it ended. Weekly sub-samples were also randomly drawn from the subject pool. Data on quarterly grades and attendance was shared by the Secretariat of Education in March 2021. Balance tests using Wald tests of simple and composite linear 535 hypotheses were conducted before and after dropping outliers to ensure that each treatment group

15
is comparable with respect to students' and school characteristics. These tests and results are detailed in the supplementary material to this paper in Table D.1. Outcome data was shared with the authors, and analyzed following a pre-analysis plan pre-registered as trial 5986 at the AEA RCT Registry (included as supplementary material to this 540 paper). We did not pre-register that we would analyze treatment effects on the high dropout risk proxy rather than official enrolment status because we did not anticipate at the time that the State would automatically enroll all students in 2021. We also did not pre-register the additional experiments, varying content within treated students, that we report in a separate section. All analyses were conducted by the authors using the statistical software Stata. 545 Finally, collecting information on human participants over time is subject to attrition. Participants were free to leave the study at any time, which creates a risk of biasing the results if such attrition is correlated with treatment assignment. In this context, we tested whether the probability of students responding to the SMS surveys was affected by the treatment. The results, which are reported in the supplementary material to this paper in Tables D.2 and D.3, indicate that the 550 probability of responding to SMS surveys is not systematically affected by the treatment. Intervention. Movva, the start-up that powered the intervention evaluated in this study, specializes in promoting behavior change by sending frequent reminders and encouragement messages directly to users’ cell phones. The concept of nudges – interventions that modify the choice architecture by changing the way decisions are framed to mitigate or amplify behavioral biases, 555 inducing certain decisions while preserving subjects’ freedom of choice – lies at the heart of the contributions of Nobel Memorial Prize in Economic Sciences winner Richard Thaler and co-authors. Nudges have been shown to effectively change behaviors across various contexts, from education to preventive health care to savings.44 Eduq+, the intervention evaluated in this study, has been shown to improve educational outcomes in an environment of regular classes across 560 different settings.27,33 In the context of this study, two nudges per week were sent over text messages (SMS) to high-school students or their primary caregivers, depending on phone ownership, in the treatment group. Nudges were organized in 2-week sequences of 4 messages, as follows (translated from Portuguese): 565 Example 1: Common sequence and framing experiment during the second school quarter
Week 1 Week 2 Treatment Fact Activity Interactivity Growth Common sequence
It is normal to be afraid in times of uncertainty. Use
this scenario to your advantage: take the
opportunity to develop the ability to focus on your
plans for the future.
How about summarizing your life project? Highlight which dreams you would
regret NOT realizing. Plan step by step how to get
there.
Tell us! From 0 to 10, what is your level of confidence that completing high school will help with your plans for the future? SMS free of charge.
One step at a time! That's how we build our story. Be
the protagonist of yours and focus on your studies to finish the school year.
Framing losses
Connect! 80% of your colleagues believe in high
school to help them do well in the future. To get there, you need to organize your
study time!
Time to study and watch movies! Make a schedule of the day, setting time to wake up, study, do activities and, of course, catch up on the
latest episodes.
A day used to study gets you closer to your diploma. How has your time management been? 1. Good 2. Regular 3.
Bad. SMS free of charge.
Social media can make the time fly. Set intervals
during the day to look at your phone. Be careful not
to compromise your studies with distractions.
Framing gains
Connect! 80% of your colleagues believe in high
school to help them do well in the future. To get there, use the holidays to define a
new routine.
Time to rest and organize! Set a routine for your
vacations, defining a time to wake up and to do what you
like. How about learning something new?
Having a routine is good for your mind! And to learn
something new too ;) What are you doing on your
vacations? SMS free of charge.
Enjoy the holidays and, between your leisure
activities, invest in skills that will help you
CONQUER the dreams you want for the future!

16
Example 2: Common sequence and social pressure experiment during the second school quarter Week 1 Week 2 Treatment Fact Activity Interactivity Growth Common sequence
What is the root of your feelings? To
laugh or cry comes from within. To
recognize what we feel helps to face life in
difficult times.
Let's understand what makes you happy? Take a paper and write down EVERYTHING that makes you feel good:
people, places, dreams ... This will be your happiness map!
What makes you happy, makes you stronger! Do
you recognize what helps you to deal with the
distance from the school? Yes or No? SMS free of
charge.
That's it! Include in your routine what makes you happy! This will
help you be resilient in this period. Be strong!;
(Message sent to the participant's who did NOT answer the
Interactivity message: Don't give up! Pick something from your map of happiness and put it in
your routine. This will help ou to be resilient in this period.)
Social pressure
Did you know that you learn more when you
explain what you have studied? This study technique is more
efficient than to read the same content
several times.
Google it! Search for study techniques, choose two and apply them this week! After,
talk to your friends about your experience! ;)
Who has an open mind always re-LEARN TO
LEARN. From 1 to 5, how is your motivation to apply
new study techniques in your routine? SMS free of
charge.
80% of your peers are learning new study techniques. Did you
learn a new technique?
No social pressure
Did you know that you learn more when you
explain what you have studied? This study technique is more
efficient than to read the same content
several times.
Google it! Search for study techniques, choose two and apply them this week! After,
talk to your friends about your experience! ;)
Who has an open mind always re-LEARN TO
LEARN. From 1 to 5, how is your motivation to apply
new study techniques in your routine? SMS free of
charge.
Be one step ahead using STUDY TECHNIQUES in your routine and develop learning skills that the university and the market
value.
Example 3: Common sequence during the fourth school quarter
Week 1 Week 2 Treatment Fact Activity Interactivity Growth Common sequence
The only one who doesn't err is the one who doesn't try! Failing when trying to learn is part of the process and prepares the brain to new learnings. Face your mistakes with curiosity!
When was the last time you did something for the first time? Hands on and learn something new: an art, a
game, a recipe! #BeCurious :)
Learning means getting out of the comfort zone! Tell us
about something you achieved after a lot of
perseverance. It can be any activity! SMS free of
charge.
Be aware! Who is open to make mistakes, is open to learn more and to stand out. Challenge yourself,
make mistakes, make mistakes again... and
learn ;)
570 Measures. Student's prolonged absenteeism right before the winter break. The Secretariat of Education shared administrative records with Movva, which then shared it with the authors. This dataset contained information on access to the online platform and participation in offline school activities at the student level, an indicator variable equal to 0 if the student logged in to the platform or participated in offline school activities on a given day and 1 in case s/he did not. Based on this 575 information, we created a measure of prolonged absenteeism which was equal to 1 if a student had no attendance on record for two weeks in a row right before the winter break (between June 15th and June 26th), and 0 otherwise. To ensure that the results presented in the paper are robust to alternative definitions of dropouts, we constructed analogous measures of prolonged absenteeism as no attendance on record for the last week before holidays or for the last three weeks before 580 holidays. Results, which are very robust to using alternative definitions of dropouts, are reported as supplementary material to this paper, in Table E.1. Student's motivation to return to school once they reopen. Each week, students assigned to be surveyed by text message reported their motivation to return to school once regular classes resume

17
by answering the following question: "Do you plan on returning to school once regular classes 585 resume?". Movva coded lack of motivation to return as a binary indicator based on SMS replies, equal to 1 if the reply was “No” or similar, and zero otherwise, and shared that information with the authors. Student dropout risk. We define high dropout risk equal to 1 if a student had no math and no Portuguese grades on record in that school quarter, and 0 otherwise. 590 Analysis method. All results presented in the paper use intention-to-treat analyses by linking student identification numbers to the treatment condition they were assigned to before the start of the intervention. The reason for restricting our analyses to intention-to-treat analyses is that we had no means of verifying whether students effectively received messages as intended. Throughout the paper, we report intention-to-treat effects obtained from Ordinary Least Squares (OLS) 595 regressions, by regressing each outcome on a binary indicator equal to 1 if the student was assigned to treatment and 0 otherwise. In Panel B of Figure B.2, effect sizes are standardized by dividing the treatment effect coefficients by the average in the control group for this outcome, providing effect sizes in % terms. Last, since for one of the weeks of our SMS surveys, student characteristics were not balanced across respondents in the treatment and control groups even after dropping 600 outlierss, we control for gender, grade in which the student is enrolled and phone ownership in this figure. We also control for those characteristics in analyses of student's dropout risk. All p-values are obtained from two-tailed tests of equality of coefficients between the treatment and control groups, with standard errors clustered at the classroom level in each case. 605 Data Availability The data that support the findings of this study are available at https://osf.io/3sqfr/ or upon reasonable request to the authors. Code Availability 610 Syntax can be found at https://osf.io/3sqfr/ or upon reasonable request to the authors. Acknowledgements This manuscript uses administrative data on students’ attendance, granted by the Goiás Secretariat of Education. Funding towards the intervention evaluated in this study was provided by Instituto 615 Sonho Grande. We acknowledge helpful comments during the preparation of the manuscript from Ernst Fehr, Johannes Haushofer, Brad Wible, David Yeager, and Ulf Zölitz. The content is solely the responsibility of the authors. Author contributions 620 G.L. conceived the study and led the design, analysis and writing; J.C. was involved in every phase of the study, particularly the conception of the study, the study design, the interpretation of analyses and the writing of the manuscript. Author information 625 G.L. is a co-founder and chairman at Movva, the implementing partner of the intervention evaluated in this study. Supplementary Information is available for this paper. Correspondence and requests for materials should be addressed to G.L. or J.C. 630
18
Supplementary Materials A. Validation of our proxy of student dropouts This Appendix compiles evidence to validate our proxy for student dropouts (high dropout risk, equal to 1 if a student had no math or Portuguese grades assigned to them in the administrative 635 data for that quarter, and 0 otherwise). To do so, we use administrative data from the State of São Paulo Education Secretariat, which includes information on both math and Portuguese grades and actual dropouts for public high-school students in 2019. Concretely, administrative dropouts equal to 1 if a student was enrolled in a State school in 2019 but not in 2020, and 0 otherwise. We restrict attention to junior and 640 sophomore students, as we cannot compute administrative dropouts for seniors. Figure A.1 plots the prevalence of administrative and proxy dropouts at the classroom level, for the universe of 1st and 2nd high-school grades of São Paulo State. Even though administrative dropouts are measured with error – as students might not re-enroll for alternative reasons, from moving to a different State to switching over to a private school –, the figure showcases that the 645 classroom-level actual and proxy dropouts are highly correlated, with a coefficient of 0.73. While 3.3% of junior and sophomore students dropped out of SP public schools in 2019, that figure was over 6-fold among those with missing math and Portuguese grades by the end of the school year.
Figure A.1: Scatter plot of proxy dropouts and administrative dropouts 650
Notes: The data used in this figure is from the school year 2019 in the State of São Paulo, Brazil. Administrative dropouts equal to 1 if a student was enrolled in school in 2019 but not in 2020, and 0 otherwise. Proxy dropouts equal to 1 if a student had no math or Portuguese grades assigned to them in the administrative data for that quarter, and 0 otherwise. 655

19
B. Short-Run Effects on Students’ Behavior and Motivation We complement the analyses by estimating treatment effects on students’ behavior and motivation shortly after the onset of the intervention. These additional analyses help us rule out that the impacts of nudges could be merely driven by reporting biases, e.g. if teachers in treated schools, being aware of the intervention, inputted grades for students who do not take math and Portuguese 660 tests to a greater extent than in control schools, out of social image concerns.
We rely on administrative data on students’ daily attendance in the two weeks before the winter break – shortly after nudges were introduced –, and on survey data on students’ motivation to return to school once they reopen, based on self-reports. We elicited the latter weekly over SMS, from rotating sub-samples of students in the treatment and control groups, from the week after the 665 intervention started until 3 weeks into the winter break. These surveys targeted random sub-samples of around 15% of our sample each week, with an average response rate of 13% across weeks. Characteristics of respondents are balanced across the treatment and control groups, and we account for selective non-response in any particular week by appropriately bounding our estimates of treatment effects. 670
Figure B.1 estimates average treatment effects of nudges on an indicator variable equal to 1 if the student attended no classes in the two weeks before the winter break, and 0 otherwise, based on administrative data. Despite quality issues for quarterly attendance data, we were able to obtain daily administrative data on attendance for each student in our sample during June 2020. Such data was in fact made available for the vast majority of students (see the Supplementary 675 Materials). Prolonged absenteeism is a well-known predictor of student dropouts. The figure showcases that while 7.21% of students in the control group had not followed remote learning activities right before the winter break, that figure was only 0.33% in the treatment group – an over 95% reduction (p-value = 0.00).

20
680 Figure B.1: Treatment effects of SMS nudges on prolonged absenteeism right before winter break
Notes: ITT estimate from an Ordinary Least Squares (OLS) regression with dependent variable = 1 if a student had no attendance on record over the last two weeks before the winter break, and 0 otherwise. Nudges = 1 in schools where students were nudged, and 0 685 otherwise. We dropped 22 schools that are outliers with respect to the baseline distributions of dropout risk and gender. 90% confidence intervals in light grey brackets; p-value in dark grey brackets from an OLS regression with standard errors clustered at the classroom level. In supplementary materials, Figure D.1 displays outlier schools dropped; Table D.1 shows that student characteristics are balanced across the treatment and control groups; and Table 690 E.1 documents that results are robust to defining prolonged absenteeism as no attendance on record over the last week, or over the last three weeks before the winter break.
Figure B.2 estimates average treatment effects of nudges on an indicator variable equal to
1 if the student states that s/he does not want to go back to school once in-person classes return, 695 and 0 otherwise, using self-reported data. Panel A displays weekly averages for the treatment and control groups, and Panel B estimates week-by-week treatment effects. Panel A documents a striking pattern for lack of motivation to return to in-person classes in the control group, which increased more than 2-fold in little over a month (starting from 15% by the 2nd week of June and reaching 39% by the 3rd week of July). Panel A also shows that lack of motivation to return to in-700 person classes not only started from a lower level in the treatment group already by week 2, but also increased at slower rates while the intervention lasted. Panel B confirms those patterns: nudges

21
decreased lack of motivation to return to in-person classes by over 30% already by week 2, and effect sizes persisted even after nudges last (significant at the 5% level by week 4, and significant at the 10% level in week 5). 705
Figure B.2 – Panel A: Students’ lack of motivation to return to school once they reopen (based on self-reported data) for the treatment and control groups, week by week
Notes: Weekly sample averages for lack of motivation to return to in-person classes (= 1 710 if the student states that s/he does not think s/he will be back in school when in-person classes resume, and 0 otherwise) for the treatment group (in black) and for the control group (in light grey). We dropped 22 schools that are considered outliers according to dropouts and gender in Q1. Self-reports based on weekly SMS surveys from rotating sub-samples of students in the treatment and control groups, from the week after the 715 intervention started until 3 weeks after it ended. Standard errors clustered at the classroom level. The shaded area corresponds to the weeks during the winter break, when no nudges were sent.
720

22
Figure B.2 – Panel B: Treatment effects of SMS nudges on students’ lack of motivation to return to school once they reopen (based on self-reported data), week by week
Notes: ITT estimates from Ordinary Least Squares (OLS) regressions week by week with 725 lack of motivation to return to in-person classes = 1 if the student states that s/he does not think s/he will be back in school when in-person classes resume, and 0 otherwise. We dropped 22 schools that are considered outliers according to dropouts and gender in Q1. Self-reports based on weekly SMS surveys from rotating sub-samples of students in the treatment and control groups, from the week after the intervention started until 3 weeks 730 after it ended. Standard errors clustered at the classroom level. The shaded area corresponds to the weeks during the winter break, when no nudges were sent. In supplementary materials, Table D.1 shows that student characteristics are balanced across the treatment and control groups on average, and for individual weeks except week 3; for this reason, we control for student characteristics in all regressions week by week; Table E.2 documents 735 that results are very similar when estimated with the full sample; and Table D.3 shows that the probability of responding to SMS surveys is not systematically affected by the treatment at any week.
After nudges temporarily stopped, during the winter break, treatment effects gradually 740
faded out. Panel A in Figure B.2 shows that lack of motivation to return to in-person classes increased nearly by the same rate across the treatment and control groups during the winter break.

23
Panel B documents that effect sizes gradually declined, from 40% to 20% only two weeks later, and no longer statistically different from zero.
All in all, these patterns confirm that students react to nudges, both when it comes to their 745 motivation to return to in-person classes and when it comes to attendance in remote learning activities right before the winter break, ruling out that treatment effects are merely driven by differential reporting by teachers in treated schools. C. Heterogeneous Treatment Effects 750
Table C.1: Heterogeneous treatment effects of SMS nudges on high dropout risk, by Q1 Portuguese GPA
High dropout risk Q1 vs. Q4 (1) (2)
Below-median Above-median Nudges x After -0.0113** -0.0001 (0.0054) (0.0036) After 0.0328*** 0.0140*** (0.0044) (0.0027) Classroom fixed-effects Yes Yes Control mean (After=1) 0.0328 0.0140 p-value([Below-median] = [Above-median]) 0.0576 Observations 14,166 13,648 R-squared 0.0830 0.0416
Notes: ITT estimate from an Ordinary Least Squares (OLS) regression with high dropout 755 risk = 1 if the student had no math and Portuguese grades in that quarter, and 0 otherwise. Nudges = 1 in schools where students were nudged, and 0 otherwise. After = 1 for Q4, and 0 otherwise. Columns (1-2) consider observations at Q1 and Q4. We dropped 22 schools (corresponding to 4,105 students) – outliers with respect to the baseline distributions of dropout risk and gender. All columns control for students' gender and grade; and whether 760 s/he owns her/his own phone. Standard errors in parentheses clustered at the classroom level. In supplementary materials, Table D.1 shows that student characteristics are balanced across the treatment and control groups after dropping outliers; and Figure D.1 displays outlier schools dropped. * p<0.1, ** p<0.05, *** p<0.01.
765

24
Table C.2: Heterogeneous treatment effects of SMS nudges on high dropout risk, by gender
High dropout risk Q1 vs. Q4 (1) (2)
Girls (54%) Boys (46%) Nudges x After -0.0020 -0.0105* (0.0031) (0.0056) After 0.0147*** 0.0347*** (0.0021) (0.0044) Classroom fixed-effects Yes Yes Control mean (After=1) 0.0147 0.0347 p-value([Boys] = [Girls]) 0.1163 Observations 14,902 12,928 R-squared 0.0463 0.0760
Notes: ITT estimate from an Ordinary Least Squares (OLS) regression with high dropout risk = 1 if the student had no math and Portuguese grades in that quarter, and 0 otherwise. 770 Nudges = 1 in schools where students were nudged, and 0 otherwise. After = 1 for Q4, and 0 otherwise. Columns (1-2) consider observations at Q1 and Q4. We dropped 22 schools (corresponding to 4,105 students) – outliers with respect to the baseline distributions of dropout risk and gender. All columns control for the grade of the student; and whether s/he owns her/his own phone. Standard errors in parentheses clustered at the classroom level. 775 In supplementary materials, Table D.1 shows that student characteristics are balanced across the treatment and control groups after dropping outliers; and Figure D.1 displays outlier schools dropped. * p<0.1, ** p<0.05, *** p<0.01.

25
Table C.3: Heterogeneous treatment effects of SMS nudges on high dropout risk, by grade 780
High dropout risk Q1 vs. Q4 (1) (2) (3) 1st graders (42%) 2nd graders (32%) 3rd graders (26%)
Nudges x After -0.0133** -0.0061 0.0049 (0.0060) (0.0061) (0.0048) After 0.0314*** 0.0265*** 0.0096*** (0.0049) (0.0050) (0.0033) Classroom fixed-effects Yes Yes Yes Control mean (After=1) 0.0314 0.0265 0.0096 p-value ([1st graders] = [2nd graders] = [3rd graders]) 0.0477 Observations 11,652 9,070 7,108 R-squared 0.0496 0.0431 0.0394
Notes: ITT estimate from an Ordinary Least Squares (OLS) regression with high dropout risk = 1 if the student had no math and Portuguese grades in that quarter, and 0 otherwise. Nudges = 1 in schools where students were nudged, and 0 otherwise. After = 1 for Q4, and 785 0 otherwise. Columns (1-3) consider observations at Q1 and Q4. We dropped 22 schools (corresponding to 4,105 students) – outliers with respect to the baseline distributions of dropout risk and gender. All columns control for the gender of the student; and whether s/he owns her/his own phone. Standard errors in parentheses clustered at the classroom level. In supplementary materials, Table D.1 shows that student characteristics are 790 balanced across the treatment and control groups after dropping outliers; and Figure D.1 displays outlier schools dropped. * p<0.1, ** p<0.05, *** p<0.01.

26
Table C.4: Heterogeneous treatment effects of SMS nudges on high dropout risk, by targeting 795
High dropout risk Q1 vs. Q4 (1) (2) Caregiver's phone (58%) Student's phone (42%) Nudges x After -0.0015 -0.0131*** (0.0041) (0.0048) After 0.0210*** 0.0289*** (0.0030) (0.0041) Classroom fixed-effects Yes Yes Control mean (After=1) 0.0210 0.0289 p-value([Caregiver]=[Student]) 0.0281 Observations 16,276 11,554 R-squared 0.0580 0.0669
Notes: ITT estimate from an Ordinary Least Squares (OLS) regression with high dropout risk = 1 if the student had no math and Portuguese grades in that quarter, and 0 otherwise. Nudges = 1 in schools where students were nudged, and 0 otherwise. After = 1 for Q4, and 0 otherwise. Columns (1-2) consider observations at Q1 and Q4. We dropped 22 schools 800 (corresponding to 4,105 students) – outliers with respect to the baseline distributions of dropout risk and gender. All columns control for students' gender and grade. Standard errors in parentheses clustered at the classroom level. In supplementary materials, Table D.1 shows that student characteristics are balanced across the treatment and control groups after dropping outliers; and Figure D.1 displays outlier schools dropped. * p<0.1, ** 805 p<0.05, *** p<0.01.

27
Table C.5: Heterogeneous treatment effects of SMS nudges on high dropout risk, by offering of online activities before the pandemic
810 High dropout risk Q1 vs. Q4 (1) (2) No prior online activities (25%) Prior online activities (75%) Nudges x After 0.0081 -0.0080** (0.0086) (0.0037) After 0.0274*** 0.0225*** (0.0056) (0.0031) Classroom fixed-effects Yes Yes Control mean (After=1) 0.0274 0.0225 p-value([Without]=[Internet]) 0.0814 Observations 6,894 20,936 R-squared 0.0512 0.0422
Notes: ITT estimate from an Ordinary Least Squares (OLS) regression with high dropout risk = 1 if the student had no math and Portuguese grades in that quarter, and 0 otherwise. Nudges = 1 in schools where students were nudged, and 0 otherwise. After = 1 for Q4, and 0 otherwise. Columns (1-2) consider observations at Q1 and Q4. We dropped 22 schools 815 (corresponding to 4,105 students) – outliers with respect to the baseline distributions of dropout risk and gender. All columns control for students' gender and grade; and whether s/he owns her/his own phone. Standard errors in parentheses clustered at the classroom level. In supplementary materials, Table D.1 shows that student characteristics are balanced across the treatment and control groups after dropping outliers; and Figure D.1 820 displays outlier schools dropped. * p<0.1, ** p<0.05, *** p<0.01.

28
Table C.6: Heterogeneous treatment effects of SMS nudges on student dropout risk across treatment arms in the social pressure’ experiment and control students
825 High dropout risk Q4 Q1 vs. Q4 Q1 vs. Q2-Q4 (1) (2) (3) (4)
Social pressure -0.0060 -0.0004 -0.0004 -0.0004 (0.0037) (0.0003) (0.0003) (0.0003) No social pressure -0.0061* (0.0037) Social pressure x After -0.0062 -0.0039 -0.0016 (0.0038) (0.0027) (0.0024) Social pressure x Dose -0.0023 (0.0017) No social pressure x After -0.0064* -0.0040 -0.0017 (0.0038) (0.0026) (0.0024) No social pressure x Dose -0.0023 (0.0018) After 0.0242*** 0.0172*** 0.0101*** (0.0028) (0.0020) (0.0018) Dose 0.0070*** (0.0013) Classroom fixed-effects No Yes Yes Yes Control mean (After=1) 0.0242 0.0242 0.0172 0.0172 p-value([Social pressure]=[No social pressure]) 0.9748 p-value([Social pressure x After]=[No social pressure x After])
0.9448 0.9404 0.9623
p-value([Social pressure x Dose]=[No social pressure x Dose])
0.9720
Observations 13,915 27,830 41,745 41,745 R-squared 0.0042 0.0453 0.0369 0.0392
Notes: ITT estimate from an Ordinary Least Squares (OLS) regression with high risk of dropouts = 1 if the student had missing values in math and Portuguese grades, and 0 otherwise. Social pressure = 1 for students who were assigned to messages stating that the majority of their fellow students wanted to return to in-person classes after school 830 reopening, and 0 otherwise. No social pressure = 1 for students who were assigned to messages only stating the importance of returning to in-person classes without reference to or data on peers' motivation to do so, and 0 otherwise. After = 1 for Q2-Q4, and 0 otherwise. Dose = 0 for Q1 and Q2, and = 2 for Q4. In column (1), we drop Q1 and Q2 observations from the sample. In column (3), we drop Q2 observations from the sample. In column (4), 835 we add an interaction between social pressure and dose, and between no social pressure and dose. We dropped 22 schools (corresponding to 4,105 students) – outliers with respect to the baseline distributions of dropout risk and gender. We control for individual characteristics in all columns. Those controls are the gender and grade of the student; and whether s/he owns her/his own phone. Standard errors in parentheses clustered at the 840 classroom level. * p<0.1, ** p<0.05, *** p<0.01.

29
Table C.7: Heterogeneous treatment effects of SMS nudges on student dropout risk across treatment arms in the framing experiment and control students
845 High dropout risk Q4 Q1 vs. Q4 Q1 vs. Q2-Q4 (1) (2) (3) (4)
Framing gains -0.0077** -0.0001 -0.0002 -0.0002 (0.0036) (0.0004) (0.0003) (0.0003) Framing losses -0.0043 (0.0037) Framing gains x After -0.0077** -0.0050* -0.0022 (0.0036) (0.0026) (0.0025) Framing gains x Dose -0.0028 (0.0017) Framing losses x After -0.0043 -0.0027 -0.0009 (0.0038) (0.0027) (0.0025) Framing losses x Dose -0.0018 (0.0017) After 0.0258*** 0.0190*** 0.0120*** (0.0047) (0.0033) (0.0033) Dose 0.0070*** (0.0013) Classroom fixed-effects No Yes Yes Yes Control mean (After=1) 0.0242 0.0242 0.0172 0.0172 p-value([Framing gains]=[Framing losses]) 0.2268 p-value([Framing gains x After]=[Framing losses x After]) 0.2307 0.2938 0.6032 p-value([Framing gains x Dose]=[Framing losses x Dose]) 0.4629 Observations 13,915 27,830 41,745 41,745 R-squared 0.0043 0.0472 0.0379 0.0402
Notes: ITT estimate from an Ordinary Least Squares (OLS) regression with high risk of dropouts = 1 if the student had missing values in math and Portuguese grades, and 0 otherwise. Framing gains = 1 for students who were assigned to messages framing the motivation to stay in school in terms of gains (the returns of high school completion), and 850 0 otherwise. Framing losses = 1 for students who were assigned to messages framing the motivation to stay in school in terms of losses (the costs of school dropouts), and 0 otherwise. After = 1 for Q2-Q4, and 0 otherwise. Dose = 0 for Q1 and Q2, and = 2 for Q4. In column (1), we drop Q1 and Q2 observations from the sample. In column (3), we drop Q2 observations from the sample. In column (4), we add an interaction between framing 855 gains and dose, and between framing losses and dose. We dropped 22 schools (corresponding to 4,105 students) – outliers with respect to the baseline distributions of dropout risk and gender. We control for individual characteristics in all columns, as well as for interactions between these individual characteristics and After. Those controls are the gender and grade of the student; and whether s/he owns her/his own phone. Standard 860 errors in parentheses clustered at the classroom level. * p<0.1, ** p<0.05, *** p<0.01.
865

30
D. Balance and Selective Attrition Tests
Table D.1 – Balance tests Panel A: Balance tests for individual characteristics (before and after dropping outliers) 870
Sub-sample means in Q1 ANOVA test # of obs. Control Treatment (p-value) Panel A.1: Before dropping outliers High risk of dropouts 0.000 0.006 0.000 18,020 Girl 0.524 0.540 0.059 18,020 Grade 1.841 1.827 0.823 18,020 Student owns phone 0.408 0.422 0.356 18,020 F-test 0.000 18,020 Panel A.2: After dropping outliers High risk of dropouts 0.000 0.000 1.000 13,915 Girl 0.524 0.544 0.027 13,915 Grade 1.844 1.831 0.855 13,915 Student owns phone 0.407 0.421 0.386 13,915 F-test 0.131 13,915
Notes: Ordinary Least Squares (OLS) regressions of student characteristics on treatment assignment at the time of randomization (Panel A.1), and after dropping outliers (Panel A.2). Results indicate that individual characteristics were unbalanced across the treatment 875 and control groups before dropping outliers. We therefore drop 22 schools (corresponding to 4,105 students) to correct these imbalances. Those schools are considered outliers according to dropouts and gender in Q1. P-values from a test of equality of means of the treatment and control groups for each covariate controlling for individual characteristics (jointly for the F-test), with standard errors clustered at the classroom level. Those controls 880 are the gender and the grade of the student; and whether s/he owns her/his own phone.

31
Panel B: Balance tests for individual characteristics across treatment arms in the social pressure’ experiment and control students (before and after dropping outliers)
885 Sub-sample means in Q1 ANOVA test # of obs. Control Social
pressure No social pressure
(p-value)
Panel B.1: Before dropping outliers High risk of dropouts 0.000 0.007 0.005 0.000 18,020 Girl 0.524 0.539 0.540 0.166 18,020 Grade 1.841 1.830 1.824 0.870 18,020 Student owns phone 0.408 0.425 0.419 0.491 18,020 F-test 0.000 18,020 Panel B.2: After dropping outliers High risk of dropouts 0.000 0.000 0.000 1.000 13,915 Girl 0.524 0.541 0.548 0.072 13,915 Grade 1.844 1.831 1.831 0.984 13,915 Student owns phone 0.407 0.425 0.418 0.542 13,915 F-test 0.136 13,915
Notes: Ordinary Least Squares (OLS) regressions of student characteristics on treatment assignment at the time of randomization (Panel B.1), and after sample adjustment (Panel B.2). Results indicate that individual characteristics were unbalanced across the treatment and control groups before dropping outliers. We therefore drop 22 schools (corresponding 890 to 4,105 students) to correct these imbalances. Those schools are considered outliers according to dropouts and gender in Q1. P-values from a test of equality of means of the treatment and control groups for each covariate controlling for individual characteristics (jointly for the F-test), with standard errors clustered at the classroom level. Those controls are the gender and the grade of the student; and whether s/he owns her/his own phone. 895

32
Panel C: Balance tests for individual characteristics across treatment arms in the framing experiment and control students (before and after dropping outliers)
Sub-sample means in Q1 ANOVA test # of obs. Control Framing gains Framing losses (p-value) Panel C.1: Before dropping outliers High risk of dropouts 0.000 0.006 0.005 0.000 18,020 Girl 0.524 0.536 0.543 0.128 18,020 Grade 1.841 1.820 1.834 0.632 18,020 Student owns phone 0.408 0.417 0.427 0.362 18,020 F-test 0.000 18,020 Panel C.2: After dropping outliers High risk of dropouts 0.000 0.000 0.000 1.000 13,915 Girl 0.524 0.540 0.549 0.068 13,915 Grade 1.844 1.822 1.841 0.526 13,915 Student owns phone 0.407 0.418 0.425 0.565 13,915 F-test 0.094 13,915
900 Notes: Ordinary Least Squares (OLS) regressions of student characteristics on treatment assignment at the time of randomization (Panel C.1), and after sample adjustment (Panel C.2). Results indicate that individual characteristics are unbalanced across the treatment and control groups, even after dropping outliers. For this reason, we control for the gender and grade of the student; and whether s/he owns her/his own phone, as well as interactions 905 between these variables and a dummy variable = 1 for Q2-Q4, and 0 otherwise in Table C.7. We dropped 22 schools (corresponding to 4,105 students). Those schools are considered outliers according to dropouts and gender in Q1. P-values from a test of equality of means of the treatment and control groups for each covariate controlling for individual characteristics (jointly for the F-test), with standard errors clustered at the classroom level. 910 Those controls are the gender and the grade of the student; and whether s/he owns her/his own phone.

33
Panel D: Balance tests for students with valid outcome data (used in regressions; after 915 dropping outliers)
Sub-sample means Diff.=0 [p-value] Number of observations Treatment Control Absenteeism Girl 0.46 0.48 0.031 13,980 Grade 1.84 1.84 0.931 13,980 Student owns phone 0.42 0.41 0.282 13,980 F-test 0.126 13,980 Self-reported motivation (weeks 2 to 4) Girl 0.44 0.40 0.264 654 Grade 1.79 1.95 0.536 654 Student owns phone 0.20 0.23 0.383 654 F-test 0.449 654 Self-reported motivation – week 2 Girl 0.44 0.40 0.524 233 Grade 1.74 1.95 0.124 233 Student owns phone 0.17 0.16 0.921 233 F-test 0.490 233 Self-reported motivation – week 3 Girl 0.43 0.37 0.352 200 Grade 1.85 1.79 0.614 200 Student owns phone 0.10 0.30 0.001 200 F-test 0.002 200 Self-reported motivation – week 4 Girl 0.44 0.42 0.750 221 Grade 1.78 1.80 0.910 221 Student owns phone 0.34 0.25 0.164 221 F-test 0.565 221 Self-reported motivation – week 5 Girl 0.38 0.47 0.191 219 Grade 1.82 1.67 0.249 219 Student owns phone 0.24 0.21 0.630 219 F-test 0.309 219 Self-reported motivation – week 6 Girl 0.40 0.49 0.167 251 Grade 1.72 1.80 0.555 251 Student owns phone 0.27 0.23 0.460 251 F-test 0.425 251 Self-reported motivation – week 7 Girl 0.42 0.37 0.489 225 Grade 1.74 1.90 0.220 225 Student owns phone 0.26 0.29 0.676 225 F-test 0.565 225
Notes: Ordinary Least Squares (OLS) regressions of student characteristics on treatment assignment for students with valid outcome data. We dropped 22 schools (corresponding to 4,105 students) – outliers 920 with respect to the baseline distributions of dropout risk and gender. P-values from a test of equality of means of the treatment and control groups for each covariate (jointly for the F-test), with standard errors clustered at the classroom level. Results indicate that student characteristics are balanced across the treatment and control groups when data are pooled together and for all weeks except week 3. For this reason, we control for student characteristics in all week-by-week regressions in Figure B.2 – Panel B. 925
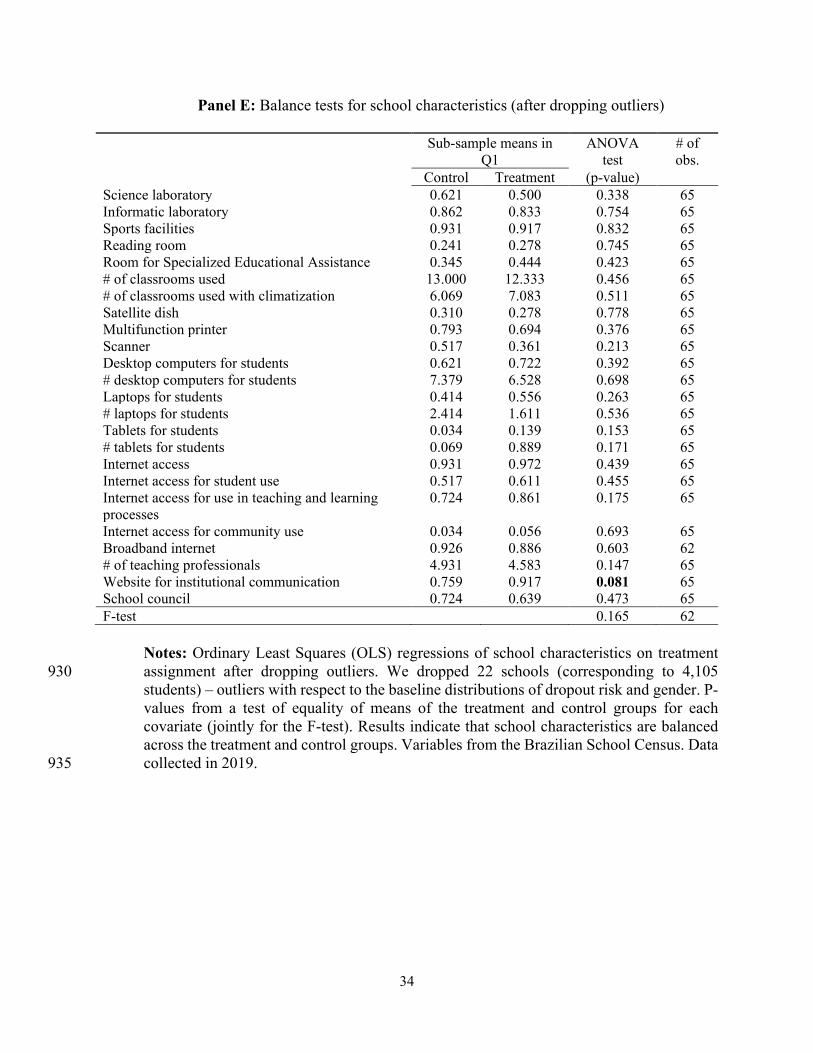
34
Panel E: Balance tests for school characteristics (after dropping outliers)
Sub-sample means in Q1
ANOVA test
# of obs.
Control Treatment (p-value) Science laboratory 0.621 0.500 0.338 65 Informatic laboratory 0.862 0.833 0.754 65 Sports facilities 0.931 0.917 0.832 65 Reading room 0.241 0.278 0.745 65 Room for Specialized Educational Assistance 0.345 0.444 0.423 65 # of classrooms used 13.000 12.333 0.456 65 # of classrooms used with climatization 6.069 7.083 0.511 65 Satellite dish 0.310 0.278 0.778 65 Multifunction printer 0.793 0.694 0.376 65 Scanner 0.517 0.361 0.213 65 Desktop computers for students 0.621 0.722 0.392 65 # desktop computers for students 7.379 6.528 0.698 65 Laptops for students 0.414 0.556 0.263 65 # laptops for students 2.414 1.611 0.536 65 Tablets for students 0.034 0.139 0.153 65 # tablets for students 0.069 0.889 0.171 65 Internet access 0.931 0.972 0.439 65 Internet access for student use 0.517 0.611 0.455 65 Internet access for use in teaching and learning processes
0.724 0.861 0.175 65
Internet access for community use 0.034 0.056 0.693 65 Broadband internet 0.926 0.886 0.603 62 # of teaching professionals 4.931 4.583 0.147 65 Website for institutional communication 0.759 0.917 0.081 65 School council 0.724 0.639 0.473 65 F-test 0.165 62
Notes: Ordinary Least Squares (OLS) regressions of school characteristics on treatment assignment after dropping outliers. We dropped 22 schools (corresponding to 4,105 930 students) – outliers with respect to the baseline distributions of dropout risk and gender. P-values from a test of equality of means of the treatment and control groups for each covariate (jointly for the F-test). Results indicate that school characteristics are balanced across the treatment and control groups. Variables from the Brazilian School Census. Data collected in 2019. 935
35
Figure D.1: Outlier schools with respect to the baseline distributions of dropout risk and gender
Notes: We drop 22 outliers at the school level in Q1 (corresponding to 4,105 students). 940 Those schools are considered outliers according to dropouts and gender in Q1.

36
Table D.2: Selective non-response tests for self-reported data (weeks 2 to 4; after dropping outliers) 945
Weeks 2 to 4 (fig.2)
(1) Nudges -0.0033 (0.0042) Control mean 0.0507 Observations 13,444 R-squared 0.0094
Notes: Ordinary Least Squares (OLS) regression with outcome variable = 1 if the student responded to the SMS surveys during the intervention (i.e. between weeks 2 and 4), and 0 otherwise. P-value from a Wald test of equality of coefficients between the treatment and 950 control groups, with standard errors clustered at the classroom level. Results show that the probability of responding to SMS surveys is not systematically affected by the treatment. We dropped 22 schools (corresponding to 4,105 students) – outliers with respect to the baseline distributions of dropout risk and gender. We control for student's gender, grade and whether s/he owns her/his own phone. 955
Table D.3: Selective non-response tests for self-reported data
(week by week; after dropping outliers)
Week 2 Week 3 Week 4 Week 5 Week 6 Week 7 (1) (2) (3) (4) (5) (6) Nudges 0.0009 -0.0019 -0.0024 -0.0020 0.0001 -0.0025 (0.0025) (0.0024) (0.0024) (0.0023) (0.0026) (0.0026) Control mean 0.0176 0.0165 0.0184 0.0181 0.0193 0.0188 Observations 13,012 12,974 12,996 12,994 13,022 12,998 R-squared 0.0054 0.0039 0.0016 0.0033 0.0028 0.0022
960 Notes: Ordinary Least Squares (OLS) regressions with outcome variable = 1 if the student responded to the SMS survey in each week, and 0 otherwise. P-value from a Wald test of equality of coefficients between the treatment and control groups, with standard errors clustered at the classroom level. Results show that the probability of responding to SMS surveys is not systematically affected by the treatment at any week. We dropped 22 schools 965 that are considered outliers according to dropouts and gender in Q1. We control for student's gender, grade and whether s/he owns her/his own phone.

37
E. Robustness Checks 970
Table E.1: Treatment effects on students without attendance before winter break, during school closures (based on administrative data), for alternative definitions of the outcome variable
(after dropping outliers) 975
No attendance over the last X weeks 1 week 3 weeks (1) (2) Nudges -0.0970*** -0.0675*** (0.0103) (0.0074) Control mean 0.1186 0.0690 Observations 709,035 709,035 R-squared 0.0071 0.0057
Notes: ITT estimates from Ordinary Least Squares (OLS) regressions with outcome variable = 1 if a student had no attendance on record over the last week (column 1) or over the last three weeks (column 2) before the winter break, and 0 otherwise. P-value from a Wald test of equality of coefficients between the treatment and control groups, with 980 standard errors clustered at the classroom level. We dropped 22 schools that are considered outliers according to dropouts and gender in Q1. Results show that patterns showcased by Figure B.1 are robust to alternative definitions of prolonged absenteeism during school closures.

38
Table E.2: Treatment effects of SMS nudges (before dropping outliers) 985
Panel A: Student dropout risk High dropout risk Q4 Q1 vs. Q4 Q1 vs. Q2-Q4 (1) (2) (3) (4) Nudges 0.0004 (0.0035) Nudges x After -0.0051 -0.0040 -0.0028 (0.0035) (0.0025) (0.0023) Nudges x Dose -0.0012 (0.0016) After 0.0243*** 0.0173*** 0.0103*** (0.0028) (0.0020) (0.0018) Dose 0.0070*** (0.0013) Classroom fixed-effects No Yes Yes Yes Control mean (After=1) 0.0246 0.0246 0.0176 0.0176 Observations 18,020 36,040 54,060 54,060 R-squared 0.0043 0.0540 0.0470 0.0489
Notes: ITT estimate from an Ordinary Least Squares (OLS) regression with high risk of dropouts = 1 if the student had missing values in math and Portuguese grades, and 0 990 otherwise. Treatment = 1 in schools where students were nudged, and 0 otherwise. After = 1 for Q2-Q4, and 0 otherwise. Dose = 0 for Q1 and Q2, and = 2 for Q4. In column (1), we drop Q1 and Q2 observations from the sample. In column (3), we drop Q2 observations from the sample. In column (4), we add an interaction between treatment and dose. We control for individual characteristics in all columns. Those controls are the gender and 995 grade of the student; and whether s/he owns her/his own phone. Standard errors in parentheses clustered at the classroom level. * p<0.1, ** p<0.05, *** p<0.01.
1000
39
Panel B: Prolonged absenteeism
No attendance over the last X weeks 1 week 2 weeks 3 weeks (1) (2) (3) Nudges -0.0704*** -0.0466*** -0.0455*** (0.0086) (0.0060) (0.0059) Control mean 0.0961 0.0603 0.0577 p-value([Nudges]=0) 0.0000 0.0000 0.0000 Observations 963,985 963,985 963,985 R-squared 0.0059 0.0040 0.0040
Notes: ITT estimates from Ordinary Least Squares (OLS) regressions with outcome variable = 1 if a student had no attendance on record over the last week (column 1), over 1005 the last two weeks (column 2), or over the last three weeks (column 3) before the winter break, and 0 otherwise. P-value from a Wald test of equality of coefficients between the treatment and control groups, with standard errors clustered at the classroom level.
Panel C: Students’ lack of motivation to return to school once they reopen (based on 1010
self-reported data), week by week
Weeks 2 to 4 Week 2 Week 3 Week 4 Week 5 Week 6 Week 7 (1) (2) (3) (4) (5) (6) (7) Nudges -0.1011*** -0.0490 -0.0508 -0.1698*** -0.1001** -0.0774 -0.0813 (0.0292) (0.0435) (0.0489) (0.0549) (0.0526) (0.0530) (0.0613) Control mean 0.2894 0.1500 0.2105 0.3491 0.2692 0.3455 0.3925 p-value([Nudges]=0) 0.0006 0.2622 0.3006 0.0022 0.0584 0.1460 0.1863 Observations 828 284 249 295 289 319 273 R-squared 0.0247 0.0207 0.0491 0.0448 0.0151 0.0134 0.0149
Notes: ITT estimates from Ordinary Least Squares (OLS) regressions week by week with outcome variable = 1 if the student states that s/he does not think s/he will be back in school 1015 when regular classes resume, and 0 otherwise. P-value from a Wald test of equality of coefficients between the treatment and control groups, with standard errors clustered at the classroom level. We control for student's gender, grade and whether s/he owns her/his own phone.
1020

40
Figure E.1: High risk of dropouts
Notes: Treatment = 1 in schools where students were nudged, and 0 otherwise. Quarterly sample averages for students at high risk of dropout (i.e. % of students without math and Portuguese grades) for the treatment group (in black) and the control group (in light grey). 1025 P-values computed with standard errors clustered at the classroom level.

41
Table E.3: Treatment effects of SMS nudges on student dropout risk (after dropping outliers; with standard errors clustered at the school level)
1030 High dropout risk Q4 Q1 vs. Q4 Q1 vs. Q2-Q4 (1) (2) (3) (4) Nudges -0.0061 (0.0064) Nudges x After -0.0063 -0.0040 -0.0017 (0.0066) (0.0046) (0.0039) Nudges x Dose -0.0023 (0.0028) After 0.0242*** 0.0172*** 0.0101*** (0.0055) (0.0039) (0.0033) Dose 0.0070*** (0.0022) Classroom fixed-effects No Yes Yes Yes Control mean (After=1) 0.0242 0.0242 0.0172 0.0172 Observations 13,915 27,830 41,745 41,745 R-squared 0.0042 0.0453 0.0369 0.0392
Notes: ITT estimate from an Ordinary Least Squares (OLS) regression with high risk of dropouts = 1 if the student had missing values in math and Portuguese grades, and 0 otherwise. Treatment = 1 in schools where students were nudged, and 0 otherwise. After = 1 for Q2-Q4, and 0 otherwise. Dose = 0 for Q1 and Q2, and = 2 for Q4. In column (1), we 1035 drop Q1 and Q2 observations from the sample. In column (3), we drop Q2 observations from the sample. In column (4), we add an interaction between treatment and dose. We dropped 22 schools (corresponding to 4,105 students) – outliers with respect to the baseline distributions of dropout risk and gender. We control for individual characteristics in all columns. Those controls are the gender and grade of the student; and whether s/he owns 1040 her/his own phone. Standard errors in parentheses clustered at the school level. * p<0.1, ** p<0.05, *** p<0.01.

42
F. Pre-Analysis Plan This randomized controlled trial was pre-registered as trial 5986 at the American Economic 1045 Association's registry for randomized controlled trial (AEA RCT Registry). The uploaded plan is detailed below.
Does Nudging Students Decrease Learning Deficits and Dropouts During and After a Pandemic?
Experimental Evidence from Covid-19 1050 Responses in Brazil
Pre-analysis Plan
The covid-19 pandemic has forced 1.5 billion schoolchildren in 160 countries to stay at
home while schools were shut down on sanitary grounds. While several remote learning
tools have been put in place in developing countries, a variety of factors raise critical 1055 concerns about learning deficits and school dropouts when schools are back,
particularly amongst the most vulnerable students. This paper investigates whether
sending reminders and encouragement messages to high-school students in Brazil
during the pandemic increases attendance and assignment completion when it comes to
remote learning, and decreases grade repetition and dropout rates in the aftermath. 1060
I. Introduction
The covid-19 pandemic has forced 1.5 billion schoolchildren in 160 countries to stay at home while schools
were shut down on sanitary grounds. Brazil is no exception. The nationwide decision to shut down schools
for almost the entirety of the 2020 school year in order to limit the spread of the covid-19 pandemic has
forced all schools to switch to remote learning. Such rapid transition, combined with a mismatch between 1065 delivery channels and access conditions – as several State Secretariats of Education switched to online,
while nearly 70 million households have no or only precarious access to internet –, are expected to severely
impact learning, and potentially lead to a spike in school dropouts (Brookings, 2020; World Bank, 2020).
Schools have been trying to keep contact with their students by sending personal letters via post or by
creating an online platform with tools that students can use. However, the attendance of the students, 1070 whether on the platform with the online tools or at school to pick up printed class material, is reported to
be remarkably low. São Paulo State has reported that only 50% of its 3.5 million students are accessing the
online learning platform daily as expected.*
* The State Secretariat also broadcasts content on television. It is much harder to gather data on the share of students following classes on this format daily.
43
With the goal of increasing engagement in remote learning – and, particularly, online attendance and
assignment completion – during the pandemic, as well as limiting its effects on learning gaps and school 1075 dropouts once schools are back, the Goiás State Secretariat of Education is testing various strategies in
partnership with Instituto Sonho Grande.† As part of those strategies, they are interested in evaluating
nudges (reminders and encouragement messages) sent twice a week to high school students, directly on
their mobile phones via text messages (SMS). Towards that goal, they have hired Eduq+, an educational
nudgebot that has been shown to improve educational outcomes (during normal times) in Brazil and Ivory 1080 Coast.
Eduq+ nudges users twice a week with motivating facts and suggested activities to engage them in the
daily school life. It also allows schools to broadcast messages to all users weekly. The intervention has been
evaluated in the context of regular schooling, targeted at parents of primary school children. The nudgebot
has been shown to promote large impacts on school attendance, test scores and grade promotion rates 1085 (Bettinger et al., 2020), and to decrease school dropouts by 50% across multiple primary grades (Lichand
and Wolf, 2020).
The version of Eduq+ to be evaluated in this study is, however, different from that in those studies, since
nudges will be sent directly to students themselves.‡ Moreover, the context of remote learning is also much
more challenging. Whether the intervention is still able to improve educational outcomes under those 1090 conditions is an empirical question.
This pre-analysis plan summarizes the design of a field experiment to test the following primary
hypotheses:
1. Does nudging students increase usage of online learning tools by high school students?
• Hypothesis: SMS nudges increase the share of students who access the online platform daily, and 1095 the share of students who hand in assignments (online or not).
2. Does nudging students mitigate the negative effects of school closures on learning outcomes?
• Hypothesis: SMS nudges improve attendance and grades, and decrease grade repetition and
dropouts once in-person classes resume.
II. Intervention and experimental design 1100
The intervention has been designed by Instituto Sonho Grande and the Goiás State Secretariat of Education,
with the help of Movva (the implementing partner that powers Eduq+).§ It will take place during the months
† Goiás a relatively poor state located in the Center-West region of Brazil. Instituo Sonho Grande is a non-profit organization committed to improving high-school educational outcomes in Brazilian public school. ‡ In case they do not have their own phone, messages will be sent to the mobile phone of their primary caregivers. § One of the authors (Guilherme) is a co-founder and chairman at Movva (http://movva.tech).

44
of June and July/2020, when public high schools will be randomly assigned to have their students receive
two messages per week from Eduq+. 57 schools have been assigned to the treatment group, and 30 to the
control group (which receives no intervention). Randomization is stratified by gender, grade and phone 1105 ownership. In case the student does not own a phone, messages will be sent to the mobile phone of his/her
primary caregiver. The intervention is scheduled to be rolled out on June 9th.
Table 1: Randomization strategy - Treatment vs. Control
Treatment Control 57 schools
12,056 students 30 schools
6,200 students
Table 1 above summarizes the randomization strategy for the first phase of intervention. Within the sample 1110 of 12,056 students assigned to receive nudges, less than half (5,188) own their own mobile phone and will
receive messages directly. It is also important to note that not all students in the sample have access to the
internet and that those who do not can pick up the printed class material once every week and hand in
assignments the following week. For the purpose of this study however, we will be able to measure their
outcomes in different ways. 1115 At the end of July, we will be able estimate treatment effects on access to the online platform, and
assignment completion, from administrative data provided by the Secretariat. Concretely, we have
requested weekly student-level data on log in activity – or face-to-face pick-up of class materials – as well
as assignment completion (again, online or offline). For those with online access, we hope to get access to
daily data, which would allow us to also estimate high-frequency treatment effects through event studies. 1120 Last, after in-person classes resume, we will have access to administrative records on student-level
attendance, grades, grade repetition and enrollment status.
The interpretation of these long-term effects will vary depending on the choice made by the Education
Secretariat to continue or not the intervention after short-term results are made available. Depending on the
short-term impacts of the nudges, the Education Secretariat might decide to keep testing Eduq+ for a longer 1125 period, to scale it up or to scale it down. As such, three scenarios can emerge after the first phase of the
intervention: (1) the intervention continues for a longer period, keeping the treatment assignment fixed; (2)
the control group starts receiving the nudges; or (3) the treatment group stops receiving the nudges. In case
(1), long-term effects will reflect a combination of nudges sent during and after school closures; in case (2),
long-term effects will only reflect differences in the intensity of the treatment; and in case (3), long-term 1130 effects will capture persistence of treatment effects (if any).
With the number of schools and the number of students presented in Table 1, and assuming an intra-
cluster correlation of 0.16 (SARESP, 2014a, 2014b) as well as conservative variance estimation for binary

45
outcomes (assuming that 50% of students access the online platform and hand in assignments, in the control
group)-, we could detect treatment effects of at least 0.8 percentage points on those outcomes**. Since the 1135 typical treatment effect of nudges on binary decisions is 1.7 percentage points (Dellavigna and Linos, 2020),
we conclude that the design is well powered to detect relevant short-term effect sizes.
III. Outcomes
We will document the effects of the treatments on the following categories of outcomes for students enrolled 1140 in high school (age 15 to 18):
A. Short-term outcomes: probability of logging into the online platform or picking up the material in
school, probability of handed in of assignments, as measured by administrative records;
B. Long-term outcomes: attendance, grades, probability of grade repetition and probability of dropout,
as measured by administrative records. 1145
Since some students will receive messages on their own mobile phones, while for others it is their caregivers
who will be nudged by Eduq+, we will estimate treatment effects within those two subgroups. Power
calculations indicate that we could detect treatment effects of at least 1 and 0.9 percentage point for these
two subsamples, respectively.
Since there are siblings in the data, we will remove from the main analysis cases when not all siblings are 1150 assigned to the same treatment conditions. Depending on how many siblings there are, we also plan to
estimate within-family's externalities of the nudges, taking advantage of that sub-sample.
IV. Empirical analysis
Since the intervention is randomly assigned, comparing treatment and control groups yields treatment
effects of the SMS nudges on the outcomes of interest (Section III). Using ordinary least squares 1155 regressions, we will estimate:
𝑌𝑌𝑠𝑠𝑠𝑠𝑠𝑠𝑗𝑗 = 𝛽𝛽0 + 𝛽𝛽1𝑇𝑇𝑠𝑠𝑠𝑠 + 𝜃𝜃𝑠𝑠 + 𝑢𝑢𝑠𝑠𝑠𝑠𝑠𝑠
Where:
• 𝑌𝑌𝑠𝑠𝑠𝑠𝑠𝑠𝑗𝑗 : Outcome variable j for student i at school m and stratum s;
** These power calculations have been computed by clustering at the school level.

46
• 𝑇𝑇𝑠𝑠: Indicator variable equal to 1 if students I in school m and stratum s is assigned to receive SMS 1160 nudges, 0 otherwise;
• 𝜃𝜃𝑠𝑠: stratum fixed effects.
We cluster standard errors at the school level, since that is the level at which the intervention is randomly
assigned. We are interested in testing 𝛽𝛽1 = 0.
1165
REFERENCES
Bettinger, E., Cunha, N., Lichand, G., & Madeira, R. (2020). “Are Effects of Informational Interventions
Driven by Salience?”. Working Paper.
DellaVigna, S., & Linos, E. (2020). RCTs to Scale: Comprehensive Evidence from Two Nudge Units.
Working Paper, UC Berkeley. 1170
Lichand, G., & Wolf, S. (2020). “Are Parenting Interventions Transferable Across Settings? Evaluating
Key Constraints in Sub-Saharan Africa”. Working Paper.
Rogers, F. H., & Sabarwal, S. (2020). The COVID-19 Pandemic: Shocks to Education and Policy
Responses (No. 148198, pp. 1-0). The World Bank.
SARESP (2014a). Relatório Pedagógico. Língua Portuguesa. 1175
SARESP (2014b). Relatório Pedagógico. Matemática.
Vegas, E. (2020). School closures, government responses, and learning inequality around the world during COVID-19. Washington, DC: Brookings Institution.