
demographic and economic insights and analysis since · PDF filedemographic and economic...
19
INDIANABUSINESSREVIEW demographic and economic insights and analysis since 1926 What should we expect in 2016 for the world, U.S. and Indiana economies? Outlook 2016 Volume 90, No. 4 2016
Transcript of demographic and economic insights and analysis since · PDF filedemographic and economic...

INDIANABUSINESSREVIEWdemographic and economic insights and analysis s ince 1926
What should we expect in 2016 for the world, U.S. and Indiana economies?
Outlook 2016 Volume 90, No. 4
2016
Kelley School of Business
Idalene KesnerDean
Laureen MainesExecutive Associate Dean of Faculty and Research
Ash SoniExecutive Associate Dean of Academic Programs
Philip L. CochranExecutive Associate Dean of Indianapolis Operations
Kenneth A. CarowAssociate Dean of Indianapolis Research and Programs
Teresa M. KaseAssistant Dean of Finance and Operations
Indiana Business Research Center
Jerry N. ConoverDirector and Publisher
Indiana Business Review
Carol O. RogersExecutive Editor
Rachel StrangeManaging Editor
Diane MillerGraphic Designer
Brittany HotchkissQuality Control
Outlook 2016Volume 90, No. 4
w w w. i b r c . i n d i a n a . e d u
Publication of the Indiana Business Review is made possible through the support of Lilly Endowment Inc.
International Outlook for 2016 Elham Mafi-Kreft
U.S. Outlook for 2016 Willard E. Witte
Financial Markets 2016: The Groundhog Forecast Robert S. Neal and Charles Trzcinka
Housing: Positive Growth Expected for 2016 Douglas M. McCoy
Indiana’s Outlook for 2016 John Lynch and Timothy F. Slaper
The Long View: Indiana’s Energy Outlook Matthew B. Dillon and Timothy F. Slaper
Indiana’s Agricultural Outlook for 2016 Corinne Alexander
The Big Picture in 2016
Table of Contents
Indiana MetrosView local metro forecasts in the online edition at www.ibrc.indiana.edu/ibr.

Indiana Business Review, Winter 2015 1
In 2016, we expect world output to grow at an annual rate of 3.6 percent, not much of a change
compared to 2015 and 2014. The economic contrast between the United States and most of the rest of the world will continue to intensify. On one side, the U.S. should enjoy continued growth in the new year, sustaining its 2.5 percent growth from 2015. On the other side, many developed countries and emerging economies will continue to struggle, as they have for much of 2015.
United StatesDespite the end of the
Federal Reserve’s five-year quantitative easing programs in late 2014, the U.S. economy has continued to receive help from the Fed. U.S. monetary policy has remained particularly accommodating by keeping interest rates between 0 and 0.25 percent to incentivize spending. However, with the strength and stability of the domestic market, we believe in the imminent end of the zero rate policy. The ultimate effect of this imminent rise in interest rates is uncertain, but it should have limited consequences on the domestic economy. The limited impact stems from the fact that the increase in rates should be minor and also because market participants have already been anticipating such increases for some time now. The largest effect of a change in U.S. interest rates will be felt by emerging economies, which may further experience an outflow of capital as foreign investors will be attracted to the higher returns in the United States.
One of the interesting aspects of the U.S. economy, and what makes it unique, is its ability to rely on endogenous factors to stimulate growth and its resiliency to grow internally. The U.S. is not as vulnerable to global shocks as many
other developed countries. In 2015, our dollar was strong and our major trading partners (China, eurozone members, Japan, Mexico and Canada) were weak economically leading to weak exports, so the health of the U.S. economy almost completely stemmed from private spending.
The driving force behind U.S. GDP growth has been our domestic household spending. Consumer confidence was encouraged by a constantly improving labor market, exceptionally low oil prices and an exceptionally low cost of borrowing. Furthermore, the surge in household spending has had a positive spillover effect on the U.S. automobile industry and the residential housing industry (construction and sales). However, the collapse of oil prices, and more generally commodity prices, has and will continue to adversely affect the mining and oil industry in 2016. Overall, after seven years of moderate growth, it looks like 2016 may be the year when we will reach our business cycle peak.
EurozoneThe economic environment at the beginning of 2015
looked very promising for the eurozone. A weak domestic currency, very low oil prices and a brand new round of quantitative easing by the European Central Bank were offering an optimal environment for a bounce-back economy. Then, a new chapter of the Greek crisis commenced, monopolizing the attention of European leaders and further eroding foreign investors’ confidence in the stability of the eurozone.
Although Europe showed great resilience to the Greek crisis, the events of the summer—geopolitical crises as well as the generalized slowdown in the emerging markets (especially Russia, China and
Brazil)—uncovered Europe’s high vulnerability to exogenous shocks.
While some peripheral countries of the eurozone, such as Spain and Italy, are growing more rapidly thanks to their enactment of significant structural reforms, overall a modest growth of 1.6 percent is expected for the eurozone in 2016. Contrary to the U.S., Europe’s private spending has yet to be sufficient to drive its growth. The sustained levels of very low inflation have given consumers some purchasing power, but the lack of confidence about their future prospects (as the labor market is still very weak) has proven to be insufficient to boost business investment. Furthermore, long-term trends such as an aging population and the declining productivity of its labor force have further contributed to weakened business investments.
In 2016, a weaker currency (triggered by an anticipated new round of quantitative easing in December) will allow the eurozone to gain competitiveness. Furthermore, the lasting lower commodity prices, which will help maintain lower productive costs, should provide an environment in which many of the policymakers can tackle their inherent structural problems regarding their regulation of labor, business and capital. This round of structural reform is necessary if eurozone members want to continue to be relevant. Finally, the migrant crisis and the clearly uncoordinated efforts of the eurozone members further outlined the weaknesses of Europe as a unified economy. Without fiscal and political integration and coordination, Europe will never reach its potential for growth and will continue to lag behind other developed economies.
International Outlook for 2016Elham Mafi-Kreft, Ph.D. Clinical Assistant Professor of Business Economics and Public Policy, Kelley School of Business, Indiana University Bloomington
2 Indiana University Kelley School of Business, Indiana Business Research Center
BrazilIn 2015, Brazil fell deep into
recession, with a 3 percent decline forecasted before year’s end and a continued decline expected for the first half of 2016. It is the hope of the outlook panel that the summer Olympic Games will bring relief to the country. However, the overall picture looks gloomy as the most optimistic forecasts show a 1 percent decline in real GDP for 2016.
The recurring problem within the Brazilian economy is political. The country’s elite have lost all credibility after a series of corruption cases (the partially state-owned oil giant Petrobas is thought to have lost $2 billion in bribes alone). The loss of confidence in the country’s institutions has resulted in a large capital outflow that has weakened the real (Brazil’s currency) and drove inflation to new heights (8.9 percent in 2015—expected to decrease to 6.3 percent in 2016). These events have contributed to a decrease in private spending as access to credit has decreased, cost of borrowing has increased and real wages have collapsed. The unemployment rate boomed and is forecasted to be at 8.6 percent in 2016 (it was as low as 4.8 percent in 2014).
Brazil’s weakened position has only gotten worse because of its depressed export revenue. This drop in export revenue has largely been driven by the slowdown of China, one of Brazil’s major trading partners, and the collapse in commodity prices.
While the central bank of Brazil has pledged to keep rates high, the government is not credible in its effort to discipline its federal budget and the sovereign bond has been downgraded to junk status, which in turn could result in further capital outflow. Political inertia has the potential to greatly hurt this economy that is composed of competitive multinationals (in the energy, agro-business, construction and aviation sectors), extraordinary natural
resources and a large population with a growing middle class.
RussiaThe recession in Russia will
end up having been quite severe in 2015 and will continue in 2016 as Russia is expected to contract at a rate of 0.6 percent. The good news is that the recession will not get worse as Russia has reached its business cycle trough. However, with the continued drop in the price of oil (Russia’s principal revenue source), 2015 saw the ruble hit a new low and inflation peaked at 15 percent in 2015 (forecasted at 9 percent for 2016). Even if the central bank decreases interest rates, household consumption will stay depressed, and we cannot count on any internal factors to jump-start the economy.
In 2016, it is likely that the current account will continue to show a surplus, but mostly because of a large drop in imports rather than a rise in revenue generated through exports.
The one piece of good news is that we should see a further slowdown of capital outflow compared to 2014 and 2015, which will create some more financial stability within the Russian banking sector. In 2016, the principal weakness of Russia will be low oil prices, which will continue to keep foreign investors away from the Russian market and prevent Russia from building up the productive capacity that is crucial to reach its economic potential.
IndiaThe dichotomy of India’s economic development
(through weak agricultural but strong service industries) is forecasted to persist, but the net forecast is optimistic that the business environment in India will continue to improve in 2016. The majority of the Indian population is employed in the country’s agricultural sector, where revenues are very low. However, the greatest contributor to India’s
GDP is the service industry, where workers are earning high revenues—especially in the IT sector.
Overall, the GDP per capita in India is $5,708 (while China is more than double that), and inequality is persistent. India’s human development (ranked at 135), as measured by the World Bank, is far behind its Asian counterparts like China (ranked at 91). Furthermore, this inequality is the reason why India is still not the engine of growth for Asia. If India wants to become a bigger global player, it needs to continue to transform its economy to a more industrial one, with a stronger middle class and fewer citizens in poverty.
2016 should be a good year for India’s economy, with growth forecasted at an enviable rate of 7.5 percent. The slump in commodity prices will help this commodity net-importer and help control its inflation rate. The future of India’s economic vitality will depend on the government’s ability to conduct important reforms, such as agro-industrial land transfers, which are not very popular politically.
ChinaIn its quest to liberalize its
capital market and further transition toward a consumption- and service-based economy, China surprised the world in 2015 by devaluing the CNY/USD rate by 2 percent. The capital outflow that followed the devaluation, as well as the second Shanghai stock market crash, showed how a loss in foreign investors’ confidence can affect a country even when it has ample reserves to buffer the shock. This economic instability, which we believe will stay contained, has the potential to slow down the liberalization rate of the Chinese economy.
Compounding the issues in China, a series of infrastructure investments have led to overcapacity in production. These overcapacity
Indiana Business Review, Winter 2015 3
problems will continue to dampen domestic business investment and at the same time hurt other countries that enjoyed privileged trade relations with China—especially those who sell their natural resources to China. Unless China’s fiscal policy tries to fill in the lack of private spending, the Chinese economy will further decelerate. Nevertheless, we believe that the overall economic conditions are quite good, and that the economy will grow by 6.3 percent. The big issue is that China’s growth transition, and its relative slowdown, will have spillover deceleration effects on the global economy—especially with those countries that are dependent on exporting to China.
SummaryCommodity exporters (even the more advanced ones, such as Canada, Norway and Australia) will be facing risks as the unfavorable terms of trade, triggered by China, may also impact their investment sector—
much like the one experienced by the U.S. energy sector. Meanwhile, the commodity importers (e.g., India) and more closed economies (such as the U.S.) will fare quite well in 2016. The bliss of a coordinated and uniform global robust growth is unfortunately not expected for 2016.
Data Sources• GDP, Unemployment and Inflation—
International Monetary Fund: https://www.imf.org/external/pubs/ft/weo/2015/02/pdf/text.pdf
• Human Development Index—United Nations: http://hdr.undp.org/en/content/human-development-index-hdi
• GDP per Capita—World Bank: http://data.worldbank.org/indicator/NY.GDP.PCAP.PP.CD
• Maps of China, Russia, India and Brazil provided by FreeVectorMaps.com
The big issue is that China’s growth
transition, and its relative slowdown, will have spillover
deceleration effects on the global economy—especially with those
countries that are dependent on exporting
to China.
4 Indiana University Kelley School of Business, Indiana Business Research Center
A year ago, I was upbeat about the recent behavior of the U.S. economy,
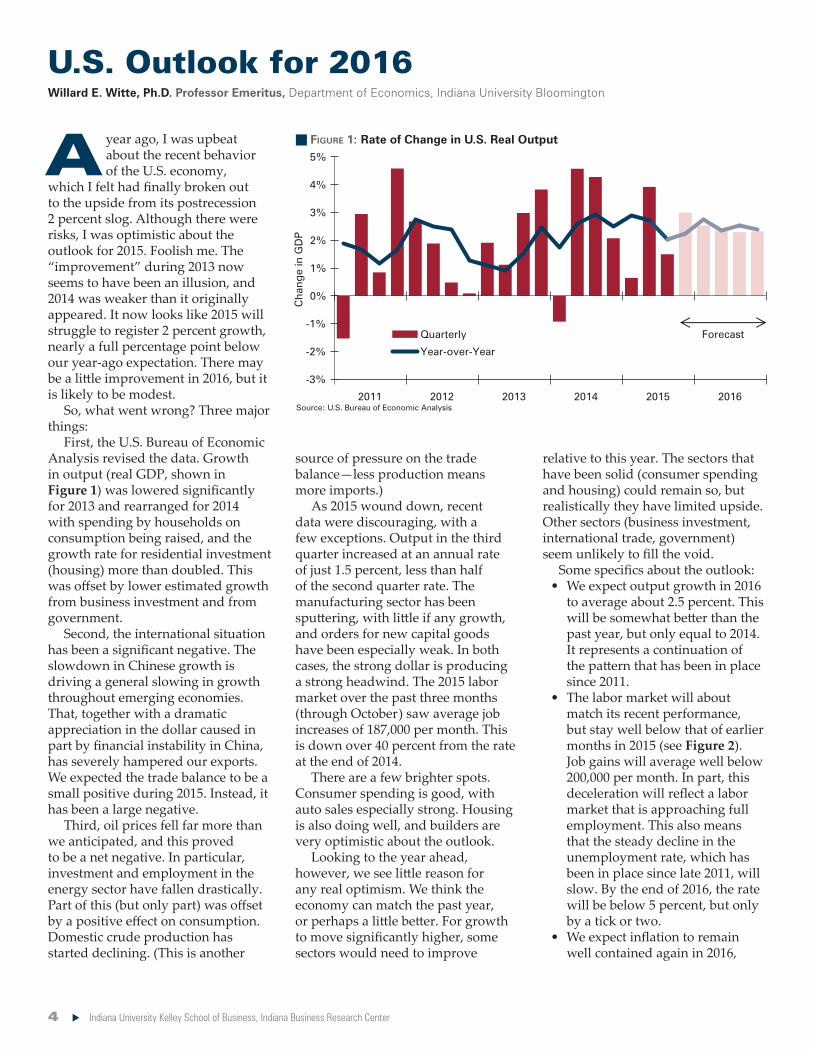
which I felt had finally broken out to the upside from its postrecession 2 percent slog. Although there were risks, I was optimistic about the outlook for 2015. Foolish me. The “improvement” during 2013 now seems to have been an illusion, and 2014 was weaker than it originally appeared. It now looks like 2015 will struggle to register 2 percent growth, nearly a full percentage point below our year-ago expectation. There may be a little improvement in 2016, but it is likely to be modest.
So, what went wrong? Three major things:
First, the U.S. Bureau of Economic Analysis revised the data. Growth in output (real GDP, shown in Figure 1) was lowered significantly for 2013 and rearranged for 2014 with spending by households on consumption being raised, and the growth rate for residential investment (housing) more than doubled. This was offset by lower estimated growth from business investment and from government.
Second, the international situation has been a significant negative. The slowdown in Chinese growth is driving a general slowing in growth throughout emerging economies. That, together with a dramatic appreciation in the dollar caused in part by financial instability in China, has severely hampered our exports. We expected the trade balance to be a small positive during 2015. Instead, it has been a large negative.
Third, oil prices fell far more than we anticipated, and this proved to be a net negative. In particular, investment and employment in the energy sector have fallen drastically. Part of this (but only part) was offset by a positive effect on consumption. Domestic crude production has started declining. (This is another
source of pressure on the trade balance—less production means more imports.)
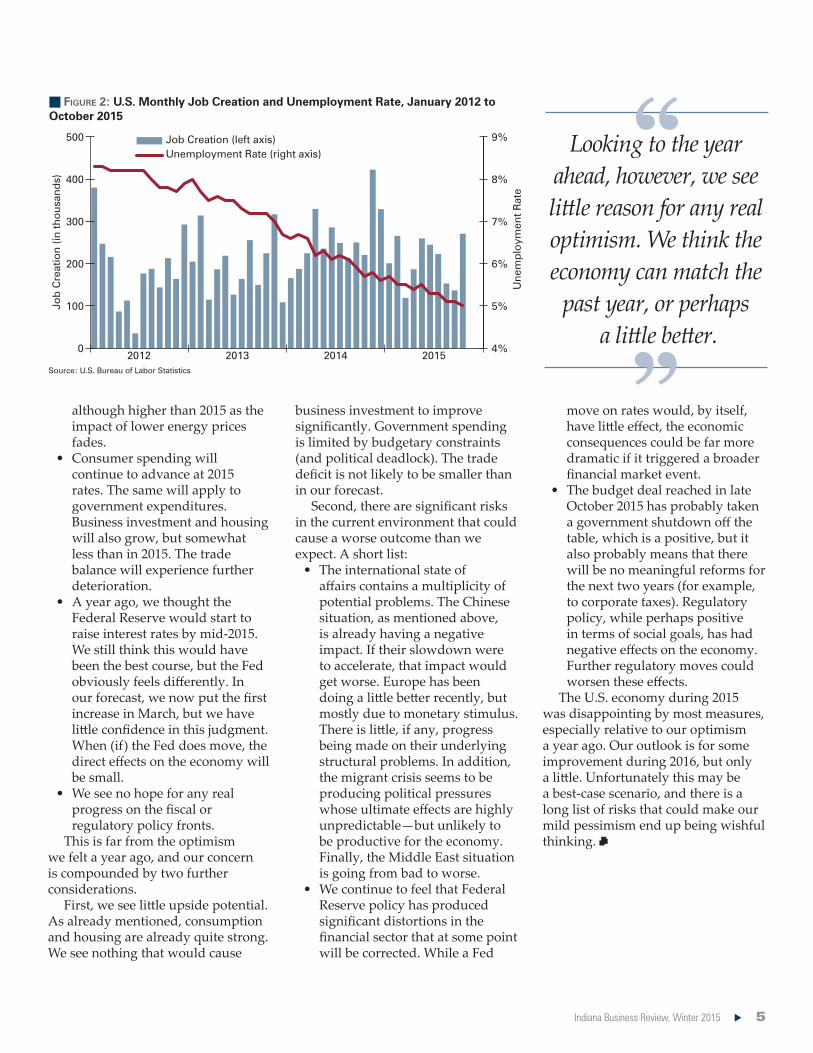
As 2015 wound down, recent data were discouraging, with a few exceptions. Output in the third quarter increased at an annual rate of just 1.5 percent, less than half of the second quarter rate. The manufacturing sector has been sputtering, with little if any growth, and orders for new capital goods have been especially weak. In both cases, the strong dollar is producing a strong headwind. The 2015 labor market over the past three months (through October) saw average job increases of 187,000 per month. This is down over 40 percent from the rate at the end of 2014.
There are a few brighter spots. Consumer spending is good, with auto sales especially strong. Housing is also doing well, and builders are very optimistic about the outlook.
Looking to the year ahead, however, we see little reason for any real optimism. We think the economy can match the past year, or perhaps a little better. For growth to move significantly higher, some sectors would need to improve
relative to this year. The sectors that have been solid (consumer spending and housing) could remain so, but realistically they have limited upside. Other sectors (business investment, international trade, government) seem unlikely to fill the void.
Some specifics about the outlook:• We expect output growth in 2016
to average about 2.5 percent. This will be somewhat better than the past year, but only equal to 2014. It represents a continuation of the pattern that has been in place since 2011.
• The labor market will about match its recent performance, but stay well below that of earlier months in 2015 (see Figure 2). Job gains will average well below 200,000 per month. In part, this deceleration will reflect a labor market that is approaching full employment. This also means that the steady decline in the unemployment rate, which has been in place since late 2011, will slow. By the end of 2016, the rate will be below 5 percent, but only by a tick or two.
• We expect inflation to remain well contained again in 2016,
Source: U.S. Bureau of Economic Analysis
-3%
-2%
-1%
0%
1%
2%
3%
4%
5%
2011 2012 2013 2014 2015 2016
Cha
nge
in G
DP
Quarterly
Year-over-Year
Forecast
n Figure 1: Rate of Change in U.S. Real Output
U.S. Outlook for 2016Willard E. Witte, Ph.D. Professor Emeritus, Department of Economics, Indiana University Bloomington
Indiana Business Review, Winter 2015 5
although higher than 2015 as the impact of lower energy prices fades.
• Consumer spending will continue to advance at 2015 rates. The same will apply to government expenditures. Business investment and housing will also grow, but somewhat less than in 2015. The trade balance will experience further deterioration.
• A year ago, we thought the Federal Reserve would start to raise interest rates by mid-2015. We still think this would have been the best course, but the Fed obviously feels differently. In our forecast, we now put the first increase in March, but we have little confidence in this judgment. When (if) the Fed does move, the direct effects on the economy will be small.
• We see no hope for any real progress on the fiscal or regulatory policy fronts.
This is far from the optimism we felt a year ago, and our concern is compounded by two further considerations.
First, we see little upside potential. As already mentioned, consumption and housing are already quite strong. We see nothing that would cause
business investment to improve significantly. Government spending is limited by budgetary constraints (and political deadlock). The trade deficit is not likely to be smaller than in our forecast.
Second, there are significant risks in the current environment that could cause a worse outcome than we expect. A short list:
• The international state of affairs contains a multiplicity of potential problems. The Chinese situation, as mentioned above, is already having a negative impact. If their slowdown were to accelerate, that impact would get worse. Europe has been doing a little better recently, but mostly due to monetary stimulus. There is little, if any, progress being made on their underlying structural problems. In addition, the migrant crisis seems to be producing political pressures whose ultimate effects are highly unpredictable—but unlikely to be productive for the economy. Finally, the Middle East situation is going from bad to worse.
• We continue to feel that Federal Reserve policy has produced significant distortions in the financial sector that at some point will be corrected. While a Fed
move on rates would, by itself, have little effect, the economic consequences could be far more dramatic if it triggered a broader financial market event.
• The budget deal reached in late October 2015 has probably taken a government shutdown off the table, which is a positive, but it also probably means that there will be no meaningful reforms for the next two years (for example, to corporate taxes). Regulatory policy, while perhaps positive in terms of social goals, has had negative effects on the economy. Further regulatory moves could worsen these effects.
The U.S. economy during 2015 was disappointing by most measures, especially relative to our optimism a year ago. Our outlook is for some improvement during 2016, but only a little. Unfortunately this may be a best-case scenario, and there is a long list of risks that could make our mild pessimism end up being wishful thinking.
n Figure 2: U.S. Monthly Job Creation and Unemployment Rate, January 2012 to October 2015
Source: U.S. Bureau of Labor Statistics
Looking to the year ahead, however, we see little reason for any real optimism. We think the economy can match the
past year, or perhaps a little better.
4%
5%
6%
7%
8%
9%
0
100
200
300
400
500
2012 2013 2014 2015
Une
mp
loym
ent R
ate
Job Creation (left axis)Unemployment Rate (right axis)
Job
Cre
atio
n (in
tho
usan
ds)
6 Indiana University Kelley School of Business, Indiana Business Research Center
Retro movies have been in the news recently. The Star Wars film has generated a lot of
publicity. Considerable attention has been given to the 30th anniversary of Back to the Future. From an economic perspective, our touchstone is the Bill Murray classic, Groundhog Day. In the movie, Murray’s character (Phil Connors) is forced to relive the same day—over and over and over. He tries to break the spell, but he’s always stuck.
This is an apt description of our economic situation. Every six weeks, the Federal Reserve has their own Groundhog Day. Like Bill Murray, they’ve been stuck in the same situation—a low growth economy—over and over. Like Murray, their efforts to break the spell have been unsuccessful and elicited increasingly aggressive monetary policy.
While we were supportive of the Fed’s liquidity policies during the financial crisis, we are concerned that the aggressive monetary policies in the following years have become counterproductive and pose a material risk to our investment portfolios.
When the Fed started quantitative easing (QE), it was argued that the lower interest rates would jump-start business investment, encourage economic growth, and the wealth effect from higher asset prices would increase household consumption. What we have seen is the weakest postrecession recovery of the modern era. From the perspective of finance, this outcome isn’t surprising. When stock and bond prices get bid up higher than they would without QE, their expected returns will be lower. With lower expected returns, businesses conserve cash and scale back investments; consumers save
more and reduce spending. The net result is lower growth.
The risk to our portfolios rises in this environment because of a growing disconnect between investment returns and the real economy. For example, it is common for companies to borrow at these low rates, use the funds to buy back their own stock, and thereby increase their stock prices. The cash dividend rate on stocks is 3 percent but the cash plus buyback rate is 6 percent. In addition, a number of countries now have negative interest rates on their sovereign bonds. This is an unambiguous market distortion. In a world of integrated capital markets, QE from Europe, Japan and China will impact U.S. asset prices, even as the Fed scales back its own QE.
As investors, we face a serious challenge: How do we manage our portfolios in a QE world? One thing we have learned is that buy and hold is actually a pretty good QE strategy. Over the past five years of QE, the average return to the S&P 500 is about 14 percent per year. This is well above the historical average of about 10 percent. Our guess is that global QE will be a force at least through 2016. However, we need to be diligent in looking for signals suggesting the phase-out of QE strategies. Robust earnings and a rise in global bond rates are indicators that QE will be phased out.
In many respects, our forecast for 2016 is similar to our forecast from last year. Following our opening theme, we call it the “Groundhog Forecast.” Last year, we predicted that the 2015 financial markets would be driven more by earnings than by concerns about whether politicians can agree with each other. We forecast that the stock market would have a below-average but still
positive return. We were right, but just barely. The S&P 500 rose about 3 percent since last November. It hit this level by late spring, and over the summer looked like we might get an average year. August was a bad month, however, and we have been recovering slowly. The economic forecast, international problems in China and the ever-present Washington dysfunction gave us a bumpy ride. We can certainly expect more of the same.
What are the factors that are likely to drive the stock market over the next 12 months? We think it will be a combination of earnings and government. With valuation ratios near historic highs, the market appears to have little potential for increasing the valuation of companies other than what they produce by earnings. If anything, interest rates may drive valuations lower, but we forecast interest rates to be flat or slightly increasing over 2016. As usual, government is likely to either hurt the market or be neutral.
With the Republicans controlling the House and Senate, it is unlikely that there will be an increase in taxes or much of an increase in spending. With the economy slowly growing,
Financial Markets 2016: The Groundhog ForecastRobert S. Neal, Ph.D. Associate Professor of Finance, Kelley School of Business, Indiana University Indianapolis
Charles Trzcinka, Ph.D. James and Virginia Cozad Professor of Finance, Kelley School of Business, Indiana University Bloomington
Aggressive monetary policies have become
counterproductive and pose a material risk to our
investment portfolios.
Indiana Business Review, Winter 2015 7
federal revenue is projected to be $3.51 trillion in 2016, which is about 19 percent of GDP. Federal expenditures are projected to be $3.93 trillion, giving us a deficit of $420 billion or 2.2 percent of GDP. The deficit is down from 2015 ($426 billion) and 2014 ($485 billion). If we combine this fiscal policy with our forecasted 3 percent real GDP growth and 1-2 percent inflation, this is a relatively favorable environment for investors.
While the Obama administration is taking actions that undermine investor confidence, such as tougher climate change-motivated regulations (including the recent cancelling of the Keystone pipeline) and the problems with “Obamacare,” its attention appears to be focused on foreign policy (e.g., ISIS). It is unlikely that it will undertake major economic initiatives over the next year.
The Federal Reserve will back off of QE, but the policy is likely to be “dovish” in targeting interest rates rather than inflation in the near term. We expect an increase in the Federal Funds rate sometime in 2016 (a “hawkish” policy). Bond buying is now an established part of the Fed’s toolkit, especially with inflation forecasts being in the 1-2 percent range.
It appears that the eurozone will be one of the major risks to U.S. stock market performance. With this area accounting for 17 percent of world GDP, it may be a source of negative earnings surprises for U.S. companies during the year.
With this as a background, we turn to fundamentals.
Economic FundamentalsStock prices are a very good indicator of future economic activity: Investors buy stocks anticipating the real economy will pick up in the near future. There are many positive reasons to believe this story now:
• Earnings: More companies beat earnings per share (EPS)
estimates, but fewer are beating sales estimates. Of the 444 companies in the S&P 500 that have reported earnings for third quarter 2015, 74 percent have reported earnings above the mean estimate and 46 percent have reported revenues above the mean estimate.
• Earnings Growth: Analysts are forecasting earnings will increase about 8.3 percent in 2016 for the S&P 500. Consumer discretionary has the highest earnings growth at 15.3 percent, while energy has the lowest at 1.7 percent.
• Revenue Growth: Among S&P 500 firms, revenues are expected to rise 4.6 percent in 2016.
• Valuation: Price-earnings (PE) ratios are above their long-run averages, but only by modest amounts. The S&P 500 PE ratio is 17, which is higher than its long-term average of 16. The “forward” PE (price today divided by expected earnings) is 16.5, above its long-term average of 14.0. All of this suggests that valuation ratios are not about to fall off a cliff.
• The market is rewarding beating estimates more and punishing misses less. The average price increase for those beating estimates is 2 percent (vs. a five-year average of 1.1 percent). Meanwhile the average price decrease for those missing is -1.6 percent (vs. a five-year average of -2.2 percent).
• IPOs are mixed. As of November 10, there were 156 IPOs raising $28 billion. Both numbers are down from last year (356 and $85 billion, respectively). The average first-day return was 14 percent, which is also down. The top IPOs were Spark Therapeutics (premium 160 percent), Shake Shack (123 percent), Global Blood Therapeutics (119 percent), Inotek (102 percent) and Fitbit (79 percent).
• The Federal Reserve is continuing to phase out its bond purchasing program, but we believe that even if the Fed refocuses their attention on tying the rate outlook more closely to inflation (rather than employment), the pace and timing of interest rate hikes should be pushed further into 2016 as inflation remains very low.
• We think inflation will remain subdued. Our forecast of 1.1 percent is in-line with most forecasts (the Fed’s forecast is 1.5 percent, the Office of Management and Budget’s is 2.2 percent, and the Organization for Economic Cooperation and Development’s is 1.9 percent).
ThreatsHowever, there are negative factors that could make the market recovery short-lived:
• The cyclically adjusted PE ratio for U.S. stocks is at 25.7, which is the highest since January 2008 (but lower than May 2007, which was 27.5). This suggests that stocks have more room to fall than rise from factors driving basic valuation but not earnings.
• The eurozone is more a source of risk than return. Supply side barriers, such as labor market constraints, may have created a “secular stagnation” that will impede an economic recovery.
• China’s growth is clearly slowing, and analysts are increasingly skeptical about official numbers.
The eurozone will be one of the major risks to U.S. stock market
performance.
8 Indiana University Kelley School of Business, Indiana Business Research Center
• Profit margins are unlikely to expand: Firms must increase earnings by revenue growth, which is problematic given the weakness in Europe and China.
• The strong U.S. dollar is a headwind: The dollar has appreciated about 8 percent against the euro and 10 percent against the yen over the past year, despite continuing QE. This will make U.S. exports more expensive in global markets, while imports into the U.S. will become cheaper.
• U.S. Debt: The expansion of the national debt since the end of 2008 is unprecedented since World War II. The total debt (held by the public) to GDP ratio has increased from 64 percent to 102 percent in 2015. The massive government deficits may lead to fears of higher interest rates, accelerating inflation and slower growth. This may have an adverse effect on business investment even though we forecast business investment to increase.
• Budget Deficits: The projected budget deficit for 2016 is about 2.2 percent of GDP, and this is not expected to change in the next five years. If interest rates return to their historical average levels, the budgetary impact will be dramatic. The average interest rate on debt held by the public is 2.43 percent and interest payments are forecast to be $261 billion for 2016. Increasing the average rate by 1 percent will trigger an additional $140 billion in federal spending. This will require reduced spending, increased taxes or both.
• In spite of the recent upturn, industrial output is still only at 77.5 percent of capacity, which is below the long-run average (including previous recessions) of 80.5 percent.
• The U.S. still faces a huge funding deficit in Social Security and Medicare payments. The present value shortfall is about $62 trillion. This is equivalent to $206,000 per person or $825,000 per U.S. household. These problems are not insurmountable, but they do require common sense and bipartisan leadership—something that appears to be in short supply in Washington, D.C.
ForecastLooking forward to 2016, the positives outweigh the negatives for the economy—but just barely. We expect the recovery to continue, GDP growth in the 2-3 percent range, and inflation in the 1-2 percent range. The combination of low inflation, a Fed that is on hold and good prospects for earnings growth suggest a favorable year for stocks. The primary risks are growth reductions in the eurozone and China.
In this environment, we expect that the return to equities will be positive, but below the long-run average return of 9 percent—perhaps at the half century rate of 7.5 percent. With Treasury bonds already at extremely low yields, there is little potential for gains with these investments. In addition, we think there are material long-term inflation risks that could make long-term bonds unattractive. In contrast, the low Treasury rates make mortgage rates still attractive, with 30-year fixed rates about 3.9 percent and 15-year rates at 3.0 percent.
We expect that the return to equities will be positive, but below the
long-run average return of 9 percent.
Indiana Business Review, Winter 2015 9
Housing: Positive Growth Expected for 2016Douglas M. McCoy: Director of the Benecki Center for Real Estate Studies, Kelley School of Business, Indiana University
The single-family housing sector found its way back to stable growth in 2015,
while the multi-family housing sector continued its strong run. Consumer confidence, job growth and low interest rates are the primary drivers that bring potential homebuyers to the housing market. Considering these factors, along with an important projected increase in new single-family inventory, the single-family housing market is forecasted to continue on a positive path in 2016.
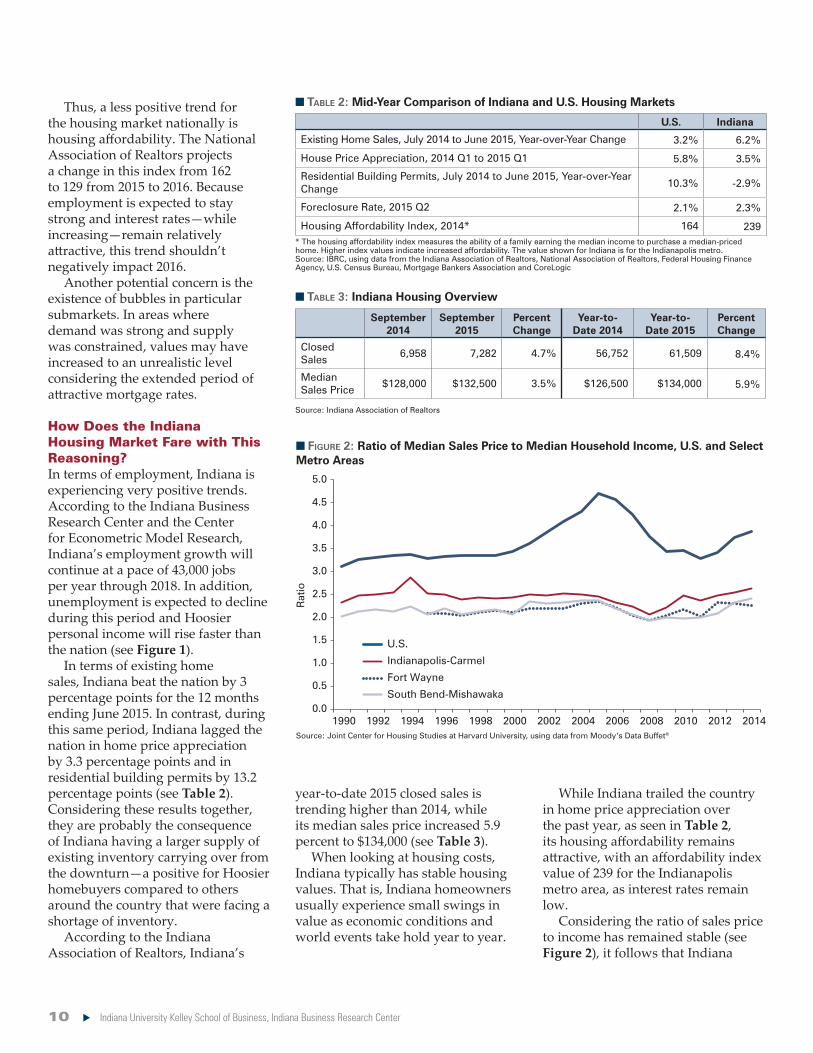
For example, the National Association of Realtors forecasts that existing home sales will increase 3.5 percent from 2015 levels, and new single-family home sales will increase 29.3 percent nationally (see Table 1). Housing starts are projected to increase 17.2 percent, with single-family units increasing 23.2 percent and multi-family units up 6.5 percent. Median home prices for both existing and new homes are expected to increase 4.1 percent.
Looking closely at these numbers one sees the importance of new home sales in 2016 and the critical need for new housing starts. The excess of existing home inventory at favorable pricing, resulting from the recent economic downturn, is mostly gone. To achieve strong numbers in 2016, new inventory must be added. The U.S. is currently experiencing a housing shortage, but home builders have been cautious in bringing new homes to market even while low interest rates have persisted. The good news is that builder confidence has been “steady or increasing,” according to a monthly survey conducted by the National Association of Home Builders.
The likelihood of continuing improvement in the single-family housing market in our nation’s cities and towns largely depends on job growth and how wages compare
to that locale’s housing prices. When differentiating single-family markets across the country, it is important to remember that a key factor of mortgage qualification is a household’s monthly gross take-home pay relative to its payment for housing costs (the total of the mortgage payment, real estate taxes
and home insurance). Holding all other things equal, communities with positive job growth and a favorable margin between wages and housing costs are more likely to experience a more stable single-family housing market than communities with narrower house affordability margins.
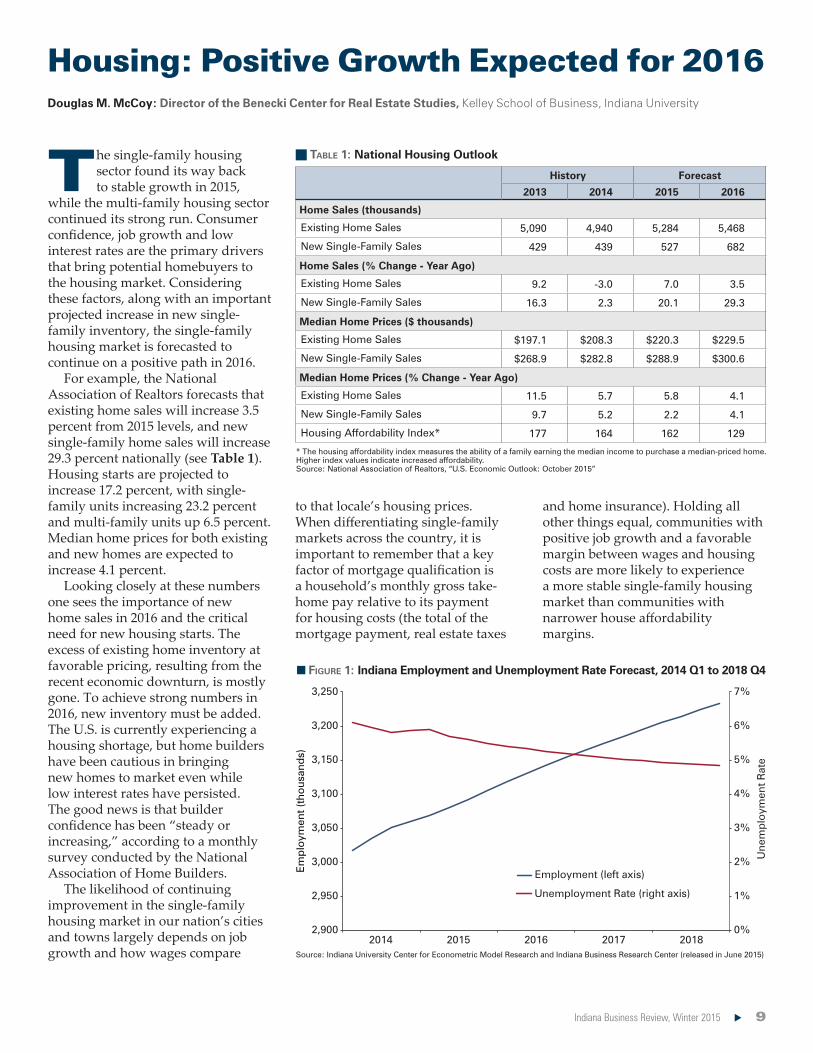
n Figure 1: Indiana Employment and Unemployment Rate Forecast, 2014 Q1 to 2018 Q4
n Table 1: National Housing Outlook
* The housing affordability index measures the ability of a family earning the median income to purchase a median-priced home. Higher index values indicate increased affordability.Source: National Association of Realtors, “U.S. Economic Outlook: October 2015”
Source: Indiana University Center for Econometric Model Research and Indiana Business Research Center (released in June 2015)
History Forecast
2013 2014 2015 2016
Home Sales (thousands)
Existing Home Sales 5,090 4,940 5,284 5,468
New Single-Family Sales 429 439 527 682
Home Sales (% Change - Year Ago)
Existing Home Sales 9.2 -3.0 7.0 3.5
New Single-Family Sales 16.3 2.3 20.1 29.3
Median Home Prices ($ thousands)
Existing Home Sales $197.1 $208.3 $220.3 $229.5
New Single-Family Sales $268.9 $282.8 $288.9 $300.6
Median Home Prices (% Change - Year Ago)
Existing Home Sales 11.5 5.7 5.8 4.1
New Single-Family Sales 9.7 5.2 2.2 4.1
Housing Affordability Index* 177 164 162 129
0%
1%
2%
3%
4%
5%
6%
7%
2,900
2,950
3,000
3,050
3,100
3,150
3,200
3,250
2014 2015 2016 2017 2018
Une
mp
loym
ent R
ate
Employment (left axis)
Unemployment Rate (right axis)
Em
plo
ymen
t (th
ous
and
s)
10 Indiana University Kelley School of Business, Indiana Business Research Center
Thus, a less positive trend for the housing market nationally is housing affordability. The National Association of Realtors projects a change in this index from 162 to 129 from 2015 to 2016. Because employment is expected to stay strong and interest rates—while increasing—remain relatively attractive, this trend shouldn’t negatively impact 2016.
Another potential concern is the existence of bubbles in particular submarkets. In areas where demand was strong and supply was constrained, values may have increased to an unrealistic level considering the extended period of attractive mortgage rates.
How Does the Indiana Housing Market Fare with This Reasoning?In terms of employment, Indiana is experiencing very positive trends. According to the Indiana Business Research Center and the Center for Econometric Model Research, Indiana’s employment growth will continue at a pace of 43,000 jobs per year through 2018. In addition, unemployment is expected to decline during this period and Hoosier personal income will rise faster than the nation (see Figure 1).
In terms of existing home sales, Indiana beat the nation by 3 percentage points for the 12 months ending June 2015. In contrast, during this same period, Indiana lagged the nation in home price appreciation by 3.3 percentage points and in residential building permits by 13.2 percentage points (see Table 2). Considering these results together, they are probably the consequence of Indiana having a larger supply of existing inventory carrying over from the downturn—a positive for Hoosier homebuyers compared to others around the country that were facing a shortage of inventory.
According to the Indiana Association of Realtors, Indiana’s
year-to-date 2015 closed sales is trending higher than 2014, while its median sales price increased 5.9 percent to $134,000 (see Table 3).
When looking at housing costs, Indiana typically has stable housing values. That is, Indiana homeowners usually experience small swings in value as economic conditions and world events take hold year to year.
While Indiana trailed the country in home price appreciation over the past year, as seen in Table 2, its housing affordability remains attractive, with an affordability index value of 239 for the Indianapolis metro area, as interest rates remain low.
Considering the ratio of sales price to income has remained stable (see Figure 2), it follows that Indiana
n Table 2: Mid-Year Comparison of Indiana and U.S. Housing Markets
n Figure 2: Ratio of Median Sales Price to Median Household Income, U.S. and Select Metro Areas
n Table 3: Indiana Housing Overview
Source: Joint Center for Housing Studies at Harvard University, using data from Moody’s Data Buffet®
* The housing affordability index measures the ability of a family earning the median income to purchase a median-priced home. Higher index values indicate increased affordability. The value shown for Indiana is for the Indianapolis metro.Source: IBRC, using data from the Indiana Association of Realtors, National Association of Realtors, Federal Housing Finance Agency, U.S. Census Bureau, Mortgage Bankers Association and CoreLogic
Source: Indiana Association of Realtors
U.S. Indiana
Existing Home Sales, July 2014 to June 2015, Year-over-Year Change 3.2% 6.2%
House Price Appreciation, 2014 Q1 to 2015 Q1 5.8% 3.5%
Residential Building Permits, July 2014 to June 2015, Year-over-Year Change 10.3% -2.9%
Foreclosure Rate, 2015 Q2 2.1% 2.3%
Housing Affordability Index, 2014* 164 239
September 2014
September 2015
Percent Change
Year-to-Date 2014
Year-to-Date 2015
Percent Change
Closed Sales
6,958 7,282 4.7% 56,752 61,509 8.4%
Median Sales Price
$128,000 $132,500 3.5% $126,500 $134,000 5.9%
0.0
0.5
1.0
1.5
2.0
2.5
3.0
3.5
4.0
4.5
5.0
1990 1992 1994 1996 1998 2000 2002 2004 2006 2008 2010 2012 2014
U.S.
Indianapolis-Carmel
Fort Wayne
South Bend-Mishawaka
Rat
io
Indiana Business Review, Winter 2015 11
L ast year, in the fall of 2014, when we were forecasting the year ahead, the world
and nation were being contorted by several forces. The Ebola outbreak in West Africa caused panic and galvanized a global response. There were border confrontations between Ukraine and Russia reminiscent of the worse Cold War tensions. And the wars in Afghanistan, Iraq and Syria provided a constant dental-drill drone. The engines of global economic growth—the BRICS (Brazil, Russia, India, China and South Africa)—were slowing, and no one was looking to Europe to provide any buoyancy to the global economy.
Domestically, the politics of race once again became part of the country’s consciousness, daily conversation and recriminations. The Republicans took control of the Senate in midterm elections. Closer to home and just a few months later, Indiana gained unwanted attention with the passage of the Religious Freedom Restoration Act, which many believed would place the state at an economic disadvantage.
Last fall, we expected economic growth (measured in current dollars) to be close to 4 percent in Indiana for 2015, slightly higher than the (then) expectations for 2014. Expectations can disappoint. Turns out that 2014 did not end as well as anticipated, with Indiana’s economic growth at 2.1 percent, nearly half of the national number of 4.0 percent. Indiana is likely to reverse that trend in 2015. At the time of this writing, we forecast current-dollar economic growth to be 3.7 percent in Indiana compared to 3.4 percent nationwide.
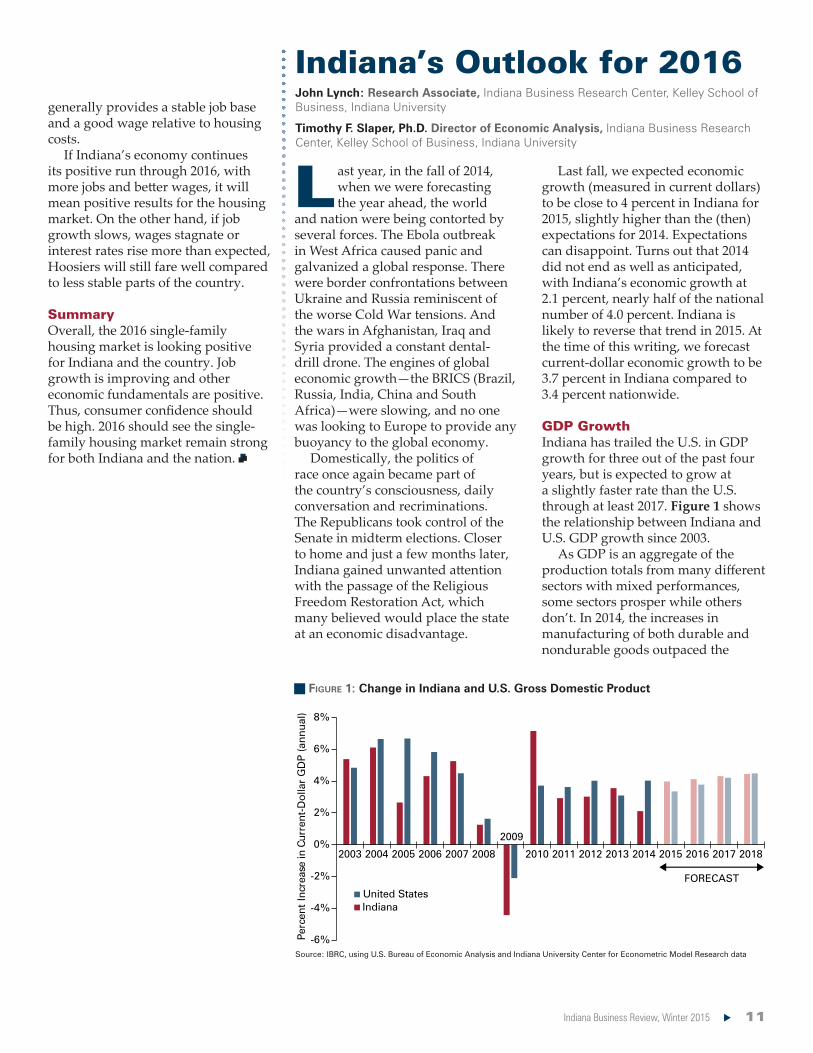
GDP Growth Indiana has trailed the U.S. in GDP growth for three out of the past four years, but is expected to grow at a slightly faster rate than the U.S. through at least 2017. Figure 1 shows the relationship between Indiana and U.S. GDP growth since 2003.
As GDP is an aggregate of the production totals from many different sectors with mixed performances, some sectors prosper while others don’t. In 2014, the increases in manufacturing of both durable and nondurable goods outpaced the
n Figure 1: Change in Indiana and U.S. Gross Domestic Product
Source: IBRC, using U.S. Bureau of Economic Analysis and Indiana University Center for Econometric Model Research data
Indiana’s Outlook for 2016John Lynch: Research Associate, Indiana Business Research Center, Kelley School of Business, Indiana University Timothy F. Slaper, Ph.D. Director of Economic Analysis, Indiana Business Research Center, Kelley School of Business, Indiana University
generally provides a stable job base and a good wage relative to housing costs.
If Indiana’s economy continues its positive run through 2016, with more jobs and better wages, it will mean positive results for the housing market. On the other hand, if job growth slows, wages stagnate or interest rates rise more than expected, Hoosiers will still fare well compared to less stable parts of the country.
SummaryOverall, the 2016 single-family housing market is looking positive for Indiana and the country. Job growth is improving and other economic fundamentals are positive. Thus, consumer confidence should be high. 2016 should see the single-family housing market remain strong for both Indiana and the nation.
-6%
-4%
-2%
0%
2%
4%
6%
8%
2003 2004 2005 2006 2007 2008
2009
2010 2011 2012 2013 2014 2015 2016 2017 2018
t-D
olla
r G
DP
(ann
ual)
nerruC ni esaercnI tnecreP
IndianaUnited States
FORECAST
12 Indiana University Kelley School of Business, Indiana Business Research Center
overall growth rate. These increases, however, were offset by double-digit percent decreases in mining and agriculture.
While Indiana-specific conditions can affect economic performance, Indiana’s economic growth can also be affected by the outside domestic and international demand for Indiana’s goods and services. To that end, the assumptions of lower or higher exports can have a big influence on the forecast. Given Indiana’s status as a manufacturing powerhouse, its GDP could be boosted by strong demand for industrial machinery and automobiles.
As it happens, 2015 was a great year for auto sales. After a strong 2014 that saw auto sales hit over 16 million units, and a monthly sales rate in August 2014 that was the highest since the middle of 2006, year-to-date 2015 has seen sales of 13.1 million, 5.0 percent higher than the same time period in 2014, according to Motor Intelligence. This increase is expected to continue through the end of 2015 and onwards.
The great news on the auto manufacturing front having been noted, one should be mindful that the state’s fortunes don’t rise and fall with the auto sector. Thanks in part to pharmaceuticals and medical device sales, the state bounced back from the Great Recession relatively strongly in 2010—twice the national rebound—even as auto sales hovered around a mere 11.5 million units.
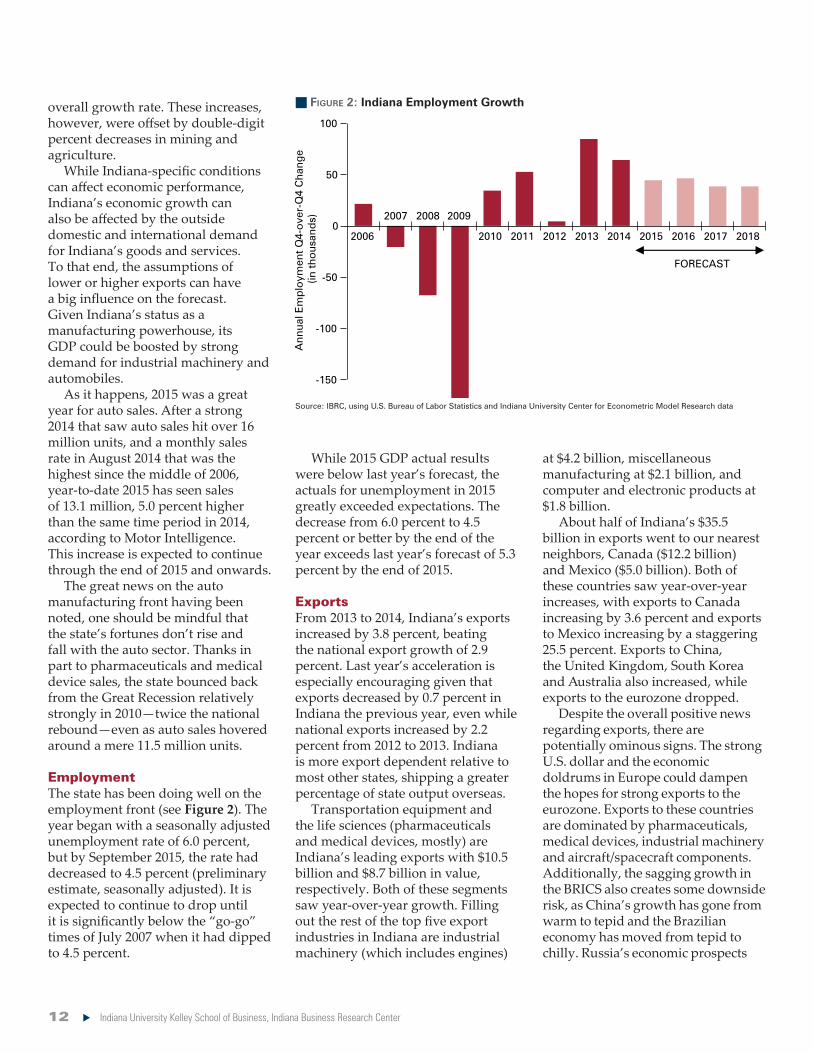
EmploymentThe state has been doing well on the employment front (see Figure 2). The year began with a seasonally adjusted unemployment rate of 6.0 percent, but by September 2015, the rate had decreased to 4.5 percent (preliminary estimate, seasonally adjusted). It is expected to continue to drop until it is significantly below the “go-go” times of July 2007 when it had dipped to 4.5 percent.
While 2015 GDP actual results were below last year’s forecast, the actuals for unemployment in 2015 greatly exceeded expectations. The decrease from 6.0 percent to 4.5 percent or better by the end of the year exceeds last year’s forecast of 5.3 percent by the end of 2015.
ExportsFrom 2013 to 2014, Indiana’s exports increased by 3.8 percent, beating the national export growth of 2.9 percent. Last year’s acceleration is especially encouraging given that exports decreased by 0.7 percent in Indiana the previous year, even while national exports increased by 2.2 percent from 2012 to 2013. Indiana is more export dependent relative to most other states, shipping a greater percentage of state output overseas.
Transportation equipment and the life sciences (pharmaceuticals and medical devices, mostly) are Indiana’s leading exports with $10.5 billion and $8.7 billion in value, respectively. Both of these segments saw year-over-year growth. Filling out the rest of the top five export industries in Indiana are industrial machinery (which includes engines)
at $4.2 billion, miscellaneous manufacturing at $2.1 billion, and computer and electronic products at $1.8 billion.
About half of Indiana’s $35.5 billion in exports went to our nearest neighbors, Canada ($12.2 billion) and Mexico ($5.0 billion). Both of these countries saw year-over-year increases, with exports to Canada increasing by 3.6 percent and exports to Mexico increasing by a staggering 25.5 percent. Exports to China, the United Kingdom, South Korea and Australia also increased, while exports to the eurozone dropped.
Despite the overall positive news regarding exports, there are potentially ominous signs. The strong U.S. dollar and the economic doldrums in Europe could dampen the hopes for strong exports to the eurozone. Exports to these countries are dominated by pharmaceuticals, medical devices, industrial machinery and aircraft/spacecraft components. Additionally, the sagging growth in the BRICS also creates some downside risk, as China’s growth has gone from warm to tepid and the Brazilian economy has moved from tepid to chilly. Russia’s economic prospects
n Figure 2: Indiana Employment Growth
Source: IBRC, using U.S. Bureau of Labor Statistics and Indiana University Center for Econometric Model Research data
-150
-100
-50
0
50
100
2006
2007 2008 2009
2010 2011 2012 2013 2014 2015 2016 2017 2018
FORECAST
Ann
ual E
mp
loym
ent Q
4-o
ver-
Q4
Cha
nge
(in
tho
usan
ds)
Indiana Business Review, Winter 2015 13
are also chilly, but that is not expected to affect Indiana’s exports since it has not traditionally been a large market for Hoosier goods.
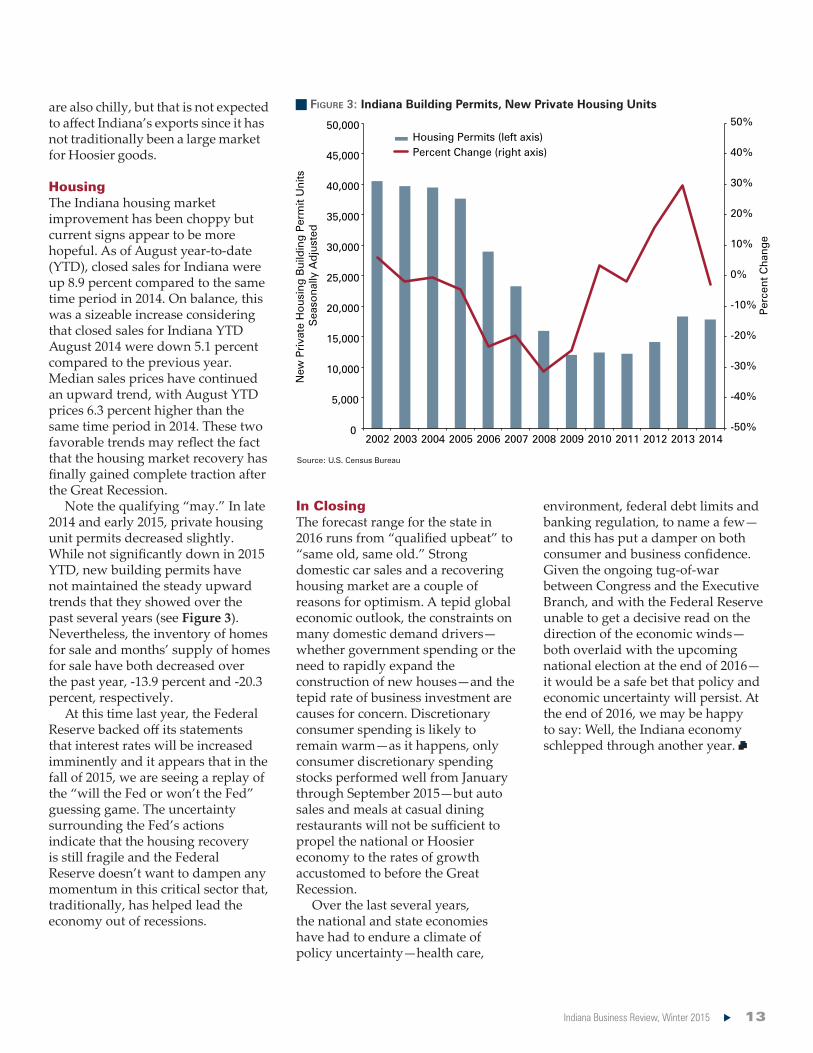
HousingThe Indiana housing market improvement has been choppy but current signs appear to be more hopeful. As of August year-to-date (YTD), closed sales for Indiana were up 8.9 percent compared to the same time period in 2014. On balance, this was a sizeable increase considering that closed sales for Indiana YTD August 2014 were down 5.1 percent compared to the previous year. Median sales prices have continued an upward trend, with August YTD prices 6.3 percent higher than the same time period in 2014. These two favorable trends may reflect the fact that the housing market recovery has finally gained complete traction after the Great Recession.
Note the qualifying “may.” In late 2014 and early 2015, private housing unit permits decreased slightly. While not significantly down in 2015 YTD, new building permits have not maintained the steady upward trends that they showed over the past several years (see Figure 3). Nevertheless, the inventory of homes for sale and months’ supply of homes for sale have both decreased over the past year, -13.9 percent and -20.3 percent, respectively.
At this time last year, the Federal Reserve backed off its statements that interest rates will be increased imminently and it appears that in the fall of 2015, we are seeing a replay of the “will the Fed or won’t the Fed” guessing game. The uncertainty surrounding the Fed’s actions indicate that the housing recovery is still fragile and the Federal Reserve doesn’t want to dampen any momentum in this critical sector that, traditionally, has helped lead the economy out of recessions.
In ClosingThe forecast range for the state in 2016 runs from “qualified upbeat” to “same old, same old.” Strong domestic car sales and a recovering housing market are a couple of reasons for optimism. A tepid global economic outlook, the constraints on many domestic demand drivers—whether government spending or the need to rapidly expand the construction of new houses—and the tepid rate of business investment are causes for concern. Discretionary consumer spending is likely to remain warm—as it happens, only consumer discretionary spending stocks performed well from January through September 2015—but auto sales and meals at casual dining restaurants will not be sufficient to propel the national or Hoosier economy to the rates of growth accustomed to before the Great Recession.
Over the last several years, the national and state economies have had to endure a climate of policy uncertainty—health care,
environment, federal debt limits and banking regulation, to name a few—and this has put a damper on both consumer and business confidence. Given the ongoing tug-of-war between Congress and the Executive Branch, and with the Federal Reserve unable to get a decisive read on the direction of the economic winds—both overlaid with the upcoming national election at the end of 2016—it would be a safe bet that policy and economic uncertainty will persist. At the end of 2016, we may be happy to say: Well, the Indiana economy schlepped through another year.
n Figure 3: Indiana Building Permits, New Private Housing Units
Source: U.S. Census Bureau
-50%
-40%
-30%
-20%
-10%
0%
10%
20%
30%
40%
50%
0
5,000
10,000
15,000
20,000
25,000
30,000
35,000
40,000
45,000
50,000
2002 2003 2004 2005 2006 2007 2008 2009 2010 2011 2012 2013 2014
Housing Permits (left axis)Percent Change (right axis)
New
Pri
vate
Ho
usin
g B
uild
ing
Per
mit
Uni
ts
Sea
sona
lly A
dju
sted
Per
cent
Cha
nge
14 Indiana University Kelley School of Business, Indiana Business Research Center
The Long View: Indiana’s Energy OutlookMatthew B. Dillon: Research Associate, Indiana Business Research Center, Kelley School of Business, Indiana University
Timothy F. Slaper, Ph.D. Director of Economic Analysis, Indiana Business Research Center, Kelley School of Business, Indiana University
Who knew that when the late Yogi Berra said, “The future ain’t what
it used to be,” he was talking about Indiana’s energy future?
Coal has been the linchpin of Indiana energy. On the production side, Indiana is ranked eighth in the country for coal production. In 2014, coal-fired power plants provided about 85 percent of Indiana’s electricity generation. Indiana’s industrial manufacturers of aluminum, chemicals, glass, metal casting and steel consume more energy than the residential and commercial sectors combined. Historically, this reliance on coal by Indiana has kept the price of energy relatively cheap and arguably has attracted industrial companies to locate in Indiana.
The state’s dominance in coal production and use has also led Indiana to have the eighth-highest energy-derived carbon emissions in the United States. Over the last few years, the state has diversified its energy portfolio by moving away from coal. This rebalancing of energy sources has been, and continues to be, motivated by environmental regulations on emissions and largely enabled by the steep drop in natural gas prices attributed to new extraction technologies (hydraulic fracking).
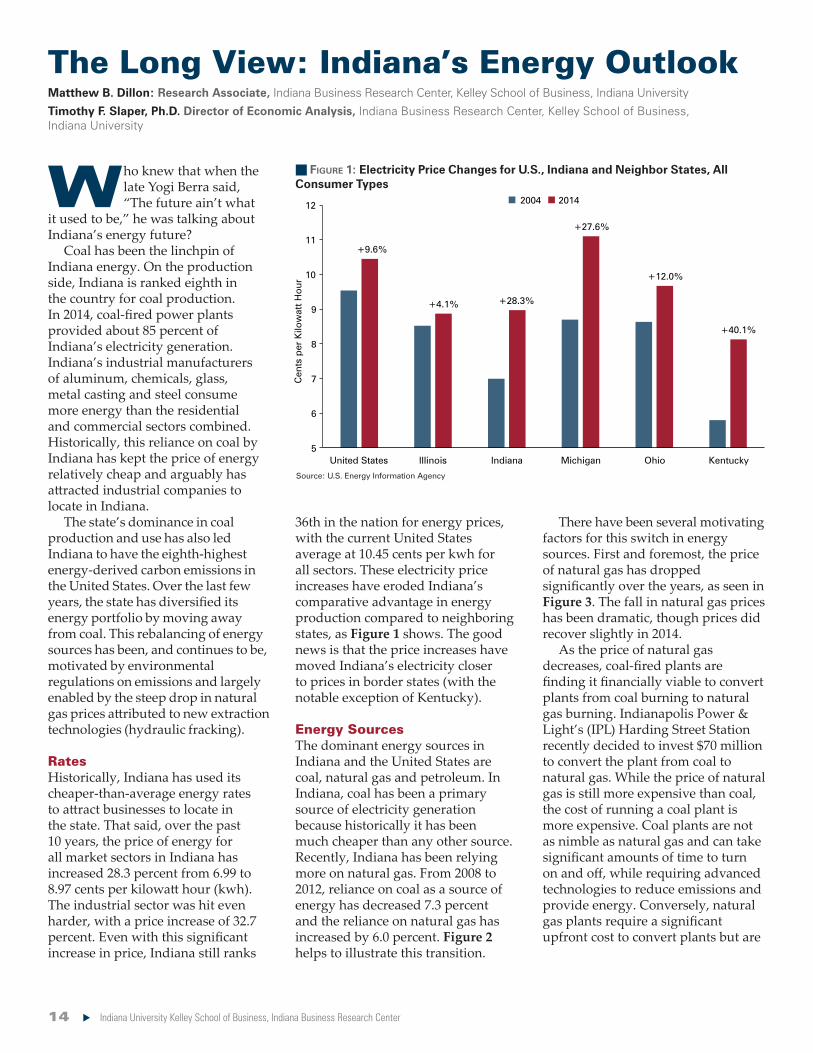
RatesHistorically, Indiana has used its cheaper-than-average energy rates to attract businesses to locate in the state. That said, over the past 10 years, the price of energy for all market sectors in Indiana has increased 28.3 percent from 6.99 to 8.97 cents per kilowatt hour (kwh). The industrial sector was hit even harder, with a price increase of 32.7 percent. Even with this significant increase in price, Indiana still ranks
36th in the nation for energy prices, with the current United States average at 10.45 cents per kwh for all sectors. These electricity price increases have eroded Indiana’s comparative advantage in energy production compared to neighboring states, as Figure 1 shows. The good news is that the price increases have moved Indiana’s electricity closer to prices in border states (with the notable exception of Kentucky).
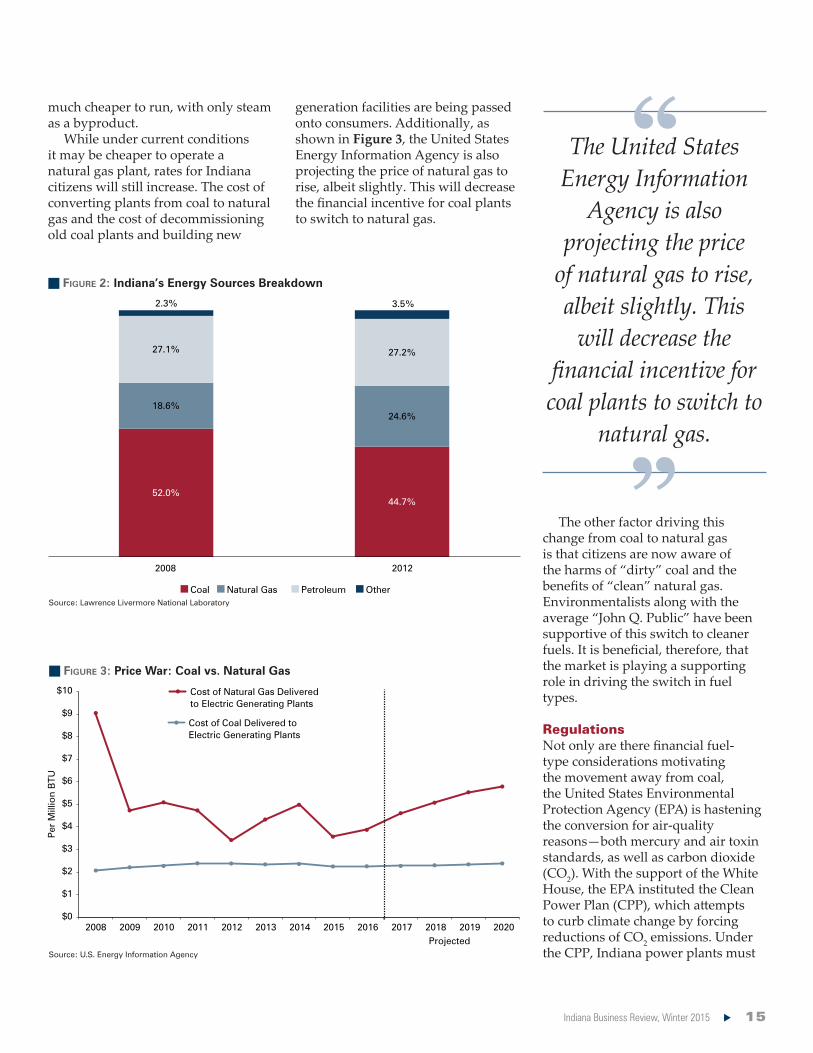
Energy SourcesThe dominant energy sources in Indiana and the United States are coal, natural gas and petroleum. In Indiana, coal has been a primary source of electricity generation because historically it has been much cheaper than any other source. Recently, Indiana has been relying more on natural gas. From 2008 to 2012, reliance on coal as a source of energy has decreased 7.3 percent and the reliance on natural gas has increased by 6.0 percent. Figure 2 helps to illustrate this transition.
There have been several motivating factors for this switch in energy sources. First and foremost, the price of natural gas has dropped significantly over the years, as seen in Figure 3. The fall in natural gas prices has been dramatic, though prices did recover slightly in 2014.
As the price of natural gas decreases, coal-fired plants are finding it financially viable to convert plants from coal burning to natural gas burning. Indianapolis Power & Light’s (IPL) Harding Street Station recently decided to invest $70 million to convert the plant from coal to natural gas. While the price of natural gas is still more expensive than coal, the cost of running a coal plant is more expensive. Coal plants are not as nimble as natural gas and can take significant amounts of time to turn on and off, while requiring advanced technologies to reduce emissions and provide energy. Conversely, natural gas plants require a significant upfront cost to convert plants but are
n Figure 1: Electricity Price Changes for U.S., Indiana and Neighbor States, All Consumer Types
Source: U.S. Energy Information Agency
+9.6%
+4.1% +28.3%
+27.6%
+12.0%
+40.1%
5
6
7
8
9
10
11
12
United States Illinois Indiana Michigan Ohio Kentucky
Cen
ts p
er K
ilow
att
Ho
ur
2004 2014
Indiana Business Review, Winter 2015 15
much cheaper to run, with only steam as a byproduct.
While under current conditions it may be cheaper to operate a natural gas plant, rates for Indiana citizens will still increase. The cost of converting plants from coal to natural gas and the cost of decommissioning old coal plants and building new
generation facilities are being passed onto consumers. Additionally, as shown in Figure 3, the United States Energy Information Agency is also projecting the price of natural gas to rise, albeit slightly. This will decrease the financial incentive for coal plants to switch to natural gas.
The other factor driving this change from coal to natural gas is that citizens are now aware of the harms of “dirty” coal and the benefits of “clean” natural gas. Environmentalists along with the average “John Q. Public” have been supportive of this switch to cleaner fuels. It is beneficial, therefore, that the market is playing a supporting role in driving the switch in fuel types.
RegulationsNot only are there financial fuel-type considerations motivating the movement away from coal, the United States Environmental Protection Agency (EPA) is hastening the conversion for air-quality reasons—both mercury and air toxin standards, as well as carbon dioxide (CO2). With the support of the White House, the EPA instituted the Clean Power Plan (CPP), which attempts to curb climate change by forcing reductions of CO2 emissions. Under the CPP, Indiana power plants must
n Figure 2: Indiana’s Energy Sources Breakdown
Source: Lawrence Livermore National Laboratory
n Figure 3: Price War: Coal vs. Natural Gas
Source: U.S. Energy Information Agency
52.0%44.7%
18.6%24.6%
27.1% 27.2%
2.3% 3.5%
2008 2012
Coal Natural Gas Petroleum Other
$0
$1
$2
$3
$4
$5
$6
$7
$8
$9
$10
2008 2009 2010 2011 2012 2013 2014 2015 2016 2017 2018 2019 2020
Per
Mill
ion
BTU
Projected
Cost of Coal Delivered to Electric Generating Plants
Cost of Natural Gas Deliveredto Electric Generating Plants
The United States Energy Information
Agency is also projecting the price
of natural gas to rise, albeit slightly. This
will decrease the financial incentive for coal plants to switch to
natural gas.
16 Indiana University Kelley School of Business, Indiana Business Research Center
reduce CO2 emissions 38.5 percent from 2012 levels by 2030. Indiana can do this by burning cleaner fuels like natural gas or by relying more on wind and solar energy, but these latter two energy sources are currently more costly, less nimble and lack the oomph to meet industrial needs. Additionally, the state can encourage citizens to decrease energy demand by using more efficient household goods.
Joining 23 other states, Indiana’s Governor Mike Pence has decided to sue the EPA over the CPP. These states argue that the CPP has gone beyond what is allowed by the law that was established with the Clean Air Act (CAA). The CAA prohibits the EPA from regulating a pollutant from a plant if other pollutants from a plant are already being regulated. However, the EPA states that the CAA prohibits regulating the same pollutants twice. Governor Pence has stated that Indiana may not comply with the CPP even if the rule is upheld. He believes that the CPP will increase prices for consumers too much, reducing their discretionary spending, in addition to putting the jobs of 28,000 Indiana energy workers in jeopardy.
Indiana has one year to submit a plan to be in compliance with CPP. (There is a provision for a two-year extension to rework the plan.) Under the EPA regulation, if Indiana does not comply, the federal government will impose its own plan.
Whether under the market forces of relative fuel price changes to drive Indiana’s gradual energy restructuring, or under the heavy hand of federal mandates to speed up Indiana’s energy transformation, Hoosier energy prices will continue to rise. While these rising energy costs may not be as significant a threat to intermediate- and long-term economic growth and economic performance as cultivating a well-trained, highly skilled workforce, it does erode the state’s short-to-
intermediate competitiveness. Irrespective of one’s political views, one can surely appreciate why Governor Pence is resisting the CPP. He is not the only governor who sees the CPP as a credible threat to his state’s economic vitality. While the future is difficult to predict, it would appear that Indiana will not be able to rely on being a low labor cost and low energy cost state, regardless of how the EPA lawsuit is settled.
Conclusion While workforce development challenges may be more central to Indiana’s long-term economic prospects, the state’s significant rise in electricity costs before the recently announced CPP is to be implemented makes the topic of energy particularly timely. Compared to its border states, Indiana has lost much of its low-cost energy edge, and this trend will likely continue in the next several years. The
state, and the country, are fortunate that while coal’s dominance is being regulated out of the energy mix, fracking has dramatically reduced the cost of natural gas and, thus, the cost of transition to cleaner fuels. Whether they come quickly or slowly, long-term structural changes in energy production and consumption is certain. How the state adapts, however, is an open question.
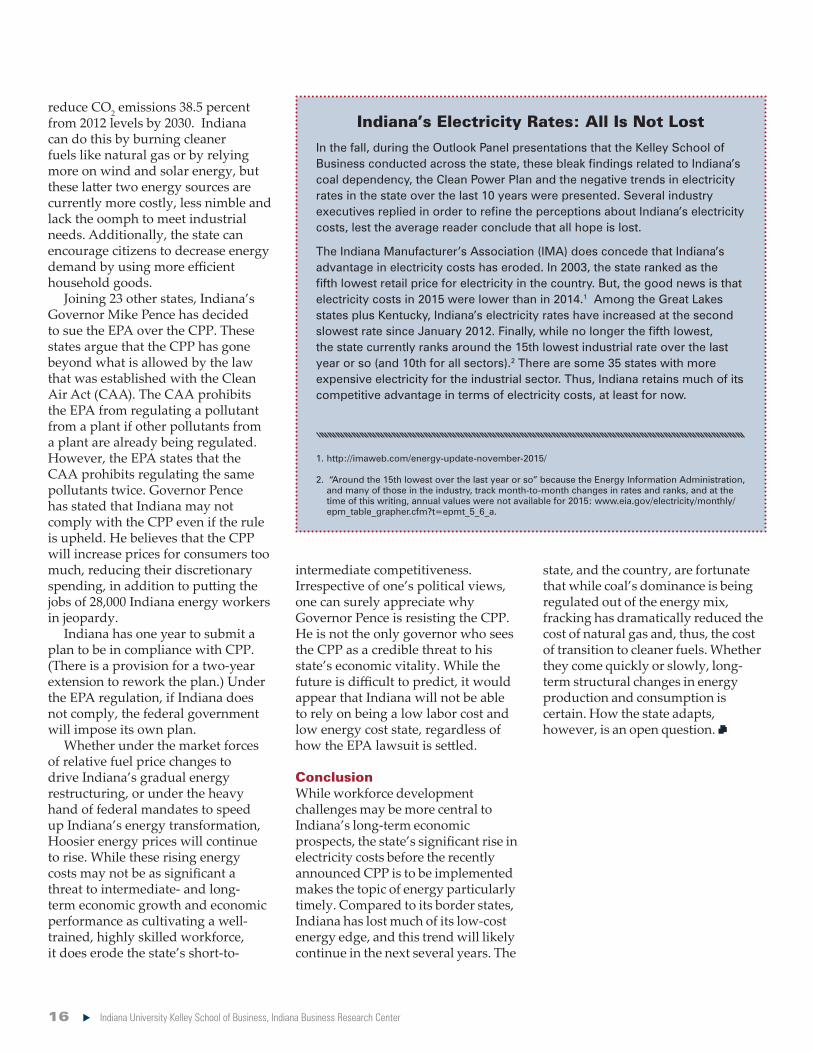
Indiana’s Electricity Rates: All Is Not Lost
In the fall, during the Outlook Panel presentations that the Kelley School of Business conducted across the state, these bleak findings related to Indiana’s coal dependency, the Clean Power Plan and the negative trends in electricity rates in the state over the last 10 years were presented. Several industry executives replied in order to refine the perceptions about Indiana’s electricity costs, lest the average reader conclude that all hope is lost.
The Indiana Manufacturer’s Association (IMA) does concede that Indiana’s advantage in electricity costs has eroded. In 2003, the state ranked as the fifth lowest retail price for electricity in the country. But, the good news is that electricity costs in 2015 were lower than in 2014.1 Among the Great Lakes states plus Kentucky, Indiana’s electricity rates have increased at the second slowest rate since January 2012. Finally, while no longer the fifth lowest, the state currently ranks around the 15th lowest industrial rate over the last year or so (and 10th for all sectors).2 There are some 35 states with more expensive electricity for the industrial sector. Thus, Indiana retains much of its competitive advantage in terms of electricity costs, at least for now.
1. http://imaweb.com/energy-update-november-2015/
2. “Around the 15th lowest over the last year or so” because the Energy Information Administration, and many of those in the industry, track month-to-month changes in rates and ranks, and at the time of this writing, annual values were not available for 2015: www.eia.gov/electricity/monthly/epm_table_grapher.cfm?t=epmt_5_6_a.
Indiana Business Review, Winter 2015 17
T he outlook for Indiana agriculture in 2016 is for the crop sector to face large
losses, while the livestock sector faces modest profits.
U.S. agriculture is facing major headwinds since the U.S. dollar has strengthened, putting U.S. agricultural exports at a competitive disadvantage. In addition, China and the global economy are slowing, even as Russia has banned all agricultural imports from the West. As of October 2015, with record yields for corn and soybeans, crop prices have fallen significantly. With normal weather in 2016 and normal crop yields, prices for corn, soybeans, wheat and hay could decline further as U.S. inventories of these commodities would continue to build. The combination of large U.S. supplies and weak global demand means that 2016 will be a difficult year for Indiana producers.
PorkThe pork industry is treading
water with hog prices trading at the expected costs of production for 2016. The good news is that the industry has largely overcome the challenges of the PED virus epidemic in 2014, and pork supplies have recovered with lower retail prices. However, there are potential new challenges late in 2016 as the total supply of meat expands at the same time as slowing global economic growth and a strong U.S. dollar may result in weak export demand.
DairyThe dairy industry is facing
headwinds as milk prices are under pressure from the strong U.S. dollar that has weakened export demand and by Russia’s ban on agricultural imports. Even with lower feed costs, dairy profit margins are under pressure at these low milk prices. The
dairy sector is expected to increase production by 2 percent in 2016. Therefore, milk prices are forecast to fall to their lowest level in six years. Even lower prices are possible depending on how much U.S. milk production expands and the level of dairy exports.
BeefThe beef cattle industry has
seen major highs and lows in 2015, starting the year at record prices over $170 per hundredweight, and then dropping to under $120 by October, for an overall average of about $150. The record-high prices at the beginning of 2015 caused both lower exports and higher imports, resulting in increased domestic supply that has pushed down prices. Prices are expected to remain moderate in 2016 in the range of high $130s to low $140s and continue stimulating the expansion of the cattle herd.
CropsMany Indiana crop producers
are facing both low yields and low prices resulting in 2015 incomes significantly lower than in recent years. With normal weather and normal yields in 2016, inventories of grain would continue to build, resulting in continued low grain prices. Given the current outlook for crop prices and input costs, row crop producers will continue to experience losses in 2016 before input costs and cash rents fully adjust downward to be in line with the lower crop prices. A potential silver lining in this period of low crop prices is that they will encourage demand growth in both the export markets and the livestock sector.
FarmlandAs of June 2015, the value of
average-quality Indiana farmland declined 3.8 percent over the previous
12 months, according to the Purdue Land Value Survey. The declines were larger for top-quality land at 5.1 percent, and poor-quality land at 4.8 percent. Another survey by the Federal Reserve Bank of Chicago found that the value of farmland in their multi-state district had declined by 3 percent from a year ago.
Looking to 2016, farmland values are expected to continue to decline because Midwest crop farmers are facing economic losses, with crop prices below the total cost of production. In addition to farm incomes, farmland values depend on factors including long-term interest rates, government support, real estate taxes and alternative investment opportunities. Long-term interest rates are currently extremely low and are expected to increase in the next five years, which would put downward pressure on land values. However, the biggest factor driving a decline in farmland values is the continuing profit margin squeeze that crop producers are experiencing.
For more information about Indiana farmland values, see the Purdue Land Value Survey at https://ag.purdue.edu/agecon/Documents/PAER%20AUGUST%202015%20Revised.pdf.
Indiana’s Agricultural Outlook for 2016Corinne Alexander, Ph.D. Associate Professor, Department of Agricultural Economics, Purdue University, West Lafayette


