Demographic Dividends, Gender Equality, and Economic ... · PDF fileDemographic Dividends,...
25
WP/16/169 Demographic Dividends, Gender Equality, and Economic Growth: The Case of Cabo Verde By Heloisa Marone IMF Working Papers describe research in progress by the author(s) and are published to elicit comments and to encourage debate. The views expressed in IMF Working Papers are those of the author(s) and do not necessarily represent the views of the IMF, its Executive Board, or IMF management.
Transcript of Demographic Dividends, Gender Equality, and Economic ... · PDF fileDemographic Dividends,...

WP/16/169
Demographic Dividends, Gender Equality, and Economic Growth: The Case of Cabo Verde
By Heloisa Marone
IMF Working Papers describe research in progress by the author(s) and are published
to elicit comments and to encourage debate. The views expressed in IMF Working
Papers are those of the author(s) and do not necessarily represent the views of the IMF, its
Executive Board, or IMF management.
2
© 2016 International Monetary Fund WP/16/169
IMF Working Paper
Institute for Capacity Development
Demographic Dividends, Gender Equality, and Economic Growth: The Case of Cabo Verde
Prepared by Heloisa Marone1 2
Authorized for distribution by L. Effie Psalida
August 2016
Abstract
This study analyzes Cabo Verde’s demographic transition from the perspective of gender equality. As
the pace of the demographic transition slows, promoting gender equality and increasing women’s
labor force participation will be progressively more important in enhancing otherwise slow-growth
dynamics, reducing poverty, and improving the lives of all, women and men. The study investigates
gender gaps in the labor market participation rate, employment conditions, and the use of time
dedicated to unpaid work. It also discusses policy options to decrease the time women spend on
unpaid work, enhance their employability, and enable them to secure employment. Overall, this study
contributes to the debate on how better to manage the potential dividends resulting from demographic
transitions on the still young but rapidly aging African continent.
JEL Classification Numbers: O1, J10, J160, J190
Keywords: Demographics, Gender Equality, Economic Growth, Employment, Development
Author’s E-Mail Address: [email protected]
1 IMF – Africa Training Institute (http://www.imfati.org/)
2I would like to thank Maritza Rosabal for her valuable comments and conversations on gender related issues, Janet G.
Stotsky, Ermal Hitaj, Leander Schneider, and Joao Inacio Oswald Padilha for their useful comments and suggestions. I
would also like to thank Luciana Lenz and participants in the session on Inequality and Poverty at the CSAE Conference
2016: Economic Development in Africa for their comments and suggestions. Finally, my thanks go to Manuel Pinheiro for
his suggestions on an earlier draft of the study.
IMF Working Papers describe research in progress by the author(s) and are published to
elicit comments and to encourage debate. The views expressed in IMF Working Papers are
those of the author(s) and do not necessarily represent the views of the IMF, its Executive Board,
or IMF management.
3
Contents Page
Abstract ......................................................................................................................................2
I. Introduction ............................................................................................................................4
II. The Demographic Transition in Cabo Verde. .......................................................................6
III. Sources of Growth ...............................................................................................................8
A. Economic growth at a glance ...........................................................................................8
B. The economic impact of the demographic transition in Cabo Verde ...............................8
C. Data considerations ..........................................................................................................9
D. Sources of income per capita growth, 1990-2030 ..........................................................10
IV. Impact on GDP from Closing the Gender Gap in the Labor Force ...................................11
V. Labor Force Participation and Time Use. ...........................................................................12
VI. Labor Market Characteristics ............................................................................................17
VII. Conclusion and Policy Implications. ................................................................................19
References ................................................................................................................................23
Tables
Table 1. Sources of Growth in Income Per Capita, 1990-2030 .............................................. 10 Table 2. Labor Force Participation by Age and Gender, 2014 ............................................... 12
Figures
Figure 1. Number of People at Working Age by Number of Dependents ................................ 7
Figure 2. Labor Force Participation by Age Group, Gender and Urban and Rural Residence
................................................................................................................................................. 14 Figure 3. Share of Respondents Who Report Time Spent Doing Unpaid Work, by Gender and
Age Group ............................................................................................................................... 15 Figure 4. Average Minutes Dedicated to Unpaid Work Weekly, by Gender and Age Group 16 Figure 5. Gender Gaps in Unemployment Rate and Unemployment Rates for Women, Urban
and Rural ................................................................................................................................. 17

4
I. INTRODUCTION
Cabo Verde is currently undergoing a demographic transition with social and economic
implications that will be defining for its development path going forward. Other countries
that are also in the advanced stages of their demographic transitions in Africa include
Mauritius, South Africa, Botswana and the Seychelles (Drummond et al. 2014).
This study analyzes Cabo Verde’s demographic transition from the perspective of gender
equality. It also discusses some policy options that may contribute to attaining the potential
economic and social dividends from the transition. With the drop in the fertility and
mortality rates in the early stages of a demographic transition, the ratio of people younger
than 15 and older than 64 to people between the ages of 15 and 64 decreases. This
combination known as youth bulge due to the shape of the demographic pyramid may result
in demographic dividends derived from changes in labor supply, savings, and human capital.
More specifically, in a demographic transition, labor supply increases as people in the
relatively expanding 15-64 age group are more likely to be working than people in other
relatively shrinking age groups (Bloom et al 2003). In addition, labor supply can also
increase with the increase in the number of women in the workforce resulting from smaller
family sizes being less taxing on women’s time. Savings tend to increase during a
demographic transition leading to a youth bulge because working-age people tend to
consume less than what they produce compared to the young and the old. Moreover, a
smaller family size can also result in higher savings: resources are reallocated from investing
in children to preparing for retirement. Finally, Bloom et al (2003) argues that the impact
from a demographic transition on the level of investment in human capital is perhaps “the
most significant and far-reaching,” with larger amount of resources being “invested” in
education and health of a relatively smaller number of children.
Bloom and Finlay’s (2008) estimates of demographic dividends suggest that, between 1965
and 2005, demographic change contributed around 40 percent of the economic growth in
South East Asia, 29 percent in the Republic of South Korea, and 26 percent in China.
However, whether demographic dividends are in fact realized depends on an enabling policy
environment and the broader social, economic, and cultural context. For instance, the
increase in productivity from the increase in the proportion of the population that is of
working-age will depend on the absorption capacity of the labor market. This capacity rests
on the ability of a growing economy to create job opportunities. Likewise, the quality of jobs
– in terms of varying levels of informality, stability of contractual employment practices,
wages levels, and fit between education and work - also matter a great deal for achieving
demographic dividends. Thus, the International Labor Organization (ILO) estimates that
nearly half the youth of developing economies is not achieving their full economic potential
because of the lack of decent jobs. This, according to the ILO, represents a key impediment
to sustainable development (ILO 2015). Gender equality has also an impact on demographic
dividends because of its impact on the labor supply and/or on the duration of the
demographic transition. Closing the gender gap in education by promoting female education,
5
for instance, is often associated with lower fertility – i.e. narrower population pyramid bases
- and diminishing family sizes (Kane 2004).
As Cabo Verde’s demographic transition slows, the size and potential of demographic
dividends post-2015 will drop sharply due to “mechanical” reasons – i.e., the slowdown of
the increase in the proportion of working-age population. Henceforth, it will largely be
determined by the growth in productivity and the growth in the effective participation rate of
the working-age population in the labor market. In this context, efforts towards closing
gender gaps, in combination with efforts towards making economic growth more inclusive,
will be increasingly important in enhancing otherwise diminished growth dynamics,
reducing poverty, and improving lives of all, women and men. This study estimates, for
instance, that closing the gender gap in labor force participation could have a direct impact
on GDP of as much as 12.2 percent in Cabo Verde.
Besides being a fundamental human right and a development goal on its own, gender
equality can multiply and extend the potential economic and social gains of a demographic
transition. That is to say that ignoring gender inequality prevents an economy from growing
at its full potential.
Indeed, referring to the relatively low level of female participation in its workforce,
Goldman Sachs has raised the alarm over the “underutilization of assets” of Japan. Closing
the gender gap in employment in Japan could boost the country’s GDP by close to 13
percent (Matsui et al 2014). In fact, since 1999, researchers at Goldman Sachs have
advocated for the adoption of “womenomics” as a national priority to solve the demographic
crisis of Japan. This includes boosting female employment with the implementation of
supporting policies such as expansion of daycare and nursing care services, flexible work
arrangements, and reevaluation of compensation and evaluation systems (Matsui et al 2014,
2010, and 1999; Lawson 2008; Daly 2007). Steinberg and Nakane (2012) emphasize the role
of policies in reducing the gender gap in career positions and in providing better support for
working mothers in Japan.
Daly (2007) estimates that increasing female participation and closing the gap between male
and female employment in the Eurozone accounts for 0.4 pp of the region’s 2.1 percent trend
growth between 1995 and 2005. Women entering the labor force represented half the rise in
the Eurozone’s total employment rate between 1995 and 2005 and that policies encouraging
and supporting that shift constituted “the single-biggest driver of Eurozone’s labour market
success, much more so than ‘conventional’ labour market reforms.”3
In contrast to Japan and Europe, Cabo Verde is at a much earlier stage of its demographic
transition. The adoption of “womenomics” would therefore only reinforce and expand the
potential of the demographic dividend and the cumulative effects on long-term growth and
poverty reduction. Indeed, the fact that 33 percent of households headed by women are poor
(among men, 25.7 percent are poor) and that the share of poor households headed by women
3 Daly (2007) p.3
6
increased from 51 percent in 2001/2002 to 56.3 percent in 2007 (INE 2004 and 2007)
indicate that the gender gap in poverty has widened and that Cabo Verde’s sustainable
poverty reduction strategies must increasingly place women at their center.
Cabo Verde’s has made significant advances in promoting gender equality in some areas but
there is still a lot of catching up to do on the economic participation front. This is reflected in
its being ranked 50th
out of 145 countries in the World Economic Forum’s Global Gender
Gap Index (2015). The same index broken down by categories places Cabo Verde in first
place, next to Finland in terms of health and survival, but in 115th
in terms of economic
participation and opportunity.
A case study of Cabo Verde generates important lessons for other countries in Africa that are
in the earlier stages of their respective demographic transitions and are looking for ways to
manage the potential dividends resulting from these transitions. As many countries in Africa
are facing increasing rates of youth unemployment and increasing gaps in gender equality,
these are increasingly urgent issues (United Nations Economic Commission for Africa,
African Union, African Development Bank and United Nations Development Programme
2015).
Section 2 describes the current demographic transition in Cabo Verde. Sections 3 measures
the potential demographic dividend in Cabo Verde and section 4 estimates the potential
impact on GDP of closing the gender gap in labor force participation. Section 5 discusses
labor force participation and time use and section 6 looks at employment conditions from a
gender perspective. Finally, section 7 presents a conclusion and a discussion of policy
options and recommendations.
II. THE DEMOGRAPHIC TRANSITION IN CABO VERDE
Cabo Verde’s National Institute of Statistics (Portuguese abbreviation, INE) estimates that
the share of the population between 15 and 64 years old will rise from 62 percent in 2000 to
67.5 percent in 2030. This increase will be accompanied by a significant decline in the
proportion of the population under the age of 15 from 32 percent to 24 percent, and an
increase in the population older than 64 from 6 percent to 8.5 percent.
INE’s estimations indicate further that most of the growth in the share of people between 15
and 64 has already occurred between 2000 and 2015. With the projections that this group’s
growth will nearly stagnate after 2025, the youth bulge is expected to peak at around 2030.
This demographic shift implies a significant increase in the proportion of people of working
age and a decrease in the proportion of dependents, in particular of dependents younger than
15. Indeed, in the mid-1970s, shortly after independence, it is estimated that there was one
person of working age (15 to 64) for each dependent (younger than 15 or older than 64); this
ratio was below the average in sub-Saharan Africa. It is projected that this ratio has doubled
by 2015, i.e., 2 people at working age for each dependent. This level is comparable to the
average of middle-income country, and is almost twice as large as the average of the Sub-
Saharan African region (Figure 1).

7
With the increasing number of potential workers per dependent, Cabo Verde’s economy has
had and will continue to have the opportunity to benefit from the demographic bonus. This is
based on the premise that adults of working age tend to produce more through their labor
than they consume, while children and older people tend to consume more than they
produce. The exact age range of the economic lifecycle that defines periods of net
production and net consumption may vary depending on countries and generations. For this
analysis, this study considers the age range for when production is higher than consumption
to be the traditional 15 to 64 years old.
Figure 1. Number of People at Working Age by Number of Dependents
Source: Own calculation based on WDI (2015) and INE (2012)
Note: (P) indicates projections. Working age is from 15 to 64 years old and dependents are younger than 15 or older than 64
years old.
High income: OECD
Middle income
Sub - Saharan Africa (all income levels)
Small states
Cabo Verde
Mauritius
0.7
1.2
1.7
2.2
2.7
1965 1970 1975 1980 1985 1990 1995 2000 2005 2010 2015 (P)
2020 (P)
2025 (P)
2030 (P)

8
II. SOURCES OF GROWTH
A. Economic growth at a glance
Between 1991 and 2014, Cabo Verde grew an average of 5.5 percent per year in real terms,
above the world’s and Sub Saharan’s growth rates of 3.6 percent and 4.5 percent respectively
(WEO database, 2015). The service sector accounted for close to 2/3 of the economy in 2014
and the sector of hotels and restaurants, which accounted around 1 percent of GDP in 1992
and 6.5 percent in 2014, has been among the fastest growing sectors in the economy.
The sector of hotels and restaurants that employed 7.3 percent of the labor force in 2014
grew at an average pace of 14 percent per year between 2008 and 2013 (INE 2015). In
contrast, the agriculture and wholesale sectors that together represented close to 30 percent
of the GDP and employed the largest share (32 percent) of the labor force in 2014 grew at
more moderate paces of 3 percent and 2 percent respectively. The limited impact of tourism
in the local economy and job market is in part explained by the prevailing all-inclusive
model of tourism that relies mostly on international chains of goods and services, the limited
ability of local markets to compete in and tap into this sector because of high production
costs associated with transportation and scale, and the concentration of tourism in two of the
country’s nine inhabited islands, Sal and Boa Vista, while the most populated islands are
Santiago and Sao Vicente.
The increased number of tourists and tourism-related construction in the country has also
brought important sustainability and environmental challenges: they constitute a threat to the
fragile natural habitats while increasing the demand on already sparse natural resources
through the consumption of water and energy and the increase in solid and liquid waste.
Increase in tourism has also been associated with emerging social challenges related to drug
issues, prostitution, criminality, and housing, especially in the tourist islands of Sal and Boa
Vista and the capital Praia.
According to Marone and Nshimyumuremyi (2014), besides the challenges associated with
the country’s arid climate, archipelagic formation, and small population, a more widespread
economic benefit from the fast-growing tourism sector, including through job creation,
depends on structural reforms aiming at facilitating the integration between this sector and
the local market of goods and services.
B. The economic impact of the demographic transition in Cabo Verde
To estimate and measure the economic impact of the demographic transition in Cabo Verde,
this study calculates the impact of the growth in the share of the population between 15 and
64 years old on the growth of income per capita following Bloom et al. (2010).
Economic growth is thus divided into three components: (i) growth of income per capita in
the labor force (an indicator of productivity), (ii) growth in the labor force participation rate,
and (iii) growth in the share of the population between 15 and 64 years old. This breakdown
comes from the identity below (equation 1) that associates the level of per capita income
(GDP per capita) and the level of income per person at working age:

9
To express equation 1 in terms of growth rates, take logs and differentiate it to obtain the
following identity:
(2)
As in Bloom et. al. (2010), this study assumes that growth of income per capita in the labor
force can be the result of an increase in worker productivity and/or the result of workers
moving from less to more productive sectors.
C. Data considerations
The following analysis comes with an important caveat: employment figures from different
years and surveys in Cabo Verde need to be analyzed carefully. Since 2012, the country has
been conducting regular employment surveys once a year and for the same period of the
year. These recent surveys allow for data comparability. Employment figures prior to 2012
are compiled from different surveys4 with data that are not necessarily comparable, in part
because the data was collected at different points in the year for different surveys;
employment varies seasonally as a result of the economy’s dependence on tourism and
agriculture. Seasonality cannot be estimated because surveys are conducted only once a year
and not necessarily at the same time of the year prior to 2012.
The employment figures used in the analysis of the period from 1990 to 2013 below are
taken from the World Development Indicators (WDI 205), which are based on ILO
modeling estimates. The data produced by INE and estimated by ILO can diverge
significantly. For instance, in 2013, INE’s survey indicates that the labor force participation
rate among men older than 15 was 67.1 percent while ILO estimated it to be 83.7 percent.
Considering that INE’s numbers are based on actual surveys and not on model-based
projections, this study chooses to use INE’s employment figures instead of ILO’s projections
whenever possible and whenever the analysis does not call for a long-term comparison using
data prior to 2012.
Finally, it is important to note the definition of employment used in surveys. A person is
considered to be employed if she or he has worked, in exchange for money or not, for at
least one hour or was on leave from a job in the week of the survey. This conception of
employment is broad and does not speak to the quality, remuneration, or duration of the
activity performed in the week of reference.
4 INE- RGPH 2000; IDRF 2001/2002; Inquérito ao Emprego 2005; QUIBB 2006; QUIBB 2007; Inquérito ao
Emprego 2008; Inquérito ao Emprego 2009; RGPH 2010
10
D. Sources of income per capita growth, 1990-2030
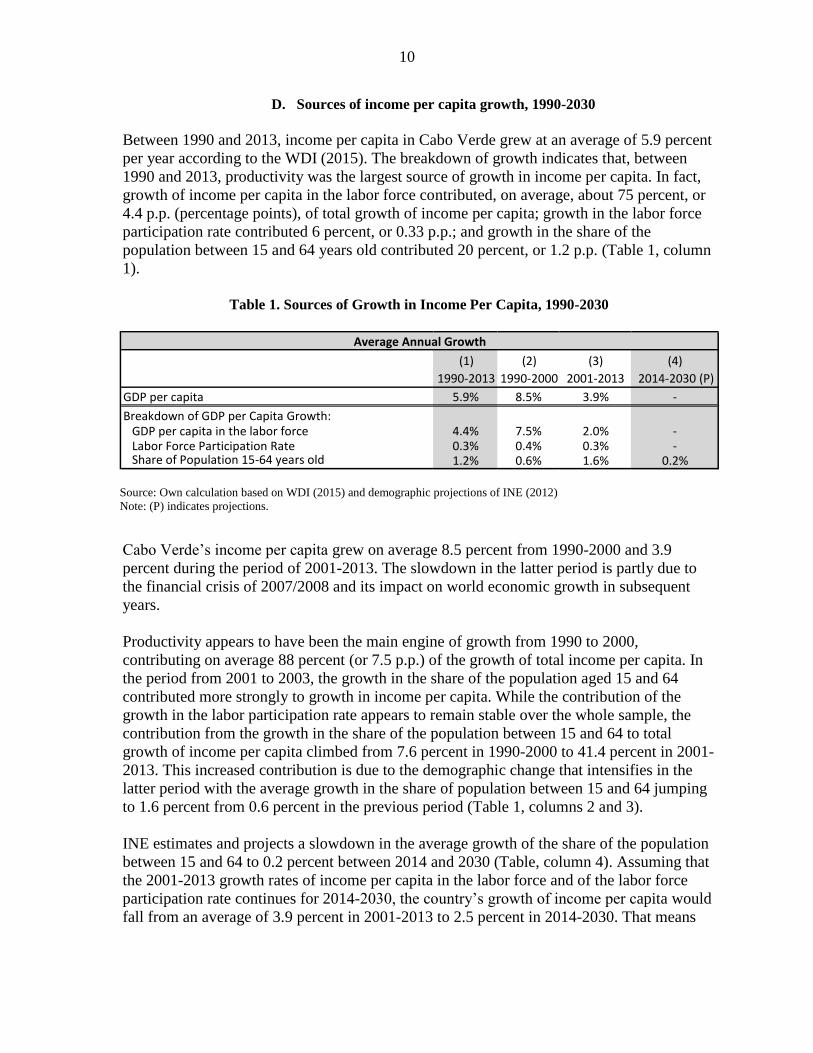
Between 1990 and 2013, income per capita in Cabo Verde grew at an average of 5.9 percent
per year according to the WDI (2015). The breakdown of growth indicates that, between
1990 and 2013, productivity was the largest source of growth in income per capita. In fact,
growth of income per capita in the labor force contributed, on average, about 75 percent, or
4.4 p.p. (percentage points), of total growth of income per capita; growth in the labor force
participation rate contributed 6 percent, or 0.33 p.p.; and growth in the share of the
population between 15 and 64 years old contributed 20 percent, or 1.2 p.p. (Table 1, column
1).
Table 1. Sources of Growth in Income Per Capita, 1990-2030
Source: Own calculation based on WDI (2015) and demographic projections of INE (2012)
Note: (P) indicates projections.
Cabo Verde’s income per capita grew on average 8.5 percent from 1990-2000 and 3.9
percent during the period of 2001-2013. The slowdown in the latter period is partly due to
the financial crisis of 2007/2008 and its impact on world economic growth in subsequent
years.
Productivity appears to have been the main engine of growth from 1990 to 2000,
contributing on average 88 percent (or 7.5 p.p.) of the growth of total income per capita. In
the period from 2001 to 2003, the growth in the share of the population aged 15 and 64
contributed more strongly to growth in income per capita. While the contribution of the
growth in the labor participation rate appears to remain stable over the whole sample, the
contribution from the growth in the share of the population between 15 and 64 to total
growth of income per capita climbed from 7.6 percent in 1990-2000 to 41.4 percent in 2001-
2013. This increased contribution is due to the demographic change that intensifies in the
latter period with the average growth in the share of population between 15 and 64 jumping
to 1.6 percent from 0.6 percent in the previous period (Table 1, columns 2 and 3).
INE estimates and projects a slowdown in the average growth of the share of the population
between 15 and 64 to 0.2 percent between 2014 and 2030 (Table, column 4). Assuming that
the 2001-2013 growth rates of income per capita in the labor force and of the labor force
participation rate continues for 2014-2030, the country’s growth of income per capita would
fall from an average of 3.9 percent in 2001-2013 to 2.5 percent in 2014-2030. That means
(1) 1990-2013
(2) 1990-2000
(3) 2001-2013
(4) 2014-2030 (P)
GDP per capita 5.9% 8.5% 3.9% -
Breakdown of GDP per Capita Growth: GDP per capita in the labor force 4.4% 7.5% 2.0% - Labor Force Participation Rate 0.3% 0.4% 0.3% - Share of Population 15-64 years old 1.2% 0.6% 1.6% 0.2%
Average Annual Growth
11
that a drop of 1.4 p.p. in growth would be directly related to the slowdown in the
demographic transition.
This analysis of the demographic projections - with all its caveats - leads to an important
conclusion: with the demographic transition slowing, the size and potential of demographic
dividends post-2015 will be determined largely by the growth of productivity and the growth
in the effective participation rate of the working-age population in the labor market.
Policies that are able to target productivity and encourage overall labor force participation
effectively will have a greater likelihood of successfully extending and even amplifying the
gains associated with the demographic transition. In particular, promoting gender equality
and increasing the labor force participation of women can have a significant impact on GDP
growth.
III. IMPACT ON GDP FROM CLOSING THE GENDER GAP IN THE LABOR FORCE
In 2014, labor force participation rate of women was 51.2 percent of the total female
working-age population in Cabo Verde; for men, it was 65 percent of the total male
working-age population. Note that national employment figures from INE surveys define the
working-age population as 15 or older (as opposed to 15 to 64); thus, for the calculations in
this section, I follow INE’s definition.
Raising the labor force participation rate of women to match that of men would imply
increasing the total labor force participation rate by 12.2 percent or a total of 26,428 workers.
The impact on GDP would be substantial: assuming everything else is kept constant in
equations 1 and 2, it would follow that closing the gap in the labor force participation rate
would increase the labor force participation rate and thus the GDP by 12.2 percent.
The actual full impact of closing the gender gap on GDP would depend on several factors,
including the absorption capacity of the economy and the labor productivity of the new
entrants.
One must also consider that as women enter the labor force, their children and dependents
would not have anyone to look after them during the hours women are out of the house. The
role of women is central in home-making in Cabo Verde: according to the Time Use Survey
(INE 2012), close to 90 percent of women report spending an average of almost 60 hours a
week doing unpaid work in the home. One third of that is spent on taking care of children
and dependents; the majority of hours spent taking care of children is dedicated to children
between the ages of 0 and 3.
Supportive policies for working mothers, including day cares, are important to encourage
female labor force participation but they are also central to preventing the potentially
negative social and economic impact of unattended young children and dependents. I will
discuss this point further in section 7.
12
Aguirre et al, (2012) attempt to quantify some dampening factors on growth when measuring
the economic contribution of new entrants in the labor force. They consider two factors: (1) a
“productivity drag” produced by a gap in productivity between incumbents and new entrants
and (2) the possibility that new entrants could be pushed into part-time jobs because of
family reasons or a limited absorption capacity of the economy. They assumed that factor (1)
could dampen GDP growth by around 30 percent and factor (2) by another 13 percent. Even
after taking into account these dampening factors, at 7.4 percent the total boost in growth
from closing the gender gap would still be substantial.
These results serve to underline that women tend to be one of the most “underutilized assets”
in the economy. However, labor force participation only tells part of the story; it is also
necessary to understand where the major gaps in labor force participation lie and if there are
gender gaps in employment conditions and more broadly that prevent women from
participating fully in the economy.
IV. LABOR FORCE PARTICIPATION AND TIME USE
According to the most recent national survey (INE 2015), the gap between the female and
male participation rate in the labor force is much larger in rural areas, while it is also
observed in urban areas.
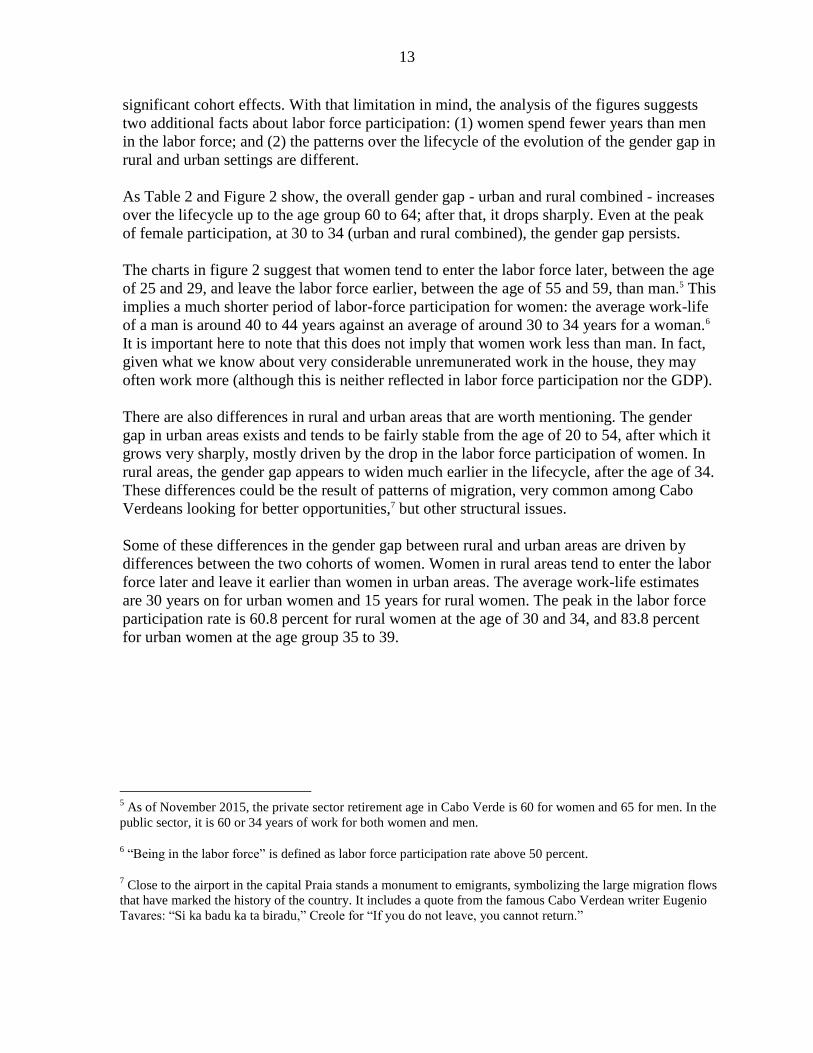
In 2014, the average labor force participation rate among urban residents was 59.1 percent
for women against 69.8 percent for men. In rural areas, these figures averaged 35.7 percent
and 55.5 percent respectively (Table 2). The gender gap is thus almost twice as large in rural
areas, where labor force participation for both men and women is also much lower than in
urban areas.
Table 2. Labor Force Participation by Age and Gender, 2014
Source: INE 2015
Looking at the figures by age provides a proxy for how the labor force participation rates
behave over the average economic lifecycle of a typical person in Cabo Verde. The country
has changed rapidly in the last 10 to 15 years, and this is and will continue to be reflected in
Age Men Women Total Men Women Total Men Women Total
15-19 13.7 12.4 13.1 19 9.8 14.7 15.9 11.3 13.7
20-24 67.7 58.8 63.2 56.7 30.5 44.9 63.7 49.8 57
25-29 83.6 73.4 78.6 71.5 47.2 60.4 80.1 66.6 73.6
30-34 88.1 80.9 84.5 77.7 60.8 69.1 85.1 75 80
35-39 90.3 83.8 86.9 82.3 59.3 70.5 88.3 77.9 82.9
40-44 91.9 80.6 85.8 78.4 57 67.3 87.7 73.7 80.2
45-49 89.8 79.4 84.9 78.2 54.8 65.7 86.3 70.5 78.6
50-54 79 69.5 74.3 78.1 46.5 60.7 78.8 61.5 69.8
55-59 78.5 46.1 60.9 61.4 44.8 51.4 73.1 45.6 57.6
60-64 57.2 29.1 41 52.1 26.7 34.7 55.8 28.2 38.9
65+ 19.8 7.2 12.3 15.3 5.2 9.1 17.8 6.3 10.9
Total 69.8 59.1 64.3 55.5 35.7 45.3 65 51.2 57.9
Urban Rural Total
13
significant cohort effects. With that limitation in mind, the analysis of the figures suggests
two additional facts about labor force participation: (1) women spend fewer years than men
in the labor force; and (2) the patterns over the lifecycle of the evolution of the gender gap in
rural and urban settings are different.
As Table 2 and Figure 2 show, the overall gender gap - urban and rural combined - increases
over the lifecycle up to the age group 60 to 64; after that, it drops sharply. Even at the peak
of female participation, at 30 to 34 (urban and rural combined), the gender gap persists.
The charts in figure 2 suggest that women tend to enter the labor force later, between the age
of 25 and 29, and leave the labor force earlier, between the age of 55 and 59, than man.5 This
implies a much shorter period of labor-force participation for women: the average work-life
of a man is around 40 to 44 years against an average of around 30 to 34 years for a woman.6
It is important here to note that this does not imply that women work less than man. In fact,
given what we know about very considerable unremunerated work in the house, they may
often work more (although this is neither reflected in labor force participation nor the GDP).
There are also differences in rural and urban areas that are worth mentioning. The gender
gap in urban areas exists and tends to be fairly stable from the age of 20 to 54, after which it
grows very sharply, mostly driven by the drop in the labor force participation of women. In
rural areas, the gender gap appears to widen much earlier in the lifecycle, after the age of 34.
These differences could be the result of patterns of migration, very common among Cabo
Verdeans looking for better opportunities,7 but other structural issues.
Some of these differences in the gender gap between rural and urban areas are driven by
differences between the two cohorts of women. Women in rural areas tend to enter the labor
force later and leave it earlier than women in urban areas. The average work-life estimates
are 30 years on for urban women and 15 years for rural women. The peak in the labor force
participation rate is 60.8 percent for rural women at the age of 30 and 34, and 83.8 percent
for urban women at the age group 35 to 39.
5 As of November 2015, the private sector retirement age in Cabo Verde is 60 for women and 65 for men. In the
public sector, it is 60 or 34 years of work for both women and men.
6 “Being in the labor force” is defined as labor force participation rate above 50 percent.
7 Close to the airport in the capital Praia stands a monument to emigrants, symbolizing the large migration flows
that have marked the history of the country. It includes a quote from the famous Cabo Verdean writer Eugenio
Tavares: “Si ka badu ka ta biradu,” Creole for “If you do not leave, you cannot return.”

14
Figure 2. Labor Force Participation by Age Group, Gender and Urban and Rural Residence
Policies aiming at encouraging higher female labor force participation need to pay particular
attention to the large gender gap and the low labor force participation of women in rural
areas. And while the process of urbanization has likely been very important to the increased
participation of women in the labor force, more can be done in terms of increasing the
average work life of women residing in urban areas. A later – relative to man – entry in the
labor force could imply more limited career opportunities for women, and a diminished
ability to accumulate on-job skills, which has a potential impact on wage differentials
between men and women. Such a gender gap is important for growth and poverty reduction:
in Cabo Verde, more than one in four people are considered poor and about one in three
households headed by a woman is poor. Breaking cycles of poverty will inevitable require
breaking women’s poverty.
Labor Force Participation by Age Group and
Gender, Urban and Rural Combined
Labor Force Participation by Age Group and
Gender, Urban
Source: INE 2015
Labor Force Participation by Age Group and
Gender, Rural
Gender Gap Differential in Labor Force
Participation by Age, Urban and Rural
15
As previously noted, the smaller female labor force participation rate does not mean that
women work less than man or contribute less to the economic welfare of the country. Indeed,
the Time Use Survey (INE 2012) indicates that women spend on average 1.6 times more
time than man doing unpaid work, including household tasks, taking care of dependents
(including child-rearing), supporting other families, and volunteer work. Much of the gender
gap is driven by differentials in time spent on household tasks and taking care of dependents.
Women in Cabo Verde spend on average about three and a half hours more than men on
unpaid work each day. In addition, more women report being engaged in unpaid work (90
percent) when compared to men (73 percent). The survey also indicates that both the number
of hours dedicated weekly to unpaid work by women and the gap in the number of hours
between men and women increases with decreasing standards of living, levels of education,
and an increasing number of dependents.
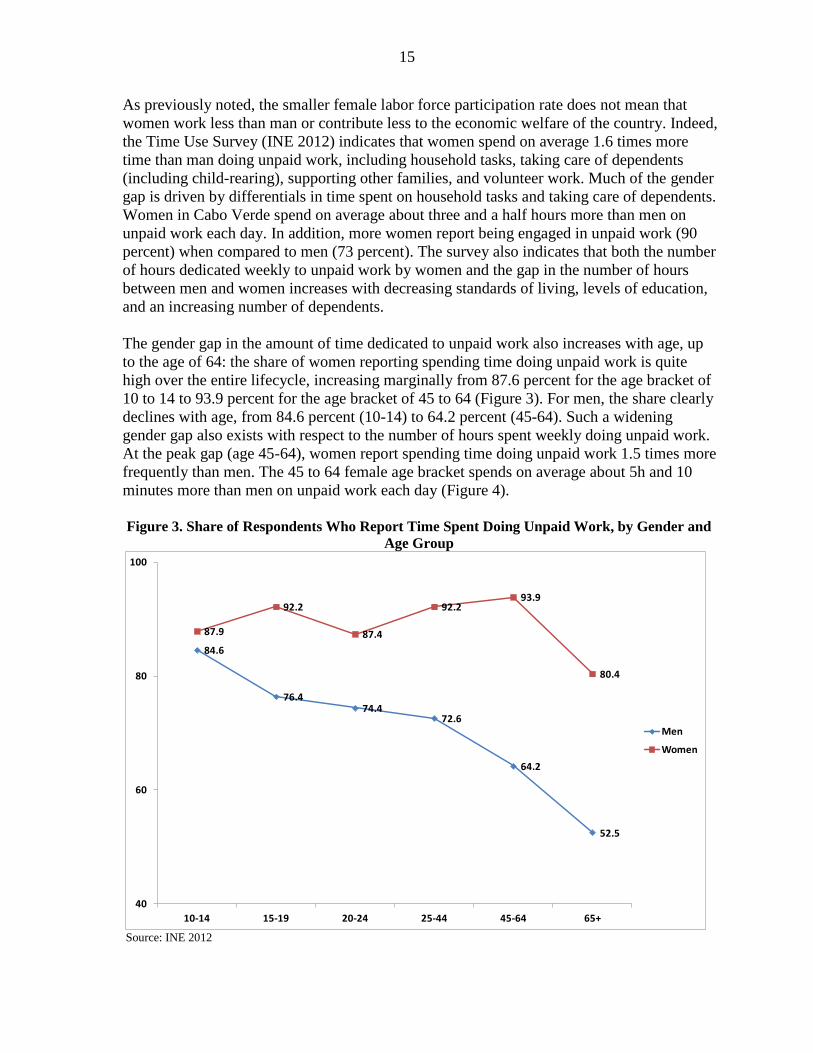
The gender gap in the amount of time dedicated to unpaid work also increases with age, up
to the age of 64: the share of women reporting spending time doing unpaid work is quite
high over the entire lifecycle, increasing marginally from 87.6 percent for the age bracket of
10 to 14 to 93.9 percent for the age bracket of 45 to 64 (Figure 3). For men, the share clearly
declines with age, from 84.6 percent (10-14) to 64.2 percent (45-64). Such a widening
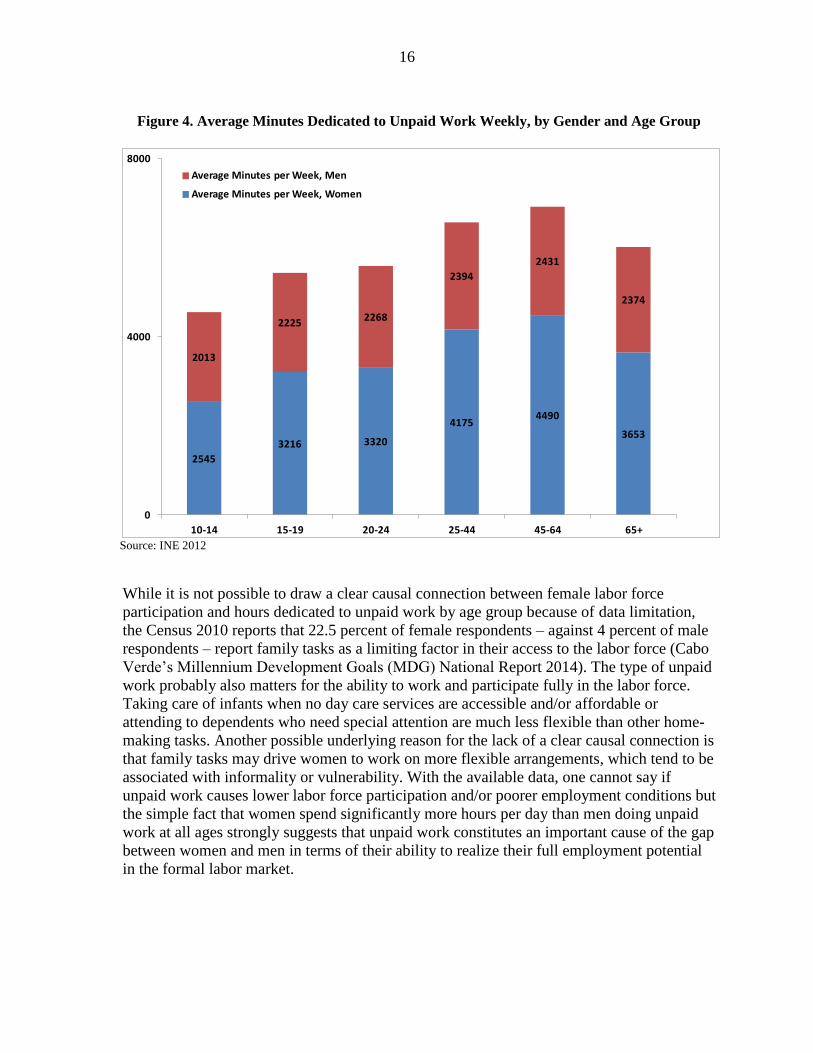
gender gap also exists with respect to the number of hours spent weekly doing unpaid work.
At the peak gap (age 45-64), women report spending time doing unpaid work 1.5 times more
frequently than men. The 45 to 64 female age bracket spends on average about 5h and 10
minutes more than men on unpaid work each day (Figure 4).
Figure 3. Share of Respondents Who Report Time Spent Doing Unpaid Work, by Gender and
Age Group
Source: INE 2012
84.6
76.474.4
72.6
64.2
52.5
87.9
92.2
87.4
92.293.9
80.4
40
60
80
100
10-14 15-19 20-24 25-44 45-64 65+
Men
Women
16
Figure 4. Average Minutes Dedicated to Unpaid Work Weekly, by Gender and Age Group
Source: INE 2012
While it is not possible to draw a clear causal connection between female labor force
participation and hours dedicated to unpaid work by age group because of data limitation,
the Census 2010 reports that 22.5 percent of female respondents – against 4 percent of male
respondents – report family tasks as a limiting factor in their access to the labor force (Cabo
Verde’s Millennium Development Goals (MDG) National Report 2014). The type of unpaid
work probably also matters for the ability to work and participate fully in the labor force.
Taking care of infants when no day care services are accessible and/or affordable or
attending to dependents who need special attention are much less flexible than other home-
making tasks. Another possible underlying reason for the lack of a clear causal connection is
that family tasks may drive women to work on more flexible arrangements, which tend to be
associated with informality or vulnerability. With the available data, one cannot say if
unpaid work causes lower labor force participation and/or poorer employment conditions but
the simple fact that women spend significantly more hours per day than men doing unpaid
work at all ages strongly suggests that unpaid work constitutes an important cause of the gap
between women and men in terms of their ability to realize their full employment potential
in the formal labor market.
2545
3216 3320
41754490
3653
2013
2225 2268
2394
2431
2374
0
4000
8000
10-14 15-19 20-24 25-44 45-64 65+
Average Minutes per Week, Men
Average Minutes per Week, Women
17
V. LABOR MARKET CHARACTERISTICS
The effective participation of both women and men in the labor force depends on their
ability to get employment and have decent jobs. The larger the effective participation is, the
larger its impact on long-term GDP growth.
Currently, 49 percent of the total working-age population -in and out of the labor force- is
employed (INE 2015). This rate is the smallest, 19.1 percent, among women aged 15 to 24
and highest, 74.1 percent, among the men aged 35 to 64.
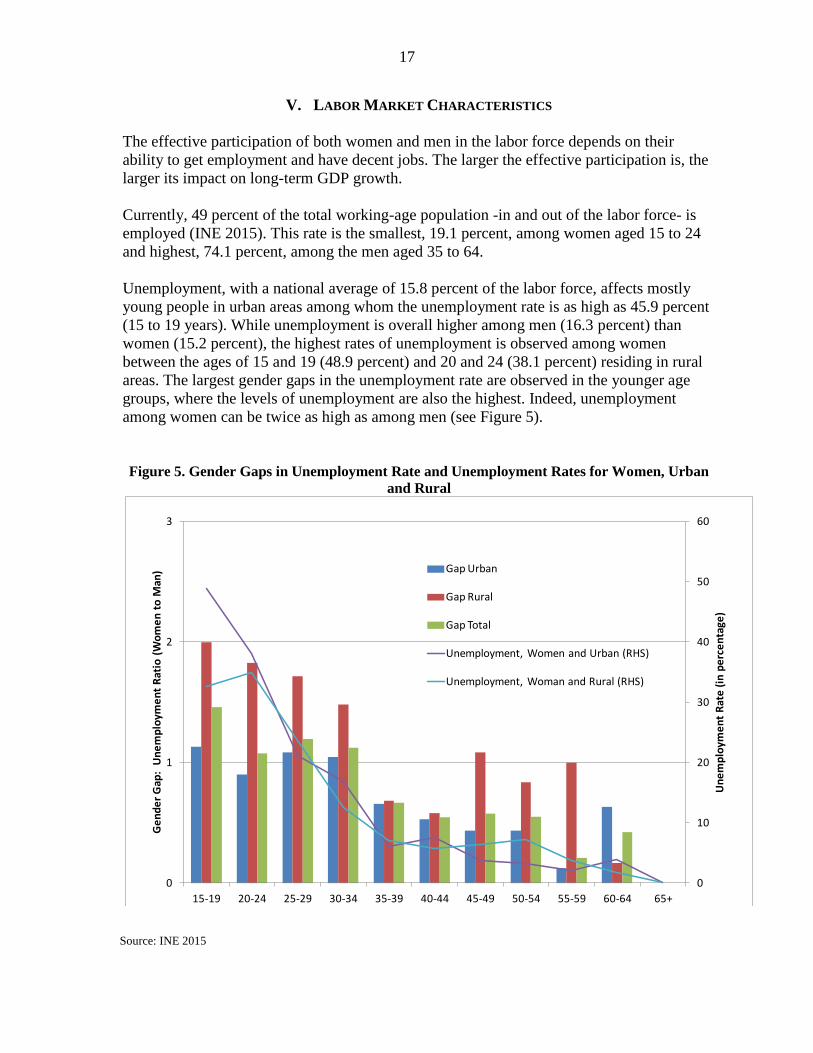
Unemployment, with a national average of 15.8 percent of the labor force, affects mostly
young people in urban areas among whom the unemployment rate is as high as 45.9 percent
(15 to 19 years). While unemployment is overall higher among men (16.3 percent) than
women (15.2 percent), the highest rates of unemployment is observed among women
between the ages of 15 and 19 (48.9 percent) and 20 and 24 (38.1 percent) residing in rural
areas. The largest gender gaps in the unemployment rate are observed in the younger age
groups, where the levels of unemployment are also the highest. Indeed, unemployment
among women can be twice as high as among men (see Figure 5).
Figure 5. Gender Gaps in Unemployment Rate and Unemployment Rates for Women, Urban
and Rural
Source: INE 2015
0
10
20
30
40
50
60
0
1
2
3
15-19 20-24 25-29 30-34 35-39 40-44 45-49 50-54 55-59 60-64 65+
Un
em
plo
yme
nt
Rat
e (
in p
erc
en
tage
)
Ge
nd
er
Gap
: U
ne
mp
loym
en
t R
atio
(W
om
en
to
Man
) Gap Urban
Gap Rural
Gap Total
Unemployment, Women and Urban (RHS)
Unemployment, Woman and Rural (RHS)
18
High rates of unemployment increase the likelihood of underemployment, which is often
characterized by low wages and poor conditions and tends to be associated with informal
sector activities. The disproportionately high level of unemployment among young women
therefore tends to create distortions early on in life that can amplify gender inequalities over
the working life in terms of job opportunities in the formal market but also in terms of wages
and career opportunities. The important role of women as heads of households greatly
increases the risk of these distortions being transmitted onto future generations, increasing
the risk of low social mobility and persistent cycles of poverty.
Informality is high in Cabo Verde: the large majority, close to 59 percent, of the employed
reports having no labor contract (INE 2015). Evidence suggests that women are the majority
of those working in informality, which suggests that the decline in the gender gap in
employment with age could be masking gender disparities in other important aspects of
employment.
Among employed women, close to one fourth works in retail and another 13 percent works
in family homes. Both sectors have very high levels of informality marked by the absence of
a contract. Indeed, the great majority of people working in family homes, 92.2 percent,
reports having no labor contract, with only 3.1 percent reporting having any kind of contract.
In retail, 77.8 percent of the respondents report having no labor contracts. Workers in
agriculture, which employs another 8.5 percent of employed women, report having no
contracts 95.4 percent of the time.
Observable “underemployment,” characterized by working less than 40 hours but being
willing to work more hours (INE 2015), affects as much as 30.1 percent of the population;
this rate is particular high in rural areas (48.2 percent) and among women (33.9 percent). The
highest rate is among women residing in rural areas where the average underemployment
rate reaches 57.9 percent; in some counties it is as high as 80.1 percent (e.g. women residing
in S. Miguel).
Finally, Cabo Verde’s 2014 MDG Report states that women tend to face greater job
vulnerabilities – defined as self-employment and being family-workers – than men. In 2011,
55.4 percent of women had vulnerable jobs against 22.4 percent of men.
Broadly, the data show that gender disparities affect women’s labor force participation but
also women’s employment conditions. Policies aiming at promoting gender equality
therefore need to go beyond closing the gender gap in labor force participation rates and also
focus on gender gaps in employment conditions.
19
VI. CONCLUSION AND POLICY IMPLICATIONS
There is much potential for increasing GDP growth in the coming years from the change in
demographics that Cabo Verde is experiencing. GDP growth will come from the increase in
the share of the working-age population. But a greater potential resides in a possible increase
in the labor force participation of young people and women.
In the case of women, who are the focus of this study, the data shows that the labor force
participation rate tends to be smaller than that of men, and that closing the gender gap in
labor force participation could raise the workforce by more than 26,000 people and boost
GDP growth by as much as 12.2 percent.
Closing other employment-related gender gaps also has the potential to raise productivity
and GDP growth. There is much room for improvement in labor productivity among women
through enhancing formal employment opportunities for them. Indeed, the data shows that
women have a shorter working-life span than man – i.e., they enter the labor force later and
leave it earlier; young women face the highest levels of unemployment; and women face
higher levels of informality, underemployment, and job vulnerability than men.
The reasons underlying these many gaps need to be further explored, but the evidence
suggests that taking care of family members and the home plays an important role in
explaining many women’s late entry in the labor force. This and the high levels of
unemployment at a young age women face in turn increase the likelihood of informality,
underemployment, and job vulnerability, creating a vicious cycle of poverty and poverty
traps.
According to Elborg-Woytek et al. (2013), improving women’s effective participation in the
labor market entails well-designed and integrated sets of policies – from fiscal policies,
including the use of tax credits or benefits to low-wage earners and expenditure measures
targeting child support, to policies aiming at increasing the demand for women’s labor and
promoting the use of flexible work arrangements. The overall conclusion, however, is that
no single policy alone can be effective in closing all gender gaps because of the multiple,
interconnected social, economic, and cultural aspects that underlie these gaps.
For instance, Cabo Verde’s 2014 MDG report shows that unemployment tends to be higher
among women than men with a post-secondary education, which implies that the education
level of girls and women does not automatically translate into equal access to job
opportunities. Nonetheless, education remains one of the pillars of efforts to promote gender
equality in terms of higher wages, a greater likelihood of working outside the home, lower
fertility rates, reduced maternal and child mortality, and better health and education,
including health and education of future generations (Lawson 2008).
Cabo Verde’s MDG report suggests further that part of the difficulty in dealing with this and
other gender-disparities is related to the lack of a systematic gender approach in planning
and managing of public policies and programs. Indeed, gender-based inequalities are among
the obstacles in the way of achieving almost all MDGs.

20
In tackling labor force participation gaps and their strong link to unpaid work and home-
making tasks in Cabo Verde, the 2014 MDG report urges to better integrate care in social
policies and reframe care services as a societal responsibility rather than exclusively that of
the care recipient’s family (and typically their female members). The report further
emphasizes the need for policies that promote shared responsibility in the care of dependents
and the house, better paid and unpaid work balance, and a higher social value associated
with unpaid work.
Support to child and elderly care plays an important role in female labor participation.
Elborg-Woytek et al. (2013) cite successful reforms in Japan, the United States, and South
Africa. Community child-care centers that target low-income neighborhoods have been
found to be effective in increasing maternal employment in a number of countries (World
Bank 2012). In studying Chile’s Crece Contigo Childcare Program, however, Manley and
Vasquez (2013) find evidence that the childcare program has not had a clear effect on
women’s rates of participation. They suggest many reasons for the apparent ineffectiveness
of the program, including cultural and traditional reasons and the need for a broader range of
social safety-net policies.
Beyond care services, Cabo Verde’s 2014 MDG report also emphasizes the need for policies
that are gender-based and aim at improving employment opportunities for women such as
professional training integrated with policy initiatives for economic diversification including
in agribusiness. The report also points to the importance of data disaggregated by gender for
designing, monitoring, and evaluating policies.
Promoting gender equality also entails policies that support changes in culture and social
behavior. For instance, 1,702 out of 2,693 children not enrolled in primary school were girls
in 2010 (MDG report 2014). The 2014 MDG report suggests that, although the reasons need
to be better understood, the gender of the child may well determine a family’s decision to
have the child help the family as opposed to sending the child off to school.
Girls’ education is a problem faced by many countries. Kane (2004) discusses the question
of girls’ education and finds that, especially among poor families, the opportunity cost of
sending girls to school is often considered high and increasing as the quality of the education
and expected returns from studying declines. The inability of young women to find jobs only
exacerbates that return calculation. Costs associated with fees, transportation, uniforms, and
books play also an important role; the demand for girls’ education in some cases is very
sensitive to the distance to school because of their need to work at home. Lawson (2008)
discusses girls’ versus boys’ education sensitivity to household income, citing a study of
India that estimates that an increase of 1 percent in per capita household income increases
the likelihood of girls’ enrollment in middle school by 4 pp, compared to 1pp for boys.
Cultural reasons are in some cases as important as economic reasons as demonstrated by
research conducted in Guinea and Ethiopia (Kane 2004).
21
Considering the evidence presented in this study, Cabo Verde would gain from adopting an
integrated set of policies that especially target the reasons underlying late entry in labor force
and higher levels of unemployment among young women. Particular attention should be
given to women in rural areas and the underlying causes for the larger gender gap and
especially low labor force participation. Two main set of policies could be effective: one that
would focus on decreasing the time spent by women doing unpaid work and one that would
focus on increasing the employability and hiring of women.
The first set of policies focusing on freeing time for formal employment could include
expanding the capacity and affordability of care services, policies and awareness campaigns
to break traditional views of gender-roles, targeted cash transfer policies, and other
development initiatives such as increased access to water and electricity. In fact, access to
running water has played a key role in the development of large economies such as the
United States precisely because it has freed up especially female labor. Gordon’s (2012)
analysis of long-term growth in the US includes an assessment of the importance of living
standards, a measure that includes running water in the house, as a contributor to what he
calls the second industrial revolution beginning in 1870: “Every drop of water for laundry,
cooking, and indoor chamber pots had to be hauled in by the housewife, and wastewater
hauled out. The average North Carolina housewife in 1885 had to walk 148 miles per year
while carrying 35 tons of water…. There was no more important event that liberated women
than the invention of running water and indoor plumbing, which happened in urban America
between 1890 and 1930.” (Gordon 2012, 7)
Limited fiscal space, which is a severely binding constraint especially for developing
nations, can be circumvented when possible through greater private sector involvement.
Matsui (2014), for instance, emphasizes the importance of deregulation in promoting the
participation of the private sector in daycare services in Japan, where fiscal constraints
decreased the ability of the state to provide such services. In fact, the promotion of
businesses offering care services in Cabo Verde would have the potential to create job
opportunities and absorb a large number of young people, especially women.
The second set of policies, which would focus on employability of women and on increasing
the demand for female labor, may include policies that promote flexible work arrangements,
female entrepreneurship, specific training, access to financing, awareness campaigns to
increase gender diversity in businesses, and the removal of discriminatory practices and red-
tape. Indeed, Gonzales et al. (2015) find legal restrictions and regulations that establish
discriminatory gender differences against women to be a significant deterrent to female labor
participation across a variety of countries.
Significant changes in the dynamics of female labor participation, possibly in tandem with
cash-transfer initiatives targeted to low income households and improvements in the quality
of education and professional training for women, would likely increase the expected return
from schooling for girls, especially poorer girls. This could have a positive impact on
enrollment ratios of girls, especially in rural areas.
22
Full participation in the labor market also depends on the ability of the economy to create
new jobs and absorb new entrants into the labor market. The evidence suggests that Cabo
Verde’s recent history of strong growth has had limited impact in terms of job creation at
national level. The tourism-related hotel and restaurant sector, for instance, which has grown
3.5 times faster than the overall economy since 2000, employed only 7.3 percent of the
population in the labor force in 2014. Going forward, growth strategies will need to be
particularly inclusive if they are to maximize the potential benefits of the demographic
transition.
Overall, this study concludes that limited female participation in the labor market constitutes
a significant loss of opportunity for Cabo Verde to grow, to improve people’s lives, and to
lift men as well as women out of poverty. With the aging of the population, the path that will
lead to the goal of Cabo Verde turning into a middle-income country by 2030 will inevitably
and in fact increasingly, include promoting gender equality on all economic, social, and
political fronts.
23
REFERENCES
Aguirre, DeAnne, Hoteit, Leila., Rupp, Christine., and Karim Sabbagh, 2012, “Empowering the
Third Billion, Women and the World of Work in 2012,” Strategy&.
Akiba, Tsunugi., Eoyang, Christopher., Matsui, Kathy., Suzuki, Hiromi., and Kazunori Tatebe,
2010, “Womenomics 3.0: The Time is Now,” Goldman Sachs, Japan: Portfolio Strategy
Research, October 1.
Akiba, Tsunugi., Matsui, Kathy., Suzuki, Hiromi., and Kazunori Tatebe, 2014, “Womenomics 4.0:
Time to Walk the Talk,” Goldman Sachs, Japan: Portfolio Strategy Research, May 30.
Bloom, Canning, David., David E., and Jaypee Sevilla, 2003, “The Demographic Dividend: A New
Perspective on the Economic Consequences of Population Change,” RAND.
Bloom, Canning, David., David E., Hu, Linlin., Mahal, Ajay., and Winnie Yip, 2010, “The
Contribution of Population Health and Demographic Change to Economic Growth in China
and India,” NIH Public Access Author Manuscript. Published in final edited form as Journal
of Comparative Economics. 2010 March 1; 38(1): 17-33.
Bloom, David E., and Jocelyn E. Finlay, 2008, “Demographic Change and Economic Growth in
Asia,” Harvard School of Public Health, Program on the Global Demography of Aging
Working Paper No.41 (September).
Clements, Benedict., Elborg-Woytek, Katrin., Fabrizio, Stefania., Kalpana, Kochhar., Kpodar,
Kangni., Newiak, Monique., Schwartz, Gerd., and Philippe Wingender, 2013, “Women,
Work, and the Economy: Macroeconomic Gains from Gender Equity,” IMF Staff Discussion
Note 13/10.
Daly, Kevin, 2007, Gender Inequality, Growth and Global Ageing, Goldman Sachs Global
Economics Paper No.154 (April).
Drummond, Paulo., Thakoor, Vimal., and Shu Yu, 2014, “Africa Rising: Harnessing the
Demographic Dividend.” IMF Working Paper 14/143.
Gonzales, Christian., Jain-Chandra, Sonali., Kochhar, Kalpan., and Monique Newiak, 2015, “Fair
Play: More Equal Laws Boost Female Labor Force Participation.” IMF Staff Discussion
Note 15/02.
Gordon, Robert J, 2012, “Is U.S. Economic Growth Over? Faltering Innovation Confronts the Six
Headwinds,” NBER Working Paper 18315.

24
ILO , 2015, Investing in Youth & Ensuring Decent Jobs to Harness the Demographic Dividend.
Remarks by Mr Aeneas C. Chuma ILO Regional Director for Africa at a Side on the
Occasion of the First-Ever World Youth Skills Day, during the Third International
Conference on Financing for Development. Accessed online on 18 October 2015 via:
http://www.ilo.org/global/topics/sdg-2030/3-fdd/WCMS_383435/lang--en/index.htm.
Instituto Nacional de Estatística de Cabo Verde, 2015, 2014, and 2013. Inquérito Multiobjectivo
Continuo
2014 and 2013, Estatísticas do Emprego e Mercado de Trabalho.
2012, Relatório do Modulo Uso do Tempo e Trabalho Não Remunerado.
2012, Projecções Demográficas de Cabo Verde, 2010-2030.
2007, Questionário Unificado de Indicadores Básicos de Bem-Estar (QUIBB).
2004. O Perfil da Pobreza em Cabo Verde: Inquérito das Despesas e das Receitas Familiares
(IDRF) 2001/2002.
Kane, Eileen, 2004, “Girls’ Education in Africa: What Do We Know About Strategies That Work?”
The World Bank Africa Region Human Development Working Paper Series (May).
Lawson, Sandra, 2008, “Women Hold Up Half the Sky,” Goldman Sachs Global Economic Paper
No: 164.
Manley, James, and Felipe Vasquez, 2013, “Childcare Availability and Female Labor Force
Participation: An Empirical Examination of the Chile Crece Contigo Program,” Towson
University Department of Economics Working Paper No. 2013‐03.
Marone, Heloisa, and Adalbert Nshimyumuremyi, 2014, “Cabo Verde Country Note,” for the
AfDB, OECD, and UNDP African Economic Outlook: Global Value Chains in Africa.
Matsui, Kathy., Suzuki, Hiromi., and Yoko Ushio, 1999, “Women-omics: Buy the Female
Economy,” Goldman Sachs, Japan: Portfolio Strategy Research, August 13.
Millennium Development Goals National Report for Cabo Verde, 2014, Unpublished.
Nakane, Masato., and Chad Steinberg, 2012, “Can Women Save Japan?” IMF Working Paper
12/248.
United Nations Economic Commission for Africa, African Union, African Development Bank and
United Nations Development Programme, 2015, MDG Report 2015: Assessing Progress in
Africa Toward the Millennium Development Goals.
World Economic Forum , 2015, The Global Gender Gap Report 2015.

25
World Bank, 2015, World Development Indicators.
World Bank, 2012, Toward Gender Equality in East Asia and the Pacific. East Asia and Pacific
Regional Report, Conference Edition.