
Demand recovery soft; over to 2HFY16 - Motilal Oswal · Demand recovery soft; over to 2HFY16 ......
20
Demand recovery soft; over to 2HFY16 Takeaways from interactions with 15 consumer companies and channel partners We present takeaways from our interactions with 15 corporates from the consumer sector at our conference and channel checks with distributors of several FMCG and retail companies in urban and rural markets: Common themes: 1) There hasn’t been any material pick-up in consumer demand. Deficient rainfall, lower rural wage growth, muted increase in Minimum Support Prices, liquidity crunch in some rural markets and overall sluggish consumer sentiments have kept the consumption demand in check. 2) Though gains from commodity cost correction have been robust, most of these gains will need to be reinvested in brand spends and trade promotions to drive demand if volume growth fails to revive. 3) Competitive intensity has been going up in some categories, though it is not a cause of concern yet as the nature of competition is still rational barring the aggressive price cuts in the shampoo category by P&G. 4) Some corporates are hopeful about demand revival in 2HFY16 due to sustained low inflation and expectations of interest rate cut. 5) Impact of poor monsoons is more on sentiments than on actual spending. Deflationary environment can impact FY17 earnings if volumes don’t recover: If volume growth does not recover and commodity prices remain benign (no inflation), FY17 earnings growth for most FMCG companies could take a hit. Absence of pricing growth will impact profitability if volumes do not recover as gains from commodity price deflation will be largely on the FY16 base, assuming no further material correction in input prices in FY17; the management of most companies expressed concerns over this scenario. Companies with strong pricing power and those that do not cut prices (Pidilite, ITC, Page, and Emami) will be better placed if this scenario plays out. Company-specific brief takeaways: Dabur and Emami have seen demand softening QoQ in 2QFY16. Dabur now expects FY16 volume growth to trend in the 6-10% band instead of the earlier guided 8-12%. Weak offtake of Zandu in Maharashtra and demand slowdown in UP is likely to impact Emami’s 2Q16 performance; the company also expects 16-17% organic revenue growth instead of the earlier guidance of 20%. Marico and GCPL have seen stable consumer demand and expect 2HY16 to be better due to urban demand recovery. Asian Paints has not seen any change in demand environment QoQ (12% volume growth in 1Q16). However, currency depreciation could offset some RM tailwind benefits. United Breweries does not expect double-digit volume growth anytime soon for the industry; some markets are doing well for UBL. Jyothy Labs has also indicated demand slowdown and believes it will take at least a year for growth rates to be restored. Page expects normalcy to return by 3Q16 as it has taken corrective measures. Shoppers Stop has guided for a healthy 9-10% same store sales growth for FY16. Consumer Sector Update | 24 September 2015 Gautam Duggad ([email protected]); +91 22 3982 5404 Manish Poddar ([email protected]); +91 22 3027 8029/ Vishal Punmiya ([email protected]) Investors are advised to refer through disclosures made at the end of the Research Report. Motilal Oswal research is available on www.motilaloswal.com/Institutional-Equities, Bloomberg, Thomson Reuters, Factset and S&P Capital. Company Pg. Consumer Asian Paints 3 Dabur India 4 Emami 5 Godrej Consumer 6 ITC 7 Jyothy Labs. 8 Marico 9 Page Inds. 10 Pidilite 11 United Breweries 12 Retails P C Jewellers 13 Shoppers Stop 14 Titan Inds. 15
Transcript of Demand recovery soft; over to 2HFY16 - Motilal Oswal · Demand recovery soft; over to 2HFY16 ......

24 September 2015 1
Consumer | The Return of Urban Consumer?
Demand recovery soft; over to 2HFY16 Takeaways from interactions with 15 consumer companies and channel partners
We present takeaways from our interactions with 15 corporates from the consumer sector at our conference and channel checks with distributors of several FMCG and retail companies in urban and rural markets: Common themes: 1) There hasn’t been any material pick-up in consumer demand. Deficient rainfall, lower rural wage growth, muted increase in Minimum Support Prices, liquidity crunch in some rural markets and overall sluggish consumer sentiments have kept the consumption demand in check. 2) Though gains from commodity cost correction have been robust, most of these gains will need to be reinvested in brand spends and trade promotions to drive demand if volume growth fails to revive. 3) Competitive intensity has been going up in some categories, though it is not a cause of concern yet as the nature of competition is still rational barring the aggressive price cuts in the shampoo category by P&G. 4) Some corporates are hopeful about demand revival in 2HFY16 due to sustained low inflation and expectations of interest rate cut. 5) Impact of poor monsoons is more on sentiments than on actual spending. Deflationary environment can impact FY17 earnings if volumes don’t recover: If volume growth does not recover and commodity prices remain benign (no inflation), FY17 earnings growth for most FMCG companies could take a hit. Absence of pricing growth will impact profitability if volumes do not recover as gains from commodity price deflation will be largely on the FY16 base, assuming no further material correction in input prices in FY17; the management of most companies expressed concerns over this scenario. Companies with strong pricing power and those that do not cut prices (Pidilite, ITC, Page, and Emami) will be better placed if this scenario plays out. Company-specific brief takeaways: Dabur and Emami have seen demand softening QoQ in 2QFY16. Dabur now expects FY16 volume growth to trend in the 6-10% band instead of the earlier guided 8-12%. Weak offtake of Zandu in Maharashtra and demand slowdown in UP is likely to impact Emami’s 2Q16 performance; the company also expects 16-17% organic revenue growth instead of the earlier guidance of 20%. Marico and GCPL have seen stable consumer demand and expect 2HY16 to be better due to urban demand recovery. Asian Paints has not seen any change in demand environment QoQ (12% volume growth in 1Q16). However, currency depreciation could offset some RM tailwind benefits. United Breweries does not expect double-digit volume growth anytime soon for the industry; some markets are doing well for UBL. Jyothy Labs has also indicated demand slowdown and believes it will take at least a year for growth rates to be restored. Page expects normalcy to return by 3Q16 as it has taken corrective measures. Shoppers Stop has guided for a healthy 9-10% same store sales growth for FY16.
Consumer
Sector Update | 24 September 2015
Gautam Duggad ([email protected]); +91 22 3982 5404
Manish Poddar ([email protected]); +91 22 3027 8029/ Vishal Punmiya ([email protected]) Investors are advised to refer through disclosures made at the end of the Research Report. Motilal Oswal research is available on www.motilaloswal.com/Institutional-Equities, Bloomberg, Thomson Reuters, Factset and S&P Capital.
Company Pg. Consumer
Asian Paints 3
Dabur India 4
Emami 5
Godrej Consumer 6
ITC 7
Jyothy Labs. 8
Marico 9
Page Inds. 10
Pidilite 11
United Breweries 12
Retails
P C Jewellers 13
Shoppers Stop 14
Titan Inds. 15

24 September 2015 2
Consumer | Sector Update
Distributor check takeaways: Our interactions with Cigarette distributor do not indicate any respite in cigarette volumes. Britannia’s Good Day re-launch has seen very encouraging response. We note that Britannia is growing at 20%+ in some of the Hindi-belt markets like Chhattisgarh, Madhya Pradesh, and Rajasthan. P&G’s growth rates have moderated, in line with the market. In the chocolates category, Dairy Milk Bubbly has evoked strong response with shortage in some markets. Earnings downgrade risk manifests: Demand recovery seems delayed even as hopes for 2HFY16 recovery in consumption are alive. We see downside risks to FY16 and FY17 earnings. While valuations have corrected, they are still expensive; this explains our largely cautious stance on the sector—only six BUYs in our universe of 18 stocks. In this price-deflationary environment, we continue to like ideas that are demonstrating healthy volume growth, good pricing power, healthy earnings visibility and turnaround potential. Britannia, Emami, United Spirits and Jubilant Foodworks continue to remain our preferred ideas.
Exhibit 1: FMCG growth rates have come off
Source: Company, MOSL
Exhibit 2: Rural-Urban gap expanded till FY15; but is now narrowing
Source: Company, MOSL
Exhibit 3: Led by demand deceleration in Urban
Source: Company, MOSL
Exhibit 4: Rural growth rates also moderated
Source: Company, MOSL
17.2 16.8 15.8
10.6
7.5
FY11 FY12 FY13 FY14 FY15
FMCG Industry growth (%)
-3.8
0.7
-0.7
4 5.8
FY11 FY12 FY13 FY14 FY15
Rural-Urban gap (%)
18.5 16.5 16
9.2
5.5
FY11 FY12 FY13 FY14 FY15
FMCG Urban Growth (%)
14.7
17.2 15.3
13.2 11.3
FY11 FY12 FY13 FY14 FY15
FMCG Rural Growth (%)

24 September 2015 3
Consumer | Sector Update
Asian Paints Key takeaways No material change in demand conditions QoQ. Some downtrading in Decorative Paints, but growth rate of Premium segment intact Premium and Mass segments are performing better than mid-premium
products. Premium segment has not seen any material change in growth rates—both 4Q15
and 1Q16 saw healthy performance. Lower-end products like “Putti” are growing faster; the segment has been doing
well for last few years. While rural is growing faster than urban, the gap is narrowing. Rural is
decelerating at the margin while urban is picking up slightly. Large urban markets like Mumbai and Bangalore have picked up recently.
Margin outlook bright; currency depreciation may offset some gains Input cost environment is benign/stable. Currency depreciation will, however,
offset some gains as 35-40% of raw material is imported. Ti02 has not seen a material correction, but solvent costs are dropping (MTO,
Ethylene-based solvents). Management believes 20%+ EBITDA margins unsustainable.
Miscellaneous Slowdown in property not a big concern as 90% of the demand comes from re-
painting. Automation in warehousing at plant and central distribution center. Total dealer base of 60k, out of which 35k are active. Looking at adding 1000-
1500 dealers per annum. In Faucets business (Ess Ess), the company is driving co-branding with Asian
Paints and has initiated it already in some markets of North and South. In Sleek, the company is focusing on getting the manufacturing right in terms of
order fulfillment and streamlining the manufacturing process.
Financial Snapshot (INR Billion) Y/E Mar 2015 2016E 2017E Sales 140.1 158.0 182.3
EBITDA 20.6 27.0 33.2 Adj. PAT 14.2 18.7 23.1 Adj. EPS (INR) 14.8 19.5 24.0
EPS Gr. (%) 15.8 31.4 23.4 BV/Sh.(INR) 49.4 58.6 70.7 RoE (%) 32.4 36.1 37.2
RoCE (%) 34.6 39.2 41.3 Payout (%) 41.1 42.3 42.4 Valuations
P/E (x) 54.3 41.4 33.5 P/BV (x) 16.3 13.8 11.4 EV/EBITDA (x) 36.9 27.9 22.4
Div. Yield (%) 0.9 1.2 1.5
Bloomberg APNT IN
Equity Shares (m) 959.2
M. Cap. (INR b)/(USD b) 773.1/11.7
52-Week Range (INR) 925/613
1,6,12 Rel Perf. (%) -4 / 9 / 29

24 September 2015 4
Consumer | Sector Update
Dabur Key takeaways Demand environment has softened QoQ, with earlier volume growth guidance of 8-12% now under threat. Double-digit volume growth unlikely in FY16 Liquidity crunch in rural and certain wholesale markets. Dabur has not seen any
improvement in market sentiments. Market growth is one of the slowest in 10-12 years. Dabur has been holding on
to its broader growth trajectory owing to its distribution expansion initiatives as indeed the portfolio expansion.
Demand has deteriorated a bit QoQ. As per the management, there is a threat to its earlier guidance of 8-12%. Volumes growth may stay in the 6-10% band and double-digit growth in FY16 seems unlikely.
2QFY16 will also be characterized by higher base and shifting in Diwali dates from October in last year to November this year (has some impact on Beverage portfolio due to Diwali gifting and inventory building prior to that).
International business: International segment is a mixed bag for Dabur. Currency and political
disturbance are impacting certain markets. Organic business is not doing well whereas Acquired businesses are performing
better. Namaste—while North America business is performing well, Africa is impacted
due to currency depreciation (manufactures in Chicago and sells in Africa).
Financial Snapshot (INR Billion) Y/E Mar 2015 2016E 2017E Sales 78.1 88.1 100.9 EBITDA 13.0 15.8 18.4 Adj. PAT 10.7 13.0 15.3
Adj. EPS (INR) 6.1 7.4 8.7 EPS Gr. (%) 15.7 22.2 17.1 BV/Sh.(INR) 19.1 23.5 28.6
RoE (%) 35.5 34.8 33.4 RoCE (%) 29.7 30.7 30.8 Payout (%) 37.0 35.0 35.0
Valuations P/E (x) 45.3 37.1 31.7 P/BV (x) 14.4 11.7 9.6
EV/EBITDA (x) 36.4 29.5 24.9 Div. Yield (%) 0.8 0.9 1.1
Bloomberg DABUR IN
Equity Shares (m) 1756.8
M. Cap. (INR b)/(USD b) 483.1/7.3
52-Week Range (INR) 317/196
1,6,12 Rel Perf. (%) 0 / 10 / 26

24 September 2015 5
Consumer | Sector Update
Emami Key takeaways
Overall demand environment continues to be soft, FY16 topline growth guidance lowered to 15-16% from 18-20%. Expect double-digit volume growth for FY16.
Majority of the portfolio doing well Broadly, the portfolio is doing well. Of the new launches, Fair & Handsome face
wash, Zandu Ultra Power, and 7 Oils in One is performing as per internal expectations. However, there is no material pick-up for “HE” and “SHE”.
Kesh King Kesh King is primarily an urban-centric brand (90% female usage; 40+ age
bracket) as compared to Navratna (70% male usage). Kesh King clocked INR3b in revenues in FY15 and the portfolio has gross margin
of 80% and EBITDA margin of 45%. Kesh King Oils is a premium product compared with other need-based oils in the market, with an MRP of INR140/100ml (2x the price of Navratna Oils).
HMN intends to focus on the oils category (INR2.4b) of the Kesh King portfolio. The company intends to launch new SKUs to enter the rural areas and to gain market share from competitors.
HMN expects 20-25% growth in the medium term from the Kesh King portfolio, primarily led by distribution expansion and increased spends behind the brands. However, FY16 would be impacted due to inventory filling in the channel.
Guidance HMN now expects revenue growth to be 15-16% for FY16, with double-digit
volume growth. The company plans to clock INR1b-1.2b from new brands annually.
Raw material environment is under check and HMN believes its portfolio can exercise pricing power if input costs turn inflationary. Expect advertisement and promotion spends at 18% of sales and PAT growth of 18-20% for FY16.
Expect dividend payout ratio to reduce to 25-30% as the focus will be on debt reduction.
Other key takeaways Emami has a policy to foray into categories that have 50%+ gross margin. Emami
is test marketing OTC Healthcare products in Hyderabad and expects to launch a few products nationwide in 2HFY16.
Financial Snapshot (INR Billion) Y/E Mar 2015 2016E 2017E Sales 22.2 28.6 34.6
EBITDA 5.4 7.8 9.7 NP 4.9 6.1 7.9 EPS (INR) 21.4 26.8 34.7
EPS Gr. (%) 20.7 25.2 29.7 BV/Sh. (INR) 54.2 69.2 88.1 RoE (%) 44.9 43.4 44.1
RoCE (%) 44.0 38.5 36.3 Payout (%) 32.7 40.2 38.0 Valuations
P/E (x) 51.0 40.7 31.4 P/BV (x) 20.1 15.7 12.4 EV/EBITDA (x) 44.7 32.6 25.8
Div. Yld (%) 0.7 1.0 1.2 EV/Sales (x) 10.8 8.8 7.2
Bloomberg HMN IN
Equity Shares (m) 227.0
M. Cap. (INR b)/(USD b) 248.8/3.8
52-Week Range (INR) 1368/661
1,6,12 Rel Perf. (%) -8 / 14 / 60

24 September 2015 6
Consumer | Sector Update
Godrej Consumer Key takeaways Market demand remains soft with gradual signs of improvement in urban, but rural is still sluggish. Structural gross margin expansion is one of the top priorities through revenue maximization and cost optimization. Portfolio Performance: Home Insecticides: HI portfolio will benefit from soft base and erratic monsoons.
GCPL is gaining market share in the category and NPD will aid the segment’s growth. Higher gross margin is partially being reinvested in A&P and distribution expansion. Fast Card is 10% of the overall portfolio, with margins higher than the Coils segment. The growth drivers for the category are coil converts, increase in usage and affordable price points.
Soaps: Soaps category has witnessed marginal increase in competitive activity, but it is not irrational like in Shampoos. Unorganized players have returned, but they haven’t had any material impact so far. Historically, GCPL has not leveraged brand equity of Cinthol; however, in the last two years, the segmenting strategy has done very well. GCPL is now looking to explore into adjacencies like body wash and face. For GCPL, Cinthol aids value growth while No. 1 aids in volume performance.
Hair Color: For GCPL, Crème is 1/3rd of the business. The company will be innovating and driving uptrading over the year.
International: 1) Indonesia: Portfolio consists of HI (45%), Wipes (15%) and Air Fresheners (35%). Expect low double-digit growth rates with slight margin expansion. 2) Africa: Foreign exchange is putting pressure on margins but GCPL is gaining incremental market share as importers are backing off. 3) LatAm: Growth rates for the region are improving. There has been a margin expansion, which will continue to improve—increased from 7-8% to 10% currently and GCPL is aiming at 12-13% in the medium term.
Distribution: The Urban:Rural split at 72:28, with modern trade forming 6-7% of sales (marginally moved up over the past three years from 4%). E-com is very small and the company is looking at exclusive distributors for different sites.
Foreign Exchange fluctuation: Currency depreciation is increasing the import bill, but the lower commodity cost is offsetting the same.
Financial Snapshot (INR Billion) Y/E Mar 2015 2016E 2017E Sales 82.8 95.1 112.1
EBITDA 13.7 17.3 21.4 Adj. PAT 9.1 11.9 14.9 Adj. EPS (INR) 26.7 34.8 43.7
EPS Gr. (%) 22.0 30.6 25.5 BV/Sh.(INR) 131.4 157.2 189.9 RoE (%) 21.4 24.1 25.2
RoCE (%) 18.9 21.6 23.7 Payout (%) 26.7 27.9 27.0 Valuations
P/E (x) 43.9 33.6 26.8 P/BV (x) 8.9 7.4 6.2 EV/EBITDA (x) 30.5 23.8 19.0
Div. Yield (%) 0.6 0.8 1.0
Bloomberg GCPL IN
Equity Shares (m) 340.5
M. Cap. (INR b)/(USD b) 400.4/6.0
52-Week Range (INR) 1457/830
1,6,12 Rel Perf. (%) -4 / 17 / 18
24 September 2015 7
Consumer | Sector Update
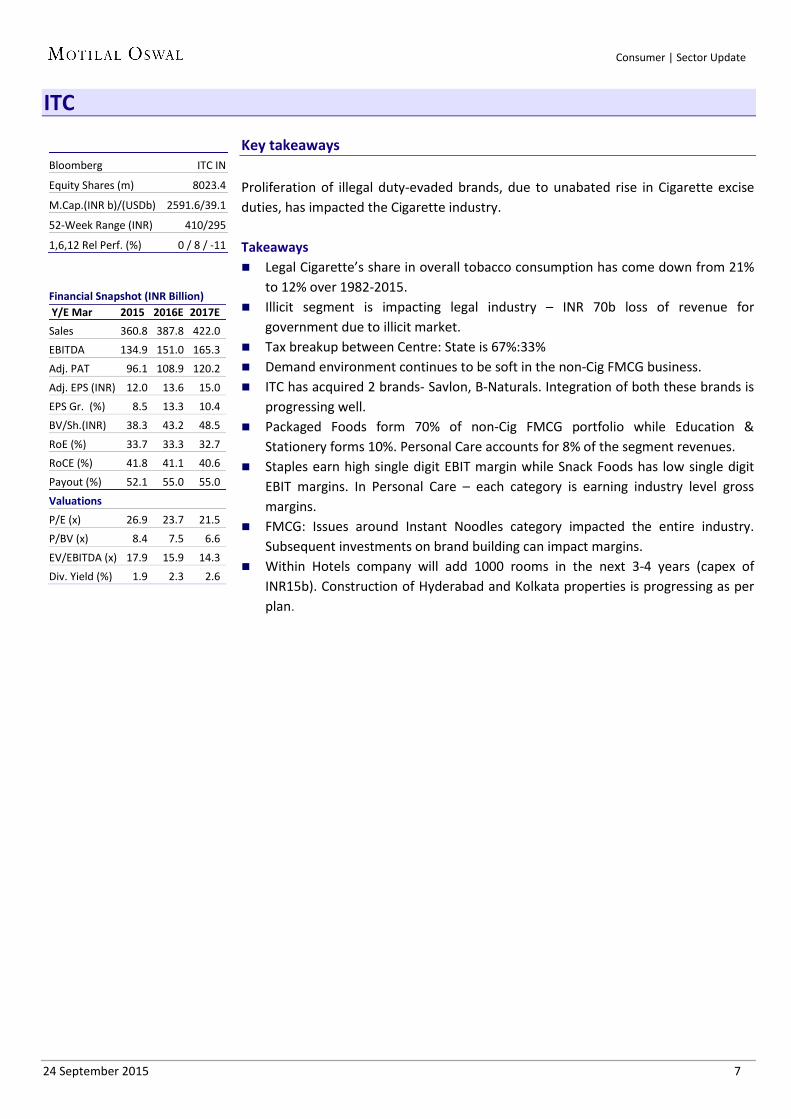
ITC Key takeaways Proliferation of illegal duty-evaded brands, due to unabated rise in Cigarette excise duties, has impacted the Cigarette industry. Takeaways Legal Cigarette’s share in overall tobacco consumption has come down from 21%
to 12% over 1982-2015. Illicit segment is impacting legal industry – INR 70b loss of revenue for
government due to illicit market. Tax breakup between Centre: State is 67%:33% Demand environment continues to be soft in the non-Cig FMCG business. ITC has acquired 2 brands- Savlon, B-Naturals. Integration of both these brands is
progressing well. Packaged Foods form 70% of non-Cig FMCG portfolio while Education &
Stationery forms 10%. Personal Care accounts for 8% of the segment revenues. Staples earn high single digit EBIT margin while Snack Foods has low single digit
EBIT margins. In Personal Care – each category is earning industry level gross margins.
FMCG: Issues around Instant Noodles category impacted the entire industry. Subsequent investments on brand building can impact margins.
Within Hotels company will add 1000 rooms in the next 3-4 years (capex of INR15b). Construction of Hyderabad and Kolkata properties is progressing as per plan.
Financial Snapshot (INR Billion) Y/E Mar 2015 2016E 2017E Sales 360.8 387.8 422.0 EBITDA 134.9 151.0 165.3 Adj. PAT 96.1 108.9 120.2
Adj. EPS (INR) 12.0 13.6 15.0 EPS Gr. (%) 8.5 13.3 10.4 BV/Sh.(INR) 38.3 43.2 48.5
RoE (%) 33.7 33.3 32.7 RoCE (%) 41.8 41.1 40.6 Payout (%) 52.1 55.0 55.0
Valuations P/E (x) 26.9 23.7 21.5 P/BV (x) 8.4 7.5 6.6
EV/EBITDA (x) 17.9 15.9 14.3 Div. Yield (%) 1.9 2.3 2.6
Bloomberg ITC IN
Equity Shares (m) 8023.4
M.Cap.(INR b)/(USDb) 2591.6/39.1
52-Week Range (INR) 410/295
1,6,12 Rel Perf. (%) 0 / 8 / -11

24 September 2015 8
Consumer | Sector Update
Jyothy Labs Key takeaways
Overall demand environment remains soft and JYL does not expect recovery in the near term and believes it will take a couple of quarters for growth to recover to previous trends. Price-led growth is absent and volume growth is unable to compensate for the same during such periods. Additionally, there is increased competitive intensity.
Portfolio Performance: Key segments’ growth has drops to single digits Ujala: JYL believes brand relevance needs to be kept high to increase product
penetration. The company has planned a new campaign to address the need. Detergents: Portfolio witnessing double-digit growth over the past few quarters;
the growth can be maintained over the next nine months. Henko Matic is growing better than the original Henko (previously had market share of 7%), which is an INR1.6b brand.
Dishwash: Bars category growth is down to 0-2% while liquids are posting 6-8% growth. This is the most sensitive category to a further slowdown. Exo is an INR3b brand.
Maxo: It is doing better than the market, but Coils is slowing down due to poor monsoon. Liquids have grown well and JYL has recently launched Fast Card, which will be taken to a pan-India level over the next few months. Maxo as a whole can continue to grow in double digits. Coils now forms 75% of the portfolio and Liquids is 25% (was 5% three years ago)
Margo: The brand posted 8-11% growth rate, which is decent in the given environment. The face wash didn't perform as per internal expectation and JYL has retraced the product offering from the market. Margo is an INR1.3b brand while Medimix is the market leader and posted sales of INR2.5b.
Profitability: About 75% of the overall profits are derived from Ujala (65%) and Margo (10%).
Guidance Revised revenue growth guidance to 8-10% versus the earlier 10-12%. Operating margins would not contract during FY16 (expect increase of 200bp)
inspite of slower topline growth—gross margin benefits (500bp) would be partially offset by higher A&P (200bp) and increased distribution expansion (100bp).
Distribution growth to be in line with sales growth (15%). JYL intends to dispose the land banks it has in industrial areas such as Ambatur (2
acres), Bhubhaneshwar (3 acres) and Karaikal (5 acres).
Bloomberg JYL IN
Equity Shares (m) 181.0
M. Cap. (INR b)/(USD b) 55.9/0.8
52-Week Range (INR) 342 /226
1,6,12 Rel Perf. (%) 12 / 22 / 31
Financial Snapshot (INR Billion) Y/E Mar 2015 2016E 2017E
Net Sales 15.1 17.1 19.6 EBITDA 1.6 2.1 2.7 Adj PAT 1.3 1.6 1.9
Adj PAT for 1.3 1.2 1.5 Adj.EPS (INR) 7.0 6.5 8.2 EPS Gr. (%) -0.1 0.3
BV/Sh (INR) 43.1 45.5 49.3 RoE (%) 16.8 20.2 22.4 RoCE (%) 9.6 13.6 18.5 Valuations
P/E (x) 43.9 47.4 37.6 P/BV (x) 7.2 6.8 6.3
EV/EBITDA 37.1 28.0 22.0 Div. Yield (%) 1.3 1.3 1.3

24 September 2015 9
Consumer | Sector Update
Marico Key takeaways Overall demand environment continues to be challenging, but rural growth has outpaced urban growth despite the erratic monsoons Expect urban demand to revive in 2HFY16 as a consequence of low inflation. Portfolio Performance Parachute: Expect volume growth of 6% to sustain going ahead. The medium-
term growth guidance remains in the 6-8% range. MRCO is not cutting prices in Parachute as copra prices are firming up again after falling from Jan 15 to July 15; however, it is running selective promotions.
Value Added Hair Oil (VAHO): VAHO category margins are better than Coconut Oil category—Shanti Amla is the largest (34% market share), though its margins are lower than the rest of the portfolio. MRCO is trying out a strategy of prototyping regional oil preferences to move consumer from unbranded to branded oil—a strategy similar to the approach adopted for Coconut Hair Oil category with Parachute. MRCO currently has three prototypes—Mustard oil in Rajasthan, Aloe Vera in Mumbai and Ayurvedic in south India. MRCO has been gaining market shares in almost all the VAHO segments—currently it is a distant #2 in Almond Oil, a close #2 in Amla and expecting to become profitable in Nihar Shanti Jasmine variant soon (which is currently in the investment phase).
Saffola Edible Oil is facing near-term challenges and currently performing lower than expected. To counter issues in Saffola, MRCO is trying new things such as introduction of low-price SKUs (the results of which are not very encouraging), differential pricing, regional promotions and improving the overall price-value proposition (not through price cuts but through improving upon the benefits).
Saffola Oats: Expect INR1.2b-1.25b of revenues for FY16 (FY15: INR0.8b). At INR2b, the segment will be able to contribute to the EBITDA.
International Business: 1) Bangladesh: Focusing Non-coconut Oil segment, which was 5% a few years ago and now forms 17-18% of the portfolio. Do not expect strong growth in FY16. 2) Vietnam: Muted consumer sentiments will result in muted growth for the next two quarters. 3) Middle East: Efficient communication and shift from single distributor in Egypt to four professional distributors could provide better control over secondary sales and significantly reduce their working capital.
Guidance MRCO reiterated that excess margin benefits will be re-invested into A&P. Expect
ad spends to be 17% of sales. Capex of INR1b for FY16 and FY17.
Financial Snapshot (INR Billion) Y/E Mar 2015 2016E 2017E Sales 57.2 64.5 74.6 EBITDA 8.6 10.6 13.2 Adj. PAT 5.7 7.0 8.8
Adj. EPS (INR) 8.9 10.9 13.6 EPS Gr. (%) 18.1 22.6 25.1 BV/Sh.(INR) 28.3 39.7 46.9
RoE (%) 36.0 32.1 31.5 RoCE (%) 35.6 35.3 35.2 Payout (%) 28.1 39.9 40.3
Valuation P/E (x) 44.4 36.2 29.0 P/BV (x) 14.0 9.9 8.4
EV/EBITDA (x) 29.6 23.4 18.5 Div. Yield (%) 0.6 1.1 1.4
Bloomberg MRCO IN
Equity Shares (m) 645.1
M. Cap. (INR b)/(USD b) 254.8/3.8
52-Week Range (INR) 466/277
1,6,12 Rel Perf. (%) 0 / 8 / 44

24 September 2015 10
Consumer | Sector Update
Page Industries Key takeaways The overall demand environment is satisfactory. One-time issues impacted Q1; demand should be normal by Q3FY16. Category takeaways Men’s Innerwear category: The category is ~INR75b in size, with Page having 20%
market share. Currently there are 12m customers within the target group and could expand to 60m in the medium term.
Competitive environment within men’s Innerwear category is muted, with organized players either closing shop or transferring baton to other players.
Leisurewear category is subdivided into Socks (4%), Thermalwear and Gymwear (largest). PAGE expects inventory/design changes brought within the Leisurewear category to stabilize by Q3FY16.
PAGE’s reach stands at 35,000 stores compared with competitors’ 100,000. The company believes its products could be marketed at 45,000 stores.
A distributor generally gets 11% margin and a retailer gets 22-28% depending on the product. EBO derive 25%-30% margin for product offering.
Top 10 cities contribute 40% to sales. Looking to foray into Kidswear category; expected by 2HFY16.
Guidance PAGE intends to increase its capacity to 230m pieces by 2019. It also intends to
outsource 30% of its production by 2020. PAGE’s product mix in the medium term will be Men (40%), Women (30%) and
Leisurewear (30%). Expect EBITDA margin to be in the 20-21% band. GST could lead to an increase in prices as PAGE will not be able to avail current
excise exemptions. Expect EBO count to increase to 300 by FY16 from 206.
Bloomberg PAG IN
Equity Shares (m) 11.2
M.Cap.(INRb)/(USDb) 149.6/2.3
52-Week Range (INR) 16995/7458
1,6,12 Rel Perf. (%) 0 / 1 / 71

24 September 2015 11
Consumer | Sector Update
Pidilite Key takeaways Demand environment Demand environment continues to be soft, with no material improvement QoQ. No divergence in demand patterns across regions, both urban and rural slowing
down. Guidance Gross margin in 1QFY16 fully reflect the reduction in input costs. PIDI is not
looking at any price cut; historically speaking, price cut was taken only once in the last seven years (in 2009) due to substantial RM price correction.
Creation of new adjacent categories will be the medium-term growth driver for PIDI.
Construction Chemicals segment could equal Fevicol sales in the medium term. The segment has witnessed slowdown in the last 12 months; however, it posted 25% CAGR over the last four years.
Ten-year tax holiday will be end in three units in Himachal Pradesh; going ahead, 1QFY16 tax rate will be a representative for the full year.
No need to augment capacities, given the current growth rates. On FY16 basis, capex should be ~INR1b—same as FY15 (assuming no acquisition).
Other key takeaways Fevicol forms 25% of PIDI’s revenues and over the years the company’s strategy
has been to branch into sub-categories under the Fevicol brand— Fevicol Marine, Fevicol Hyper, etc.
Fevicol posted 10-11% growth in FY15, mainly led by 6-7% volume growth, but also by pricing.
Pidilite product portfolio is not that elastic as far as pricing in concerned. PIDI recently acquired Bluecoat business for INR2.6b and its integration is
progressing well.
Financial Snapshot (INR Billion) Y/E Mar 2015 2016E 2017E Sales 44.1 49.5 57.8 EBITDA 7.7 10.4 12.0 Adj. PAT 5.2 6.9 8.0
Adj. EPS (INR) 10.1 13.5 15.7 EPS Gr. (%) 9.3 33.0 16.5 BV/Sh.(INR) 45.8 61.2 71.4
RoE (%) 23.7 25.2 23.7 RoCE (%) 29.3 32.7 30.7 Payout (%) 0.0 35.5 36.0
Valuations P/E (x) 54.7 41.1 35.3 P/BV (x) 12.1 9.1 7.8
EV/EBITDA (x) 36.0 26.1 22.2 Div. Yield (%) 0.0 0.9 1.0
Bloomberg PIDI IN
Equity Shares (m) 512.7
M. Cap. (INR b)/(USD b) 284/4.3
52-Week Range (INR) 638/376
1,6,12 Rel Perf. (%) 1 / -2 / 43

24 September 2015 12
Consumer | Sector Update
United Breweries Key takeaways Industry growth remains weak owing to sluggish macros The beer industry continues to witness muted demand, led by broader slowdown
in the macro environment. Different regions are exhibiting divergent consumption patterns, with key states such as Andhra Pradesh and Karnataka posting flat growth and Maharashtra exhibiting sluggish growth.
Key driver for beer industry growth is linked to GDP growth. Volumes grow 1.5x of GDP growth in the long term. UB has witnessed a 5% price increase per annum, historically.
The industry is not witnessing any shift from IMFL/IMIL categories to beer industry, as per the management.
The Premium segment in the beer market is growing, but is relatively small in size. Breakeven point for the beer industry is higher than other industries (spirits and
soft drinks). Guidance UB does not expect double-digit volume growth for the beer industry in the
medium term. Capex of INR3.5b in FY16. Exclusion of beer industry from the GST framework could impact the financial
performance. The All India Brewers' Association is pushing for tax rates based on the alcohol content of the drinks, which will lead to beer companies paying lower excise than spirit companies.
Other key takeaways UB generally takes pricing actions as and when possible, preferably in Feb-Mar.
Beer industry received double-digit price hike in Telangana (Feb 2015) and Andhra Pradesh (April 2015).
UB derives 65% of sales from controlled states. Kingfisher Ultra is doing well (currently forms only 2% of total volumes).

24 September 2015 13
Consumer | Sector Update
PC Jeweller Key takeaways Demand environment Demand environment is stable. Competition In the next 5-7 years, the regional barriers among jewelry players are expected to
break down. PCJ is looking to open a store in east India while east-based players like PC Chandra Jewelers are moving toward north.
While most of the south-based jewelers purchase local jewelry to meet local demand and taste, PCJ manufactures majority of its gold jewelry in-house.
The company currently has ~65% in-house gold manufacturing, which is expected to go up to 80% in the near future. PCJ is planning to set up one of the largest manufacturing units (with a land area of around 100 acres) in the world with an investment of around INR2b-2.5b.
The company does not have any store in Chennai and Kerala due to hyper-competitive nature of the markets.
Other key points PCJ has only two stores in south India, one in Hyderabad and the other in
Mangalore. The Hyderabad store is struggling, according to the management. 25-30% of PCJ revenue comes from exports, which is aimed at NRIs (exports have
gross margin of around 8% and PBT margin of 6%). The percentage of exports to revenue is likely to come down as PCJ doesn’t see any growth in the segment.
Blended working capital cycle is between 180 and 220 days.
Bloomberg PCJL IN
Equity Shares (m) 179.1
M. Cap. (INR b)/(USD b) 62/0.9
52-Week Range (INR) 494/165
1,6,12 Rel Perf. (%) 0 / 15 / 68

24 September 2015 14
Consumer | Sector Update
Shoppers Stop Key takeaways
The overall demand environment continues to be soft, with no material divergence across regions. Expect 9-10% SSG for FY16. Key takeaways Broader demand patterns still soft. North and west are doing well while south
continues to be a laggard. There is no material difference in tier 1 and tier 2 regions.
SHOP is posting double-digit growth in non-metros due to small base. Store breakeven time has now stretched to 24 months from the earlier 18. Shoppers Stop has tied up with E-commerce players (terms of trade involve
50:50 profit sharing). The company generates ~20-22% of sales from discounts. Key difference in Omnichannel strategy and E-commerce is the option of “Click
and collect” in the former. Within HyperCITY, recent trends were better than the 1QFY16 performance.
Guidance SSG could post 10-12% in the medium term. SHOP intends to take private label share from the current 15%+2% (exclusive
brands) to 25%+10% in three years. The company has created a separate P&L and recruited a new CEO for the private label vertical. Every 20bp increase in private brand will result in a 40bp margin increase.
Expect operating margin of 8% by FY18 from the existing 5%—100 bp each from topline growth, mix improvement and cost containment.
E-commerce forms 1% of sales and SHOP intends to take it to 10% in the next three years. SHOP will witness higher spends in the next few months, given the increased online play.
Capex of INR1.3b in FY16 and INR1b in FY17 for Shoppers Stop (standalone entity).
In HyperCITY, the company is looking for external partner. SHOP also has property option of INR1.8b-INR2b, which it looks to exercise in the next 18-24 months.
Financial Snapshot (INR Billion) Y/E Mar 2015 2016E 2017E Sales 30.4 35.0 41.3 EBITDA 1.9 2.2 2.7 Adj. PAT 0.4 0.5 0.8
Adj. EPS (INR) 4.9 6.4 9.3 EPS Gr. (%) 7.9 31.6 44.8 BV/Sh.(INR) 93.1 97.0 104.2
RoE (%) 5.3 6.7 9.1 RoCE (%) 8.0 9.3 11.3 Payout (%) 15.3 20.0 20.0
Valuations P/E (x) 77.7 59.1 40.8 P/BV (x) 4.1 3.9 3.6
EV/EBITDA (x) 17.1 15.0 12.4 Div. Yield (%) 0.2 0.3 0.5
Bloomberg SHOP IN
Equity Shares (m) 83.4
M. Cap. (INR b)/(USD b) 31.7/0.5
52-Week Range (INR) 624/301
1,6,12 Rel Perf. (%) 4 / -2 / -23
24 September 2015 15
Consumer | Sector Update
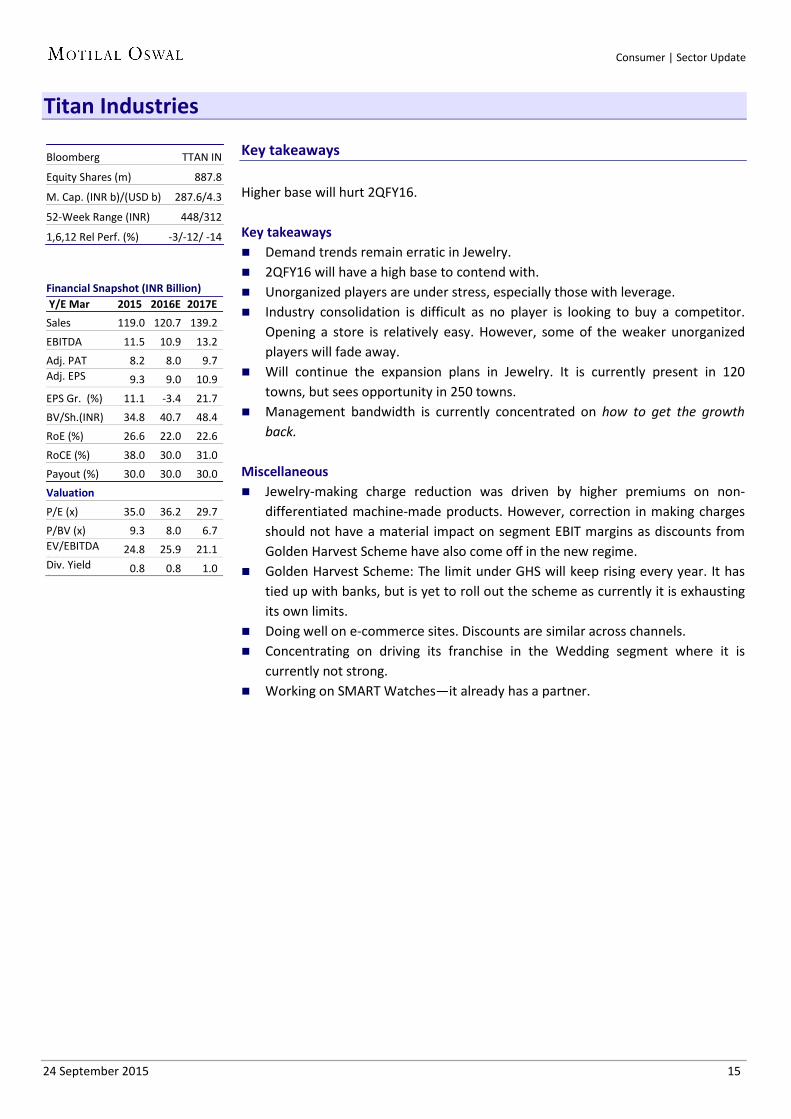
Titan Industries Key takeaways Higher base will hurt 2QFY16. Key takeaways Demand trends remain erratic in Jewelry. 2QFY16 will have a high base to contend with. Unorganized players are under stress, especially those with leverage. Industry consolidation is difficult as no player is looking to buy a competitor.
Opening a store is relatively easy. However, some of the weaker unorganized players will fade away.
Will continue the expansion plans in Jewelry. It is currently present in 120 towns, but sees opportunity in 250 towns.
Management bandwidth is currently concentrated on how to get the growth back.
Miscellaneous Jewelry-making charge reduction was driven by higher premiums on non-
differentiated machine-made products. However, correction in making charges should not have a material impact on segment EBIT margins as discounts from Golden Harvest Scheme have also come off in the new regime.
Golden Harvest Scheme: The limit under GHS will keep rising every year. It has tied up with banks, but is yet to roll out the scheme as currently it is exhausting its own limits.
Doing well on e-commerce sites. Discounts are similar across channels. Concentrating on driving its franchise in the Wedding segment where it is
currently not strong. Working on SMART Watches—it already has a partner.
Financial Snapshot (INR Billion) Y/E Mar 2015 2016E 2017E Sales 119.0 120.7 139.2
EBITDA 11.5 10.9 13.2 Adj. PAT 8.2 8.0 9.7 Adj. EPS ( )
9.3 9.0 10.9
EPS Gr. (%) 11.1 -3.4 21.7 BV/Sh.(INR) 34.8 40.7 48.4 RoE (%) 26.6 22.0 22.6
RoCE (%) 38.0 30.0 31.0 Payout (%) 30.0 30.0 30.0 Valuation
P/E (x) 35.0 36.2 29.7 P/BV (x) 9.3 8.0 6.7 EV/EBITDA ( )
24.8 25.9 21.1 Div. Yield (%)
0.8 0.8 1.0
Bloomberg TTAN IN
Equity Shares (m) 887.8
M. Cap. (INR b)/(USD b) 287.6/4.3
52-Week Range (INR) 448/312
1,6,12 Rel Perf. (%) -3/-12/ -14

24 September 2015 16
Consumer | Sector Update
Exhibit 5: Volume growth trends across categories Quarter Ending Jun-13 Sep-13 Dec-13 Mar-14 Jun-14 Sep-14 Dec-14 Mar-15 Jun-15 Asian Paints 10.0 12.0 7.0 12.0 11.0 10.0 3.0 4.0 10.0 Colgate (Toothpaste) 11.0 9.0 11.0 7.0 5.0 7.0 5.0 5.0 2.0 Dabur 9.0 10.7 9.0 9.2 8.3 8.7 7.4 8.1 8.1 Emami 6.0 6.0 1.5 -10.0 12.5 11.5 11.0 12.0 15.0 Godrej Consumer Soaps 7.0 4.0 6.0 -4.0 -MSD LSD LSD 5.0 DD GSK Consumer 7.0 10.0 11.0 8.0 3.0 2.0 5.0 2.0 2.0 Hindustan Unilever 4.0 5.0 4.0 3.0 5.0 5.0 3.0 6.0 6.0 ITC (cigarette) -2.0 -4.0 -2.0 -3.0 -2.5 -4.0 -13.0 -12.0 -17.0 Marico Parachute 4.0 1.0 2.0 10.0 6.0 7.0 8.0 5.0 8.0 Hair Oil 16.0 15.0 8.0 5.0 11.0 13.0 10.0 5.0 14.0 Saffola 10.0 7.0 9.0 11.0 10.0 9.0 3.0 -1.0 4.0 Pidilite 7.5 15.0 11.0 12.0 13.0 10.0 7.0 5.5 5.0 Radico Khaitan 7.6 7.2 9.9 3.5 -3.5 -3.9 -5.6 -4.2 -10.3
Source: Company, MOSL
Exhibit 6: Sales growth stood at 2.5% in 1QFY16
Source: Company, MOSL
Exhibit 7: … while PAT growth stood at 10.5%
Source: Company, MOSL
Exhibit 8: Consumer sector PE (x)
Source: Company, MOSL
Exhibit 9: Consumer PE relative to Sensex PE (%)
Source: Company, MOSL
15.0
16.7
16.4
13.6
12.4
12.0
12.5
12.8
14.2
12.3
7.4
6.7
2.5
June
-12
Sep-
12
Dec-
12
Mar
-13
Jun-
13
Sep-
13
Dec-
13
Mar
-14
Jun-
14
Sep-
14
Dec-
14
Mar
-15
Jun-
15
Sales Growth (%)
23.9
15.1
17.9
18.0
14.6
18.7
16.1
13.4
11.3
12.1
11.6
13.2
10.5
June
-12
Sep-
12
Dec-
12
Mar
-13
Jun-
13
Sep-
13
Dec-
13
Mar
-14
Jun-
14
Sep-
14
Dec-
14
Mar
-15
Jun-
15
PAT Growth(%)
25.5
18.0
31.9 26.8
12.0
22.0
32.0
42.0
Sep-
05
Dec-
06
Mar
-08
Jun-
09
Sep-
10
Dec-
11
Mar
-13
Jun-
14
Sep-
15
Consumer Sector PE (x) LPA (x)
2.7
128.9 108.6
66.3
-15
40
95
150
Sep-
05
Dec-
06
Mar
-08
Jun-
09
Sep-
10
Dec-
11
Mar
-13
Jun-
14
Sep-
15
Consumer PE Relative to Sensex PE (%)

24 September 2015 17
Consumer | Sector Update
Exhibit 10: Consumer sector PB (x)
Source: Company, MOSL
Exhibit 11: Consumer PB relative to Sensex PB (%)
Source: Company, MOSL
Exhibit 12: Consumer sector EV/EBITDA (x)
Source: Company, MOSL
Exhibit 13: Valuation Matrix of coverage universe
Company Reco Price Mkt Cap
(USD M) EPS Growth YoY (%) P/E (x) EV/EBITDA (x) ROE (%) Div. (%)
(INR) FY15 FY16E FY17E FY15 FY16E FY17E FY15 FY16E FY17E FY15 FY15 Consumer Asian Paints Buy 806 11,675 15.8 31.4 23.4 54.3 41.4 33.5 36.9 27.9 22.4 32.4 0.9 Britannia Buy 2,882 5,198 45.1 50.7 21.6 60.2 39.9 32.8 43.5 27.4 22.1 56.4 0.6 Colgate Neutral 952 3,910 13.9 11.7 27.8 46.3 41.5 32.4 30.9 26.8 21.0 81.6 1.3 Dabur Neutral 275 7,291 15.7 22.2 17.1 45.3 37.1 31.6 36.4 29.5 24.9 35.5 0.8 Emami Buy 1,096 3,756 20.7 25.2 29.7 51.2 40.9 31.6 45.9 32.8 26.0 44.9 0.7 Godrej Consumer Neutral 1,176 6,041 22.0 30.6 25.6 44.1 33.8 26.9 31.8 25.1 20.6 21.4 0.6 GSK Consumer Neutral 6,104 3,876 -13.5 23.2 20.5 44.0 35.7 29.6 32.5 25.4 20.8 29.6 0.9 Hind. Unilever Neutral 781 25,529 6.4 15.3 19.1 44.7 38.7 32.5 32.0 26.8 22.5 108.1 1.9 ITC Neutral 323 39,052 8.5 13.3 10.4 26.9 23.8 21.5 18.0 15.9 14.4 33.7 1.9 Jyothy Labs Buy 309 845 48.7 -7.5 26.1 44.0 47.5 37.7 37.1 28.0 22.0 16.8 1.3 Marico Neutral 395 3,844 18.1 22.6 25.1 44.4 36.2 29.0 29.6 23.4 18.5 36.0 0.6 Nestle Neutral 6,203 9,030 6.8 -13.1 21.3 47.6 54.8 45.2 28.4 31.6 26.8 48.2 1.0 Pidilite Inds. Neutral 554 4,286 9.9 32.3 16.6 54.4 41.1 35.3 36.0 26.1 22.2 23.1 0.6 Radico Khaitan Buy 83 166 -10.4 8.6 21.8 14.6 13.4 11.0 10.9 9.2 7.7 8.6 1.0 United Spirits Buy 3,097 6,795 Loss -165.6 82.2 -65.7 100.1 54.9 63.6 47.2 32.4 -21.7 0.0 Retail
Jubilant Foodworks Buy 1,613 1,593 -6.2 46.7 58.7 95.2 64.9 40.9 40.9 29.6 19.6 17.2 0.2 Shopper's Stop Neutral 380 471 7.9 31.6 44.8 77.7 59.1 40.8 17.3 15.2 12.5 5.3 0.2 Titan Company Neutral 324 4,346 11.1 -3.4 21.7 35.0 36.2 29.7 24.8 25.9 21.1 26.6 0.9
Note: For Nestle FY15 means CY14 Source: Company, MOSL
8.5
6.4
11.3 9.2
3.0
7.0
11.0
15.0
Sep-
05
Dec-
06
Mar
-08
Jun-
09
Sep-
10
Dec-
11
Mar
-13
Jun-
14
Sep-
15
Consumer Sector PB (x) LPA (x)
108.8
410.5
349.3
245.3
80
210
340
470
Sep-
05
Dec-
06
Mar
-08
Jun-
09
Sep-
10
Dec-
11
Mar
-13
Jun-
14
Sep-
15
Consumer PB Relative to Sensex PB (%)
17.0
11.6
21.7 17.8
8.0
16.0
24.0
32.0
Sep-
05
Dec-
06
Mar
-08
Jun-
09
Sep-
10
Dec-
11
Mar
-13
Jun-
14
Sep-
15
Consumer Sector EV/EBDITA (x) LPA (x)

24 September 2015 18
Consumer | Sector Update
N O T E S

24 September 2015 19
Consumer | Sector Update
Consumer Gallery

24 September 2015 20
Consumer | Sector Update
Disclosures This document has been prepared by Motilal Oswal Securities Limited (hereinafter referred to as Most) to provide information about the company(ies) and/sector(s), if any, covered in the report and may be distributed by it and/or its affiliated company(ies). This report is for personal information of the selected recipient/s and does not construe to be any investment, legal or taxation advice to you. This research report does not constitute an offer, invitation or inducement to invest in securities or other investments and Motilal Oswal Securities Limited (hereinafter referred as MOSt) is not soliciting any action based upon it. This report is not for public distribution and has been furnished to you solely for your general information and should not be reproduced or redistributed to any other person in any form. This report does not constitute a personal recommendation or take into account the particular investment objectives, financial situations, or needs of individual clients. Before acting on any advice or recommendation in this material, investors should consider whether it is suitable for their particular circumstances and, if necessary, seek professional advice. The price and value of the investments referred to in this material and the income from them may go down as well as up, and investors may realize losses on any investments. Past performance is not a guide for future performance, future returns are not guaranteed and a loss of original capital may occur.
MOSt and its affiliates are a full-service, integrated investment banking, investment management, brokerage and financing group. We and our affiliates have investment banking and other business relationships with a some companies covered by our Research Department. Our research professionals may provide input into our investment banking and other business selection processes. Investors should assume that MOSt and/or its affiliates are seeking or will seek investment banking or other business from the company or companies that are the subject of this material and that the research professionals who were involved in preparing this material may educate investors on investments in such business. The research professionals responsible for the preparation of this document may interact with trading desk personnel, sales personnel and other parties for the purpose of gathering, applying and interpreting information. Our research professionals are paid on the profitability of MOSt which may include earnings from investment banking and other business.
MOSt generally prohibits its analysts, persons reporting to analysts, and members of their households from maintaining a financial interest in the securities or derivatives of any companies that the analysts cover. Additionally, MOSt generally prohibits its analysts and persons reporting to analysts from serving as an officer, director, or advisory board member of any companies that the analysts cover. Our salespeople, traders, and other professionals or affiliates may provide oral or written market commentary or trading strategies to our clients that reflect opinions that are contrary to the opinions expressed herein, and our proprietary trading and investing businesses may make investment decisions that are inconsistent with the recommendations expressed herein. In reviewing these materials, you should be aware that any or all of the foregoing among other things, may give rise to real or potential conflicts of interest. MOSt and its affiliated company(ies), their directors and employees and their relatives may; (a) from time to time, have a long or short position in, act as principal in, and buy or sell the securities or derivatives thereof of companies mentioned herein. (b) be engaged in any other transaction involving such securities and earn brokerage or other compensation or act as a market maker in the financial instruments of the company(ies) discussed herein or act as an advisor or lender/borrower to such company(ies) or may have any other potential conflict of interests with respect to any recommendation and other related information and opinions.; however the same shall have no bearing whatsoever on the specific recommendations made by the analyst(s), as the recommendations made by the analyst(s) are completely independent of the views of the affiliates of MOSt even though there might exist an inherent conflict of interest in some of the stocks mentioned in the research report Reports based on technical and derivative analysis center on studying charts company's price movement, outstanding positions and trading volume, as opposed to focusing on a company's fundamentals and, as such, may not match with a report on a company's fundamental analysis. In addition MOST has different business segments / Divisions with independent research separated by Chinese walls catering to different set of customers having various objectives, risk profiles, investment horizon, etc, and therefore may at times have different contrary views on stocks sectors and markets.
Unauthorized disclosure, use, dissemination or copying (either whole or partial) of this information, is prohibited. The person accessing this information specifically agrees to exempt MOSt or any of its affiliates or employees from, any and all responsibility/liability arising from such misuse and agrees not to hold MOSt or any of its affiliates or employees responsible for any such misuse and further agrees to hold MOSt or any of its affiliates or employees free and harmless from all losses, costs, damages, expenses that may be suffered by the person accessing this information due to any errors and delays. The information contained herein is based on publicly available data or other sources believed to be reliable. Any statements contained in this report attributed to a third party represent MOSt’s interpretation of the data, information and/or opinions provided by that third party either publicly or through a subscription service, and such use and interpretation have not been reviewed by the third party. This Report is not intended to be a complete statement or summary of the securities, markets or developments referred to in the document. While we would endeavor to update the information herein on reasonable basis, MOSt and/or its affiliates are under no obligation to update the information. Also there may be regulatory, compliance, or other reasons that may prevent MOSt and/or its affiliates from doing so. MOSt or any of its affiliates or employees shall not be in any way responsible and liable for any loss or damage that may arise to any person from any inadvertent error in the information contained in this report. MOSt or any of its affiliates or employees do not provide, at any time, any express or implied warranty of any kind, regarding any matter pertaining to this report, including without limitation the implied warranties of merchantability, fitness for a particular purpose, and non-infringement. The recipients of this report should rely on their own investigations.
This report is intended for distribution to institutional investors. Recipients who are not institutional investors should seek advice of their independent financial advisor prior to taking any investment decision based on this report or for any necessary explanation of its contents.
Most and it’s associates may have managed or co-managed public offering of securities, may have received compensation for investment banking or merchant banking or brokerage services, may have received any compensation for products or services other than investment banking or merchant banking or brokerage services from the subject company in the past 12 months. Most and it’s associates have not received any compensation or other benefits from the subject company or third party in connection with the research report. Subject Company may have been a client of Most or its associates during twelve months preceding the date of distribution of the research report
MOSt and/or its affiliates and/or employees may have interests/positions, financial or otherwise of over 1 % at the end of the month immediately preceding the date of publication of the research in the securities mentioned in this report. To enhance transparency, MOSt has incorporated a Disclosure of Interest Statement in this document. This should, however, not be treated as endorsement of the views expressed in the report.
Motilal Oswal Securities Limited is registered as a Research Analyst under SEBI (Research Analyst) Regulations, 2014. SEBI Reg. No. INH000000412
There are no material disciplinary action that been taken by any regulatory authority impacting equity research analysis activities
Analyst Certification The views expressed in this research report accurately reflect the personal views of the analyst(s) about the subject securities or issues, and no part of the compensation of the research analyst(s) was, is, or will be directly or indirectly related to the specific recommendations and views expressed by research analyst(s) in this report. The research analysts, strategists, or research associates principally responsible for preparation of MOSt research receive compensation based upon various factors, including quality of research, investor client feedback, stock picking, competitive factors and firm revenues
Disclosure of Interest Statement Companies where there is interest Analyst ownership of the stock No Served as an officer, director or employee No
A graph of daily closing prices of securities is available at www.nseindia.com and http://economictimes.indiatimes.com/markets/stocks/stock-quotes
Regional Disclosures (outside India) This report is not directed or intended for distribution to or use by any person or entity resident in a state, country or any jurisdiction, where such distribution, publication, availability or use would be contrary to law, regulation or which would subject MOSt & its group companies to registration or licensing requirements within such jurisdictions.
For U.S. Motilal Oswal Securities Limited (MOSL) is not a registered broker - dealer under the U.S. Securities Exchange Act of 1934, as amended (the"1934 act") and under applicable state laws in the United States. In addition MOSL is not a registered investment adviser under the U.S. Investment Advisers Act of 1940, as amended (the "Advisers Act" and together with the 1934 Act, the "Acts), and under applicable state laws in the United States. Accordingly, in the absence of specific exemption under the Acts, any brokerage and investment services provided by MOSL, including the products and services described herein are not available to or intended for U.S. persons.
This report is intended for distribution only to "Major Institutional Investors" as defined by Rule 15a-6(b)(4) of the Exchange Act and interpretations thereof by SEC (henceforth referred to as "major institutional investors"). This document must not be acted on or relied on by persons who are not major institutional investors. Any investment or investment activity to which this document relates is only available to major institutional investors and will be engaged in only with major institutional investors. In reliance on the exemption from registration provided by Rule 15a-6 of the U.S. Securities Exchange Act of 1934, as amended (the "Exchange Act") and interpretations thereof by the U.S. Securities and Exchange Commission ("SEC") in order to conduct business with Institutional Investors based in the U.S., MOSL has entered into a chaperoning agreement with a U.S. registered broker-dealer, Motilal Oswal Securities International Private Limited. ("MOSIPL"). Any business interaction pursuant to this report will have to be executed within the provisions of this chaperoning agreement.
The Research Analysts contributing to the report may not be registered /qualified as research analyst with FINRA. Such research analyst may not be associated persons of the U.S. registered broker-dealer, MOSIPL, and therefore, may not be subject to NASD rule 2711 and NYSE Rule 472 restrictions on communication with a subject company, public appearances and trading securities held by a research analyst account.
For Singapore Motilal Oswal Capital Markets Singapore Pte Limited is acting as an exempt financial advisor under section 23(1)(f) of the Financial Advisers Act(FAA) read with regulation 17(1)(d) of the Financial Advisors Regulations and is a subsidiary of Motilal Oswal Securities Limited in India. This research is distributed in Singapore by Motilal Oswal Capital Markets Singapore Pte Limited and it is only directed in Singapore to accredited investors, as defined in the Financial Advisers Regulations and the Securities and Futures Act (Chapter 289), as amended from time to time. In respect of any matter arising from or in connection with the research you could contact the following representatives of Motilal Oswal Capital Markets Singapore Pte Limited: Kadambari Balachandran Email : [email protected] Contact : (+65) 68189233 / 65249115 Office Address : 21 (Suite 31),16 Collyer Quay,Singapore 04931
Motilal Oswal Securities Ltd
Motilal Oswal Tower, Level 9, Sayani Road, Prabhadevi, Mumbai 400 025 Phone: +91 22 3982 5500 E-mail: [email protected]


![î ì r î ífisheries.ahdbihar.in/District/AURANGABAD.pdfDemand [Rs. 2016-17 Recovery Recovery Demand [Rs. 2017-18 Recovery Recovery [0/0] Demand [Rs. 2018-19 Recovery 000] Recovery](https://static.fdocuments.us/doc/165x107/603a5853b3cb7915986a8890/-r-demand-rs-2016-17-recovery-recovery-demand-rs-2017-18-recovery.jpg)
