Dell PowerEdge Blades Outperform Cisco UCS in East-West … · 2020-03-02 · Dell PowerEdge Blades...
16
This white paper compares the performance of blade-to-blade network traffic between two enterprise blade solutions: the Dell PowerEdge M1000e versus Cisco UCS. Brian Bassett Solutions Performance Analysis Dell | Enterprise Solutions Group Dell PowerEdge Blades Outperform Cisco UCS in East-West Network Performance
Transcript of Dell PowerEdge Blades Outperform Cisco UCS in East-West … · 2020-03-02 · Dell PowerEdge Blades...

This white paper compares the performance of blade-to-blade
network traffic between two enterprise blade solutions: the
Dell PowerEdge M1000e versus Cisco UCS.
Brian Bassett Solutions Performance Analysis Dell | Enterprise Solutions Group
Dell PowerEdge Blades Outperform Cisco UCS in East-West Network Performance

Dell PowerEdge Blades Outperform Cisco UCS in East-West Network Performance
ii
Contents
Executive summary ................................................................................................................................................... 4
Introduction ................................................................................................................................................. 4
Key findings .................................................................................................................................................. 4
Methodology ............................................................................................................................................... 5
Solution configuration.............................................................................................................................................. 6
Test 1: Virtual machine migration ........................................................................................................................ 10
Test 2: Round trip time measurements using Netperf ...................................................................................... 11
Price ............................................................................................................................................................................12
Summary ....................................................................................................................................................................13
Appendix A — Test hardware configurations ..................................................................................................... 14
Appendix B — Firmware and software revisions ................................................................................................. 15
Appendix C — Test methodology ........................................................................................................................ 16
Cisco UCS test setup ................................................................................................................................ 16
Dell PowerEdge test setup ...................................................................................................................... 16
Tables
Table 1. Enclosure hardware comparison ................................................................................................... 14
Table 2. Blade hardware comparison ........................................................................................................... 14
Table 3. External component comparison ................................................................................................... 14
Table 4. Firmware and software revisions ..................................................................................................... 15
Figures
Figure 1. Cisco UCS solution front view .......................................................................................................... 6
Figure 2. Cisco UCS solution rear view ............................................................................................................. 7
Figure 3. Dell PowerEdge solution rear view .................................................................................................. 8
Figure 4. Dell PowerEdge solution rear view .................................................................................................. 9
Figure 5. VM migration testing ......................................................................................................................... 10
Figure 6. I/O latency testing with Netperf ...................................................................................................... 11

Dell PowerEdge Blades Outperform Cisco UCS in East-West Network Performance
iii
THIS DOCUMENT IS FOR INFORMATIONAL PURPOSES ONLY, AND MAY CONTAIN TYPOGRAPHICAL ERRORS AND TECHNICAL INACCURACIES.
THE CONTENT IS PROVIDED AS IS, WITHOUT EXPRESS OR IMPLIED WARRANTIES OF ANY KIND.
© 2013 All rights reserved. Reproduction of this material in any manner whatsoever without the express written permission of Dell Inc. is strictly
forbidden. For more information, contact Dell.
Dell, the Dell logo, and PowerEdge are trademarks of Dell Inc. Cisco is a registered trademark of Cisco Systems, Inc. Intel and Xeon are registered
trademarks of Intel Corporation in the U.S. and other countries. Microsoft, Windows, and Windows Server are either registered trademarks or
trademarks of Microsoft Corporation in the United States and/or other countries. Novell and SUSE are registered trademarks of Novell, Inc. in the
United States and other countries. Other trademarks and trade names may be used in this document to refer to either the entities claiming the
marks and names or their products. Dell disclaims proprietary interest in the marks and names of others.
December 2013 | Version 1.0

Dell PowerEdge Blades Outperform Cisco UCS in East-West Network Performance
4
Executive summary
Introduction
Data centers have traditionally been optimized for traffic between servers and clients, or “north-south”
traffic. The rising popularity of virtualization and private clouds in data centers has led to an increased
emphasis on traffic between servers, or “east-west” traffic.
When a running virtual machine (VM) is migrated between servers, east-west traffic is generated as the
memory of the VM is copied over the network to the destination server. Performing this operation on a
heavily loaded VM can saturate even a dedicated 10Gb link.
East-west traffic between blades in a Dell™ PowerEdge™ M1000e blade enclosure stays within the
chassis, travelling to the destination blade through the installed I/O module. Only traffic destined for a
server outside the enclosure has to leave the enclosure.
Cisco’s UCS architecture requires east-west traffic between blades, even blades within the same
enclosure, to leave the enclosure. This means that the contents of memory during a virtual machine
migration must travel from the source blade through a Fabric Extender, out to an external Fabric
Interconnect, back down to the Fabric Extender, and finally to the destination blade. These extra hops
introduce additional latency in the data stream, causing live migration to take longer on a busy virtual
machine.
Dell’s Solutions Performance Analysis team measured the impact these different architectures can
have on the performance of east-west network traffic. We configured solutions based on the Dell
PowerEdge M1000e blade enclosure and the Cisco UCS 5108 blade chassis, configuring each solution
to simulate a typical customer deployment, with redundant links and each vendor’s own top-of-rack
switching.
Key findings
Virtual machine migration time between blades in the same chassis
A heavily loaded VM can be migrated in 30 percent less time between blades in one Dell blade
enclosure compared to the same VM migrating between blades in one Cisco UCS blade enclosure.
Virtual machine migration time between blades in different chassis
A heavily loaded VM can be migrated in 22 percent less time between blades in two separate Dell
blade enclosures compared to the same VM migrating between blades in one Cisco UCS blade
enclosure.
Network latency between blades in the same chassis
The Dell solution provided 61 percent lower network latency between blades in one Dell blade
enclosure than between blades in one Cisco UCS blade enclosure.
Network latency between blades in different chassis
The Dell solution provided 60 percent lower network latency between blades in two separate Dell
blade enclosures than between blades in one Cisco UCS blade enclosure.
Dell PowerEdge Blades Outperform Cisco UCS in East-West Network Performance
5
Price
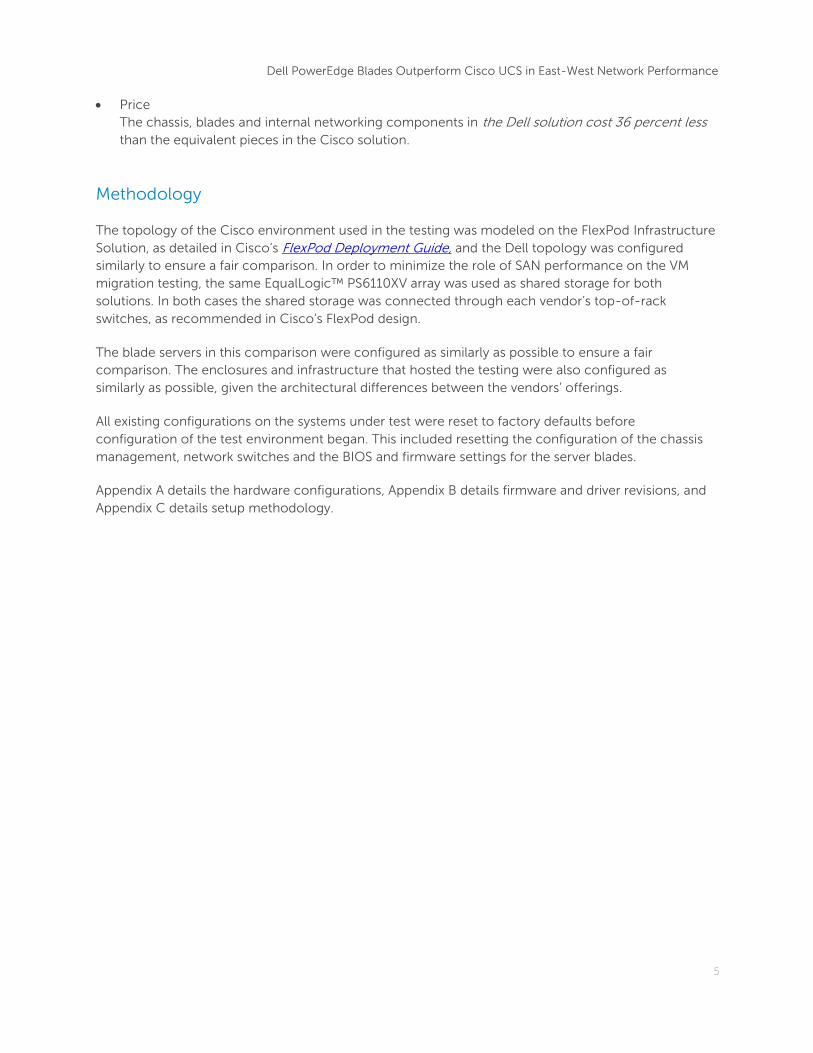
The chassis, blades and internal networking components in the Dell solution cost 36 percent less
than the equivalent pieces in the Cisco solution.
Methodology
The topology of the Cisco environment used in the testing was modeled on the FlexPod Infrastructure
Solution, as detailed in Cisco’s FlexPod Deployment Guide, and the Dell topology was configured
similarly to ensure a fair comparison. In order to minimize the role of SAN performance on the VM
migration testing, the same EqualLogic™ PS6110XV array was used as shared storage for both
solutions. In both cases the shared storage was connected through each vendor’s top-of-rack
switches, as recommended in Cisco’s FlexPod design.
The blade servers in this comparison were configured as similarly as possible to ensure a fair
comparison. The enclosures and infrastructure that hosted the testing were also configured as
similarly as possible, given the architectural differences between the vendors’ offerings.
All existing configurations on the systems under test were reset to factory defaults before
configuration of the test environment began. This included resetting the configuration of the chassis
management, network switches and the BIOS and firmware settings for the server blades.
Appendix A details the hardware configurations, Appendix B details firmware and driver revisions, and
Appendix C details setup methodology.

Dell PowerEdge Blades Outperform Cisco UCS in East-West Network Performance
6
Solution configuration
The two solutions were configured as similarly as possible given the differences in architectures of the
solutions. Figure 1 and Figure 2 show the front and rear views of the Cisco UCS solution. The Cisco
switches and Fabric Interconnects were mounted to have coolant air entering from the cold aisle and
exhausting to the hot aisle, as recommended in the Cisco Nexus 5500 Platform Overview.
Figure 1. Cisco UCS solution front view
Dell PowerEdge Blades Outperform Cisco UCS in East-West Network Performance
7
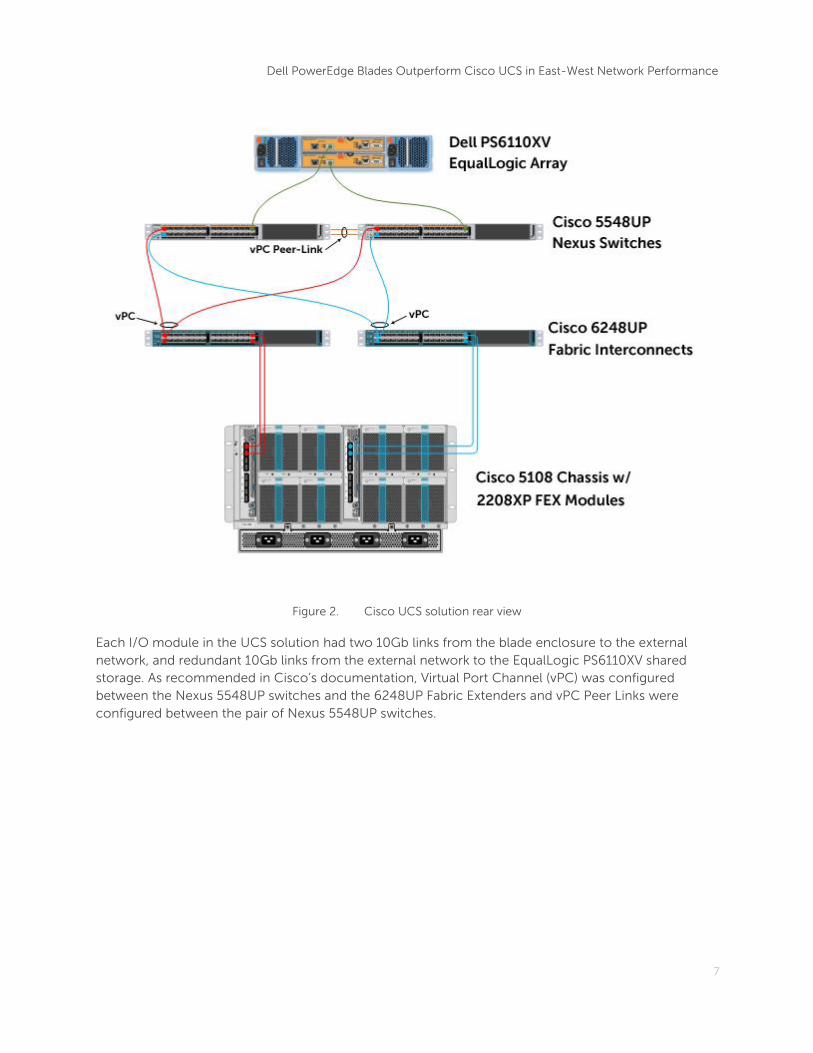
Figure 2. Cisco UCS solution rear view
Each I/O module in the UCS solution had two 10Gb links from the blade enclosure to the external
network, and redundant 10Gb links from the external network to the EqualLogic PS6110XV shared
storage. As recommended in Cisco’s documentation, Virtual Port Channel (vPC) was configured
between the Nexus 5548UP switches and the 6248UP Fabric Extenders and vPC Peer Links were
configured between the pair of Nexus 5548UP switches.

Dell PowerEdge Blades Outperform Cisco UCS in East-West Network Performance
8
Figure 3 and Figure 4 show the Dell PowerEdge solution. As with the UCS solution, each I/O module in
the Dell solution has two 10Gb links from the blade to the external network, and redundant 10Gb links
to the EqualLogic PS6110XV shared storage. In each solution, iSCSI traffic travels through that
solution’s top-of-rack switches to the EqualLogic storage array.
In the PowerEdge solution, east-west traffic between blades in the chassis can travel from the
originating blade to the Dell Networking MXL switch inside the chassis and directly to the destination
blade. In contrast, in the UCS solution, traffic between blades in the chassis must leave the UCS 5108
blade enclosure through the 2208XP Fabric Extender modules and travel through the 6248UP Fabric
Interconnects, and then back through the 2208XP Fabric Extender.
Figure 3. Dell PowerEdge solution rear view

Dell PowerEdge Blades Outperform Cisco UCS in East-West Network Performance
9
Figure 4. Dell PowerEdge solution rear view

Dell PowerEdge Blades Outperform Cisco UCS in East-West Network Performance
10
Test 1: Virtual machine migration
With the solutions configured to simulate a typical deployment, we tested an east-west traffic scenario
by migrating a heavily loaded VM between blades in each solution. VMware®
ESXi™ 5.1 Update 1 was
installed on all blades, and a virtual machine was created on the EqualLogic shared storage.
Microsoft®
Windows Server®
2008 R2 SP1 was installed as the guest OS. To simulate a heavily loaded
VM, Prime95 was run in the guest OS and set to exercise 14GB of memory. This VM was migrated
using vMotion™ between the blades in both setups.
We migrated the VM five times on each solution, and we averaged and compared the time required for
the migration, as reported by vCenter logs. To ensure consistent results, we rebooted the guest
operating system after each test iteration.
As Figure 5 shows, the Dell solution took an average of 46 seconds to migrate the VM between blades
in the same chassis, 30 percent faster than the Cisco solution, which took on average one minute and
five seconds.
Figure 5. VM migration testing
The testing shows that when the source and destination hosts for a VM migration are within the same
M1000e blade enclosure, the migration time is considerably lower than it is with the UCS solution. We
also moved one of the M620 blades to another similarly configured M1000e blade enclosure and
repeated the testing. As seen in Figure 5, the time to move the VM between hosts in different M1000e
chassis is an average of 5 seconds longer, but it is still 22 percent lower than the average time required
to move the same VM between two blades that are housed in one UCS 5108 chassis.
00:46 00:51
01:05
00:00
00:09
00:17
00:26
00:35
00:43
00:52
01:00
01:09
Time to migrate VM between blades (minutes and seconds, lower is better)
Dell (single chassis) Dell (chassis to chassis) Cisco (single chassis)
Dell PowerEdge Blades Outperform Cisco UCS in East-West Network Performance
11
Test 2: Round trip time measurements using Netperf
To test the network latency of each solution, we performed a fresh install of Novell®
SUSE®
Linux®
Enterprise Server (SLES) 11 SP2 on each blade, and we installed Netperf 2.6.0. One blade in each
solution was configured as the target (“netserver”). The other blade in each solution ran the
tcp_rr_script test script included with Netperf to test round trip time between the blades of each
solution.
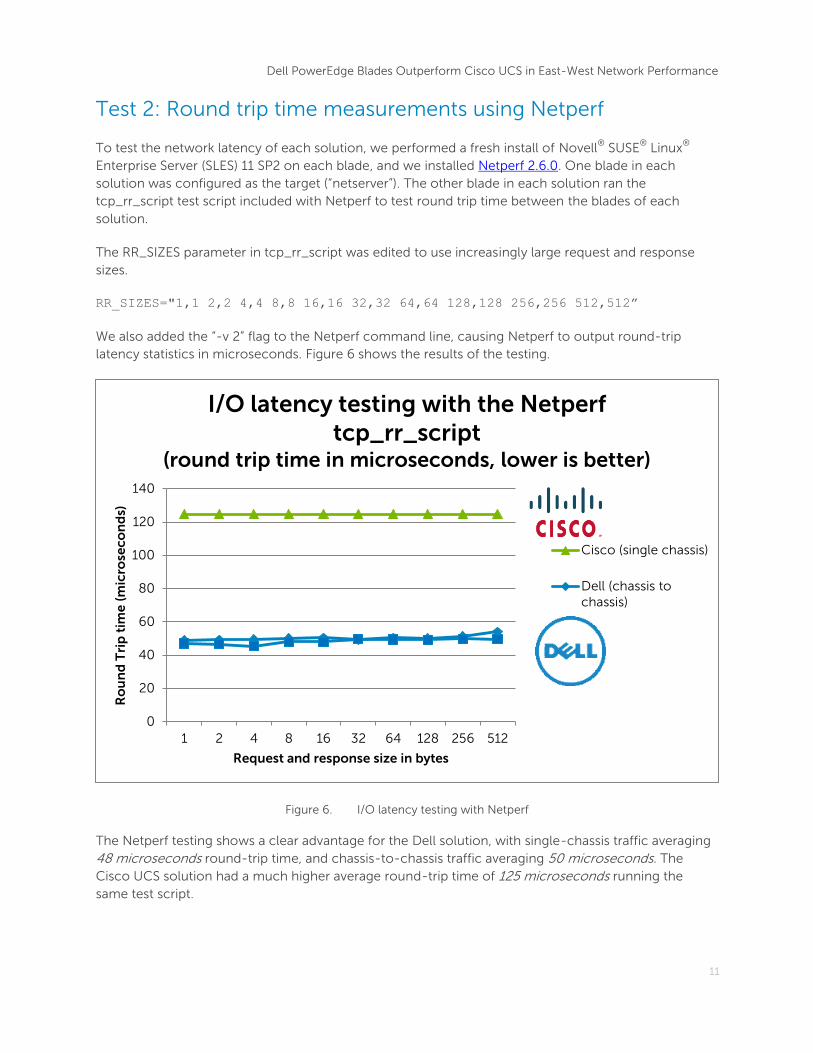
The RR_SIZES parameter in tcp_rr_script was edited to use increasingly large request and response
sizes.
RR_SIZES="1,1 2,2 4,4 8,8 16,16 32,32 64,64 128,128 256,256 512,512”
We also added the “-v 2” flag to the Netperf command line, causing Netperf to output round-trip
latency statistics in microseconds. Figure 6 shows the results of the testing.
Figure 6. I/O latency testing with Netperf
The Netperf testing shows a clear advantage for the Dell solution, with single-chassis traffic averaging
48 microseconds round-trip time, and chassis-to-chassis traffic averaging 50 microseconds. The
Cisco UCS solution had a much higher average round-trip time of 125 microseconds running the
same test script.
0
20
40
60
80
100
120
140
1 2 4 8 16 32 64 128 256 512
Ro
un
d T
rip
tim
e (
mic
rose
co
nd
s)
Request and response size in bytes
I/O latency testing with the Netperf tcp_rr_script
(round trip time in microseconds, lower is better)
Cisco (single chassis)
Dell (chassis tochassis)

Dell PowerEdge Blades Outperform Cisco UCS in East-West Network Performance
12
Price
We also compared the cost of each solution’s blade chassis, blades and IO modules. Based on a quote
received from Dell Sales, the cost of these components in the Dell solution was $46,369, which is
36 percent less than the equivalent components in the Cisco solution, which cost $72,299, based on a
quote from a Cisco authorized reseller. The quote for the Cisco solution included the cost of the two
6248UP Fabric Interconnects and the license for UCS Manager, as these are required parts of the
Cisco solution.

Dell PowerEdge Blades Outperform Cisco UCS in East-West Network Performance
13
Summary
These tests show a large latency advantage for the Dell solution based on Dell Networking MXL I/O
modules and S4810 top-of-rack switches compared to the Cisco UCS solution. The ability of the Dell
solution to pass traffic between blades without leaving the chassis resulted in significantly lower
migration time for a heavily loaded VM. Even when top-of-rack switching was introduced and one
blade was moved to a second M1000e enclosure, the Dell solution maintained a significant advantage
in both VM migration time and in latency testing.
With the explosion in virtualization in today’s data centers, the east-west traffic generated by VM
migration is an increasingly large portion of total network traffic. Hypervisor load balancers can
constantly move VMs to less loaded hosts, and bringing down a heavily loaded host for maintenance
could result in the migration of dozens of VMs. Administrators looking to minimize the time that VM
migrations take will find these test results enlightening.

Dell PowerEdge Blades Outperform Cisco UCS in East-West Network Performance
14
Appendix A — Test hardware configurations
Enclosure hardware comparison Table 1.
Enclosure hardware Dell blade solution Cisco blade solution
Blade enclosure PowerEdge M1000e UCS 5108
Blades 2 x PowerEdge M620 2 x UCS B200 M3
Internal I/O Module 2 x Dell Networking MXL 10/40GbE blade switch
2 x UCS 2208XP Fabric Extender
Management 2 x Dell CMC Module Cisco UCS Manager
Power supply quantity/rating
6 x 2700W platinum rated (Dell P/N 0G803N)
4 x 2500W platinum rated (Cisco P/N N20-PAC5-2500W)
Blade hardware comparison Table 2.
Blade hardware Dell PowerEdge M620 Cisco UCS B200 M3
Sockets/form factor 2 / half height 2 / half width
Processors 2 x Intel Xeon E5-2680 2 x Intel Xeon E5-2680
Physical/logical cores 16/32 16/32
Memory 8 x 8GB Dual Ranked PC3L-10600R, LV RDIMMs
8 x 8GB Dual Ranked PC3L-10600R, LV RDIMMs
Hard drives 1 x 146GB 15k 6Gb 1 x 146GB 15k 6Gb
Network Onboard 2-port Broadcom NetXtreme II 10GbE BCM57810
Integrated 4 port Cisco UCS VIC 1240
Storage controller Dell PERC H310 LSI SAS2004 Integrated RAID controller
External component comparison Table 3.
External components Dell blade solution Cisco blade solution
10GbE external switches Dell Force10 S4810 (Dell P/N: W9C6F)
Cisco Nexus 5548UP (Cisco Model Number: N5K-C5548UP
External Blade Management Module
N/A 2 x Cisco UCS 6248UP 48 Port 1RU Fabric Interconnect (Cisco P/N: UCS-FI-6248UP)
Shared storage Dell EqualLogic PS6110XV Dell EqualLogic PS6110XV

Dell PowerEdge Blades Outperform Cisco UCS in East-West Network Performance
15
Appendix B — Firmware and software revisions
Firmware and software revisions Table 4.
Dell PowerEdge M1000e Cisco UCS 5108
Management firmware version
CMC 4.45 2.1(3a)
Internal IOM firmware 9.2(0.0) 2.1(3a)
Blade BIOS version 2.0.19 200M3.2.1.3a.0.082320131800
Blade management controller firmware version
1.45.46 2.1(3a)
Blade network adapter firmware version
7.6.15 2.1(3a)
Netperf latency test operating system version
SUSE Linux Enterprise Server 11 SP2 SUSE Linux Enterprise Server 11 SP2
Blade network adapter driver version (SLES 11 SP2)
7.6.62_3.0.13_0.27-2 2.1.1.41 (ENIC)
Virtual machine migration test guest OS version
Microsoft Windows Server 2008 R2 SP1
Microsoft Windows Server 2008 R2 SP1
Vendor customized VMware ESXi installation file name
VMware-VMvisor-Installer-5.1.0- 799733.x86_64- Dell_Customized_RecoveryCD_A00.iso
VMware ESXi-5.1.0-799733-custom- Cisco-2.1.0.3.iso

Dell PowerEdge Blades Outperform Cisco UCS in East-West Network Performance
16
Appendix C — Test methodology
Cisco UCS test setup
Network cabling for the Cisco UCS solution was configured in accordance with the Cisco UCS 5108
Server Chassis Hardware Installation Guide. Both ports of each 2208XP Fabric Extender were
connected to only one 6248UP Fabric Interconnect, as directed in that document, and the chassis
were not connected to the expansion modules of the Fabric Interconnect.
The Nexus 5548UP switches were configured using Cisco’s FlexPod Deployment Guide.as a starting
point. As recommended in that document, the switches were configured with virtual port channel
(vPC) connections, and the shared storage (in this case, the EqualLogic PS6110XV array) was
connected to the 5548UP switches.
The existing UCS configuration was cleared using the “erase configuration” command as described in
Chapter 41 of the Cisco UCS Manager CLI Configuration Guide, Release 2.1,, then we performed the
Initial System Setup for a Cluster Configuration, as described in Chapter 5 of the same document.
To configure the infrastructure for the Cisco UCS test setup, we followed the instructions in the 2013
revision of the Cisco UCS Manager Configuration Common Practices and Quick-Start Guide. We
followed all the instructions found in “Appendix: Cisco UCS Quick-Start Guide” of that document,
except step 9, which applies to SAN Boot only, and step 11, which is specific to a fibre channel over
Ethernet (FCoE) installation.
In addition to the steps contained in the Quick-Start Guide, we also configured jumbo frames using
the instructions from the Cisco UCS Manager GUI Configuration Guide, Release 2.1. We set the MTU
for the LAN Cloud and the MTU of all vNICs in the B200 M3 blades to the maximum value of 9000.
We used the Linux “tracepath” command and the ESXi “vmkping” command to verify that jumbo
frames were working between the blades and between each blade and the iSCSI storage array.
Dell PowerEdge test setup
The Dell PowerEdge test setup was configured to be similar to the UCS test setup, with redundant
links for each blade and a top-of-rack switch connected to the EqualLogic shared storage array. The
40Gb links between Dell Networking MXL switches were cabled to each other and a Link Aggregation
Group (LAG) configured as described on pages 4-5 of the Dell Force10 S4810 Switch: Rapid
EqualLogic Configuration Series Implementation Guide. The S4810 top-of-rack switches were
configured using Virtual Link Trunking (VLT) as described in the Dell Force10 VLT Technical Guide.
The MTU for all ports in the MXL switches and the S4810 top-of-rack switch were set to 9000, and the
MTU for the onboard Broadcom BCM57810 adapters in the M620 blades was also set to 9000. We
used the Linux “tracepath” command and the ESXi “vmkping” command to verify jumbo frames were
working between the blades and between each blade and the EqualLogic storage array.