
Delivering Measurable Results to Manufacturing Clients
12
Delivering Measurable Results to Manufacturing Clients MEP • MANUFACTURING EXTENSION PARTNERSHIP March 2011 Fiscal Year 2009 Results
Transcript of Delivering Measurable Results to Manufacturing Clients

Delivering Measurable Results to Manufacturing Clients
MEP • MANUFACTURINGEXTENSION PARTNERSHIP
March 2011
Fiscal Year 2009 Results

Created in 1988, the Hollings Manufacturing Extension Partnership (MEP), a program of the U.S. Department of Commerce’s National Institute of Standards and Technology (NIST) provides knowledge and problem-solving services to improve the productivity, economic competitiveness and technological capabilities of America’s manufacturers, particularly small manufacturers. MEP is a results-based system of locally operated and staffed non-profit and university-based organizations leveraging federal, state, local and private resources. This partnership among the federal government, state and local governments, and the private sector has manufacturing extension offices providing a range of needed services to manufacturers across the country and in Puerto Rico. These organizations provide critical services and assistance to meet clients’ current and future strategic needs. MEP works directly with manufacturing firms to provide expertise and services tailored to their most important needs on the shop floor, offices and board rooms. With the introduction of innovation and growth services in 2008, MEP is ensuring that the services evolve with the changing needs of manufacturers.
Since 1996, NIST MEP has used an independent third-party organization to conduct a national survey of center clients. The survey collects client level data on the business impact of the services provided by their local center. These results allow the NIST MEP to gauge the impact of the MEP network on America’s manufacturers and its economic impact on the national, state, and regional economies. Clients are surveyed two quarters after an initial project is completed.
Each year the MEP network helps thousands of manufacturers solve problems, increase productivity, improve their economic competitiveness, and enhance their innovation capabilities. As a result, MEP clients achieve higher profits, save time and money, invest in physical and human capital, and create and retain thousands of jobs. This brief report documents the survey process and summarizes the total national client impacts for the services provided in Fiscal Year 2009. Since the survey is conducted two quarters after the completion of services, survey results reported here were collected during Fiscal Year 2010.
MEP clients reported that MEP services led to:
n Creating and retaining more than 72,000 jobs;
n Helping firms increase and retain sales by over $8.4 billion;
n Leveraging nearly $1.9 billion in new private sector investment
n Generating cost savings of over $1.3 billion; and,
n Two out of every three MEP clients reported that they are very likely to recommend MEP to others.
EXECUTIVE SUMMARY
U.S. DEPARTMENT OF COMMERCE • NATIONAL INSTITUTE OF STANDARDS AND TECHNOLOGY • MANUFACTURING EXTENSION PARTNERSHIP
W W W . N I S T . G O V / M E P • 1 - 8 0 0 - M E P - 4 M F G
2
INTRODUCTION
U.S. DEPARTMENT OF COMMERCE • NATIONAL INSTITUTE OF STANDARDS AND TECHNOLOGY • MANUFACTURING EXTENSION PARTNERSHIP
W W W . N I S T . G O V / M E P • 1 - 8 0 0 - M E P - 4 M F G
The Manufacturing Extension Partnership
Created in 1988, the Hollings Manufacturing Extension Partnership (MEP), a program of the U.S. Department of Commerce’s National Institute of Standards and Technology (NIST), provides knowledge and problem-solving services to improve the productivity, economic competitiveness and technological capabilities of America’s manufacturers, particularly small manufacturers. MEP is a results-based system of locally operated and staffed non-profit and university-based organizations, leveraging federal, state, local, and private resources. These centers tailor their services to the communities and manufacturers they work with providing critical services that meet clients’ current and future strategic needs.
This partnership among the federal government, state and local governments, and the private sector has manufacturing extension offices in all 50 states and in Puerto Rico. The MEP network is dynamic and constantly evolving in terms of services provided, the resources used to support their work, and the manufacturers they serve. MEP delivers its services on the shop floor, offices and board rooms of manufacturing firms.
Centers work directly with local firms to provide expertise and services tailored to meet critical needs ranging from innovation strategies, process improvements and new product development. During Fiscal Year 2010, MEP provided intensive services in areas including business systems, human resource management, process improvement, product development, and market diversification to nearly 7,000 manufacturing establishments. MEP services are provided through a combination of direct assistance from center staff and assistance from private-sector consultants. This diversity is a strength of the program and permits local MEP Centers to provide a wide range of mission-related services tailored to the state and regional economies they serve.
Driven by evolving customer and industry demands, MEP constantly refines and improves its products, services and delivery approaches. MEP’s work with clients focuses on technology, innovation, training, and technical assistance. Since the program began, clients have used the NIST MEP program over 456,000 times. In Fiscal Year 2010, MEP Centers engaged with more than 34,000 manufacturing establishments throughout the Unites States and Puerto Rico to provide a range of services including one-on-one assistance to their needs in terms of education, information and implementation.
Small Manufacturers and Their Challenges
MEP’s primary clients, the more than 330,000 U.S. small manufacturing establishments with fewer than 500 employees, are important cornerstones of the U.S. economy and are essential contributors to national and economic security.1 Diversity, geographic dispersion and complexity characterize
1 The number of small manufacturing establishments is from the 2007 County Business Patterns data series.
the small manufacturing marketplace. Small manufacturing establishments are a critical national economic resource as reported by the U.S. Census Bureau: in 2007, they represented nearly 99 percent of all manufacturing establishments, accounted for 72 percent of all manufacturing employment, employed about 9.7 million people, and accounted for about 60 percent of the total value-added by all U.S. manufacturers2.
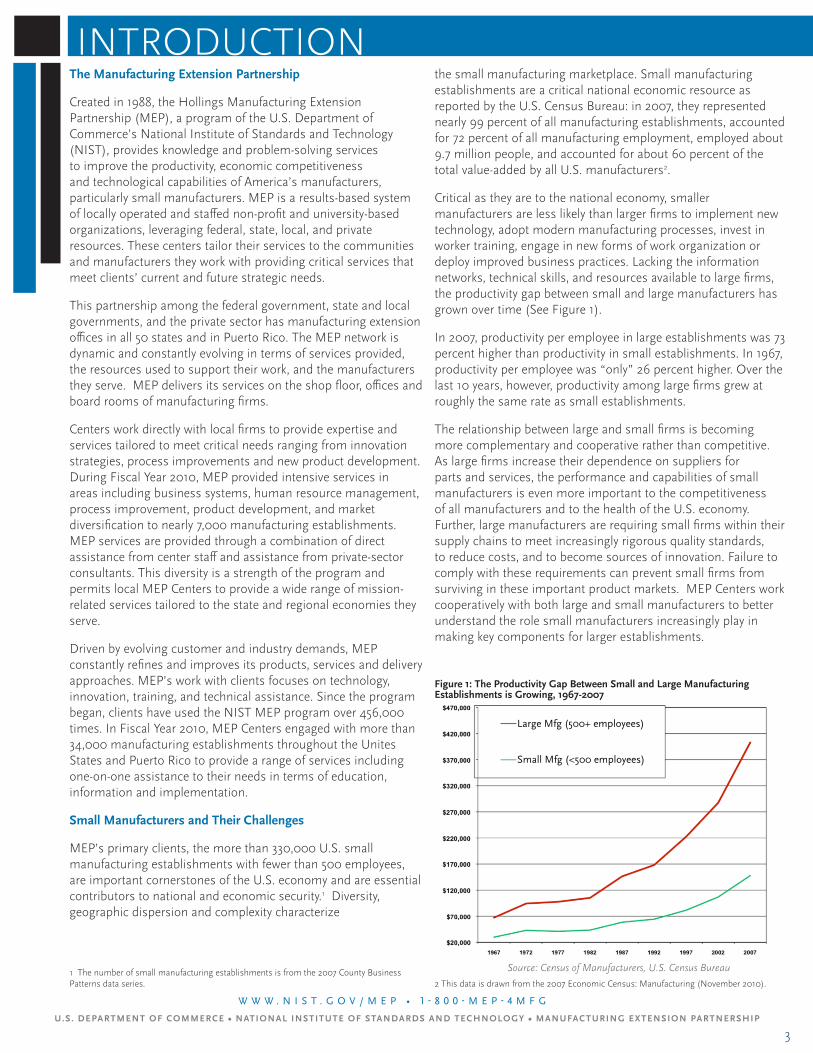
Critical as they are to the national economy, smaller manufacturers are less likely than larger firms to implement new technology, adopt modern manufacturing processes, invest in worker training, engage in new forms of work organization or deploy improved business practices. Lacking the information networks, technical skills, and resources available to large firms, the productivity gap between small and large manufacturers has grown over time (See Figure 1).
In 2007, productivity per employee in large establishments was 73 percent higher than productivity in small establishments. In 1967, productivity per employee was “only” 26 percent higher. Over the last 10 years, however, productivity among large firms grew at roughly the same rate as small establishments.
The relationship between large and small firms is becoming more complementary and cooperative rather than competitive. As large firms increase their dependence on suppliers for parts and services, the performance and capabilities of small manufacturers is even more important to the competitiveness of all manufacturers and to the health of the U.S. economy. Further, large manufacturers are requiring small firms within their supply chains to meet increasingly rigorous quality standards, to reduce costs, and to become sources of innovation. Failure to comply with these requirements can prevent small firms from surviving in these important product markets. MEP Centers work cooperatively with both large and small manufacturers to better understand the role small manufacturers increasingly play in making key components for larger establishments.
2 This data is drawn from the 2007 Economic Census: Manufacturing (November 2010).
Source: Census of Manufacturers, U.S. Census Bureau
Figure 1: The Productivity Gap Between Small and Large Manufacturing Establishments is Growing, 1967-2007
3
Large Mfg (500+ employees)
Small Mfg (<500 employees)

Survey Purpose
Since 1996, NIST MEP has sponsored a national survey of center clients by independent survey experts. The survey asks clients to report on the business impact of the services provided by their local center. NIST MEP surveys clients for two primary purposes:
n Collect aggregate information on program performance indicators to report to various stakeholders on program performance. The survey provides information about the quantifiable impacts clients attribute to the services provided by MEP Centers. NIST MEP also conducts other episodic studies to evaluate the system’s impact that corroborate and complement the survey results.
n Provide center-specific program performance and impact information for center use. Centers use this information to communicate results to their own stakeholders at both the state and federal level. Center management and NIST MEP use these results to evaluate center performance and effectiveness. The MEP review process places a strong emphasis on a center’s ability to demonstrate impacts based on the survey results.
The survey results also provide MEP Centers with a tool to measure their center’s performance and effectiveness as well as benchmark their performance against other centers and performance standards. In addition, the data allows NIST MEP to gauge the impact of the national MEP system on America’s small manufacturers and its impact on the national and regional economies.
Survey Methods
Turner Marketing, Inc. conducts the NIST MEP client survey. Turner Marketing is an Orlando-based call center providing lead generation, marketing, and database services across the United States and Canada. The company has experience both in market research and surveying with a specialization in dealing with small manufacturers.
Turner Marketing conducts the survey quarterly and MEP clients are interviewed annually. The survey asks clients to consider the entire set of projects or services provided by a center and to report on how their company’s performance and processes have been affected in the last 12 months. The survey asks clients to report on the impact of MEP services on bottom-line client outcomes and bottom-line impacts such as sales, jobs created/retained, capital investment and cost savings.
The survey has 13 questions and takes an average of 10 minutes to complete. A copy of the survey form and the questions is included in Appendix 3.
Clients are selected for the survey based on when the firm completes its first project with a center and are surveyed approximately 2 calendar quarters (6 months) later. For instance, if a client’s project closed in March 2011, this client would be surveyed in the third quarter of 2011. Clients completing multiple projects with a center in a year are surveyed only once a year based on the date of their first completed project. While clients are selected based on when a project was completed with a center, the survey is client-based rather than project-based. Clients can be surveyed multiple times for one project at the MEP Center’s discretion. The intent for these multiple surveys is to capture impacts that may take multiple years to come to fruition, with particular emphasis on growth and innovation projects.
MEP, along with Turner Marketing, uses several tools and techniques to minimize both response and non-response bias to the survey. Response bias may arise due to inaccurate responses to particular questions; non-response bias may arise due to errors because of an unrepresentative sample of MEP clients actually being surveyed. This might occur because some clients decline to participate or cannot be reached during the four-week survey period.
Several steps are taken to limit response bias. Clients are informed that they were selected for an interview and are encouraged to participate in the study. A letter or email is sent to each client announcing that they were selected for the survey. The MEP Centers also follow up with non-respondents during the survey period via phone and email to encourage participation.
Table 1 shows the number of interviews conducted in each survey period, the number that completed an interview, and the response rate3.
3 Appendix 1 explores the characteristics of the clients that responded to the survey and those that did not to examine if there are indications of potential response bias. Appendix 2 examines the confidence intervals for the survey results. Appendix 3 provides a copy of the actual survey instrument and the results for each question based on the client responses.
U.S. DEPARTMENT OF COMMERCE • NATIONAL INSTITUTE OF STANDARDS AND TECHNOLOGY • MANUFACTURING EXTENSION PARTNERSHIP
THE MEP SURVEY
W W W . N I S T . G O V / M E P • 1 - 8 0 0 - M E P - 4 M F G
For FY2009, 9,654 surveys were attempted, with 7,786 responding;
resulting in an 81% response rate for the year.
Table 1: Response Rates
4

U.S. DEPARTMENT OF COMMERCE • NATIONAL INSTITUTE OF STANDARDS AND TECHNOLOGY • MANUFACTURING EXTENSION PARTNERSHIP
CLIENT IMPACT SURVEY RESULTS
W W W . N I S T . G O V / M E P • 1 - 8 0 0 - M E P - 4 M F G
The Manufacturing Extension Program delivers measurable results to its clients. The services provided lead to improvements in client sales, investment, and cost savings, as well as increased and retained employment. The data provides detail on why clients work with a center, productivity and competitiveness improvements reported by MEP clients. Data will also show detail on the bottom-line impacts reported by the 7,786 MEP clients interviewed.
Clients chose to work with MEP because of the program’s expertise. A majority of clients chose to work with MEP because of the knowledge and expertise of the center staff. Nearly 45% of the clients reported that the price of MEPs services contributed to their decision to work with MEP. The center’s reputation for results and fair/unbiased service together represented about half of all responses.
The majority of MEP clients reported that MEP was their exclusive provider of business improvement services.
MEP Clients face a wide array of challenges. While ongoing continuous improvement remains important to manufacturers, the need to innovate and grow is extremely important, as is sustainability. Seven in ten MEP clients view continuous improvement and cost reduction strategies as one of their biggest strategic challenges.
MEP services had a significant impact on company sales. As a result of the services provided, a majority of MEP clients reported either increased sales or retained sales, resulting in $8.4 billion in sales impact during FY 2009.Note: percentages do not add to 100 since clients can select more
than one factor. n = 7,786 Clients
Table 2: Why Clients Choose to Work with MEP Clients
n = 7,786 Clients
Table 3: Percent of Clients Reporting Using Other Service Providers
Table 4: Top Challenges facing MEP clients over the next three years
Note: percentages do not add to 100 since clients can select more than one factor. n = 7,786 Clients
Table 5: Sales Impacts Reported by MEP Clients
n = 7,786 Clients
5
Factor for Choosing MEPPercent of Clients
Reporting
Center/Staff Experience 57.8%
Cost/Price of Services 44.4%
Reputation for Results 22.7%
Fair and Unbiased Advice/Services 22.3%
Knowledge of Your Industry 17.5%
Specific Services Not Available from
Other Providers10.3%
Lack of Other Providers Nearby 4.5%
Other 6.7%
Other Service Provider UsedPercent of Clients
Reporting
Yes 40.6%
No 54.9%
Don’t Know/Refused 4.5%
Strategic ChallengePercent of Clients
Reporting
Ongoing Continuous Improvement 70.1%
Identifying Growth Opportunities 58.2%
Product Innovation/Development 46.8%
Sustainability in Products and
Processes24.3%
Employee Recruitment and
Retention22.2%
Financing 17.1%
Managing Partners and Supplies 14.2%
Technology Needs 11.5%
Exporting/Global Engagement 8.3%
Other 4.1%
Impact Dollar Amount
Increased Sales $3.5 Billion
Retained Sales $4.9 Billion

MEP clients created and retained over 72,000 jobs as result of services. MEP services led to 5 out of 10 clients reporting they either created or retained jobs during FY 2009. Overall, MEP clients created and retained 72,075 jobs.
MEP clients reported significant cost savings. Two-thirds of MEP clients surveyed said the services resulted in cost savings in areas such as labor, materials, inventory, and energy. MEP clients realized over $1.3 billion in total cost savings in FY 2009.
U.S. DEPARTMENT OF COMMERCE • NATIONAL INSTITUTE OF STANDARDS AND TECHNOLOGY • MANUFACTURING EXTENSION PARTNERSHIP
CLIENT IMPACT SURVEY RESULTS
W W W . N I S T . G O V / M E P • 1 - 8 0 0 - M E P - 4 M F G
n = 7,786 Clients
Table 6: Employment Impacts Reported by MEP Clients
n = 7,786 Clients
Table 7: Cost Savings Impacts Reported by MEP Clients
6
Impact Number of Jobs
Creation of New Jobs 17,721 jobs
Retention of Jobs 54,354 jobs
Impact Dollar Amount
Labor, material, overhead, inventory,
energy, etc.$907 million
Cost Savings on Investments Made
or Avoided$474 million

CLIENT IMPACT SURVEY RESULTS
U.S. DEPARTMENT OF COMMERCE • NATIONAL INSTITUTE OF STANDARDS AND TECHNOLOGY • MANUFACTURING EXTENSION PARTNERSHIP
W W W . N I S T . G O V / M E P • 1 - 8 0 0 - M E P - 4 M F G
7
MEP services leveraged significant new client investment. Most clients reported increased investment in key areas of their operations. MEP services leveraged significant new investments among its clients, totaling nearly $1.9 billion. The bulk of new investments reported by clients were in plant and equipment; but an increasing share of the new investment reported by clients was in more intangible areas such as employee skills, information systems, and research and development.
More than two-thirds of clients reported they are very likely to recommend the MEP center. Beginning in FY 2008, NIST MEP began asking clients how likely they were to recommend the center they worked with to other companies, on a scale of zero to ten (with zero representing not at all likely and 10 very likely). The question is asked in a manner consistent with the Net Promoter Score (NPS) methodology, and NIST MEP can use the NPS to evaluate center and program performance relative to this performance measure.4 Those clients selecting 10 or 9 are considered promoters, those who selected 8 or 7 are considered passive, and those answering 6-0 are considered detractors. More than two-thirds of the clients responding to the survey in FY 2010 reported they are very likely to recommend the center they worked with other firms.
The Manufacturing Extension Partnership (MEP) focuses on results and outcomes. MEP maintains accountability to clients, investors, and stakeholders by asking the people with the best information, manufacturing clients, about the impacts of MEP services.
MEP delivers measurable results to clients and investors. Each year, MEP makes it possible for thousands of companies to solve problems, increase productivity, achieve higher profits, find new markets, adopt technologies, innovate and create and retain thousands of jobs.
In FY 2009, MEP clients reported that these services led to:
n Creating and retaining more than 72,000 jobs;
n Helping firms increase and retain sales by over $8.4 billion;
n Leveraging nearly $1.9 billion in new private sector investment;
n Generating cost savings of over $1.3 billion.
Results from other studies reinforce and complement NIST MEP survey findings. The survey data and studies highlight the positive effects on the manufacturers MEP serves, creating a positive contribution to local, state, and U.S. economies.
Table 9: Likeliness to Recommend MEP Center
n = 7,786 Clients
Category Percent Reporting
Promoter 67.9%
Passive 22.9%
Detractor 9.1%
4 Reichheld, F. (2006). The ultimate question: Driving good profits and true growth. Cambridge, MA: Harvard University Press.
CONCLUSION
Table 8: Investment Impacts Reported by MEP Clients
n = 7,786 Clients
Impact Dollar Amount
Plant and Equipment $1.2 billion
Workforce practices and employee
skills$270 million
Other areas of business $197 million
Information systems and software $154 million

APPENDIX 1
U.S. DEPARTMENT OF COMMERCE • NATIONAL INSTITUTE OF STANDARDS AND TECHNOLOGY • MANUFACTURING EXTENSION PARTNERSHIP
W W W . N I S T . G O V / M E P • 1 - 8 0 0 - M E P - 4 M F G
8
Characteristics of Respondents and Non-respondents
This appendix explores the characteristics of the population selected for survey and examines whether there were important differences among those responding to the survey and non-respondents. The data in this report are from a representative cross-section of MEP clients in FY 2009. Those responding to the survey did not significantly differ from the larger population of all MEP clients we tried to contact but who did not respond. Thus, the data in this report represents the target population and represents a conservative and reasonable estimate of MEP program impacts based on client responses. The data reported here represent actual responses from the clients. Data have not been weighted nor have missing data been imputed.
Below is additional information regarding the characteristics and distribution of the survey respondents compared to non-respondents.
Employment Size CategorySurvey Respondents
(n=7,786)
Survey Non-Respondents
(n=1,868)
0-19 employees (n=2,530) 26.0% 27.2%
20-99 employees (n=3,875) 40.3% 39.5%
100-249 employees (n=1,935) 19.9% 20.6%
150-499 employees (n=964) 10.2% 8.9%
At least 500 employees (n=350) 3.6% 3.8%
Total population (N=9,654) 100.0% 100.0%
The portion of clients responding to the survey closely tracks the distribution of the total population. Smaller clients (i.e., those with less than 100 employees) were slightly more likely to respond to the survey as compared to larger clients (those with 100 or more employees).
Appendix Table 1.1: Characteristics of Survey Respondents & Non-Respondents in Terms of Establishing Size Category

APPENDIX 2
U.S. DEPARTMENT OF COMMERCE • NATIONAL INSTITUTE OF STANDARDS AND TECHNOLOGY • MANUFACTURING EXTENSION PARTNERSHIP
W W W . N I S T . G O V / M E P • 1 - 8 0 0 - M E P - 4 M F G
9
Standard Error of the Estimates
All sampling approaches involve the possibility that the results reported could be different from the characteristics of the full population from which the sample is drawn. While the survey is not a sample, not all clients respond to the survey, so it is important to determine and report the confidence intervals of the survey results. The likelihood that there is a range in the estimates depends on two factors: 1) the size of the sample, and 2) the observed distribution of the results in the sample. As to sample size, a sample of 50 is generally regarded as the minimum necessary. As to the observed distribution, the closer to a 50-50 split that exists in the sample, the greater the likelihood the sample result and the population result will diverge. Because of the large sample size, the confidence intervals around each reported result are very narrow.
To express the degree of confidence in the results relying on a sample, statisticians compute a standard error of the estimate and a confidence interval for the results. The confidence interval expresses the range on either side of an observed sample result that can be expected for the true value of the overall population to fall. The greater the degree of confidence wanted, the wider the confidence interval will be. Statisticians generally use a 95 percent confidence interval. This means we are 95 percent confident the true population proportion is in the specified range of the proportion reported based on the sample size.
The table below reports the confidence intervals for the full sample. This table provides the estimates of the standard errors at the 95 percent confidence level. Overall, we are 95 percent certain the true population proportion ranges between + /- 0.03 percent to + /-1.38 percent of the observed proportion. For example, if 60 percent of the respondents reported that the services helped them achieve some cost savings, there is a 95 percent probability the true value for the entire population of MEP clients would fall between 58.6 percent and 61.4 percent.
Reported Result
(Percent)Confidence Interval
1 ± 0.03
10 ± 0.9
20 ± 1.2
30 ± 1.3
40 ± 1.4
50 ± 1.4
60 ± 1.4
70 ± 1.3
80 ± 1.2
90 ± 0.9
99 ± 0.03
Appendix Table 2.1: Standard Errors of Estimates for Given Survey Results, 95-Percent Confidence Level, Sample Size of 7,786 Respondents

APPENDIX 3
U.S. DEPARTMENT OF COMMERCE • NATIONAL INSTITUTE OF STANDARDS AND TECHNOLOGY • MANUFACTURING EXTENSION PARTNERSHIP
W W W . N I S T . G O V / M E P • 1 - 8 0 0 - M E P - 4 M F G
10
Client Impact Survey - FY 2009 National Results (n=7,786 respondents)
1. What are the two most important factors for your firm choosing to work with (Center Name)?
• Center/staff expertise Percent of respondents selecting – 58.8%
• Cost/price of services Percent of respondents selecting – 44.4%
• Fair and unbiased advice/services Percent of respondents selecting – 22.3%
• Reputation for results Percent of respondents selecting – 22.7%
• Knowledge of your industry Percent of respondents selecting – 17.5%
• Specific services not available from other providers Percent of respondents selecting – 10.3%
• Other (specify) Percent of respondents selecting – 6.7%
• Lack of other providers nearby Percent of respondents selecting – 4.7%
• Don’t know/Refused Percent of respondents selecting – 1.7%
2. In addition to (Center Name), has your company used any other external resources/providers to address business performance issues over the past 12 months?
Yes – 40.6%
No – 54.9%
Don’t know/Refused – 4.5%
3. As you look forward over the next 3 years, what do you see as your company’s three most important strategic challenges?
• Ongoing continuous improvement/cost reduction strategies Percent of respondents selecting – 70.1%
• Identifying growth opportunities Percent of respondents selecting – 58.2%
• Product innovation/development Percent of respondents selecting – 46.8%
• Sustainability in products and processes Percent of respondents selecting – 24.3%
• Employee recruitment and retention Percent of respondents selecting – 22.2%
• Financing Percent of respondents selecting – 17.1%
• Managing partners and suppliers Percent of respondents selecting – 14.2%
• Technology needs Percent of respondents selecting – 11.5%
• Exporting/Global engagement Percent of respondents selecting – 8.3%
• Other (specify) Percent of respondents selecting – 4.1%
• Don’t know/Refused Percent of respondents selecting – 1.3%
4. Did the services you received directly lead to an increase in sales at your establishment over the past 12 months?
Yes – 31.5%
No – 50.1%
Don’t know/Refused – 18.4%
How much? $3,507,239,954
5. Did the services you received directly lead you to create any jobs over the past 12 months?
Yes – 27.2%
No – 64.6%
Don’t know/Refused – 8.2%
How many? 17,741

APPENDIX 3 CONT.
U.S. DEPARTMENT OF COMMERCE • NATIONAL INSTITUTE OF STANDARDS AND TECHNOLOGY • MANUFACTURING EXTENSION PARTNERSHIP
W W W . N I S T . G O V / M E P • 1 - 8 0 0 - M E P - 4 M F G
11
6. Did the services you received directly lead you to retain sales that would have otherwise been lost?
Yes – 40.0%
No – 39.5%
Don’t know/Refused – 20.5%
How much? - $4,965,360,721
7. Did the services you received lead you to retain any jobs over the past 12 months?
Yes – 42.9%
No – 43.9%
Don’t know/Refused – 13.2%
How many? - 54,355
8. Did the services you received directly result in cost savings in labor, materials, energy, overhead, or other areas over what would otherwise have been spent in the past 12 months?
Yes – 57.5%
No – 28.8%
Don’t know/Refused – 13.7%
How much? - $907,617,739
9. As a result of the services you received, has your establishment increased its investment over the past 12 months in:
a. Plant or equipment?
Yes – 34.4%
No – 56.9%
Don’t know/Refused – 8.7%
How much? - $1,298,779,396
b. Information systems or software?
Yes – 22.8%
No – 69.1%
Don’t know/Refused – 8.1%
How much? - $154,058,264
c. Workforce practices or employee skill?
Yes – 48.6%
No – 42.3%
Don’t know/Refused – 9.1%
How much? - $270,008,952
d. Other areas of business?
Yes – 18.2%
No – 64.3%
Don’t know/Refused – 17.5%
How much? - $197,681,916
10. As a result of the services you received, did your establishment avoid any unnecessary investments or save on any investments in the past 12 months?
Yes – 33.1%
No – 48.6%
Don’t know/Refused – 18.3%
How much was saved/avoided? $474,665,402
APPENDIX 3 CONT.
U.S. DEPARTMENT OF COMMERCE • NATIONAL INSTITUTE OF STANDARDS AND TECHNOLOGY • MANUFACTURING EXTENSION PARTNERSHIP
W W W . N I S T . G O V / M E P • 1 - 8 0 0 - M E P - 4 M F G
12
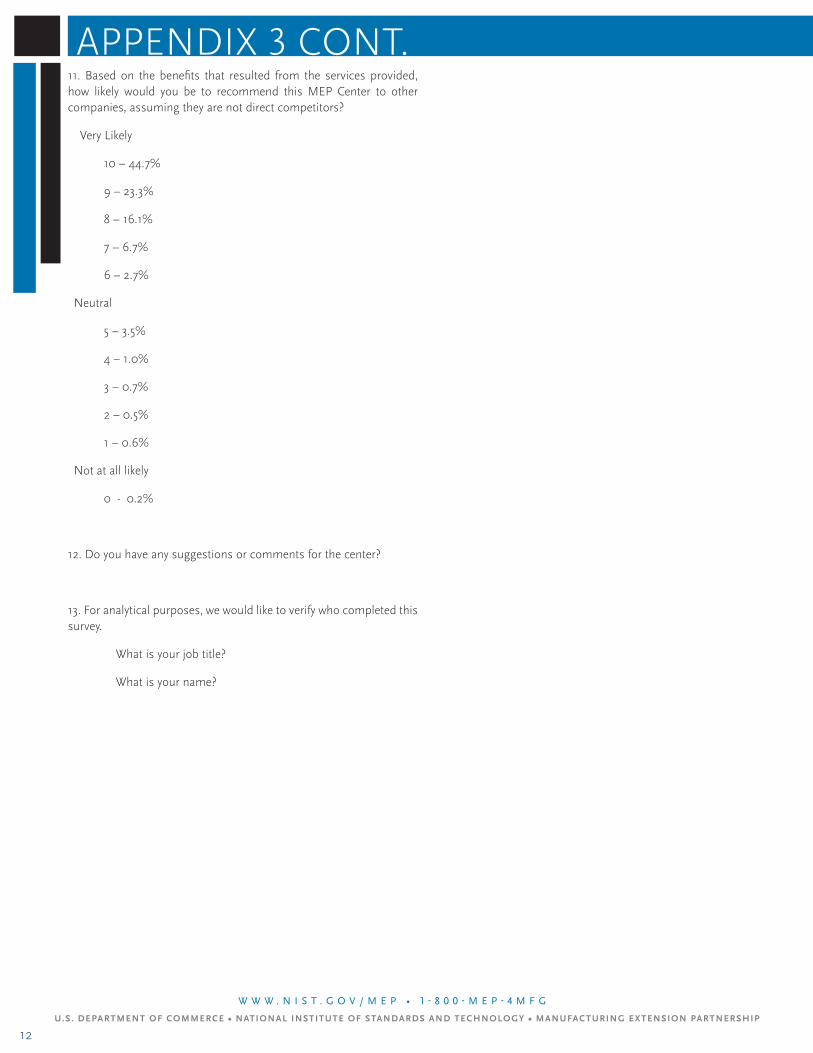
11. Based on the benefits that resulted from the services provided, how likely would you be to recommend this MEP Center to other companies, assuming they are not direct competitors?
Very Likely
10 – 44.7%
9 – 23.3%
8 – 16.1%
7 – 6.7%
6 – 2.7%
Neutral
5 – 3.5%
4 – 1.0%
3 – 0.7%
2 – 0.5%
1 – 0.6%
Not at all likely
0 - 0.2%
12. Do you have any suggestions or comments for the center?
13. For analytical purposes, we would like to verify who completed this survey.
What is your job title?
What is your name?