Del. 1.2 - SWOT analysis and SME profiling - Business School
31
Instrument: SP4-Capacities - CSA - Support Action Call: FP7-SME-2009-1 Grant agreement Number: 245459 Start date of project: 1 st December 2009 Duration: 24 months Project acronym: GPrix Project full name: Good Practices in Innovation Support Measures for SMEs: facilitating transition from the traditional to the knowledge economy Consortium: Del. 1.2 - SWOT analysis and SME profiling – North and Central Regions (Portugal) Date of deliverable: 30 th June 2010 Organisation name of lead beneficiary for this deliverable: INOVA+ Author (s): The GPrix consortium Project co-funded by the European Commission within the Seventh Framework Programme (2007- 20013) Dissemination level PU Public PP Restricted to other programme participants (including the Commission Services) RE Restricted to a group specified by the consortium (including the Commission Services) CO Confidential, only for members of the consortium (including the Commission Services)
Transcript of Del. 1.2 - SWOT analysis and SME profiling - Business School

Instrument: SP4-Capacities - CSA - Support Action Call: FP7-SME-2009-1 Grant agreement Number: 245459 Start date of project: 1st December 2009 Duration: 24 months
Project acronym: GPrix
Project full name: Good Practices in Innovation Support Measures for SMEs: facilitating
transition from the traditional to the knowledge economy Consortium:
Del. 1.2 - SWOT analysis and SME profiling – North and Central Regions (Portugal)
Date of deliverable: 30th June 2010 Organisation name of lead beneficiary for this deliverable: INOVA+ Author (s): The GPrix consortium
Project co-funded by the European Commission within the Seventh Framework Programme (2007- 20013) Dissemination level
PU Public PP Restricted to other programme participants (including the Commission Services) RE Restricted to a group specified by the consortium (including the Commission Services) CO Confidential, only for members of the consortium (including the Commission Services)
FP7-SME-2009-1-245459 – GPRIX
Del_1_2_RegionalEconomicFabric_PT.doc Page 2 of 31
Table of Contents
1 EXECUTIVE SUMMARY ............................................................................................................. 3
1.1 OBJECTIVE OF THE DELIVERABLE ............................................................................................... 3 1.2 IDENTIFYING A “TRADITIONAL SECTOR” ...................................................................................... 3
2 NORTH AND CENTRAL REGIONS - PORTUGAL ...................................................................... 6
2.1 ECONOMIC CONTEXT OF THE REGION .......................................................................................... 6 2.2 SME PROFILING IN THE REGION .............................................................................................. 12
2.2.1 SME situation in the region ........................................................................................ 12 2.2.2 SMEs in traditional sectors ........................................................................................ 14
2.3 SWOT ANALYSIS .................................................................................................................. 30 2.3.1 Strengths, Weaknesses, Opportunities and Threats .................................................... 30 2.3.2 Final considerations ................................................................................................... 31

FP7-SME-2009-1-245459 – GPRIX
Del_1_2_RegionalEconomicFabric_PT.doc Page 3 of 31
1 Executive Summary
1.1 Objective of the deliverable The objective of this deliverable is to report on the regional economic fabric of the 7 regions. The report uses a common template for the 7 regions so each partner can develop regional reports with the same structure and information, including a detailed SWOT analysis. This first report on the targeted regions will provide a baseline to support the development of the following reports on the regions later on: A contextual analysis of regional innovation policies and strategies in terms of
Innovation-led growth paths (Deliverable 1.5). List of selected measures for good practice case studies (Deliverable 1.6) An inventory of R&D&I support measures and an impact analysis on regional SMEs,
using primary and secondary data (Deliverable 1.7). Innovation pathways of SMEs in traditional sectors (Deliverable 1.8)
These reports will be complemented by a global analysis at EU level of R&D&I support measures and their impact on the transition of regions from traditional to knowledge based economies on WP2. Resulting from this research study, a set of recommendations regarding more efficient R&D&I measures will be produced and validated at European level, while the participating regions will serve as a test bed for their implementation by including them in the Local Action Plans to be developed and implemented by the UNIC project.
1.2 Identifying a “traditional sector” Our concern is with “traditional manufacturing sectors”. We do not define “traditional” only - or even mainly - according to the standard OECD classification of industries as “high”, “medium” or “low-tech”.1 This approach does not capture the complexities of traditional industries nor does it show the dynamic nature of the firms. For instance, some traditional industries may be low-tech but others are not (e.g., automotive). Indeed, once we define industry at a level meaningful to practitioners - say, at the SIC 4-digit level - characterization of whole industrial sectors as “high”, “medium” or “low-tech” may be misleading. For example, pottery/ceramic products in SIC 262 includes sectors that may operate at different levels of R&D intensity (e.g., SIC 2621 – manufacture of ceramic household and ornamental articles - and SIC 2624 – manufacture of technical ceramics).2 Moreover, even
1 These categories are defined by research and development ‘intensities’ – that is, OECD average shares of research and development expenditure in sales revenue – of, respectively, more than 10 per cent, between 0.9 and 10 per cent, and less than 0.9 per cent. 2 In the British Standard Industrial Classification (SIC), which follows the same classification principles as the EU NACE classification, the principal pottery/ceramic products in SIC 262 comprise SIC 2621 – manufacture of ceramic household and ornamental articles, including table ware, kitchen ware, ornamental articles and toilet articles (excluding large sanitary fixtures); SIC 2622 – manufacture of ceramic sanitary fixtures; SIC 2623 and 2624 – manufacture of technical ceramics; and SIC 2626 –

FP7-SME-2009-1-245459 – GPRIX
Del_1_2_RegionalEconomicFabric_PT.doc Page 4 of 31
the same 4-digit industry may include substantially different intensities with respect to R&D and other types of innovation activity (e.g., commodity earthenware producers and specialists in hotel ware). Our preferred approach to defining “traditional industry” is multi-dimensional, reflecting not only measurable characteristics but also a range of concerns or anxieties. We define as “traditional” those manufacturing industries with at least the majority of the following characteristics.
Long established. Traditional implies history. One interpretation would be that the industry should have been established at least during the inter-war years (1918-1939) if not before. This is sufficiently broad to include, say, the motor industry but to exclude, say, computing. Most of the industries in which we are interested have been established for much longer, such as leather. Strictly speaking, age is both a necessary and sufficient condition for an industry to be classed as “traditional”, which suggests the major theme of longstanding processes or products. However, we are also interested in industries with at least some of the following characteristics: Once a - even the - main source of employment at the sub-regional level (possibly even the regional level in certain cases). In the mature or declining phase of the industry life-cycle, with recent decline typically associated with globalisation. Because these industries are long established, knowledge has diffused and enabled production to develop in and/or be relocated to new locations with lower costs. This applies to at least some of our industries (e.g., ceramics) although not necessarily to all (maybe food processing?). Labour intensive, so that relocation of production to low-wage economies has particularly serious consequences for manual employment in the (sub) regional context. Of course not all aspects of production may be out-sourced to low-wage economies such as design and marketing. However, a key element of the traditional nature of the industries is that some or most of the repetitive, low-skilled, manual work is indeed out-sourced from EU countries. Major sources of wealth creation and employment in regional (or, at least, sub-regional) economies. In spite of recent decline, the traditional industries in which we are interested continue to be important to regional or, at least, sub-regional economies. Retain capacity for innovation, hence the potential to continue as important sources of wealth creation and employment. This issue can be linked to the core competencies where firms will retain what can add value (make strategy) and out-source what the market can produce more cheaply and/or efficiently (buy strategy). Conversely, traditional industries may be ones in which “conditions of low
manufacture of refractory ceramic products (CSO, 1993). Related industries, but outside SIC 262, include the manufacture of ceramic tiles and flags (SIC 2630) as well as bricks, tiles, and construction products (SIC 2640).

FP7-SME-2009-1-245459 – GPRIX
Del_1_2_RegionalEconomicFabric_PT.doc Page 5 of 31
technological opportunities limit innovative entry and restrict the innovative growth of successful established firms” (Breschi et al., 2000, p.393). Recent and often dramatic decline is why we are especially concerned with traditional industries because traditional industries often remain important sources of wealth creation and employment in regional (or, at least, sub-regional) economies they are of concern to public policy; and capacity for innovation is likely to be both a feature of any industry that survives long enough to be classified as traditional and a necessary condition for a positive return on public sector support for these industries.
This potential for innovation may be more associated with particular industry groups (at the NACE/SIC 3-digit and/or 4-digit levels) firms than with the industry as a whole and, possibly, with SMEs rather than with larger and established industry leaders. Accordingly, we should also be careful to distinguish high-tech and dynamic industries or even firms within broadly defined traditional sectors. Evidence of significant capacity to diversify from within a traditional industry towards new, high-growth activities: i.e., the possibility of high-tech and dynamic industry groups emerging within broadly defined traditional sectors. Sectors defined at the NACE/SIC 2-, 3- or even 4-digit level may be sufficiently heterogeneous to give rise to industry groups able to diversify into new technologies and products. An example is the textile industry that as well as the “rag trade” has also witnessed the growth of technical textiles. The general point is to note significant diversification from within traditional industries towards new, high-growth activities. Additional characteristics, although not necessary conditions, of traditional manufacturing industries might also be: Substantial contribution to regional (or, at least, sub-regional) exports, even if the industry has recorded a deteriorating trade balance as part of overall decline associated with growing competition from imports. Geographically concentrated; traditional industries may or may not be geographically concentrated and so constitute a “cluster”. This characteristic can vary between industries where economies of agglomeration are useful for some industries, such as ceramics, but not others.
FP7-SME-2009-1-245459 – GPRIX
Del_1_2_RegionalEconomicFabric_PT.doc Page 6 of 31
2 North and Central Regions - Portugal
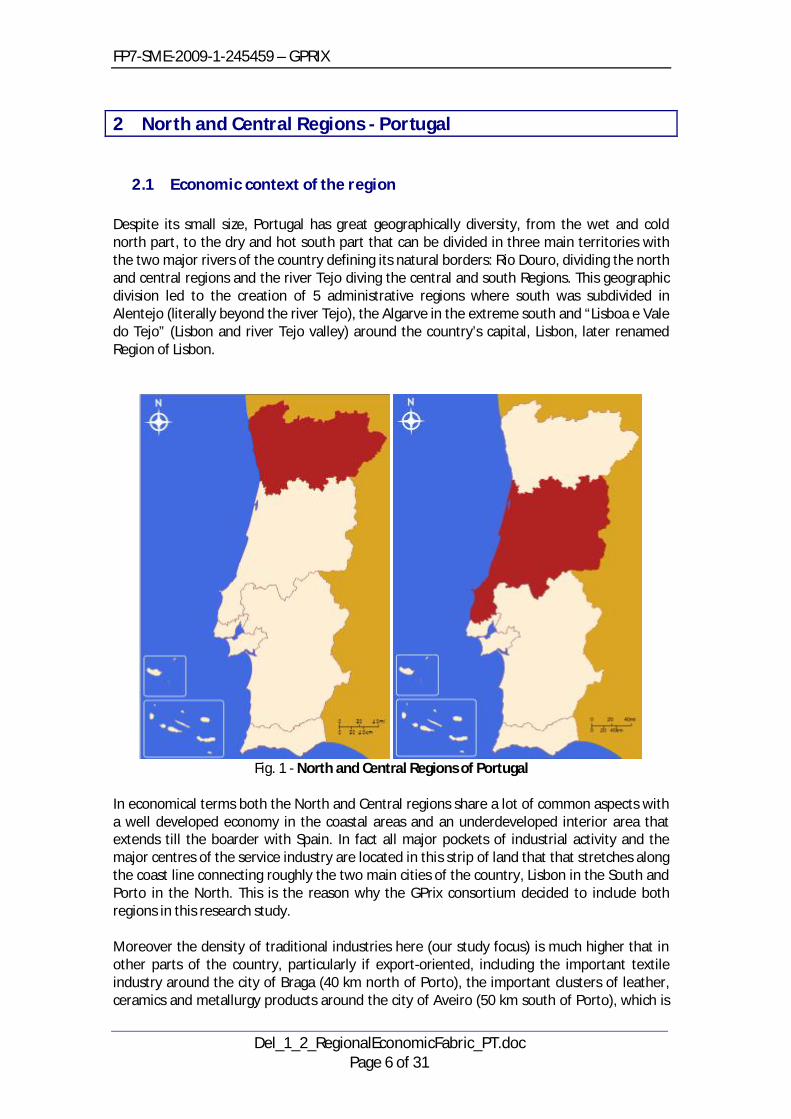
2.1 Economic context of the region Despite its small size, Portugal has great geographically diversity, from the wet and cold north part, to the dry and hot south part that can be divided in three main territories with the two major rivers of the country defining its natural borders: Rio Douro, dividing the north and central regions and the river Tejo diving the central and south Regions. This geographic division led to the creation of 5 administrative regions where south was subdivided in Alentejo (literally beyond the river Tejo), the Algarve in the extreme south and “Lisboa e Vale do Tejo” (Lisbon and river Tejo valley) around the country’s capital, Lisbon, later renamed Region of Lisbon.
Fig. 1 - North and Central Regions of Portugal
In economical terms both the North and Central regions share a lot of common aspects with a well developed economy in the coastal areas and an underdeveloped interior area that extends till the boarder with Spain. In fact all major pockets of industrial activity and the major centres of the service industry are located in this strip of land that that stretches along the coast line connecting roughly the two main cities of the country, Lisbon in the South and Porto in the North. This is the reason why the GPrix consortium decided to include both regions in this research study. Moreover the density of traditional industries here (our study focus) is much higher that in other parts of the country, particularly if export-oriented, including the important textile industry around the city of Braga (40 km north of Porto), the important clusters of leather, ceramics and metallurgy products around the city of Aveiro (50 km south of Porto), which is

FP7-SME-2009-1-245459 – GPRIX
Del_1_2_RegionalEconomicFabric_PT.doc Page 7 of 31
already in the Central region, while the automotive sector is more scattered along both regions as the sector has a much more recent development that the others sectors mentioned above. With this in mind the GPrix consortium decided to cover an area with a focal point in Porto but that extends northwards towards Braga and southwards to the area of Aveiro thus covering two regions.
Fig. 2 – Targeted area of the GPrix study and its relation to population density
Facts & Figures
North Region Central Region Area (km2) 21 284.6 28 202.6 Resident population (ner) 3 745 236 2 385 911 Growth rate of population (average 1995/2007) (%)
0.43 0.37
Population density ( Inh / km2 ) 176.0 84.6 Population < 15 years (%) 15.8 14.0 Population > 65 years (%) 15.3 20.3 Per capita purchasing power (2005) 85.5 83.9
Table 1 – Data about targeted regions (2007)

FP7-SME-2009-1-245459 – GPRIX
Del_1_2_RegionalEconomicFabric_PT.doc Page 8 of 31
Source: Instituto Nacional de Estatística,
Education Level
Fig. 3 – Employees Education Level – North Region (2006) Source: Instituto Nacional de Estatística,
Fig. 4 – Employees Education Level – Central Region (2006) Source: Instituto Nacional de Estatística,

FP7-SME-2009-1-245459 – GPRIX
Del_1_2_RegionalEconomicFabric_PT.doc Page 9 of 31
The following pie chart depicts the number of employees by sector type, showing the increase of the secondary sector.
Employees by Sector
Fig. 5 – Employees according to broad sectors of activity – North Region (2000 - 2006) Source: Instituto Nacional de Estatística,
Fig. 6 – Employees according to broad sectors of activity – Central Region (2000 - 2006) Source: Instituto Nacional de Estatística,
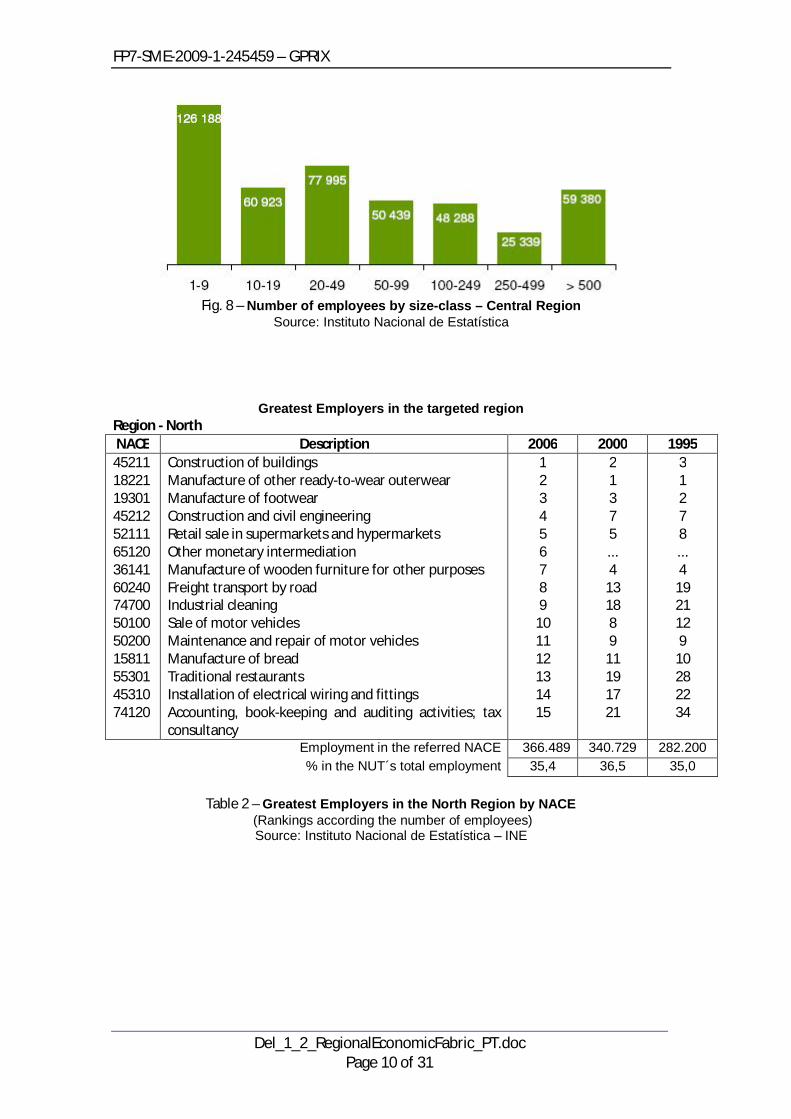
The following chart depicts the number of people employed by firm size with a vast majority of people working in SMEs (598 355 of 745329, over 80%).
Number of employees by size-class
Fig. 6 – Number of employees by size-class – North Region Source: Instituto Nacional de Estatística
FP7-SME-2009-1-245459 – GPRIX
Del_1_2_RegionalEconomicFabric_PT.doc Page 10 of 31
Fig. 8 – Number of employees by size-class – Central Region
Source: Instituto Nacional de Estatística
Greatest Employers in the targeted region Region - North NACE Description 2006 2000 1995 45211 18221 19301 45212 52111 65120 36141 60240 74700 50100 50200 15811 55301 45310 74120
Construction of buildings Manufacture of other ready-to-wear outerwear Manufacture of footwear Construction and civil engineering Retail sale in supermarkets and hypermarkets Other monetary intermediation Manufacture of wooden furniture for other purposes Freight transport by road Industrial cleaning Sale of motor vehicles Maintenance and repair of motor vehicles Manufacture of bread Traditional restaurants Installation of electrical wiring and fittings Accounting, book-keeping and auditing activities; tax consultancy
1 2 3 4 5 6 7 8 9
10 11 12 13 14 15
2 1 3 7 5 ... 4
13 18 8 9
11 19 17 21
3 1 2 7 8 ... 4
19 21 12 9
10 28 22 34
Employment in the referred NACE 366.489 340.729 282.200 % in the NUT´s total employment 35,4 36,5 35,0
Table 2 – Greatest Employers in the North Region by NACE
(Rankings according the number of employees) Source: Instituto Nacional de Estatística – INE
FP7-SME-2009-1-245459 – GPRIX
Del_1_2_RegionalEconomicFabric_PT.doc Page 11 of 31
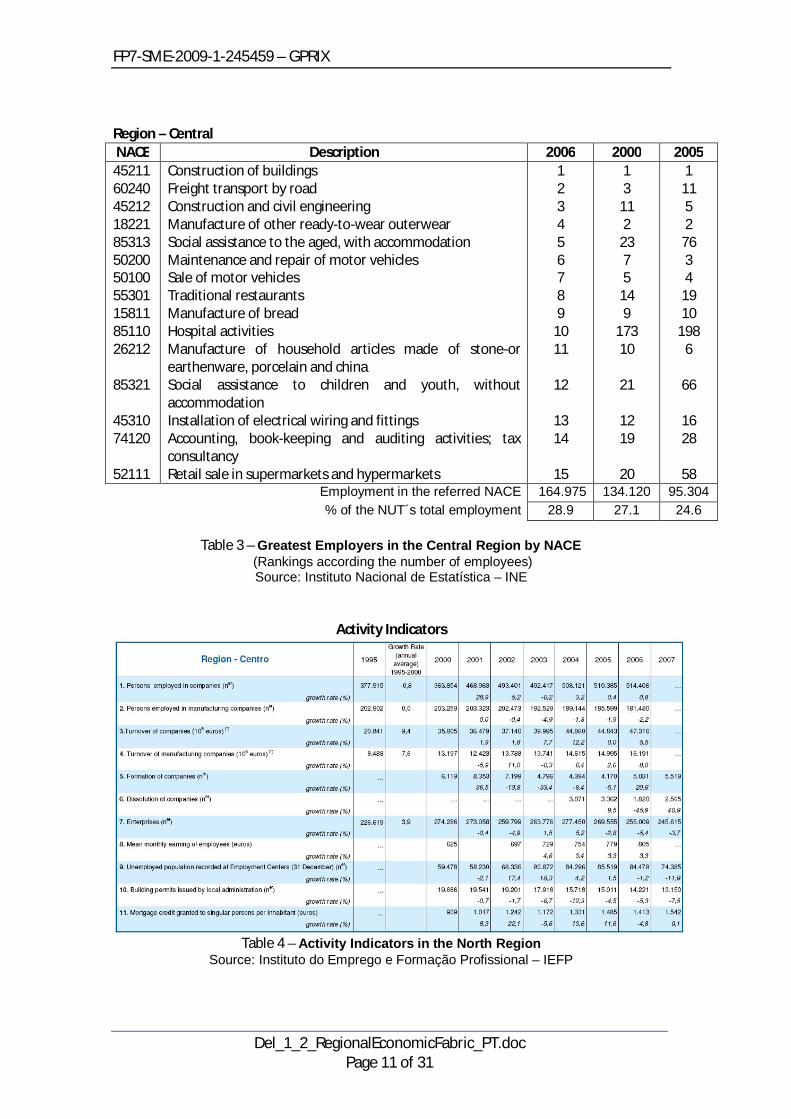
Region – Central NACE Description 2006 2000 2005 45211 60240 45212 18221 85313 50200 50100 55301 15811 85110 26212 85321 45310 74120 52111
Construction of buildings Freight transport by road Construction and civil engineering Manufacture of other ready-to-wear outerwear Social assistance to the aged, with accommodation Maintenance and repair of motor vehicles Sale of motor vehicles Traditional restaurants Manufacture of bread Hospital activities Manufacture of household articles made of stone-or earthenware, porcelain and china Social assistance to children and youth, without accommodation Installation of electrical wiring and fittings Accounting, book-keeping and auditing activities; tax consultancy Retail sale in supermarkets and hypermarkets
1 2 3 4 5 6 7 8 9
10 11
12
13 14
15
1 3
11 2
23 7 5
14 9
173 10
21
12 19
20
1 11 5 2
76 3 4
19 10
198 6
66
16 28
58
Employment in the referred NACE 164.975 134.120 95.304 % of the NUT´s total employment 28.9 27.1 24.6
Table 3 – Greatest Employers in the Central Region by NACE
(Rankings according the number of employees) Source: Instituto Nacional de Estatística – INE
Activity Indicators
Table 4 – Activity Indicators in the North Region
Source: Instituto do Emprego e Formação Profissional – IEFP

FP7-SME-2009-1-245459 – GPRIX
Del_1_2_RegionalEconomicFabric_PT.doc Page 12 of 31
Table 5 – Activity Indicators in the Central Region
Source: Instituto do Emprego e Formação Profissional – IEFP
2.2 SME profiling in the region
2.2.1 SME situation in the region SMEs play a crucial role on the regional economy both in terms of turnover as well as in employment but they are struggling to stay competitive in the global economy. Generally SMEs have common fragilities that prevent them to develop their businesses even further. Some of them are listed below: Insufficient knowledge of the dynamic factors that influence competitiveness
(management, quality, design, innovation, training, marketing, etc). Difficulties in access to raw materials at favourable conditions of price and quality Drop of selling prices and added-value (increased competition) Small size of the domestic market forces internationalisation Even start-ups have to go international at early stage Technological inadequacies of processes and products Insufficient investment in R & D and Innovation Micro-size of most SMEs tempers their innovation Low productivity when compared to EU averages. Weak business cooperation
The importance of the above factors is very different from sector to sector as the incentives to support the efforts of modernization in the last 20 years were put in place. Currently SMEs present an increased use of advanced technology, better cooperation between actors, high product flexibility and all contribute to a good positioning in the international markets in some segments. This commitment to internationalization by SMEs in different sectors (particularly in the covered regions) is an important factor to face future challenges ahead.
FP7-SME-2009-1-245459 – GPRIX
Del_1_2_RegionalEconomicFabric_PT.doc Page 13 of 31
In the current framework of fierce international competition and constant change in the global markets, particularly with the new players from Asia, the competitiveness of SMEs in the region has suffered a major decline. The government plays a key role here and although there were interesting advances recorded in the area of streamlining bureaucratic and administrative processes, there are still some hurdles to be tackled such as much discussed labour law, one of the most rigid in EU countries, that fails to meet the needs of the current business environment. Collaboration is another key factor for success and in this field there’s still a lot to do by establishing alliances with external partners, namely in PALOP’s countries (Portuguese Speaking African Countries) taking advantage of the good relations with those countries and in particular with Angola where the recent economic boom has brought the country to the exclusive club of the fastest growing economies of the world. This strategy also implies the reinforcement of the local networks to explore the dynamics of the sector resulting from a corporate structure dominated by SMEs. Through sectoral associations and clustering some collaborative lines have been explored in the last years but the more efforts are required to foster partnerships and to find common goals in order to raise SMEs competitiveness. As a result of this strategy, in 2009 the government launch a collaboration policy programme by setting up Competitiveness Poles for each sector to bring together under the same structure several actors on that field, from SMEs and big companies to universities and research centres. A total of 17 poles were setup to define a common strategy in each area and to promote specific projects targeting common objectives (called “Mobilizadores” or mobilising projects, in English). These big projects are subdivided in sub-projects where SMEs play an active part by addressing their specific innovation plans according to their needs but in the other hand by adjusting SMEs objectives to the overall goal of the Competitiveness Pole.

FP7-SME-2009-1-245459 – GPRIX
Del_1_2_RegionalEconomicFabric_PT.doc Page 14 of 31
2.2.2 SMEs in traditional sectors The vast majority of companies in both regions are SMEs and the same happens in the sub-group of traditional sectors. The following table compares main traditional sector characteristics against each sector and clearly shows that these sectors have a common set of characteristics usually found in many traditional industries across Europe.
Sector Main traditional sector characteristics
Ceramics Textiles Leather Metallurgy / Mechanical engineering
Automotive
1. Long established Yes Yes Yes Yes Yes 2. Main source of
employment (at least in certain sub-regions)
Yes Yes Yes Yes Yes
3. Mature and declining
Yes No No No Yes
4. Labour intensive (relative to the average for manufacturing industry in the region)
Yes Yes Yes Yes Yes
5. Main source of wealth creation (at least in certain sub-regions)
Yes Yes Yes Yes Yes
6. Innovation capacity
Yes Yes Yes Yes Yes
7. Capacity to diversify into new, high-growth activities
Yes Yes Yes Yes Yes
8. Export-led contribution
Yes Yes Yes Yes Yes
9. Cluster location (relevant for at least significant industries within the sector)
Yes Yes Yes Yes Yes
Table 6 – Traditional manufacturing sectors in the North and Central Regions: traditional characteristics matrix
It may useful to explain the few negative matches in characteristic 3. (“Mature and declining”) as these reflect some particular characteristics found in the region. In fact, textile, leather and mechanical sectors although mature, had a steady growth in recent years and therefore cannot be properly called a “declining industry” (despite the decrease in the number of jobs) as they become more and more competitive and are having a decisive contribution to raise the volume of exports.
FP7-SME-2009-1-245459 – GPRIX
Del_1_2_RegionalEconomicFabric_PT.doc Page 15 of 31
The analysis of e economic fabric of the region sector by sector will be presented next, covering the following traditional sectors:
Textiles; Leather; Ceramics; Automotive; Mechanical, Metallurgy and Mechanical engineering.
Textiles – C13 Textile is one of most well-know Portuguese sectors in external markets due to the exporting character of the industry. In part this the result of an early internationalization process that started in 1960 with the adhesion to EFTA (European Free Trade Association) as a founder member together with Austria, Denmark, Norway, Sweden, Switzerland and the UK. In the sixties the development continued to expand mainly based on the competitive price and flexibility of production. EFTA was a valuable experience for its members and in particular for Portugal that had an urgent need to increase exports. The know-how created in aspects like business relationship, design collaboration and manufacturing processes would later become crucial in the process of integration in the European Union. Since then, the industry has evolved from the classical low-cost manufacturing industry to a complete cluster covering from design, brand management, marketing to innovative new products such as technical textiles, a direct outcome of an intense collaboration with R&D centres and universities, in particular with the University of Braga which is now a textile knowledge centre recognized internationally. This important transformation didn’t arrive without a price and many companies failed to cope with these changes and entered in decline soon after the fiercely competition from Eastern Asian countries, like China, hit the European markets. However this is not new for an industry that has always suffered from periods of huge growth followed by regression in line with the economic cycles. This great capacity to adapt to new realities was always a major strength of the sector and the recent crisis once again is challenging the best companies in the industry to carry out the required restructuring to be able to overcome current and future challenges. Nowadays, the textile industry is still one of the most important sectors of the Portuguese economy. It represents around 11% of total exports, 22% of the turnover of the manufacturing industry and 7% of production, involving 7,000 companies from which almost 96% are SMEs. Despite this figures, in the last decade, 20% of orders were diverted to an expanding market: Asia, clearly shows the sector must undertake serious changes to become competitive.
FP7-SME-2009-1-245459 – GPRIX
Del_1_2_RegionalEconomicFabric_PT.doc Page 16 of 31
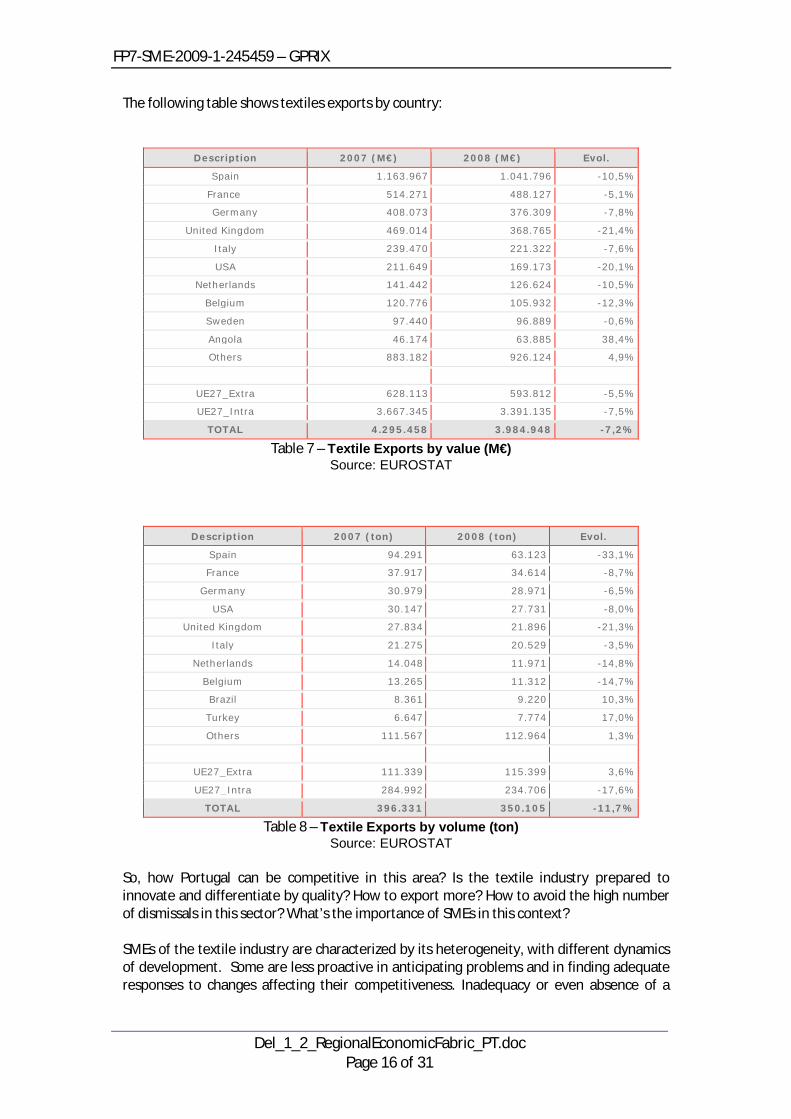
The following table shows textiles exports by country:
Description 2007 (M€) 2008 (M€) Evol.
Spain 1.163.967 1.041.796 -10,5%
France 514.271 488.127 -5,1%
Germany 408.073 376.309 -7,8%
United Kingdom 469.014 368.765 -21,4%
Italy 239.470 221.322 -7,6%
USA 211.649 169.173 -20,1%
Netherlands 141.442 126.624 -10,5%
Belgium 120.776 105.932 -12,3%
Sweden 97.440 96.889 -0,6%
Angola 46.174 63.885 38,4%
Others 883.182 926.124 4,9%
UE27_Extra 628.113 593.812 -5,5%
UE27_Intra 3.667.345 3.391.135 -7,5%
TOTAL 4.295.458 3.984.948 -7,2%
Table 7 – Textile Exports by value (M€) Source: EUROSTAT
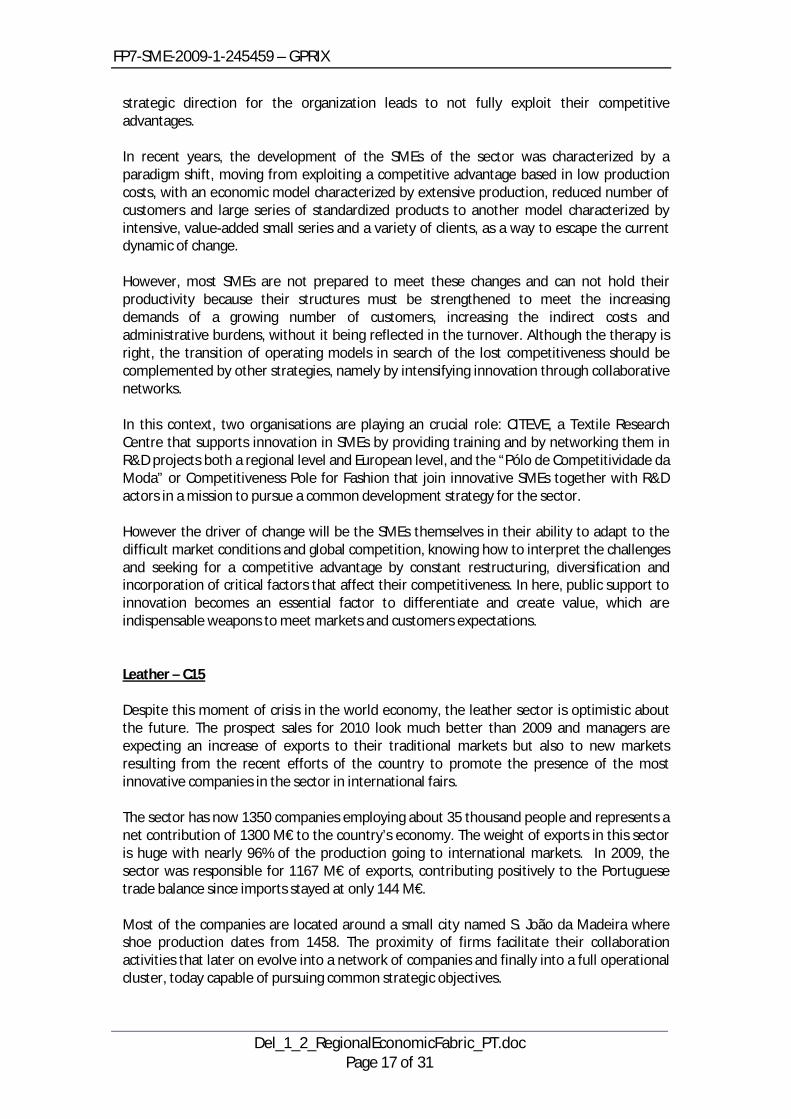
Description 2007 (ton) 2008 (ton) Evol.
Spain 94.291 63.123 -33,1%
France 37.917 34.614 -8,7%
Germany 30.979 28.971 -6,5%
USA 30.147 27.731 -8,0%
United Kingdom 27.834 21.896 -21,3%
Italy 21.275 20.529 -3,5%
Netherlands 14.048 11.971 -14,8%
Belgium 13.265 11.312 -14,7%
Brazil 8.361 9.220 10,3%
Turkey 6.647 7.774 17,0%
Others 111.567 112.964 1,3%
UE27_Extra 111.339 115.399 3,6%
UE27_Intra 284.992 234.706 -17,6%
TOTAL 396.331 350.105 -11,7%
Table 8 – Textile Exports by volume (ton) Source: EUROSTAT
So, how Portugal can be competitive in this area? Is the textile industry prepared to innovate and differentiate by quality? How to export more? How to avoid the high number of dismissals in this sector? What’s the importance of SMEs in this context? SMEs of the textile industry are characterized by its heterogeneity, with different dynamics of development. Some are less proactive in anticipating problems and in finding adequate responses to changes affecting their competitiveness. Inadequacy or even absence of a
FP7-SME-2009-1-245459 – GPRIX
Del_1_2_RegionalEconomicFabric_PT.doc Page 17 of 31
strategic direction for the organization leads to not fully exploit their competitive advantages. In recent years, the development of the SMEs of the sector was characterized by a paradigm shift, moving from exploiting a competitive advantage based in low production costs, with an economic model characterized by extensive production, reduced number of customers and large series of standardized products to another model characterized by intensive, value-added small series and a variety of clients, as a way to escape the current dynamic of change. However, most SMEs are not prepared to meet these changes and can not hold their productivity because their structures must be strengthened to meet the increasing demands of a growing number of customers, increasing the indirect costs and administrative burdens, without it being reflected in the turnover. Although the therapy is right, the transition of operating models in search of the lost competitiveness should be complemented by other strategies, namely by intensifying innovation through collaborative networks. In this context, two organisations are playing an crucial role: CITEVE, a Textile Research Centre that supports innovation in SMEs by providing training and by networking them in R&D projects both a regional level and European level, and the “Pólo de Competitividade da Moda” or Competitiveness Pole for Fashion that join innovative SMEs together with R&D actors in a mission to pursue a common development strategy for the sector. However the driver of change will be the SMEs themselves in their ability to adapt to the difficult market conditions and global competition, knowing how to interpret the challenges and seeking for a competitive advantage by constant restructuring, diversification and incorporation of critical factors that affect their competitiveness. In here, public support to innovation becomes an essential factor to differentiate and create value, which are indispensable weapons to meet markets and customers expectations. Leather – C15 Despite this moment of crisis in the world economy, the leather sector is optimistic about the future. The prospect sales for 2010 look much better than 2009 and managers are expecting an increase of exports to their traditional markets but also to new markets resulting from the recent efforts of the country to promote the presence of the most innovative companies in the sector in international fairs. The sector has now 1350 companies employing about 35 thousand people and represents a net contribution of 1300 M€ to the country’s economy. The weight of exports in this sector is huge with nearly 96% of the production going to international markets. In 2009, the sector was responsible for 1167 M€ of exports, contributing positively to the Portuguese trade balance since imports stayed at only 144 M€. Most of the companies are located around a small city named S. João da Madeira where shoe production dates from 1458. The proximity of firms facilitate their collaboration activities that later on evolve into a network of companies and finally into a full operational cluster, today capable of pursuing common strategic objectives.

FP7-SME-2009-1-245459 – GPRIX
Del_1_2_RegionalEconomicFabric_PT.doc Page 18 of 31
This rather optimistic scenario results partially from the investments in innovation done in the last decade. From simple production plants targeting subcontracting of the major European brands, the leather industry was capable of moving up on the supply chain to produce high-quality, highly fashionable articles, taking advantage of the extensive know-how accumulated throughout the years and a remarkable networking capacity to develop luxury goods and by this way differentiate from competitors, namely from Eastern Asia. Two major vectors must be detailed. One came from the technological aspects with introduction of new manufacturing techniques that arose from the collaboration with technological centres mostly supported by national innovation programmes. Technologies like CAD, lean manufacturing and remote communications led to an increase of efficiency and efficacy of the industry when reacting to demand, creating a the same time, a whole new business area of solution providers to the leather industry that use the industry as a testbed for their innovative products. Another important vector is internationalization, a crucial survival factor for the industry, by which the industry tried to maintain the competitiveness while moving its competitive advantage from low production costs to trendy fashion designs, from price to quality. The presence in the main fairs around the globe was again partially financed by support programmes specifically designed to foster the internationalization of the Portuguese SMEs. At the same time, the recent development of the fashion industry in Portugal provided the ideal partner to boost the required changes in the industry. Joint participation in fairs and business missions are the most common but, and most important, the regular collaboration between fashion and leather industries (the same happen in textiles) where designers get in close contact with the industry needs and the markets created a symbiotic relationship capable of producing new brands for those new markets while keeping the IPR ownership. Slowly this has been paving the way to a new image of the industry, an image of high quality at competitive prices with a high level responsiveness to market variations and capable of playing seriously in the exclusive niche of luxury products. This tendency that can be observed, for example, in the names of the brands just created for the international luxury market (Luis Onofre, Miguel Vieira, Carlos Santos, etc), with shoe companies branding the name of the designer in Portuguese instead of the usual Anglo-Saxon or Italian names that generally people believed had more impact internationally. Other stakeholders like policy makers, usually more focused on the so-called “new” industries, are becoming more and more ware of the importance of this sector and new measure was designed to support the creation of Competitiveness Poles for Fashion and Manufacturing (“Pólo de Competitividade da Moda” and PRODUTECH – “Pólo das Tecnologias de Produção”). These poles join together all major actors of the industry, including SMEs, and their mission in to define common strategic objectives for the sector. In conclusion, the leather sector, despite being considered in the past as an industry in decline was capable to find a way not only to survive but to become a major leverage of the Portuguese economy. The relevant changes implemented in the last two decades have changed the dark horizon into a one of the most competitive sectors of the country aligned with the strategic objectives defined for the country’s economy of internationalization and competitiveness of the economic fabric through innovation and new marketing approaches. The recent certification of the shoe company A J. Sampaio & Irmão as an “Innovative SME”, the first SME from traditional sectors that achieved this certification, may be only the first

FP7-SME-2009-1-245459 – GPRIX
Del_1_2_RegionalEconomicFabric_PT.doc Page 19 of 31
sign of what comes ahead as more and more firms adopt innovation processes in their daily operation. Let’s hope that enough incentives are provided to support these efforts and that the future innovation support programmes will take this in consideration. Ceramics – C23 Portugal has strong traditions in the sector due to the availability and high-quality of raw materials and the extensive know-how built over the centuries. The country is internationally recognized by the high-quality of its ceramic products but apparently this image is not enough to conquer international markets as competition gets tougher and tougher. In fact, the ceramic sector has been declining in the last decade and it is now facing huge difficulties to recover its competitiveness again. Its economic sustainability is highly dependent of foreign markets and its future will be surely based on the capacity of firms to supply high-quality, high added value products to those markets resulting from innovation and design. In the last decade, over 150 companies had closed doors raising the concerns about the sector future even if the total production remained stable as most of them were micro enterprises. Some successful experiences in the luxury market is paving the way to regain competitiveness in the sector. In fact, this niche market can absorb annually 10% of all exports in the sector, generating a turnover of 60 million euros and involving about 40 companies. The recent crisis in the global economy only reinforces the need to keep seizing the opportunities in the sector and in some cases this is being done. However the sector will only be capable of answering those needs if some structural changes are implemented in the short-term. After the important effort of modernization since Portugal’s adhesion to the European Union in 1986, the sector is now much better prepared to face those challenges but they need not only to embrace innovation and design but they also need to develop their know-how on consumer and market behaviour to really take advantage of those opportunities. Nevertheless, sector representatives are optimistic about the future and some signs of recovery of exports in the first semester of 2010. In the words of Mr. Jose Sequeira, executive vice president of the Portuguese Association of the Ceramic Industry (APICER): “Portuguese firms are structured to respond to this threat, have done their homework in terms of innovation and design. This means that the problem is, often, a market problem. Once you reopen that market, companies are able to respond, because we really are well scaled to meet immediate needs. We are sufficiently innovative, creative, we have capacity in the market and we have know-how that allows us to be well positioned to respond whenever opportunities arise.” 3 Fact and figures
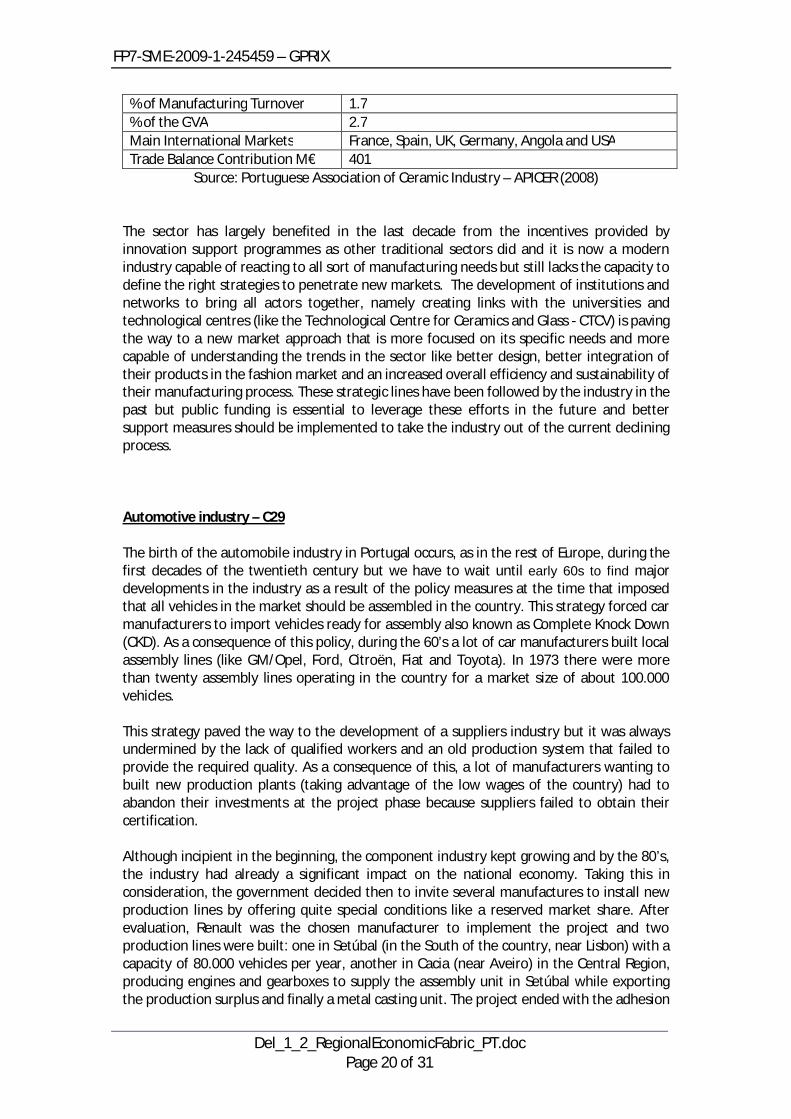
Companies 703 Jobs 22 994 Turnover M€ 1.2247 Exports Turnover M€ 592.9 % of Exports 48.4 % of Total Exports 1.58
3 Interview published in newspaper “Expresso das Ilhas” – Cap Vert, 21-2-2010
FP7-SME-2009-1-245459 – GPRIX
Del_1_2_RegionalEconomicFabric_PT.doc Page 20 of 31
% of Manufacturing Turnover 1.7 % of the GVA 2.7 Main International Markets France, Spain, UK, Germany, Angola and USA Trade Balance Contribution M€ 401
Source: Portuguese Association of Ceramic Industry – APICER (2008)
The sector has largely benefited in the last decade from the incentives provided by innovation support programmes as other traditional sectors did and it is now a modern industry capable of reacting to all sort of manufacturing needs but still lacks the capacity to define the right strategies to penetrate new markets. The development of institutions and networks to bring all actors together, namely creating links with the universities and technological centres (like the Technological Centre for Ceramics and Glass - CTCV) is paving the way to a new market approach that is more focused on its specific needs and more capable of understanding the trends in the sector like better design, better integration of their products in the fashion market and an increased overall efficiency and sustainability of their manufacturing process. These strategic lines have been followed by the industry in the past but public funding is essential to leverage these efforts in the future and better support measures should be implemented to take the industry out of the current declining process. Automotive industry – C29 The birth of the automobile industry in Portugal occurs, as in the rest of Europe, during the first decades of the twentieth century but we have to wait until early 60s to find major developments in the industry as a result of the policy measures at the time that imposed that all vehicles in the market should be assembled in the country. This strategy forced car manufacturers to import vehicles ready for assembly also known as Complete Knock Down (CKD). As a consequence of this policy, during the 60’s a lot of car manufacturers built local assembly lines (like GM/Opel, Ford, Citroën, Fiat and Toyota). In 1973 there were more than twenty assembly lines operating in the country for a market size of about 100.000 vehicles. This strategy paved the way to the development of a suppliers industry but it was always undermined by the lack of qualified workers and an old production system that failed to provide the required quality. As a consequence of this, a lot of manufacturers wanting to built new production plants (taking advantage of the low wages of the country) had to abandon their investments at the project phase because suppliers failed to obtain their certification. Although incipient in the beginning, the component industry kept growing and by the 80’s, the industry had already a significant impact on the national economy. Taking this in consideration, the government decided then to invite several manufactures to install new production lines by offering quite special conditions like a reserved market share. After evaluation, Renault was the chosen manufacturer to implement the project and two production lines were built: one in Setúbal (in the South of the country, near Lisbon) with a capacity of 80.000 vehicles per year, another in Cacia (near Aveiro) in the Central Region, producing engines and gearboxes to supply the assembly unit in Setúbal while exporting the production surplus and finally a metal casting unit. The project ended with the adhesion
FP7-SME-2009-1-245459 – GPRIX
Del_1_2_RegionalEconomicFabric_PT.doc Page 21 of 31
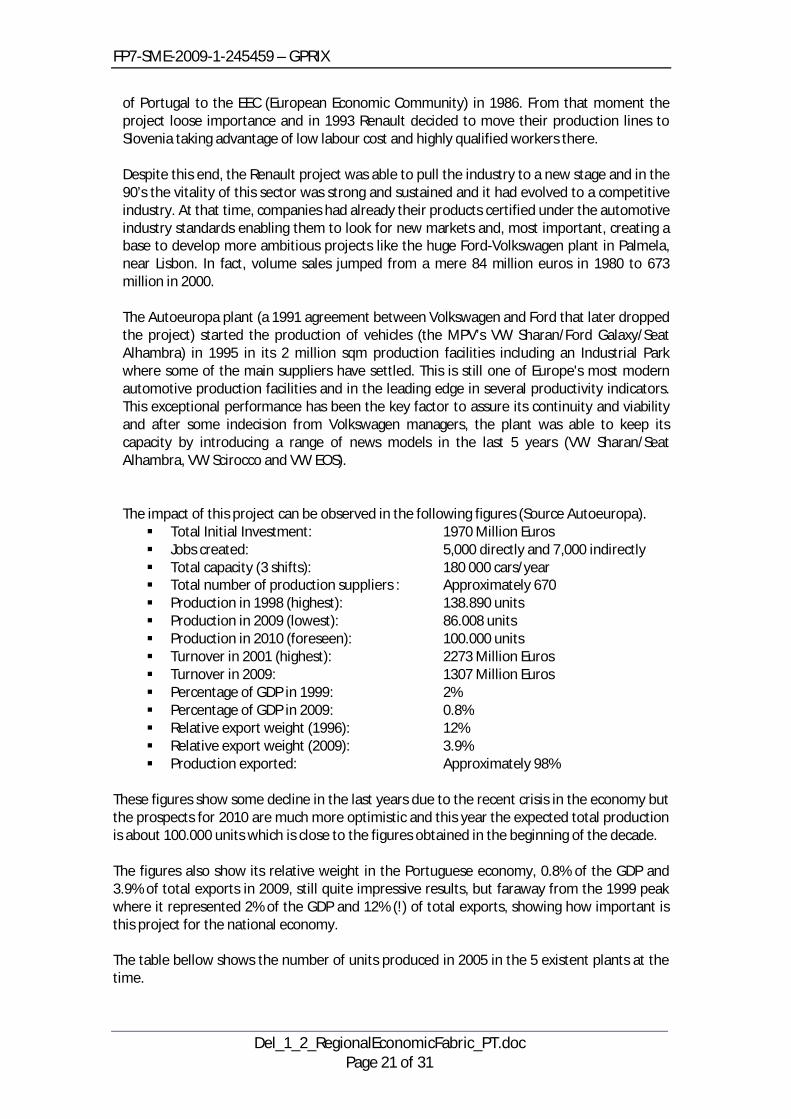
of Portugal to the EEC (European Economic Community) in 1986. From that moment the project loose importance and in 1993 Renault decided to move their production lines to Slovenia taking advantage of low labour cost and highly qualified workers there. Despite this end, the Renault project was able to pull the industry to a new stage and in the 90’s the vitality of this sector was strong and sustained and it had evolved to a competitive industry. At that time, companies had already their products certified under the automotive industry standards enabling them to look for new markets and, most important, creating a base to develop more ambitious projects like the huge Ford-Volkswagen plant in Palmela, near Lisbon. In fact, volume sales jumped from a mere 84 million euros in 1980 to 673 million in 2000. The Autoeuropa plant (a 1991 agreement between Volkswagen and Ford that later dropped the project) started the production of vehicles (the MPV’s VW Sharan/Ford Galaxy/Seat Alhambra) in 1995 in its 2 million sqm production facilities including an Industrial Park where some of the main suppliers have settled. This is still one of Europe's most modern automotive production facilities and in the leading edge in several productivity indicators. This exceptional performance has been the key factor to assure its continuity and viability and after some indecision from Volkswagen managers, the plant was able to keep its capacity by introducing a range of news models in the last 5 years (VW Sharan/Seat Alhambra, VW Scirocco and VW EOS). The impact of this project can be observed in the following figures (Source Autoeuropa). Total Initial Investment: 1970 Million Euros Jobs created: 5,000 directly and 7,000 indirectly Total capacity (3 shifts): 180 000 cars/year Total number of production suppliers : Approximately 670 Production in 1998 (highest): 138.890 units Production in 2009 (lowest): 86.008 units Production in 2010 (foreseen): 100.000 units Turnover in 2001 (highest): 2273 Million Euros Turnover in 2009: 1307 Million Euros Percentage of GDP in 1999: 2% Percentage of GDP in 2009: 0.8% Relative export weight (1996): 12% Relative export weight (2009): 3.9% Production exported: Approximately 98%
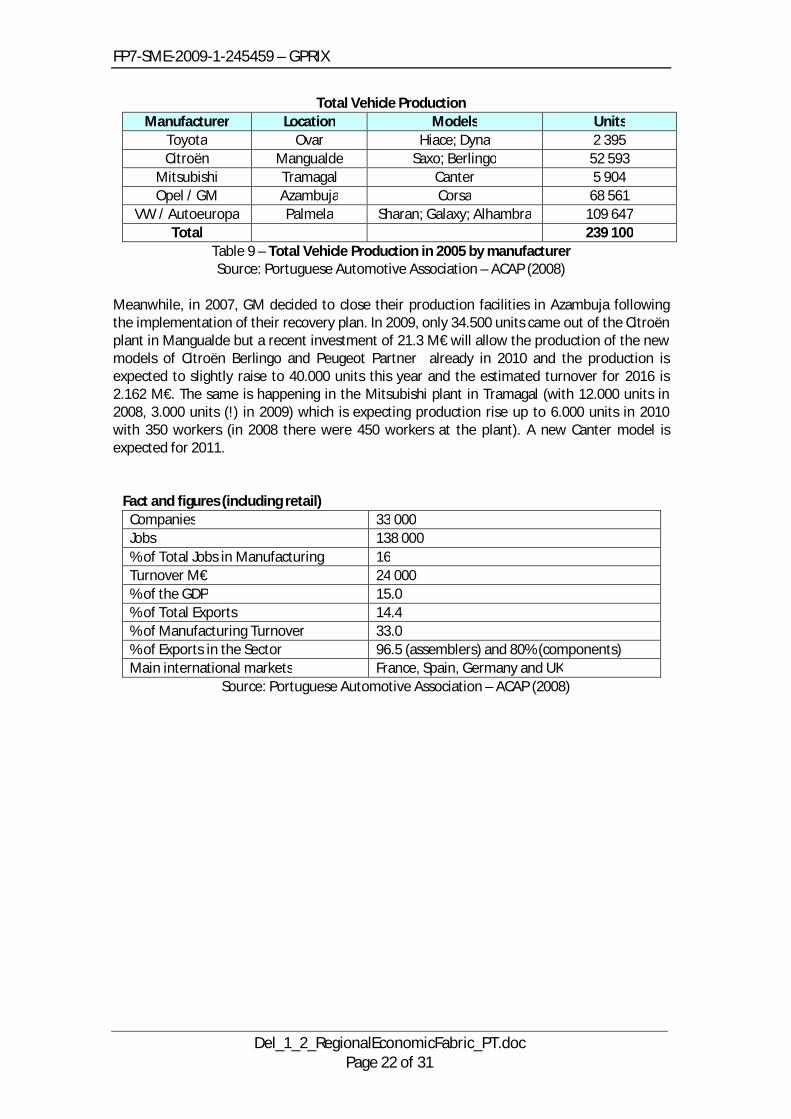
These figures show some decline in the last years due to the recent crisis in the economy but the prospects for 2010 are much more optimistic and this year the expected total production is about 100.000 units which is close to the figures obtained in the beginning of the decade. The figures also show its relative weight in the Portuguese economy, 0.8% of the GDP and 3.9% of total exports in 2009, still quite impressive results, but faraway from the 1999 peak where it represented 2% of the GDP and 12% (!) of total exports, showing how important is this project for the national economy. The table bellow shows the number of units produced in 2005 in the 5 existent plants at the time.
FP7-SME-2009-1-245459 – GPRIX
Del_1_2_RegionalEconomicFabric_PT.doc Page 22 of 31
Total Vehicle Production Manufacturer Location Models Units
Toyota Ovar Hiace; Dyna 2 395 Citroën Mangualde Saxo; Berlingo 52 593
Mitsubishi Tramagal Canter 5 904 Opel / GM Azambuja Corsa 68 561
VW / Autoeuropa Palmela Sharan; Galaxy; Alhambra 109 647 Total 239 100
Table 9 – Total Vehicle Production in 2005 by manufacturer Source: Portuguese Automotive Association – ACAP (2008)
Meanwhile, in 2007, GM decided to close their production facilities in Azambuja following the implementation of their recovery plan. In 2009, only 34.500 units came out of the Citroën plant in Mangualde but a recent investment of 21.3 M€ will allow the production of the new models of Citroën Berlingo and Peugeot Partner already in 2010 and the production is expected to slightly raise to 40.000 units this year and the estimated turnover for 2016 is 2.162 M€. The same is happening in the Mitsubishi plant in Tramagal (with 12.000 units in 2008, 3.000 units (!) in 2009) which is expecting production rise up to 6.000 units in 2010 with 350 workers (in 2008 there were 450 workers at the plant). A new Canter model is expected for 2011.
Fact and figures (including retail) Companies 33 000 Jobs 138 000 % of Total Jobs in Manufacturing 16 Turnover M€ 24 000 % of the GDP 15.0 % of Total Exports 14.4 % of Manufacturing Turnover 33.0 % of Exports in the Sector 96.5 (assemblers) and 80% (components) Main international markets France, Spain, Germany and UK
Source: Portuguese Automotive Association – ACAP (2008)
FP7-SME-2009-1-245459 – GPRIX
Del_1_2_RegionalEconomicFabric_PT.doc Page 23 of 31
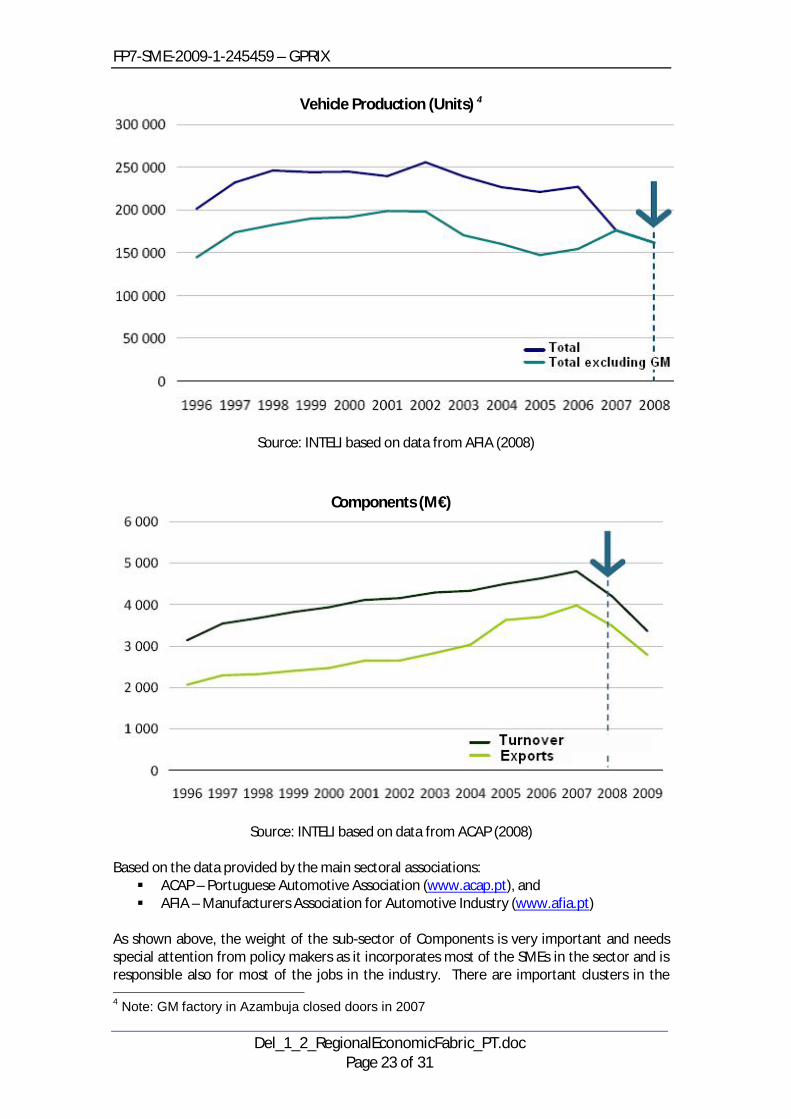
Vehicle Production (Units) 4
Source: INTELI based on data from AFIA (2008)
Components (M€)
Source: INTELI based on data from ACAP (2008) Based on the data provided by the main sectoral associations: ACAP – Portuguese Automotive Association (www.acap.pt), and AFIA – Manufacturers Association for Automotive Industry (www.afia.pt)
As shown above, the weight of the sub-sector of Components is very important and needs special attention from policy makers as it incorporates most of the SMEs in the sector and is responsible also for most of the jobs in the industry. There are important clusters in the 4 Note: GM factory in Azambuja closed doors in 2007
FP7-SME-2009-1-245459 – GPRIX
Del_1_2_RegionalEconomicFabric_PT.doc Page 24 of 31
covered regions particularly in the North Region with many component suppliers around the city of Porto Central Region with a competitive industry of moulds around the city of Leiria (see the analysis of this sub-region in the next paragraph dedicated to metal products). Two important associations of firms have a major role in the development of the components sub-sector of the automotive industry in the Central Region:
CEFAMOL - National Association of Casting Industry; www.cefamol.pt CENTIMFE - Technological Centre for the Moulds, Special Tooling and Plastics
www.centimfe.pt Together with several other organisations of the region, a Regional RTD Network was created to build a common strategy and establish the critical mass required to promote a change in the competitiveness of this exporting sector. In 1999 the North Region created a R&D structure to specifically support the automotive industry of the region:
CEIIA – Centre of Excellence and Innovation in the Automotive Industry www.ceiia.pt, an association of suppliers of the automotive industry.
CEIIA was created to address the need and opportunity to build a centre specially focused on the automotive industry with the following objectives:
a) Reinforce cooperation between players and initiatives; b) Preview of strategy changes on customers, products and technologies; c) Capacitate the Portuguese auto industry in terms of HR, product development and
R&D; d) Develop value chains of OEMs in Portugal and near markets; e) Development of supplying strategies from the national component industry to
existent and new customers on global markets; f) Specialize the Portuguese auto industry on conception, development, manufacturing
and validation of new generations of automotive vehicles, components and powertrain;
g) Attract foreign direct investment oriented to the development and production capacity, new specialization profiles and market segments and emerging OEMs.
Following the government plan of setting up competitiveness poles in all sectors, CEIIA become in 2010 the leader of the Technology and Competitiveness Pole for Mobility with the specific role of improving competitiveness of the whole mobility industry sector in Portugal. In 2008 the Portuguese government created a specific programme to help companies in the automotive sector to overcome the economic crisis. The PASA programme (Automotive Sector Support Plan) was an opportunity for companies to fight against the sector crisis, with a 50% drop in sales and a 30% drop in turnover in 2008 while trying to prevent future lay-offs (estimated in 18.000 jobs). Moreover the programme also intended to support the companies trying to overcome some of the old structural problems of the sector, like: Low capacity to react to changes in the market Increasing production costs (raw materials, energy and interest rates) Constant need of investment in a qualified workforce No direct connection with the market (low level on the supply chain) Mostly are PMEs and therefore very sensible to market variations.

FP7-SME-2009-1-245459 – GPRIX
Del_1_2_RegionalEconomicFabric_PT.doc Page 25 of 31
The impact of the programme in the industry is still unknown but current figures are encouraging showing a timid recovery although surely correlated with the recent recovery of the world economy. All these positive signs are contributing for the sector recovery and a 20% raise in production is expected by the end of 2010. However, these positive developments are relative to the year 2009, an abnormally low production year, so when comparing the production of this year with the average of the last five years, a completely different picture appears as production is 13.7% below average, showing that the recovery is on its way but we still need a few years for a complete recovery. Mechanical/Metallurgy/ Mechanical engineering – C24/C25/C28
In macroeconomic terms, the metallurgical/Mechanical sector holds a very important position in national economy being responsible for 5% of Turnover and 6% of Gross Value Added (GVA) and jobs created in the country. Most of the companies in the sector are located in the regions covered by our study and most of them are small to medium enterprises. The industry is concentrated mainly in industrialized areas along the coastal areas. Fact and figures
Companies 20 897 % of Total Manufacturing Companies
26
Jobs 182 467 % of Total Jobs in Manufacturing 21 Turnover M€ 15 890 Gross Value Added (GVA) M€ 4 387 Exports Turnover M€ 10 201 % of Total Exports 30 % of Manufacturing Turnover 22 % of Manufacturing GVA 22 Main International markets France, Spain, UK, Germany, Italy, Belgium and
Angola Imports Turnover M€ 16 299 % of Total Imports 31 Import/Export Coverage rate % 63
Source: National Association of Metallurgical and Metalworking Enterprises – ANEMM (2008)
Trade relations are mainly within the European Community, notably to Spain, Germany, France, Italy, UK and Belgium. The Angolan market is one of the most promising for the future and is becoming an important destination for the exports of the sector with a steady average growth of approximately 5% in the last 5 years. The sector occupies an important position in the context of manufacturing industry: owning about 26% of companies employing 21% of its workforce accounting for 22% of its turnover accounting for 23% of its value added
FP7-SME-2009-1-245459 – GPRIX
Del_1_2_RegionalEconomicFabric_PT.doc Page 26 of 31
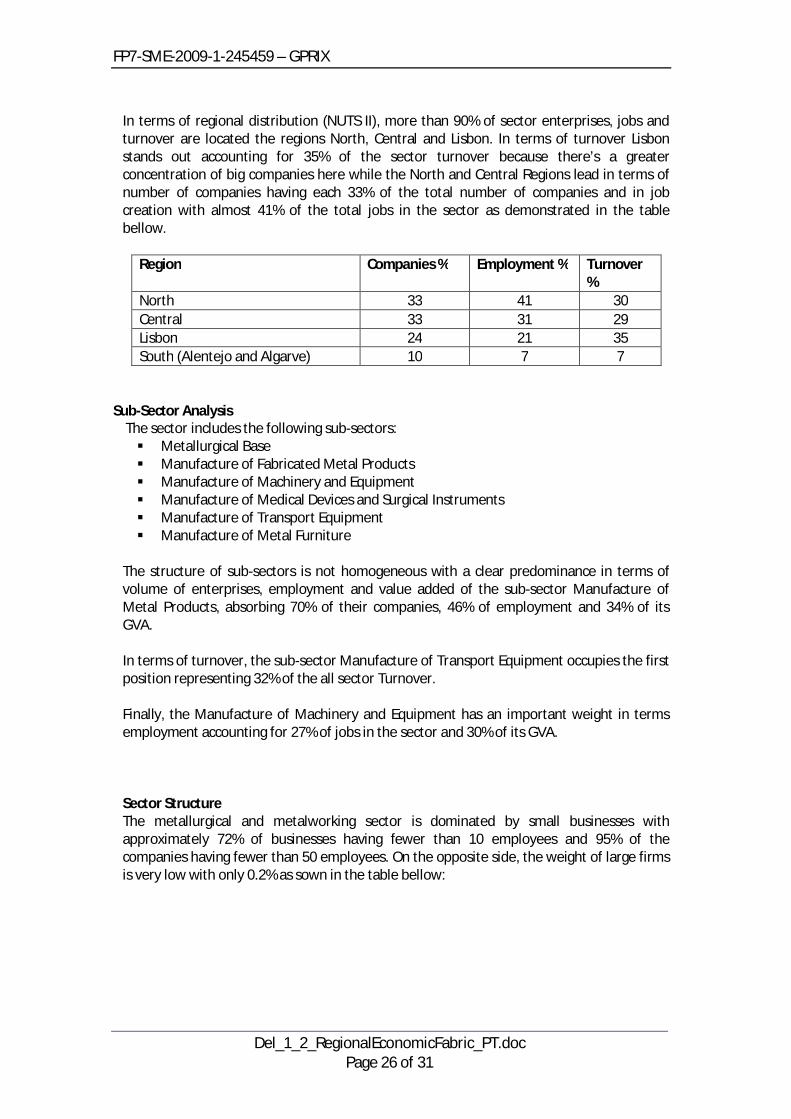
In terms of regional distribution (NUTS II), more than 90% of sector enterprises, jobs and turnover are located the regions North, Central and Lisbon. In terms of turnover Lisbon stands out accounting for 35% of the sector turnover because there’s a greater concentration of big companies here while the North and Central Regions lead in terms of number of companies having each 33% of the total number of companies and in job creation with almost 41% of the total jobs in the sector as demonstrated in the table bellow.
Region Companies % Employment % Turnover %
North 33 41 30 Central 33 31 29 Lisbon 24 21 35 South (Alentejo and Algarve) 10 7 7
Sub-Sector Analysis The sector includes the following sub-sectors: Metallurgical Base Manufacture of Fabricated Metal Products Manufacture of Machinery and Equipment Manufacture of Medical Devices and Surgical Instruments Manufacture of Transport Equipment Manufacture of Metal Furniture
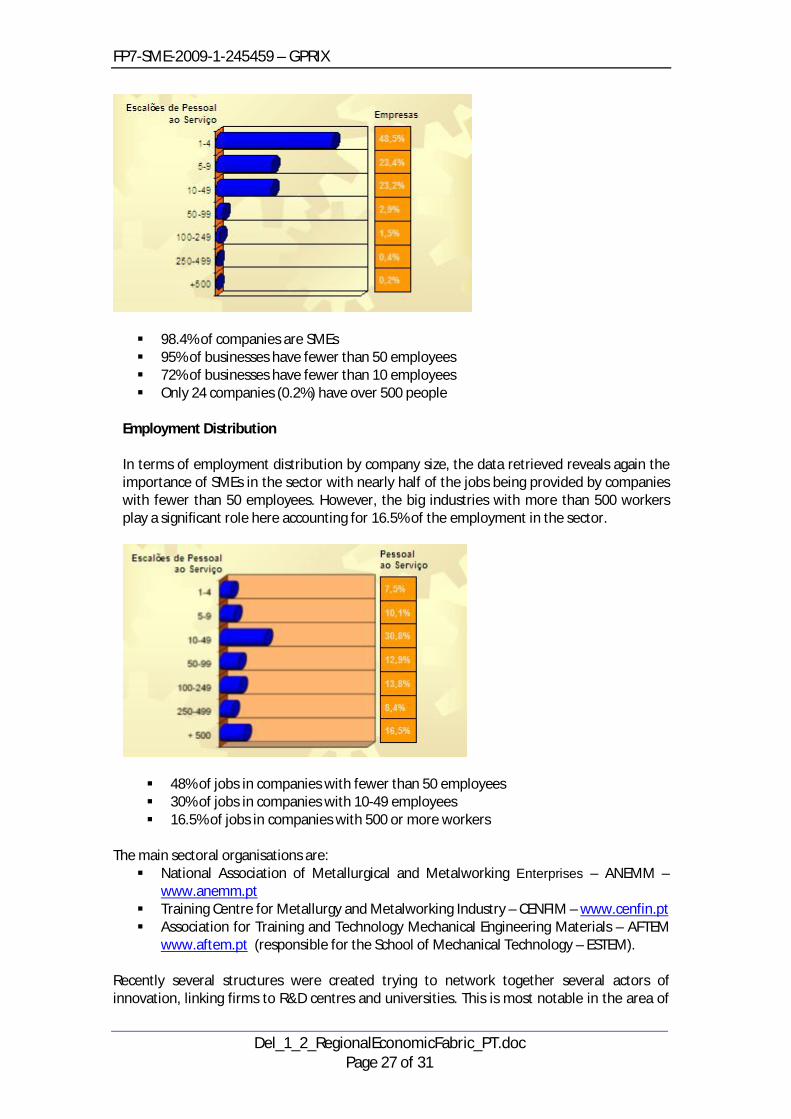
The structure of sub-sectors is not homogeneous with a clear predominance in terms of volume of enterprises, employment and value added of the sub-sector Manufacture of Metal Products, absorbing 70% of their companies, 46% of employment and 34% of its GVA. In terms of turnover, the sub-sector Manufacture of Transport Equipment occupies the first position representing 32% of the all sector Turnover. Finally, the Manufacture of Machinery and Equipment has an important weight in terms employment accounting for 27% of jobs in the sector and 30% of its GVA. Sector Structure The metallurgical and metalworking sector is dominated by small businesses with approximately 72% of businesses having fewer than 10 employees and 95% of the companies having fewer than 50 employees. On the opposite side, the weight of large firms is very low with only 0.2% as sown in the table bellow:
FP7-SME-2009-1-245459 – GPRIX
Del_1_2_RegionalEconomicFabric_PT.doc Page 27 of 31
98.4% of companies are SMEs 95% of businesses have fewer than 50 employees 72% of businesses have fewer than 10 employees Only 24 companies (0.2%) have over 500 people
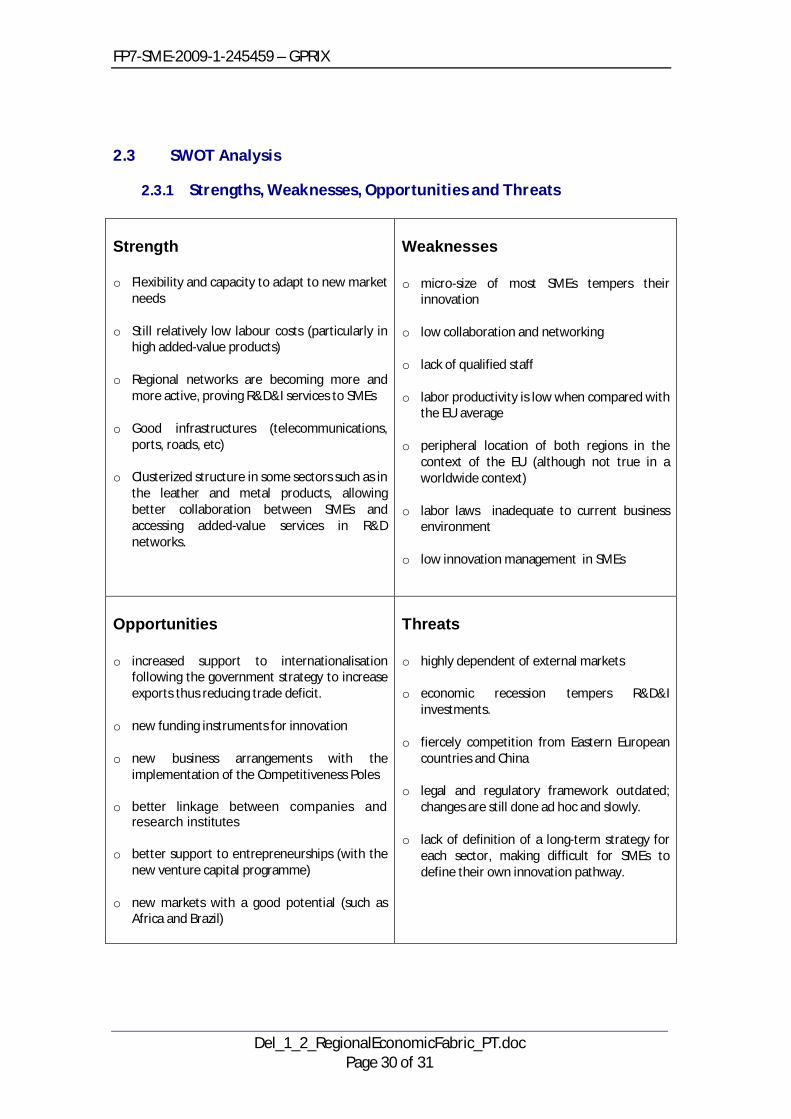
Employment Distribution In terms of employment distribution by company size, the data retrieved reveals again the importance of SMEs in the sector with nearly half of the jobs being provided by companies with fewer than 50 employees. However, the big industries with more than 500 workers play a significant role here accounting for 16.5% of the employment in the sector.
48% of jobs in companies with fewer than 50 employees 30% of jobs in companies with 10-49 employees 16.5% of jobs in companies with 500 or more workers
The main sectoral organisations are: National Association of Metallurgical and Metalworking Enterprises – ANEMM –
www.anemm.pt Training Centre for Metallurgy and Metalworking Industry – CENFIM – www.cenfin.pt Association for Training and Technology Mechanical Engineering Materials – AFTEM
www.aftem.pt (responsible for the School of Mechanical Technology – ESTEM). Recently several structures were created trying to network together several actors of innovation, linking firms to R&D centres and universities. This is most notable in the area of

FP7-SME-2009-1-245459 – GPRIX
Del_1_2_RegionalEconomicFabric_PT.doc Page 28 of 31
Leiria where companies are working together to setup these networks and an emerging cluster on the area of tooling and engineering is being developed, namely by setting up: The Engineering & Tooling Competitiveness Pole – www.toolingportugal.com,
following the setup of competitiveness poles in all sectors as explained above. The RTD Network (Rede IDT), a regional network to support the Research and
Technological Development which promoted several sub-networks like the MicroManufacturing Competences Network - CEMICRO.
These R&D&I networks are good examples of collaboration between regional authorities, companies, R&D Centres, Training centres and universities, working together under a common development strategy that will definitely boost innovation in the region. Finally, the following table lists the main technological centres and sectoral associations by sector. These actors have a crucial role in the regional innovation system, as they often are the first contact of the SME with the regional innovation network, particularly true in SMEs of the traditional sectors:
Technological Centre Sector Sectoral Association CITEVE Technological Centre of Textile and Clothing Industries of Portugal www.citeve.pt
Textiles
ATP Textile and Clothing Association of Portugal www.atp.pt
CTIC Technical Centre for Leather Industries www.ctic.pt CTC Footwear Technology Centre www.ctc.pt
Leather
APIC Portuguese Association of Leather Manufacturers www.apic.pt APICCAPS Portuguese Association of Manufacturers of Footwear, Leather and Components and their substitutes www.apiccaps.pt
CTCV Technological Centre of Ceramics and Glass www.ctcv.pt
Ceramics
APICER Portuguese Association of Ceramic Industry www.apicer.pt
CEIIA Centre of Excellence and Innovation in the Automotive Industry www.ceiia.pt
Automotive
AFIA Manufacturers Association for Automotive Industry www.afia.pt
CATIM Technology Support Centre for the Metalworking Industry
Mechanical, Metallurgy
and
ANEMM National Association of Metallurgical and Metalworking Enterprises –

FP7-SME-2009-1-245459 – GPRIX
Del_1_2_RegionalEconomicFabric_PT.doc Page 29 of 31
www.catim.pt CENTIMFE Technological Centre for the Moulds, Special Tooling and Plastics www.centinfe.pt
Mechanical engineering
www.anemm.pt AIMMAP Association of Industrial Metal, Metalworking www.aimmap.pt
FP7-SME-2009-1-245459 – GPRIX
Del_1_2_RegionalEconomicFabric_PT.doc Page 30 of 31
2.3 SWOT Analysis
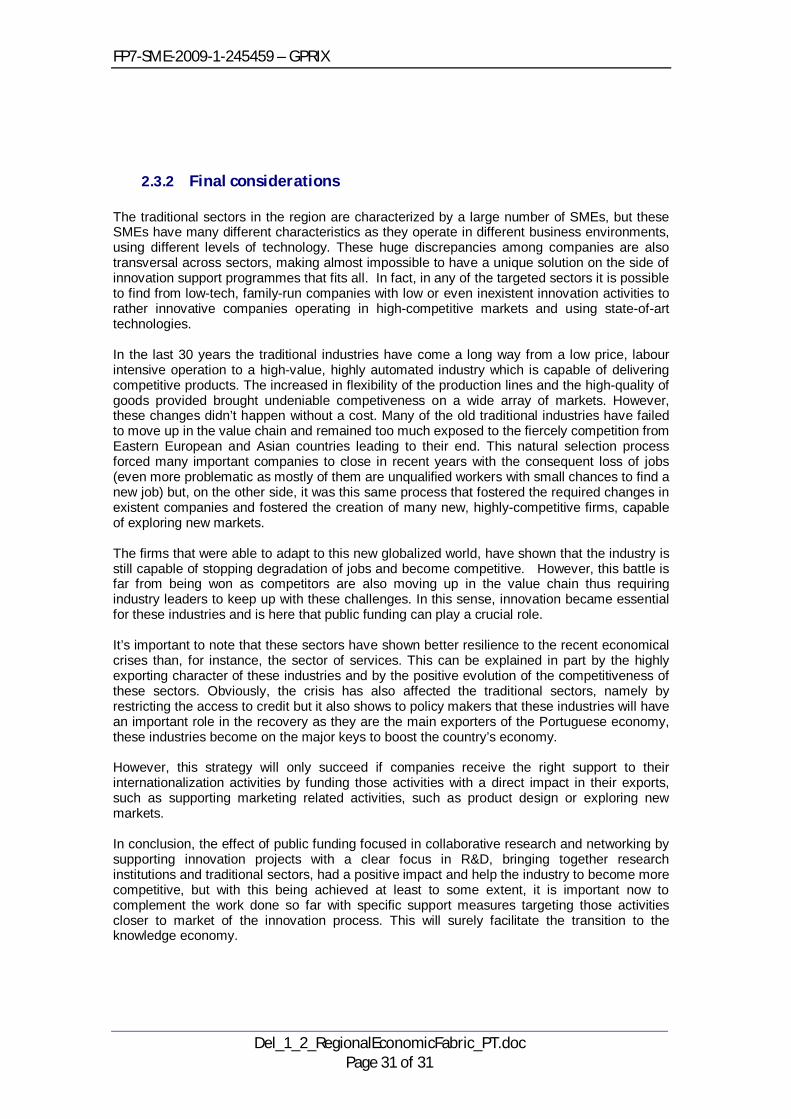
2.3.1 Strengths, Weaknesses, Opportunities and Threats Strength o Flexibility and capacity to adapt to new market
needs o Still relatively low labour costs (particularly in
high added-value products) o Regional networks are becoming more and
more active, proving R&D&I services to SMEs o Good infrastructures (telecommunications,
ports, roads, etc) o Clusterized structure in some sectors such as in
the leather and metal products, allowing better collaboration between SMEs and accessing added-value services in R&D networks.
Weaknesses o micro-size of most SMEs tempers their
innovation o low collaboration and networking o lack of qualified staff o labor productivity is low when compared with
the EU average o peripheral location of both regions in the
context of the EU (although not true in a worldwide context)
o labor laws inadequate to current business
environment o low innovation management in SMEs
Opportunities o increased support to internationalisation
following the government strategy to increase exports thus reducing trade deficit.
o new funding instruments for innovation o new business arrangements with the
implementation of the Competitiveness Poles o better linkage between companies and
research institutes o better support to entrepreneurships (with the
new venture capital programme) o new markets with a good potential (such as
Africa and Brazil)
Threats o highly dependent of external markets o economic recession tempers R&D&I
investments. o fiercely competition from Eastern European
countries and China o legal and regulatory framework outdated;
changes are still done ad hoc and slowly. o lack of definition of a long-term strategy for
each sector, making difficult for SMEs to define their own innovation pathway.
FP7-SME-2009-1-245459 – GPRIX
Del_1_2_RegionalEconomicFabric_PT.doc Page 31 of 31
2.3.2 Final considerations The traditional sectors in the region are characterized by a large number of SMEs, but these SMEs have many different characteristics as they operate in different business environments, using different levels of technology. These huge discrepancies among companies are also transversal across sectors, making almost impossible to have a unique solution on the side of innovation support programmes that fits all. In fact, in any of the targeted sectors it is possible to find from low-tech, family-run companies with low or even inexistent innovation activities to rather innovative companies operating in high-competitive markets and using state-of-art technologies. In the last 30 years the traditional industries have come a long way from a low price, labour intensive operation to a high-value, highly automated industry which is capable of delivering competitive products. The increased in flexibility of the production lines and the high-quality of goods provided brought undeniable competiveness on a wide array of markets. However, these changes didn’t happen without a cost. Many of the old traditional industries have failed to move up in the value chain and remained too much exposed to the fiercely competition from Eastern European and Asian countries leading to their end. This natural selection process forced many important companies to close in recent years with the consequent loss of jobs (even more problematic as mostly of them are unqualified workers with small chances to find a new job) but, on the other side, it was this same process that fostered the required changes in existent companies and fostered the creation of many new, highly-competitive firms, capable of exploring new markets. The firms that were able to adapt to this new globalized world, have shown that the industry is still capable of stopping degradation of jobs and become competitive. However, this battle is far from being won as competitors are also moving up in the value chain thus requiring industry leaders to keep up with these challenges. In this sense, innovation became essential for these industries and is here that public funding can play a crucial role. It’s important to note that these sectors have shown better resilience to the recent economical crises than, for instance, the sector of services. This can be explained in part by the highly exporting character of these industries and by the positive evolution of the competitiveness of these sectors. Obviously, the crisis has also affected the traditional sectors, namely by restricting the access to credit but it also shows to policy makers that these industries will have an important role in the recovery as they are the main exporters of the Portuguese economy, these industries become on the major keys to boost the country’s economy. However, this strategy will only succeed if companies receive the right support to their internationalization activities by funding those activities with a direct impact in their exports, such as supporting marketing related activities, such as product design or exploring new markets. In conclusion, the effect of public funding focused in collaborative research and networking by supporting innovation projects with a clear focus in R&D, bringing together research institutions and traditional sectors, had a positive impact and help the industry to become more competitive, but with this being achieved at least to some extent, it is important now to complement the work done so far with specific support measures targeting those activities closer to market of the innovation process. This will surely facilitate the transition to the knowledge economy.