DEFLECTION ANALYSIS OF CONCRETE BEAMS PRESTRESSED …
142
VILNIUS GEDIMINAS TECHNICAL UNIVERSITY Edgaras ATUTIS DEFLECTION ANALYSIS OF CONCRETE BEAMS PRESTRESSED WITH BASALT FIBER REINFORCED POLYMER BARS SUBJECTED TO CYCLIC LOADING DOCTORAL DISSERTATION TECHNOLOGICAL SCIENCES, CIVIL ENGINEERING (T 002) Vilnius 2019
Transcript of DEFLECTION ANALYSIS OF CONCRETE BEAMS PRESTRESSED …
VILNIUS GEDIMINAS TECHNICAL UNIVERSITY
Edgaras ATUTIS
DEFLECTION ANALYSIS OF CONCRETE BEAMS PRESTRESSED WITH BASALT FIBER REINFORCED POLYMER BARS SUBJECTED TO CYCLIC LOADING
DOCTORAL DISSERTATION
TECHNOLOGICAL SCIENCES, CIVIL ENGINEERING (T 002)
Vilnius 2019
Doctoral dissertation was prepared at Vilnius Gediminas Technical University in 2013–2019.
Supervisor
Prof. Dr Juozas VALIVONIS (Vilnius Gediminas Technical University, Civil Engineering – T 002).
The Dissertation Defence Council of Scientific Field of Civil Engineering of Vilnius Gediminas Technical University:
Chairman
Prof. Dr Romualdas KLIUKAS (Vilnius Gediminas Technical University, Civil Engineering – T 002).
Members:
Assoc. Prof. Dr Darius BAČINSKAS (Vilnius Gediminas Technical University, Civil Engineering – T 002),
Dr Nicholas FANTUZZI (University of Bologna, Italy, Civil Engineering – T 002),
Dr Rimvydas STONYS (Vilnius Gediminas Technical University, Materials Engineering – T 008),
Assoc. Prof. Dr Vitoldas VAITKEVIČIUS (Kaunas University of Technology, Civil Engineering – T 002).
The dissertation will be defended at the public meeting of the Dissertation Defence Council of Civil Engineering in the Senate Hall of Vilnius Gediminas Technical University at 9 a. m. on 8 November 2019.
Address: Saulėtekio al. 11, LT-10223 Vilnius, Lithuania. Tel.: +370 5 274 4956; fax +370 5 270 0112; e-mail: [email protected]
A notification on the intend defending of the dissertation was send on 7 October 2019. A copy of the doctoral dissertation is available for review at VGTU repository http://dspace.vgtu.lt/ and at the Library of Vilnius Gediminas Technical University (Saulėtekio al. 14, LT-10223 Vilnius, Lithuania).
VGTU Press TECHNIKA 2019-047-M research publication book ISBN 978-609-476-200-0
© VGTU Press TECHNIKA, 2019 © Edgaras Atutis, 2019 [email protected]
VILNIAUS GEDIMINO TECHNIKOS UNIVERSITETAS
Edgaras ATUTIS
IŠ ANKSTO ĮTEMPTAIS BAZALTO PLUOŠTO STRYPAIS ARMUOTŲ LENKIAMŲJŲ BETONINIŲ ELEMENTŲ ĮLINKIŲ ANALIZĖ VEIKIANT CIKLINEI APKROVAI
DAKTARO DISERTACIJA
TECHNOLOGIJOS MOKSLAI, STATYBOS INŽINERIJA (T 002)
Vilnius 2019
Disertacija rengta 2013–2019 metais Vilniaus Gedimino technikos universitete.
Vadovas
prof. dr. Juozas VALIVONIS (Vilniaus Gedimino technikos universitetas, statybos inžinerija – T 002).
Vilniaus Gedimino technikos universiteto Statybos inžinerijos mokslo krypties disertacijos gynimo taryba:
Pirmininkas
prof. dr. Romualdas KLIUKAS (Vilniaus Gedimino technikos universitetas, statybos inžinerija – T 002).
Nariai: doc. dr. Darius BAČINSKAS (Vilniaus Gedimino technikos universitetas, statybos inžinerija – T 002),
dr. Nicholas FANTUZZI (Bolonijos universitetas, Italija, statybos inžinerija – T 002),
dr. Rimvydas STONYS (Vilniaus Gedimino technikos universitetas, medžiagų inžinerija – T 008),
doc. dr. Vitoldas VAITKEVIČIUS (Kauno technologijos universitetas, statybos inžinerija – T 002).
Disertacija bus ginama viešame Statybos inžinerijos mokslo krypties disertacijos gynimo tarybos posėdyje 2019 m. lapkričio 8 d. 9 val. Vilniaus Gedimino technikos universiteto senato posėdžių salėje.
Adresas: Saulėtekio al. 11, LT-10223 Vilnius, Lietuva. Tel.: (8 5) 274 4956; faksas (8 5) 270 0112; el. paštas [email protected]
Pranešimai apie numatomą ginti disertaciją išsiųsti 2019 m. spalio 7 d.
Disertaciją galima peržiūrėti VGTU talpykloje http://dspace.vgtu.lt/ ir Vilniaus Gedimino technikos universiteto bibliotekoje (Saulėtekio al. 14, LT-10223 Vilnius, Lietuva).
v
Abstract
The behaviour of prestressed concrete beams reinforced with non-metallic rein-forcement under cyclic loading is analysed in this doctoral thesis. Review on the advantages and disadvantages of non-metallic reinforcement is provided, strength properties and the most crucial parameter values, necessary for the development of the topic of this thesis, are investigated and determined. Arguments on why and at which certain situations the use of this reinforcement can be superior compared to steel are provided. A separate experimental program is developed to determine the behaviour of non-metallic reinforcement undergoing repetitive or cyclic load-ing. The effect of initial prestressing level and stress range caused by the cyclic load to the final number of load cycles endured is also analysed. Moreover, the influence of cyclic loading on the mechanical properties of concrete is being in-vestigated in this study.
The dissertation consists of introduction, three main chapters, general con-clusions, the lists of references and author’s publications on the topic of the dissertation.
The introductory chapter presents the problem formulation, the relevance of the thesis and research object, formulates the aim of the study, describes research methodology, scientific novelty and practical significance of the obtained results.
Chapter 1 describes the fatigue phenomena and the main reasons causing fa-tigue to concrete and composite reinforcement. Besides, attention to static, cyclic creep of concrete and recommendations of the evaluation of these effects in design codes are reviewed.
Chapter 2 is dedicated generally for the description of the proposed deflection calculation method based on the principles of structural dynamics concerning cy-clic creep of concrete and a possible decrease in mechanical properties of compo-site reinforcement due to cyclic loading. A detailed calculation algorithm of the proposed method and general assumptions are provided.
The 3rd and final Chapter describes in detail the experimental study per-formed investigating basalt fibre reinforced polymer bars and tests of BFRP pre-stressed concrete beam deflection estimation results which are compared to the proposed and other authors methods. The adequacy of proposed method is evalu-ated thru statistical analysis.
The topic of the thesis has been published in 7 articles: 5 – in the journals with an Impact Factor, 1 – in scientific journals of other international databases and 1 in the conference proceedings referred by the Clarivate Analytics Web of Science.
vi
Reziumė
Disertacijoje nagrinėjama nemetaline iš anksto įtempta armatūra armuotų lenkia-mųjų elementų elgsena veikiant ciklinėms apkrovoms. Apžvelgiami ne-metalinės armatūros privalumai ir trūkumai, tiriamos šios armatūros mechaninės savybės bei nustatomos svarbiausios nagrinėjamai temai plėtoti reikalingos parametrų vertės. Pateikiami argumentai kodėl ir kokiose situacijose ši armatūra gali būti pranašesnė nei plieno armatūra. Sudaroma atskira eksperimentinių tyrimų pro-grama neplieninės armatūros elgsenos nustatymui, veikiant kartotinėms arba ci-klinėms apkrovoms. Taip pat analizuojama išankstinio įtempimo lygio ir ciklinės apkrovos sukeliamų įtempių amplitudės įtaka ribiniam atlaikomam apkrovos ci-klų skaičiui. Be to, darbe yra analizuojama ciklinės apkrovos įtaka betono mechaninėms savybėms augant apkrovos ciklų skaičiui.
Disertaciją sudaro įvadas, trys pagrindiniai skyriai, bendrosios išvados, nau-dotos literatūros sąrašas bei autoriaus publikacijų sąrašas disertacijos tema.
Įvadiniame skyriuje formuluojama darbo problema, aprašomas darbo aktua-lumas ir tyrimų objektas, formuluojamas darbo tikslas bei aptariami darbo užda-viniai. Taip pat aprašoma tyrimų metodika, darbo mokslinis naujumas ir rezultatų praktinė reikšmė.
Pirmajame skyriuje aprašomos ciklinės apkrovos sukeliamo nuovargio efekto priežastys ir pasekmės betonui bei kompozitinei armatūrai. Atskiras dėmesys ski-riamas betono statiniam ir cikliniam valkšnumui, apžvelgiamos galiojančių pro-jektavimo normų ir rekomendacijų nuorodos šių efektų vertinimui armuotų beto-ninių konstrukcijų projektavime.
Antrajame skyriuje aprašomas siūlomas įlinkių skaičiavimo metodas, pagrįs-tas statybinės dinamikos principais, vertinantis betono ciklinį valkšnumą bei ga-limą kompozitinės armatūros mechaninių savybių pokytį dėl apkrovos cikliš-kumo. Pateikiamas detalus siūlomo metodo skaičiavimo algoritmas bei taikomos prielaidos.
Trečiajame skyriuje detaliai aprašomi atlikti bazalto pluošto armatūros bei iš anksto įtemptųjų sijų, armuotų minima armatūra, eksperimentiniai tyrimai. Šioje dalyje gauti rezultatai yra palyginami su siūlomo metodo bei kitų autorių įlinkio skaičiavimo metodų rezultatais. Taip pat atliekama siūlomo metodo adekvatumo statistinė analizė.
Disertacijos tema paskelbti 7 moksliniai strapsniai: 5 – žurnaluose turinčiuose citavimo rodiklį, 1 – kitų tarptautinių duomenų bazių leidiniuose ir 1 – konferencijų rinkinyje, referuojamame Clarivate Analytics Web of Science duo-menų bazėje.
vii
Notations
Symbols
A – is the area of the beam cross-section; empirical concstant;
B – is the empirical concstant;
Ac – is the area of plain concrete net section;
Ac,cr – is the area of cracked concrete net section;
Ap – is the cross-sectional area of prestressing bar;
As – is the cross-section area of steel rebar;
C(t,τ) – is the coefficient of pure creep;
C0(t,t0) – is the compliance function of creep with constant moisture content and without any movement of the moisture in concrete (basic creep);
Cd(t,t0) – is the compliance function of due to simultaneous drying of concrete;
D0 – is the material and geometric properties matrix;
D – is the dissipative energy;
D(N) – is the damage variable;
Ec – is the modulus of elasticity of concrete;
Ec.eff – is the effective modulus of elasticity of concrete;
c.effE – is the age-adjusted effective elasticity modulus for concrete;
viii
cycc,effE t – is the effective modulus of elasticity of concrete at a certain loading cycle;
Ecm – is the secant modulus of elasticity of concrete;
Ecm.28 – is the elastic modulus of concrete at the age of 28 days;
Ep – is the elastic modulus of the prestressing bar; potential energy of the beam due to flexural deformations;
E, Es – is the Young modulus of the steel;
Esec – is the instantaneous elastic modulus measured from pulsating compression;
Ef0,Einit – is the static (initial) elastic modulus of the polymer bar;
Ef(N) – is the modulus of elasticity of FRP at a certain load cycle;
Ek – is the kinetic energy of the SDOF system;
Fa – is the amplitude of the excitation force;
Ftrans – is the coefficient used for vertical translation of excitation force;
Ic – is the second moment of area of the concrete cross-section;
Ic,cr – is the second moment of area of the cracked concrete cross-section;
Icr – is the second moment of area of a cracked cross-section;
Ieff – is the effective moment of inertia after cracking;
eff
cycI – is the effective moment of inertia at a certain loading cycle;
Ig – is the second moment of area of the gross cross-section;
I0 – is the uncracked second moment of the transformed area about the refe-rence axis of the cross-section at time of prestress transfer;
J(t,t0) – is the complience of static creep of concrete;
Jtot – is the total complience of creep of concrete;
Ma – is the moment due to the applied service load;
Mcr – is the cracking moment;
Mdec – is the decompression moment;
Me – is the externally applied moment;
Mi – is the internal bending moment;
M – is the external virtual moment;
N – is the loading cycles;
Nc – is the sum of the resistant forces of concrete;
Ne – is the external axial force of the element;
Ni – is the internal axial force of the element;
Ns – is the sum of the resistant forces of non-prestressed reinforcement;
Np – is the sum of the resistant forces of prestressing reinforcement;
ix
N – is the external virtual force;
Pi,init – is the initial prestressing force; R – is the stress ratio between minimum and maximum stress; R‘ – is the stress ratio evaluating stress reversals; RA(t) – is the time-dependent axial rigidity of the cross-section; RS(t) – is the time-dependent stiffness of the cross-section related to the first mo-
ment of area about the reference axis; RI(t) – is the time-dependent flexural rigidity of the cross-section about the refe-
rence axis; RA,cr – is the axial rigidity of the cracked cross-section; RS,cr – is the stiffness of the cracked cross-section related to the first moment of
area about the reference axis; RI,cr – is the flexural rigidity of the cracked cross-section about the reference axis; RA,0 – is the axial rigidity of the cross-section; RS,0 – is the stiffness of the cross-section related to the first moment of area about
the reference axis; RI,0 – is the flexural rigidity of the cross-section about the reference axis; S, Sr – is the stress range; T – is the temperature; period of cyclic loading; K – is the power law coefficient; V/C – is the water-cement ratio; Sc – is the first moment of area about the reference axis of the concrete cross-
section; Sc,cr – is the first moment of area about the reference axis of the cracked concrete
cross-section; a – is the coefficient; acceleration of a mass; a0 – is the initial crack size before the cyclic loading; aN – is the crack size after N loading cycles; b – is the coefficient; the width; c – is the empirical coefficient; is the viscous damping of SDOF system; cb – is the distance from the centroid of the cross-section to the bottom of the
cross-section; ct – is the distance from the centroid of the cross-section to the top of the cross-
section; e – is the eccentricity of the prestress; the base of the natural logarithm; lc – is the representative volume element of the material dimension; l0, leff – is the effective span of the beam;
x
fc – is the compressive strength of concrete prisms; fcd,fat – is the fatigue strength of the concrete;
fcm – is the mean value of cylinder compressive strength of concrete;
fcm28 – is the compressive strength of concrete at the age of 28 days;
ffu, fu – is the ultimate tensile strength of prestressing bar;
fcr(t) – is the vector representing effect of creep;
fp,init – is the vector containing actions caused by initial prestressing;
fp,rel(t) – is the vector representing initial prestress force and losses of prestresss of BFRP reinforcement;
fsh(t) – is the vector representing effect of shrinkage;
fr – is the static modulus of rupture of concrete;
fr(N) – is the modulus of rupture of concrete after N loading cycles;
h,RH – is the relative humidity;
k – is the systems stiffness; factor representing loading conditions;
ke – is the generalized stiffness of the SDOF system;
ks – is the cross-section shape factor;
kh – is the humidity dependent coefficient;
t – is the time being considered; the age of concrete (in days);
t0 – is the time of the transfer of prestress from BFRP bar to concrete cross-section;
t'0 – is the time at which drying and loading first act simultaneously;
tp – is the time at prestress transfer to concrete cross-section;
td – is the time of the cyclic load applience;
m – is the mass of the SDOF system;
me – is the generalized mass of the SDOF system;
n – is the power law coefficient;
u – is the displacement of SDOF system;
v – is the velocity of SDOF system;
q1 – is the instantenous strain due to unit stress;
q2,3,4,5 – is the empirical constitutice parameters;
re,0 – is the vector of applied external forces and bending moments;
yp – is the y-coordinate of the level of prestressing bar (tendon);
ys – is the y-coordinate of the level of steel reinforcement;
yn – is the distance between the neutral axis and the reference axis of the cross-section;
xi
α – is the thermal expansion coefficient;
β – is the coefficient depending on the type of applied load;
βcc – is the coefficient which depends on the age of the concrete;
ϛ – is the coefficient used to account for the tension stiffening effect;
ν,f – is the loading frequancy;
νfib – is the volume fraction of fibres;
νmat – is the volume fraction of matrix;
ΔT – is the temperature change;
ΔJN – is the complience of cyclic creep of concrete;
ΔM – is the restraining moment;
ΔN – is the restraining axial force;
ε – is the strain at any fiber of cross-section;
εc – is the compressive concrete strain;
εel – is the elastic strain;
c,crεcyc – is the cyclic creep strain of the concrete;
εcr, εcrp – is the static creep strain of concrete;
εcr,d (t) – is the delayed (recoverable) elastic strain of concrete;
εcr,f (t) – is the irrecoverable creep strain of concrete;
εsh – is the shrinkage strain of concrete;
εr – is the strain regarding reference axis; residaul strain;
εre – is the residaul elastic strain;
εp,init – is the initial strain in prestressing bar;
εp,rel – is the relaxation strain in prestressed BFRP bar;
ε0 – is the instantaneous strain at the level of the reference axis at the time of prestress transfer;
ε0 – is the strain vector;
σ – is the stress;
σc – is the compressive concrete stress;
σf – is the axial stress in the unidirectional FRP bar;
σfib – is the tensile stress in the FRP fibres;
σp – is the stress in prestressing bar;
σm – is the mean stress;
σmat – is the stress in the matrix;
σmax – is the maximum stress;
xii
σmin – is the mimimum stress;
τ0 – is the time when the axila load is applied;
τd – is the moist curing time of concrete;
κ – is the curvature of the cross-section;
κcr – is the curvature of the cracked cross-section;
κ0 – is the curvature of the uncracked cross-section;
ω – is the circular frequency of excitation force;
ωn – is the natural circular frequency;
φ, – is the creep coefficient of concrete;
φp – is the relaxation coefficient for BFRP reinforcement;
φ0 – is the relative creep coefficient of concrete;
φ0k – is the nonlinear notional creep coefficient of concrete;
χ, χc – is the aging coefficient of concrete;
ψ(x,t) – is the shape function;
φ(t,τ) – is the creep function.
Abbreviations
AAEM – age-adjusted effective moduli method; AFRP – aramid fibre reinforced polymer; BFRP – basalt fibre reinforced polymer; CFRP – carbon fibre reinforced polymer; CTE – coefficient of thermal expansion; FRP – fibre reinforced polymer; GFRP – glass fibre reinforced polymer; LVDT – linear variable displacement transducer; PC – prestressed concrete; RC – reinforced concrete; RSM – residual stiffness model; SDOF – single degree of freedom; SLER – strength-life equal rank; SLS – serviceability limit state; UTS – ultimate tensile strength.
xiii
Contents
INTRODUCTION ........................................................................................................... 1 Problem Formulation ................................................................................................. 1 Relevence of the Thesis ............................................................................................. 2 Object of the Research .............................................................................................. 3 Aim of the Thesis ...................................................................................................... 3 Tasks of the Thesis .................................................................................................... 3 Research Methodology ............................................................................................... 4 Scientific Novelty of the Thesis ................................................................................ 4 Pratical Value of the Research Findings ................................................................... 4 The Defended Statements .......................................................................................... 5 Approval of the Research Findings ........................................................................... 5 Structure of the Dissertation ....................................................................................... 6 Acknowledgments ...................................................................................................... 6
1. LITERATURE SURVEY ON FATIGUE BEHAVIOUR AND FAILURE
MECHANISMS OF PRESSTRESSED CONCRETE STRUCTURES ..................... 7 1.1. Fatigue of Prestressed Concrete Structures ........................................................ 8 1.2. Application of Fibre Reinforced Polymer Reinforcement in Construction
Industry ............................................................................................................. 9 1.2.1. A Review on Fibre Reinforced Polymers ................................................ 9 1.2.2. Physical Attributes of Fibre Reinforced Polymer Reinforcement ......... 12
xiv
1.3. Fatigue Failure Mechanism and Fatigue Life Prediction for Non-metallic Bars .................................................................................................................. 14
1.4. Review on Creep and Shrinkage of Concrete .................................................... 20 1.4.1. Static Creep Models .............................................................................. 21 1.4.2. Cyclic Creep Models ............................................................................. 25 1.5. Code Provisions and Available Models on Fatigue Strength of Concrete ......... 31 1.5.1. Review on Existing Fatigue Life Models .............................................. 31 1.5.2. Eurocode 2 ............................................................................................. 32 1.5.3. Model Code 2010 .................................................................................. 33 1.5.4. ACI 215R-74 ......................................................................................... 34 1.6. Review of Deflection Prediction Method of Prestressed Concrete Beams ........ 35 1.7. Deflection Prediction of Prestressed Concrete Beams Under Cyclic Loading .. 41 1.7.1. Balaguru (1981): Modified Effective Moment of Inertia ...................... 41 1.7.2. Bažant and Hubler (2014) ..................................................................... 43 1.7.3. Jiang et al. (2017) .................................................................................. 44 1.8. Conclusions of Chapter 1 and Formulation of the Tasks of the Thesis ............ 47
2. DEFORMATION ANALYSIS OF CONCRETE BEAMS PRESTRESSED WITH FIBRE REINFORCED POLYMER BARS ................................................................... 51
2.1. Dynamics of Analysed System ......................................................................... 52 2.1.1. Introduction to Single-Degree-of-Freedom System ............................... 52 2.1.2. Approximation of Mass and Stiffness of the Single-Degree-of- Freedom System .............................................................................................. 57
2.2. Accounting for the Cyclic Creep of Concrete ................................................... 60 2.3. Calculation Procedure ....................................................................................... 61 2.4. Simplified Deflection Response Analysis ......................................................... 63 2.5. Conclusions of Chapter 2 ................................................................................. 64
3. ASSESSEMENT OF THEORETICAL AND EXPERIMENTAL RESEARCH RESULTS ..................................................................................................................... 67
3.1. Experimental Programme .................................................................................. 68 3.2. Fatigue Analysis of Basalt Reinforced Polymer Bars ....................................... 69 3.2.1. Bar Specimens ......................................................................................... 69 3.2.2. Experimental Setup ................................................................................. 70 3.2.3. Discussion of the Test Results ................................................................. 71 3.3. Modulus Of Elasticity of Basalt Reinforced Polymer Bars ............................... 73 3.3.1. Experimental Setup of Tested Basalt Reinforced Polymer Bars ............. 73 3.3.2. Instrumentation of the Test ...................................................................... 73 3.3.3. Results of the Experimental Work........................................................... 74 3.4. Serviceability of Concrete Beams Prestressed with Basalt Reinforced Polymer Bars ..................................................................................................... 75 3.4.1. Experimental Setup of Tested Prestressed Concrete Beams ................... 75 3.4.2. Arrangement of the Test .......................................................................... 77 3.4.3. Analysis of the Experimental Results ...................................................... 79 3.5. Comparative Analysis of Theoretical and Experimental Results ...................... 87
xv
3.6. Conclusions of Chapter 3 .................................................................................. 93
GENERAL CONCLUSIONS ........................................................................................ 95
REFERENCES .............................................................................................................. 99 LIST OF SCIENTIFIC PUBLICATIONS BY THE AUTHOR ON THE TOPIC OF
THE DISSERTATION ....................................................................................... 107 SUMMARY IN LITHUANIAN ................................................................................. 109
ANNEXES1 ................................................................................................................ 129 Annex A. Declaration of Academic Integrity ......................................................... 131 Annex B. The Co-Authors’ Agreements to Present Publications Material
in the Dissertation ................................................................................ 132 Annex C. Copies of the Scientific Publications by the Author on the Topic
of the Dissertation .................................................................................. 135
1The annexes are supplied in the enclosed compact disc.

1
Introduction
Problem Formulation
Prestressed concrete has wide application in the design of structures such as bridges, viaducts, off-shore platforms, containments, etc. The principle of pre-stressing of the reinforcement is used not only because of the increased member stiffness, cracking resistance, and longevity, but also because of the economical aspect. Prestressing of reinforcement allows to save up to about 30% of the mate-rials used.
Despite the advantages of reinforced and prestressed concrete, a major disad-vantage still exists even today – steel corrosion. This problem costs billions of euros annually for the maintenance of existing buildings and structures world-wide. Several decades before, a potential solution was found – fibre reinforced polymer. A relatively new material is basalt fibre reinforced polymer (BFRP). BFRP reinforcement have better physical and mechanical properties (i.e., re-sistance to alkali and thermal effects) compared to glass fibre reinforced polymer reinforcement, whereas comparing to carbon fibre reinforced polymer reinforce-ment – having almost the same fatigue resistance but is less expensive. Neverthe-less, the performance of BFRP under cyclic loading is still being investigated due to the lack of experimental results.
2 INTRODUCTION
There has been a vast amount of investigations on engineering structures that are reinforced or prestressed with regular steel under repetitive or cyclic load. Since certain FRP’s (such as glass, aramid, and carbon fibre) have received con-siderable attention, a great amount of fatigue investigations can be found on these FRPs in the literature, however, not many investigations have been conducted on basalt fibres.
FRP design codes and recommendations such as JSCE (1997), fib bulletin 40 (FIB), CSA-S806 and ACI 440.4R provide certain guidance for the design of struc-tures, that are reinforced with aramid, glass and carbon fibre reinforced polymer reinforcement, undergoing fatigue loading. No recommendations can be found for BFRP reinforcement. In this regard, this study is a step towards obtaining the better understanding of the combined use of concrete and BFRP in PC flexural members undergoing cyclic (dynamic) loading. In addition, this study also focuses on achieving a more accurate behaviour prediction of such structures in the ser-viceability limit state – deflection development throughout the period of cyclic loading.
Relevance of the Thesis
Concrete structures reinforced with steel or non-metallic reinforcement, undergo-ing cyclic loading, behave in a different manner than structures subjected to static loads. In addition, the use of traditional steel reinforcement is highly dependent on environmental impact. Cracking of concrete structures reinforced with steel reinforcement can result in reduced longevity due to corrosion effect. The corro-sion problem can be dealt with by using composite reinforcement; however, the issues created by cyclic loading require additional attention. The variation in stresses and strain due to cyclic loading cause damage to the reinforced and pre-stressed concrete structures. These damages affect the safety and reliability of structures throughout the service life of the structure. There is still a lack of knowledge on this problem. An understanding of the behavioural features can be obtained only by performing complex research on both the constituent materials (concrete and BFRP) and the structural members with such reinforcement, under-going cyclic loading conditions. The changes in the flexural stiffness of FRP pre-stressed concrete beams can be adequately evaluated only by measuring the changes in the mechanical properties of concrete and composite reinforcement during the period of cyclic loading. Only the development of accurate physical material models that evaluate the cyclic loading effects can enable civil engineers to reliably predict the behavior of concrete structures throughout the service life.
INTRODUCTION 3
Object of the Research
The object of this research is to evaluate the influence of cyclic loading on the mechanical properties of concrete and basalt fibre reinforced polymer reinforce-ment and to the stiffness degradation of BFRP prestressed concrete beams.
Aim of the Thesis
This thesis aims to propose a new method for the evaluation of degradation of mechanical properties of basalt fibre reinforced polymer reinforcement due to cy-clic loading and a new method for the deflection determination of BFRP pre-stressed concrete beams.
Tasks of the Thesis
In order to achieve the aim of the thesis, the following tasks are formulated:
1. To perform a literature survey on the existing models determining fatigue dependent properties of concrete, in particular – cyclic creep.
2. To review the existing theoretical methods and analytical models for es-timating the degradation of mechanical properties of BFRP reinforcement due to cyclic loading.
3. To propose an analytical deflection estimation method for BFRP pre-stressed concrete flexural members undergoing cyclic loading.
4. To design and perform an experimental program that investigates the fa-tigue life of BFRP bars and the decrease in mechanical properties due to fatigue loading.
5. To perform an experimental investigation on the fatigue life and deflection of real scale BFRP prestressed PC beams involving a variety of initial prestressing level and load range.
6. To analyse the adequacy of the developed analytical method for deflec-tion determination by comparing with the experimental results.
4 INTRODUCTION
Research Methodology
The principles of structural mechanics and structural dynamics are applied in this thesis. Investigated flexural members are approximated to single-degree-of-free-dom (SDOF) system by generalizing the systems mass and flexural stiffness. The equation of motion is used for the internal, inertia and excitation force equilibrium determination. By using Duhamel’s integral, the solution of non-homogeneous differential equation consisting of particular and complementary solutions is ob-tained. In addition, a literature survey is performed on the changes in the mechan-ical properties of concrete and BFRP bars during cyclic loading application. Changes in mechanical properties of concrete and BFRP reinforcement are eval-uated in the proposed method. Experimental tests of BFRP bars and BFRP pre-stressed concrete beams subjected to cyclic loading are performed to evaluate the accuracy of proposed method. Adequacy of proposed method is evaluated by the statistical analysis of theoretical and experimental results.
Scientific Novelty of the Thesis
1. Based on the experimental results, the stress range – number of load-ing cycles (Sr–N) relation, which is the determining equation for BFRP bars, is proposed.
2. A new deflection calculation method, which involves structural dy-namics, for BFRP prestressed concrete beams undergoing cyclic load-ing is proposed.
3. New experimental data on the changes in the modulus of elasticity during fatigue loading of BFRP reinforcement is obtained.
4. New experimental results of BFRP prestressed concrete beams under cyclic loading are obtained.
Practical Value of the Research Findings
Present study contributes to the expansion of the knowledge and understanding of the fatigue problem in fibre reinforced polymers and their use for prestressed con-crete flexural members. The findings of this research are an important addition to the limited data that exists on the performance of BFRP reinforcement under cy-clic loading. The obtained results can be applied or adopted for the update of con-
INTRODUCTION 5
crete structures, that are reinforced with FRP reinforcement, design codes and rec-ommendations. Strain increment of compressed concrete due to cyclic loading model, as also, degradation of mechanical properties of BFRP reinforcement eval-uating model being proposed in this thesis. Both propositions are included in the newly proposed deflection determination method, which involves structural dy-namics, which can be used by civil engineers in the analytical displacement cal-culations of PC structures in situations where an understanding of the dynamic movement is extremely important (i.e., pedestrian bridges).
The Defended Statements
1. Basalt fibre reinforced polymer bars can be considered to have a high resistance to cyclic loading at maximum stress level not higher than 65% of the ultimate tensile strength.
2. The cyclic loading resistance of BFRP prestressed concrete flexural members is highly dependent on the initial prestressing level and load-ing range. Based on the findings of this thesis, the most effective BFRP bar prestressing level for analyzed situation is determined to be 45% of the ultimate tensile strength.
3. The stress ratio (R) for the BFRP reinforcement should not be less than 0.88 for PC applications.
4. The proposed generalized stiffness ke for simply supported PC beam, reinforced with FRP reinforcement, allows adequately evaluate de-flection of the beam as a displacement solution of SDOF system. Moreover, by the use of generalized stiffness ke, natural frequency of the beam can be determined.
5. The proposed deflection calculation method, which considers the cy-clic creep of concrete and possible decrease in mechanical properties of BFRP reinforcement due to cyclic loading, achieves reasonable ac-curacy.
Approval of the Research Findings
The author has published eight articles on the topic of this dissertation (five of them are in journals with an Impact Factor (IF), one is in the scientific journal of
6 INTRODUCTION
other international databases and one – in the conference proceedings of the Cla-rivate Analytics Web of Science. The results of the dissertation have been presented in five presentations at the local and abroad scientific conferences:
– 17th Conference of Lithuanian Young Scientists Science – Future of Lith-uania. A thematic conference „Civil Engineering, Vilnius, Lithuania, 2014;
– 18th International Conference on Composite Structures (ICCS 18), Lisbon, Portugal, 2015;
– 12th International Conference Modern Building Materials, Structures and Techniques, Vilnius, Lithuania, 2016;
– 19th International Conference on Composite Structures (ICCS 19), Porto, Portugal, 2016;
– 5th International Conference on Mechanics of Composites (MECHCOMP 2019), Lisbon, Portugal, 2019.
Structure of the Dissertation
This dissertation consists of an introduction, three chapters, general conclusions, a list of references (100 publications), a list of the author’s publications on the topic of the thesis, a summary in Lithuanian and three annexes. The dissertation volume is 124 pages, 44 pictures, 10 tables, and 164 equations.
Acknowledgments
I would like to express my deepest gratitude and acknowledgment to the supervi-sor of this scientific work, Prof. Dr Juozas Valivonis, the Head of the Department of Reinforced Concrete Structures and Geotechnics, for providing a great deal of guidance, knowledge, motivation, and assistance along this challenging and ex-citing way. I would also like to express my appreciation and gratitude to Assoc Prof. Dr Robertas Balevičius, Assoc Prof. Dr Bronius Jonaitis, for ideas and in-sights, and special thanks to my colleague Dr Aidas Jokūbaitis for his time and help during the experimental works. For valuable insights and recommendations, author would like to express appreciation to Assoc. Prof. Dr Darius Bačinskas, Prof. Dr Romualdas Kliukas and Dr. Rimvydas Stonys.
Lastly, I would like to express my sincerest thanks to my family who sup-ported and helped me tirelessly during this challenging journey. My deepest thank you to my wife Simona and adorable kids Medeina and Margiris.
7
1 Literature Survey on Fatigue
Behaviour and Failure Mechanisms of Prestressed Concrete Structures
This chapter presents a review on the fatigue issues in PC flexural members to-gether with material models and fatigue-life determination methods used in prac-tice. Also, a brief review of the mechanical and physical properties of the most common non-metallic reinforcement (FRP) is presented. The most recent experi-mental results on the behaviour of FRP bars undertaking repetitive or cyclic load-ing are reviewed. In the present investigation, the deformations of PC members due to time-dependent material properties, such as shrinkage, and the static and cyclic creep of concrete, are discussed. Various fatigue-life models and the pro-cess of failure mechanism of FPR reinforcement as a result of time-varying load-ing are also reviewed. The main focus of this study is the deflection of prestressed concrete members under cyclic load, and in this regard, most recent deflection prediction models are examined. In addition, this chapter formulates the main ob-jective and the tasks of the present research work. This review was presented in the articles by Atutis et al. (2013a), Atutis et al. (2013b), Atutis et al. (2017), Atutis et al. (2018a), and Atutis et al. 2019.
8 1. LITERATURE SURVEY ON FATIGUE BEHAVIOUR AND FAILURE…
1.1. Fatigue of Prestressed Concrete Structures
In recent years, the fatigue strength of concrete members has been attracting in-creasing attention from the engineering community. By using high strength mate-rials and advanced design, manufacturing, and construction technologies, it is of-ten impractical and uneconomical to design structures that remain in the elastic state under service loads. The design must ensure that the structures or structural members perform satisfactorily over the lifetime of the structure, even under the high-stress levels caused by external loading.
Concerns about the effects of fatigue phenomena has increased along with the increasing interest of structural optimisation. The increasing attention to the fatigue limit state in partially and fully prestressed concrete has led to extension of investigations and experimental projects dealing with fatigue or cyclic loading (Rabbat et al. 1978, Holmen 1982, Reese 1983, Overmann et al. 1984, Bennet 1986, Harajli 1985, Naaman 1989, Dulinskas et al. 2007, Dulinskas et al. 2008, Elfgren 2015, Jokūbaitis et al. 2016, Jokūbaitis et al. 2018). The fatigue behaviour of prestressed or reinforced concrete is an important limit state that must be con-sidered by structural engineers and designers of large span bridge decks, parking garages, and other structures subjected to cyclic loading (Adimi et al. 2000, Hig-gins et al. 2006, El-Ragaby et al. 2007, Noël et al. 2014) (Fig. 1.1).
If the design is performed ensuring that cracking does not appear throughout the service life of the structure, then most likely the prestressing reinforcement or anchorage will not be critical designing factors. The fatigue process becomes very critical in cases where cracking is allowed. It is therefore believed that the proba-bility of failure by fatigue is greater for partially prestressed flexural members than for conventionally reinforced or prestressed concrete members. Localized stresses increase in the prestressing reinforcement across cracks, and fretting ef-fects are developed, which is followed by the failure of the structure due to fatigue. When a concrete member is reinforced or prestressed with corrosion prone con-ventional steel, protection against environmental actions become the highest pri-ority, e.g., infrastructural objects. Due to corrosion problems, the serviceability of the structures can be significantly lowered, which leads to excessive rehabilitation and maintenance expenses. These are situations in which FRP reinforcement proves to be useful. Although, FRP has several advantageous properties, it also has some important disadvantages. While being a non-corrosive material puts FRP in front of conventional steel, the degradation of mechanical properties in certain environments such as marine environment can bring other issues in the design list for civil engineers.
Among the various applications of FRPs the most important use of such re-inforcing material is considered to be for prestressing due to its high strength in

1. LITERATURE SURVEY ON FATIGUE BEHAVIOUR AND FAILURE… 9
the longitudinal direction and relatively low elasticity modulus compared to steel (Balafas, 2012).
Fig. 1.1. Prestressed concrete structures undergoing fatigue effect:
a) concrete sleepers (You et al. 2017); b) bridges; c) offshore oil platforms; d) parking garages (Cleland et al. 2015)
1.2. Application of Fibre Reinforced Polymer Reinforcement in Construction Industry
1.2.1. A Review on Fibre Reinforced Polymers
The growing construction industry and global climate change have increased the demand for more eco-friendly, natural, and sustainable composite materials to be used in structural fabrication. Currently, the worldwide infrastructure repair and maintenance costs amount to billions of Euros annually (fib bulletin 40, 2007). A significant portion of this expense is spent trying to address the durability prob-lems in concrete structures. It is clear for civil and structural engineers that some kind of composite material with superior characteristics should be developed in order to decrease the huge expenses on rehabilitation of concrete structures.
10 1. LITERATURE SURVEY ON FATIGUE BEHAVIOUR AND FAILURE…
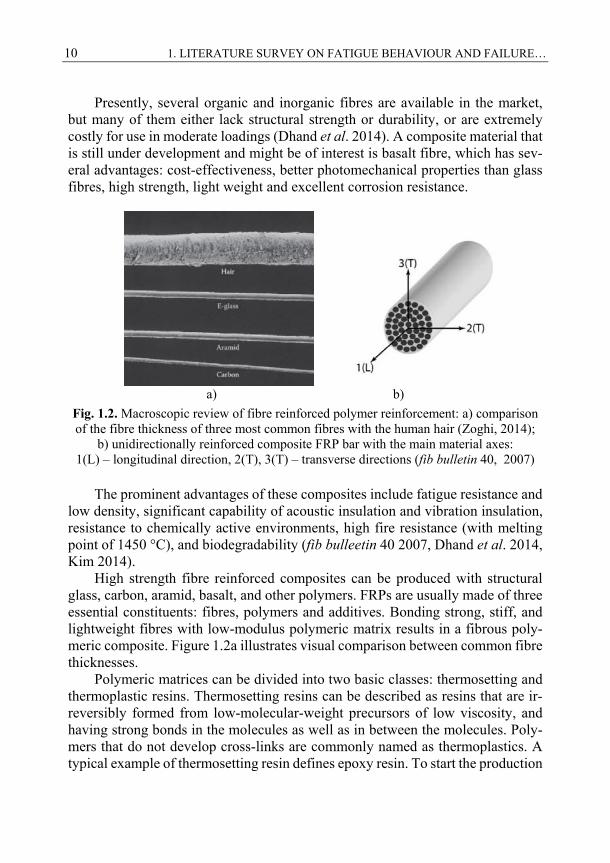
Presently, several organic and inorganic fibres are available in the market, but many of them either lack structural strength or durability, or are extremely costly for use in moderate loadings (Dhand et al. 2014). A composite material that is still under development and might be of interest is basalt fibre, which has sev-eral advantages: cost-effectiveness, better photomechanical properties than glass fibres, high strength, light weight and excellent corrosion resistance.
a) b)
Fig. 1.2. Macroscopic review of fibre reinforced polymer reinforcement: a) comparison of the fibre thickness of three most common fibres with the human hair (Zoghi, 2014);
b) unidirectionally reinforced composite FRP bar with the main material axes: 1(L) – longitudinal direction, 2(T), 3(T) – transverse directions (fib bulletin 40, 2007)
The prominent advantages of these composites include fatigue resistance and low density, significant capability of acoustic insulation and vibration insulation, resistance to chemically active environments, high fire resistance (with melting point of 1450 °C), and biodegradability (fib bulleetin 40 2007, Dhand et al. 2014, Kim 2014).
High strength fibre reinforced composites can be produced with structural glass, carbon, aramid, basalt, and other polymers. FRPs are usually made of three essential constituents: fibres, polymers and additives. Bonding strong, stiff, and lightweight fibres with low-modulus polymeric matrix results in a fibrous poly-meric composite. Figure 1.2a illustrates visual comparison between common fibre thicknesses.
Polymeric matrices can be divided into two basic classes: thermosetting and thermoplastic resins. Thermosetting resins can be described as resins that are ir-reversibly formed from low-molecular-weight precursors of low viscosity, and having strong bonds in the molecules as well as in between the molecules. Poly-mers that do not develop cross-links are commonly named as thermoplastics. A typical example of thermosetting resin defines epoxy resin. To start the production
1. LITERATURE SURVEY ON FATIGUE BEHAVIOUR AND FAILURE… 11
of an FRP material, small amounts of reactive curing agents (additives) together with bundle of fibres are added to liquid resin to initiate polymerization.
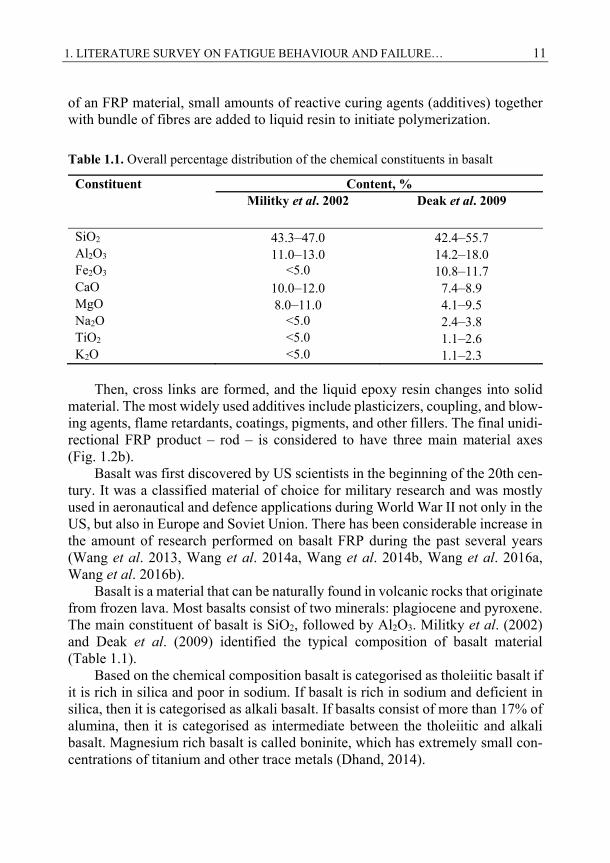
Table 1.1. Overall percentage distribution of the chemical constituents in basalt
Constituent Content, % Militky et al. 2002 Deak et al. 2009
SiO2 43.3–47.0 42.4–55.7 Al2O3 11.0–13.0 14.2–18.0 Fe2O3 <5.0 10.8–11.7 CaO 10.0–12.0 7.4–8.9 MgO 8.0–11.0 4.1–9.5 Na2O <5.0 2.4–3.8 TiO2 <5.0 1.1–2.6 K2O <5.0 1.1–2.3
Then, cross links are formed, and the liquid epoxy resin changes into solid material. The most widely used additives include plasticizers, coupling, and blow-ing agents, flame retardants, coatings, pigments, and other fillers. The final unidi-rectional FRP product – rod – is considered to have three main material axes (Fig. 1.2b).
Basalt was first discovered by US scientists in the beginning of the 20th cen-tury. It was a classified material of choice for military research and was mostly used in aeronautical and defence applications during World War II not only in the US, but also in Europe and Soviet Union. There has been considerable increase in the amount of research performed on basalt FRP during the past several years (Wang et al. 2013, Wang et al. 2014a, Wang et al. 2014b, Wang et al. 2016a, Wang et al. 2016b).
Basalt is a material that can be naturally found in volcanic rocks that originate from frozen lava. Most basalts consist of two minerals: plagiocene and pyroxene. The main constituent of basalt is SiO2, followed by Al2O3. Militky et al. (2002) and Deak et al. (2009) identified the typical composition of basalt material (Table 1.1).
Based on the chemical composition basalt is categorised as tholeiitic basalt if it is rich in silica and poor in sodium. If basalt is rich in sodium and deficient in silica, then it is categorised as alkali basalt. If basalts consist of more than 17% of alumina, then it is categorised as intermediate between the tholeiitic and alkali basalt. Magnesium rich basalt is called boninite, which has extremely small con-centrations of titanium and other trace metals (Dhand, 2014).
12 1. LITERATURE SURVEY ON FATIGUE BEHAVIOUR AND FAILURE…
1.2.2. Physical Attributes of Fibre Reinforced Polymer Reinforcement
It has been almost thirty years since FRP bars have become commercially availa-ble as reinforcement of concrete. FRP reinforcement first appeared in the market as another solution to the corrosion problem. Usually, regular steel reinforcement exposed to an aggressive environment tends to corrode which leads to spalling of the concrete cover. The most useful application of FRP as the main reinforcement in structures is expected to be in marine environments, chemical plants, factories, and off-shore structures, that is, in structures where it is not possible to produce (on site) or pour high quality concrete. FRP reinforcement is the most economical when it is used as prestressing reinforcement. The high tensile strength and light weight compared to conven-tional steel are advantageous properties that are of interest for engineers. Based on the rule of mixture unidirectional FRP tensile stress can be given as follows:
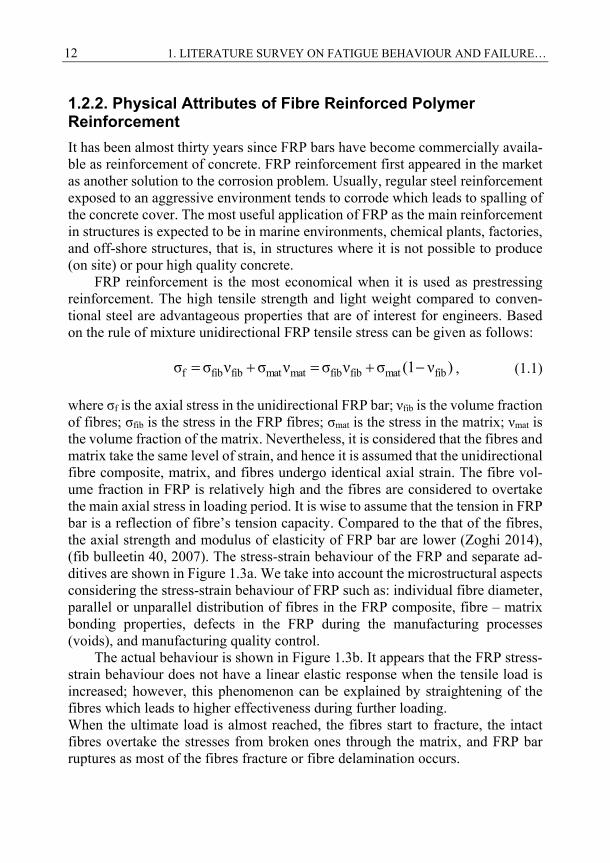
f fib fib mat mat fib fib mat fibσ σ ν σ ν σ ν σ (1 ν ) , (1.1) where σf is the axial stress in the unidirectional FRP bar; νfib is the volume fraction of fibres; σfib is the stress in the FRP fibres; σmat is the stress in the matrix; νmat is the volume fraction of the matrix. Nevertheless, it is considered that the fibres and matrix take the same level of strain, and hence it is assumed that the unidirectional fibre composite, matrix, and fibres undergo identical axial strain. The fibre vol-ume fraction in FRP is relatively high and the fibres are considered to overtake the main axial stress in loading period. It is wise to assume that the tension in FRP bar is a reflection of fibre’s tension capacity. Compared to the that of the fibres, the axial strength and modulus of elasticity of FRP bar are lower (Zoghi 2014), (fib bulleetin 40, 2007). The stress-strain behaviour of the FRP and separate ad-ditives are shown in Figure 1.3a. We take into account the microstructural aspects considering the stress-strain behaviour of FRP such as: individual fibre diameter, parallel or unparallel distribution of fibres in the FRP composite, fibre – matrix bonding properties, defects in the FRP during the manufacturing processes (voids), and manufacturing quality control.
The actual behaviour is shown in Figure 1.3b. It appears that the FRP stress-strain behaviour does not have a linear elastic response when the tensile load is increased; however, this phenomenon can be explained by straightening of the fibres which leads to higher effectiveness during further loading. When the ultimate load is almost reached, the fibres start to fracture, the intact fibres overtake the stresses from broken ones through the matrix, and FRP bar ruptures as most of the fibres fracture or fibre delamination occurs.
1. LITERATURE SURVEY ON FATIGUE BEHAVIOUR AND FAILURE… 13
FRPFi
bre
Fig. 1.3. Tensile stress-strain behaviour: a) rule of mixture; b) actual (Zoghi, 2014)
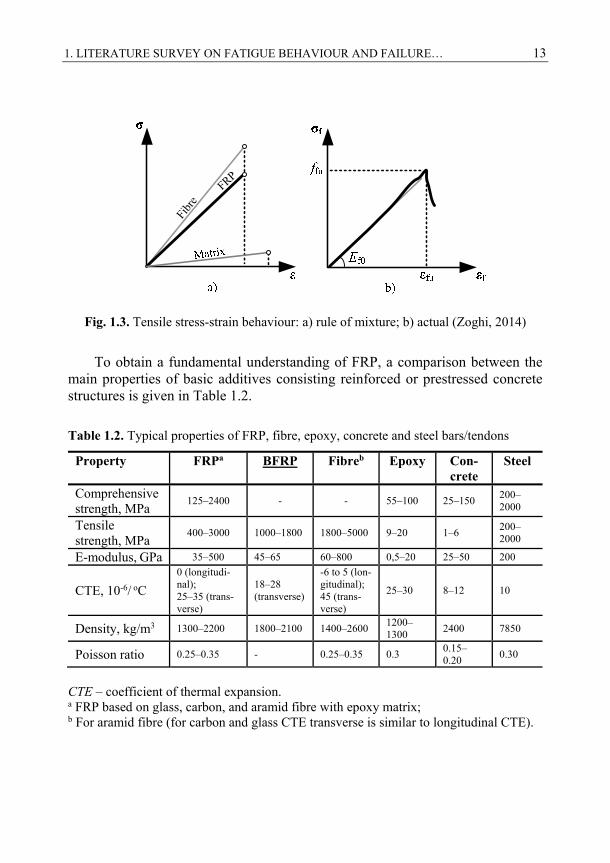
To obtain a fundamental understanding of FRP, a comparison between the main properties of basic additives consisting reinforced or prestressed concrete structures is given in Table 1.2.
Table 1.2. Typical properties of FRP, fibre, epoxy, concrete and steel bars/tendons
Property FRPa BFRP
Fibreb Epoxy Con-crete
Steel
Comprehensive strength, MPa
125–2400 - - 55–100 25–150 200–2000
Tensile strength, MPa
400–3000 1000–1800 1800–5000 9–20 1–6 200–2000
E-modulus, GPa 35–500 45–65 60–800 0,5–20 25–50 200
CTE, 10-6/ oC
0 (longitudi-nal); 25–35 (trans-verse)
18–28 (transverse)
-6 to 5 (lon-gitudinal); 45 (trans-verse)
25–30 8–12 10
Density, kg/m3 1300–2200 1800–2100 1400–2600 1200–1300
2400 7850
Poisson ratio 0.25–0.35 - 0.25–0.35 0.3 0.15–0.20
0.30
CTE – coefficient of thermal expansion. a FRP based on glass, carbon, and aramid fibre with epoxy matrix; b For aramid fibre (for carbon and glass CTE transverse is similar to longitudinal CTE).
14 1. LITERATURE SURVEY ON FATIGUE BEHAVIOUR AND FAILURE…
1.3. Fatigue Failure Mechanism and Fatigue Life Prediction for Non-metallic Bars
Fiber reinforced polymer composite fatigue has been studied for many decades, although the majority of analytical and experimental results and data focus on aerospace, marine and transportation application and are not generally applicable to the construction field. There are significant differences in the magnitude of de-formations and environments in which the materials are used (Adimi et al. 2000, Noël et al. 2014). Mostly, the structures used in construction applications under-take much higher deformations than those in the aerospace or marine fields. The fatigue of FRP bars is a recent concern of engineers. In particular, most of the research studies provide results on GFRP (Abdelrahman et al. 1997, Abdelrahman et al. 1999), CFRP (Xue et al. 2010) and AFRP bars (Kostikov 1995, Odagiri et al. 1997, Dolan 1999, Saadatmanesh and Tanous 1999a, b, El Refai et al. 2007, Kar et al. 2012). Clearly, not enough data exists on fatigue life analysis and pre-diction of BFRP reinforcement. It is considered, that concrete has an adverse effect on the fatigue life of FRP bars. The alkaline environment and friction between FRP bar and surrounding concrete causes abrasion of the FRP reinforcement surface. Exposure to the chem-ical and environmental conditions adds an extra challenge to the use of FRP ten-dons in prestressed concrete structures. The duration of chemical exposure, fibre material, fibre-matrix interface, resin matrix are main factors describing degrada-tion of an FRP bar. Sim et al. (2005) and Coricciati et al. (2009) showed that depending on the type of sodium hydroxide solution, basalt and glass fibres lost about 1.04% and 3.87% of their mass, respectively, after 28 days of immersion. Zhou et al. (2011) reported that BFRP bars soaked in saturated calcium hydroxide solution for 900 days resulted in a total loss of 32% in the ultimate FRP strength. This loss grew even higher when the temperature at which the experiment was performed was raised to 80 °C for 90 days of immersion.
A literature survey on the friction between FRP bars and concrete shown that, during cyclic loading, the friction process evolves and FRP fatigue failure occurs due to matrix cracks at the bar surface. Friction fretting of the bar surface, which causes successive destruction of the bar, might occur near the flexure-induced cracks where the bonding stresses are high and there is a possibility for bar slip-page (Adimi et al. 2000, CEB-FIP 2000, Noël et al. 2014).
Adimi et al. (2000) performed fatigue tests on CFRP bars under various stress ranges, loading frequencies, and environment conditions (chemical exposure and temperature). It was reported that CFRP bars with 65% of fibre volume, tested at a cyclic rate of 4 Hz and stress ratio 0.1 had an almost linearly increasing fatigue life as the maximum stress decreased.
1. LITERATURE SURVEY ON FATIGUE BEHAVIOUR AND FAILURE… 15
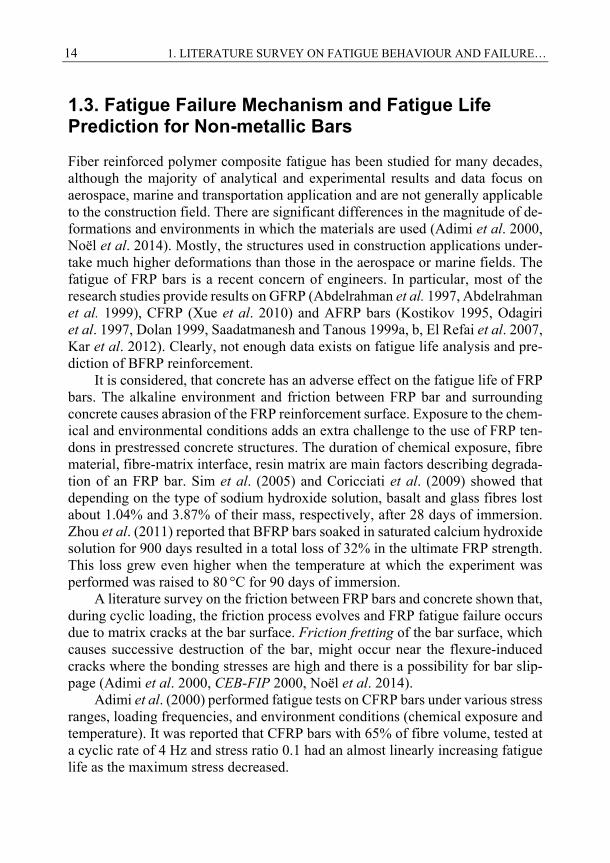
Fig. 1.4. Fatigue life data on various Fibre Reinforced Polymer types (Adimi et al. 2000,
El Refai et al. 2007, El Refai 2013, Noel et al. 2014). UTS – ultimate tensile strength
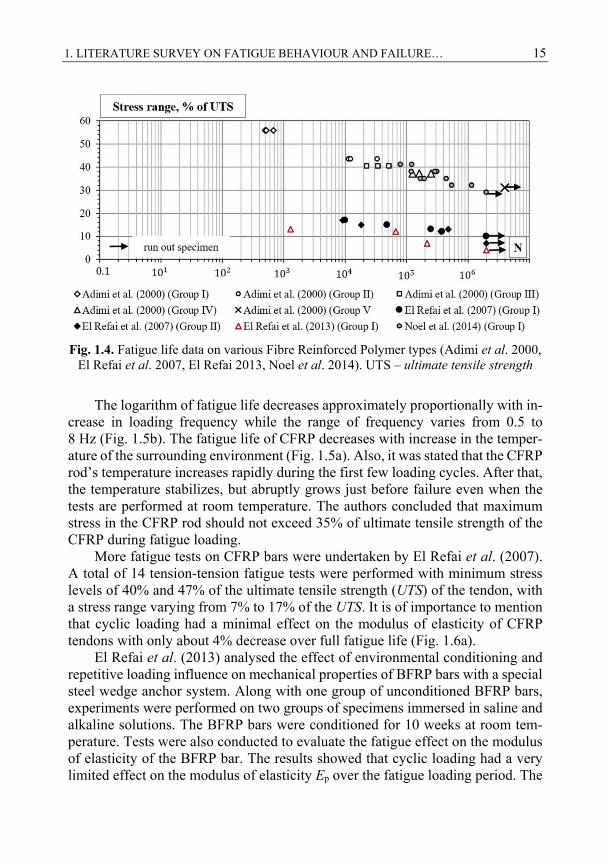
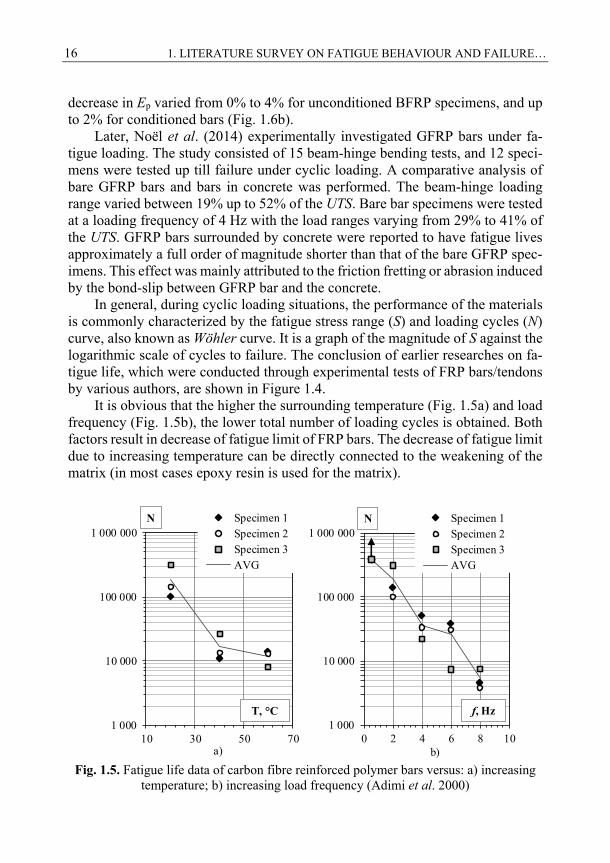
The logarithm of fatigue life decreases approximately proportionally with in-crease in loading frequency while the range of frequency varies from 0.5 to 8 Hz (Fig. 1.5b). The fatigue life of CFRP decreases with increase in the temper-ature of the surrounding environment (Fig. 1.5a). Also, it was stated that the CFRP rod’s temperature increases rapidly during the first few loading cycles. After that, the temperature stabilizes, but abruptly grows just before failure even when the tests are performed at room temperature. The authors concluded that maximum stress in the CFRP rod should not exceed 35% of ultimate tensile strength of the CFRP during fatigue loading.
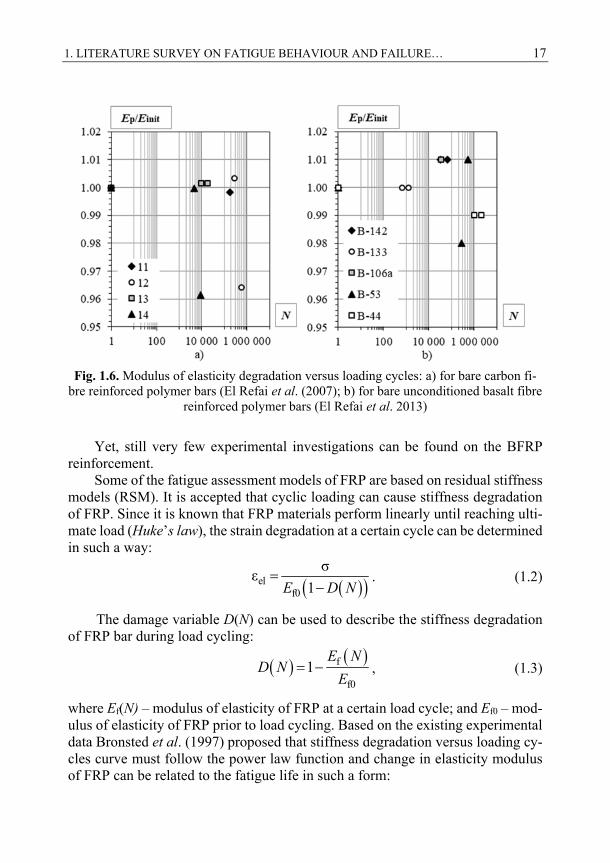
More fatigue tests on CFRP bars were undertaken by El Refai et al. (2007). A total of 14 tension-tension fatigue tests were performed with minimum stress levels of 40% and 47% of the ultimate tensile strength (UTS) of the tendon, with a stress range varying from 7% to 17% of the UTS. It is of importance to mention that cyclic loading had a minimal effect on the modulus of elasticity of CFRP tendons with only about 4% decrease over full fatigue life (Fig. 1.6a).
El Refai et al. (2013) analysed the effect of environmental conditioning and repetitive loading influence on mechanical properties of BFRP bars with a special steel wedge anchor system. Along with one group of unconditioned BFRP bars, experiments were performed on two groups of specimens immersed in saline and alkaline solutions. The BFRP bars were conditioned for 10 weeks at room tem-perature. Tests were also conducted to evaluate the fatigue effect on the modulus of elasticity of the BFRP bar. The results showed that cyclic loading had a very limited effect on the modulus of elasticity Ep over the fatigue loading period. The
16 1. LITERATURE SURVEY ON FATIGUE BEHAVIOUR AND FAILURE…
decrease in Ep varied from 0% to 4% for unconditioned BFRP specimens, and up to 2% for conditioned bars (Fig. 1.6b).
Later, Noël et al. (2014) experimentally investigated GFRP bars under fa-tigue loading. The study consisted of 15 beam-hinge bending tests, and 12 speci-mens were tested up till failure under cyclic loading. A comparative analysis of bare GFRP bars and bars in concrete was performed. The beam-hinge loading range varied between 19% up to 52% of the UTS. Bare bar specimens were tested at a loading frequency of 4 Hz with the load ranges varying from 29% to 41% of the UTS. GFRP bars surrounded by concrete were reported to have fatigue lives approximately a full order of magnitude shorter than that of the bare GFRP spec-imens. This effect was mainly attributed to the friction fretting or abrasion induced by the bond-slip between GFRP bar and the concrete.
In general, during cyclic loading situations, the performance of the materials is commonly characterized by the fatigue stress range (S) and loading cycles (N) curve, also known as Wӧhler curve. It is a graph of the magnitude of S against the logarithmic scale of cycles to failure. The conclusion of earlier researches on fa-tigue life, which were conducted through experimental tests of FRP bars/tendons by various authors, are shown in Figure 1.4.
It is obvious that the higher the surrounding temperature (Fig. 1.5a) and load frequency (Fig. 1.5b), the lower total number of loading cycles is obtained. Both factors result in decrease of fatigue limit of FRP bars. The decrease of fatigue limit due to increasing temperature can be directly connected to the weakening of the matrix (in most cases epoxy resin is used for the matrix).
Fig. 1.5. Fatigue life data of carbon fibre reinforced polymer bars versus: a) increasing
temperature; b) increasing load frequency (Adimi et al. 2000)
1 000
10 000
100 000
1 000 000
10 30 50 70
Specimen 1Specimen 2Specimen 3AVG
N
T, °C
a)
1 000
10 000
100 000
1 000 000
0 2 4 6 8 10
Specimen 1Specimen 2Specimen 3AVG
N
f, Hz
b)
1. LITERATURE SURVEY ON FATIGUE BEHAVIOUR AND FAILURE… 17
Fig. 1.6. Modulus of elasticity degradation versus loading cycles: a) for bare carbon fi-
bre reinforced polymer bars (El Refai et al. (2007); b) for bare unconditioned basalt fibre reinforced polymer bars (El Refai et al. 2013)
Yet, still very few experimental investigations can be found on the BFRP reinforcement.
Some of the fatigue assessment models of FRP are based on residual stiffness models (RSM). It is accepted that cyclic loading can cause stiffness degradation of FRP. Since it is known that FRP materials perform linearly until reaching ulti-mate load (Huke’s law), the strain degradation at a certain cycle can be determined in such a way:
elf0
σε
1
E D N. (1.2)
The damage variable D(N) can be used to describe the stiffness degradation of FRP bar during load cycling:
f
f0
1 E N
D NE
, (1.3)
where Ef(N) – modulus of elasticity of FRP at a certain load cycle; and Ef0 – mod-ulus of elasticity of FRP prior to load cycling. Based on the existing experimental data Bronsted et al. (1997) proposed that stiffness degradation versus loading cy-cles curve must follow the power law function and change in elasticity modulus of FRP can be related to the fatigue life in such a form:
18 1. LITERATURE SURVEY ON FATIGUE BEHAVIOUR AND FAILURE…
f
nf
f0
1 σ
E Nd
E NK
dN E, (1.4)
here K and n are power law coefficients. By integrating equation (1.4) we can obtain:
nf
f f0
σ1
1
E NK N
E N E. (1.5)
Other stiffness degradation models for FRPs, based on 2–parameter Weibull distribution (Chi et al., 1984; Zhou and Mallick, 2004) or strength-life equal rank (SLER), introduced by Chou and Croman (1978), are also available in literature.
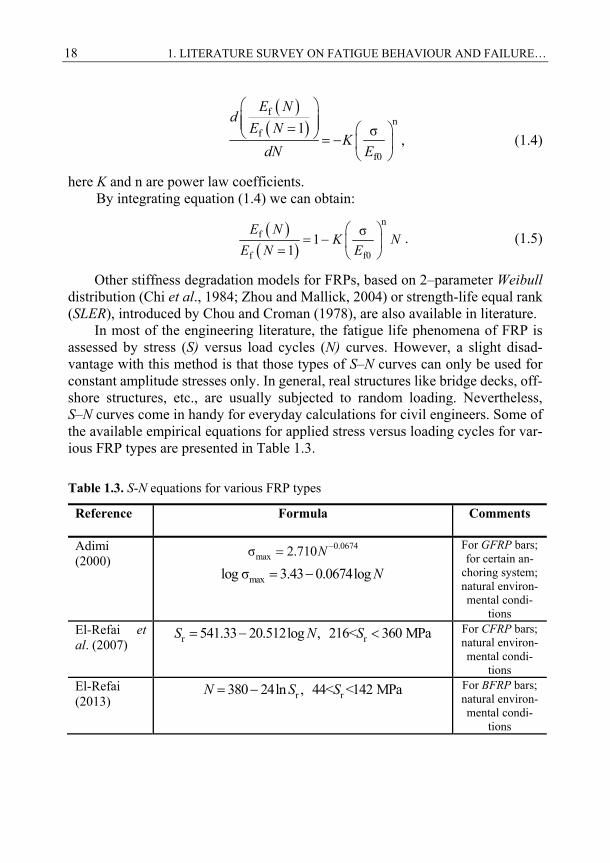
In most of the engineering literature, the fatigue life phenomena of FRP is assessed by stress (S) versus load cycles (N) curves. However, a slight disad-vantage with this method is that those types of S–N curves can only be used for constant amplitude stresses only. In general, real structures like bridge decks, off-shore structures, etc., are usually subjected to random loading. Nevertheless, S–N curves come in handy for everyday calculations for civil engineers. Some of the available empirical equations for applied stress versus loading cycles for var-ious FRP types are presented in Table 1.3.
Table 1.3. S-N equations for various FRP types
Reference Formula Comments
Adimi (2000)
0.0674maxσ 2.710N
maxlog σ 3.43 0.0674log N
For GFRP bars; for certain an-
choring system; natural environ-mental condi-
tions El-Refai et al. (2007)
r r541.33 20.512log , 216< 360 MPaS N S
For CFRP bars; natural environ-mental condi-
tions El-Refai (2013)
r r380 24ln , 44< <142 MPaN S S
For BFRP bars; natural environ-mental condi-
tions
1. LITERATURE SURVEY ON FATIGUE BEHAVIOUR AND FAILURE… 19
End of Table 1.3
Reference Formula Comments
El-Refai (2013)
r r380 24ln , 44< <142 MPaN S S
For BFRP bars; natural environ-mental condi-
tions
r r324 20ln , 44< <133 MPaN S S
For BFRP bars; NaCl condi-
tioned
r r329 20ln , 44< <133 MPaN S S
For BFRP bars; NaOH condi-
tioned
r r247 15ln , 32< <121 MPaN S S
For GFRP bars; natural environ-mental condi-
tions Zhao et al. (2016)
r fu/ 1.0995 0.019lnS f N
For BFRP fibre bundles; natural environmental
conditions where N – number of cycles; Sr – stress range (σmax – σmin); ffu – ultimate tensile strength of FRP.
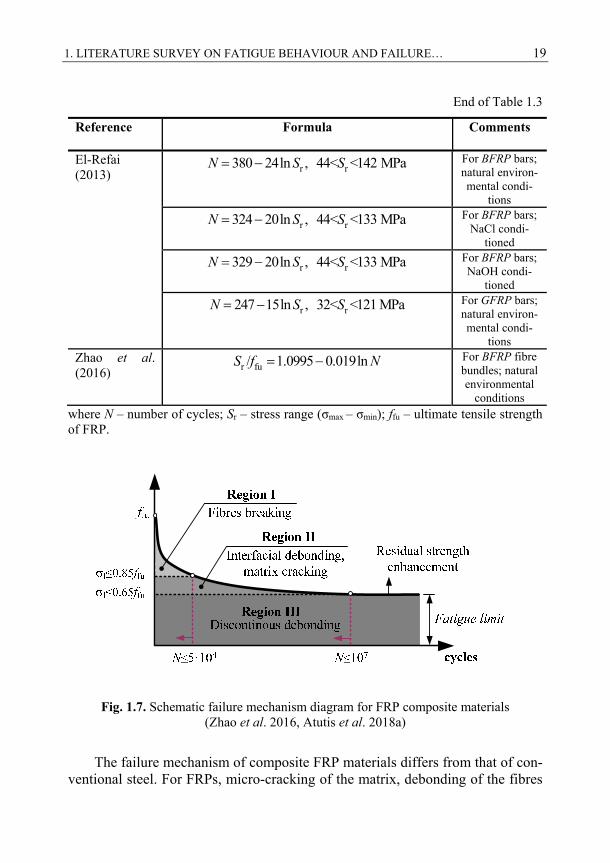
Fig. 1.7. Schematic failure mechanism diagram for FRP composite materials (Zhao et al. 2016, Atutis et al. 2018a)
The failure mechanism of composite FRP materials differs from that of con-ventional steel. For FRPs, micro-cracking of the matrix, debonding of the fibres
20 1. LITERATURE SURVEY ON FATIGUE BEHAVIOUR AND FAILURE…
and the matrix, or rupture of fibres are the main possible outcomes of failure under cyclic loading. Compared to steel, which is a homogenous material, failure is usu-ally caused by the opening of first the major crack and increase in this crack width until failure point.
Due to the accumulated damage in FRP composite materials, three main types of fatigue damage regions can be generated. In region I of Figure 1.7, the failure of the specimen occurs mostly because of the progressive fibre rupture. In this region, the composite material experiences greatest deformations due to high maximum loading stresses (> 85% of UTS). The stress and strain increase pro-gressively in fibres that are degrading but still not damaged enough to break, be-cause the stresses redistributed due to the increasing number of ruptured fibres in the composite, until the material reaches failure. At the lower stress region (region II), the acting load does not cause fibre breaking because the stress is rel-atively low (65–85% of UTS). Small-scale micro-cracks occur transversely over few of the fibres or along the interface of the fibre and matrix. This process causes the initiation of interfacial debonding. The composite material damage accumu-lates due to wear caused by the fibre-matrix contact zone debonding. Eventually, the high level of damage causes rupture of the fibres, leading to FRP failure under cyclic load. In region III, the fibre-matrix interfacial debonding continues to evolve causing straightening of the separate fibres. The stress intensity is too low to cause fibre breaking, and therefore this region is called FRP composite’s fatigue limit (the maximum stress intensity is under 65% of UTS of FRP) (Zhao et al. 2016, Atutis et al. 2018a).
1.4. Review on Creep and Shrinkage of Concrete
Concrete can be described as a complicated composite material because of the fact that its mechanical and physical properties are time dependent. From an applied load point of view, concrete deformations can be classified in two: a) deformations due to shrinkage, which are non-dependent on applied load and b) deformations due to creep – a phenomena that highly depends on the constant load duration. Of course, other elements also influence the final deformations of concrete, for ex-ample, the rheological properties of cement paste, progressive microcracking, wa-ter-cement ratio (V/C), age of concrete, moisture movement in the aggregate, elas-ticity modulus of the aggregate, admixtures, atmosphere conditions, etc. A vast amount of experimental data exists on shrinkage and creep of concrete, which provides a more advanced understanding of these processes. In this chapter, a brief review on some of the existing models for creep of concrete is provided, and to obtain a better understanding, one should analyse the extensive works of Bažant and Panula (1978), Neville et al. (1983), Bažant and Buyukozturk (1988), Gilbert
1. LITERATURE SURVEY ON FATIGUE BEHAVIOUR AND FAILURE… 21
(1988), Bažant and Kim (1992), Neville (1997), Cholmianskij (1997), Balevičius and Dulinskas (2000, 2010), Balevičius (2003, 2018), Gribniak (2009), Gilbert and Ranzi (2011) and others.
1.4.1. Static Creep Models
Based on the above-mentioned literature, it can be concluded that two of the most common approaches to predict the creep of concrete are as follows: a) depending on the treatment of size effects and humidity, the basic creep and drying creep curves are considered to have the same shape and are usually corrected by coeffi-cients that have no physical meaning; b) the time-shape curve difference of basic and drying creep is acknowledged and evaluated. It is assumed that the basic creep curve is independent of the size whereas the shrinkage curve depends on humidity and has a different shape. In many design codes and recommendations, the first approach – (a) is accepted (Bažant and Baweja, 2001).
When uncracked concrete under sustained axial loading at any time t is ana-lysed, there will be four main concrete strain components: instantaneous strain εel(t), creep strain εcr(t), shrinkage strain εsh(t) and temperature strain εT(t). If in the analysed situation, the environment temperature and sustained compressive stress σc0 are constant, then the concrete strain can be expressed as the sum of three main strain components:
el cr shε ε ε ε t t t t . (1.6)
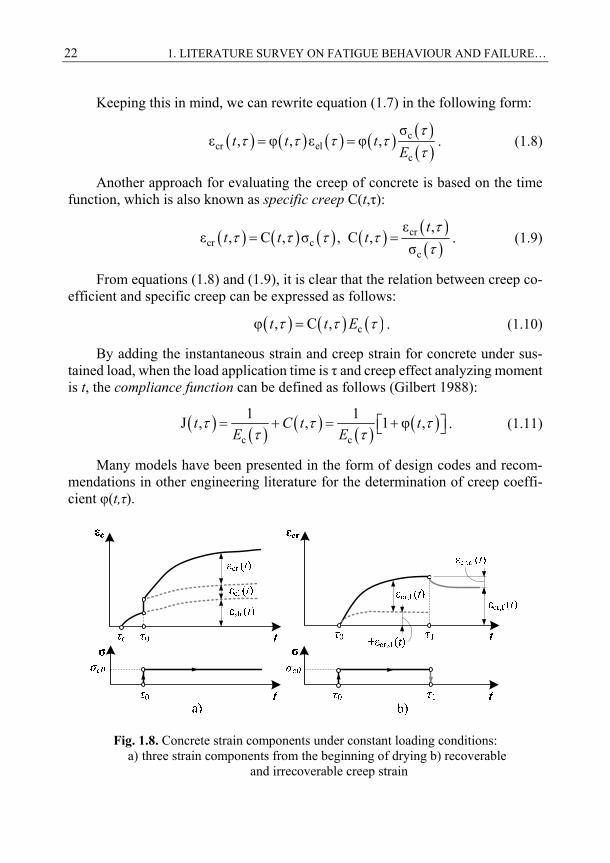
Immediately after ending moist curing (t = τd), shrinkage strain starts devel-oping, and it increases continually over time. At time t = τ0, when the axial load is applied, instantaneous strain appears and there will be an immediate increase in the strain (see Fig. 1.8a). Because of the fact that applied load is constant and has a long-time duration, the creep process starts, and the concrete strain increases again. Later, when the applied load is removed (at time t = τ1), the creep strain gradually reduces over time. A reduction process occurs because part of the creep strain is recoverable; however, the larger part is irrecoverable. The recoverable part is often referred to as delayed elastic strain εcr.d(t) and the irrecoverable – flow, εcr.f(t), as it is shown in Figure 1.8b) (Gilbert and Ranzi, 2011).
Usually, concrete strain due to creep can be determined by the involvement of creep coefficient φ(t,τ). If stress is applied at age τ, then at time t the relation between instantaneous strain and creep strain can be expressed as follows (Gilbert 1988):
cr
el
ε ,φ ,
ε
tt . (1.7)
22 1. LITERATURE SURVEY ON FATIGUE BEHAVIOUR AND FAILURE…
Keeping this in mind, we can rewrite equation (1.7) in the following form:
ccr el
c
σε , φ , ε φ ,
t t t
E. (1.8)
Another approach for evaluating the creep of concrete is based on the time function, which is also known as specific creep C(t,τ):
crcr c
c
ε ,ε , C , σ , C ,
σ
tt t t . (1.9)
From equations (1.8) and (1.9), it is clear that the relation between creep co-efficient and specific creep can be expressed as follows:
cφ , C , t t E . (1.10)
By adding the instantaneous strain and creep strain for concrete under sus-tained load, when the load application time is τ and creep effect analyzing moment is t, the compliance function can be defined as follows (Gilbert 1988):
c c
1 1J , , 1 φ ,
t C t t
E E. (1.11)
Many models have been presented in the form of design codes and recom-mendations in other engineering literature for the determination of creep coeffi-cient φ(t,τ).
Fig. 1.8. Concrete strain components under constant loading conditions:
a) three strain components from the beginning of drying b) recoverable and irrecoverable creep strain
1. LITERATURE SURVEY ON FATIGUE BEHAVIOUR AND FAILURE… 23
A brief review of Model Code 2010 (MC2010) time–dependent creep model
formulation is presented here. The creep coefficient is calculated in as follows:
0 0 c 0φ , φ β ,t t t t , 0 RH cm 0φ φ β β f t , (1.12)
RH 1 23
1 /100φ 1
0.1
RH
h
, cmcm
16.8β f
f , (1.13)
0 0.20
1β =
0.1t
t,
0.7 0.2
1 2cm cm
35 35,
f f
, (1.14)
where RH – is the relative humidity of the ambient environment; h = 2Ac/u is the notional size of the member, where Ac is the cross-section and u is the perimeter of the member in contact with the atmosphere.
The development of creep with time is described by equations (1.15) and (1.16):
0.30
c 0H 0
β ,β
t tt t
t t
, (1.15)
18H 3 3β 1.5 1 1.2 / 100 250 1500h RH
, 0.5
3cm
35
f
. (1.16)
In cases with higher stress levels, the nonlinearity of creep may be taken into account using equations (1.17) and (1.18):
0k 0 σφ φ exp 1.5 0, 4k for σ0.4 0.6k , (1.17)
0k 0φ φ for σ 0.4k , (1.18)
where φ0k – is the nonlinear notional creep coefficient; kσ = |σ| / fcm(t0). In the model by Bažant and Baweja (1995, 2000), also known as B3 model, the creep of concrete is evaluated using the compliance function J(t,t0). B3 model gives adequate results only for stresses < 0.45fck. The strain due to constant stress, applied at age t0 is given by
0 shε , σ ε t J t t t T t , (1.19)
where α – is the thermal expansion coefficient and ΔT(t) – is the temperature change. The compliance function is given as follows:
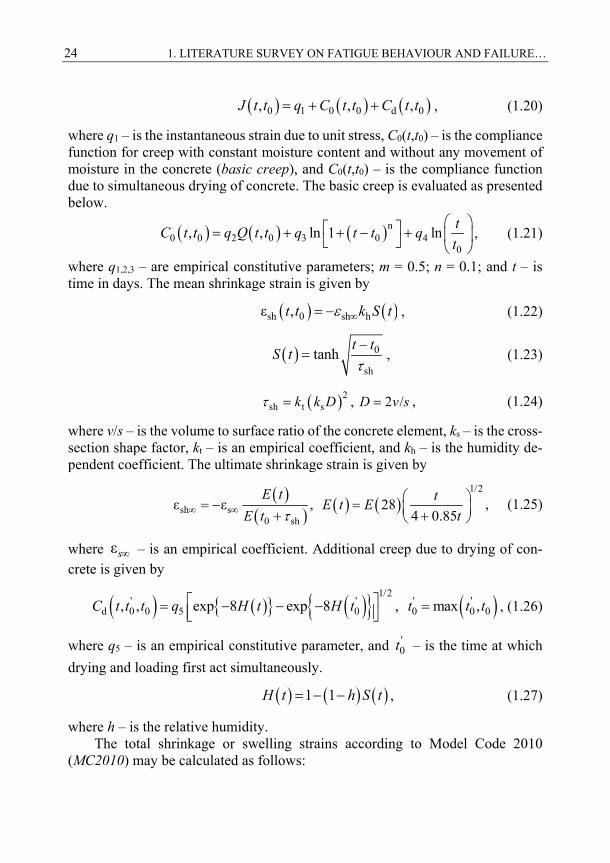
24 1. LITERATURE SURVEY ON FATIGUE BEHAVIOUR AND FAILURE…
0 1 0 0 d 0, , , J t t q C t t C t t , (1.20)
where q1 – is the instantaneous strain due to unit stress, C0(t,t0) – is the compliance function for creep with constant moisture content and without any movement of moisture in the concrete (basic creep), and C0(t,t0) – is the compliance function due to simultaneous drying of concrete. The basic creep is evaluated as presented below.
n0 0 2 0 3 0 40
, , ln 1 ln
tC t t q Q t t q t t q
t, (1.21)
where q1,2,3 – are empirical constitutive parameters; m = 0.5; n = 0.1; and t – is time in days. The mean shrinkage strain is given by
sh 0 sh hε , t t k S t , (1.22)
0
sh
tanh
t t
S t , (1.23)
2sh t s , 2 / k k D D v s , (1.24)
where v/s – is the volume to surface ratio of the concrete element, ks – is the cross-section shape factor, kt – is an empirical coefficient, and kh – is the humidity de-pendent coefficient. The ultimate shrinkage strain is given by
1/2
sh s0 sh
ε ε , 284 0.85
E t tE t E
E t t
, (1.25)
where ε s – is an empirical coefficient. Additional creep due to drying of con-crete is given by
1/2
' ' ' 'd 0 0 5 0 0 0 0, , exp 8 exp 8 , max ,
C t t t q H t H t t t t , (1.26)
where q5 – is an empirical constitutive parameter, and '0t – is the time at which
drying and loading first act simultaneously.
1 1 H t h S t , (1.27)
where h – is the relative humidity. The total shrinkage or swelling strains according to Model Code 2010
(MC2010) may be calculated as follows:
1. LITERATURE SURVEY ON FATIGUE BEHAVIOUR AND FAILURE… 25
cs cd caε ε ε , (1.28)
cd ds s h cd.0, t t k , (1.29)
0.5
sds s 2
0 s
,0.035
t tt t
h t t
, (1.30)
6cmcd,0 ds1 ds2 RH
cm.0
ε 0.85 220 110 exp 10
f
f, (1.31)
3
RH0
1.55 1
RH
RH , ca as caε ε , (1.32)
6ca ck( ) 2.5( 10) 10 f ,
1
2as 1 exp( 0.2 ) t . (1.33)
1.4.2. Cyclic Creep Models
Cyclic creep or fatigue creep of concrete can be described as a continuous long-time deformation process due to the cyclic load including the static creep of con-crete. Dynamic loading influences the viscoelastic behaviour of concrete by fluc-tuating the stresses throughout the concrete section and induces time-dependent deformation. In most cases, the cyclic creep phenomenon was determined by ex-perimentation. It was first detected by a researcher called Féret in 1906. Subse-quently, it was absorbed by Probst in 1925 and Ban in 1933. Cyclic creep was studied by many researchers and various approximate empirical formulas were proposed (Le Campus 1946, Murdock and Kesler 1955, Murdock 1965, Gvozdev 1966, Nordby 1967, Bažant 1968, Wittmann 1971, Whaley and Neville, Hirst 1973 and 1977, Bažant and Panula 1979, Hsu 1981, Bažant et al. 1992, Balaguru 1981, Taliercio 1993, 1996, Neville 1997, Jiang 2017 and others). Most of the proposed models generally agree with only short duration tests. On reviewing the empirical formulae, it is obvious that some generally accepted theory should have emerged. When investigating concrete elements under repetitive loading, one should focus on the changes in mechanical properties during fatigue life. The microcrack-ing process develops when the loading cycles increase. This process appears due to the tensile stresses transversely developed in the main compression field (Zanuy, 2010).
26 1. LITERATURE SURVEY ON FATIGUE BEHAVIOUR AND FAILURE…
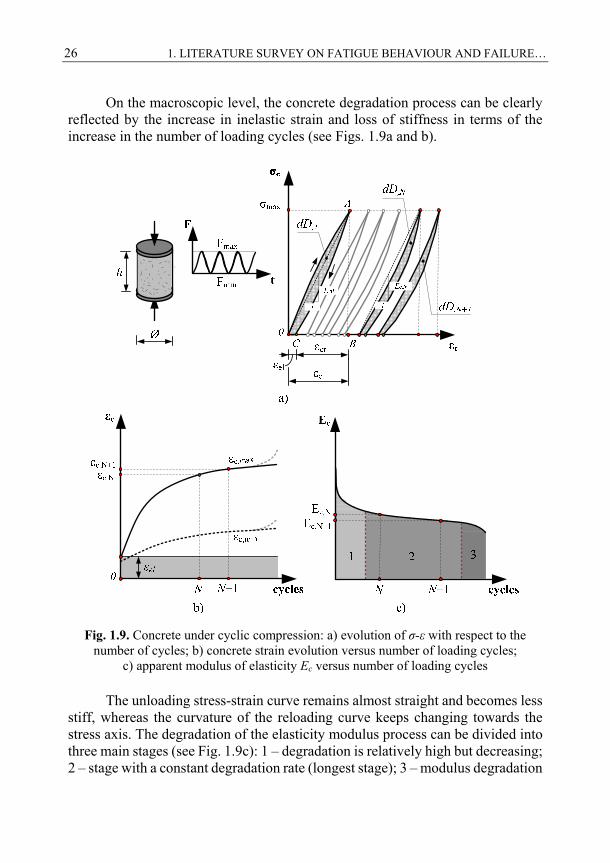
On the macroscopic level, the concrete degradation process can be clearly reflected by the increase in inelastic strain and loss of stiffness in terms of the increase in the number of loading cycles (see Figs. 1.9a and b).
Fig. 1.9. Concrete under cyclic compression: a) evolution of σ-ε with respect to the
number of cycles; b) concrete strain evolution versus number of loading cycles; c) apparent modulus of elasticity Ec versus number of loading cycles
The unloading stress-strain curve remains almost straight and becomes less stiff, whereas the curvature of the reloading curve keeps changing towards the stress axis. The degradation of the elasticity modulus process can be divided into three main stages (see Fig. 1.9c): 1 – degradation is relatively high but decreasing; 2 – stage with a constant degradation rate (longest stage); 3 – modulus degradation
1. LITERATURE SURVEY ON FATIGUE BEHAVIOUR AND FAILURE… 27
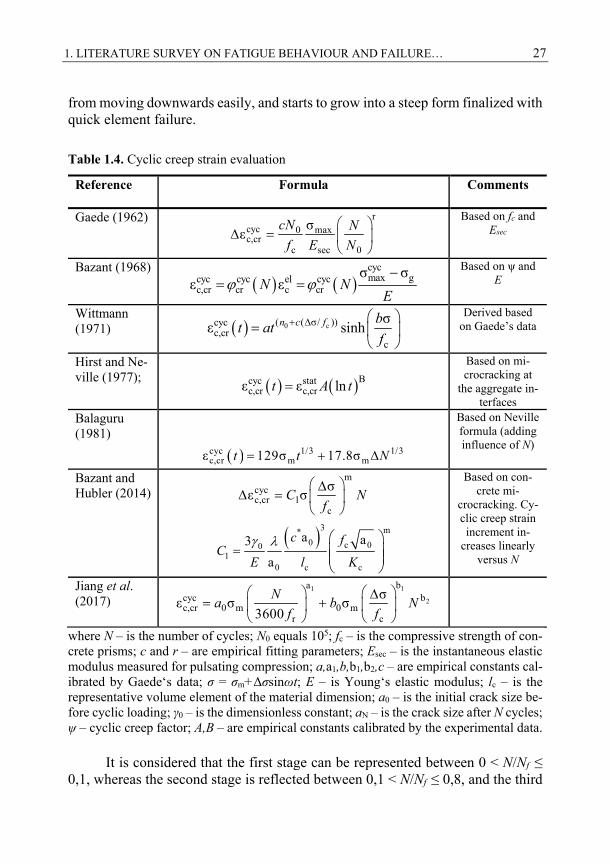
from moving downwards easily, and starts to grow into a steep form finalized with quick element failure.
Table 1.4. Cyclic creep strain evaluation
Reference Formula Comments
Gaede (1962) rcyc 0 maxc,cr
c sec 0
σε
cN N
f E N
Based on fc and Esec
Bazant (1968)
cycmax gcyc cyc el cyc
c,cr cr c cr
σ σε ε
N N
E
Based on ψ and E
Wittmann (1971) 0 c( ( σ/ ))cyc
c,crc
σε sinh
n c f bt at
f
Derived based on Gaede’s data
Hirst and Ne-ville (1977);
Bcyc statc,cr c,crε ε lnt A t
Based on mi-crocracking at
the aggregate in-terfaces
Balaguru (1981)
cyc 1/3 1/3c,cr m mε 129σ 17.8σ t t N
Based on Neville formula (adding influence of N)
Bazant and Hubler (2014)
mcycc,cr 1
c
σε σ
C N
f
3 m*0 c 00
10 c c
a a3
a
c fC
E l K
Based on con-crete mi-
crocracking. Cy-clic creep strain increment in-
creases linearly versus N
Jiang et al. (2017)
11
2
babcyc
c,cr 0 m 0 mr c
σε σ σ
3600
Na b N
f f
where N – is the number of cycles; N0 equals 105; fc – is the compressive strength of con-crete prisms; c and r – are empirical fitting parameters; Esec – is the instantaneous elastic modulus measured for pulsating compression; a,a1,b,b1,b2,c – are empirical constants cal-ibrated by Gaede‘s data; σ = σm+Δσsinωt; E – is Young‘s elastic modulus; lc – is the representative volume element of the material dimension; a0 – is the initial crack size be-fore cyclic loading; γ0 – is the dimensionless constant; aN – is the crack size after N cycles; ψ – cyclic creep factor; A,B – are empirical constants calibrated by the experimental data.
It is considered that the first stage can be represented between 0 < N/Nf ≤ 0,1, whereas the second stage is reflected between 0,1 < N/Nf ≤ 0,8, and the third
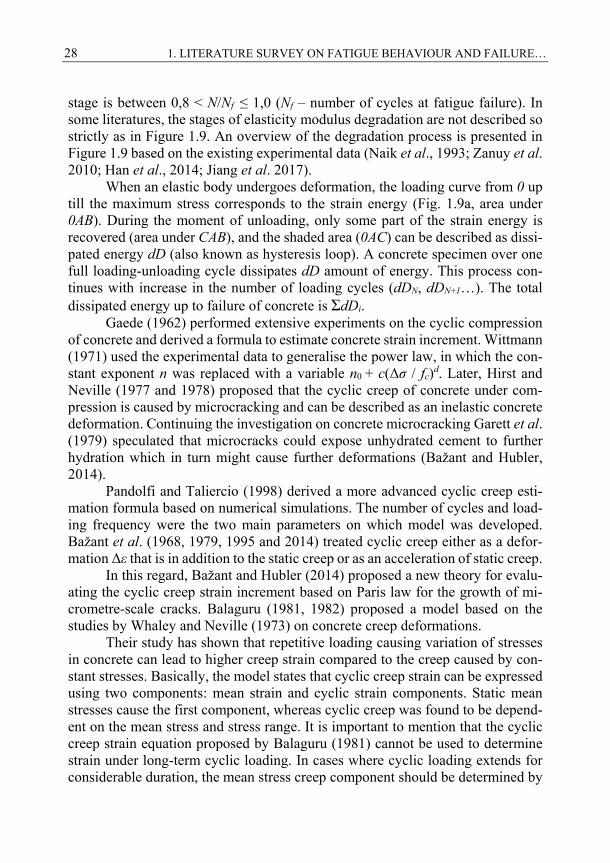
28 1. LITERATURE SURVEY ON FATIGUE BEHAVIOUR AND FAILURE…
stage is between 0,8 < N/Nf ≤ 1,0 (Nf – number of cycles at fatigue failure). In some literatures, the stages of elasticity modulus degradation are not described so strictly as in Figure 1.9. An overview of the degradation process is presented in Figure 1.9 based on the existing experimental data (Naik et al., 1993; Zanuy et al. 2010; Han et al., 2014; Jiang et al. 2017). When an elastic body undergoes deformation, the loading curve from 0 up till the maximum stress corresponds to the strain energy (Fig. 1.9a, area under 0AB). During the moment of unloading, only some part of the strain energy is recovered (area under CAB), and the shaded area (0AC) can be described as dissi-pated energy dD (also known as hysteresis loop). A concrete specimen over one full loading-unloading cycle dissipates dD amount of energy. This process con-tinues with increase in the number of loading cycles (dDN, dDN+1…). The total dissipated energy up to failure of concrete is ΣdDi. Gaede (1962) performed extensive experiments on the cyclic compression of concrete and derived a formula to estimate concrete strain increment. Wittmann (1971) used the experimental data to generalise the power law, in which the con-stant exponent n was replaced with a variable n0 + c(Δσ / fc)d. Later, Hirst and Neville (1977 and 1978) proposed that the cyclic creep of concrete under com-pression is caused by microcracking and can be described as an inelastic concrete deformation. Continuing the investigation on concrete microcracking Garett et al. (1979) speculated that microcracks could expose unhydrated cement to further hydration which in turn might cause further deformations (Bažant and Hubler, 2014). Pandolfi and Taliercio (1998) derived a more advanced cyclic creep esti-mation formula based on numerical simulations. The number of cycles and load-ing frequency were the two main parameters on which model was developed. Bažant et al. (1968, 1979, 1995 and 2014) treated cyclic creep either as a defor-mation Δε that is in addition to the static creep or as an acceleration of static creep. In this regard, Bažant and Hubler (2014) proposed a new theory for evalu-ating the cyclic creep strain increment based on Paris law for the growth of mi-crometre-scale cracks. Balaguru (1981, 1982) proposed a model based on the studies by Whaley and Neville (1973) on concrete creep deformations. Their study has shown that repetitive loading causing variation of stresses in concrete can lead to higher creep strain compared to the creep caused by con-stant stresses. Basically, the model states that cyclic creep strain can be expressed using two components: mean strain and cyclic strain components. Static mean stresses cause the first component, whereas cyclic creep was found to be depend-ent on the mean stress and stress range. It is important to mention that the cyclic creep strain equation proposed by Balaguru (1981) cannot be used to determine strain under long-term cyclic loading. In cases where cyclic loading extends for considerable duration, the mean stress creep component should be determined by
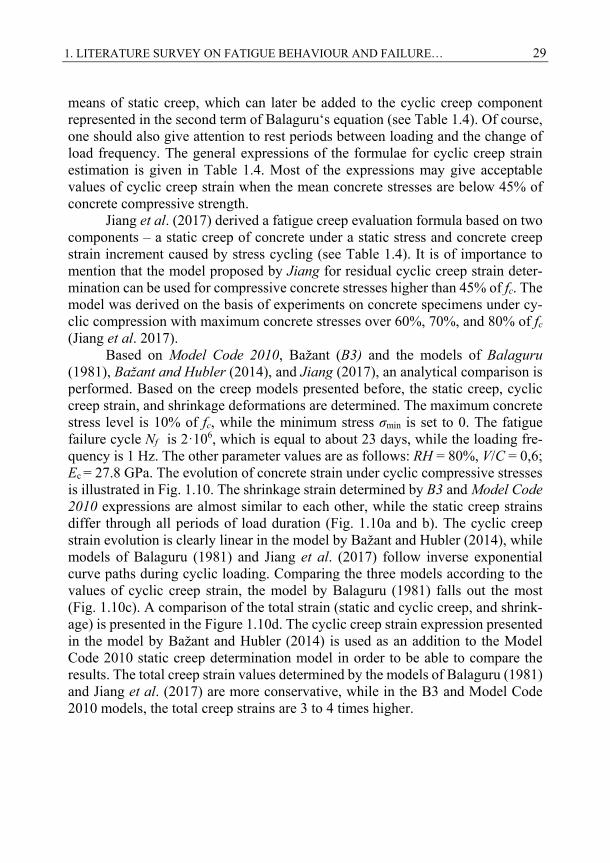
1. LITERATURE SURVEY ON FATIGUE BEHAVIOUR AND FAILURE… 29
means of static creep, which can later be added to the cyclic creep component represented in the second term of Balaguru‘s equation (see Table 1.4). Of course, one should also give attention to rest periods between loading and the change of load frequency. The general expressions of the formulae for cyclic creep strain estimation is given in Table 1.4. Most of the expressions may give acceptable values of cyclic creep strain when the mean concrete stresses are below 45% of concrete compressive strength. Jiang et al. (2017) derived a fatigue creep evaluation formula based on two components – a static creep of concrete under a static stress and concrete creep strain increment caused by stress cycling (see Table 1.4). It is of importance to mention that the model proposed by Jiang for residual cyclic creep strain deter-mination can be used for compressive concrete stresses higher than 45% of fc. The model was derived on the basis of experiments on concrete specimens under cy-clic compression with maximum concrete stresses over 60%, 70%, and 80% of fc (Jiang et al. 2017). Based on Model Code 2010, Bažant (B3) and the models of Balaguru (1981), Bažant and Hubler (2014), and Jiang (2017), an analytical comparison is performed. Based on the creep models presented before, the static creep, cyclic creep strain, and shrinkage deformations are determined. The maximum concrete stress level is 10% of fc, while the minimum stress σmin is set to 0. The fatigue failure cycle Nf is 2ꞏ106, which is equal to about 23 days, while the loading fre-quency is 1 Hz. The other parameter values are as follows: RH = 80%, V/C = 0,6; Ec = 27.8 GPa. The evolution of concrete strain under cyclic compressive stresses is illustrated in Fig. 1.10. The shrinkage strain determined by B3 and Model Code 2010 expressions are almost similar to each other, while the static creep strains differ through all periods of load duration (Fig. 1.10a and b). The cyclic creep strain evolution is clearly linear in the model by Bažant and Hubler (2014), while models of Balaguru (1981) and Jiang et al. (2017) follow inverse exponential curve paths during cyclic loading. Comparing the three models according to the values of cyclic creep strain, the model by Balaguru (1981) falls out the most (Fig. 1.10c). A comparison of the total strain (static and cyclic creep, and shrink-age) is presented in the Figure 1.10d. The cyclic creep strain expression presented in the model by Bažant and Hubler (2014) is used as an addition to the Model Code 2010 static creep determination model in order to be able to compare the results. The total creep strain values determined by the models of Balaguru (1981) and Jiang et al. (2017) are more conservative, while in the B3 and Model Code 2010 models, the total creep strains are 3 to 4 times higher.
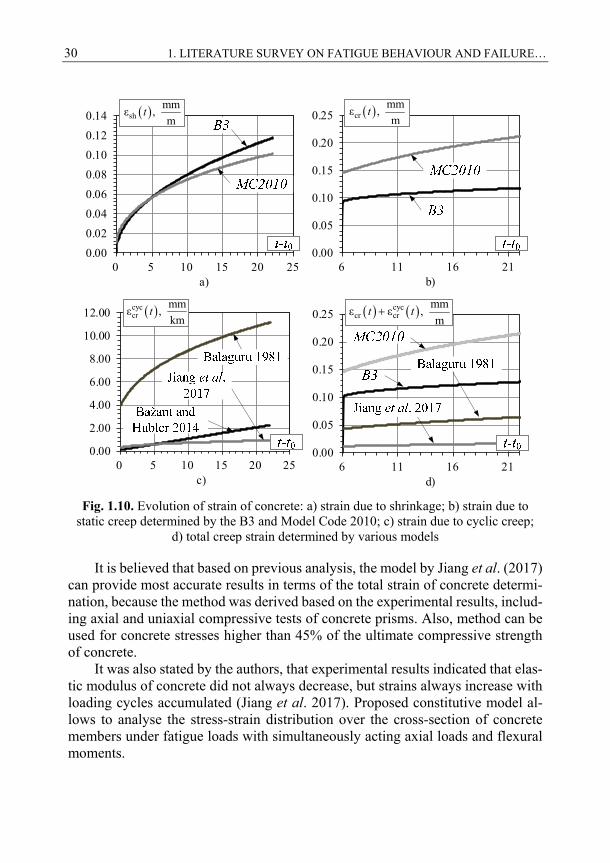
30 1. LITERATURE SURVEY ON FATIGUE BEHAVIOUR AND FAILURE…
0.00
0.05
0.10
0.15
0.20
0.25
6 11 16 21d)
0.00
2.00
4.00
6.00
8.00
10.00
12.00
0 5 10 15 20 25c)
0.00
0.05
0.10
0.15
0.20
0.25
6 11 16 21b)
0.00
0.02
0.04
0.06
0.08
0.10
0.12
0.14
0 5 10 15 20 25a)
shmm
ε , m
t crmm
ε , m
t
cyccr
mmε ,
kmt cyc
cr crmm
ε ε , m
t t
Fig. 1.10. Evolution of strain of concrete: a) strain due to shrinkage; b) strain due to
static creep determined by the B3 and Model Code 2010; c) strain due to cyclic creep; d) total creep strain determined by various models
It is believed that based on previous analysis, the model by Jiang et al. (2017)
can provide most accurate results in terms of the total strain of concrete determi-nation, because the method was derived based on the experimental results, includ-ing axial and uniaxial compressive tests of concrete prisms. Also, method can be used for concrete stresses higher than 45% of the ultimate compressive strength of concrete.
It was also stated by the authors, that experimental results indicated that elas-tic modulus of concrete did not always decrease, but strains always increase with loading cycles accumulated (Jiang et al. 2017). Proposed constitutive model al-lows to analyse the stress-strain distribution over the cross-section of concrete members under fatigue loads with simultaneously acting axial loads and flexural moments.
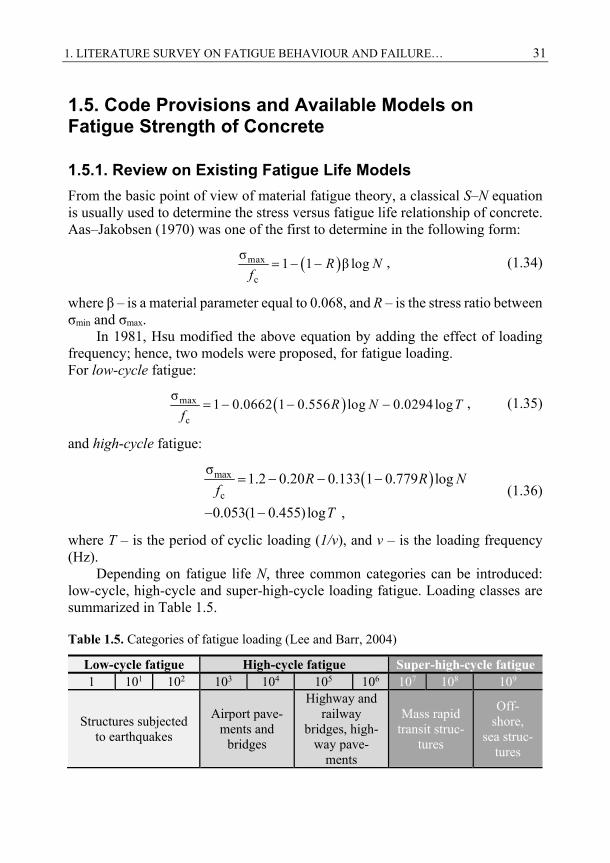
1. LITERATURE SURVEY ON FATIGUE BEHAVIOUR AND FAILURE… 31
1.5. Code Provisions and Available Models on Fatigue Strength of Concrete
1.5.1. Review on Existing Fatigue Life Models
From the basic point of view of material fatigue theory, a classical S–N equation is usually used to determine the stress versus fatigue life relationship of concrete. Aas–Jakobsen (1970) was one of the first to determine in the following form:
max
c
σ1 1 β log R N
f, (1.34)
where β – is a material parameter equal to 0.068, and R – is the stress ratio between σmin and σmax.
In 1981, Hsu modified the above equation by adding the effect of loading frequency; hence, two models were proposed, for fatigue loading. For low-cycle fatigue:
max
c
σ1 0.0662 1 0.556 log 0.0294 logR N T
f , (1.35)
and high-cycle fatigue:
max
c
σ1.2 0.20 0.133 1 0.779 log
0.053(1 0.455) log ,
R R Nf
T
(1.36)
where T – is the period of cyclic loading (1/ν), and ν – is the loading frequency (Hz).
Depending on fatigue life N, three common categories can be introduced: low-cycle, high-cycle and super-high-cycle loading fatigue. Loading classes are summarized in Table 1.5.
Table 1.5. Categories of fatigue loading (Lee and Barr, 2004)
Low-cycle fatigue High-cycle fatigue Super-high-cycle fatigue 1 101 102 103 104 105 106 107 108 109
Structures subjected to earthquakes
Airport pave-ments and
bridges
Highway and railway
bridges, high-way pave-
ments
Mass rapid transit struc-
tures
Off-shore,
sea struc-tures
32 1. LITERATURE SURVEY ON FATIGUE BEHAVIOUR AND FAILURE…
Furtak (1984) developed a model considering the change in loading fre-quency:
Amaxν
c
σ(1 log ) CN BR N C
f, (1.37)
where А,B, and C – are the adjusting parameters. Coefficient Cν is determined by the following equation:
ν 1 1 log C a bR , (1.38)
where a, and b – are model parameters. Later, Zhang (1989) made some improvements on the fatigue life determina-
tion model and introduced the importance of reversal of stresses:
maxν
c
σ1 1 ' log C R N
f. (1.39)
The loading frequency is expressed as follows:
log νν
C ab c , (1.40)
where R‘ – is the stress ratio evaluating stress reversals:
max
min
' , kai 0,
' , kai 0.
R R R
SR R
S
(1.41)
Here, c – is a model adjusting parameter.
1.5.2. Eurocode 2
In order to avoid fatigue failure of RC structures, the minimum and maximum compressive stresses during repetitive loading are limited. For concrete under compression or shear loading, the design fatigue strength of concrete is prescribed as follows:
cd,fat 1 cc 0 cd ckβ ( ) (1 / 250) f k t f f , (1.42)
0.5
cc 00
28β ( ) exp 1t s
t
, (1.43)
where βcc(t0) is a coefficient for the concrete strength at the first loading moment; t0 – is the time at the beginning of cyclic loading (in days), and s – is a coefficient
1. LITERATURE SURVEY ON FATIGUE BEHAVIOUR AND FAILURE… 33
depending on strength class of the cement. For cement class 42.5N, the value of s equals 0.25; k1 equals 0.85 for N = 106 cycles.
A satisfactory fatigue resistance of concrete under compression may be as-sumed if following conditions are fulfilled:
cd,max,equ equ0.43 1 1E R . (1.44)
The stress ratio is expressed as:
cd,min,equequ
cd,max,equ
E
RE
. (1.45)
The stress levels are defined as follows:
cd,max,equcd,max,equ
cd,fat
σE
f, (1.46)
cd,min,equcd,min,equ
cd,fat
σE
f. (1.47)
To summarize the fatigue strength limit ascribed in the above provisions of Eurocode 2, it is clear that the calculation process is performed as a damage-equivalent check for the fatigue due to a single load cycle.
1.5.3. Model Code 2010
Similar to Eurocode 2, the international general merged structural code fib also limits the stresses in concrete due to cyclic load:
cd,fat cc 0 c,sus 0 cd ckβ ( )β ( , ) (1 / 400) f t t t f f , (1.48)
where βcc(t0) is the same as in equation (1.15) and βc,sus(t,t0) is equal to 0.85 for fatigue. For concrete age in days, the following expression is used:
T1 i
4000exp 13.65
273 ( )
n
it t
T t
. (1.49)
Here, the number of days with temperature T are counted as Δti; therefore T(Δti) describes the temperature during time period Δti. From equations (1.14) and (1.29) the factor 400 instead of 250 in fib is considered to obtain a better corre-spondence with the experimental results for higher strength concrete specimens. The Wӧhler curve ascribing relations in fib Model Code 2010 (for 0 ≤ Sc,min ≤ 0.8) are given as follows:
34 1. LITERATURE SURVEY ON FATIGUE BEHAVIOUR AND FAILURE…
1 c,min8
log 11
N SY
, (1.50)
c,max c,min2 c,min
c,min
8ln(10)log 8 log
1
S SN Y S
Y Y S , (1.51)
c,min2
c,min c,min
0.45 1.8
1 1.8 0.3
SY
S S
, (1.52)
c,maxc,max
ck,fat
σS
f ;
c,minc,min
ck,fat
σS
f , (1.53)
c c,max c,min S S S . (1.54)
This code provides such regulations on equations (1.50) – (1.54): if logN1 ≤ 8, then logN = logN1 and if logN1 > 8, then logN = logN2. If Sc,min > 0.8 the S–N relations for Sc,min = 0.8 should be used. All the above relations are valid for concrete stored in a constant environment of approximately 20 oC and RH = 65%.
1.5.4. ACI 215R-74
Plain concrete undergoing cyclic loading may exhibit excessive cracking and eventually – result in failure after many loading cycles, even if the maximum stress caused by repetitive loading is less than static strength of a similar speci-men. The fatigue curve is usually shown for a probability of failure of 50%. The design for fatigue of concrete may be completed easier by the use of a modified Goodman diagram. Goodman diagram is based on the assumption that the fatigue strength of concrete is almost the same irrespective of whether the mode of load-ing is tension, compression or flexure. Goodman’s diagram evaluates the influ-ence of the range of loading. Using this diagram, engineers can determine the maximum stress in tension, compression, or flexure that plain concrete can with-stand for N = 106 loading repetitions for a given minimum stress (see Fig. 1.11). An example is shown using ACI codes to provide an explanation of Goodman’s diagram: if σmin = 0.15fck, then the maximum load that can result in fatigue failure of concrete after one million cycles is about 57% of the static ultimate strength.
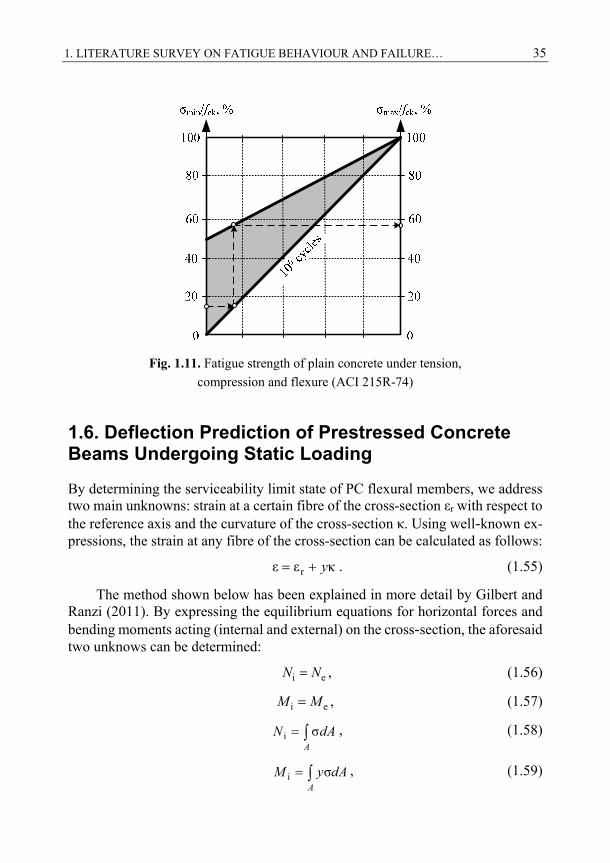
1. LITERATURE SURVEY ON FATIGUE BEHAVIOUR AND FAILURE… 35
Fig. 1.11. Fatigue strength of plain concrete under tension,
compression and flexure (ACI 215R-74)
1.6. Deflection Prediction of Prestressed Concrete Beams Undergoing Static Loading
By determining the serviceability limit state of PC flexural members, we address two main unknowns: strain at a certain fibre of the cross-section εr with respect to the reference axis and the curvature of the cross-section κ. Using well-known ex-pressions, the strain at any fibre of the cross-section can be calculated as follows:
rε ε κ y . (1.55)
The method shown below has been explained in more detail by Gilbert and Ranzi (2011). By expressing the equilibrium equations for horizontal forces and bending moments acting (internal and external) on the cross-section, the aforesaid two unknows can be determined:
i eN N , (1.56)
i eM M , (1.57)
i σ A
N dA , (1.58)
i σ A
M y dA , (1.59)
36 1. LITERATURE SURVEY ON FATIGUE BEHAVIOUR AND FAILURE…
where Ne and Me are the applied external axial force and bending moment, respec-tively.
Having obtained the strain values, the stresses in any level of concrete fibre, in reinforcing and prestressing reinforcement, can be determined. The instantane-ous stresses at time t0 can be written as follows:
c c 0σ ε E , (1.60)
s,i s,i 0σ ε E , (1.61)
p,i p,i 0 p,i,initσ ε ε E , (1.62)
where σc, σs,i, and σp,i determine the stresses in any fibre in concrete, stresses in the i-th reinforcing steel (where i = 1,…ms) and stresses in the prestressing rein-forcement (where i = 1,…mp).
The initial strain in the prestressing reinforcement due to prestressing force at time t0 is given by
i,initp,i,init
p,i p,i
ε P
A E. (1.63)
The total internal axial force Ni(t0) can be determined from the sum of re-sistant forces of concrete Nc, non-prestressed reinforcement Ns, and prestressing FRP reinforcement Np at the time t0 (Gilbert 1988, Gilbert and Ranzi 2011):
c c
c 0 c,0 c,0 r,0 0 c c r,0 c c 0σ ε κ ε κ A A
N t dA E y dA A E S E , (1.64)
s s s
s 0 s,i s,i r,0 s,i 0 s,i s,i r,0 s,i s,i s,i 01 1 1
ε κ ε κ
m m m
i i iN t A E y A E A E y , (1.65)
p p p
p 0 p,i p,i r,0 p,i p,i p,i 0 p,i p,i p,init1 1 1
ε κ ε
m m m
i i iN t A E A E y A E , (1.66)
ps
p ps
i 0 c c,0 s,i s,i p,i p,i r,01 1
c c,0 s,i s,i s,i p,i p,i p,i 0 p,i p,i p,init1 1 1
ε
κ ε
mm
i i
m mm
i i i
N t A E A E A E
S E A E y A E y A E
p
A,0 r,0 S,0 0 p,i p,i p,init1
ε κ ε ,m
iR R A E
(1.67)
1. LITERATURE SURVEY ON FATIGUE BEHAVIOUR AND FAILURE… 37
where RA,0 and RS,0 respectively represent the axial rigidity and the cross-section stiffness related to the first moment of area about the refence axis at time t0:
ps
A,0 c c s,i s,i p,i p,i1 1
mm
i iR A E A E A E , (1.68)
ps
S,0 c c s,i s,i s,i p,i p,i p,i1 1
mm
i iR S E A E y A E y . (1.69)
The total internal bending moment Mi(t0) can be determined by the sum of resistant bending moments of concrete, non-prestressed reinforcement, and pre-stressing FRP reinforcement at time t0:
ps
p ps
0 c c,0 s,i s,i s,i p,i p,i p,i r,01 1
2 2c c,0 s,i s,i s,i p,i p,i p,i 0 p,i p,i p,init p,i
1 1 1
ε
κ ε
mm
ii i
m mm
i i i
M t S E A E y A E y
I E A E y A E y A E y
p
S,0 r,0 I,0 0 p,i p,i p,init p,i1
ε κ ε ,m
iR R A E y
(1.70)
where RI,0 represents the flexural rigidity and cross-section about the refence axis at time t0:
ps 2 2
I,0 c c s,i s,i s,i p,i p,i p,i1 1
mm
i iR I E A E y A E y . (1.71)
Then, the equilibrium equations Ni(t0) = Ne(t0) and Mi(t0) = Me(t0) can be re-written into matrix form. The vector for the applied external forces and bending moments re,0, material and geometric properties matrix D0, the strain vector ε0, and the vector containing actions caused by initial prestressing fp,init at the time t0:
e,0 0 0 p,init+r D ε f , (1.72)
here:
e,0e,0
e,0
N
M
r , (1.73)
A,0 S,00
S,0 I,0
R R
R R
D , (1.74)
38 1. LITERATURE SURVEY ON FATIGUE BEHAVIOUR AND FAILURE…
r,00
0
ε
κ
ε , (1.75)
p p,i p,i p,i,initp,init
1 p,i p,i p,i,init p,i
ε
ε
m
i
A E
A E y
f , (1.76)
One of the unknowns, the strain vector, can be determined by solving equa-tion (1.72):
10 0 e,0 p,init 0 e,0 p,init
ε D r f F r f . (1.77)
where:
I,0 S,00 2
A,0 I,0 S,0 S,0 A,0
1
F
R R
R R R R R. (1.78)
Once we have calculated the strain vector, it is possible to determine the stress distribution in the cross-section by rewriting (1.60), (1.61) and (1.62) into the equations shown below:
c,0 c,0 0 c,0 0σ ε 1 εE E y , (1.79)
s,i,0 s,i 0 s,i s,i 0σ ε 1 εE E y , (1.80)
p,i,0 p,i 0 p,i,init p,i p,i 0 p,i p,i,initσ ε ε 1 ε εE E y E . (1.81)
In order to determine how the stresses and strains are vary with time, cross-sectional analysis using the age-adjusted effective modulus method (AAEMM) is employed. Based on time t, when the development of stress and strain are meas-ured, expression (1.55) takes the following form:
rε ε κ t t y t . (1.82)
The stresses in the cross-section can be determined as follows:
c,effc 0 sh e,0 c,0σ , ε ε σ t E t t t t F , (1.83)
s,i s,iσ εt E t , (1.84)
p,i p,i p,i,init p,i,relσ ε ε ε t E t t , (1.85)
where:
1. LITERATURE SURVEY ON FATIGUE BEHAVIOUR AND FAILURE… 39
0e,0 0
0 0
, 1,
1 , ,
t tF t t
t t t t. (1.86a)
The age-adjusted effective modulus is determined by the following equation (Gilbert 1988):
c 0c,eff 0
0 0
,1 , ,
E tE t t
t t t t. (1.86b)
Relaxation strain in BFRP reinforcement can be determined using the equa-tion given below:
p,i,rel p,i,init p p,i,initε ε ,σt t , (1.87)
where φp(t,σp,i,init) – is the relaxation coefficient for BFRP reinforcement. This value was determined from the experimental tests performed by Atutis et al. (2018c).
Time–dependent cross–sectional properties RA(t), RS(t), and RI(t) are then re-calculated using AAEMM for concrete. In order to evaluate the effect of creep and shrinkage of concrete equilibrium equation (1.72) must take the following form:
e cr sh p,init p,rel( ) ( ) ( )+ ( ) ( ) ( )t t t t t t r D ε f f f f . (1.88)
The vector representing the effect of creep is calculated using the following equation:
c r,0 c 0cr e,0 c,0
c r,0 c 0( )
f
A St F E
S I. (1.89)
The effect of shrinkage is calculated using the expression presented here.
csh c,eff sh
c
( )
fA
t E tS
. (1.90)
Finally, the initial prestress force and prestress losses of BFRP reinforcement are calculated using equations (1.76) and (1.91).
p,rel p,init p p,i,init( ) ,σf ft t . (1.91)
The strain vector ( )ε t can be determined by solving equation (1.88). After cracking, the geometrical properties of the cross-section (Ac,cr, Sc,cr and Ic,cr), cross-sectional rigidities and stiffness (RA,cr, RS,cr and RI,cr) are recalculated using the cracked cross-section. Using trial–error method by solving equations (1.56) and
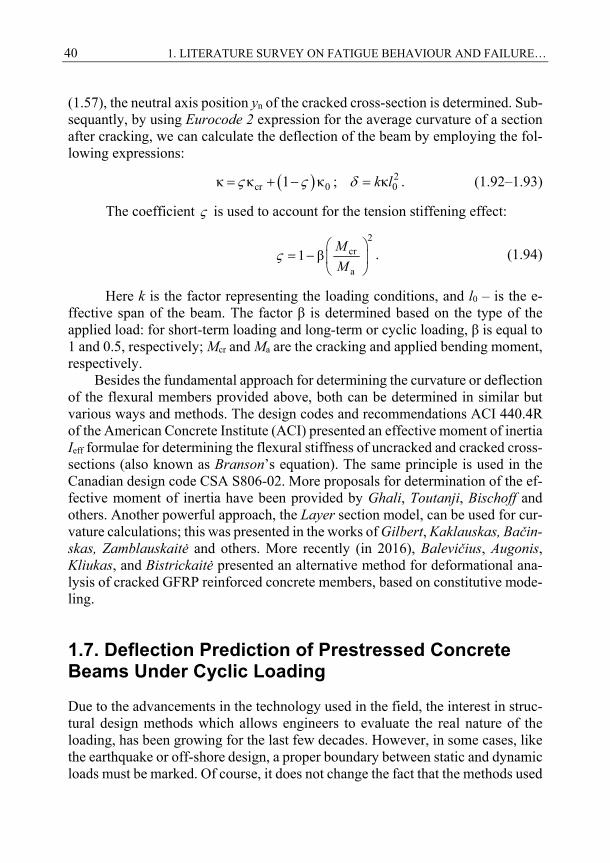
40 1. LITERATURE SURVEY ON FATIGUE BEHAVIOUR AND FAILURE…
(1.57), the neutral axis position yn of the cracked cross-section is determined. Sub-sequantly, by using Eurocode 2 expression for the average curvature of a section after cracking, we can calculate the deflection of the beam by employing the fol-lowing expressions:
cr 0κ κ 1 κ ; 20κk l . (1.92–1.93)
The coefficient is used to account for the tension stiffening effect:
2
cr
a
1 β
M
M. (1.94)
Here k is the factor representing the loading conditions, and l0 – is the e-ffective span of the beam. The factor β is determined based on the type of the applied load: for short-term loading and long-term or cyclic loading, β is equal to 1 and 0.5, respectively; Mcr and Ma are the cracking and applied bending moment, respectively.
Besides the fundamental approach for determining the curvature or deflection of the flexural members provided above, both can be determined in similar but various ways and methods. The design codes and recommendations ACI 440.4R of the American Concrete Institute (ACI) presented an effective moment of inertia Ieff formulae for determining the flexural stiffness of uncracked and cracked cross-sections (also known as Branson’s equation). The same principle is used in the Canadian design code CSA S806-02. More proposals for determination of the ef-fective moment of inertia have been provided by Ghali, Toutanji, Bischoff and others. Another powerful approach, the Layer section model, can be used for cur-vature calculations; this was presented in the works of Gilbert, Kaklauskas, Bačin-skas, Zamblauskaitė and others. More recently (in 2016), Balevičius, Augonis, Kliukas, and Bistrickaitė presented an alternative method for deformational ana-lysis of cracked GFRP reinforced concrete members, based on constitutive mode-ling.
1.7. Deflection Prediction of Prestressed Concrete Beams Under Cyclic Loading
Due to the advancements in the technology used in the field, the interest in struc-tural design methods which allows engineers to evaluate the real nature of the loading, has been growing for the last few decades. However, in some cases, like the earthquake or off-shore design, a proper boundary between static and dynamic loads must be marked. Of course, it does not change the fact that the methods used

1. LITERATURE SURVEY ON FATIGUE BEHAVIOUR AND FAILURE… 41
to design structures under static loading are valid for use when a dynamic analysis is being performed. Dynamic analysis enables us to determine the changes in de-flection considering time variation. To ensure high quality results, dynamic anal-ysis of the structural deformations can be performed only when the natural angular frequency ωn is known. The two main parameters influencing the value of the natural frequency of the structure is the stiffness k and mass m. Estimation of these parameters are only possible if the dynamic motion of the structure is evaluated at some level. Moreover, the deflection of the structure caused by time-varying loading can be obtained when the solution of the differential equation is found.
In some way or the other, most of the deflection calculation methods found in literature treat dynamic load as static. Some of the recently developed methods are presented in further chapters. These methods usually include an estimation of the changes in the mechanical properties of materials. Hence, the increase in de-flection is usually determined.
1.7.1. Balaguru (1981): Modified Effective Moment of Inertia
Balaguru introduced a theoretical model to predict the increase in deflection of prestressed concrete beams using the fatigue properties of the constituent materi-als. He was one of the first to suggest that not only should the time–dependent creep be accounted for but also the cyclic creep of concrete in compression should have some reference in the determination of deformations of PC beams subjected to cyclic loading. The stiffness degradation due to progressive cracking and the reduction of a bond between concrete and reinforcement leads to lower tension zone contribution. Also, the contribution of strain softening of the reinforcing and prestressing steel due to cyclic creep is applied in the model.
The proposed model procedure includes four main steps: a) calculation of concrete strain including both time-dependent creep and cyclic creep of concrete in compression; b) determination of degraded or apparent modulus of elasticity of concrete; c) recalculation of cracking moment under cyclic loading; d) determi-nation of the effective moment of inertia by evaluating the increase in the number of load cycles.
Cyclic creep can be calculated using the equation given in Table 1.4. It is of importance to mention that the creep strain corresponding to mean stress cannot be calculated for long–term cyclic loading. If the cyclic load duration is extended for a considerable duration cyclic creep strain should be determined by static or time-dependent creep formulations presented in the design codes and recommen-dations. The calculated mean strain can then be added to the cyclic creep expres-sion represented by the second term of Balaguru model – 17,8σmΔN1/3 (see Ta-ble 1.4). Also, the cyclic creep expression presented in this model can give acceptable results only for stress values less than 0,45fck.

42 1. LITERATURE SURVEY ON FATIGUE BEHAVIOUR AND FAILURE…
After determining the non–recoverable cyclic creep strain secant modulus of elasticity of concrete at any loading cycle, Ec(N) can be defined as a function of cyclic creep strain:
c,maxc
c,max cycc,cr
c
σ( )
σε
E N
E
, (1.95)
where N – is the number of cycles, Ec is the modulus of elasticity of concrete, and σc,max – is the maximum concrete compressive stress at a certain loading cycle.
The concrete between the cracks and the steel reinforcement surrounded by concrete undergo cyclic stresses due to the cyclic load, which leads to a decrease in the modulus of rupture of concrete. The following suggestion is introduced for the degradation of the modulus of rupture of concrete:
10r r
log( ) 1
13
Nf N f , (1.96)
where fr – is the static modulus of rupture of concrete. Considering the dependence of PC beam cracking moment and modulus of
rupture, it is stated that Mcr should also decrease according to equation (1.96). Because the model is based on Branson’s effective moment of inertia Ieff, the
tendency of decrease is obtained by entering Mcr(N). This approach allows the reduction in tensile stiffness of concrete because progressive cracking is ac-counted for in the model. Finally, the modified effective moment of inertia is de-fined as follows:
3
creff cr g cr g
a
( )( ) ( ) ( )
M NI N I N I I N I
M
. (1.97)
Here, Icr(N) – is the second moment of area of a cracked cross-section account-ing for Ec(N), Ma – is the applied bending moment at a certain load cycle, and Ig – is the second moment of area of the gross cross-section.
The PC beam deflection under cyclic loading can then be expressed in the following form:
2a eff
c eff
δ( )( ) ( )
kM lN
E N I N . (1.98)
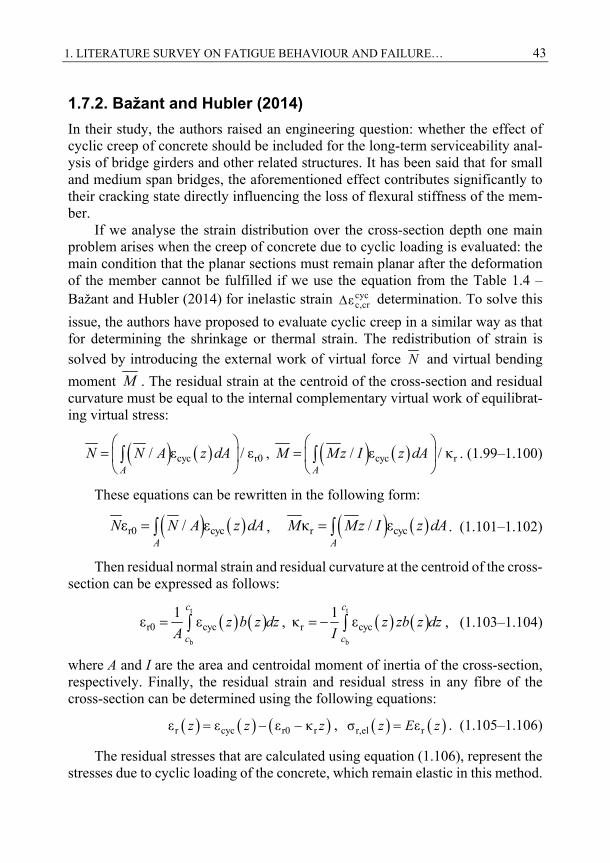
1. LITERATURE SURVEY ON FATIGUE BEHAVIOUR AND FAILURE… 43
1.7.2. Bažant and Hubler (2014)
In their study, the authors raised an engineering question: whether the effect of cyclic creep of concrete should be included for the long-term serviceability anal-ysis of bridge girders and other related structures. It has been said that for small and medium span bridges, the aforementioned effect contributes significantly to their cracking state directly influencing the loss of flexural stiffness of the mem-ber. If we analyse the strain distribution over the cross-section depth one main problem arises when the creep of concrete due to cyclic loading is evaluated: the main condition that the planar sections must remain planar after the deformation of the member cannot be fulfilled if we use the equation from the Table 1.4 – Bažant and Hubler (2014) for inelastic strain cyc
c,crε determination. To solve this
issue, the authors have proposed to evaluate cyclic creep in a similar way as that for determining the shrinkage or thermal strain. The redistribution of strain is
solved by introducing the external work of virtual force N and virtual bending
moment M . The residual strain at the centroid of the cross-section and residual curvature must be equal to the internal complementary virtual work of equilibrat-ing virtual stress:
cyc r0/ ε / εA
N N A z dA
, cyc r/ ε / κ
A
M M z I z dA
. (1.99–1.100)
These equations can be rewritten in the following form:
r0 cycε / ε A
N N A z dA , r cycκ / ε A
M Mz I z dA . (1.101–1.102)
Then residual normal strain and residual curvature at the centroid of the cross-section can be expressed as follows:
t
b
r0 cyc1
ε ε c
c
z b z dzA
, t
b
r cyc1
κ ε c
c
z zb z dzI
, (1.103–1.104)
where A and I are the area and centroidal moment of inertia of the cross-section, respectively. Finally, the residual strain and residual stress in any fibre of the cross-section can be determined using the following equations:
r cyc r0 rε ε ε κ z z z , r,el rσ εz E z . (1.105–1.106)
The residual stresses that are calculated using equation (1.106), represent the stresses due to cyclic loading of the concrete, which remain elastic in this method.
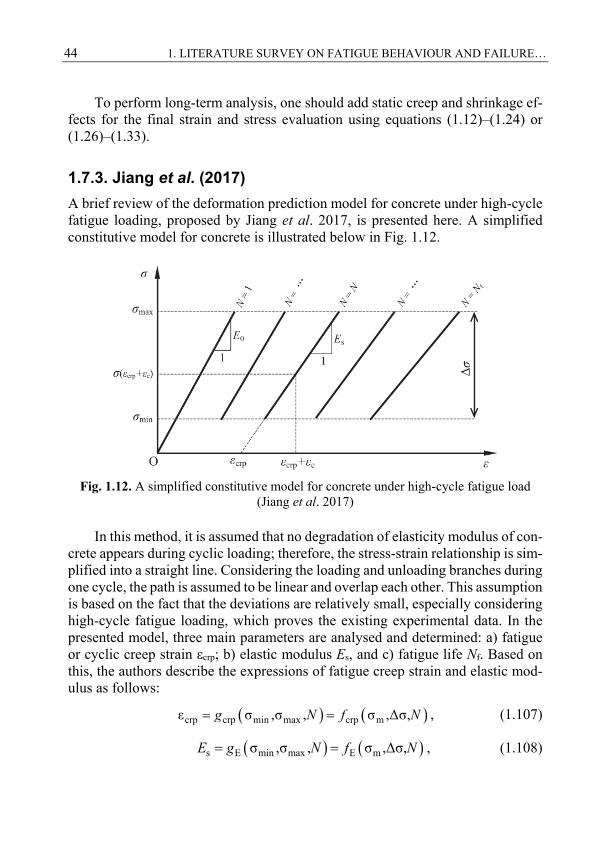
44 1. LITERATURE SURVEY ON FATIGUE BEHAVIOUR AND FAILURE…
To perform long-term analysis, one should add static creep and shrinkage ef-fects for the final strain and stress evaluation using equations (1.12)–(1.24) or (1.26)–(1.33).
1.7.3. Jiang et al. (2017)
A brief review of the deformation prediction model for concrete under high-cycle fatigue loading, proposed by Jiang et al. 2017, is presented here. A simplified constitutive model for concrete is illustrated below in Fig. 1.12.
Fig. 1.12. A simplified constitutive model for concrete under high-cycle fatigue load
(Jiang et al. 2017)
In this method, it is assumed that no degradation of elasticity modulus of con-crete appears during cyclic loading; therefore, the stress-strain relationship is sim-plified into a straight line. Considering the loading and unloading branches during one cycle, the path is assumed to be linear and overlap each other. This assumption is based on the fact that the deviations are relatively small, especially considering high-cycle fatigue loading, which proves the existing experimental data. In the presented model, three main parameters are analysed and determined: a) fatigue or cyclic creep strain εcrp; b) elastic modulus Es, and c) fatigue life Nf. Based on this, the authors describe the expressions of fatigue creep strain and elastic mod-ulus as follows:
crp crp min max crp mε σ ,σ , σ ,Δσ,g N f N , (1.107)
s E min max E mσ ,σ , σ ,Δσ,E g N f N , (1.108)
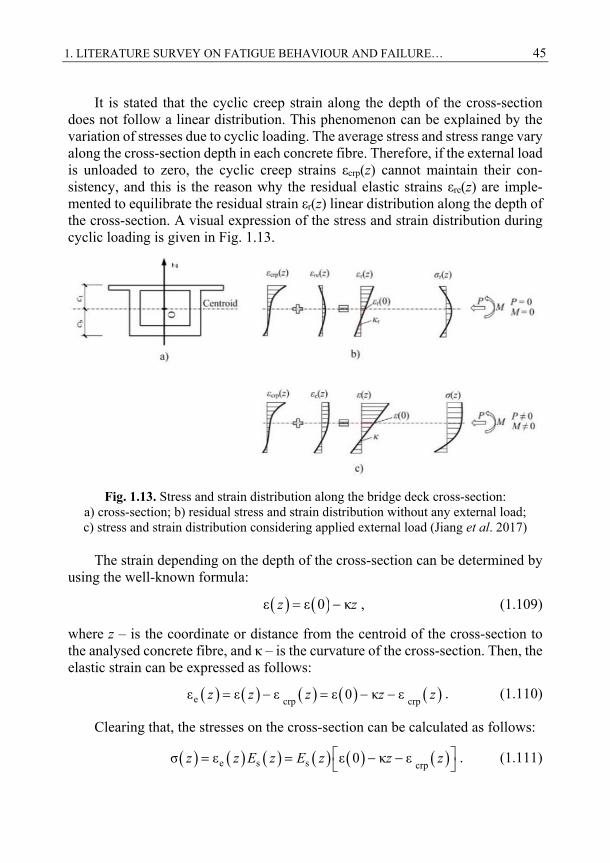
1. LITERATURE SURVEY ON FATIGUE BEHAVIOUR AND FAILURE… 45
It is stated that the cyclic creep strain along the depth of the cross-section does not follow a linear distribution. This phenomenon can be explained by the variation of stresses due to cyclic loading. The average stress and stress range vary along the cross-section depth in each concrete fibre. Therefore, if the external load is unloaded to zero, the cyclic creep strains εcrp(z) cannot maintain their con-sistency, and this is the reason why the residual elastic strains εre(z) are imple-mented to equilibrate the residual strain εr(z) linear distribution along the depth of the cross-section. A visual expression of the stress and strain distribution during cyclic loading is given in Fig. 1.13.
Fig. 1.13. Stress and strain distribution along the bridge deck cross-section:
a) cross-section; b) residual stress and strain distribution without any external load; c) stress and strain distribution considering applied external load (Jiang et al. 2017)
The strain depending on the depth of the cross-section can be determined by
using the well-known formula:
ε ε 0 κz z , (1.109)
where z – is the coordinate or distance from the centroid of the cross-section to the analysed concrete fibre, and κ – is the curvature of the cross-section. Then, the elastic strain can be expressed as follows:
e crp crpε ε ε ε 0 κ εz z z z z . (1.110)
Clearing that, the stresses on the cross-section can be calculated as follows:
e s s crpσ ε ε 0 κ εz z E z E z z z . (1.111)
46 1. LITERATURE SURVEY ON FATIGUE BEHAVIOUR AND FAILURE…
Of course, the equilibrium of the applied force and moment should be de-fined:
t t
b b
t t
b b
c cs crp-c -c
c cs crp-c -c
σ d ε 0 κ ε d
σ d ε 0 κ ε d
z b z z E z z z b z z P
z b z z z E z z z b z z z M
. (1.112)
Based on structural mechanics, equation (1.35) could be rewritten in matrix form:
11 12 1
21 22 2
ε 0
κ
K K F
K K F, (1.113)
t
b
c11 sc
d K E z b z z , t
b
c12 21 sc
d K K E z b z z z , (1.114–1.115)
t
b
c 222 sc
d K E z b z z z , t
b
c1 s crpc
ε d F E z b z z P , (1.116–1.117)
t
b
c2 s crpc
ε d F E z b z z z M . (1.118)
Finally, by solving equation (1.36), the strain at the centroid of cross-section and curvature can be expressed as:
111 12 1
21 22 2
ε 0
κ
K K F
K K F. (1.119)
As stated earlier, in the presented model, the degradation of elastic modulus is neglected (Es ≡ E0), so equation (1.42) can be expressed as follows:
t
b
t
b
c
crp-c0
c
crp-c0
1ε 0 ε d
1κ ε d
Fz b z z
A E A
Mz b z z z
I E I
. (1.120)
The authors proposed that due to stress and strain redistribution during cyclic loading, this process equilibrates the internal forces along the depth of the cross-section. If the average stress and stress range are constants during one cycle, the cyclic creep strain and elastic modulus of concrete can be expressed as functions of average stress, stress range and loading cycles from equations (1.107) and (1.108). Using the average stress (σm(z))N and stress range (Δσ(z))N of the Nth cy-
1. LITERATURE SURVEY ON FATIGUE BEHAVIOUR AND FAILURE… 47
cle, the decrease in elastic modulus and increase in cyclic creep strain can be con-trolled by the above mentioned equations during the change in cycle from the Nth to Nth+1. However, if we take the Nth-1 cycle, the average stress and stress range are unknown and different from those of the Nth cycle. Therefore, it is proposed to enter the equivalent loading cycles as determined below:
* 1m m s
* 1m m crp
σ , Δσ ,
σ , Δσ ,
sE E N N N
crp crp N N N
N z f z z E z
N z f z z z. (1.121)
By substituting (1.121) equation into (1.107) and (1.108), the elastic modulus and cyclic creep strain can be obtained:
*s m m1
*crp m m1
σ , Δσ , 1
σ , Δσ , 1
sE EN N N
crp crpN NN
E z f z z N z
z f z z N z. (1.122)
The creep strain, including the cyclic creep of concrete, is determined using the equation presented in Table 1.4 – Jiang et al. 2017.
1.8. Conclusions of Chapter 1 and Formulation of the Objectives of the Thesis
1. When the structural design for the serviceability limit state of flexural members is limited in the elastic stage (no cracking appears), the deter-mination of stress-strain state and the evaluation of the deformations of the member can be performed with high quality and insignificant error. However, at present, this approach can be considered as uneconomical and unoptimized. At a certain level, it can be considered that using non-metallic (FRP) reinforcement can solve some of structural longevity prob-lems.
2. Most structures are affected by random loading. Hence, the fatigue caused by cyclic loading is an important limit state for large or medium span structures. Cyclic loading causes increase in strain of concrete due to creep phenomena. Creep of concrete can be divided in two constituents: static and cyclic creep. Various methods and models evaluating the creep of concrete under static loading exist, however, very few evaluating the strain increment due to cyclic loading (variation of stress) is available. Redistribution of stress due to cyclic loading can cause increased strain in
48 1. LITERATURE SURVEY ON FATIGUE BEHAVIOUR AND FAILURE…
concrete under tension, leading to premature cracking and reduced stiff-ness of PC or RC structures. The size of the stress redistribution is un-known when PC structures, reinforced with fibre reinforced polymer bars, are analysed.
3. Another important aspect when analysing PC structures, reinforced with FRP reinforcement, is the stiffness degradation of composite material (re-bar). While great amount of experiments can be found on such types of FRP as aramid, glass or carbon, the opposite situation is regarding BFRP reinforcement.
4. FRP design codes and recommendations, such as JSCE (1997), fib bulle-tin 40 (FIB), CSA-S806, and ACI 440.4R provide certain guidance for the design of structures, reinforced with aramid, glass and carbon fibre rein-forced polymer reinforcement, undergoing fatigue loading. No recom-mendations can be found for basalt fibre reinforced polymer reinforce-ment. Also, no recommendations for the serviceability analysis of flexural members undergoing cyclic (or dynamic) loading can be found in the pre-viously mentioned design codes and standards, except several methods, discussed in Section 1.7.
5. Because of the existence of engineering opinions, that cyclic creep of con-crete plays a certain role in the time-dependent deformations of RC and PC flexural members due to cyclic loading, the need of a more detailed analysis of this issue should be performed.
With regard to the literature survey that was performed, the following tasks are addressed in this doctoral thesis:
1. Development of an analytical method for determining the deflection of BFRP prestressed concrete beams based on structural dynamics, by uti-lizing a simplified model for the effect of cyclic creep of concrete on the stress-strain state.
2. An experimental investigation on fatigue life and change in mechanical properties of BFRP reinforcement specimens considering different cyclic load ranges.
3. An experimental investigation on the deflection of real scale flexural PC beams with different levels of prestressing under different ranges of cyclic loading.
4. Proposals for modification of existing serviceability limit state analysis methods of prestressed concrete beams under cyclic loading.
5. A comparative analysis of the developed analytical method with various available methods and the obtained experimental results.

1. LITERATURE SURVEY ON FATIGUE BEHAVIOUR AND FAILURE… 49
Considering the complexity and duration of the planned experimental re-search, it was decided to not included any numerical simulation analysis using finite element method (FEM) in this study.

51
2 Deformation Analysis of Concrete
Beams Prestressed with Fibre Reinforced Polymer Bars
This chapter summarizes the investigation performed on the time-dependent ma-terial properties of concrete such as cyclic creep. The influence of cyclic loading on the changes in the flexural stiffness of real scale structural members are eval-uated from a structural dynamics point of view. An alternative method for deter-mining the deflection of concrete beams prestressed with BFRP bars is proposed by approximating the real behaviour of the structural element into the dynamic single-degree-of-freedom system, with a certain generalization of the mass and flexural stiffness. The changes in the properties of the materials used (concrete and FRP) are assessed throughout the cyclic load application period. The im-portance of beam displacement (deflection) shape form is also explained. The pro-posal based on the average curvature of the cross-section accounting for cracked and uncracked zones of the beam and tension stiffening effect is also presented. This chapter includes the material presented in journal publications by Atutis et al. (2015), Atutis et al. (2018b), Atutis et al. (2018c), and Atutis et al. (2019).
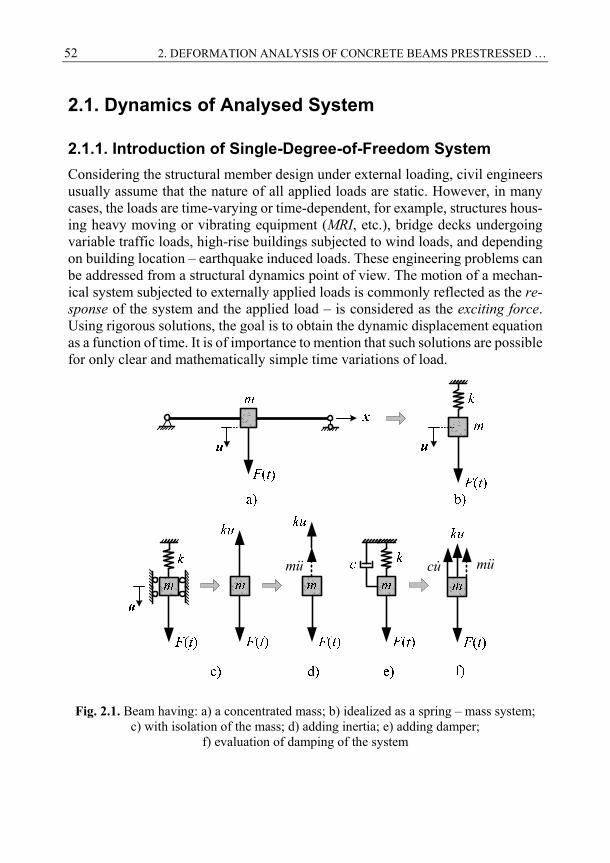
52 2. DEFORMATION ANALYSIS OF CONCRETE BEAMS PRESTRESSED …
2.1. Dynamics of Analysed System
2.1.1. Introduction of Single-Degree-of-Freedom System
Considering the structural member design under external loading, civil engineers usually assume that the nature of all applied loads are static. However, in many cases, the loads are time-varying or time-dependent, for example, structures hous-ing heavy moving or vibrating equipment (MRI, etc.), bridge decks undergoing variable traffic loads, high-rise buildings subjected to wind loads, and depending on building location – earthquake induced loads. These engineering problems can be addressed from a structural dynamics point of view. The motion of a mechan-ical system subjected to externally applied loads is commonly reflected as the re-sponse of the system and the applied load – is considered as the exciting force. Using rigorous solutions, the goal is to obtain the dynamic displacement equation as a function of time. It is of importance to mention that such solutions are possible for only clear and mathematically simple time variations of load.
mu mucu
Fig. 2.1. Beam having: a) a concentrated mass; b) idealized as a spring – mass system;
c) with isolation of the mass; d) adding inertia; e) adding damper; f) evaluation of damping of the system
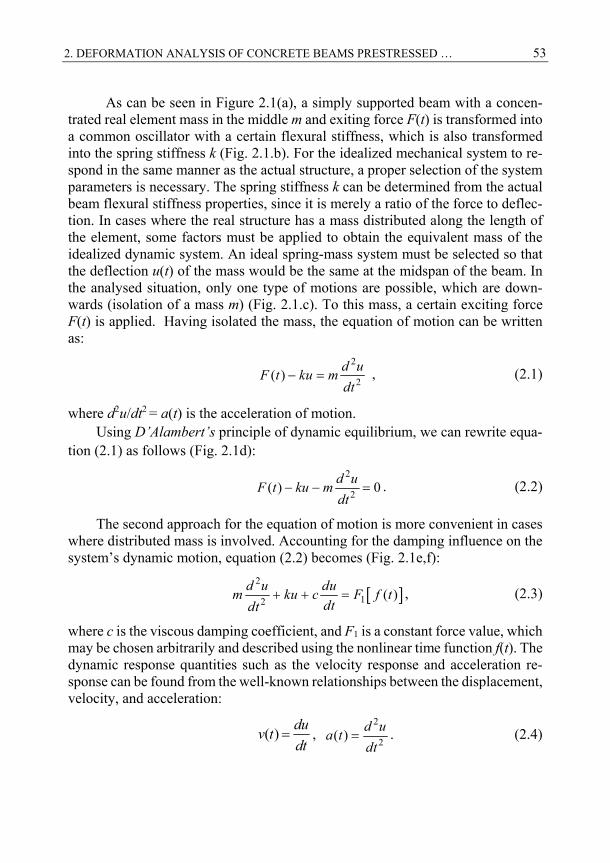
2. DEFORMATION ANALYSIS OF CONCRETE BEAMS PRESTRESSED … 53
As can be seen in Figure 2.1(a), a simply supported beam with a concen-trated real element mass in the middle m and exiting force F(t) is transformed into a common oscillator with a certain flexural stiffness, which is also transformed into the spring stiffness k (Fig. 2.1.b). For the idealized mechanical system to re-spond in the same manner as the actual structure, a proper selection of the system parameters is necessary. The spring stiffness k can be determined from the actual beam flexural stiffness properties, since it is merely a ratio of the force to deflec-tion. In cases where the real structure has a mass distributed along the length of the element, some factors must be applied to obtain the equivalent mass of the idealized dynamic system. An ideal spring-mass system must be selected so that the deflection u(t) of the mass would be the same at the midspan of the beam. In the analysed situation, only one type of motions are possible, which are down-wards (isolation of a mass m) (Fig. 2.1.c). To this mass, a certain exciting force F(t) is applied. Having isolated the mass, the equation of motion can be written as:
2
2( )
d uF t ku m
dt , (2.1)
where d2u/dt2 = a(t) is the acceleration of motion. Using D’Alambert’s principle of dynamic equilibrium, we can rewrite equa-
tion (2.1) as follows (Fig. 2.1d):
2
2( ) 0
d uF t ku m
dt. (2.2)
The second approach for the equation of motion is more convenient in cases where distributed mass is involved. Accounting for the damping influence on the system’s dynamic motion, equation (2.2) becomes (Fig. 2.1e,f):
2
12( )
d u dum ku c F f t
dtdt, (2.3)
where c is the viscous damping coefficient, and F1 is a constant force value, which may be chosen arbitrarily and described using the nonlinear time function f(t). The dynamic response quantities such as the velocity response and acceleration re-sponse can be found from the well-known relationships between the displacement, velocity, and acceleration:
( ) du
v tdt
, 2
2( )
d ua t
dt. (2.4)
54 2. DEFORMATION ANALYSIS OF CONCRETE BEAMS PRESTRESSED …
For a free vibration situation F1 = 0 without any damping, the solution for the equation of motion would be expressed by the following equation:
1 2sin cos k k
u C t C tm m
, (2.5)
where ωn = /k m is the natural circular frequency.
1 2sin cos n nu C t C t . (2.6)
Using the initial conditions and by introducing the initial velocity v(0) and initial displacement u(0), equation (2.6) can be described as follows:
(0)sin (0) cos
n n
n
vu t u t . (2.7)
For the final solution of equation (2.3), the only unknown now is the forcing function. Therefore, the concept of impulse is introduced, which can be defined as the area under the load-time curve (Fig. 2.2). A general solution based on the approach of superposition of impulses is provided below.
Fig. 2.2. Forcing function in an undamped system
If we assume that the SDOF system is at rest at first and then an excitation force is applied for an extremely short period of time td, the mass of the SDOF system will undergo instantaneous acceleration d2u/dt2, which can also be ex-pressed as an instantaneous velocity du/dt. Considering that, the excitation force acts for a period of time that is smaller than 1/10 of the ωn, than the error in the following equation can be neglected (Biggs, 1964):
2
2 d d
du d u F it t
dt m mdt, (2.8)
2. DEFORMATION ANALYSIS OF CONCRETE BEAMS PRESTRESSED … 55
where i is the applied impulse equal to the time duration of the applied force td. From a structural dynamics perspective, all the exciting forces can be considered as a sequence of short impulses. From time τ till time increment equal to dτ, an increase in the velocity is produced F1f(τ)dτ / m. Moreover, the SDOF system ex-periences an incremental response:
1
nn
sin
F f d
tm
du . (2.9)
Regarding equation (2.9), the total displacement of the system can be de-scribed as the sum of impulses during the period between t = 0 and t:
t
1n
0 n
sin
F f
u t dm
t . (2.10)
Now, the static deflection caused by F1 can be represented as follows:
1 1st 2
n
F Fu
k m. (2.11)
Finally, the general expression for the displacement of the system can be arranged in the form of Duhamel’s integral:
t
n n st n n0n
(0)(0)cos sin sin
vu u t t u f t d . (2.12)
For an undamped mechanical system, as shown in Figure 2.1b, which is subjected to a periodic function, the equation of motion will be presented as fol-lows:
2
12cos
d um ku F t
dt. (2.13)
Based on the classical solution that the linear differential equation of mo-tion consists of the sum of the complementary solution uc(t) and the particular solution up(t), we can write
c p u t u t u t , (2.14)
where the complementary solution is the solution based on the free, undamped vibration case. The particular solution is obtained using undetermined coefficients for a given function and takes the following form:
c n ncos sin u t A t B t . (2.15)
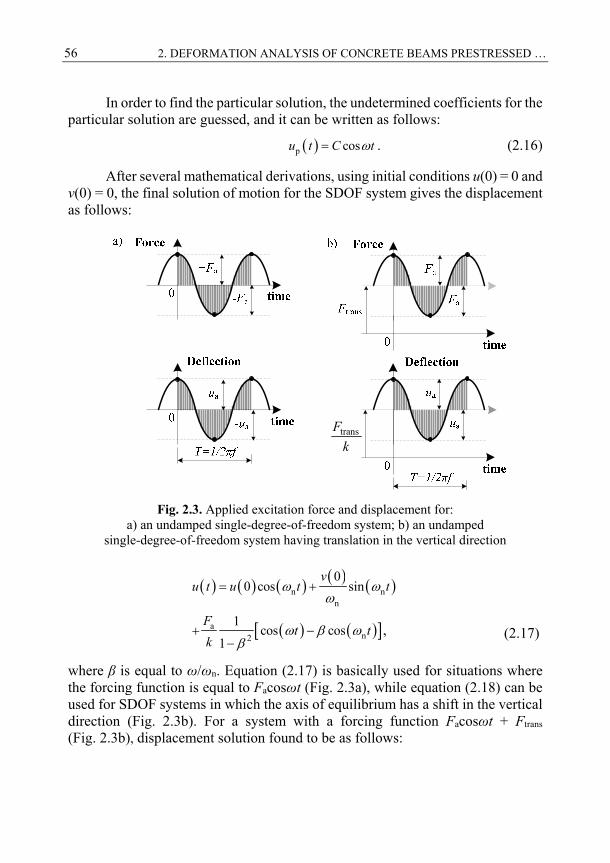
56 2. DEFORMATION ANALYSIS OF CONCRETE BEAMS PRESTRESSED …
In order to find the particular solution, the undetermined coefficients for the particular solution are guessed, and it can be written as follows:
p cosu t C t . (2.16)
After several mathematical derivations, using initial conditions u(0) = 0 and v(0) = 0, the final solution of motion for the SDOF system gives the displacement as follows:
transF
k
Fig. 2.3. Applied excitation force and displacement for:
a) an undamped single-degree-of-freedom system; b) an undamped single-degree-of-freedom system having translation in the vertical direction
n nn
an2
00 cos sin
1cos cos
1,
vu t u t t
Ft t
k
(2.17)
where β is equal to ω/ωn. Equation (2.17) is basically used for situations where the forcing function is equal to Facosωt (Fig. 2.3a), while equation (2.18) can be used for SDOF systems in which the axis of equilibrium has a shift in the vertical direction (Fig. 2.3b). For a system with a forcing function Facosωt + Ftrans (Fig. 2.3b), displacement solution found to be as follows:
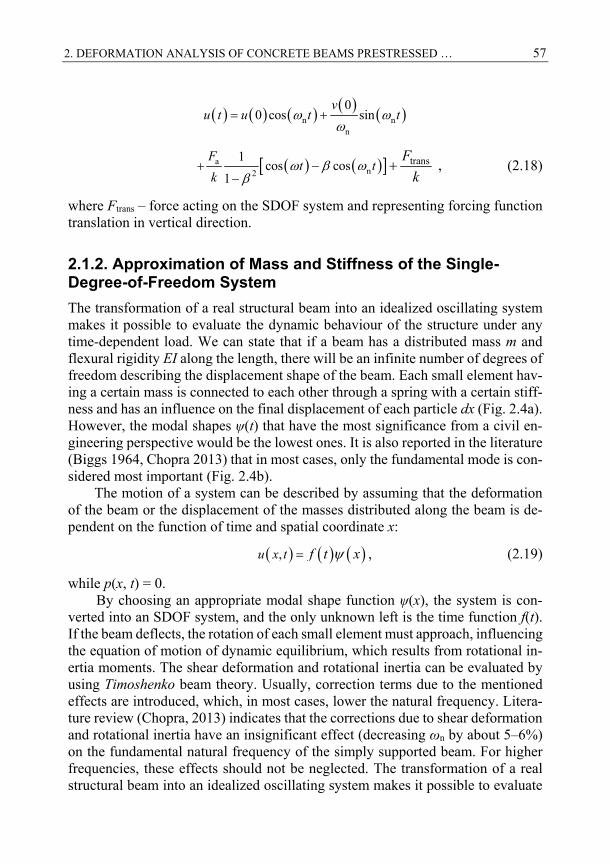
2. DEFORMATION ANALYSIS OF CONCRETE BEAMS PRESTRESSED … 57
n nn
00 cos sin
vu t u t t
an2
trans1cos cos
1 ,
Ft t
k
F
k
(2.18)
where Ftrans – force acting on the SDOF system and representing forcing function translation in vertical direction.
2.1.2. Approximation of Mass and Stiffness of the Single- Degree-of-Freedom System
The transformation of a real structural beam into an idealized oscillating system makes it possible to evaluate the dynamic behaviour of the structure under any time-dependent load. We can state that if a beam has a distributed mass m and flexural rigidity EI along the length, there will be an infinite number of degrees of freedom describing the displacement shape of the beam. Each small element hav-ing a certain mass is connected to each other through a spring with a certain stiff-ness and has an influence on the final displacement of each particle dx (Fig. 2.4a). However, the modal shapes ψ(t) that have the most significance from a civil en-gineering perspective would be the lowest ones. It is also reported in the literature (Biggs 1964, Chopra 2013) that in most cases, only the fundamental mode is con-sidered most important (Fig. 2.4b).
The motion of a system can be described by assuming that the deformation of the beam or the displacement of the masses distributed along the beam is de-pendent on the function of time and spatial coordinate x:
, u x t f t x , (2.19)
while p(x, t) = 0. By choosing an appropriate modal shape function ψ(x), the system is con-
verted into an SDOF system, and the only unknown left is the time function f(t). If the beam deflects, the rotation of each small element must approach, influencing the equation of motion of dynamic equilibrium, which results from rotational in-ertia moments. The shear deformation and rotational inertia can be evaluated by using Timoshenko beam theory. Usually, correction terms due to the mentioned effects are introduced, which, in most cases, lower the natural frequency. Litera-ture review (Chopra, 2013) indicates that the corrections due to shear deformation and rotational inertia have an insignificant effect (decreasing ωn by about 5–6%) on the fundamental natural frequency of the simply supported beam. For higher frequencies, these effects should not be neglected. The transformation of a real structural beam into an idealized oscillating system makes it possible to evaluate
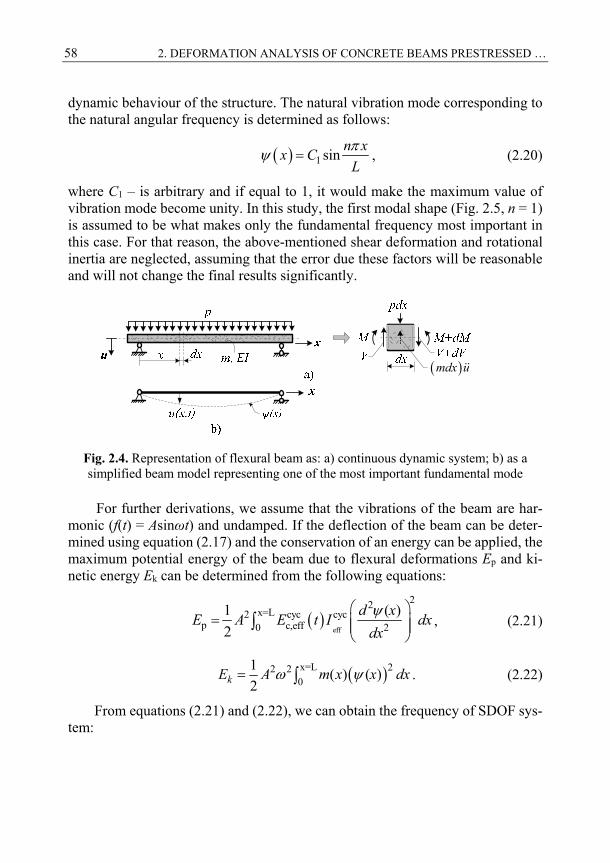
58 2. DEFORMATION ANALYSIS OF CONCRETE BEAMS PRESTRESSED …
dynamic behaviour of the structure. The natural vibration mode corresponding to the natural angular frequency is determined as follows:
1 sin
n xx C
L, (2.20)
where C1 – is arbitrary and if equal to 1, it would make the maximum value of vibration mode become unity. In this study, the first modal shape (Fig. 2.5, n = 1) is assumed to be what makes only the fundamental frequency most important in this case. For that reason, the above-mentioned shear deformation and rotational inertia are neglected, assuming that the error due these factors will be reasonable and will not change the final results significantly.
mdx u
Fig. 2.4. Representation of flexural beam as: a) continuous dynamic system; b) as a simplified beam model representing one of the most important fundamental mode
For further derivations, we assume that the vibrations of the beam are har-monic (f(t) = Asinωt) and undamped. If the deflection of the beam can be deter-mined using equation (2.17) and the conservation of an energy can be applied, the maximum potential energy of the beam due to flexural deformations Ep and ki-netic energy Ek can be determined from the following equations:
eff
22x=L cyc cyc2
p c,eff 20
1 ( )
2
d xE A E t I dx
dx
, (2.21)
x=L 22 20
1( ) ( )
2kE A m x x dx . (2.22)
From equations (2.21) and (2.22), we can obtain the frequency of SDOF sys-tem:
2. DEFORMATION ANALYSIS OF CONCRETE BEAMS PRESTRESSED … 59
eff
22x=L x=L 2cyc cyc2
n c,eff 20 0
( )ω (x) ( )
d xE t I dx m x dx
dx
, (2.23)
where cycc,effE t and cyc
effI – are the effective modulus of elasticity of concrete and
the second moment of the area of the cross-section at a certain loading cycle, re-spectively (see Eqs. 2.28 and 2.35). It should be noted that the numerator of equa-tion (2.23) is identical to the generalized stiffness ke of the SDOF system:
2 cyc cyc42x=L c,eff effcyc cyc
e c,eff eff 2 30
( )
2
E t I td xk E t I t dx
dx L
, (2.24)
The denominator can be described as the generalized mass me of the system:
2
x=L 2e 0
( )= ( ) ( )
2
m x
m m x x dxL
, (2.25)
where m(x) – is the mass of the beam per unit length.
-1.1
-0.6
0.0
0.6
1.1
0.0 0.2 0.4 0.6 0.8 1.0 1.2 1.4 1.6 1.8 2.0 2.2 2.4 2.6
Fig. 2.5. Some of the main modal shapes of simply supported beam (n=1–4)
The effective second moment of the area of the beam cross-section can be derived using equations (1.92) and (1.94). By substituting the equation (1.94) into equation (1.92) the following expression can be obtained:
2 2
cr crcr 0
a a
κ 1 κ κ
M Mt t t
M t M t. (2.26)
The effective, uncracked and cracked cross-sectional curvatures can be deter-mined using the well-known expressions, involving the effective modulus of elas-ticity of concrete at a certain load cycle:
60 2. DEFORMATION ANALYSIS OF CONCRETE BEAMS PRESTRESSED …
a a acr 0cyc cyc cyc cyc
cr 0eff eff eff eff
; ; M t M t M t
t t tE t I E t I E t I
. (2.27)
Equation (2.26) together with (2.27) can be expressed in an alternative form:
cyc cr0eff 2
cr cr
0 a
1 1
II I
I M
I M t
, (2.28)
where I0 = bh3/12; Icr = bx3 / 12 + bx3 / 4 + αeAs1ds12 + (αe – 1) As2ds2
2 + αpApdp2; b
and h – are the width and height of the beam cross-section, respectively; x – is the depth of the neutral axis; As1 and As2 – are the cross-sectional area of the top and bottom steel reinforcements of the beam, respectively; Ap – is the cross-sectional area of the prestressed FRP reinforcement; ds1, ds2, and dp – are the distances from the top, bottom, and prestressing reinforcement centre of the cross section to the reference axis, respectively; αe – is the ratio between modulus of elasticity of steel reinforcement and concrete; αp – is the ratio between the modulus of elasticity of the prestressing FRP reinforcement and concrete.
It is important to mention that for the determination of the cross-sectional properties, an updated modulus of elasticity of FRP bars Ebfrp(t) should be used, in order to evaluate the damages in the bar because of the friction fretting effect in the crack opening between the bar and the surrounding concrete (see Section 1.3 and 3.3.3).
2.2. Accounting for the Cyclic Creep of Concrete
In the presence of cyclic creep, the concrete strain can be determined considering the cyclic creep compliance ΔJN and can be expressed by the following formula (Whaley and Neville 1973, Bažant and Hubler 2014, Jiang et al. 2017):
1
2N 0
c
ΔσΔ =
bbJ b N
f. (2.29)
Cyclic creep compliance can be considered as a creep compliance increment caused by stress cycling. In this regard, the total creep compliance can be divided into two components:
tot 0 N= , ΔJ t J t t J . (2.30)
The static creep function is provided in Chapter 1, equation (1.11).
2. DEFORMATION ANALYSIS OF CONCRETE BEAMS PRESTRESSED … 61
Taking a more general form, the static creep could be defined as follows (Jiang et al. 2017):
10 0, aJ t t a t , (2.32)
where a0, and a1 – are the fitting or calibrating parameters. Finally, the cyclic creep strain, taking into account the creep from the sus-
tained load, can be derived in the following form:
1
2cyccr m tot m 0 N m 0 m 0
c
Δσε σ σ , Δ σ , σ
bbt J t J t t J J t t b N
f. (2.33)
This can be written in a more general form as follows:
1
1 2cyc cyccr cr cr 0 m 0 m
c
Δσε ε ε σ σ
ba bt t t a t b N
f. (2.34)
The following expression can be used to determine the effective modulus of elasticity of concrete at a certain load cycle:
1 2
cyc m mc,eff cyc
c,effel cr cr m 0 m c
σ σ
ε ε +Δε σ / σ Δσ/b b
E tt t t E t b f N
. (2.35)
Due to the lack of research and investigation results on cyclic creep of uniax-ially loaded concrete and the complexity of experimental work that must be per-formed to obtain useful data, fitting parameters b0, b1 and b2 are adopted from model presented by Jiang et al. (2017) for cyclic creep compliance function de-termination.
2.3. Calculation Procedure
The proposed method, which considers the input data and the actual loading stage (Fig. 2.6) in which the deflection of the PC beam under cyclic loading is being determined, is summarized in the flowchart below (Fig. 2.7). Certain time instants are introduced: t = 0 is the start of shrinkage measurement; tp is the time when the prestressing force in FRP reinforcement is transferred to the concrete cross-sec-tion; t0 is the time of the first loading cycle of the beam, which is applied statically; the cyclic loading starts at time td, and tlim is the prestressed beam failure due to cyclic loading.
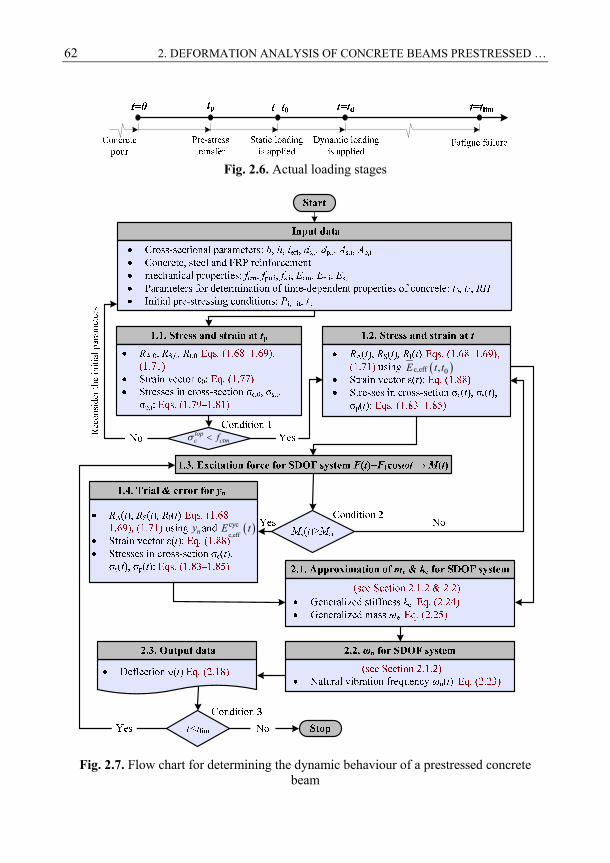
62 2. DEFORMATION ANALYSIS OF CONCRETE BEAMS PRESTRESSED …
Fig. 2.6. Actual loading stages
c,eff 0,E t t
ny c,eff
cycE t
topc ctmf
Fig. 2.7. Flow chart for determining the dynamic behaviour of a prestressed concrete
beam
2. DEFORMATION ANALYSIS OF CONCRETE BEAMS PRESTRESSED … 63
With regard to the validity of proposed method during all stages of the design process, certain assumptions are made: 1) the distribution of strain maintains a linear shape over the depth of the uncracked and cracked cross-sections; 2) a per-fect bond between FRP prestressing reinforcement and surrounding concrete is assumed; 3) an average stress and average strain concept is adopted throughout all stages of cyclic loading; 4) linear-elastic properties of the concrete and pre-stressing FRP bars are assumed; 5) by using the Duhamel‘s integral, it is assumed that the SDOF system is conservative, and superposition principle is applied; 6) the SDOF system is considered linear during the analysed loading cycle, and with the increase in the number of loading cycles, the decrease in generalized stiffness ke of the system is evaluated; 7) the modal superposition technique is used for the performance of dynamic response analysis.
To ease the calculation process for the proposed method, the calculation al-gorithm was implemented in computer program MATHCAD.
The solution for the dynamic problem and the proposed technique focus only on simply supported prestressed concrete beams, reinforced with non-metallic (FRP) reinforcement loaded with two concentrated simultaneously acting cyclic forces within the midspan range and described with a simple mathematical func-tion (sine or cosine). For other situations, the reliability of the proposed method and the validation of the obtained results should be confirmed through additional experimental tests.
Moreover, relaxation of FRP reinforcement (in this study – BFRP) was de-termined by additional experimental program, presented in the article by Atutis et al. (2018c). Determined relaxation coefficient is implemented into equation (1.87) (see Chapter 1).
2.4. Simplified Curvature Determination Technique
The determination of PC beam deflection is of highest priority in situations where cracking appears in the tension zone and flexural stiffness decreases instantly. Many deflection prediction methods or design codes and recommendations (such as ACI 440.4R-04, etc.) are based on Branson‘s equation, which was derived for flexural members under monotonic loading. Very few models can be found for cyclic loading situations. One of the deflection calculation methods (derived by Balaguru (1981)) is presented in the Chapter 1. Equation (1.97) allows us to eval-uate the effective moment of inertia by updating the cycle dependent parameters such as modulus of rupture of concrete, cracking moment, neutral axis position, apparent cyclic modulus of concrete, and degradation of BFRP reinforcement elasticity modulus (Atutis et al. 2019). However, it is observed that Branson’s equation tends to overestimate flexural stiffness (especially for PC beams) even
64 2. DEFORMATION ANALYSIS OF CONCRETE BEAMS PRESTRESSED …
for monotonic loading situations (Atutis et al. 2015). Hence, when cyclic load is involved, an overestimation in EI brings a certain error at the start of the calcula-tion procedure.
Therefore, using equations (1.92) and (1.94), which were originally provided in Eurocode 2, we can derive the effective moment of inertia of the beam for cyclic load applications. By substituting equation (1.94) into equation (1.92), the following expression of average curvature (depending on loading cycle N) can be obtained:
2 2
cr crcr 0
a a
κ 1 κ κ
M N M NN N N
M M. (2.36)
The effective, cracked, and uncracked cross-sectional curvature can be deter-mined by using equation (2.27):
a
c eff
M
NE N I N
, (2.37)
a
crc
cr
MN
E N I N, (2.38)
a
0c 0
M
NE N I
. (2.39)
Finally, for Ieff(N), expression (1.97) can be replaced by equation (2.40):
cr
eff 02cr cr
0 a
1 1
I NI N I
I N M N
I M
. (2.40)
Regarding the FRP reinforcement, the differences in the effective moment of
inertia determination, compared to conventional steel, are basically applied through the cross-sectional properties of the flexural member by involving the FRP reinforcement mechanical properties Efrp.
2. DEFORMATION ANALYSIS OF CONCRETE BEAMS PRESTRESSED … 65
2.5. Conclusions of Chapter 2
This chapter presented the investigation results of deflection response calculation with regard to structural dynamics. In addition, the time-dependent material prop-erties of concrete, such as cyclic creep of concrete, are being involved in the pro-posed calculation procedure. Based on the derivations and assumptions made for the final approach of the model, the following conclusions can be drawn:
1. PC beams undergoing cyclic loading are approximated to the oscillating SDOF system by assuming that the excitation force acting on the body is equal to the product of the mass and acceleration of the system. The sys-tem is in equilibrium if D’Alamberts principle is applied. Therefore, it is considered that the applied excitation force is equal to the sequence of the short impulses and the displacement (deflection) response of the system is arranged in the form of Duhamel’s integral.
2. In order to transform the real structural member to the oscillating SDOF system, a certain level of approximation must be made for the mass and stiffness of the system. For a flexural member the mass and stiffness are distributed along the length of the member. The motion of the SDOF sys-tem can be described considering that the displacement of the masses along the beam is dependent on the spatial coordinate and time. By as-suming an appropriate modal shape function, the beam is approximated to the dynamic system. In the same manner, by applying the principle of conservation of energy of the system, approximation to the flexural stiff-ness is also done. Due to these assumptions the natural modal frequency for the approximated SDOF system, considering the so-called generalized mass me and generalized stiffness ke, can be determined.
3. The time-dependant concrete properties such as creep should be evaluated for the dynamic problems. The redistribution of stress and strain in the cross-section due to creep effects can lead to higher stresses in the tension zone of the cross-section and eventually result in a lower stiffness value, especially when FRP with considerably lower, comparing to steel, elas-ticity modulus Efrp (compared to steel) is used. This can be a major factor for the increase in cracking and deflection of the member. The increase in creep of concrete due to cyclic loading should be formed as an addition to the static creep of concrete, as either a deformation Δεcr or an acceler-ation of static creep. Neglecting the cyclic creep phenomena for concrete beams, prestressed with FRP reinforcement can cause overestimation of the flexural stiffness of the member.
66 2. DEFORMATION ANALYSIS OF CONCRETE BEAMS PRESTRESSED …
4. The proposed method for deflection calculation of FRP prestressed con-crete members under dynamic load enables to analyse the changes in de-flection over the entire loading duration (selected load cycle and any part of it). After the pouring of concrete, prestress losses are determined with reference to the completed experimental investigation; the PC member stress-strain state in the cross-section at the preloading and first loading stages (static load) are determined. Regarding the stresses in the cross-section, the initial conditions for cyclic creep determination for the full cyclic loading stage can be determined. The step-by-step calculation pro-cedure for the proposed method was provided. This enables engineers to determine within a reasonable time and with sufficient accuracy, the cur-vature (or deflection) of concrete beam, prestressed with FRP reinforce-ment, undergoing cyclic loading, which can be described using a known mathematical function.
5. The proposed deflection calculation method is constructed based on the aforementioned assumptions. Nevertheless, the accuracy of the model shall be proved by extension of the complex experimental programme, including analysis of the material changes due to cyclic load not only in the concrete but in the FRP reinforcement itself.
67
3 Assessment of Theoretical and Experimental Research Results
This chapter presents an extensive experimental investigation of the fatigue life determination of BFRP bars and BFRP prestressed concrete beams. A total of six BFRP bar specimens were produced for the fatigue analysis and twelve concrete beams, prestressed with BFRP bars. Two additional BFRP bar specimens were produced for the analysis of the change in elasticity modulus during repetitive cyclic loading. The serviceability limit state (deflection) changes during the repet-itive or cyclic loading was also analysed. Another part of the tests was focused on the mechanical properties and the changes under cyclic loading.
The experimental program included real scale BFRP prestressed concrete beams, having a reinforcement ratio of 0.32 and prestressing levels of 40%, 45%, and 55%, and a tension-tension fatigue test specimen of BFRP bars with a varying loading frequency and load range. Experiments were also performed to determine the actual stress relaxation in the BFRP reinforcement after initial prestressing. This chapter includes the material presented in journal publications by Atutis et al. (2018a), and Atutis et al. (2019).
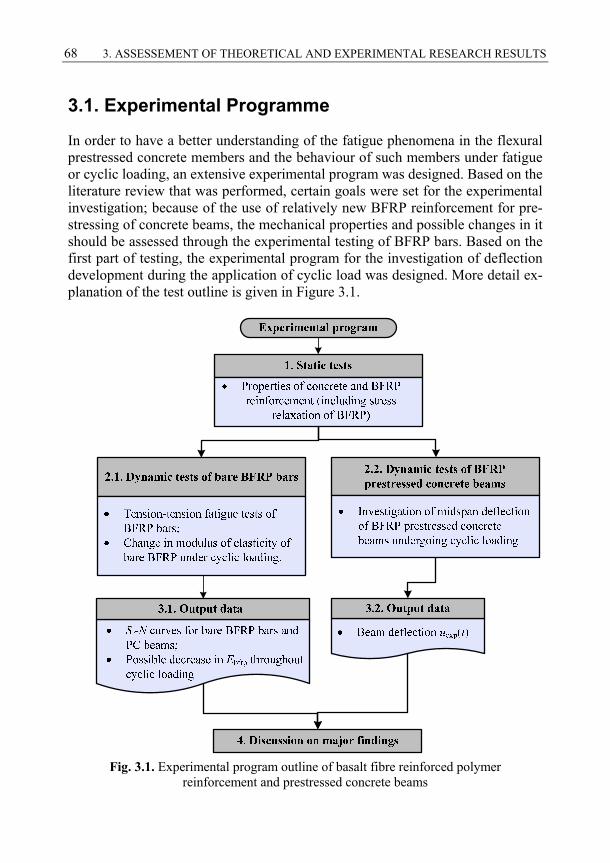
68 3. ASSESSEMENT OF THEORETICAL AND EXPERIMENTAL RESEARCH RESULTS
3.1. Experimental Programme
In order to have a better understanding of the fatigue phenomena in the flexural prestressed concrete members and the behaviour of such members under fatigue or cyclic loading, an extensive experimental program was designed. Based on the literature review that was performed, certain goals were set for the experimental investigation; because of the use of relatively new BFRP reinforcement for pre-stressing of concrete beams, the mechanical properties and possible changes in it should be assessed through the experimental testing of BFRP bars. Based on the first part of testing, the experimental program for the investigation of deflection development during the application of cyclic load was designed. More detail ex-planation of the test outline is given in Figure 3.1.
Fig. 3.1. Experimental program outline of basalt fibre reinforced polymer
reinforcement and prestressed concrete beams
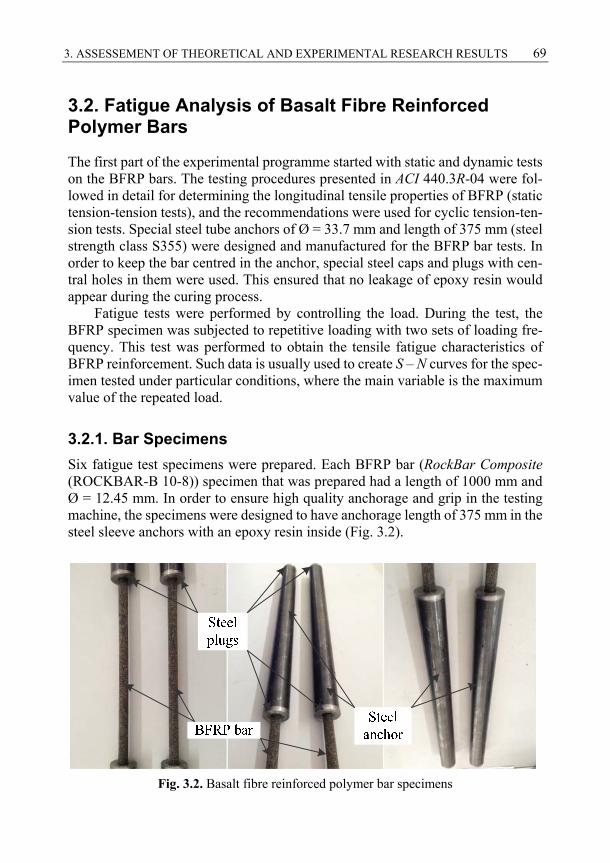
3. ASSESSEMENT OF THEORETICAL AND EXPERIMENTAL RESEARCH RESULTS 69
3.2. Fatigue Analysis of Basalt Fibre Reinforced Polymer Bars
The first part of the experimental programme started with static and dynamic tests on the BFRP bars. The testing procedures presented in ACI 440.3R-04 were fol-lowed in detail for determining the longitudinal tensile properties of BFRP (static tension-tension tests), and the recommendations were used for cyclic tension-ten-sion tests. Special steel tube anchors of Ø = 33.7 mm and length of 375 mm (steel strength class S355) were designed and manufactured for the BFRP bar tests. In order to keep the bar centred in the anchor, special steel caps and plugs with cen-tral holes in them were used. This ensured that no leakage of epoxy resin would appear during the curing process. Fatigue tests were performed by controlling the load. During the test, the BFRP specimen was subjected to repetitive loading with two sets of loading fre-quency. This test was performed to obtain the tensile fatigue characteristics of BFRP reinforcement. Such data is usually used to create S – N curves for the spec-imen tested under particular conditions, where the main variable is the maximum value of the repeated load.
3.2.1. Bar Specimens
Six fatigue test specimens were prepared. Each BFRP bar (RockBar Composite (ROCKBAR-B 10-8)) specimen that was prepared had a length of 1000 mm and Ø = 12.45 mm. In order to ensure high quality anchorage and grip in the testing machine, the specimens were designed to have anchorage length of 375 mm in the steel sleeve anchors with an epoxy resin inside (Fig. 3.2).
Fig. 3.2. Basalt fibre reinforced polymer bar specimens
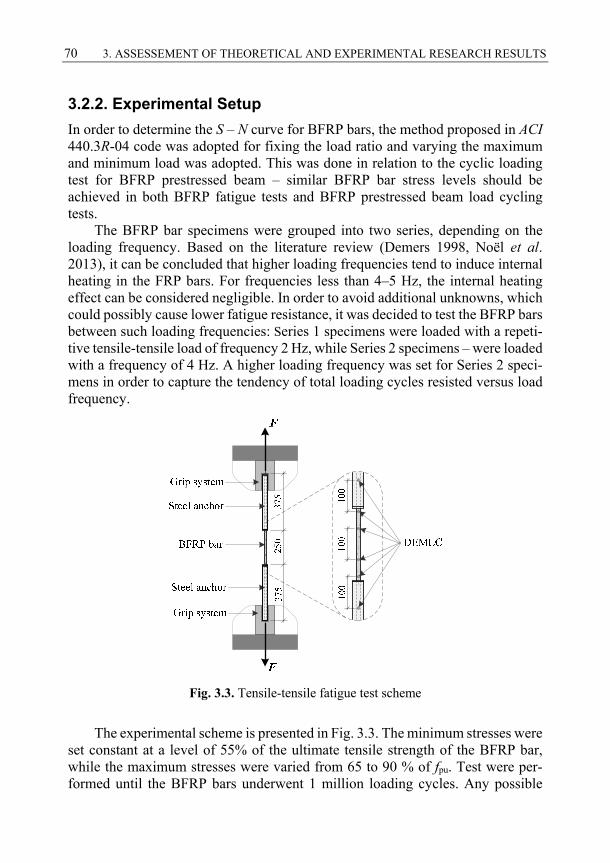
70 3. ASSESSEMENT OF THEORETICAL AND EXPERIMENTAL RESEARCH RESULTS
3.2.2. Experimental Setup
In order to determine the S – N curve for BFRP bars, the method proposed in ACI 440.3R-04 code was adopted for fixing the load ratio and varying the maximum and minimum load was adopted. This was done in relation to the cyclic loading test for BFRP prestressed beam – similar BFRP bar stress levels should be achieved in both BFRP fatigue tests and BFRP prestressed beam load cycling tests.
The BFRP bar specimens were grouped into two series, depending on the loading frequency. Based on the literature review (Demers 1998, Noël et al. 2013), it can be concluded that higher loading frequencies tend to induce internal heating in the FRP bars. For frequencies less than 4–5 Hz, the internal heating effect can be considered negligible. In order to avoid additional unknowns, which could possibly cause lower fatigue resistance, it was decided to test the BFRP bars between such loading frequencies: Series 1 specimens were loaded with a repeti-tive tensile-tensile load of frequency 2 Hz, while Series 2 specimens – were loaded with a frequency of 4 Hz. A higher loading frequency was set for Series 2 speci-mens in order to capture the tendency of total loading cycles resisted versus load frequency.
Fig. 3.3. Tensile-tensile fatigue test scheme
The experimental scheme is presented in Fig. 3.3. The minimum stresses were set constant at a level of 55% of the ultimate tensile strength of the BFRP bar, while the maximum stresses were varied from 65 to 90 % of fpu. Test were per-formed until the BFRP bars underwent 1 million loading cycles. Any possible
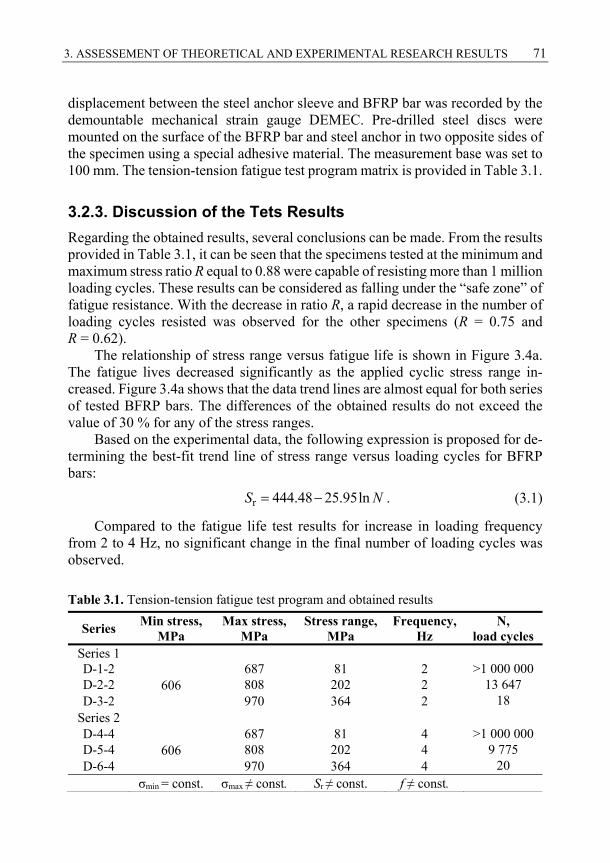
3. ASSESSEMENT OF THEORETICAL AND EXPERIMENTAL RESEARCH RESULTS 71
displacement between the steel anchor sleeve and BFRP bar was recorded by the demountable mechanical strain gauge DEMEC. Pre-drilled steel discs were mounted on the surface of the BFRP bar and steel anchor in two opposite sides of the specimen using a special adhesive material. The measurement base was set to 100 mm. The tension-tension fatigue test program matrix is provided in Table 3.1.
3.2.3. Discussion of the Tets Results
Regarding the obtained results, several conclusions can be made. From the results provided in Table 3.1, it can be seen that the specimens tested at the minimum and maximum stress ratio R equal to 0.88 were capable of resisting more than 1 million loading cycles. These results can be considered as falling under the “safe zone” of fatigue resistance. With the decrease in ratio R, a rapid decrease in the number of loading cycles resisted was observed for the other specimens (R = 0.75 and R = 0.62).
The relationship of stress range versus fatigue life is shown in Figure 3.4a. The fatigue lives decreased significantly as the applied cyclic stress range in-creased. Figure 3.4a shows that the data trend lines are almost equal for both series of tested BFRP bars. The differences of the obtained results do not exceed the value of 30 % for any of the stress ranges.
Based on the experimental data, the following expression is proposed for de-termining the best-fit trend line of stress range versus loading cycles for BFRP bars:
r 444.48 25.95lnS N . (3.1)
Compared to the fatigue life test results for increase in loading frequency from 2 to 4 Hz, no significant change in the final number of loading cycles was observed.
Table 3.1. Tension-tension fatigue test program and obtained results
Series Min stress,
MPa Max stress,
MPa
Stress range, MPa
Frequency, Hz
N, load cycles
Series 1 D-1-2
606 687 81 2 >1 000 000
D-2-2 808 202 2 13 647 D-3-2 970 364 2 18
Series 2 D-4-4
606 687 81 4 >1 000 000
D-5-4 808 202 4 9 775 D-6-4 970 364 4 20
σmin = const. σmax ≠ const. Sr ≠ const. f ≠ const.
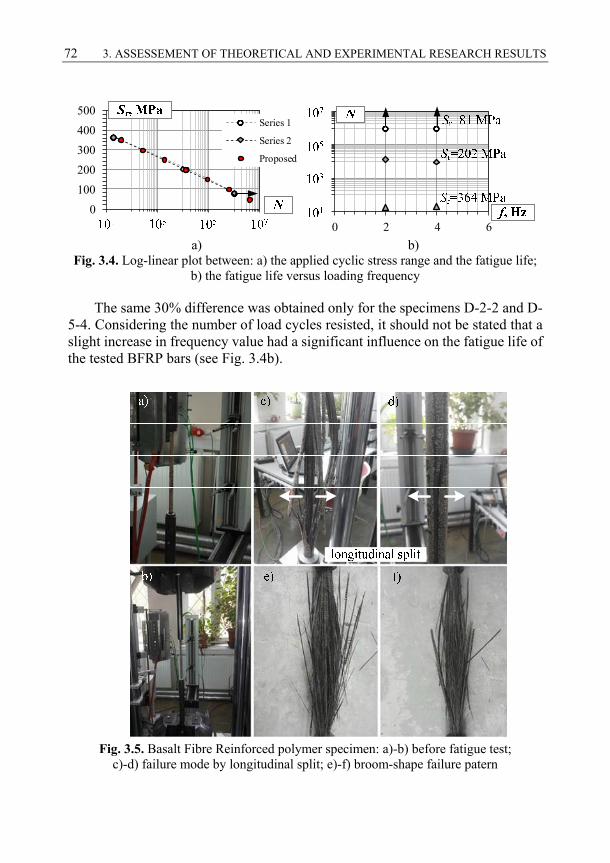
72 3. ASSESSEMENT OF THEORETICAL AND EXPERIMENTAL RESEARCH RESULTS
0
0
0
10
0 2 4 6
0
100
200
300
400
500
10^ 10^ 10^ 10^
Series 1
Series 2
Proposed
a) b)
Fig. 3.4. Log-linear plot between: a) the applied cyclic stress range and the fatigue life; b) the fatigue life versus loading frequency
The same 30% difference was obtained only for the specimens D-2-2 and D-5-4. Considering the number of load cycles resisted, it should not be stated that a slight increase in frequency value had a significant influence on the fatigue life of the tested BFRP bars (see Fig. 3.4b).
Fig. 3.5. Basalt Fibre Reinforced polymer specimen: a)-b) before fatigue test;
c)-d) failure mode by longitudinal split; e)-f) broom-shape failure patern
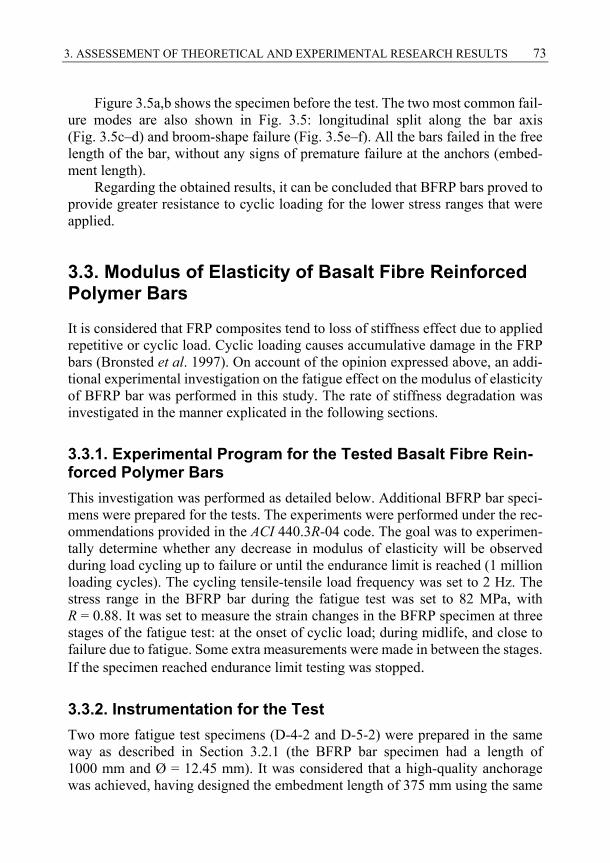
3. ASSESSEMENT OF THEORETICAL AND EXPERIMENTAL RESEARCH RESULTS 73
Figure 3.5a,b shows the specimen before the test. The two most common fail-ure modes are also shown in Fig. 3.5: longitudinal split along the bar axis (Fig. 3.5c–d) and broom-shape failure (Fig. 3.5e–f). All the bars failed in the free length of the bar, without any signs of premature failure at the anchors (embed-ment length).
Regarding the obtained results, it can be concluded that BFRP bars proved to provide greater resistance to cyclic loading for the lower stress ranges that were applied.
3.3. Modulus of Elasticity of Basalt Fibre Reinforced Polymer Bars
It is considered that FRP composites tend to loss of stiffness effect due to applied repetitive or cyclic load. Cyclic loading causes accumulative damage in the FRP bars (Bronsted et al. 1997). On account of the opinion expressed above, an addi-tional experimental investigation on the fatigue effect on the modulus of elasticity of BFRP bar was performed in this study. The rate of stiffness degradation was investigated in the manner explicated in the following sections.
3.3.1. Experimental Program for the Tested Basalt Fibre Rein-forced Polymer Bars
This investigation was performed as detailed below. Additional BFRP bar speci-mens were prepared for the tests. The experiments were performed under the rec-ommendations provided in the ACI 440.3R-04 code. The goal was to experimen-tally determine whether any decrease in modulus of elasticity will be observed during load cycling up to failure or until the endurance limit is reached (1 million loading cycles). The cycling tensile-tensile load frequency was set to 2 Hz. The stress range in the BFRP bar during the fatigue test was set to 82 MPa, with R = 0.88. It was set to measure the strain changes in the BFRP specimen at three stages of the fatigue test: at the onset of cyclic load; during midlife, and close to failure due to fatigue. Some extra measurements were made in between the stages. If the specimen reached endurance limit testing was stopped.
3.3.2. Instrumentation for the Test
Two more fatigue test specimens (D-4-2 and D-5-2) were prepared in the same way as described in Section 3.2.1 (the BFRP bar specimen had a length of 1000 mm and Ø = 12.45 mm). It was considered that a high-quality anchorage was achieved, having designed the embedment length of 375 mm using the same
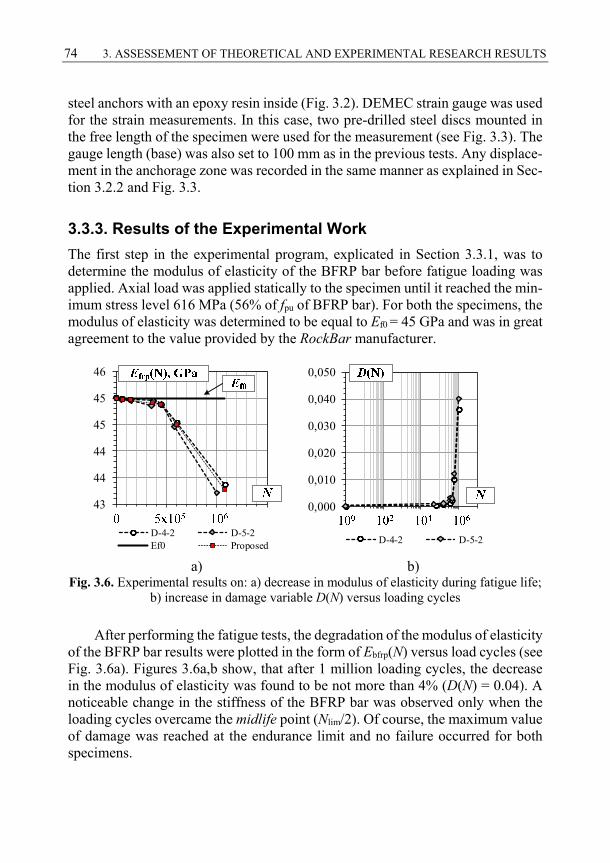
74 3. ASSESSEMENT OF THEORETICAL AND EXPERIMENTAL RESEARCH RESULTS
steel anchors with an epoxy resin inside (Fig. 3.2). DEMEC strain gauge was used for the strain measurements. In this case, two pre-drilled steel discs mounted in the free length of the specimen were used for the measurement (see Fig. 3.3). The gauge length (base) was also set to 100 mm as in the previous tests. Any displace-ment in the anchorage zone was recorded in the same manner as explained in Sec-tion 3.2.2 and Fig. 3.3.
3.3.3. Results of the Experimental Work
The first step in the experimental program, explicated in Section 3.3.1, was to determine the modulus of elasticity of the BFRP bar before fatigue loading was applied. Axial load was applied statically to the specimen until it reached the min-imum stress level 616 MPa (56% of fpu of BFRP bar). For both the specimens, the modulus of elasticity was determined to be equal to Ef0 = 45 GPa and was in great agreement to the value provided by the RockBar manufacturer.
43
44
44
45
45
46
10^ 10^ 10^ 10^D-4-2 D-5-2Ef0 Proposed
0,000
0,010
0,020
0,030
0,040
0,050
10^ 10^ 10^ 10^
D-4-2 D-5-2
a) b)
Fig. 3.6. Experimental results on: a) decrease in modulus of elasticity during fatigue life; b) increase in damage variable D(N) versus loading cycles
After performing the fatigue tests, the degradation of the modulus of elasticity of the BFRP bar results were plotted in the form of Ebfrp(N) versus load cycles (see Fig. 3.6a). Figures 3.6a,b show, that after 1 million loading cycles, the decrease in the modulus of elasticity was found to be not more than 4% (D(N) = 0.04). A noticeable change in the stiffness of the BFRP bar was observed only when the loading cycles overcame the midlife point (Nlim/2). Of course, the maximum value of damage was reached at the endurance limit and no failure occurred for both specimens.
3. ASSESSEMENT OF THEORETICAL AND EXPERIMENTAL RESEARCH RESULTS 75
Based on the damage variable D(N) reviewed in Chapter 1.3, as well as the experimental results, a best fitting Power law function is proposed for evaluating the stiffness degradation of BFRP bars:
8.15610 r
bfrp f0f0
σ( ) 1 6 10E N E N
E
, (3.2)
where σr is the applied stress range. Equation (3.2) can be rewritten for situations in which time domain is the main variable used in the calculations and the applied load frequency fp is known (fp is equal to 1 Hz in this case):
8.15610 r
bfrp f0 pf0
σ( ) 1 6 10E t E f t
E
. (3.3)
3.4. Serviceability of Concrete Beams Prestressed with Basalt Fibre Reinforced Polymer Bars
The second part of the experimental programme was designed to check the accu-racy of the proposed deflection calculation method presented in Chapter 2. Most of the available methods were derived for PC flexural members reinforced with conventional steel, which has a much higher modulus of elasticity (Young’s mod-ulus) compared to FRP (for BFRP, the difference is more than 4 times). The dif-ference between the elasticity modulus of the BFRP reinforcement and the higher strength concrete class is almost negligible: for BFRP, it is equal to Ebfrp ≈ 45 GPa and for C50/60 and C60/75 concrete strength classes, it is Ecm ≈ 37–39 GPa. Under these circumstances, the flexural members can experience large deflections, be-cause of the low flexural stiffness of the RC beams. In order to increase the stiff-ness value, prestressing is utilized. A special jacking system was introduced and presented in detail in the article by Atutis et al. 2018.
3.4.1. Experimental Setup of Prestressed Concrete Beams
For the experimental tests, 12 real-scale specimens with a rectangular cross-sec-tion having the depth of 300 mm, width of 150 mm and length of 3200 mm (beam span of 2640 mm) were manufactured. A control beam, denoted as CS-1, with no initial prestressing of BFRP reinforcement was also prepared for cyclic load test.
The beams were denoted from CSI-1 to CSI-12, where the letter "S” refers to the member type (“Sija” = “Beam”), “C” refers to the loading type (“Ciklinė” = “Cyclic”) and “I” refers to the member type (“Įtemptoji sija” = “Prestressed
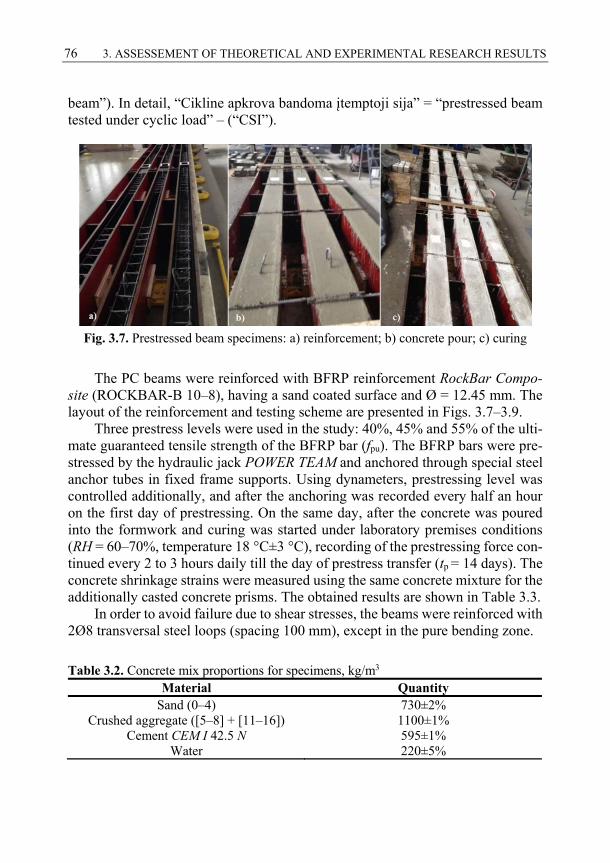
76 3. ASSESSEMENT OF THEORETICAL AND EXPERIMENTAL RESEARCH RESULTS
beam”). In detail, “Cikline apkrova bandoma įtemptoji sija” = “prestressed beam tested under cyclic load” – (“CSI”).
Fig. 3.7. Prestressed beam specimens: a) reinforcement; b) concrete pour; c) curing
The PC beams were reinforced with BFRP reinforcement RockBar Compo-site (ROCKBAR-B 10–8), having a sand coated surface and Ø = 12.45 mm. The layout of the reinforcement and testing scheme are presented in Figs. 3.7–3.9.
Three prestress levels were used in the study: 40%, 45% and 55% of the ulti-mate guaranteed tensile strength of the BFRP bar (fpu). The BFRP bars were pre-stressed by the hydraulic jack POWER TEAM and anchored through special steel anchor tubes in fixed frame supports. Using dynameters, prestressing level was controlled additionally, and after the anchoring was recorded every half an hour on the first day of prestressing. On the same day, after the concrete was poured into the formwork and curing was started under laboratory premises conditions (RH = 60–70%, temperature 18 °C±3 °C), recording of the prestressing force con-tinued every 2 to 3 hours daily till the day of prestress transfer (tp = 14 days). The concrete shrinkage strains were measured using the same concrete mixture for the additionally casted concrete prisms. The obtained results are shown in Table 3.3.
In order to avoid failure due to shear stresses, the beams were reinforced with 2Ø8 transversal steel loops (spacing 100 mm), except in the pure bending zone.
Table 3.2. Concrete mix proportions for specimens, kg/m3 Material Quantity
Sand (0–4) 730±2% Crushed aggregate ([5–8] + [11–16]) 1100±1%
Cement CEM I 42.5 N 595±1% Water 220±5%
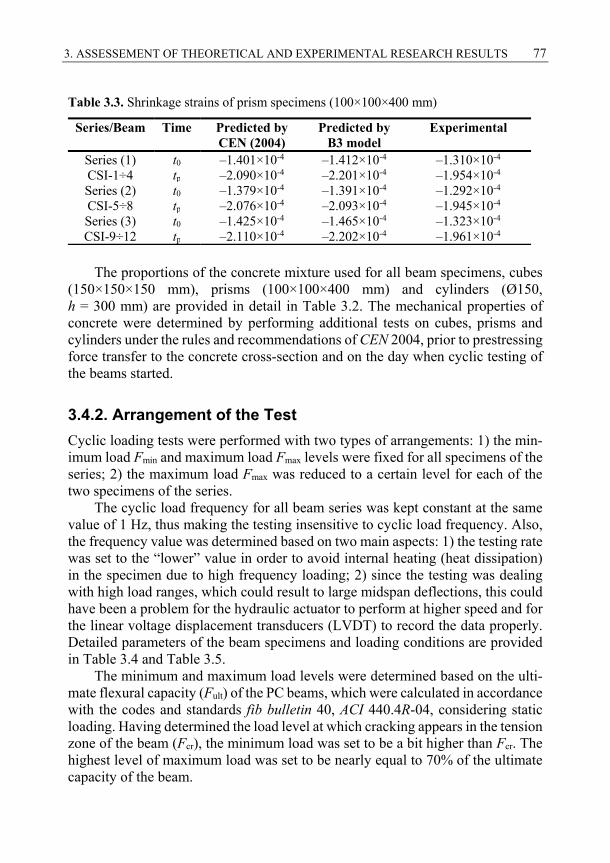
3. ASSESSEMENT OF THEORETICAL AND EXPERIMENTAL RESEARCH RESULTS 77
Table 3.3. Shrinkage strains of prism specimens (100×100×400 mm)
Series/Beam Time Predicted by CEN (2004)
Predicted by B3 model
Experimental
Series (1) CSI-1÷4
t0 –1.401×10⁻⁴ –1.412×10⁻⁴ –1.310×10⁻⁴ tp –2.090×10⁻⁴ –2.201×10⁻⁴ –1.954×10⁻⁴
Series (2) CSI-5÷8
t0 –1.379×10⁻⁴ –1.391×10⁻⁴ –1.292×10⁻⁴ tp –2.076×10⁻⁴ –2.093×10⁻⁴ –1.945×10⁻⁴
Series (3) CSI-9÷12
t0 –1.425×10⁻⁴ –1.465×10⁻⁴ –1.323×10⁻⁴ tp –2.110×10⁻⁴ –2.202×10⁻⁴ –1.961×10⁻⁴
The proportions of the concrete mixture used for all beam specimens, cubes
(150×150×150 mm), prisms (100×100×400 mm) and cylinders (Ø150, h = 300 mm) are provided in detail in Table 3.2. The mechanical properties of concrete were determined by performing additional tests on cubes, prisms and cylinders under the rules and recommendations of CEN 2004, prior to prestressing force transfer to the concrete cross-section and on the day when cyclic testing of the beams started.
3.4.2. Arrangement of the Test
Cyclic loading tests were performed with two types of arrangements: 1) the min-imum load Fmin and maximum load Fmax levels were fixed for all specimens of the series; 2) the maximum load Fmax was reduced to a certain level for each of the two specimens of the series.
The cyclic load frequency for all beam series was kept constant at the same value of 1 Hz, thus making the testing insensitive to cyclic load frequency. Also, the frequency value was determined based on two main aspects: 1) the testing rate was set to the “lower” value in order to avoid internal heating (heat dissipation) in the specimen due to high frequency loading; 2) since the testing was dealing with high load ranges, which could result to large midspan deflections, this could have been a problem for the hydraulic actuator to perform at higher speed and for the linear voltage displacement transducers (LVDT) to record the data properly. Detailed parameters of the beam specimens and loading conditions are provided in Table 3.4 and Table 3.5.
The minimum and maximum load levels were determined based on the ulti-mate flexural capacity (Fult) of the PC beams, which were calculated in accordance with the codes and standards fib bulletin 40, ACI 440.4R-04, considering static loading. Having determined the load level at which cracking appears in the tension zone of the beam (Fcr), the minimum load was set to be a bit higher than Fcr. The highest level of maximum load was set to be nearly equal to 70% of the ultimate capacity of the beam.
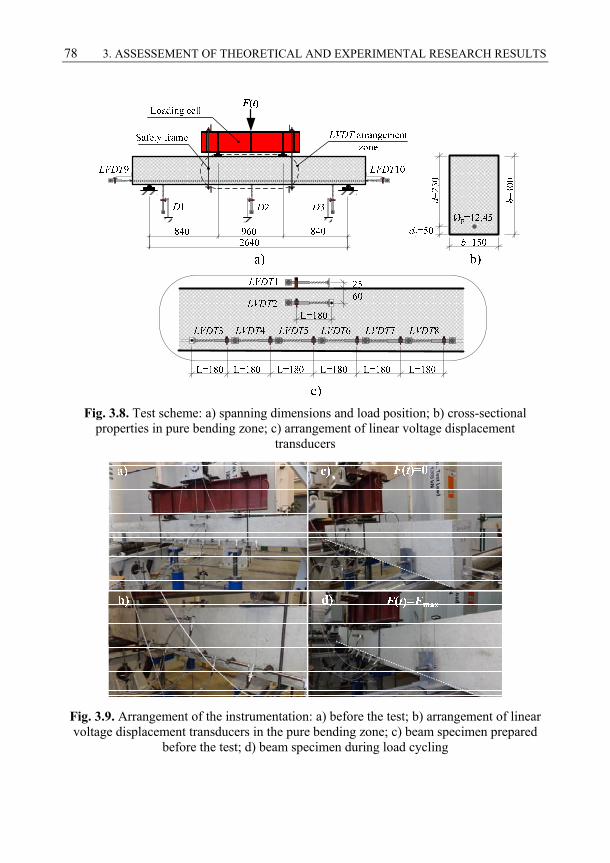
78 3. ASSESSEMENT OF THEORETICAL AND EXPERIMENTAL RESEARCH RESULTS
Fig. 3.8. Test scheme: a) spanning dimensions and load position; b) cross-sectional
properties in pure bending zone; c) arrangement of linear voltage displacement transducers
Fig. 3.9. Arrangement of the instrumentation: a) before the test; b) arrangement of linear voltage displacement transducers in the pure bending zone; c) beam specimen prepared
before the test; d) beam specimen during load cycling
3. ASSESSEMENT OF THEORETICAL AND EXPERIMENTAL RESEARCH RESULTS 79
Within Series 1, the prestressing levels of two beam specimens were set at 55% of ffu of the BFRP bar. The second ones had a lower initial prestressing level with a value of 40% of ffu. For Series 2 and Series 3 beam specimens, the initial prestressing stresses were equal to 45% of ffu.
The test was performed according to the following steps: 1) pre-loading was performed up to a total load of 5 kN, and it was transferred to the PC beam through the loading cell. The purpose of this was to double check if all the equipment were performing well and whether proper reading of the measurements were recorded in the data files. The instrumentation that was used allowed to record readings every 0.1 second. 2) The PC beam specimen was loaded statically till the maxi-mum load level Fmax and unloaded up to the value of Fmin. 3) The load cycling stage was performed at a loading speed of 96 kN/s for the the Series 1 beams, from 74 to 54 kN/s for the Series 2 beams, and from 66 to 40 kN/s for the Series 3 beams, up till the failure of the beam occurred.
Table 3.4. Geometrical and material properties of the beams
Beam h, mm
b, mm
l, mm
dp, mm
ffu, MPa
εfu Ep, GPa
ρ, %
fc, MPa
Control CS-1 302 152 3200 50 1090 0.0246 45 0.32 46.01 Series 1 CSI-1 303 149 CSI-2 300 148 3200 50 1090 0.0246 45 0.32 44.47 CSI-3 301 150 CSI-4 299 149 Series 2 CSI-5 300 150 CSI-6 303 152 3200 50 1090 0.0246 45 0.32 40.21 CSI-7 301 148 44.29 CSI-8 303 147 Series 3 CSI-9 301 151 CSI-10 303 153 3200 50 1090 0.0246 45 0.32 46.01 CSI-11 302 150 CSI-12 300 149
3.4.3. Analysis of the Experimental Results
The two main parts of the results are discussed in this section: a) results on the BFRP prestressed concrete beam fatigue resistance, and b) displacement (deflec-tion) development of the beams during cyclic loading. All specimens failed due to rupture of the BFRP bars, except the control beam, which failed in the mode of concrete crushing in the compression zone.
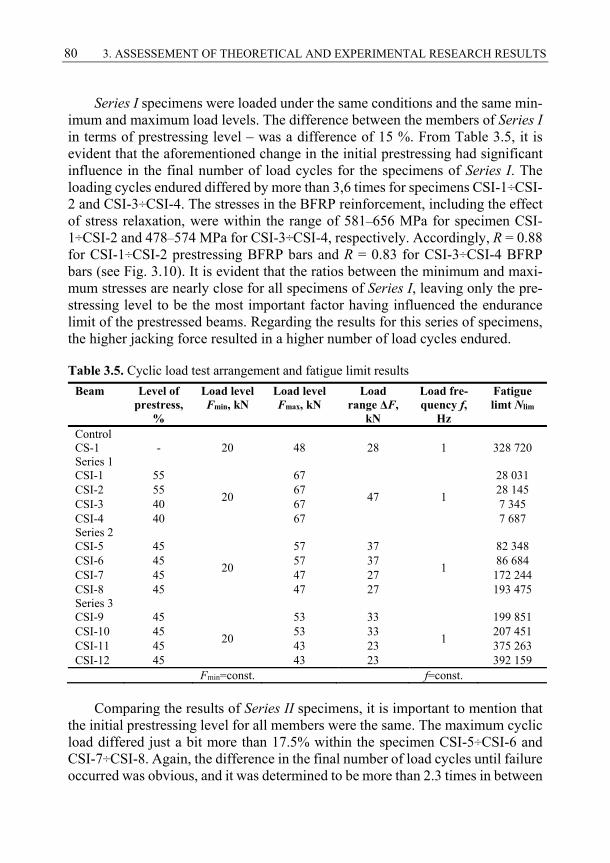
80 3. ASSESSEMENT OF THEORETICAL AND EXPERIMENTAL RESEARCH RESULTS
Series I specimens were loaded under the same conditions and the same min-imum and maximum load levels. The difference between the members of Series I in terms of prestressing level – was a difference of 15 %. From Table 3.5, it is evident that the aforementioned change in the initial prestressing had significant influence in the final number of load cycles for the specimens of Series I. The loading cycles endured differed by more than 3,6 times for specimens CSI-1÷CSI-2 and CSI-3÷CSI-4. The stresses in the BFRP reinforcement, including the effect of stress relaxation, were within the range of 581–656 MPa for specimen CSI-1÷CSI-2 and 478–574 MPa for CSI-3÷CSI-4, respectively. Accordingly, R = 0.88 for CSI-1÷CSI-2 prestressing BFRP bars and R = 0.83 for CSI-3÷CSI-4 BFRP bars (see Fig. 3.10). It is evident that the ratios between the minimum and maxi-mum stresses are nearly close for all specimens of Series I, leaving only the pre-stressing level to be the most important factor having influenced the endurance limit of the prestressed beams. Regarding the results for this series of specimens, the higher jacking force resulted in a higher number of load cycles endured.
Table 3.5. Cyclic load test arrangement and fatigue limit results
Beam Level of prestress,
%
Load level Fmin, kN
Load level Fmax, kN
Load range ΔF,
kN
Load fre-quency f,
Hz
Fatigue limt Nlim
Control CS-1 - 20 48 28 1 328 720 Series 1 CSI-1 55
20
67
47 1
28 031 CSI-2 55 67 28 145 CSI-3 40 67 7 345 CSI-4 40 67 7 687 Series 2 CSI-5 45
20
57 37
1
82 348 CSI-6 45 57 37 86 684 CSI-7 45 47 27 172 244 CSI-8 45 47 27 193 475 Series 3 CSI-9 45
20
53 33
1
199 851 CSI-10 45 53 33 207 451 CSI-11 45 43 23 375 263 CSI-12 45 43 23 392 159 Fmin=const. f=const.
Comparing the results of Series II specimens, it is important to mention that the initial prestressing level for all members were the same. The maximum cyclic load differed just a bit more than 17.5% within the specimen CSI-5÷CSI-6 and CSI-7÷CSI-8. Again, the difference in the final number of load cycles until failure occurred was obvious, and it was determined to be more than 2.3 times in between
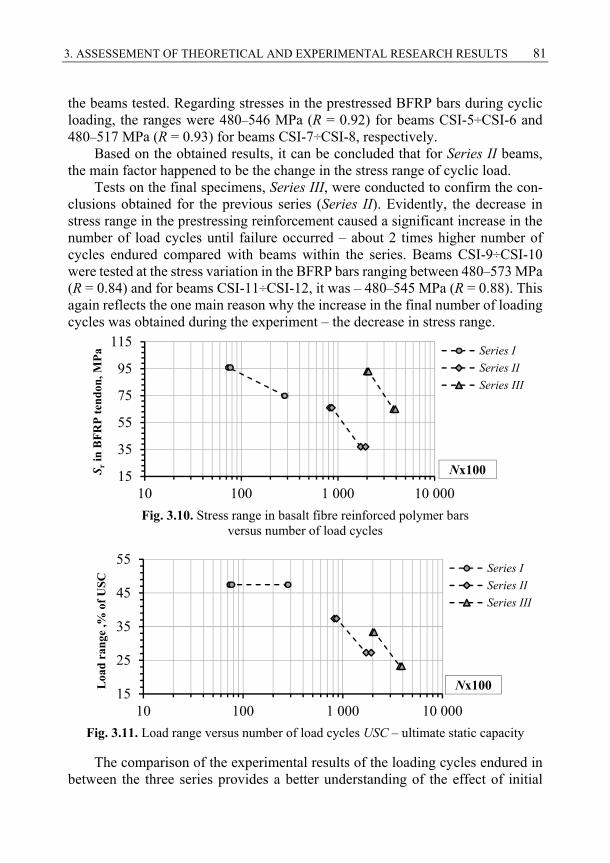
3. ASSESSEMENT OF THEORETICAL AND EXPERIMENTAL RESEARCH RESULTS 81
the beams tested. Regarding stresses in the prestressed BFRP bars during cyclic loading, the ranges were 480–546 MPa (R = 0.92) for beams CSI-5÷CSI-6 and 480–517 MPa (R = 0.93) for beams CSI-7÷CSI-8, respectively.
Based on the obtained results, it can be concluded that for Series II beams, the main factor happened to be the change in the stress range of cyclic load.
Tests on the final specimens, Series III, were conducted to confirm the con-clusions obtained for the previous series (Series II). Evidently, the decrease in stress range in the prestressing reinforcement caused a significant increase in the number of load cycles until failure occurred – about 2 times higher number of cycles endured compared with beams within the series. Beams CSI-9÷CSI-10 were tested at the stress variation in the BFRP bars ranging between 480–573 MPa (R = 0.84) and for beams CSI-11÷CSI-12, it was – 480–545 MPa (R = 0.88). This again reflects the one main reason why the increase in the final number of loading cycles was obtained during the experiment – the decrease in stress range.
Fig. 3.10. Stress range in basalt fibre reinforced polymer bars
versus number of load cycles
Fig. 3.11. Load range versus number of load cycles USC – ultimate static capacity
The comparison of the experimental results of the loading cycles endured in between the three series provides a better understanding of the effect of initial
15
35
55
75
95
115
10 100 1 000 10 000
S rin
BF
RP
ten
don,
MP
a Series I
Series II
Series III
Nx100
15
25
35
45
55
10 100 1 000 10 000
Loa
d r
ange
,% o
f U
SC
Series I
Series II
Series III
Nx100
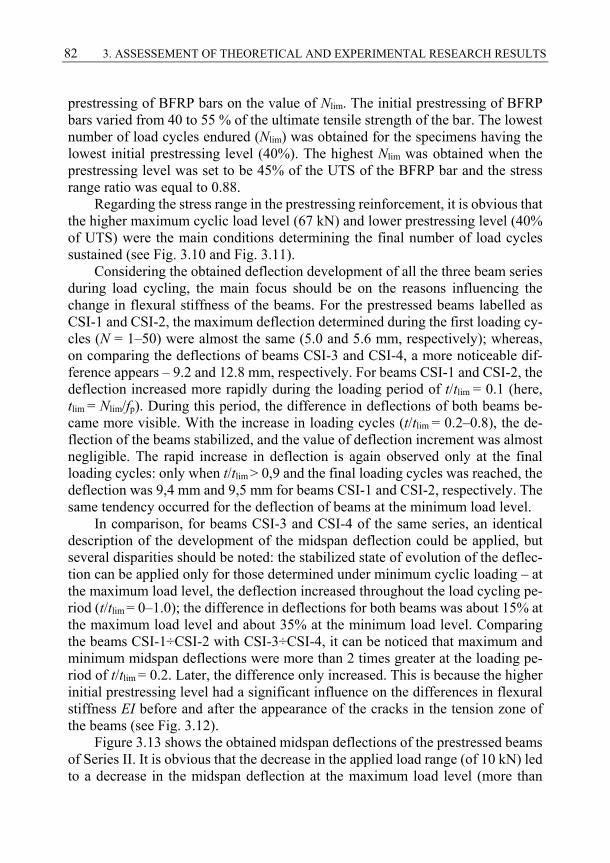
82 3. ASSESSEMENT OF THEORETICAL AND EXPERIMENTAL RESEARCH RESULTS
prestressing of BFRP bars on the value of Nlim. The initial prestressing of BFRP bars varied from 40 to 55 % of the ultimate tensile strength of the bar. The lowest number of load cycles endured (Nlim) was obtained for the specimens having the lowest initial prestressing level (40%). The highest Nlim was obtained when the prestressing level was set to be 45% of the UTS of the BFRP bar and the stress range ratio was equal to 0.88.
Regarding the stress range in the prestressing reinforcement, it is obvious that the higher maximum cyclic load level (67 kN) and lower prestressing level (40% of UTS) were the main conditions determining the final number of load cycles sustained (see Fig. 3.10 and Fig. 3.11).
Considering the obtained deflection development of all the three beam series during load cycling, the main focus should be on the reasons influencing the change in flexural stiffness of the beams. For the prestressed beams labelled as CSI-1 and CSI-2, the maximum deflection determined during the first loading cy-cles (N = 1–50) were almost the same (5.0 and 5.6 mm, respectively); whereas, on comparing the deflections of beams CSI-3 and CSI-4, a more noticeable dif-ference appears – 9.2 and 12.8 mm, respectively. For beams CSI-1 and CSI-2, the deflection increased more rapidly during the loading period of t/tlim = 0.1 (here, tlim = Nlim/fp). During this period, the difference in deflections of both beams be-came more visible. With the increase in loading cycles (t/tlim = 0.2–0.8), the de-flection of the beams stabilized, and the value of deflection increment was almost negligible. The rapid increase in deflection is again observed only at the final loading cycles: only when t/tlim > 0,9 and the final loading cycles was reached, the deflection was 9,4 mm and 9,5 mm for beams CSI-1 and CSI-2, respectively. The same tendency occurred for the deflection of beams at the minimum load level.
In comparison, for beams CSI-3 and CSI-4 of the same series, an identical description of the development of the midspan deflection could be applied, but several disparities should be noted: the stabilized state of evolution of the deflec-tion can be applied only for those determined under minimum cyclic loading – at the maximum load level, the deflection increased throughout the load cycling pe-riod (t/tlim = 0–1.0); the difference in deflections for both beams was about 15% at the maximum load level and about 35% at the minimum load level. Comparing the beams CSI-1÷CSI-2 with CSI-3÷CSI-4, it can be noticed that maximum and minimum midspan deflections were more than 2 times greater at the loading pe-riod of t/tlim = 0.2. Later, the difference only increased. This is because the higher initial prestressing level had a significant influence on the differences in flexural stiffness EI before and after the appearance of the cracks in the tension zone of the beams (see Fig. 3.12).
Figure 3.13 shows the obtained midspan deflections of the prestressed beams of Series II. It is obvious that the decrease in the applied load range (of 10 kN) led to a decrease in the midspan deflection at the maximum load level (more than
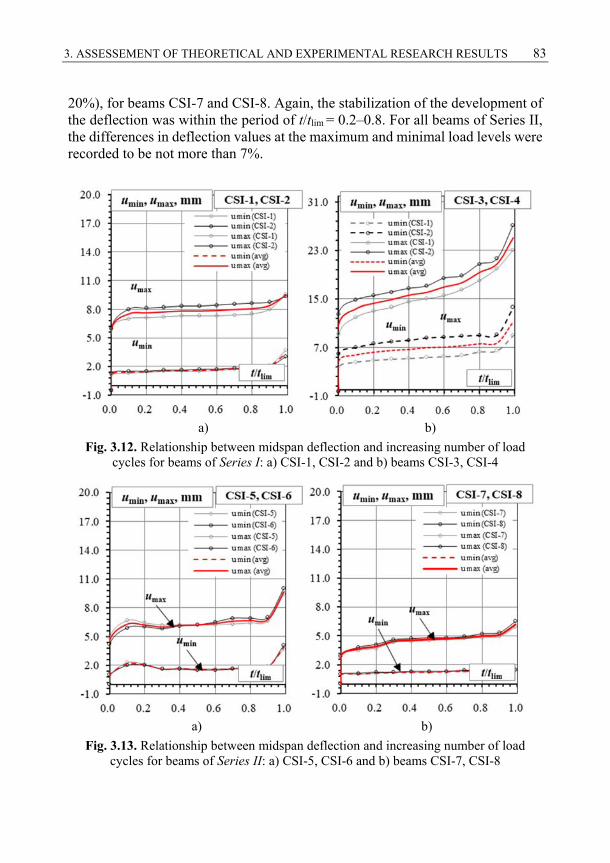
3. ASSESSEMENT OF THEORETICAL AND EXPERIMENTAL RESEARCH RESULTS 83
20%), for beams CSI-7 and CSI-8. Again, the stabilization of the development of the deflection was within the period of t/tlim = 0.2–0.8. For all beams of Series II, the differences in deflection values at the maximum and minimal load levels were recorded to be not more than 7%.
a) b)
Fig. 3.12. Relationship between midspan deflection and increasing number of load cycles for beams of Series I: a) CSI-1, CSI-2 and b) beams CSI-3, CSI-4
a) b)
Fig. 3.13. Relationship between midspan deflection and increasing number of load cycles for beams of Series II: a) CSI-5, CSI-6 and b) beams CSI-7, CSI-8
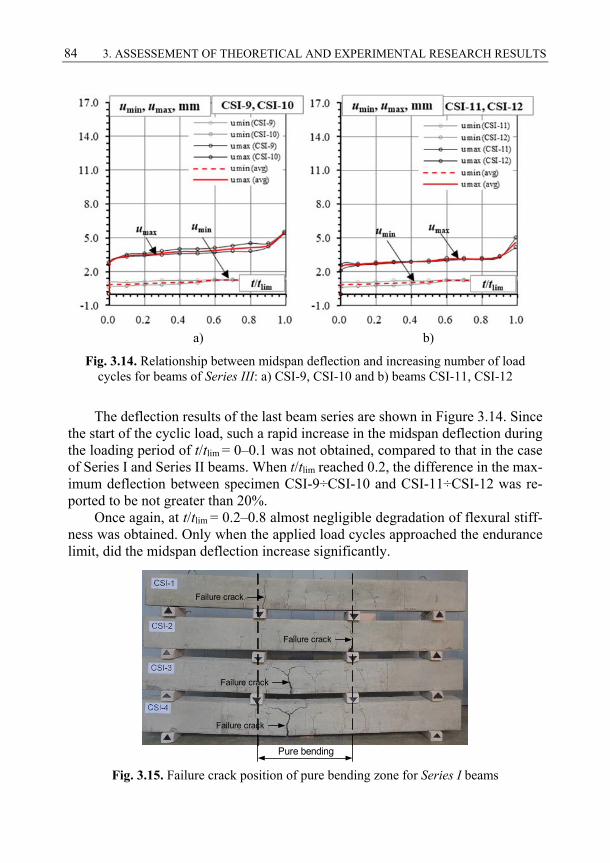
84 3. ASSESSEMENT OF THEORETICAL AND EXPERIMENTAL RESEARCH RESULTS
a) b)
Fig. 3.14. Relationship between midspan deflection and increasing number of load cycles for beams of Series III: a) CSI-9, CSI-10 and b) beams CSI-11, CSI-12
The deflection results of the last beam series are shown in Figure 3.14. Since the start of the cyclic load, such a rapid increase in the midspan deflection during the loading period of t/tlim = 0–0.1 was not obtained, compared to that in the case of Series I and Series II beams. When t/tlim reached 0.2, the difference in the max-imum deflection between specimen CSI-9÷CSI-10 and CSI-11÷CSI-12 was re-ported to be not greater than 20%.
Once again, at t/tlim = 0.2–0.8 almost negligible degradation of flexural stiff-ness was obtained. Only when the applied load cycles approached the endurance limit, did the midspan deflection increase significantly.
Pure bending
Failure crack
Failure crack
Failure crack
Failure crack
Fig. 3.15. Failure crack position of pure bending zone for Series I beams
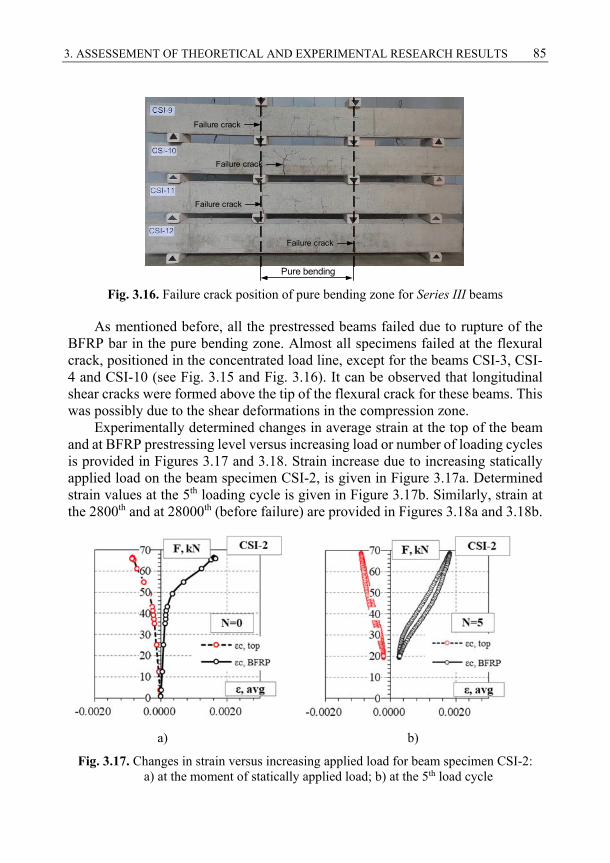
3. ASSESSEMENT OF THEORETICAL AND EXPERIMENTAL RESEARCH RESULTS 85
Pure bending
Failure crack
Failure crack
Failure crack
Failure crack
Fig. 3.16. Failure crack position of pure bending zone for Series III beams
As mentioned before, all the prestressed beams failed due to rupture of the BFRP bar in the pure bending zone. Almost all specimens failed at the flexural crack, positioned in the concentrated load line, except for the beams CSI-3, CSI-4 and CSI-10 (see Fig. 3.15 and Fig. 3.16). It can be observed that longitudinal shear cracks were formed above the tip of the flexural crack for these beams. This was possibly due to the shear deformations in the compression zone.
Experimentally determined changes in average strain at the top of the beam and at BFRP prestressing level versus increasing load or number of loading cycles is provided in Figures 3.17 and 3.18. Strain increase due to increasing statically applied load on the beam specimen CSI-2, is given in Figure 3.17a. Determined strain values at the 5th loading cycle is given in Figure 3.17b. Similarly, strain at the 2800th and at 28000th (before failure) are provided in Figures 3.18a and 3.18b.
a) b)
Fig. 3.17. Changes in strain versus increasing applied load for beam specimen CSI-2: a) at the moment of statically applied load; b) at the 5th load cycle
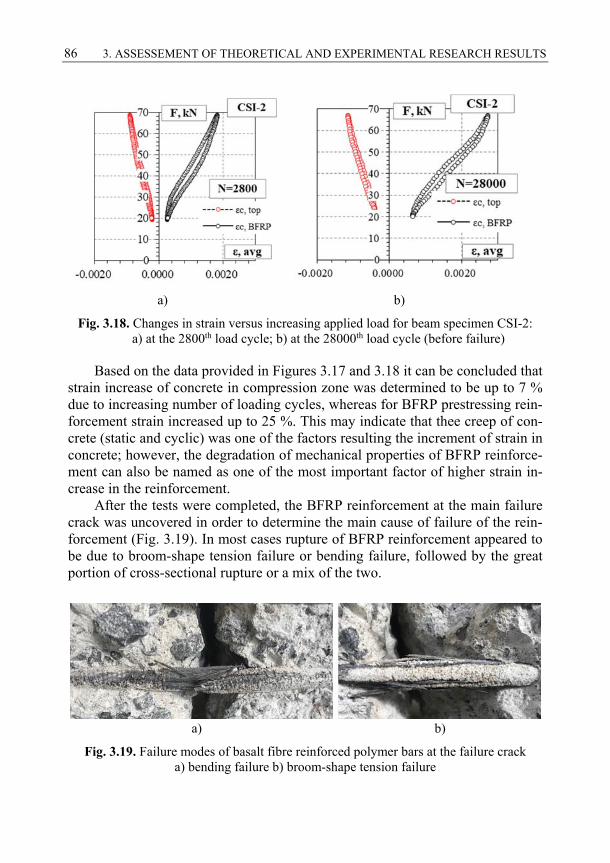
86 3. ASSESSEMENT OF THEORETICAL AND EXPERIMENTAL RESEARCH RESULTS
a) b)
Fig. 3.18. Changes in strain versus increasing applied load for beam specimen CSI-2: a) at the 2800th load cycle; b) at the 28000th load cycle (before failure)
Based on the data provided in Figures 3.17 and 3.18 it can be concluded that strain increase of concrete in compression zone was determined to be up to 7 % due to increasing number of loading cycles, whereas for BFRP prestressing rein-forcement strain increased up to 25 %. This may indicate that thee creep of con-crete (static and cyclic) was one of the factors resulting the increment of strain in concrete; however, the degradation of mechanical properties of BFRP reinforce-ment can also be named as one of the most important factor of higher strain in-crease in the reinforcement.
After the tests were completed, the BFRP reinforcement at the main failure crack was uncovered in order to determine the main cause of failure of the rein-forcement (Fig. 3.19). In most cases rupture of BFRP reinforcement appeared to be due to broom-shape tension failure or bending failure, followed by the great portion of cross-sectional rupture or a mix of the two.
a) b)
Fig. 3.19. Failure modes of basalt fibre reinforced polymer bars at the failure crack a) bending failure b) broom-shape tension failure
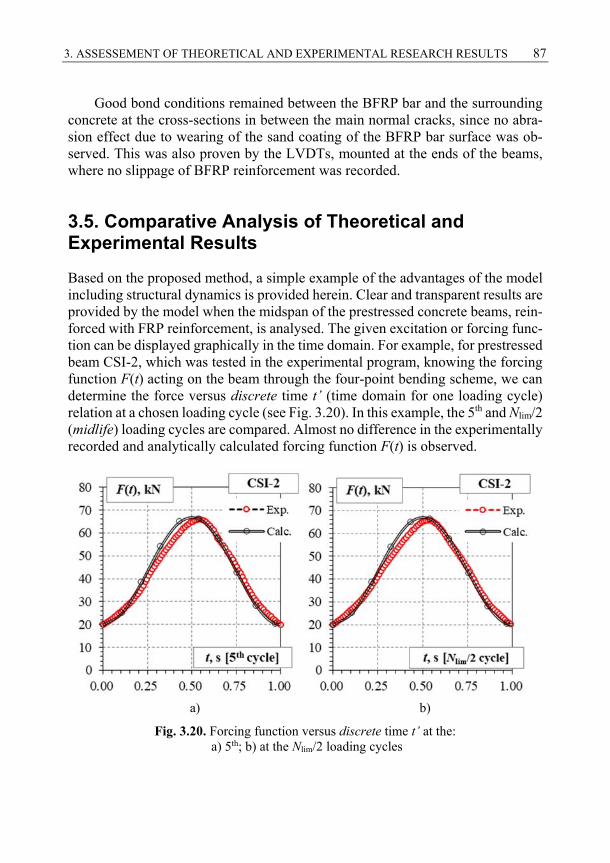
3. ASSESSEMENT OF THEORETICAL AND EXPERIMENTAL RESEARCH RESULTS 87
Good bond conditions remained between the BFRP bar and the surrounding concrete at the cross-sections in between the main normal cracks, since no abra-sion effect due to wearing of the sand coating of the BFRP bar surface was ob-served. This was also proven by the LVDTs, mounted at the ends of the beams, where no slippage of BFRP reinforcement was recorded.
3.5. Comparative Analysis of Theoretical and Experimental Results
Based on the proposed method, a simple example of the advantages of the model including structural dynamics is provided herein. Clear and transparent results are provided by the model when the midspan of the prestressed concrete beams, rein-forced with FRP reinforcement, is analysed. The given excitation or forcing func-tion can be displayed graphically in the time domain. For example, for prestressed beam CSI-2, which was tested in the experimental program, knowing the forcing function F(t) acting on the beam through the four-point bending scheme, we can determine the force versus discrete time t’ (time domain for one loading cycle) relation at a chosen loading cycle (see Fig. 3.20). In this example, the 5th and Nlim/2 (midlife) loading cycles are compared. Almost no difference in the experimentally recorded and analytically calculated forcing function F(t) is observed.
a) b)
Fig. 3.20. Forcing function versus discrete time t’ at the: a) 5th; b) at the Nlim/2 loading cycles
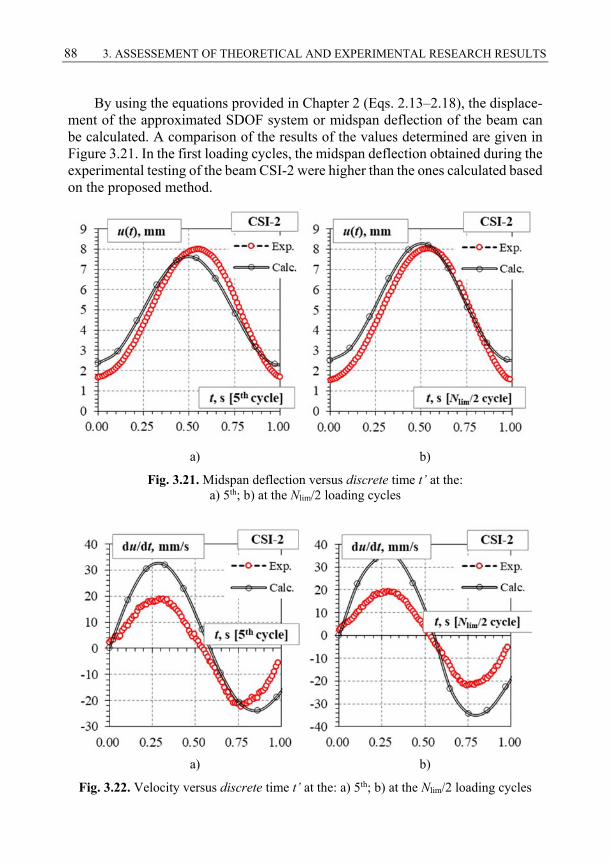
88 3. ASSESSEMENT OF THEORETICAL AND EXPERIMENTAL RESEARCH RESULTS
By using the equations provided in Chapter 2 (Eqs. 2.13–2.18), the displace-ment of the approximated SDOF system or midspan deflection of the beam can be calculated. A comparison of the results of the values determined are given in Figure 3.21. In the first loading cycles, the midspan deflection obtained during the experimental testing of the beam CSI-2 were higher than the ones calculated based on the proposed method.
a) b)
Fig. 3.21. Midspan deflection versus discrete time t’ at the: a) 5th; b) at the Nlim/2 loading cycles
a) b)
Fig. 3.22. Velocity versus discrete time t’ at the: a) 5th; b) at the Nlim/2 loading cycles
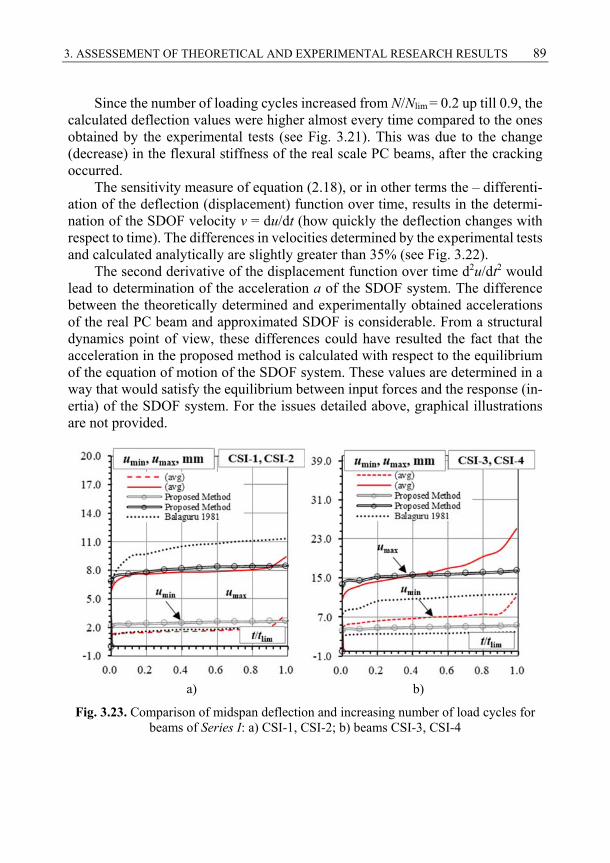
3. ASSESSEMENT OF THEORETICAL AND EXPERIMENTAL RESEARCH RESULTS 89
Since the number of loading cycles increased from N/Nlim = 0.2 up till 0.9, the calculated deflection values were higher almost every time compared to the ones obtained by the experimental tests (see Fig. 3.21). This was due to the change (decrease) in the flexural stiffness of the real scale PC beams, after the cracking occurred. The sensitivity measure of equation (2.18), or in other terms the – differenti-ation of the deflection (displacement) function over time, results in the determi-nation of the SDOF velocity v = du/dt (how quickly the deflection changes with respect to time). The differences in velocities determined by the experimental tests and calculated analytically are slightly greater than 35% (see Fig. 3.22). The second derivative of the displacement function over time d2u/dt2 would lead to determination of the acceleration a of the SDOF system. The difference between the theoretically determined and experimentally obtained accelerations of the real PC beam and approximated SDOF is considerable. From a structural dynamics point of view, these differences could have resulted the fact that the acceleration in the proposed method is calculated with respect to the equilibrium of the equation of motion of the SDOF system. These values are determined in a way that would satisfy the equilibrium between input forces and the response (in-ertia) of the SDOF system. For the issues detailed above, graphical illustrations are not provided.
a) b)
Fig. 3.23. Comparison of midspan deflection and increasing number of load cycles for beams of Series I: a) CSI-1, CSI-2; b) beams CSI-3, CSI-4
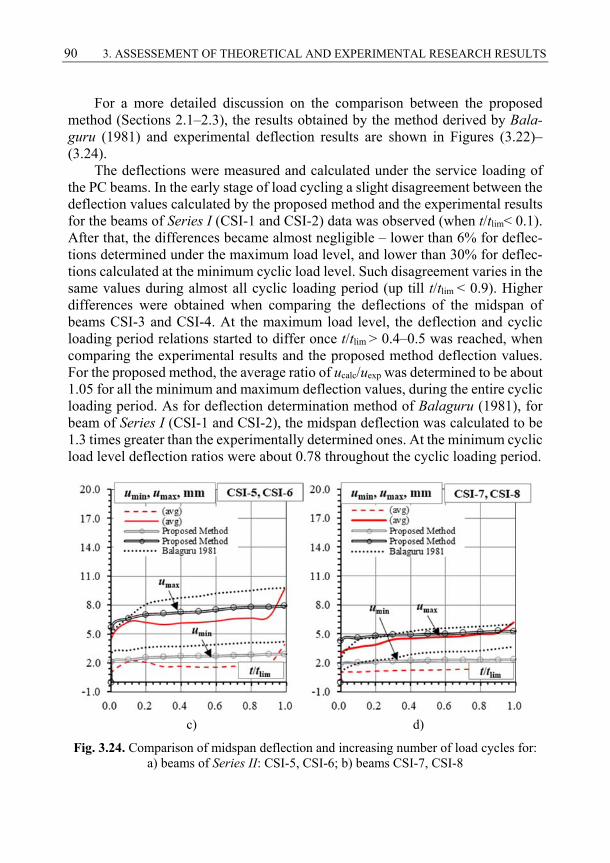
90 3. ASSESSEMENT OF THEORETICAL AND EXPERIMENTAL RESEARCH RESULTS
For a more detailed discussion on the comparison between the proposed method (Sections 2.1–2.3), the results obtained by the method derived by Bala-guru (1981) and experimental deflection results are shown in Figures (3.22)–(3.24).
The deflections were measured and calculated under the service loading of the PC beams. In the early stage of load cycling a slight disagreement between the deflection values calculated by the proposed method and the experimental results for the beams of Series I (CSI-1 and CSI-2) data was observed (when t/tlim< 0.1). After that, the differences became almost negligible – lower than 6% for deflec-tions determined under the maximum load level, and lower than 30% for deflec-tions calculated at the minimum cyclic load level. Such disagreement varies in the same values during almost all cyclic loading period (up till t/tlim < 0.9). Higher differences were obtained when comparing the deflections of the midspan of beams CSI-3 and CSI-4. At the maximum load level, the deflection and cyclic loading period relations started to differ once t/tlim > 0.4–0.5 was reached, when comparing the experimental results and the proposed method deflection values. For the proposed method, the average ratio of ucalc/uexp was determined to be about 1.05 for all the minimum and maximum deflection values, during the entire cyclic loading period. As for deflection determination method of Balaguru (1981), for beam of Series I (CSI-1 and CSI-2), the midspan deflection was calculated to be 1.3 times greater than the experimentally determined ones. At the minimum cyclic load level deflection ratios were about 0.78 throughout the cyclic loading period.
c) d)
Fig. 3.24. Comparison of midspan deflection and increasing number of load cycles for: a) beams of Series II: CSI-5, CSI-6; b) beams CSI-7, CSI-8
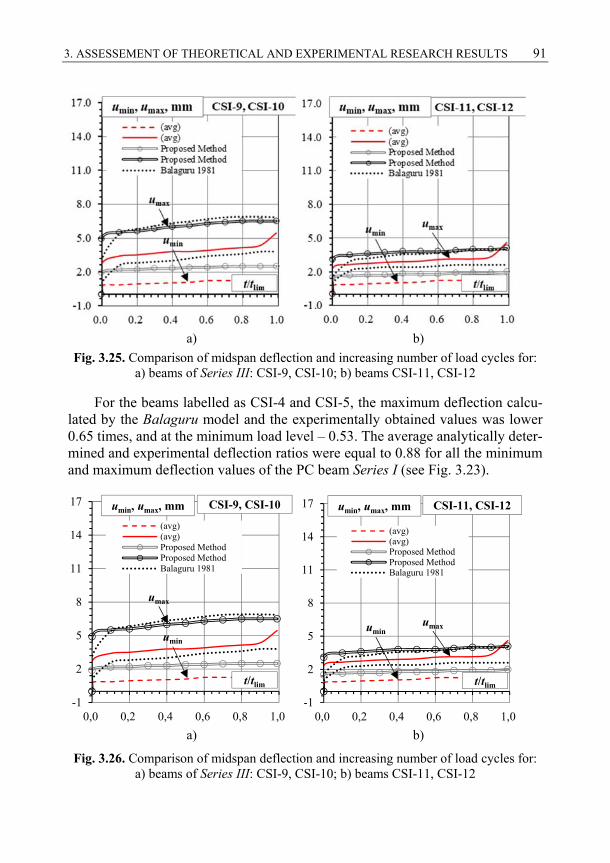
3. ASSESSEMENT OF THEORETICAL AND EXPERIMENTAL RESEARCH RESULTS 91
a) b)
Fig. 3.25. Comparison of midspan deflection and increasing number of load cycles for: a) beams of Series III: CSI-9, CSI-10; b) beams CSI-11, CSI-12
For the beams labelled as CSI-4 and CSI-5, the maximum deflection calcu-lated by the Balaguru model and the experimentally obtained values was lower 0.65 times, and at the minimum load level – 0.53. The average analytically deter-mined and experimental deflection ratios were equal to 0.88 for all the minimum and maximum deflection values of the PC beam Series I (see Fig. 3.23).
a) b)
Fig. 3.26. Comparison of midspan deflection and increasing number of load cycles for: a) beams of Series III: CSI-9, CSI-10; b) beams CSI-11, CSI-12
-1
2
5
8
11
14
17
0,0 0,2 0,4 0,6 0,8 1,0
(avg)(avg)Proposed MethodProposed MethodBalaguru 1981
CSI-9, CSI-10
t/tlim
umax
umin
umin, umax, mm
-1
2
5
8
11
14
17
0,0 0,2 0,4 0,6 0,8 1,0
(avg)(avg)Proposed MethodProposed MethodBalaguru 1981
CSI-11, CSI-12
t/tlim
umaxumin
umin, umax, mm
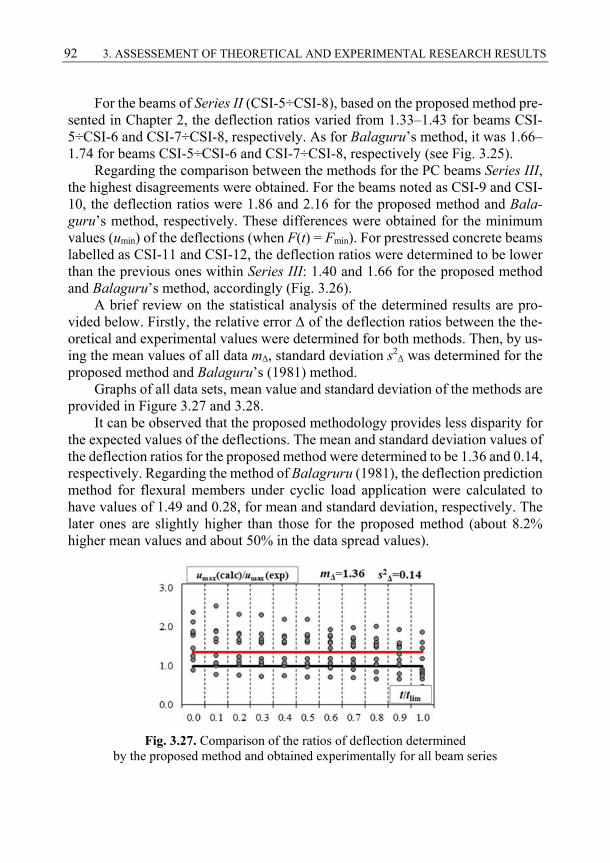
92 3. ASSESSEMENT OF THEORETICAL AND EXPERIMENTAL RESEARCH RESULTS
For the beams of Series II (CSI-5÷CSI-8), based on the proposed method pre-sented in Chapter 2, the deflection ratios varied from 1.33–1.43 for beams CSI-5÷CSI-6 and CSI-7÷CSI-8, respectively. As for Balaguru’s method, it was 1.66–1.74 for beams CSI-5÷CSI-6 and CSI-7÷CSI-8, respectively (see Fig. 3.25).
Regarding the comparison between the methods for the PC beams Series III, the highest disagreements were obtained. For the beams noted as CSI-9 and CSI-10, the deflection ratios were 1.86 and 2.16 for the proposed method and Bala-guru’s method, respectively. These differences were obtained for the minimum values (umin) of the deflections (when F(t) = Fmin). For prestressed concrete beams labelled as CSI-11 and CSI-12, the deflection ratios were determined to be lower than the previous ones within Series III: 1.40 and 1.66 for the proposed method and Balaguru’s method, accordingly (Fig. 3.26).
A brief review on the statistical analysis of the determined results are pro-vided below. Firstly, the relative error Δ of the deflection ratios between the the-oretical and experimental values were determined for both methods. Then, by us-ing the mean values of all data mΔ, standard deviation s2
Δ was determined for the proposed method and Balaguru’s (1981) method.
Graphs of all data sets, mean value and standard deviation of the methods are provided in Figure 3.27 and 3.28.
It can be observed that the proposed methodology provides less disparity for the expected values of the deflections. The mean and standard deviation values of the deflection ratios for the proposed method were determined to be 1.36 and 0.14, respectively. Regarding the method of Balagruru (1981), the deflection prediction method for flexural members under cyclic load application were calculated to have values of 1.49 and 0.28, for mean and standard deviation, respectively. The later ones are slightly higher than those for the proposed method (about 8.2% higher mean values and about 50% in the data spread values).
Fig. 3.27. Comparison of the ratios of deflection determined by the proposed method and obtained experimentally for all beam series
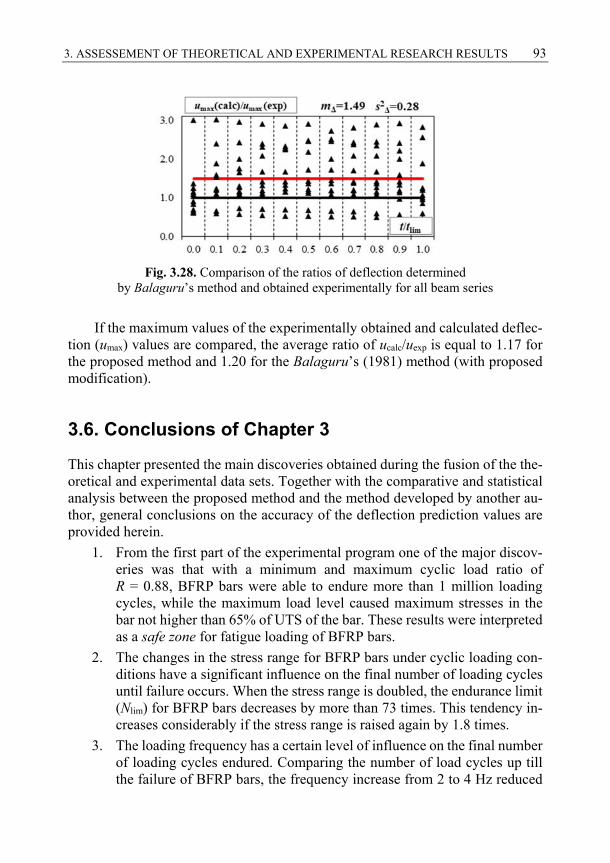
3. ASSESSEMENT OF THEORETICAL AND EXPERIMENTAL RESEARCH RESULTS 93
Fig. 3.28. Comparison of the ratios of deflection determined by Balaguru’s method and obtained experimentally for all beam series
If the maximum values of the experimentally obtained and calculated deflec-tion (umax) values are compared, the average ratio of ucalc/uexp is equal to 1.17 for the proposed method and 1.20 for the Balaguru’s (1981) method (with proposed modification).
3.6. Conclusions of Chapter 3
This chapter presented the main discoveries obtained during the fusion of the the-oretical and experimental data sets. Together with the comparative and statistical analysis between the proposed method and the method developed by another au-thor, general conclusions on the accuracy of the deflection prediction values are provided herein.
1. From the first part of the experimental program one of the major discov-eries was that with a minimum and maximum cyclic load ratio of R = 0.88, BFRP bars were able to endure more than 1 million loading cycles, while the maximum load level caused maximum stresses in the bar not higher than 65% of UTS of the bar. These results were interpreted as a safe zone for fatigue loading of BFRP bars.
2. The changes in the stress range for BFRP bars under cyclic loading con-ditions have a significant influence on the final number of loading cycles until failure occurs. When the stress range is doubled, the endurance limit (Nlim) for BFRP bars decreases by more than 73 times. This tendency in-creases considerably if the stress range is raised again by 1.8 times.
3. The loading frequency has a certain level of influence on the final number of loading cycles endured. Comparing the number of load cycles up till the failure of BFRP bars, the frequency increase from 2 to 4 Hz reduced
94 3. ASSESSEMENT OF THEORETICAL AND EXPERIMENTAL RESEARCH RESULTS
the number of cycles endured by 30%. At higher loading frequencies, Nlim tends to decrease even more rapidly.
4. The experimental test on the change in the modulus of elasticity of BFRP bars under cyclic loading provided the following results: After 1 million loading cycles, the decrease of the modulus of elasticity of BFRP bars was obtained to be not more than 4%. An increase in the damage variable D(N) was obtained only after the midlife (Nlim/2) of the test specimens. Based on the experimental data a power law equation was proposed for the determination of modulus of elasticity decrease for BFRP bars.
5. Regarding the fatigue resistance of BFRP prestressed concrete beams it was observed that, the highest number of maintained load cycles was reached for the beams having the lowest load range (also the lowest Sr in the prestressing reinforcement) and medium initial prestressing level (out of free: 40%, 45% and 55%). The optimal minimum and maximum stress ratio R was determined to be varying from 0.84 to 0.88. Higher R values are followed by lower Nlim.
6. Experimental tests on the PC beams under cyclic loading showed fatigue failure of the beams in the tension zone (by rupture of the BFRP bar), except for the control beam (crushing of concrete in the compression zone). All the specimens failed in the major flexural crack, positioned in the concentrated load line (in the pure bending zone). Several specimens failed in between the concentrated load points. It was observed that in those specimen, major flexural crack had longitudinal shear cracks, formed above the tip of the major crack. This was possibly due to the concrete resistance of the propagation of crack towards the neutral axis, followed by the development of shear deformations.
7. After the comparison of the proposed method with the experimental data it was determined that the proposed method provides greater accuracy for midspan deflection values than the ones calculated by the other method available in the literature (Balaguru 1981). The mean and standard devi-ation values of the deflection ratios for the proposed method were deter-mined to be 1.36 and 0.14, respectively.
95
General Conclusions
Conclusions of most important findings can be drawn:
1. The literature review showed that in order to properly evaluate deflection of the PC flexural members under repetitive or cyclic loading, accurate evaluation of the degradation processes in both the concrete and the pre-stressing reinforcement must be considered. In addition to static creep, cyclic creep of concrete should be assessed throughout the loading period. In order to use BFRP reinforcement as a prestressing for concrete flexural members, extensive theoretical and experimental tests should be per-formed. In order to obtain greater knowledge and understanding of the inner processes and response of FRP reinforcement (in this case – BFRP) undergoing cyclic loading, new investigations should be performed.
2. Based on the obtained extensive experimental results, an alternative model is proposed for the cyclic creep strain determination in cases where prestressing reinforcement, which has a relatively low modulus of elas-ticity (i.e., BFRP), is used. The model is proposed with reference to the exciting cyclic creep of concrete evaluation model.
3. Time-dependent concrete properties such as creep could be re-evaluated by the addition of creep increment due to cyclic loading in the existing design codes and recommendations for concrete members reinforced or prestressed with FRP bars. Evaluation of the effect of cyclic loading on
96 GENERAL CONCLUSIONS
the properties of FRP reinforcement should also include the changes in the elasticity modulus.
4. An analytical model based on structural dynamics for evaluating the de-flection evolution during cyclic loading is proposed. Unlike the other methods reviewed in this thesis, the proposed method is advantageous due to the ability to involve structural dynamic principles in the deflection determination processes, such as determination of the natural angular fre-quency (ωn) of BFRP prestressed concrete beams, sensitivity of a flexural member to the excitation force (cyclic loading) and load frequency. The proposed method evaluates FRP (in this case – BFRP) prestress losses due to its relaxation, static and cyclic creep, and shrinkage of concrete, throughout the cyclic loading period (loading duration). Basically, the method enables engineers to analyse the structural members (i.e., PC sleepers, PC girders, PC bridge decks, etc.) in the early stages of the de-signing process (i.e., prestress level, stress-strain evaluation, natural an-gular frequency of the structural member, etc.) and make easier decisions in the final stages.
5. It was experimentally found that for BFRP bars, mechanical properties such as modulus of elasticity are almost non-degradable. After 1 million loading cycles (tension-tension cyclic tests), it was determined that the total degradation was less than 5%, leading to a conclusion that BFRP bars can be highly recommended for use in flexural PC structures under-going cyclic loading. Nevertheless, based on these results, a new change in the BFRP elasticity modulus determining equation Ebfrp(N), based on damage variable, was proposed, which allows to extrapolate the degrada-tion values for even higher loading cycles (>1 million). However, it is recommended to perform additional experimental investigation to ensure the adequacy of the proposed equation.
6. Based on the experimental results, it was found that the fatigue life of BFRP prestressed concrete beams had greater values in situations where the load range was the lowest (Sr in the BFRP prestressing reinforcement was also lowest) of all tested specimen. The most effective initial pre-stressing level was found to be 45% of the ultimate tensile strength of BFRP bar. The tested specimens were able to undergo the highest number of loading cycles in situations where the minimum and maximum stress ratios in the BFRP reinforcement was found to vary from 0.84 to 0.88.
7. After the completion of statistical analysis, it was determined that the pro-posed method for calculating the deflection of PC beams provides greater accuracy of the determined deflection values at any given time step of the forcing function, compared to the experimental test results and the method
GENERAL CONCLUSIONS 97
proposed by another author (Balaguru 1981). The mean and standard de-viation values of the minimum and maximum deflection ratios for the proposed method were 1.36 and 0.14, respectively. The mean value for maximum deflection ratio values only were determined to be equal to 1.17 for the proposed method, leading to a conclusion that proposed method provides more accurate results comparing to other method.
8. Considering the above conclusions, it is highly recommended to extend the research on the findings presented in this study through additional ex-perimental tests and numerical simulations with FEM to be able to apply the methodology and proposed calculation technique to the existing de-sign codes and recommendations for structures reinforced with BFRP re-inforcement.

99
References
Aas-Jakobsen K. 1970. Fatigue of concrete beams and columns. Trondheim, NTH Institutt for Betongkonstruksjoner; Bulletin No. 70–1. 148 p.
Abdelrahman, A.; Rizkalla, S.1997. Serviceability of concrete beams prestressed by car-bon fibre-reinforced-plastic bars. ACI Structural Journal 94(4): 447–454.
Abdelrahman, A.; Rizkalla, S. 1999. Deflection control of concrete beams pretensioned by CFRP reinforcements. ASCE Journal of Composites for Construction 3(2): 55–62.
ACI Committee 215. 1997. Considerations for design of concrete structures subjected to fatigue loading, ACI-215R-74. 24 p.
ACI Committee 440. 2004. Guidelines for prestressing concrete structures with FRP ten-dons, ACI–440.4R–04. Farmington Hills, Michigan: ACI. 35 p.
Adimi, M. R.; Rahman, A. H.; Benmokrane, B. 2000. New method for testing fibre-rein-forced polymer rods under fatigue. ASCE Journal of Composite for Constructions, 10.1061/(ASCE)1090-0268(2000)4:4(206): 206–213.
Balaguru, P., N. 1981. Analysis of prestressed concrete beams for fatigue loading. PCI Journal, 16(5): 22–52.
Balaguru, P., N.; Shah, S. P. 1982. A Method for Predicting Crack Widths and Deflections for Fatigue Loading. ACI SP-75: 153–175.
Balafas, I.; Burgoyne, C.J. 2012. Economic design of beams with FRP rebar or prestress, Magazine of Concrete Research 64(10): 885–898.
100 REFERENCES
Balevičius, R. Tiesinio valkšnumo įvertinimas, skaičiuojant įtemptojo gelžbetonio strypinius elementus. Daktaro disertacija, Vilniaus Gedimino technikos universitetas, 2000. 163 p. (In Lithuanian)
Balevičius, R.; E. Dulinskas. 2010. On the Prediction of Non‐linear Creep Strains”. Jour-nal of Civil Engineering and Management, Vol. 16, no. 3, Sept., 382–386.
Balevičius, R.; Augonis, M. 2018. The effects of bond, shrinkage and creep on cracking resistance of steel and GFRP RC members, Composite Structures 187: 85–101.
Bažant, Z. P. 1968. On causes of excessive long-time deflections of prestressed concrete bridges. Creep under repeated live load. In: Czech, Inženýrské Stavby, 16: 317–320.
Bažant, Z. P; Panula, L. 1978. Practical prediction of time-dependent deformations of concrete. Parts I and II: 11(65) (1978), 307-328. Parts III and IV: ibid. 11(66): 415–434.
Bažant, Z. P.; Panula, L. 1979. Practical prediction of time-dependent deformations of concrete. Part VI: cyclic creep, nonlinearity and statistical scatter. Materials and Struc-tures. (RILEM, Paris) 12: 175–183.
Bažant, Z. P.; Kim, J. K.; Panula, L. 1992. Improved prediction model for time-dependent deformations of concrete: Part 5–Cyclic load and cyclic humidity. Materials and Struc-tures. (RILEM, Paris) 25 (147): 163–169.
Bažant, Z. P.; Baweja, S. 1995. Creep and shrinkage prediction model for analysis and design of concrete structures - model B3. Materials and Structures, 28(357–365): 415–430.
Bažant, Z. P.; Baweja, S. 2000. Creep and Shrinkage Prediction Model for Analysis and Design of Concrete Structures: Model B3–Short Form, Special Publication Vol.194. 30 p.
Bechyně, S.; 1959. Concrete Construction. I. Concrete Technology, SNTL, Prague: 122–136 (in Czech).
Bennett, E. W.; Raju, N. K. 1969. Cumulative Fatigue Damage of Plain Concrete in Com-pression,” International Conference on Structures, Solid Mechanics and Engineering De-sign in Civil Engineering Materials, University of Southampton, UK: 1089–1101.
Biggs, J.M. 1964. Introduction to Structural Dynamics. McGraw-Hill, New York. 341 p.
Brøndsted P.; Lilholt H.; Andersen S. I. 1997. Fatigue damage prediction by measure-ments of the stiffness degradation in polymer matrix composites. Degallaix S, Bathias C, Fougères R, editors. In International conference on fatigue of composites. Paris: ICFC. 370–377.
Buyukozturk, O. et al. 1988. Mathematical Modelling of Creep and Shrinkage of Con-crete, ISBN: 047192057-6, John Wiley & Sons., 275–310.
Chi, Z.; Chou, T.; Shen, G. 1984. Determination of Single Fibre Strength Distribution from Fibre Bundle Testing’s. Journal of Materials Science. Vol 19: 3319–3324.
Cholmianskij, М. М. 1997. Concrete and reinforced concrete. Deformability and strength. Moscow: Stroijzdat, 576 p. (in Russian)
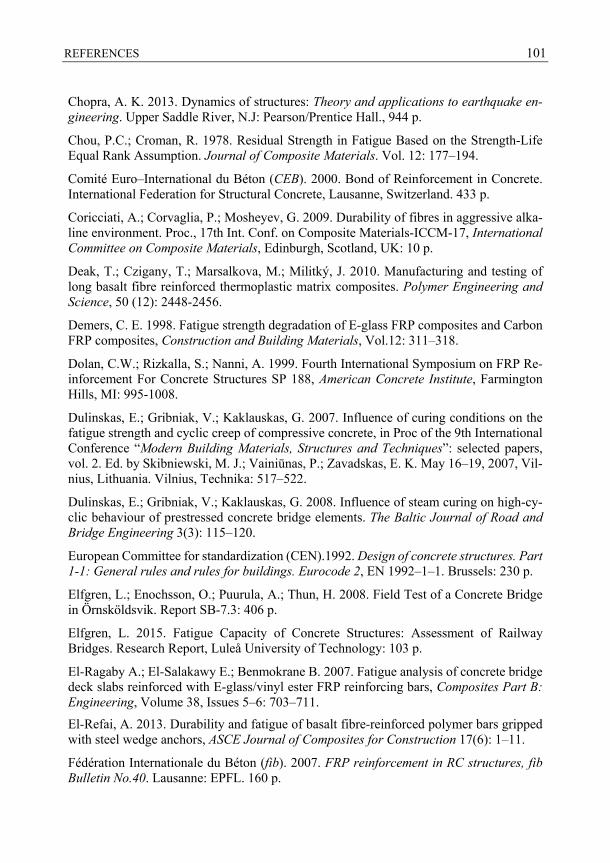
REFERENCES 101
Chopra, A. K. 2013. Dynamics of structures: Theory and applications to earthquake en-gineering. Upper Saddle River, N.J: Pearson/Prentice Hall., 944 p.
Chou, P.C.; Croman, R. 1978. Residual Strength in Fatigue Based on the Strength-Life Equal Rank Assumption. Journal of Composite Materials. Vol. 12: 177–194.
Comité Euro–International du Béton (CEB). 2000. Bond of Reinforcement in Concrete. International Federation for Structural Concrete, Lausanne, Switzerland. 433 p.
Coricciati, A.; Corvaglia, P.; Mosheyev, G. 2009. Durability of fibres in aggressive alka-line environment. Proc., 17th Int. Conf. on Composite Materials-ICCM-17, International Committee on Composite Materials, Edinburgh, Scotland, UK: 10 p.
Deak, T.; Czigany, T.; Marsalkova, M.; Militký, J. 2010. Manufacturing and testing of long basalt fibre reinforced thermoplastic matrix composites. Polymer Engineering and Science, 50 (12): 2448-2456.
Demers, C. E. 1998. Fatigue strength degradation of E-glass FRP composites and Carbon FRP composites, Construction and Building Materials, Vol.12: 311–318.
Dolan, C.W.; Rizkalla, S.; Nanni, A. 1999. Fourth International Symposium on FRP Re-inforcement For Concrete Structures SP 188, American Concrete Institute, Farmington Hills, MI: 995-1008.
Dulinskas, E.; Gribniak, V.; Kaklauskas, G. 2007. Influence of curing conditions on the fatigue strength and cyclic creep of compressive concrete, in Proc of the 9th International Conference “Modern Building Materials, Structures and Techniques”: selected papers, vol. 2. Ed. by Skibniewski, M. J.; Vainiūnas, P.; Zavadskas, E. K. May 16–19, 2007, Vil-nius, Lithuania. Vilnius, Technika: 517–522.
Dulinskas, E.; Gribniak, V.; Kaklauskas, G. 2008. Influence of steam curing on high-cy-clic behaviour of prestressed concrete bridge elements. The Baltic Journal of Road and Bridge Engineering 3(3): 115–120.
European Committee for standardization (CEN).1992. Design of concrete structures. Part 1-1: General rules and rules for buildings. Eurocode 2, EN 1992–1–1. Brussels: 230 p.
Elfgren, L.; Enochsson, O.; Puurula, A.; Thun, H. 2008. Field Test of a Concrete Bridge in Ӧrnskӧldsvik. Report SB-7.3: 406 p.
Elfgren, L. 2015. Fatigue Capacity of Concrete Structures: Assessment of Railway Bridges. Research Report, Luleå University of Technology: 103 p.
El-Ragaby A.; El-Salakawy E.; Benmokrane B. 2007. Fatigue analysis of concrete bridge deck slabs reinforced with E-glass/vinyl ester FRP reinforcing bars, Composites Part B: Engineering, Volume 38, Issues 5–6: 703–711.
El-Refai, A. 2013. Durability and fatigue of basalt fibre-reinforced polymer bars gripped with steel wedge anchors, ASCE Journal of Composites for Construction 17(6): 1–11.
Fédération Internationale du Béton (fib). 2007. FRP reinforcement in RC structures, fib Bulletin No.40. Lausanne: EPFL. 160 p.
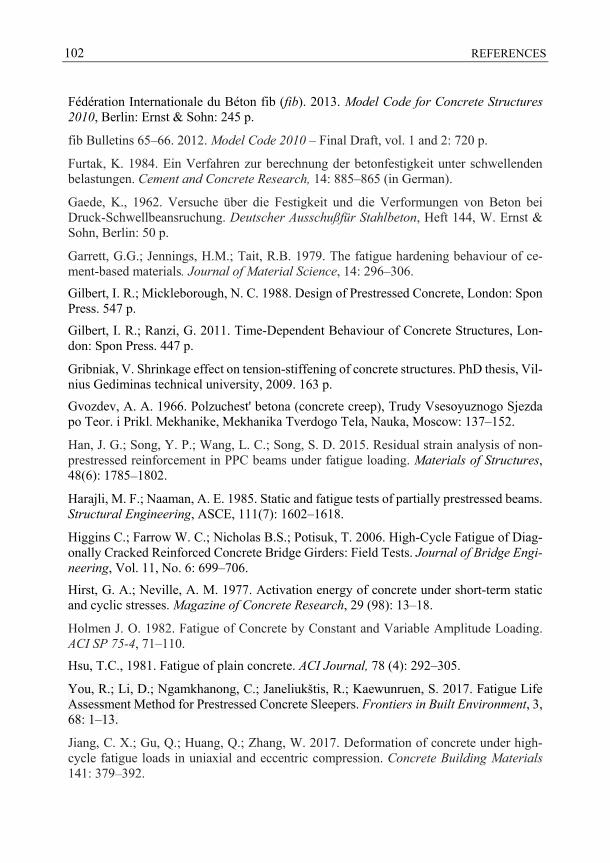
102 REFERENCES
Fédération Internationale du Béton fib (fib). 2013. Model Code for Concrete Structures 2010, Berlin: Ernst & Sohn: 245 p.
fib Bulletins 65–66. 2012. Model Code 2010 – Final Draft, vol. 1 and 2: 720 p.
Furtak, K. 1984. Ein Verfahren zur berechnung der betonfestigkeit unter schwellenden belastungen. Cement and Concrete Research, 14: 885–865 (in German).
Gaede, K., 1962. Versuche über die Festigkeit und die Verformungen von Beton bei Druck-Schwellbeansruchung. Deutscher Ausschußfür Stahlbeton, Heft 144, W. Ernst & Sohn, Berlin: 50 p.
Garrett, G.G.; Jennings, H.M.; Tait, R.B. 1979. The fatigue hardening behaviour of ce-ment-based materials. Journal of Material Science, 14: 296–306.
Gilbert, I. R.; Mickleborough, N. C. 1988. Design of Prestressed Concrete, London: Spon Press. 547 p.
Gilbert, I. R.; Ranzi, G. 2011. Time-Dependent Behaviour of Concrete Structures, Lon-don: Spon Press. 447 p.
Gribniak, V. Shrinkage effect on tension-stiffening of concrete structures. PhD thesis, Vil-nius Gediminas technical university, 2009. 163 p.
Gvozdev, A. A. 1966. Polzuchest' betona (concrete creep), Trudy Vsesoyuznogo Sjezda po Teor. i Prikl. Mekhanike, Mekhanika Tverdogo Tela, Nauka, Moscow: 137–152.
Han, J. G.; Song, Y. P.; Wang, L. C.; Song, S. D. 2015. Residual strain analysis of non-prestressed reinforcement in PPC beams under fatigue loading. Materials of Structures, 48(6): 1785–1802.
Harajli, M. F.; Naaman, A. E. 1985. Static and fatigue tests of partially prestressed beams. Structural Engineering, ASCE, 111(7): 1602–1618.
Higgins C.; Farrow W. C.; Nicholas B.S.; Potisuk, T. 2006. High-Cycle Fatigue of Diag-onally Cracked Reinforced Concrete Bridge Girders: Field Tests. Journal of Bridge Engi-neering, Vol. 11, No. 6: 699–706.
Hirst, G. A.; Neville, A. M. 1977. Activation energy of concrete under short-term static and cyclic stresses. Magazine of Concrete Research, 29 (98): 13–18.
Holmen J. O. 1982. Fatigue of Concrete by Constant and Variable Amplitude Loading. ACI SP 75-4, 71–110.
Hsu, T.C., 1981. Fatigue of plain concrete. ACI Journal, 78 (4): 292–305.
You, R.; Li, D.; Ngamkhanong, C.; Janeliukštis, R.; Kaewunruen, S. 2017. Fatigue Life Assessment Method for Prestressed Concrete Sleepers. Frontiers in Built Environment, 3, 68: 1–13.
Jiang, C. X.; Gu, Q.; Huang, Q.; Zhang, W. 2017. Deformation of concrete under high-cycle fatigue loads in uniaxial and eccentric compression. Concrete Building Materials 141: 379–392.
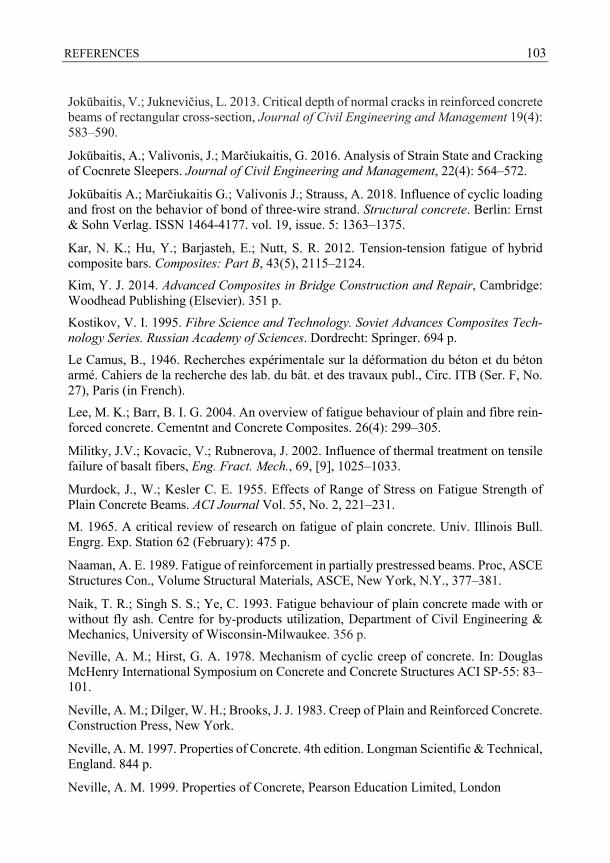
REFERENCES 103
Jokūbaitis, V.; Juknevičius, L. 2013. Critical depth of normal cracks in reinforced concrete beams of rectangular cross-section, Journal of Civil Engineering and Management 19(4): 583–590.
Jokūbaitis, A.; Valivonis, J.; Marčiukaitis, G. 2016. Analysis of Strain State and Cracking of Cocnrete Sleepers. Journal of Civil Engineering and Management, 22(4): 564–572.
Jokūbaitis A.; Marčiukaitis G.; Valivonis J.; Strauss, A. 2018. Influence of cyclic loading and frost on the behavior of bond of three‐wire strand. Structural concrete. Berlin: Ernst & Sohn Verlag. ISSN 1464-4177. vol. 19, issue. 5: 1363–1375.
Kar, N. K.; Hu, Y.; Barjasteh, E.; Nutt, S. R. 2012. Tension-tension fatigue of hybrid composite bars. Composites: Part B, 43(5), 2115–2124.
Kim, Y. J. 2014. Advanced Composites in Bridge Construction and Repair, Cambridge: Woodhead Publishing (Elsevier). 351 p.
Kostikov, V. I. 1995. Fibre Science and Technology. Soviet Advances Composites Tech-nology Series. Russian Academy of Sciences. Dordrecht: Springer. 694 p.
Le Camus, B., 1946. Recherches expérimentale sur la déformation du béton et du béton armé. Cahiers de la recherche des lab. du bât. et des travaux publ., Circ. ITB (Ser. F, No. 27), Paris (in French).
Lee, M. K.; Barr, B. I. G. 2004. An overview of fatigue behaviour of plain and fibre rein-forced concrete. Cementnt and Concrete Composites. 26(4): 299–305.
Militky, J.V.; Kovacic, V.; Rubnerova, J. 2002. Influence of thermal treatment on tensile failure of basalt fibers, Eng. Fract. Mech., 69, [9], 1025–1033.
Murdock, J., W.; Kesler C. E. 1955. Effects of Range of Stress on Fatigue Strength of Plain Concrete Beams. ACI Journal Vol. 55, No. 2, 221–231.
M. 1965. A critical review of research on fatigue of plain concrete. Univ. Illinois Bull. Engrg. Exp. Station 62 (February): 475 p.
Naaman, A. E. 1989. Fatigue of reinforcement in partially prestressed beams. Proc, ASCE Structures Con., Volume Structural Materials, ASCE, New York, N.Y., 377–381.
Naik, T. R.; Singh S. S.; Ye, C. 1993. Fatigue behaviour of plain concrete made with or without fly ash. Centre for by-products utilization, Department of Civil Engineering & Mechanics, University of Wisconsin-Milwaukee. 356 p.
Neville, A. M.; Hirst, G. A. 1978. Mechanism of cyclic creep of concrete. In: Douglas McHenry International Symposium on Concrete and Concrete Structures ACI SP-55: 83–101.
Neville, A. M.; Dilger, W. H.; Brooks, J. J. 1983. Creep of Plain and Reinforced Concrete. Construction Press, New York.
Neville, A. M. 1997. Properties of Concrete. 4th edition. Longman Scientific & Technical, England. 844 p.
Neville, A. M. 1999. Properties of Concrete, Pearson Education Limited, London
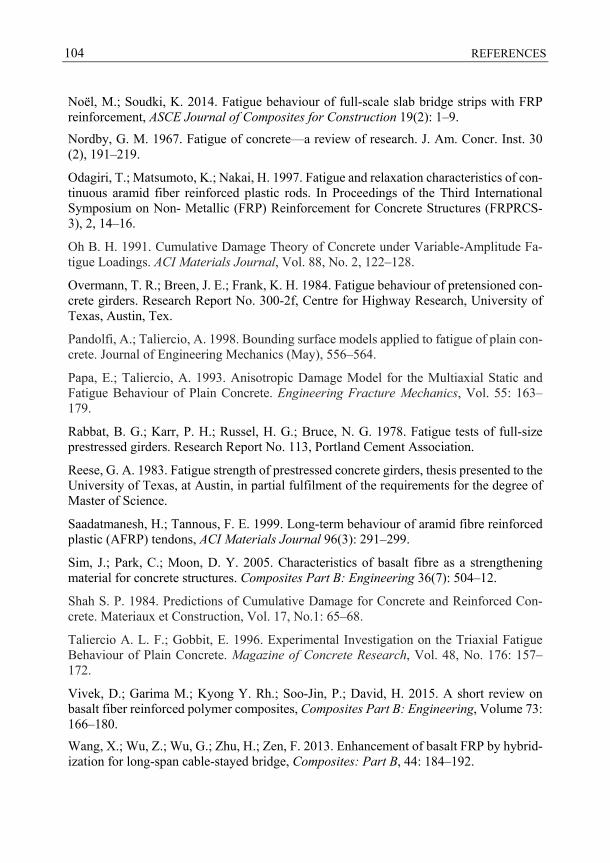
104 REFERENCES
Noël, M.; Soudki, K. 2014. Fatigue behaviour of full-scale slab bridge strips with FRP reinforcement, ASCE Journal of Composites for Construction 19(2): 1–9.
Nordby, G. M. 1967. Fatigue of concrete—a review of research. J. Am. Concr. Inst. 30 (2), 191–219.
Odagiri, T.; Matsumoto, K.; Nakai, H. 1997. Fatigue and relaxation characteristics of con-tinuous aramid fiber reinforced plastic rods. In Proceedings of the Third International Symposium on Non- Metallic (FRP) Reinforcement for Concrete Structures (FRPRCS-3), 2, 14–16.
Oh B. H. 1991. Cumulative Damage Theory of Concrete under Variable-Amplitude Fa-tigue Loadings. ACI Materials Journal, Vol. 88, No. 2, 122–128.
Overmann, T. R.; Breen, J. E.; Frank, K. H. 1984. Fatigue behaviour of pretensioned con-crete girders. Research Report No. 300-2f, Centre for Highway Research, University of Texas, Austin, Tex.
Pandolfi, A.; Taliercio, A. 1998. Bounding surface models applied to fatigue of plain con-crete. Journal of Engineering Mechanics (May), 556–564.
Papa, E.; Taliercio, A. 1993. Anisotropic Damage Model for the Multiaxial Static and Fatigue Behaviour of Plain Concrete. Engineering Fracture Mechanics, Vol. 55: 163–179.
Rabbat, B. G.; Karr, P. H.; Russel, H. G.; Bruce, N. G. 1978. Fatigue tests of full-size prestressed girders. Research Report No. 113, Portland Cement Association.
Reese, G. A. 1983. Fatigue strength of prestressed concrete girders, thesis presented to the University of Texas, at Austin, in partial fulfilment of the requirements for the degree of Master of Science.
Saadatmanesh, H.; Tannous, F. E. 1999. Long-term behaviour of aramid fibre reinforced plastic (AFRP) tendons, ACI Materials Journal 96(3): 291–299.
Sim, J.; Park, C.; Moon, D. Y. 2005. Characteristics of basalt fibre as a strengthening material for concrete structures. Composites Part B: Engineering 36(7): 504–12.
Shah S. P. 1984. Predictions of Cumulative Damage for Concrete and Reinforced Con-crete. Materiaux et Construction, Vol. 17, No.1: 65–68.
Taliercio A. L. F.; Gobbit, E. 1996. Experimental Investigation on the Triaxial Fatigue Behaviour of Plain Concrete. Magazine of Concrete Research, Vol. 48, No. 176: 157– 172.
Vivek, D.; Garima M.; Kyong Y. Rh.; Soo-Jin, P.; David, H. 2015. A short review on basalt fiber reinforced polymer composites, Composites Part B: Engineering, Volume 73: 166–180.
Wang, X.; Wu, Z.; Wu, G.; Zhu, H.; Zen, F. 2013. Enhancement of basalt FRP by hybrid-ization for long-span cable-stayed bridge, Composites: Part B, 44: 184–192.
REFERENCES 105
Wang, X; Shi, J; Liu, S; Yang, L; Wu, Z. 2014a. Creep behaviour of basalt fibre reinforced polymer tendons for prestressing application, Materials and Design, 59: 558–564.
Wang, X; W, G; Wu, Z; Dong, z; Xie, Q. 2014b. Evaluation of prestressed basalt fibre and hybrid fibre reinforced polymer tendons under marine environment, Materials and Design, 64: 721–728.
Wang, X; Shi, J; Wu, Z; Zhu, Z. 2016a. Fatigue Behaviour of Basalt Fibre-Reinforced Polymer Tendons for Prestressing Applications, ASCE Journal of Composites for Con-struction, 20 (3): 1–10.
Wang, X; Shi, J; Wu, Z; Zhu, Z. 2016b. Creep strain control by pretension for basalt fibre-reinforced polymer tendon in civil applications, Materials and Design, 89: 1270–1277.
Wittmann, V. F. 1971. Kriechverformung des Betons unter statischer und unter dyna-mischer Belastung. Rheol. Acta 10: 422–428.
Whaley, C. P.; Neville, A. M. 1973. Non-elastic deformation of concrete under cyclic compression. Magazine of Concrete Research, 25 (84): 145–154.
Xing, Zh.; Xin, W.; Zhishen, W.; Zhongguo, Z. 2016. Fatigue behaviour and failure mech-anism of basalt FRP composites under long-term cyclic loads, International Journal of Fatigue, Volume 88: 58–67.
Xue, W.; Tan, Y.; Zeng, L. 2010. Flexural response predictions of reinforced concrete beams strengthened with prestressed CFRP plates, Composite Structures 92(3): 612–622.
Zoghi, M. 2017. The International Handbook of FRP Composites in Civil Engineering, Taylor & Francis Group, 6000 Broken Sound Parkway NW, Suite 300, Boca Raton, FL 33487-2742, 665 p.
Zhou, Y.; Mallick, P. K. 2004. Fatigue Strength Characterization of E-Glass Fibres Using Fibre Bundle Test. Journal of Composite Materials. Vol. 38, No. 22: 2025–2035.
Zanuy, C.; Fuente, P.; Albajar, L. 2007. Effect of fatigue degradation of the compression zone of concrete in reinforced concrete sections. Engineering Structures, 29: 2908–2920.
Zhang, B.; Phillips, D. V.; Wu, K. 1996. Effect of loading frequency and stress reversal of fatigue life of plain concrete. Magazine of Concrete Research, 48; 177: 361–375.


107
List of Scientific Publications
by the Author on the Topic of the Dissertation
Publications in the Reviewed Scientific Journals
Atutis E.; Valivonis J.; Atutis M. 2019. Deflection determination method for BFRP pre-stressed concrete beams under fatigue loading. Composite Structures 226: 1–16. Oxford: Elsevier. ISSN 0263-8223. [Clarivate Analytics Web of Science, IF: 4.829].
Atutis, E.; Valivonis, J.; Atutis, M. 2018a. Experimental study of concrete beams pre-stressed with basalt fiber reinforced polymers under cyclic load. Composite Structures 183:389–396. Oxford: Elsevier. ISSN 0263-8223. [Clarivate Analytics Web of Science, IF: 4.193].
Atutis, M.; Valivonis J.; Atutis, E. 2018b. Experimental study of concrete beams prestressed with basalt fibre reinforced polymers. Part I: Flexural behaviour and service-ability, Composite Structures 183:114–123. Oxford: Elsevier. ISSN 0263-8223. [Clarivate Analytics Web of Science, IF: 4.193].
Atutis, M; Valivonis, J.; Atutis, E. 2018c. Experimental study of concrete beams pre-stressed with basalt fibre reinforced polymers. Part II: Stress relaxation phenomenon, Composite Structures 202:344–354. Oxford: Elsevier. ISSN 0263-8223. [Clarivate Analytics Web of Science, IF: 4.193].
108 LIST OF SCIENTIFIC PUBLICATIONS BY THE AUTHOR ON THE TOPIC OF THE …
Atutis, M; Valivonis J; Atutis, E. 2015. Analysis of serviceability limit state of GFRP prestressed concrete beams. Composite Structures 134: 450–459. Oxford: Elsevier. ISSN 0263-8223. [Clarivate Analytics Web of Science, IF: 4.193].
Atutis, E.; Budvytis, M.; Atutis, M. 2013a. Experimental study on the flexural and shear analysis of concrete beams reinforced with glass fibre-reinforced (GFRP) bars, Science – future of Lithuania: civil and transport engineering, aviation technologies 5(5): 467–473. Vilnius: Technika. ISSN 2029-2341. http://dx.doi.org/10.3846/mla.2013.73.
Atutis, E.; Valivonis, J.; Atutis, M. 2013b. Experimental analysis on flexural behaviour of concrete beams with GFRP reinforcement, Engineering Structures and Techniques, 5(2): 76–81. Vilnius: Technika. ISSN 2029-2317.
Publications in Conference Proceedings
Atutis, E.; Atutis, M.; Budvytis, M.; Valivonis, J. 2017. Serviceability and Shear Response of RC beams prestressed with various types of FRP bars, Procedia Engineering 172: 60–67. Modern Building Materials, Structures and Techniques (MBMST 2016). Amsterdam: Elsevier Ltd. ISSN 1877-7058.
109
Summary in Lithuanian
Įvadas Problemos formulavimas
Iš anksto įtemptojo gelžbetonio konstrukcijos yra plačiai naudojamos tokiuose statiniuose kaip tiltai, viadukai, naftos gavybos platformos, birių medžiagų talpyklos ir daugelyje kitų. Išankstinio armatūros įtempimo principas šiuose statiniuose naudojamas ne tik dėl pa-didėjusio konstrukcijos standumo, sumažėjusio pleišėjimo, padidėjusio konstrukcijos il-gaamžiškumo, tačiau ir dėl ekonominių aspektų. Iš anksto įtempiant plieninę armatūra galima sutaupyti net iki 30% naudojamų medžiagų kiekio.
Nepaisant daugybės įprasto ir iš anksto įtemptojo gelžbetonio privalumų, pagrindinis šių konstrukcijų trūkumas išlieka armatūros korozija. Korozijos pažeistų konstrukcijų ar statinių remontui pasaulyje kas met išleidžiami milijardai eurų. Prieš keletą dešimtmečių pasirodė galimas šios problemos sprendimas – polimerinės kompozitinės medžiagos. Sąlyginai nauja tokio tipo medžiaga gali būti laikoma bazalto pluoštu armuoti kompozitai. Bazalto pluoštu armuota kompozitinė armatūra (BFRP) pasižyminti geresnėmis fizi-kinėmis ir mechaninėmis savybėmis (pvz., šarminei aplinkai ir temperatūros poveikiams) lyginant su stiklo pluošto armatūra, o lyginant su anglies pluošto armatūra – turi pa-kankamai gerą atsparumą nuovargiui ir yra pigesnė. Nepaisant to, BFRP armatūros ek-sploatacinės savybės veikiant ciklinėms apkrovoms yra iki šiol tiriamos eksperimentiškai dėl tyrimų rezultatų trūkumo.
Literatūroje galima rasti nemažai iš anksto įtemptaja plienine armatūra armuotų kon-strukcijų, veikiamų ciklinėmis apkrovomis tyrimų. Priešinga situacija yra su konstrukcijų
110 SUMMARY IN LITHUANIAN
tyrimais, kai plieninė armatūra yra pakeičiama nemetalinė armatūra. Tam tikro tipo (sti-klo, aramido, anglies pluošto) nemetalinės armatūros nuovargio tyrimų rezultatų lit-eratūroje randama pakankamai nemažai, tačiau vis dar išlieka didelis bazalto pluošto ar-matūros tyrimų trūkumas.
Kompozitine armatūra armuotų konstrukcijų projektavimui normų, tokių kaip JSCE (1997), fib bulletin 40 (FIB), CSA-S806 ir ACI 440.4R, rekomendacijose randami nu-rodymai nuovargio efekto vertinimui, konstrukcijoms, armuotoms aramido, anglies arba stiklo pluošto armatūra. Bazalto pluošto armatūra armuotų konstrukcijų projektavimui rekomendacijų ir nurodymų nėra pateikiama. Todėl šiuo darbu siekiama išplėsti supratimą apie ciklinių (dinaminių) apkrovų veikiamų lenkiamųjų betoninių konstrukcijų, armuotų bazalto pluošto armatūra, elgseną. Be to, ypatingas dėmesys skiriamas tokių konstrukcijų tinkamumo ribiniam būviui – įlinkio pokyčiams ciklinės apkrovos veikimo laikotarpiu.
Darbo aktualumas
Betoninių konstrukcijų, armuotų plienine ar nemetaline armatūra ir veikiamų ciklinių apk-rovų elgsena skiriasi nuo statinėmis apkrovomis veikiamų konstrukcijų. Be to, tradicine plienine armatūra armuotų konstrukcijų eksploatacinėms savybės didelę įtaką daro aplin-kos poveikis. Dėl atsivėrusių plyšių galimas tokių konstrukcijų ilgaamžiškumo sumažėji-mas dėl plieninės armatūros korozijos. Kompozitinės armatūros panaudojimas gali padėti išspręsti korozijos problemą, tačiau atskiras dėmesys turėtų būti skiriamas ciklinės apkro-vos konstrukcijai sukeliamiems poveikiams įvertinti. Cikliškas įtempių ir deformacijų ki-timas skerspjūvyje sukelia betono ir armatūros pažaidas. Šie veiksniai turi įtakos konst-rukcijos saugos ir tinkamumo ribiniams būviams, bei iki šiol nėra galutinai ištirti. Todėl tik atliekant papildomus, kompleksiškus tyrimus galima nustatyti tiek atskirų medžiagų (betono ir BFRP armatūros), tiek bendros jų elgsenos ypatumus veikiant ciklinei apkrovai. Vertinant iš anksto įtemptųjų lenkiamųjų konstrukcijų, armuotų neplienine armatūra stan-dumo pokytį, svarbu įvertinti ciklinės apkrovos įtaką betono bei neplieninės armatūros mechaninių savybių pokyčiui. Tik esant tiksliems medžiagų fizikiniams modeliams ga-lima reikiamu patikimumu prognozuoti minėtų konstrukcijų elgseną visą jų eksploatacijos laikotarpį.
Tyrimo objektas
Darbe nagrinėjama ciklinės apkrovos įtaka betono ir bazalto pluošto armatūros mechani-nėms savybėms bei šia armatūra armuotų, iš anksto įtemptųjų betoninių sijų standumo pokyčiui.
Darbo tikslas
Disertacijos tikslas yra pasiūlyti bazalto pluošto armatūros, veikiamos ciklinių apkrovų, mechaninių savybių vertinimo ir šia armatūra armuotų iš anksto įtemptųjų sijų analitinį įlinkio apskaičiavimo modelius.
SUMMARY IN LITHUANIAN 111
Darbo uždaviniai
Darbo tikslui pasiekti sprendžiami šie uždaviniai:
1. Atlikti esamų ciklinių apkrovų veikiamo betono mechaninių savybių kitimo nus-tatymo metodų literatūros analizę, plačiau apžvelgiant betono valkšnumą dėl cik-linių apkrovų poveikio.
2. Apžvelgti esamus analitinius modelius, ciklinių apkrovų veikiamos BFRP arma-tūros mechaninių savybių pokyčiui nustatyti.
3. Pasiūlyti analitinį metodą BFRP armatūra armuotų iš anksto įtemptųjų lenkia-mųjų elementų, veikiamų ciklinių apkrovų, įlinkio nustatymui.
4. Atlikti BFRP armatūros nuovargio bei mechaninių savybių pokyčio dėl ciklinio apkrovos veikimo eksperimentinę analizę.
5. Atlikti BFRP armatūra armuotų iš anksto įtemptųjų sijų nuovargio bei įlinkio ki-timo dėl ciklinės apkrovos veikimo eksperimentinius tyrimus, veikiant skirtin-giems išankstiniams armatūros įtempiams bei ciklinės apkrovos amplitudėms.
6. Atlikti pasiūlyto analitinio metodo tikslumo analizę, lyginant eksperimentinius ir apskaičiuotus sijų įlinkio kitimo rezultatus.
Tyrimų metodika
Darbe taikomi statybinės mechanikos bei konstrukcijų dinamikos principai. Tiriamos betoninės sijos, armuotos iš anksto įtempta bazalto pluošto armatūra. Tiriamieji elementai aproksimuojami į vieno laisvumo laipsnio (VLL) dinaminę sistemą, keičiant jų tikrąją masę bei lenkiamąjį standumą į apibendrintąsias vertes. Pasitelkiant dinamikos lygtis aprašoma VLL sistemos pusiausvyra tarp vidinių, inercijos bei judesį žadinančių jėgų. Pateikiamas nehomogeninės diferencialinės lygties sprendinys, susidedantis iš dviejų de-damųjų – dalinio ir papildomo sprendinio. Papildomai atliekama literatūros analizė, siekiant apžvelgti betono ir BFRP armatūros mechaninių savybių pokyčius veikiant ci-klinei apkrovai. Betono ir BFRP armatūros mechaninių savybių pokyčiai įvertinami siūlomame įlinkių skaičiavimo metode. Siūlomo metodo tikslumui įvertinti atliekami ba-zato pluošto armatūros, bei iš anksto įtemptųjų sijų, veikiamų ciklinių apkrovų, eksperi-mentiniai tyrimai. Metodo adekvatumas įvertinamas atliekant teorinių ir eksperimentinių rezultatų statistinę analizę.
Darbo mokslinis naujumas
1. Remiantis eksperimentiniais tyrimais pasiūlyta BFRP armatūros įtempių ampli-tudes – atlaikomų apkrovos ciklų skaičiaus (Sr-N) priklausomybę nusakanti lygtis.
2. Pasiūlytas naujas BFRP armatūra armuotų iš anksto įtemptų sijų, veikiamų ci-klinės apkrovos bei paremtas konstrukcijų dinamika, įlinkio vertinimo metodas.
3. Gauti nauji BFRP armatūros tamprumo modulio kitimo dėl ciklinės apkrovos poveikio eksperimentiniai rezultatai bei pasiūlyta šį pokytį nusakanti lygtis.
112 SUMMARY IN LITHUANIAN
4. Gauti nauji BFRP armatūra armuotų iš anksto įtemptų sijų, veikiamų ciklinės apkrovos, eksperimentinių tyrimų rezultatai.
Darbo rezultatų praktinė reikšmė
Disertacijos rezultatai yra svarbūs vertinant kompozitais armuotos polimerinės armatūros nuovargio efektą dėl ciklinės apkrovos veikimo bei šio tipo armatūros tinkamumą iš anksto įtemptų konstrukcijų armavimui. Gauti nauji ir aktualūs bazalto pluošto armatūros veikiamos ciklinės apkrovos eksperimentinių tyrimų rezultatai. Remiantis gautais tyrimų rezultatais galima papildyti konstrukcijų armuotų FRP armatūra galiojančių projektavimo normų ir rekomendacijų nuostatas. Pasiūlytas gniuždomo betono, veikiamo ciklinių apk-rovų deformacijų prieaugio vertinimo, taip pat BFRP armatūros mechaninių savybių po-kyčio vertinimo modeliai dėl ciklinių apkrovų poveikio. Pasiūlytas įlinkio vertinimo me-todas, kuriame įvertinami prieš tai minėti modeliai gali būti naudojamas projektuotojų nustatant iš anksto įtemptųjų lenkiamųjų konstrukcijų įlinkius, esant situacijoms, kai jie atsiranda dėl dinaminių poveikių ir įlinkių kitimo laike nustatymas yra ypač aktualus.
Ginamieji teiginiai
1. Bazalto pluošto armatūros atsparumas nuovargiui gali būti laikomas pakankamu, kai ciklinės apkrovos sukeliamų maksimalių įtempių dydis neviršija 65 % ar-matūros tempiamojo stiprio ribos.
2. BRRP armatūra armuotų iš anksto įtemptų sijų atsparumas nuovargiui priklauso nuo šios armatūros išankstinio įtempimo dydžio bei ciklinės apkrovos ampli-tudes. Remiantis gautais tyrimų rezultatais nustatyta, kad optimalus išankstinio įtempimo lygis BFRP armatūroje lygus 45 % šios armatūros tempiamojo stiprio ribos.
3. Iš anksto įtemptųjų lenkiamųjų betoninių konstrukcijų, armuotų BFRP armatūra, minimalių ir maksimalių įtempių tempiamoje armatūroje santykis (R) turėtų būti didesnis nei 0,88.
4. Pasiūlyta apibendrintojo standumo ke išraiška leidžia pakankamai tiksliai nustatyti lenkiamųjų elementų, armuotų iš anksto įtempta BFRP armatūra įlinkį, kaip vieno laisvumo laipsnio sistemos poslinkį. Be to, pasitelkiant apibendrintojo standumo išraišką ke galima nustatyti sijos savųjų svyravimų dažnį.
5. Pasiūlytas BFRP armatūra armuotų iš anksto įtemptų sijų įlinkio nustatymo metodas, vertinantis betono ciklinį valkšnumą bei galimą BFRP armatūros mechaninių savybių (tamprumo modulio) pokytį dėl ciklinio apkrovos pobūdžio yra pakankamai tikslus.
Darbo rezultatų aprobavimas
Disertacijos tema paskelbti 8 moksliniai straipsniai, iš kurių 5 – žurnaluose turinčiuose cituojamumo rodiklį, 1 – konferencijų rinkiniuose referuojamuose Clarivate Analysis Web
SUMMARY IN LITHUANIAN 113
of Science duomenų bazėje ir 1 – kitų tarptautinių duomenų bazių leidiniuose. Disertaci-joje atliktų tyrimų rezultatai buvo paskelbti 5 pranešimuose 5 konferencijose Lietuvoje ir užsienyje:
– 17-oji Jaunųjų mokslininkų konferencijoje Lietuva be mokslo – Lietuva be atei-ties, Vilnius, Lietuva, 2014;
– 18-oji tarptautinė konferencija 18th International Conference on Composite Structures, Lisabona, Portugalija, 2015;
– 12-oji tarptautinė konferencija „Modern Building Materials, Structures and Tech-niques“, Vilnius, Lietuva, 2016;
– 19-oji tarptautinė konferencija 19th International Conference on Composite Structures, Porto, Portugalija, 2016;
– 5-oji tarptautinė konferencija 5th International Conference on Mechanics of Composites, Lisabona, Portugalija, 2019.
Disertacijos struktūra
Disertaciją sudaro įvadas, 3 skyriai, bendrosios išvados, autoriaus mokslinių publikacijų disertacijos tema sąrašas (8 publikacijos), santrauka lietuvių kalba ir 3 priedai.
Disertacijos apimtis – 124 puslapiai. Tekste panaudoti 44 paveikslai, 10 lentelių, 164 formulės ir 100 literatūros šaltinių.
Padėka
Autorius nori išreikšti nuoširdžią padėką savo mokslinio darbo vadovui, Gelžbetoninių konstrukcijų ir geotechnikos katedros vedėjui prof. dr. Juozui Valivoniui už puikią lyderystę, vertingas žinias ir patarimus bei motyvaciją visu disertacinio darbo rengimo metu. Disertacijos autorius taip pat dėkoja doc. dr. Robertui Balevičiui, doc. dr. Broniui Jonaičiui, už idėjas ir patarimus, taip pat kolegai dr. Aidui Jokūbaičiui už geranorišką pa-galbą atliekant eksperimentinius tyrimus. Už reikšmingas pastabas ir rekomendacijas, ku-rios padėjo pagerinti disertacinio darbo kokybę, autorius dėkoja doc. dr. Dariui Bačinskui, prof. dr. Romualdui Kliukui ir dr. Rimvydui Stoniui.
Taip pat, autorius širdingai dėkoja, tėveliams Petrui ir Audrutei, broliui Mantui už jų visokeriopą pagalbą rengiant šį darbą. Labiausiai autorius dėkoja savo mylimai žmonai Simonai bei vaikams Medeinai ir Margiriui.
1. Neplienine armatūra armuotų iš anksto įtemptų konstrukcijų elgsenos bei suirimo dėl nuovargio literatūros apžvalga
Pirmajame disertacijos skyriuje aprašomi nemetaline armatūra armuotų iš anksto įtempto gelžbetonio konstrukcijų elgsenos tyrimai veikiant ciklinėms apkrovoms. Analizuojamas minėtos apkrovos poveikis tiek bendram konstrukcijos darbui tiek betonui bei FRP ar-matūrai atskirai. Nagrinėjami FRP armatūros suirimą dėl nuovargio lemiantys veiksniai.
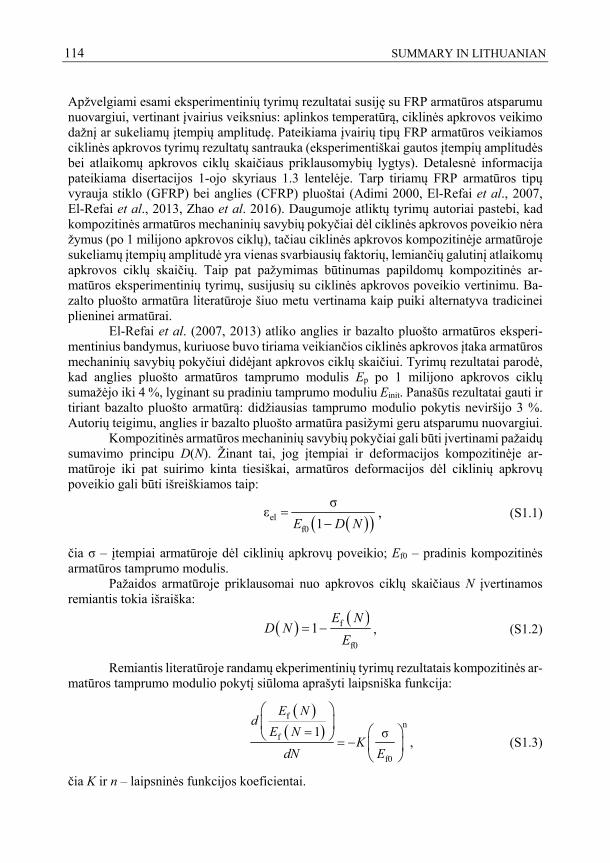
114 SUMMARY IN LITHUANIAN
Apžvelgiami esami eksperimentinių tyrimų rezultatai susiję su FRP armatūros atsparumu nuovargiui, vertinant įvairius veiksnius: aplinkos temperatūrą, ciklinės apkrovos veikimo dažnį ar sukeliamų įtempių amplitudę. Pateikiama įvairių tipų FRP armatūros veikiamos ciklinės apkrovos tyrimų rezultatų santrauka (eksperimentiškai gautos įtempių amplitudės bei atlaikomų apkrovos ciklų skaičiaus priklausomybių lygtys). Detalesnė informacija pateikiama disertacijos 1-ojo skyriaus 1.3 lentelėje. Tarp tiriamų FRP armatūros tipų vyrauja stiklo (GFRP) bei anglies (CFRP) pluoštai (Adimi 2000, El-Refai et al., 2007, El-Refai et al., 2013, Zhao et al. 2016). Daugumoje atliktų tyrimų autoriai pastebi, kad kompozitinės armatūros mechaninių savybių pokyčiai dėl ciklinės apkrovos poveikio nėra žymus (po 1 milijono apkrovos ciklų), tačiau ciklinės apkrovos kompozitinėje armatūroje sukeliamų įtempių amplitudė yra vienas svarbiausių faktorių, lemiančių galutinį atlaikomų apkrovos ciklų skaičių. Taip pat pažymimas būtinumas papildomų kompozitinės ar-matūros eksperimentinių tyrimų, susijusių su ciklinės apkrovos poveikio vertinimu. Ba-zalto pluošto armatūra literatūroje šiuo metu vertinama kaip puiki alternatyva tradicinei plieninei armatūrai. El-Refai et al. (2007, 2013) atliko anglies ir bazalto pluošto armatūros eksperi-mentinius bandymus, kuriuose buvo tiriama veikiančios ciklinės apkrovos įtaka armatūros mechaninių savybių pokyčiui didėjant apkrovos ciklų skaičiui. Tyrimų rezultatai parodė, kad anglies pluošto armatūros tamprumo modulis Ep po 1 milijono apkrovos ciklų sumažėjo iki 4 %, lyginant su pradiniu tamprumo moduliu Einit. Panašūs rezultatai gauti ir tiriant bazalto pluošto armatūrą: didžiausias tamprumo modulio pokytis neviršijo 3 %. Autorių teigimu, anglies ir bazalto pluošto armatūra pasižymi geru atsparumu nuovargiui. Kompozitinės armatūros mechaninių savybių pokyčiai gali būti įvertinami pažaidų sumavimo principu D(N). Žinant tai, jog įtempiai ir deformacijos kompozitinėje ar-matūroje iki pat suirimo kinta tiesiškai, armatūros deformacijos dėl ciklinių apkrovų poveikio gali būti išreiškiamos taip:
elf0
σε
1E D N
, (S1.1)
čia σ – įtempiai armatūroje dėl ciklinių apkrovų poveikio; Ef0 – pradinis kompozitinės armatūros tamprumo modulis. Pažaidos armatūroje priklausomai nuo apkrovos ciklų skaičiaus N įvertinamos remiantis tokia išraiška:
f
f0
1E N
D NE
, (S1.2)
Remiantis literatūroje randamų ekperimentinių tyrimų rezultatais kompozitinės ar-matūros tamprumo modulio pokytį siūloma aprašyti laipsniška funkcija:
f
n
f
f0
1 σ
E Nd
E NK
dN E
, (S1.3)
čia K ir n – laipsninės funkcijos koeficientai.
SUMMARY IN LITHUANIAN 115
Integruojant S1.3 formulę gaunama tokia kompozitinės armatūros tamprumo mod-ulio pokyčio priklausomybė didėjant apkrovos ciklų skaičiui:
n
f
f f0
σ1
1
E NK N
E N E
. (S1.4)
Darbe taip pat aptariami įvairių autorių pasiūlyti bei galiojančių projektavimo normų betono ilgalaikių savybių, tokių kaip statinis ir ciklinis valkšnumas, nustatymo metodai (Gaede 1962, Wittmann 1971, Hirst ir Neville 1977, Balaguru 1981, Bažant ir Hubler 2014, Jiang et al. 2017). Remiantis dauguma siūloma metodų, betono gniuždomiesiems įtempiams neviršijant 45 % gniuždomojo stiprio ribos, gaunami pa-kankamai tikslūs betono deformacijų nustatymo rezultatai. Esant didesniems gniuždo-mojo betono įtempiams siūlomų metodų tikslumas ženkliai sumažėja. Atlikus analitinę analizę aprašomi skirtumai tarp anksčiau paminėtų siūlomų metodų. Pastebėta, kad Bažant ir Baweja (dar vadinamu B3) modelyje betono traukumo deformacijos nustatomos labai artimos Model Code 2010 modeliui, tačiau statinio valkšnumo vertės išsiskiria. Bažant ir Hubler (2014) pasiūlė metodą ciklinio valkšnumo įvertinimui naudojant ciklinio valkšnumo funkciją ΔJN, kaip statinio valkšnumo funkcijos J(t,t0) prieaugį. Panašiu prin-cipu grįsti ir kiti metodai (Balaguru 1981, Jiang et al. 2017). Skirtingai nuo kitų metodų, autorių Bažant ir Hubler (2014) pasiūlytame įlinkio apskaičiavimo metode ciklinis valkšnumas yra išreiškiamas tiesine priklausomybe nuo laiko (ciklinės apkrovos veikimo trukmės). Remiantis Jiang et at. (2017) siūlomu metodu betono valkšniąsias deformacijas, veikiant ciklinei apkrovai, galima nustatyti ir atvejais, kai gniuždomojo betono įtempiai viršija 45 % gniuždomojo stiprio ribos. Eksperimentiniuose tyrimuose, betono gniuždomųjų įtempių reikšmės siekė net 60%, 70% ir net 80% betono gniuždomojo stiprio. Taip pat trumpai apžvelgti siūlomi betono atsparumo nuovargiui vertinimo metodai pagal Eurokodas 2, Model Code 2010 ir ACI215R-74 metodikas. Detaliau aprašyti ir esami iš anksto įtemptų sijų įlinkio, veikiant ciklinėms apkrovoms, nustatymo metodai, tačiau jie visi skirti elementams armuotiems plienine armatūra (Balaguru 1981, Bažant ir Hubler 2014, Jiang et al. 2017). Jiang et al. (2017) siūlomame įlinkio nustatymo metode priimama prielaida, kad po tam tikro apkrovos ciklų skaičiaus kirstinis betono tamprumo modulis išlieka nepakitęs, lyginant su pradiniu betono tamprumo moduliu. Bažant ir Hubler (2014) pasiūlytame metode lenkiamų elementų kreivio pokytis dėl bet-ono ciklinio valkšnumo sukeliamo deformacijų pokyčio įvertinamas papildomai įvedant fiktyvią jėgą bei fiktyvų lenkimo momentą. Šis principas yra panašus į literatūroje sutinka-mus siūlymus betono traukumo deformacijų įvertinimui, bei deformacijų kitimo dėl tem-peratūrų poveikio vertinime. Apžvelgti metodai grįsti prielaida, kad ciklinių apkrovų sukeliamas įlinkis gali būti nustatomas metodais, skirtais statinių apkrovų sukeliamų įlinkių skaičiavimui su tam tikromis prielaidomis. Kadangi siūlomi metodai skirti iš anksto įtemptųjų lenkiamųjų el-ementų, armuotų plienine armatūra bei veikiamų ciklinių apkrovų įlinkio nustatymui, ne-galima vienareikšmiškai teigti, kad jie gali būti tinkami kompozitine armatūra armuotų
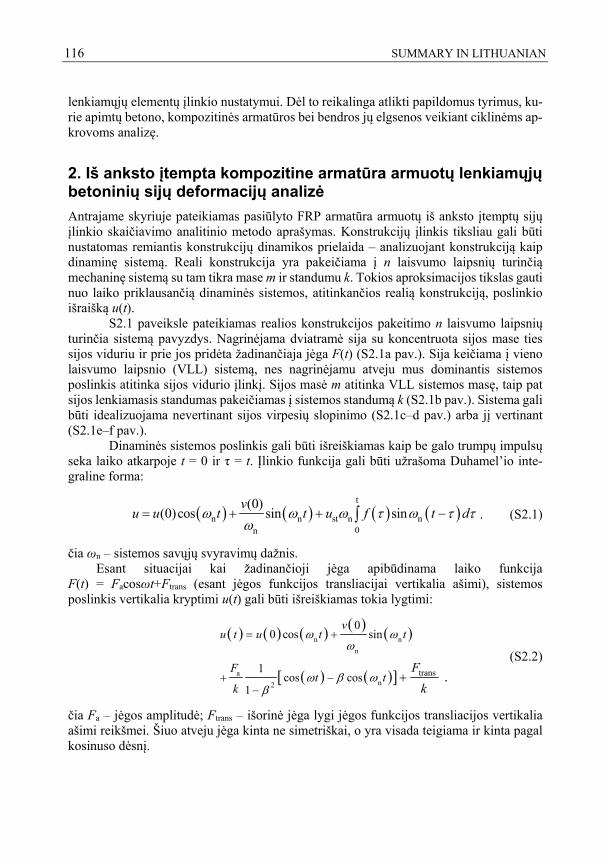
116 SUMMARY IN LITHUANIAN
lenkiamųjų elementų įlinkio nustatymui. Dėl to reikalinga atlikti papildomus tyrimus, ku-rie apimtų betono, kompozitinės armatūros bei bendros jų elgsenos veikiant ciklinėms ap-krovoms analizę.
2. Iš anksto įtempta kompozitine armatūra armuotų lenkiamųjų betoninių sijų deformacijų analizė
Antrajame skyriuje pateikiamas pasiūlyto FRP armatūra armuotų iš anksto įtemptų sijų įlinkio skaičiavimo analitinio metodo aprašymas. Konstrukcijų įlinkis tiksliau gali būti nustatomas remiantis konstrukcijų dinamikos prielaida – analizuojant konstrukciją kaip dinaminę sistemą. Reali konstrukcija yra pakeičiama į n laisvumo laipsnių turinčią mechaninę sistemą su tam tikra mase m ir standumu k. Tokios aproksimacijos tikslas gauti nuo laiko priklausančią dinaminės sistemos, atitinkančios realią konstrukciją, poslinkio išraišką u(t). S2.1 paveiksle pateikiamas realios konstrukcijos pakeitimo n laisvumo laipsnių turinčia sistemą pavyzdys. Nagrinėjama dviatramė sija su koncentruota sijos mase ties sijos viduriu ir prie jos pridėta žadinančiaja jėga F(t) (S2.1a pav.). Sija keičiama į vieno laisvumo laipsnio (VLL) sistemą, nes nagrinėjamu atveju mus dominantis sistemos poslinkis atitinka sijos vidurio įlinkį. Sijos masė m atitinka VLL sistemos masę, taip pat sijos lenkiamasis standumas pakeičiamas į sistemos standumą k (S2.1b pav.). Sistema gali būti idealizuojama nevertinant sijos virpesių slopinimo (S2.1c–d pav.) arba jį vertinant (S2.1e–f pav.). Dinaminės sistemos poslinkis gali būti išreiškiamas kaip be galo trumpų impulsų seka laiko atkarpoje t = 0 ir τ = t. Įlinkio funkcija gali būti užrašoma Duhamel’io inte-graline forma:
t
n n st n n0n
(0)(0)cos sin sin
vu u t t u f t d
. (S2.1)
čia ωn – sistemos savųjų svyravimų dažnis. Esant situacijai kai žadinančioji jėga apibūdinama laiko funkcija
F(t) = Facosωt+Ftrans (esant jėgos funkcijos transliacijai vertikalia ašimi), sistemos poslinkis vertikalia kryptimi u(t) gali būti išreiškiamas tokia lygtimi:
n n
n
an2
trans
00 cos sin
1cos cos
1 .
vu t u t t
Ft t
k
F
k
(S2.2)
čia Fa – jėgos amplitudė; Ftrans – išorinė jėga lygi jėgos funkcijos transliacijos vertikalia ašimi reikšmei. Šiuo atveju jėga kinta ne simetriškai, o yra visada teigiama ir kinta pagal kosinuso dėsnį.
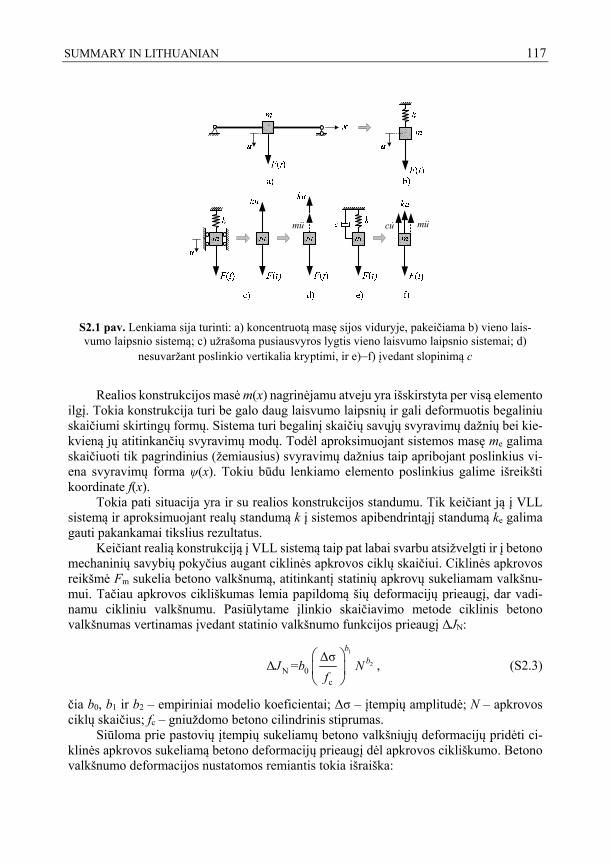
SUMMARY IN LITHUANIAN 117
mu mucu
S2.1 pav. Lenkiama sija turinti: a) koncentruotą masę sijos viduryje, pakeičiama b) vieno lais-vumo laipsnio sistemą; c) užrašoma pusiausvyros lygtis vieno laisvumo laipsnio sistemai; d)
nesuvaržant poslinkio vertikalia kryptimi, ir e)–f) įvedant slopinimą c
Realios konstrukcijos masė m(x) nagrinėjamu atveju yra išskirstyta per visą elemento ilgį. Tokia konstrukcija turi be galo daug laisvumo laipsnių ir gali deformuotis begaliniu skaičiumi skirtingų formų. Sistema turi begalinį skaičių savųjų svyravimų dažnių bei kie-kvieną jų atitinkančių svyravimų modų. Todėl aproksimuojant sistemos masę me galima skaičiuoti tik pagrindinius (žemiausius) svyravimų dažnius taip apribojant poslinkius vi-ena svyravimų forma ψ(x). Tokiu būdu lenkiamo elemento poslinkius galime išreikšti koordinate f(x).
Tokia pati situacija yra ir su realios konstrukcijos standumu. Tik keičiant ją į VLL sistemą ir aproksimuojant realų standumą k į sistemos apibendrintąjį standumą ke galima gauti pakankamai tikslius rezultatus.
Keičiant realią konstrukciją į VLL sistemą taip pat labai svarbu atsižvelgti ir į betono mechaninių savybių pokyčius augant ciklinės apkrovos ciklų skaičiui. Ciklinės apkrovos reikšmė Fm sukelia betono valkšnumą, atitinkantį statinių apkrovų sukeliamam valkšnu-mui. Tačiau apkrovos cikliškumas lemia papildomą šių deformacijų prieaugį, dar vadi-namu cikliniu valkšnumu. Pasiūlytame įlinkio skaičiavimo metode ciklinis betono valkšnumas vertinamas įvedant statinio valkšnumo funkcijos prieaugį ΔJN:
1
2N 0
c
ΔσΔ =
b
bJ b Nf
, (S2.3)
čia b0, b1 ir b2 – empiriniai modelio koeficientai; Δσ – įtempių amplitudė; N – apkrovos ciklų skaičius; fc – gniuždomo betono cilindrinis stiprumas. Siūloma prie pastovių įtempių sukeliamų betono valkšniųjų deformacijų pridėti ci-klinės apkrovos sukeliamą betono deformacijų prieaugį dėl apkrovos cikliškumo. Betono valkšnumo deformacijos nustatomos remiantis tokia išraiška:
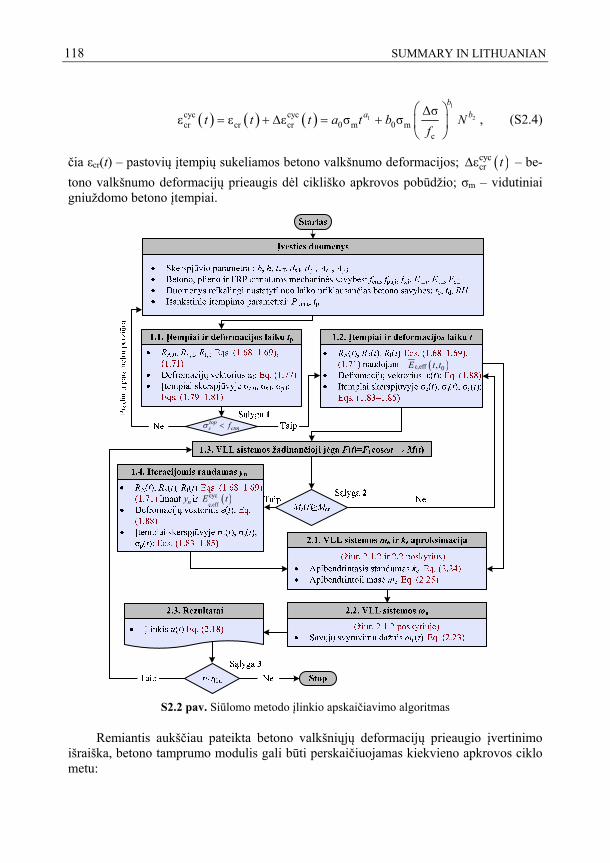
118 SUMMARY IN LITHUANIAN
1
1 2cyc cyccr cr cr 0 m 0 m
c
Δσε ε ε σ σ
b
a bt t t a t b Nf
, (S2.4)
čia εcr(t) – pastovių įtempių sukeliamos betono valkšnumo deformacijos; cyccrε t – be-
tono valkšnumo deformacijų prieaugis dėl cikliško apkrovos pobūdžio; σm – vidutiniai gniuždomo betono įtempiai.
c,eff 0,E t t
ny c,eff
cycE t
topc ctmf
S2.2 pav. Siūlomo metodo įlinkio apskaičiavimo algoritmas
Remiantis aukščiau pateikta betono valkšniųjų deformacijų prieaugio įvertinimo išraiška, betono tamprumo modulis gali būti perskaičiuojamas kiekvieno apkrovos ciklo metu:
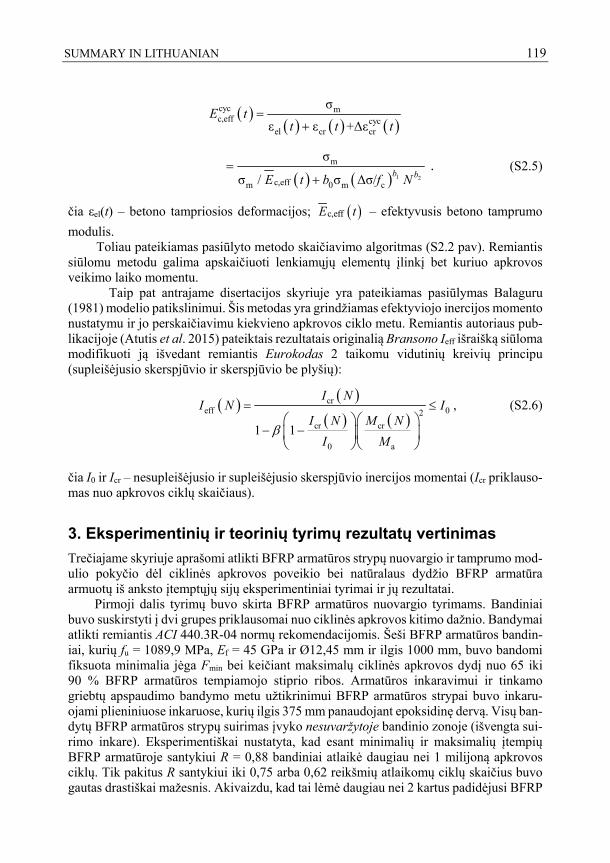
SUMMARY IN LITHUANIAN 119
cyc mc,eff cyc
el cr cr
σ
ε ε +ΔεE t
t t t
1 2
m
c,effm 0 m c
σ
σ / σ Δσ/ .
b bE t b f N
(S2.5)
čia εel(t) – betono tampriosios deformacijos; c,effE t – efektyvusis betono tamprumo
modulis. Toliau pateikiamas pasiūlyto metodo skaičiavimo algoritmas (S2.2 pav). Remiantis siūlomu metodu galima apskaičiuoti lenkiamųjų elementų įlinkį bet kuriuo apkrovos veikimo laiko momentu. Taip pat antrajame disertacijos skyriuje yra pateikiamas pasiūlymas Balaguru (1981) modelio patikslinimui. Šis metodas yra grindžiamas efektyviojo inercijos momento nustatymu ir jo perskaičiavimu kiekvieno apkrovos ciklo metu. Remiantis autoriaus pub-likacijoje (Atutis et al. 2015) pateiktais rezultatais originalią Bransono Ieff išraišką siūloma modifikuoti ją išvedant remiantis Eurokodas 2 taikomu vidutinių kreivių principu (supleišėjusio skerspjūvio ir skerspjūvio be plyšių):
cr
eff 02
cr cr
0 a
1 1
I NI N I
I N M N
I M
, (S2.6)
čia I0 ir Icr – nesupleišėjusio ir supleišėjusio skerspjūvio inercijos momentai (Icr priklauso-mas nuo apkrovos ciklų skaičiaus).
3. Eksperimentinių ir teorinių tyrimų rezultatų vertinimas
Trečiajame skyriuje aprašomi atlikti BFRP armatūros strypų nuovargio ir tamprumo mod-ulio pokyčio dėl ciklinės apkrovos poveikio bei natūralaus dydžio BFRP armatūra armuotų iš anksto įtemptųjų sijų eksperimentiniai tyrimai ir jų rezultatai. Pirmoji dalis tyrimų buvo skirta BFRP armatūros nuovargio tyrimams. Bandiniai buvo suskirstyti į dvi grupes priklausomai nuo ciklinės apkrovos kitimo dažnio. Bandymai atlikti remiantis ACI 440.3R-04 normų rekomendacijomis. Šeši BFRP armatūros bandin-iai, kurių fu = 1089,9 MPa, Ef = 45 GPa ir Ø12,45 mm ir ilgis 1000 mm, buvo bandomi fiksuota minimalia jėga Fmin bei keičiant maksimalų ciklinės apkrovos dydį nuo 65 iki 90 % BFRP armatūros tempiamojo stiprio ribos. Armatūros inkaravimui ir tinkamo griebtų apspaudimo bandymo metu užtikrinimui BFRP armatūros strypai buvo inkaru-ojami plieniniuose inkaruose, kurių ilgis 375 mm panaudojant epoksidinę dervą. Visų ban-dytų BFRP armatūros strypų suirimas įvyko nesuvaržytoje bandinio zonoje (išvengta sui-rimo inkare). Eksperimentiškai nustatyta, kad esant minimalių ir maksimalių įtempių BFRP armatūroje santykiui R = 0,88 bandiniai atlaikė daugiau nei 1 milijoną apkrovos ciklų. Tik pakitus R santykiui iki 0,75 arba 0,62 reikšmių atlaikomų ciklų skaičius buvo gautas drastiškai mažesnis. Akivaizdu, kad tai lėmė daugiau nei 2 kartus padidėjusi BFRP
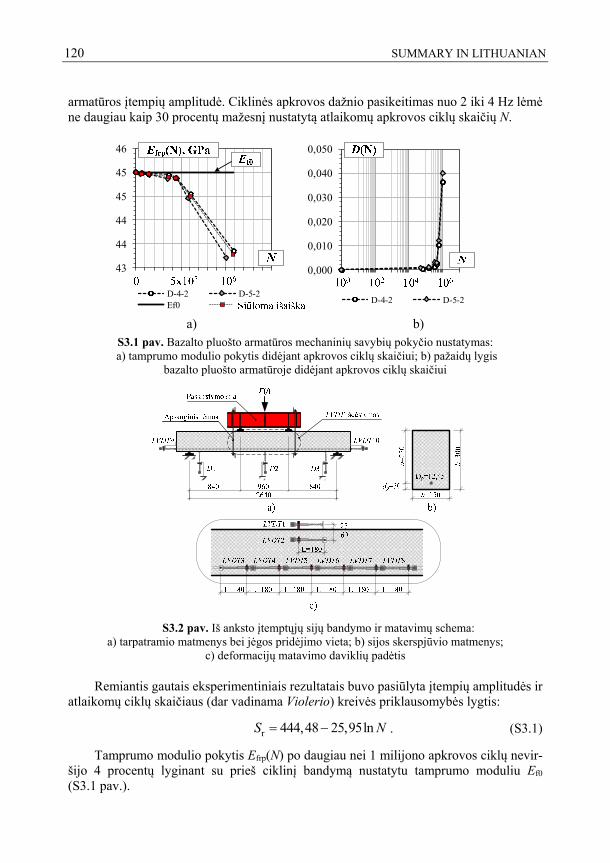
120 SUMMARY IN LITHUANIAN
armatūros įtempių amplitudė. Ciklinės apkrovos dažnio pasikeitimas nuo 2 iki 4 Hz lėmė ne daugiau kaip 30 procentų mažesnį nustatytą atlaikomų apkrovos ciklų skaičių N.
43
44
44
45
45
46
10^ 10^ 10^ 10^D-4-2 D-5-2Ef0 Proposed
0,000
0,010
0,020
0,030
0,040
0,050
10^ 10^ 10^ 10^
D-4-2 D-5-2
a) b)
S3.1 pav. Bazalto pluošto armatūros mechaninių savybių pokyčio nustatymas: a) tamprumo modulio pokytis didėjant apkrovos ciklų skaičiui; b) pažaidų lygis
bazalto pluošto armatūroje didėjant apkrovos ciklų skaičiui
S3.2 pav. Iš anksto įtemptųjų sijų bandymo ir matavimų schema:
a) tarpatramio matmenys bei jėgos pridėjimo vieta; b) sijos skerspjūvio matmenys; c) deformacijų matavimo daviklių padėtis
Remiantis gautais eksperimentiniais rezultatais buvo pasiūlyta įtempių amplitudės ir atlaikomų ciklų skaičiaus (dar vadinama Violerio) kreivės priklausomybės lygtis:
r 444,48 25,95lnS N . (S3.1)
Tamprumo modulio pokytis Efrp(N) po daugiau nei 1 milijono apkrovos ciklų nevir-šijo 4 procentų lyginant su prieš ciklinį bandymą nustatytu tamprumo moduliu Ef0 (S3.1 pav.).
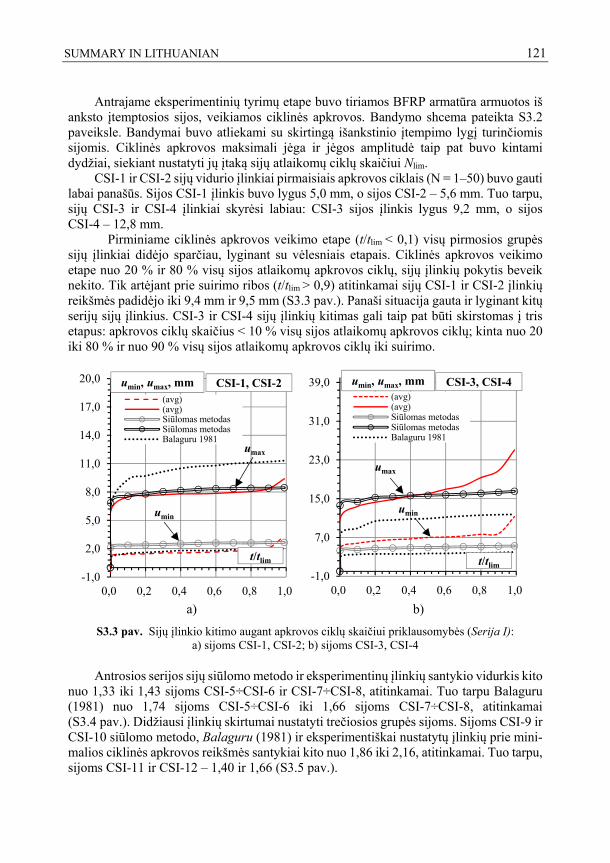
SUMMARY IN LITHUANIAN 121
Antrajame eksperimentinių tyrimų etape buvo tiriamos BFRP armatūra armuotos iš anksto įtemptosios sijos, veikiamos ciklinės apkrovos. Bandymo shcema pateikta S3.2 paveiksle. Bandymai buvo atliekami su skirtingą išankstinio įtempimo lygį turinčiomis sijomis. Ciklinės apkrovos maksimali jėga ir jėgos amplitudė taip pat buvo kintami dydžiai, siekiant nustatyti jų įtaką sijų atlaikomų ciklų skaičiui Nlim.
CSI-1 ir CSI-2 sijų vidurio įlinkiai pirmaisiais apkrovos ciklais (N = 1–50) buvo gauti labai panašūs. Sijos CSI-1 įlinkis buvo lygus 5,0 mm, o sijos CSI-2 – 5,6 mm. Tuo tarpu, sijų CSI-3 ir CSI-4 įlinkiai skyrėsi labiau: CSI-3 sijos įlinkis lygus 9,2 mm, o sijos CSI-4 – 12,8 mm.
Pirminiame ciklinės apkrovos veikimo etape (t/tlim < 0,1) visų pirmosios grupės sijų įlinkiai didėjo sparčiau, lyginant su vėlesniais etapais. Ciklinės apkrovos veikimo etape nuo 20 % ir 80 % visų sijos atlaikomų apkrovos ciklų, sijų įlinkių pokytis beveik nekito. Tik artėjant prie suirimo ribos (t/tlim > 0,9) atitinkamai sijų CSI-1 ir CSI-2 įlinkių reikšmės padidėjo iki 9,4 mm ir 9,5 mm (S3.3 pav.). Panaši situacija gauta ir lyginant kitų serijų sijų įlinkius. CSI-3 ir CSI-4 sijų įlinkių kitimas gali taip pat būti skirstomas į tris etapus: apkrovos ciklų skaičius < 10 % visų sijos atlaikomų apkrovos ciklų; kinta nuo 20 iki 80 % ir nuo 90 % visų sijos atlaikomų apkrovos ciklų iki suirimo.
a) b)
S3.3 pav. Sijų įlinkio kitimo augant apkrovos ciklų skaičiui priklausomybės (Serija I): a) sijoms CSI-1, CSI-2; b) sijoms CSI-3, CSI-4
Antrosios serijos sijų siūlomo metodo ir eksperimentinų įlinkių santykio vidurkis kito nuo 1,33 iki 1,43 sijoms CSI-5÷CSI-6 ir CSI-7÷CSI-8, atitinkamai. Tuo tarpu Balaguru (1981) nuo 1,74 sijoms CSI-5÷CSI-6 iki 1,66 sijoms CSI-7÷CSI-8, atitinkamai (S3.4 pav.). Didžiausi įlinkių skirtumai nustatyti trečiosios grupės sijoms. Sijoms CSI-9 ir CSI-10 siūlomo metodo, Balaguru (1981) ir eksperimentiškai nustatytų įlinkių prie mini-malios ciklinės apkrovos reikšmės santykiai kito nuo 1,86 iki 2,16, atitinkamai. Tuo tarpu, sijoms CSI-11 ir CSI-12 – 1,40 ir 1,66 (S3.5 pav.).
-1,0
2,0
5,0
8,0
11,0
14,0
17,0
20,0
0,0 0,2 0,4 0,6 0,8 1,0
(avg)(avg)Siūlomas metodasSiūlomas metodasBalaguru 1981
CSI-1, CSI-2
t/tlim
umin, umax, mm
umax
umin
-1,0
7,0
15,0
23,0
31,0
39,0
0,0 0,2 0,4 0,6 0,8 1,0
(avg)(avg)Siūlomas metodasSiūlomas metodasBalaguru 1981
CSI-3, CSI-4
t/tlim
umax
umin
umin, umax, mm
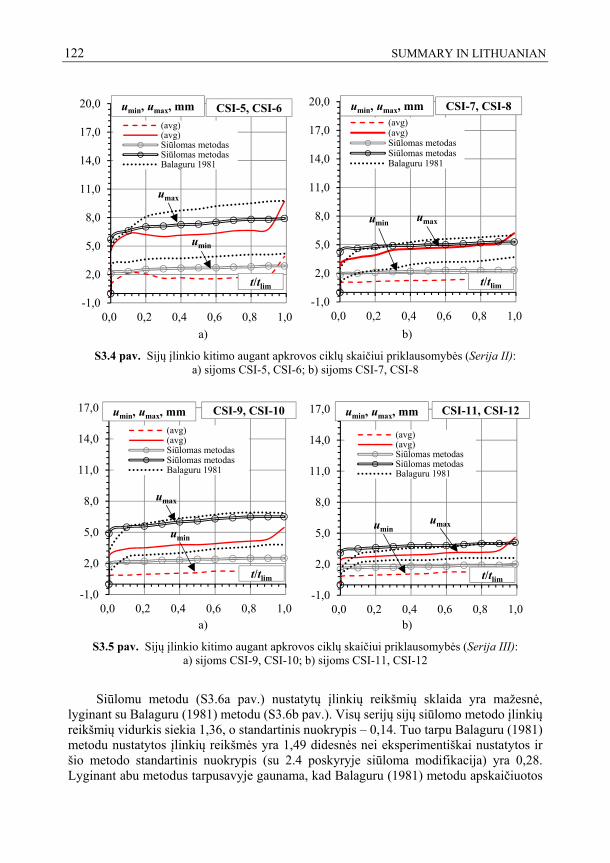
122 SUMMARY IN LITHUANIAN
a) b)
S3.4 pav. Sijų įlinkio kitimo augant apkrovos ciklų skaičiui priklausomybės (Serija II): a) sijoms CSI-5, CSI-6; b) sijoms CSI-7, CSI-8
a) b)
S3.5 pav. Sijų įlinkio kitimo augant apkrovos ciklų skaičiui priklausomybės (Serija III): a) sijoms CSI-9, CSI-10; b) sijoms CSI-11, CSI-12
Siūlomu metodu (S3.6a pav.) nustatytų įlinkių reikšmių sklaida yra mažesnė, lyginant su Balaguru (1981) metodu (S3.6b pav.). Visų serijų sijų siūlomo metodo įlinkių reikšmių vidurkis siekia 1,36, o standartinis nuokrypis – 0,14. Tuo tarpu Balaguru (1981) metodu nustatytos įlinkių reikšmės yra 1,49 didesnės nei eksperimentiškai nustatytos ir šio metodo standartinis nuokrypis (su 2.4 poskyryje siūloma modifikacija) yra 0,28. Lyginant abu metodus tarpusavyje gaunama, kad Balaguru (1981) metodu apskaičiuotos
-1,0
2,0
5,0
8,0
11,0
14,0
17,0
20,0
0,0 0,2 0,4 0,6 0,8 1,0
(avg)(avg)Siūlomas metodasSiūlomas metodasBalaguru 1981
CSI-5, CSI-6
t/tlim
umax
umin
umin, umax, mm
-1,0
2,0
5,0
8,0
11,0
14,0
17,0
20,0
0,0 0,2 0,4 0,6 0,8 1,0
(avg)(avg)Siūlomas metodasSiūlomas metodasBalaguru 1981
CSI-7, CSI-8
t/tlim
umaxumin
umin, umax, mm
-1,0
2,0
5,0
8,0
11,0
14,0
17,0
0,0 0,2 0,4 0,6 0,8 1,0
(avg)(avg)Siūlomas metodasSiūlomas metodasBalaguru 1981
CSI-9, CSI-10
t/tlim
umax
umin
umin, umax, mm
-1,0
2,0
5,0
8,0
11,0
14,0
17,0
0,0 0,2 0,4 0,6 0,8 1,0
(avg)(avg)Siūlomas metodasSiūlomas metodasBalaguru 1981
CSI-11, CSI-12
t/tlim
umaxumin
umin, umax, mm
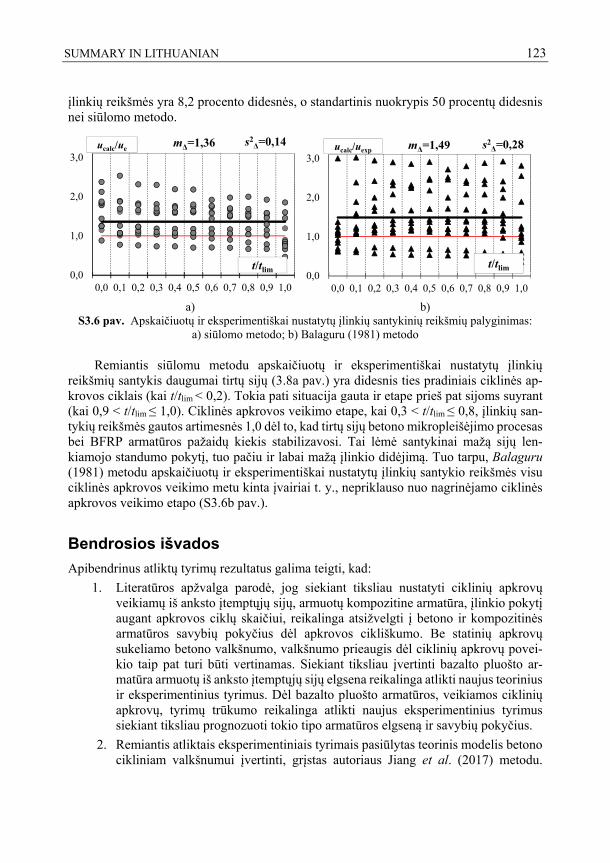
SUMMARY IN LITHUANIAN 123
įlinkių reikšmės yra 8,2 procento didesnės, o standartinis nuokrypis 50 procentų didesnis nei siūlomo metodo.
a) b)
S3.6 pav. Apskaičiuotų ir eksperimentiškai nustatytų įlinkių santykinių reikšmių palyginimas: a) siūlomo metodo; b) Balaguru (1981) metodo
Remiantis siūlomu metodu apskaičiuotų ir eksperimentiškai nustatytų įlinkių reikšmių santykis daugumai tirtų sijų (3.8a pav.) yra didesnis ties pradiniais ciklinės ap-krovos ciklais (kai t/tlim < 0,2). Tokia pati situacija gauta ir etape prieš pat sijoms suyrant (kai 0,9 < t/tlim ≤ 1,0). Ciklinės apkrovos veikimo etape, kai 0,3 < t/tlim ≤ 0,8, įlinkių san-tykių reikšmės gautos artimesnės 1,0 dėl to, kad tirtų sijų betono mikropleišėjimo procesas bei BFRP armatūros pažaidų kiekis stabilizavosi. Tai lėmė santykinai mažą sijų len-kiamojo standumo pokytį, tuo pačiu ir labai mažą įlinkio didėjimą. Tuo tarpu, Balaguru (1981) metodu apskaičiuotų ir eksperimentiškai nustatytų įlinkių santykio reikšmės visu ciklinės apkrovos veikimo metu kinta įvairiai t. y., nepriklauso nuo nagrinėjamo ciklinės apkrovos veikimo etapo (S3.6b pav.).
Bendrosios išvados
Apibendrinus atliktų tyrimų rezultatus galima teigti, kad:
1. Literatūros apžvalga parodė, jog siekiant tiksliau nustatyti ciklinių apkrovų veikiamų iš anksto įtemptųjų sijų, armuotų kompozitine armatūra, įlinkio pokytį augant apkrovos ciklų skaičiui, reikalinga atsižvelgti į betono ir kompozitinės armatūros savybių pokyčius dėl apkrovos cikliškumo. Be statinių apkrovų sukeliamo betono valkšnumo, valkšnumo prieaugis dėl ciklinių apkrovų povei-kio taip pat turi būti vertinamas. Siekiant tiksliau įvertinti bazalto pluošto ar-matūra armuotų iš anksto įtemptųjų sijų elgsena reikalinga atlikti naujus teorinius ir eksperimentinius tyrimus. Dėl bazalto pluošto armatūros, veikiamos ciklinių apkrovų, tyrimų trūkumo reikalinga atlikti naujus eksperimentinius tyrimus siekiant tiksliau prognozuoti tokio tipo armatūros elgseną ir savybių pokyčius.
2. Remiantis atliktais eksperimentiniais tyrimais pasiūlytas teorinis modelis betono cikliniam valkšnumui įvertinti, grįstas autoriaus Jiang et al. (2017) metodu.
0,0
1,0
2,0
3,0
0,0 0,1 0,2 0,3 0,4 0,5 0,6 0,7 0,8 0,9 1,0
ucalc/ue
t/tlim
mΔ=1,36 s2Δ=0,14
0,0
1,0
2,0
3,0
0,0 0,1 0,2 0,3 0,4 0,5 0,6 0,7 0,8 0,9 1,0
t/tlim
mΔ=1,49 s2Δ=0,28ucalc/uexp
124 SUMMARY IN LITHUANIAN
Modelio parametrai pritaikyti kompozitine armatūra (turinčia mažesnį tamprumo modulį nei plieno) armuotų, iš anksto įtemptųjų sijų įlinkio prognozavimui.
3. Ciklinis valkšnumas turėtų būti vertinamas nemetaline armatūra armuotų beto-ninių konstrukcijų projektavimo normose ir rekomendacijose sumuojant statinių apkrovų sukeliamas betono valkšnumo deformacijas bei šių deformacijų prieaugį atsirandantį dėl apkrovos cikliškumo. Nemetalinės armatūros mechaninių savybių pokytis (tamprumo modulio) dėl ciklinių apkrovų poveikio taip pat turėtų būti vertinamas.
4. Pasiūlytas analitinis konstrukcijos įlinkio kitimo, veikiant ciklinėms apkrovoms, vertinimo metodas. Siūlomas metodas grindžiamas konstrukcijų dinamika. Tai leidžia nustatyti iš anksto įtemptųjų sijų, armuotų BFRP armatūra savųjų svyravimų dažnį, analizuojant sijas įvertinti veikiančios ciklinės apkrovos, bei apkrovos dažnio įtaką sijos deformacijoms (įlinkiui). Metodas leidžia detaliau analizuoti lenkiamųjų elementų elgseną projektavimo stadijoje (pvz., išankstinio įtempimo įtaką standumui, įtempių būvį skerspjūvyje, savųjų svyravimų dažnio nustatymas).
5. Eksperimentiškai nustatyta, kad bazalto pluošto armatūros strypai turi pa-kankamą atsparumą nuovargiui. Šios armatūros tamprumo modulis po 1 milijono (ciklinio tempimo) apkrovos ciklų sumažėjo iki 5 % lyginant su pradiniu tamprumo moduliu. Dėl to, bazalto pluošto armatūra gali būti puiki alternatyva plieninei armatūrai iš anksto įtemptosiose konstrukcijose. Be to, pasiūlytas ba-zalto pluošto armatūros tamprumo modulio kitimo vertinimo modelis gali būti panaudojamas pokyčio prognozavimui esant didesniems apkrovos ciklams (N>1 mln. apkrovos ciklų). Rezultatų patikimumui įvertinti reikalinga atlikti papildomus BFRP armatūros tyrimus esant didesniam apkrovos ciklų skaičiui N.
6. Eksperimentiškai nustatyta, jog bazalto pluošto armatūra armuotos iš anksto įtemptosios sijos gebėjo atlaikyti daugiausiai apkrovos ciklų tada, kai apkrovos amplitudė buvo mažiausia (įtempių amplitudė bazalto pluošto armatūroje taip pat mažiausia). Efektyviausias išankstinio įtempimo lygis – 45 % bazalto pluošto armatūros tempiamojo stiprio ribos. Sijų, kurių bazalto pluošto armatūros mini-malių ir maksimalių įtempių santykis kito nuo 0,84 iki 0,88 atlaikytų apkrovos ciklų skaičius buvo gautas didžiausias.
7. Pasiūlyto įlinkių nustatymo metodo tikslumas buvo gautas didesnis nei kitų au-torių (Balaguru 1981). Atlikus siūlomo metodo rezultatų statistinę analizę gauta, jog minimalių ir maksimalių įlinkių santykių vidurkis yra lygus 1,36, o standartinė deviacija 0,14. Siūlomo metodo įlinkių santykio vidurkis prie maksi-malių ciklinės apkrovos reikšmių gautas lygus 1,17.
8. Atsižvelgiant į prieš tai pateiktas bendrąsias išvadas rekomenduojama tęsti at-liktus mokslinius tyrimus atliekant papildomus iš anksto įtemptųjų sijų eksperi-mentinius tyrimus, taip pat baigtinių elementų (BE) skaitinį modeliavimą.

125
Annexes1
Annex A. Declaration of Academic Integrity
Annex B. The Co-authors’ Agreement to Present Publications Material in Dissertation
Annex C. Copies of Scientific Publications by the Author on the Topic of Dissertation
1The annexes are supplied in the enclosed compact disc.
Edgaras ATUTIS DEFLECTION ANALYSIS OF CONCRETE BEAMS PRESTRESSED WITH BASALT FIBER REINFORCED POLYMER BARS SUBJECTED TO CYCLIC LOADING
Doctoral Dissertation
Technological Sciences, Civil Engineering (T 002)
IŠ ANKSTO ĮTEMPTAIS BAZALTO PLUOŠTO STRYPAIS ARMUOTŲ LENKIAMŲJŲ BETONINIŲ ELEMENTŲ ĮLINKIŲ ANALIZĖ VEIKIANT CIKLINEI APKROVAI
Daktaro disertacija
Technologijos mokslai, statybos inžinerija (T 002) 2019 10 07. 12,0 sp. l. Tiražas 20 egz. Vilniaus Gedimino technikos universiteto leidykla „Technika“, Saulėtekio al. 11, 10223 Vilnius, http://leidykla.vgtu.lt Spausdino BĮ UAB „Baltijos kopija“ Kareivių g. 13B, 09109 Vilnius