Defining Operational/ Measurable Goalsmvz/mswe609/book/chapter3.pdf · 3.1 Defining Operational/...
24
3.1 Defining Operational/ Measurable Goals Any engineering process requires feedback and evaluation. Software development is an engineering discipline and measurement is an ideal mechanism for feedback and evaluation. The measurement and information fed back to all parties, e.g., developers, managers, customers and the corporation helps in the understanding and control of the software processes and products, and the relationships between them. It helps in making intelligent decisions and improving over time. But measurement must be focused, based upon goals and models. We need to establish goals for the various software processes and products and these goals should be measurable, driven by the appropriate models. There are a large variety of software goals, defined from a variety of perspectives, including the customer, the project, and the corporation. Sample customer goals include customer satisfaction and that the product contains needed functionality. Sample project goals include the need for a high quality process and on time delivery. Sample corporate goals include that the product be salable and that the quality of the software development process improve over time. There are a variety of reasons for measuring the software development process and product. Measurement is a mechanism for creating a corporate memory and an aid in answering a variety of questions associated with any software development. It helps support project planning, (e.g., how much will a new project cost?); allows us to determine the strengths and weaknesses of the current process and product, (e.g., are certain types of errors commonplace?); provides a rationale for adopting/refining techniques, (e.g., what techniques will minimize current problems?); allows us to assess the impact of techniques, (e.g., does functional testing minimize certain error classes?); evaluate the quality of the process/product, (e.g., what is the reliability of the product after delivery?) and the functionality and user friendliness (e.g., to determine if the system is easy to use and does what the user wants it to do.) Measurement must be defined in a top down fashion, bottom-up approach wonÆt work. There are a large variety of software metrics: calendar time, number of open problems, cyclomatic complexity, lines of code/module, number of defects found in inspections, severity of failures, total effort, total number of defects, machine time, lines of code/staff month, total lines of code number of failures during system test. But which metrics does one use and how does one interpret them without the appropriate models and goals surrounding them? There are a variety of mechanisms for defining measurable goals that have appeared in the literature: Quality Function Deployment Approach (QFD), the Goal/Question/Metric Paradigm (GQM), and Software Quality Metrics Approach (SQM). In this chapter we will discuss the GQM approach to measurement. THE GQM PARADIGM For an organization to measure in a purposeful way requires that it (1) specifies the goals for itself and its projects, (2) traces those goals to the data that are intended to define these goals operationally, and
Transcript of Defining Operational/ Measurable Goalsmvz/mswe609/book/chapter3.pdf · 3.1 Defining Operational/...

3.1
Defining Operational/ Measurable Goals
Any engineering process requires feedback and evaluation. Software development is an engineeringdiscipline and measurement is an ideal mechanism for feedback and evaluation. The measurement andinformation fed back to all parties, e.g., developers, managers, customers and the corporation helps inthe understanding and control of the software processes and products, and the relationships betweenthem. It helps in making intelligent decisions and improving over time. But measurement must befocused, based upon goals and models. We need to establish goals for the various software processesand products and these goals should be measurable, driven by the appropriate models.
There are a large variety of software goals, defined from a variety of perspectives, including thecustomer, the project, and the corporation. Sample customer goals include customer satisfaction andthat the product contains needed functionality. Sample project goals include the need for a high qualityprocess and on time delivery. Sample corporate goals include that the product be salable and that thequality of the software development process improve over time.
There are a variety of reasons for measuring the software development process and product.Measurement is a mechanism for creating a corporate memory and an aid in answering a variety ofquestions associated with any software development. It helps support project planning, (e.g., how muchwill a new project cost?); allows us to determine the strengths and weaknesses of the current processand product, (e.g., are certain types of errors commonplace?); provides a rationale for adopting/refiningtechniques, (e.g., what techniques will minimize current problems?); allows us to assess the impact oftechniques, (e.g., does functional testing minimize certain error classes?); evaluate the quality of theprocess/product, (e.g., what is the reliability of the product after delivery?) and the functionality and userfriendliness (e.g., to determine if the system is easy to use and does what the user wants it to do.)
Measurement must be defined in a top down fashion, bottom-up approach wonÆt work.There are a large variety of software metrics: calendar time, number of open problems, cyclomaticcomplexity, lines of code/module, number of defects found in inspections, severity of failures, totaleffort, total number of defects, machine time, lines of code/staff month, total lines of code number offailures during system test. But which metrics does one use and how does one interpret them without theappropriate models and goals surrounding them?
There are a variety of mechanisms for defining measurable goals that have appeared in the literature:Quality Function Deployment Approach (QFD), the Goal/Question/Metric Paradigm (GQM), andSoftware Quality Metrics Approach (SQM). In this chapter we will discuss the GQM approach tomeasurement.
THE GQM PARADIGM
For an organization to measure in a purposeful way requires that it (1) specifies the goals for itself andits projects, (2) traces those goals to the data that are intended to define these goals operationally, and

3.2
(3) provide a framework for interpreting the data understand the goals. Thus, it is important to makeclear at least in general terms what informational needs the organization has, so that these needs forinformation can be quantified whenever possible, and the quantified information can be analyzed as towhether or not the goals are achieved. We propose a paradigm, called the Goal/Question/Metric(GQM) Paradigm that supports a tractable software engineering process.
The Goal/Question/Metric paradigm is a mechanism for defining and evaluating a set of operationalgoals, using measurement. It represents a systematic approach for tailoring and integrating goals withmodels of the software processes, products and quality perspectives of interest, based upon thespecific needs of the project and the organization.
The goals are defined in an operational, tractable way by refining them into a set of quantifiablequestions that are used to extract the appropriate information from the models. The questions andmodels, in turn, define a specific set of metrics and data for collection and provide a framework forinterpretation.
The GQM paradigm was originally developed for evaluating defects for a set of projects in theNASA/GSFC environment. The application involved a set of case study experiments. It was thenexpanded to include various types of experimental approaches, including controlled experiments.
Although the GQM was originally used to define and evaluate goals for a particular project in aparticular environment, its use has been expanded in the context of the Quality Improvement Paradigm(QIP). Now, we can use it for long range corporate goal setting and evaluation. We can improve ourevaluation of a project by analyzing it in the context of several other projects. We can expand our levelof feedback and learning by defining the appropriate synthesis procedure for transforming lower-levelinformation into higher-level packages of experience. As part of the QIP we can learn more about thedefinition and application of the GQM in a formal way, just as we would learn about any otherexperiences.
The flow from the goals to the metrics in the GQM paradigm can be viewed as a directed graph (theflow is from the goal nodes to the question nodes to the metric nodes):
Goal1 Goal2 ... Goaln . . . . . . . . . . . . . . . . . . . . . . . . . . . Question1 . Question3 Question4 . . . . Question8 . . . . . Question6 . . . Question2 . . Question5 . Question7 . d1 . . . m9 d2 . . . . . . . m5 . . . . . . . . . . m1 m2 m3 m4 m2 d3 m6 m1 m6 m7

3.3
Here there are n goals shown and each goal generates a set of quantifiable questions that attempt todefine and quantify the specific goal which represents an entry node in the directed graph. Thesequestions are based upon a particular set of process, product, and quality models that are not explicitlyrepresented in the graph. Each directed sub-graph reachable form a goal node represents a particularGQM model.
The goal is only as well defined as the questions it generates and the models on which those questionsare based. Since models are often hard to define, they may exist only implicitly in the questions. Themore formal, explicit, and complete the models, the more effective the questions and the definition ofthe goals. Each question generates a set of metrics (mi) or distributions (di). Again, the question canonly be answered relative to and as completely as the available metrics and distributions allow. As isshown in the above diagram, the same questions can be used to define multiple goals (e.g. Question6),and metrics and distributions can be used to answer more than one question. Thus questions andmetrics are used in several contexts.
The paradigm is used not just for focusing management, engineering and quality assurance interests, butalso for interpreting the questions and the metrics. For example, m6 is collected in two contexts andpossibly for two different reasons. Question6 may ask for the size of the product (m6) as part of thegoal to model productivity (Goal2). But m6 (size of the product) may also be used as part of a questionabout the complexity of the product (e.g. Question7) related to a goal on ease of modification (e.g.Goaln).
If a measure cannot be taken but is part of the definition of the question, it is important that it beincluded in the GQM paradigm. This is so that the other metrics that answer the question can beviewed in the proper context and the question interpreted with the appropriate limitations. The same isclearly true for questions being asked that may not be answerable with the the data available.
Although there may be many goals and even many questions, the metrics do not grow as the same rateas the goals and questions. Thus a set of metrics could be collected for characterizing the softwareprocess and product that will allow us to answer many questions generated by different goals.
THE GQM PROCESS
Given the above paradigm, the data collection process consists of six steps:
(1) Develop a set of corporate, division, and project goals for productivity and quality, e.g. customersatisfaction, on-time delivery, improved product quality.
(2) Based upon these goals, define operational definitions, in the form of questions, that characterize,evaluate, predict and motivate quality and productivity.
(3) Specify the measures needed to be collected to answer those questions and to track process andproduct conformance to the goals.
3.4
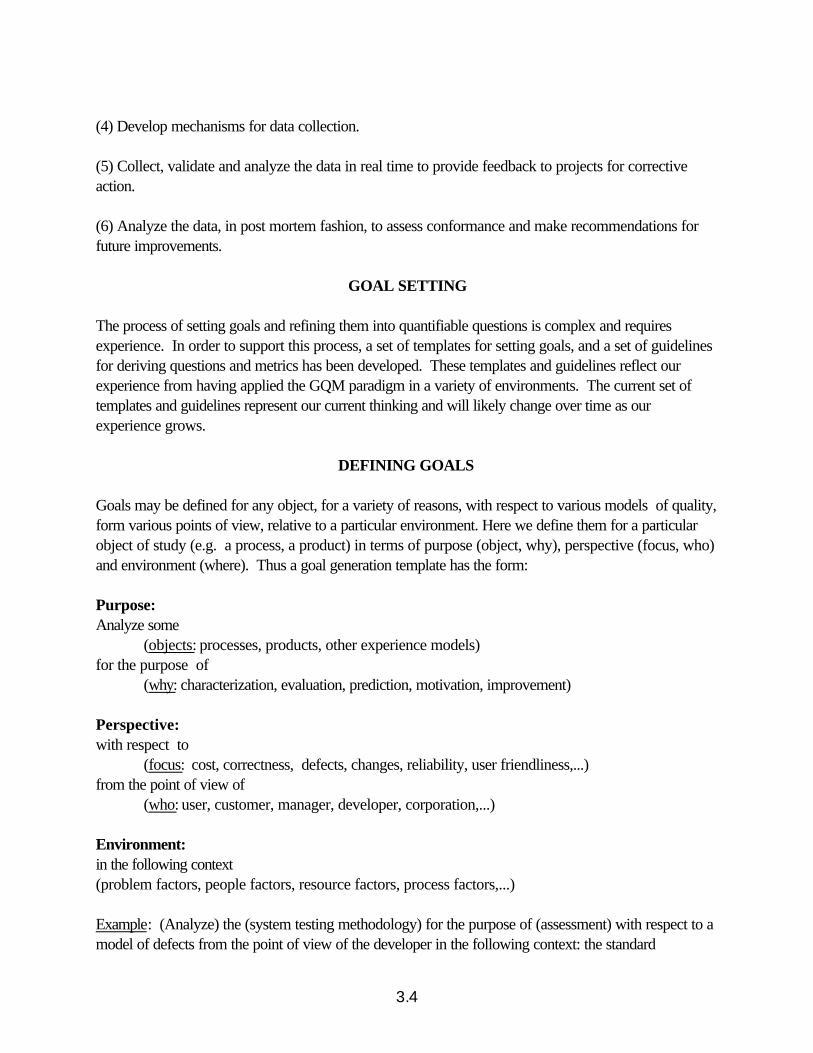
(4) Develop mechanisms for data collection.
(5) Collect, validate and analyze the data in real time to provide feedback to projects for correctiveaction.
(6) Analyze the data, in post mortem fashion, to assess conformance and make recommendations forfuture improvements.
GOAL SETTING
The process of setting goals and refining them into quantifiable questions is complex and requiresexperience. In order to support this process, a set of templates for setting goals, and a set of guidelinesfor deriving questions and metrics has been developed. These templates and guidelines reflect ourexperience from having applied the GQM paradigm in a variety of environments. The current set oftemplates and guidelines represent our current thinking and will likely change over time as ourexperience grows.
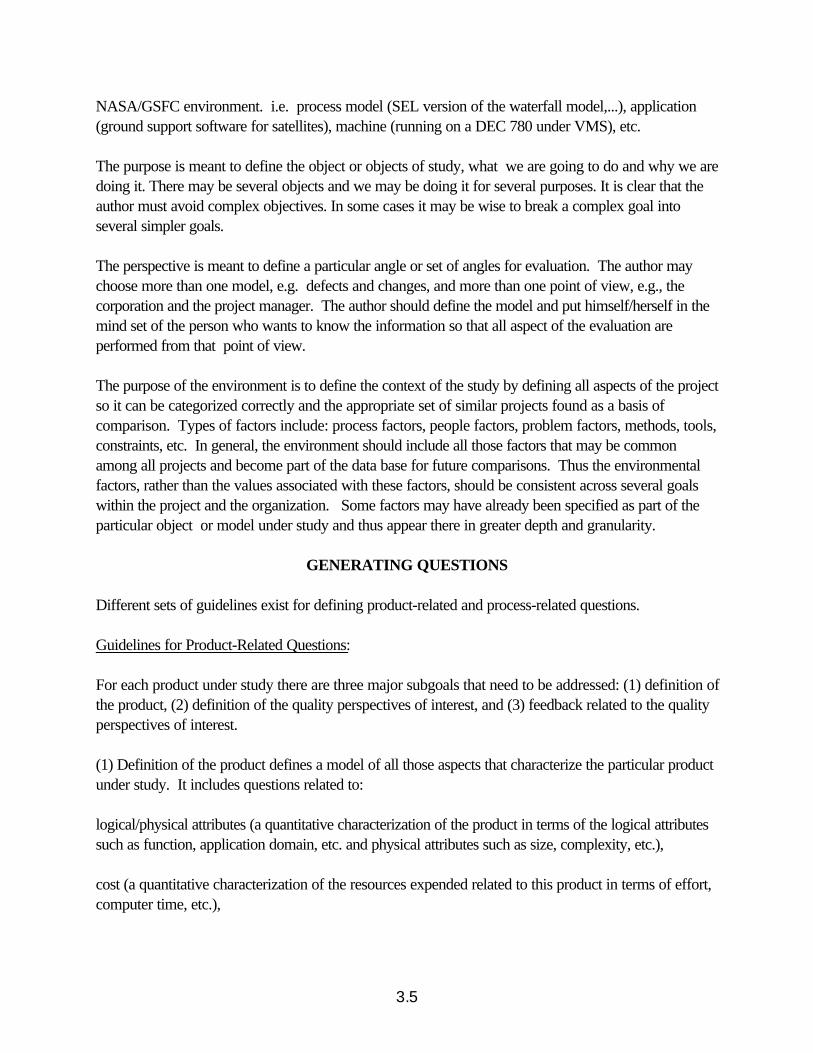
DEFINING GOALS
Goals may be defined for any object, for a variety of reasons, with respect to various models of quality,form various points of view, relative to a particular environment. Here we define them for a particularobject of study (e.g. a process, a product) in terms of purpose (object, why), perspective (focus, who)and environment (where). Thus a goal generation template has the form:
Purpose:Analyze some
(objects: processes, products, other experience models)for the purpose of
(why: characterization, evaluation, prediction, motivation, improvement)
Perspective:with respect to
(focus: cost, correctness, defects, changes, reliability, user friendliness,...)from the point of view of
(who: user, customer, manager, developer, corporation,...)
Environment:in the following context(problem factors, people factors, resource factors, process factors,...)
Example: (Analyze) the (system testing methodology) for the purpose of (assessment) with respect to amodel of defects from the point of view of the developer in the following context: the standard
3.5
NASA/GSFC environment. i.e. process model (SEL version of the waterfall model,...), application(ground support software for satellites), machine (running on a DEC 780 under VMS), etc.
The purpose is meant to define the object or objects of study, what we are going to do and why we aredoing it. There may be several objects and we may be doing it for several purposes. It is clear that theauthor must avoid complex objectives. In some cases it may be wise to break a complex goal intoseveral simpler goals.
The perspective is meant to define a particular angle or set of angles for evaluation. The author maychoose more than one model, e.g. defects and changes, and more than one point of view, e.g., thecorporation and the project manager. The author should define the model and put himself/herself in themind set of the person who wants to know the information so that all aspect of the evaluation areperformed from that point of view.
The purpose of the environment is to define the context of the study by defining all aspects of the projectso it can be categorized correctly and the appropriate set of similar projects found as a basis ofcomparison. Types of factors include: process factors, people factors, problem factors, methods, tools,constraints, etc. In general, the environment should include all those factors that may be commonamong all projects and become part of the data base for future comparisons. Thus the environmentalfactors, rather than the values associated with these factors, should be consistent across several goalswithin the project and the organization. Some factors may have already been specified as part of theparticular object or model under study and thus appear there in greater depth and granularity.
GENERATING QUESTIONS
Different sets of guidelines exist for defining product-related and process-related questions.
Guidelines for Product-Related Questions:
For each product under study there are three major subgoals that need to be addressed: (1) definition ofthe product, (2) definition of the quality perspectives of interest, and (3) feedback related to the qualityperspectives of interest.
(1) Definition of the product defines a model of all those aspects that characterize the particular productunder study. It includes questions related to:
logical/physical attributes (a quantitative characterization of the product in terms of the logical attributessuch as function, application domain, etc. and physical attributes such as size, complexity, etc.),
cost (a quantitative characterization of the resources expended related to this product in terms of effort,computer time, etc.),

3.6
changes and defects (a quantitative characterization of the errors, faults, failures, adaptations, andenhancements related to this product), and
context (a quantitative characterization of the customer community using this product and theiroperational profiles).
(2) The quality perspectives of interest are based upon the definition of the model and tells us how todefine our measure. The models used here may be mathematically tractable models or qualitativemodels. Quality perspectives of interest (e.g.,reliability, user friendliness), include questions related to
the major model(s) used (a quantitative specification of the quality perspective of interest),
the validity of the model for the particular environment (an analysis of the appropriateness of the modelfor the particular project environment),
the validity of the data collected (an analysis of the quality of data), and optionally,
a substantiation of the model (an alternative model to help evaluate whether the results of the primarymodel are reasonable).
This last option is taken when there is some concern about the validity of the primary model or the data.
(3) Feedback includes questions related to improving the product relative to the quality perspective ofinterest (a quantitative characterization of the product quality, major problems regarding the qualityperspective of interest, and suggestions for improvement during the ongoing project as well as duringfuture projects). It should also include things learned with regard to process, application and otherproducts based upon what we have learned here.
Feedback very often requires reference to other factors not explicitly mentioned in the definition of theproduct or perspective. In these cases it should be checked that these factors exist either in theenvironment section (when there is an attempt to evaluate against a data base) or in the definition of theproduct section (when there is a need to examine the model of the project).
Guidelines for Process-Related Questions:
For each process under study, there are three major subgoals that need to be addressed: (1) definitionof the process, (2) definition of the quality perspectives of interest, and (3) feedback from using thisprocess relative to the quality perspective of interest.
(1) Definition of the process includes questions related to
3.7
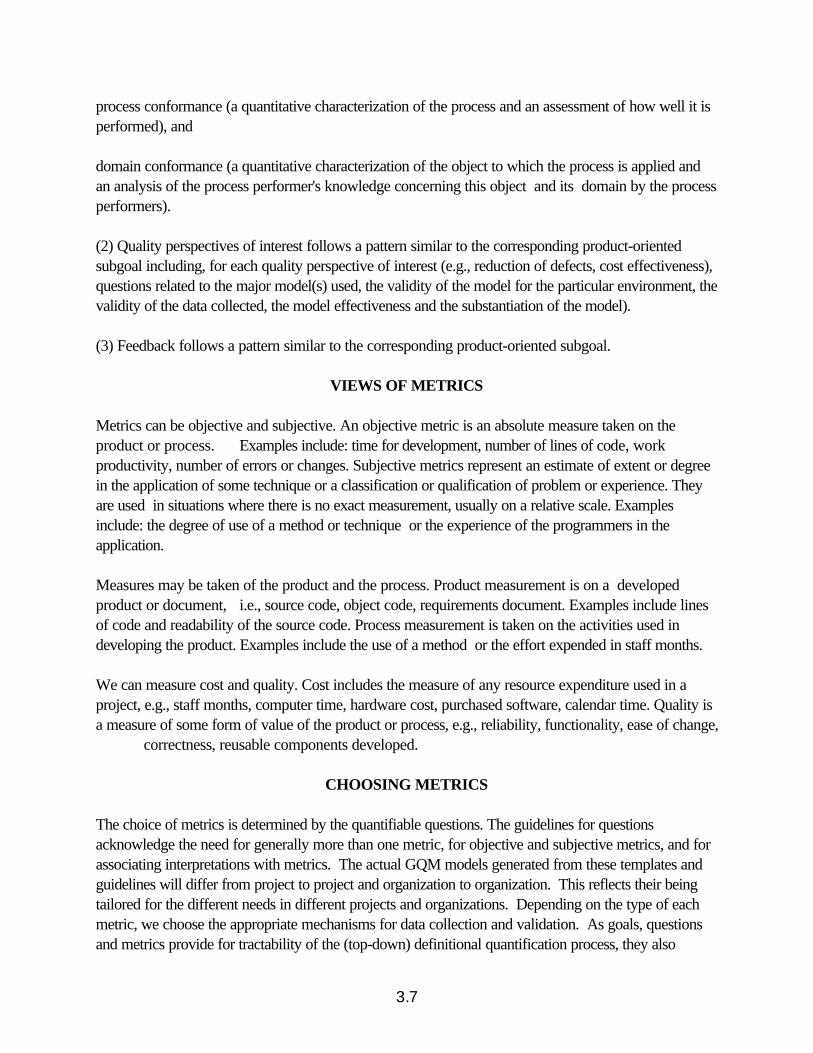
process conformance (a quantitative characterization of the process and an assessment of how well it isperformed), and
domain conformance (a quantitative characterization of the object to which the process is applied andan analysis of the process performer's knowledge concerning this object and its domain by the processperformers).
(2) Quality perspectives of interest follows a pattern similar to the corresponding product-orientedsubgoal including, for each quality perspective of interest (e.g., reduction of defects, cost effectiveness),questions related to the major model(s) used, the validity of the model for the particular environment, thevalidity of the data collected, the model effectiveness and the substantiation of the model).
(3) Feedback follows a pattern similar to the corresponding product-oriented subgoal.
VIEWS OF METRICS
Metrics can be objective and subjective. An objective metric is an absolute measure taken on theproduct or process. Examples include: time for development, number of lines of code, workproductivity, number of errors or changes. Subjective metrics represent an estimate of extent or degreein the application of some technique or a classification or qualification of problem or experience. Theyare used in situations where there is no exact measurement, usually on a relative scale. Examplesinclude: the degree of use of a method or technique or the experience of the programmers in theapplication.
Measures may be taken of the product and the process. Product measurement is on a developedproduct or document, i.e., source code, object code, requirements document. Examples include linesof code and readability of the source code. Process measurement is taken on the activities used indeveloping the product. Examples include the use of a method or the effort expended in staff months.
We can measure cost and quality. Cost includes the measure of any resource expenditure used in aproject, e.g., staff months, computer time, hardware cost, purchased software, calendar time. Quality isa measure of some form of value of the product or process, e.g., reliability, functionality, ease of change,
correctness, reusable components developed.
CHOOSING METRICS
The choice of metrics is determined by the quantifiable questions. The guidelines for questionsacknowledge the need for generally more than one metric, for objective and subjective metrics, and forassociating interpretations with metrics. The actual GQM models generated from these templates andguidelines will differ from project to project and organization to organization. This reflects their beingtailored for the different needs in different projects and organizations. Depending on the type of eachmetric, we choose the appropriate mechanisms for data collection and validation. As goals, questionsand metrics provide for tractability of the (top-down) definitional quantification process, they also

3.8
provide for the interpretation context (bottom-up). This integration of definition with interpretationallows for the interpretation process to be tailored to the specific needs of an environment.
GENERATING A PARTICULAR OPERATIONAL MODEL
Often we must build simple models of various products and processes. For example, suppose wewanted to characterize the education and training of an individual team with regard to a particularprocess, e.g., a method or technique. We begin by trying to define the steps of our education andtraining process. For example, suppose we begin by providing the individual with training manuals andexpecting them to be read. We then provide a course, educating the individual in the process. This isfollowed by training via an application of the process to a toy problem in order to build up skills in usingthe process. The individual is then assigned to a project that is using the process and receives some onthe job training by a team member who is well versed in the application of the process. After this theindividual is considered fully trained in the process.
This definiition is then converted into an operational model by providing a set of interval valuesassociated with the various steps of the process. In this case, since the model is clear, each of the stepsrepresents a further passage along the interval scale. Thus a value of 0 impies no training, 1 implies theindividual has read the manuals, 2 implies the individual has been through a training course, 3 implies theindividual has had experience in a laboratory environment, 4 implies the process had been used on aproject before, under tutelage, and 5 implies the process has been used on several projects. Eventhough we call this a subjective rating, it should be clear that if the education and training process isvalid, then our modle and the metrics associated with it are valid.
Using the GQM, we can generate a question that gathers the information for the model:
Characterize the process experience of the team.(subjective rating per person)
0 - none1 - have read the manuals2 - have had a training course3 - have had experience in a laboratory environment4 - have used on a project before5 - have used on several projects beforex - no response
The data from the question can then be interpreted in a variety of ways. For example, if there are tenmembers of the team, we might requrie that a minimum requiremnt is that all team members have at leasta three and the team leader has a five, etc. This evaluation process will become more effective overtime.
A PROCESS GOAL EXAMPLE

3.9
This is a simple example of a process evaluation goal. It should be noted that we may wish to mixprocess and product measurements on several occasions. For example, here we may wish to haveseveral product measurements in the environment characteristics to help us locate similar projects in thedata base for comparison.
GQM Goal:
PURPOSE OF STUDY: Analyze the system test process for the purpose of evaluation
PERSPECTIVE: with respect to defect slippage from the point of view of the corporation.
System Test Process Model:
Process Goal: Generate a set of tests consistent with the complexity and importance of eachrequirement.
Process Algorithm: (1) Enumerate the requirements, (2) Rate importance by marketing, (3) Ratecomplexity by system tester, (4) ...
Defect Slippage Model:
Let:Es = #faults per KLOC found in system test in this projectEa = #faults per KLOC found in acceptance test in this projectEo = #faults per KLOC found in operation in this project
Let {Pi} be the set of projects used as a basis for comparison.PEs = average #faults per KLOC found in system test in {Pi}PEa = average #faults per KLOC found in acceptance test in {Pi}PEo = average #faults per KLOC found in operation in {Pi}
Let Fc = the ratio of faults per KLOC found in system test to the faults found after system test on thisproject. [Fc = Es/(Es+Ea+Eo)]
Let Fs = the ratio of faults per KLOC found in system test to the faults found after system test in theset of projects used as a basis for comparison.[Fs = PEs/(PEs+PEa+PEo)]
Let QF = Fc/Fs = the relationship of system test on this project to faults as compared to the averagethe appropriate basis set.
Simple Interpretation of Defect Slippage Model

3.10
if QF > 1 then
method better than history check process conformance if process conformance poor
improve process or process conformance check domain conformance if domain conformance poor
improve object or domain training
= 1 then method same as history if cost lower than normal method cost effective
check process conformance ...
< 1 then check process conformance if process conformance good
check domain conformanceif domain conformance good
method poor for this class of project
This process should be done not only at this high level but for each class of fault, the total cost to isolateand fix a fault in total and by class of fault. We can do the calculation by error andfailure category as well. We can also look at normalized defects by size.
ENVIRONMENT: [The environment consists of the following: process factors, people factors,problem factors, methods, tools, constraints, etc. It consists of all the characterizing metrics that may notbe directly relevant to the study but whose existence allow us to choose the appropriate "standard"project set used for comparison and may explain various differences.]
PROCESS QUESTIONS
Process Conformance:[A quantitative characterization of the process and an assessment of how well it is performed.]
Characterize the test method experience of the test team.(subjective rating per person)
0 - none1 - have read the manuals

3.11
2 - have had a training course3 - have had experience in a laboratory environment4 - have used on a project before5 - have used on several projects beforex - no response
How many requirements are there?(enumerate them)
What is the importance of testing each requirement?(Subjective rating 0 - 5 by marketing and testers)
0 - not important, could be left out1 - not too important, may affect some users2 - mildly important, will affect some users3 - important, should affect most users4 - extremely important, part of the essence of the system5 - critical, without this the system is uselessx - donÆt know
What is the complexity of testing each requirement?(subjective rating 0 - 5 by tester)
0 - doesnÆt need to be tested1 - easy to test, one test should do it2 - reasonably easy to test, only a few ad hoc tests are needed3 - not easy to test, requires carefully made up test suite4 - very difficult to test, requires a lot of thought to make up a good test suite5 - extremely difficult to test, requires a large, complex test suitex - impossible to test
What is the distribution of tests over requirements?(number of tests/requirement)
Is the number of tests/requirement consistent with the evaluation of its complexity and importance?0 - there are no tests for this requirement1 - there is at least one test2 - there are several tests but not nearly enough3 - the number of tests are reasonable but not sufficient given the importance or complexity of the requirement4 - the number of tests are sufficient for the complexity and importance of the requirement5 - the number of tests are more than adequate for the importance
and complexity of the requirementx - no response

3.12
[This may be calculated subjectively, as is done here or there may be a quantitative evaluation basedupon some predefined expectation. For example:
If importance = 5 and complexity = 5 then number of test cases =
Domain Conformance:[A quantitative characterization of the object to which the process is applied and an analysis of theprocess performer's knowledge concerning this object.]
How familiar is the domain?(subject rating 0 - 5 for each tester)
0 - domain new to me1 - have had a course in the subject domain2 - have built or tested one system in this domain3 - have built and tested at least one system in this product line4 - have built and tested several systems in this domain5 - have tested and built several systems in this product line
How understandable are the requirements?(subjective rating 0 - 5 for each requirement)
0 - not understandable at all1 - requirement ambiguous or not sure what it means2 - not sure of the full ramifications3 - reasonably clear requirement4 - requirement is perfectly clear5 - have successfully tested this type of requirement before
How precisely are the tests (inputs, results) known in advance? (subjective rating 0 - 5)0 - there were no tests for this requirement1 - will make the inputs up at terminal2 - know the inputs but not the results3 - know the inputs and the range of the results4 - know the inputs and the results5 - have simulation results for the test cases
How confident are you that the result is correct?(subjective rating 0 - 5)
0 - there are no results1 - the results are incorrect2 - not sure the results are correct3 - think they are correct4 - reasonably sure they are correct5 - positive they are correct

3.13
Are tests written/changed consistent with the evaluation of theircomplexity and importance?(Subjective rating 0 - 5)0- there are no tests for this requirement1- there is a least one test2- there are several tests but not nearly enough3- the number of tests are reasonable but not sufficient given the importance or complexity of the requirement4- the number of tests are sufficient for the complexity and importance of the requirement5- the number of tests are more than adequate for the importance and complexity of this requirement
What is the evaluation of the domain conformance?
[This may be calculated subjectively, as is was done above or there may be a quantitative evaluationbased upon some predefined expectation.]
Focus: Cost[A quantitative specification of the costs of interest.]
What is the total cost of testing?
OR, depending upon the level of granularity required:
What is the staff time to make a test?
What is the staff time to run a test and check the result?
What is the staff time to isolate the fault?
What is the staff time to design and implement a fix?
What is the staff time to retest?
What is the machine time used?
Focus: Defect Slippage Model[A quantitative specification of the defect slippage quality perspective]
What is the number of faults failures discovered during system test, acceptance test and one month, sixmonths, one year after system release on this project?
3.14
What is the number of faults failures discovered during system test, acceptance test and one month, sixmonths, one year after system release on the set of projects classified as similar?
What is the ratio of faults in system test on this project to faults found from system test on?
What is the ratio of faults in system test on the set of similar projects to faults found from system test on?
What is the ratio of system test performance on this project to system test performance on the set ofsimilar projects?
Focus: Various General Defect Slippage Model s[A quantitative specification of the quality perspective a various general defect slippage models]
What is the number of errors, faults and failures on this projectin total,per line of code,by various classification schemes, andby cost to isolate, fix and overall,
Discovered during each phase of development and one month, six months, one year after systemrelease?
What is the number of errors, faults and failures on the set of similar projectsin total,per line of code,by various classification schemes, andby cost to isolate, fix and overall,
Discovered during each phase of development and one month, six months, one year after systemrelease?
What is the ratio of weighted faults in system test on this project to faults found from system test byvarious classification schemes?
What is the ratio of weighted faults in system test on the set of similar projects to faults found fromsystem test by various classification schemes?
What is the ratio of system test performance based upon the various slippage models on this project tosystem test performance on the set of similar projects?
Feedback[This includes questions related to improving the process relative to the quality perspective of interest.]
Does the system test method need to be refined or modified?

3.15
Is more or different training needed in the method or the technology?
Is more or different training needed in the application domain?
What should be automated?
What is the input to the requirements, specification, design and code techniques, methods, and tools,and the defect detection techniques, methods, and tools?
DATA SOURCES
System test tables:
System test table 1: Nature of requirements (Filled out after baselining of requirements)
Req. # How understandable Importance of testing is the requirement (marketing) (systest)_________________________________________________________R1 5 3 2 . . .(Req# is the list of each system or component requirement, how understandable is the requirement is thesubjective rating, importance of testing is a subjective rating by the marketing and system test group ofhow important the requirement is)
System test table 2: Nature of tests (Filled out after test plan)
Req. #of How well are Difficulty Evaluation Are # of tests Rating # tests tests known? of testing subj stat consistent with diff & import?____________________________________________________________R1 5 3 2 3 3/50 4 4 . . .(Req# is the list of each system or component requirement, # of tests is the number of tests run againstthat requirement, How well were the tests known in advance is a subjective rating,difficulty of testing is a rating by the test group of how hard they think it is to actually test the requirementsufficiently, evaluation consists of a subjective rating by the tester of the quality of the tests for thatparticular requirement, i.e. is the test set "adequate" for the requirement? and a statistical evaluation,performed by the software engineering group of the number of tests run (weighted by their subjective

3.16
quality, their importance and the difficulty of testing) divided by the total number of tests run for allrequirements, Rating is calculated by the SE group based upon the weighting of the question.)
System test table 3: Results of the tests (Filled out after tests run)
Test Failure? How confident # of Faults are you in found # Yes : No the results? ________________________________________________________T1 x 3 1 . . .(Req# is the list of each system or component requirement, How confident are you in the results? is asubjective rating, # of errors after test is filled out by the system test group based upon the number oferrors associated with the particular requirement based upon the given set of test cases.)
Acceptance Test Table:
Defect | Defect Classifications |
Operation Table:
Defect | Defect Classifications |
DATA PRESENTATIONS
Slippage model data:QEs, REs, RPEsEs, Ea, Eo
Histograms of:Number of faults found in each phaseThe number of requirements vs. subjective ratings of
how understandable the requirement isimportance of requirementdifficulty of testing the requirement. . .
Example:
Number | | | | | | | |of | | | | | | | |
3.17
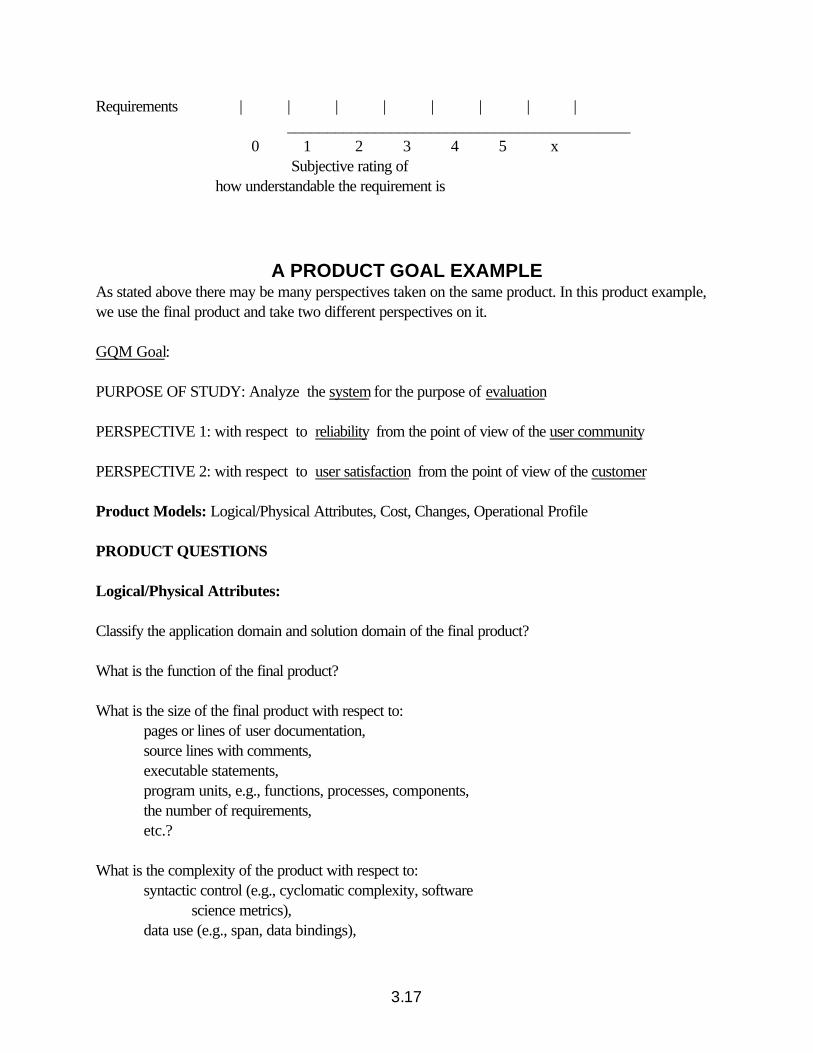
Requirements | | | | | | | |___________________________________________
0 1 2 3 4 5 x Subjective rating of how understandable the requirement is
A PRODUCT GOAL EXAMPLEAs stated above there may be many perspectives taken on the same product. In this product example,we use the final product and take two different perspectives on it.
GQM Goal:
PURPOSE OF STUDY: Analyze the system for the purpose of evaluation
PERSPECTIVE 1: with respect to reliability from the point of view of the user community
PERSPECTIVE 2: with respect to user satisfaction from the point of view of the customer
Product Models: Logical/Physical Attributes, Cost, Changes, Operational Profile
PRODUCT QUESTIONS
Logical/Physical Attributes:
Classify the application domain and solution domain of the final product?
What is the function of the final product?
What is the size of the final product with respect to:pages or lines of user documentation,source lines with comments,executable statements,program units, e.g., functions, processes, components,the number of requirements,etc.?
What is the complexity of the product with respect to:syntactic control (e.g., cyclomatic complexity, software
science metrics),data use (e.g., span, data bindings),

3.18
etc.for each appropriate unit?
What is the distribution of programming language features used?
What are the run-time time and space constraints?
COST
What is the effort by phase, activity, personnel type, used to develop the system?
How much machine time was used to develop the system; documentation as well as other aspects?
How much calendar time was used to develop the system and each component?
Presentation:
Histogram of the number of hours and the percent of time vs. the time card accounting sub-codes.
Histogram of the # of hours and the percent of time vs. the various activities (from the beginning of datacollection and during the last report period).
Number | | | | | | %| | | | | |
of | | | | | | of| | | | | |
Hours | | | | | | time _________________________________________________
A1 A2 A3 A4 ......
Where A1, A2, A3, etc., are the different activities for which time is being accounted.
CHANGES
A. Enhancements
What is the number of enhancements (normalized by calendar time, phase of project)?
What are the enhancements categorized by type (requirements, specification, design, architecture,planned enhancements, insert/delete debug code, improve clarity, optimize: space or time, feature,enhancement, bug)?

3.19
What are the enhancements categorized by market/external and internal needs?
What are the changes characterized by size, e.g., number of lines of code, number of componentsaffected, etc.?
What are the number of changes characterized by disposition, e.g., rejected as a change, not relevant,under consideration, being worked on, completed, saved for next enhancement?
What are the changes characterized by level of document changed?
How many customers are affected by the changes?
What is the Trouble Report history profile for each change?
B. Defects
What are the number of errors in total and by type, e.g., error origin, error domain?
What are the faults in total and by type, e.g., fault entry time, fault detection time/phase,á(omission,commission), software aspect, mechanism of discovery, product level?
What are the failures in total and by type, e.g. severity, failure detection time/phase?
What are the number of errors, faults and failures in total and by type, normalized by phase andcalendar time?
Presentations :
Histograms of the number of changes/defects by various classes.
Graphs of # of changes/defects initiated and closed vs. calendar time
Number of errors/component for each component
CONTEXT
A. Customer community
What classes of customers are expected to use the system?
3.20
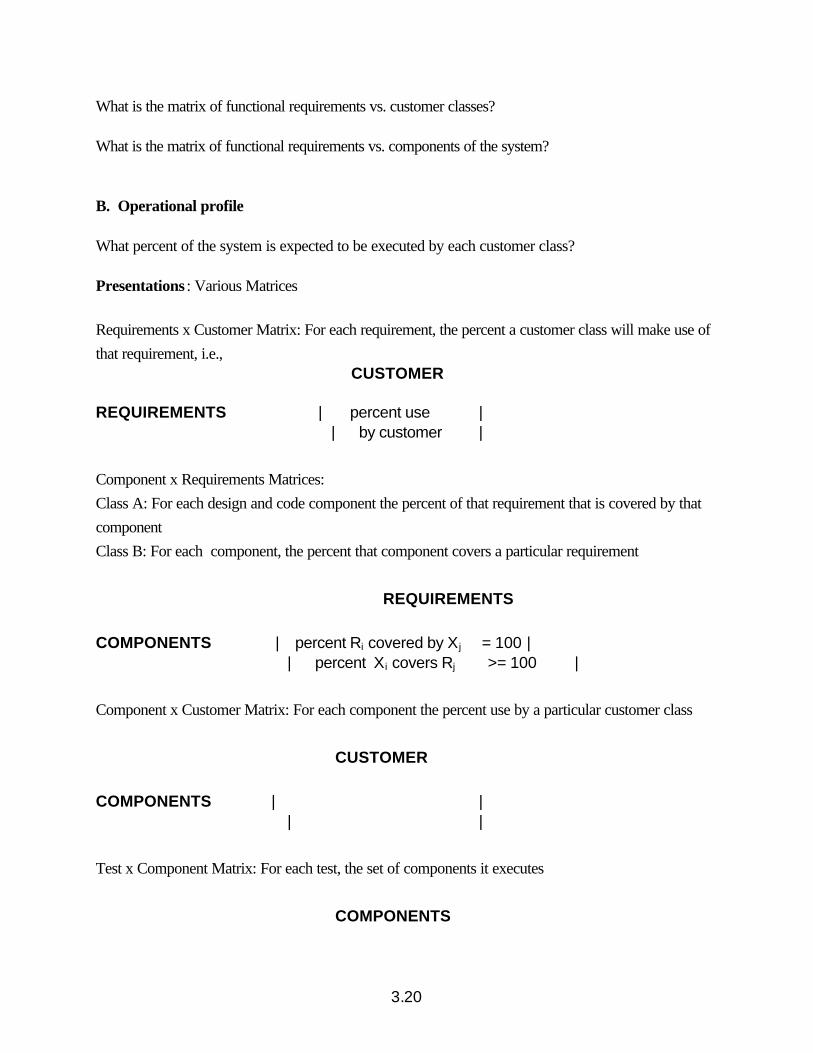
What is the matrix of functional requirements vs. customer classes?
What is the matrix of functional requirements vs. components of the system?
B. Operational profile
What percent of the system is expected to be executed by each customer class?
Presentations : Various Matrices
Requirements x Customer Matrix: For each requirement, the percent a customer class will make use ofthat requirement, i.e.,
CUSTOMER
REQUIREMENTS | percent use | | by customer |
Component x Requirements Matrices:Class A: For each design and code component the percent of that requirement that is covered by thatcomponentClass B: For each component, the percent that component covers a particular requirement
REQUIREMENTS
COMPONENTS | percent Ri covered by X j = 100 | | percent Xi covers Rj >= 100 |
Component x Customer Matrix: For each component the percent use by a particular customer class
CUSTOMER
COMPONENTS | || |
Test x Component Matrix: For each test, the set of components it executes
COMPONENTS
3.21
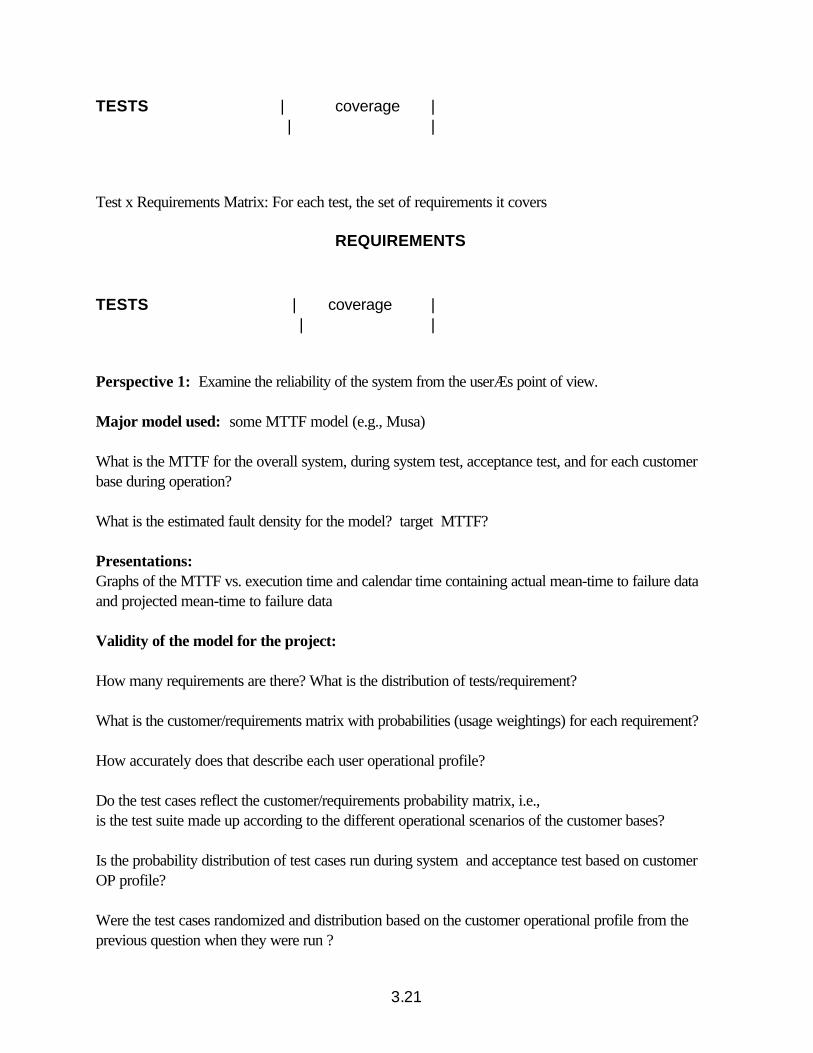
TESTS | coverage || |
Test x Requirements Matrix: For each test, the set of requirements it covers
REQUIREMENTS
TESTS | coverage | | |
Perspective 1: Examine the reliability of the system from the userÆs point of view.
Major model used: some MTTF model (e.g., Musa)
What is the MTTF for the overall system, during system test, acceptance test, and for each customerbase during operation?
What is the estimated fault density for the model? target MTTF?
Presentations:Graphs of the MTTF vs. execution time and calendar time containing actual mean-time to failure dataand projected mean-time to failure data
Validity of the model for the project:
How many requirements are there? What is the distribution of tests/requirement?
What is the customer/requirements matrix with probabilities (usage weightings) for each requirement?
How accurately does that describe each user operational profile?
Do the test cases reflect the customer/requirements probability matrix, i.e.,is the test suite made up according to the different operational scenarios of the customer bases?
Is the probability distribution of test cases run during system and acceptance test based on customerOP profile?
Were the test cases randomized and distribution based on the customer operational profile from theprevious question when they were run ?

3.22
Are corrections being made as failures are discovered?
Are new errors being introduced into the system during testing and debugging?
Is the model being run for each customer base with a different operational scenario?
Do the cumulative changes imply that the reliability model should be restarted?
Validity of data collected:
How valid is the failure data and the associated failure times?
Substantiation of the model:
Use of error profiles:
What is number of faults detected per 1000 lines and per component (one-half system test, system test,one-half certification, end of certification)?
Does this agree with previous projectsÆ fault history and reliability ratings?
Use of coverage data:
What is the requirement, component coverage of the test plan at various points in time?
Do the requirement and component coverage correspond to the distribution in the (requirement,component) and (component, customer) matrices?
Perspective 2: Examine the user satisfaction from the customerÆs point of view
Major model(s) used: User response to systemHow many failures are reported by the users?How many clarifications are requested by the user?Is the use of the system growing, shrinking, staying the same?How many requests are there for functional enhancements?How many functional change requests are real versus functions already in the system?How many performance change requests are being submitted?

3.23
Validity of the model for the project: User representationHas a user committee been appointed that covers all user types?Has the user community had any input into the requirements?Are there prototype screens for the users to play with?Is the user part of the test plan development?Is the user part of the test team?
Validity of the data collected:How valid is the data collected?
Substantiation of the model: User subjective evaluationHow responsive is the system to user request for functionality?How responsive is the system to user request for performance?How does the user rate the system with respect to: Ease of use, Functionality, Performance Ease of understanding the documentation? (A questionnaire should be made up)Why did you buy it?Did you get more, less, same as expected?How many others have you used?Would you recommend it to a friend? A competitor?Would you reorder?Which competitors did you considerHow many requests are there for functional enhancements?
FUTURE DIRECTIONS
Although the GQM is being used today by several organizations, there is still a great deal of researchand development needed to make it more effective and easier to use. As part of the TAME system, itneeds to be automated. Full or partially automated support should be provided for creating goals,defining models, associating goals with models, generating questions that define the goals in terms of themodels, generating the specifications for the data that needs to be collected, collecting and validatingthe data, analyzing the data in the context of the questions and models, interpreting the results withrespect to the goals and an experience base for storing the results of the analysis and all the modelsand our history with the models. All these mechanisms must be coordinated and integrated to providea complete and consistent view.
3.24
To support goal creation, it needs mechanisms to help in the selection and tailoring of existing goalsbased upon such factors as organizational needs, project requirements, past history and planningactivities. One possible mechanism is a decision support system.
Work in model definition requires the development of various modeling languages for process models,product models and quality models. We need mechanisms to allow these models to be easily modified.Modification may take the form of generalizing, tailoring or allowing various options depending onvarious environmental factors.
The goal definition template needs to be automated to allow the instantiation of various models for anyset of goals, the generation of questions that define the goals in terms of the models and the generationof the specification for the data that needs to be collected. This requires a formal basis for modelselection and the definition of a goal generation language that automates the generation of questions anddata based upon the goals and models.
Data can be collected automatically or via on-line forms, that can allow the collection, storage, andanalysis of data based upon the models and the automated updating of the models in the experiencebased, from what we have learned in applying and evaluating the models.
Work in several of these areas is currently under investigation and in some cases prototypes exist.