CS 551 Estimation Fall 2005 1 December 2005. QSE Lambda Protocol Prospectus Measurable Operational...
29
CS 551 Estimation Fall 2005 1 December 2005
-
date post
21-Dec-2015 -
Category
Documents
-
view
215 -
download
2
Transcript of CS 551 Estimation Fall 2005 1 December 2005. QSE Lambda Protocol Prospectus Measurable Operational...

CS 551 Estimation
Fall 2005
1 December 2005

QSE Lambda Protocol
• Prospectus
• Measurable Operational Value
• Prototyping or Modeling
• sQFD
• Schedule, Staffing, Quality Estimates
• ICED-T
• Trade-off Analysis

Requirements Specification Spec
1. Project Title, Revision Number and Author2. Scope and Purpose of the system3. Measurable Operational Value4. Description5. Feature List including ICED T and Simplified QFD
analysis6. Interfaces7. Constraints8. Change Log and Expected Changes9. Responses to the unexpected10.Measurements11.Glossary12.References

Specification for Development Plan
• Project• Feature List• Development Process• Size Estimates• Staff Estimates• Schedule Estimates• Organization• Gantt Chart

Sizing Software Projects
• Effort = (productivity) (size)c
Staff
months
Lines of Code or
Function Points
500
Lines of Code
• LOC= Line of Code
• SLOC = Source Line of Code
• NCSLOC = New or Changed Source of Lines of Code

0
2
4
6
8
10
12
20 40 80 160 320 640 1280 2560 5120 10240 20480 40960
Function Points
Bell Laboratories data
Capers Jones data
Prod
uctiv
ity (F
unct
ion
poin
ts /
staf
f mon
th)
Productivity= f(Size)

Bernstein’s rule of thumb
• Productivity per staff-month:• 50 NCSLOC for OS code (or real-time system)• 250 NCSLOC for intermediary applications
(high risk, on-line)• 500 NCSLOC for normal applications (low risk,
on-line)• 10,000 NCSLOC for reused code
Reuse note: Sometimes, reusing code that does not provide the exact functionality needed can be achieved by reformatting input/output. This decreases performance but dramatically shortens development time.

Software Development Productivity for Industry Average Transaction Projects
Characteristic
Software Development Productivity (SLOC/WM)
Classical rates 130 - 195
Evolutionary approaches
244 - 325
New embedded flight software
17 – 105
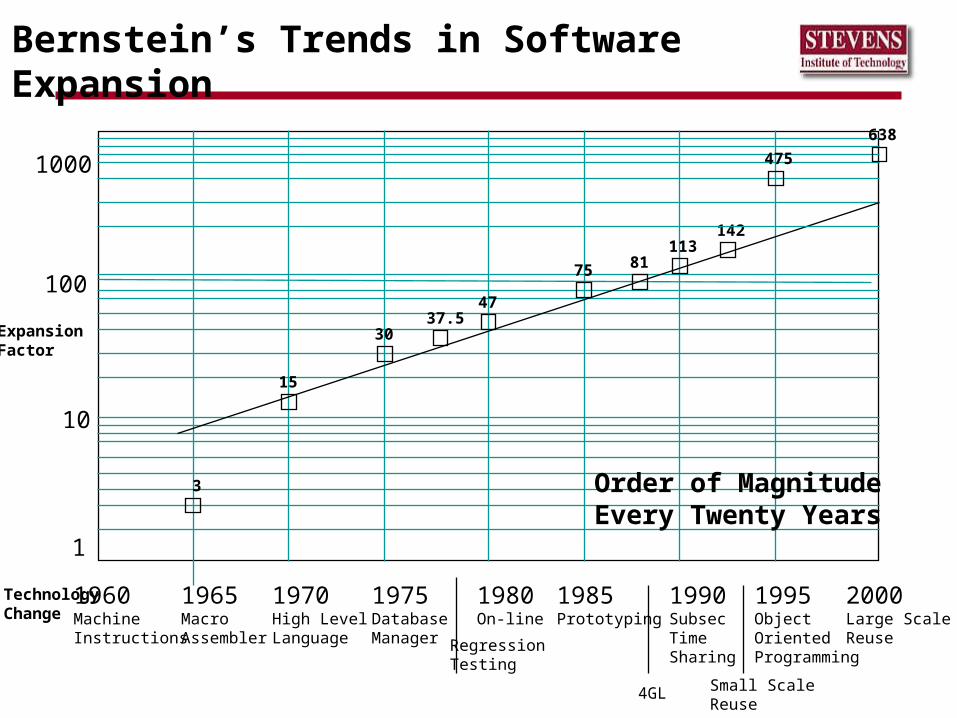
Bernstein’s Trends in Software Expansion
Small ScaleReuse
1990SubsecTime Sharing
1995ObjectOrientedProgramming
1960MachineInstructions
1965MacroAssembler
1970High LevelLanguage
1975Database Manager
1980On-line
1985Prototyping
2000Large ScaleReuse
1
10
100
1000
3
15
3037.5
47
75 81113
142
475
638
RegressionTesting
4GL
Order of MagnitudeEvery Twenty Years
ExpansionFactor
TechnologyChange

Function Point Analysis
• Can use early in project (data from requirements)• Substantial data supports the methodology• Software Shop and Project characteristics are
accounted for in the Adjusted Function Points Technology and Project Methodology dependent
Technology changes negate history until the new relative improvement is established
• Still have to estimate other elements of the project• Could be done by converting UFPs to LOC for a specific
language (technology) and then using an algorithmic tool such as COCOMO or SLIM.
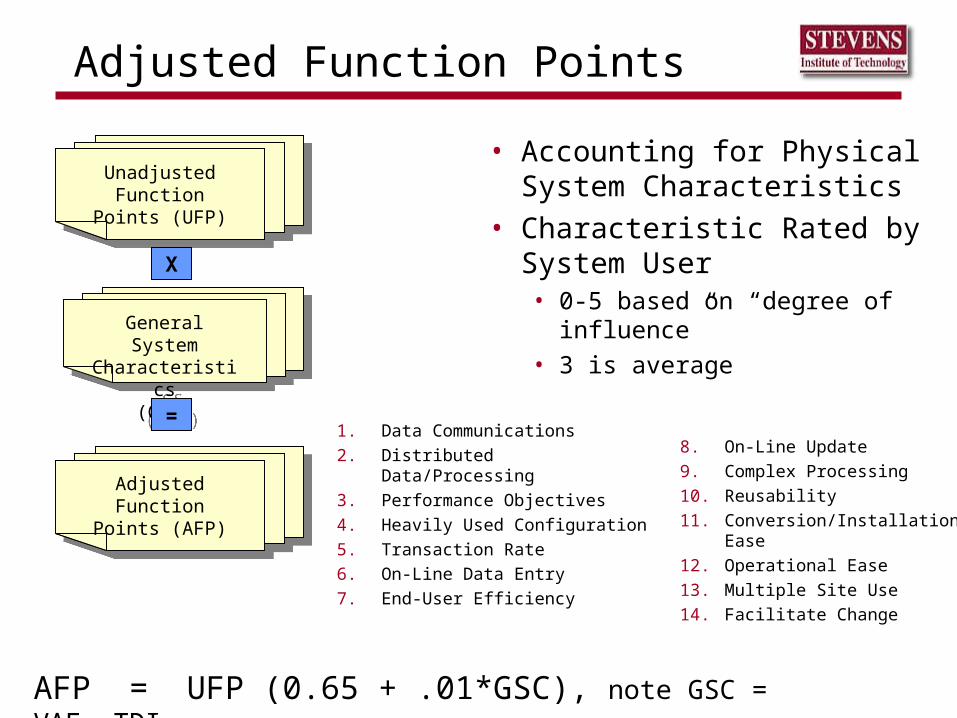
Adjusted Function Points
• Accounting for Physical System Characteristics
• Characteristic Rated by System User• 0-5 based on “degree of
influence”• 3 is average
UnadjustedFunction
Points (UFP)
UnadjustedFunction
Points (UFP)
General SystemCharacteristics
(GSC)
General SystemCharacteristics
(GSC)
X
=
AdjustedFunction
Points (AFP)
AdjustedFunction
Points (AFP)
AFP = UFP (0.65 + .01*GSC), note GSC = VAF= TDI
1. Data Communications
2. Distributed Data/Processing
3. Performance Objectives
4. Heavily Used Configuration
5. Transaction Rate
6. On-Line Data Entry
7. End-User Efficiency
8. On-Line Update
9. Complex Processing
10. Reusability
11. Conversion/Installation Ease
12. Operational Ease
13. Multiple Site Use
14. Facilitate Change
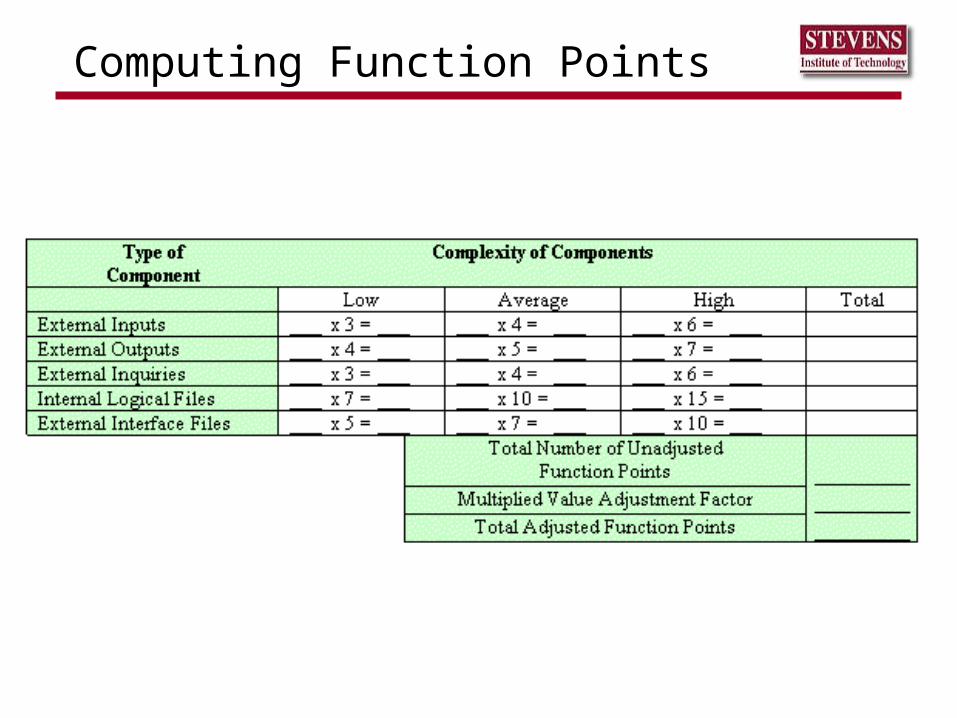
Computing Function Points

External Inputs – One updates two files
External Inputs (EI) - when data crosses the boundary from outside to inside. This data may come from a data input screen or another application.

External Interface Table
For example, EIs that reference or update 2 File Types Referenced (FTR’s) and has 7 data elements would be assigned a ranking of average and associated rating of 4.
File Type References (FTR’s) are the sum of Internal Logical Files referenced or updated and External Interface Files referenced.
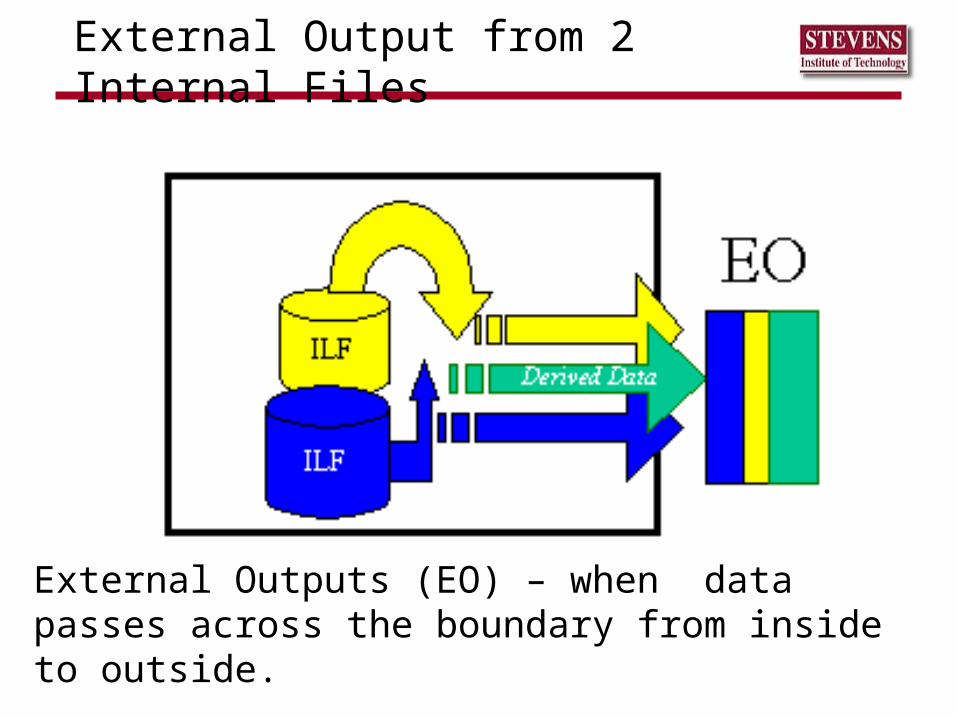
External Output from 2 Internal Files
External Outputs (EO) – when data passes across the boundary from inside to outside.

External Inquiry drawing from 2 ILFs
External Inquiry (EQ) - an elementary process with both input and output components that result in data retrieval from one or more internal logical files and external interface files. The input process does not update Internal Logical File, and there is no derived data.

EO and EQ Table mapped to Values

Computing Function Points
Internal Logical Files
Internal Logical Files (ILF’s) - a user identifiable group of logically related data that resides entirely within the applications boundary and is maintained through external inputs.

External Interface Files
• External Interface Files (EIF’s) - a user identifiable group of logically related data that is used for reference purposes only. The data resides entirely outside the application and is maintained by another application. The external interface file is an internal logical file for another application.

Proposed System
Proposed System
Check Status
Create Order
Shipment Notice
Inventory
Assign Inventory to Order
Inventory Assigned
New Inventory for Held Orders
Assign Order to Truck
Truckload Report
Shipping Invoices
Order Update
Order Display
Problem ResolutionDispatch
Accounting
Management Reports
Customer
Check Credit &
Completion
Users
Catalog
Orders
OrderCreation
Credit Check
InventoryAssignment
Held OrderProcessing
Completion
DispatchSupport
ProblemResolution
ManagementReporting
OA&M
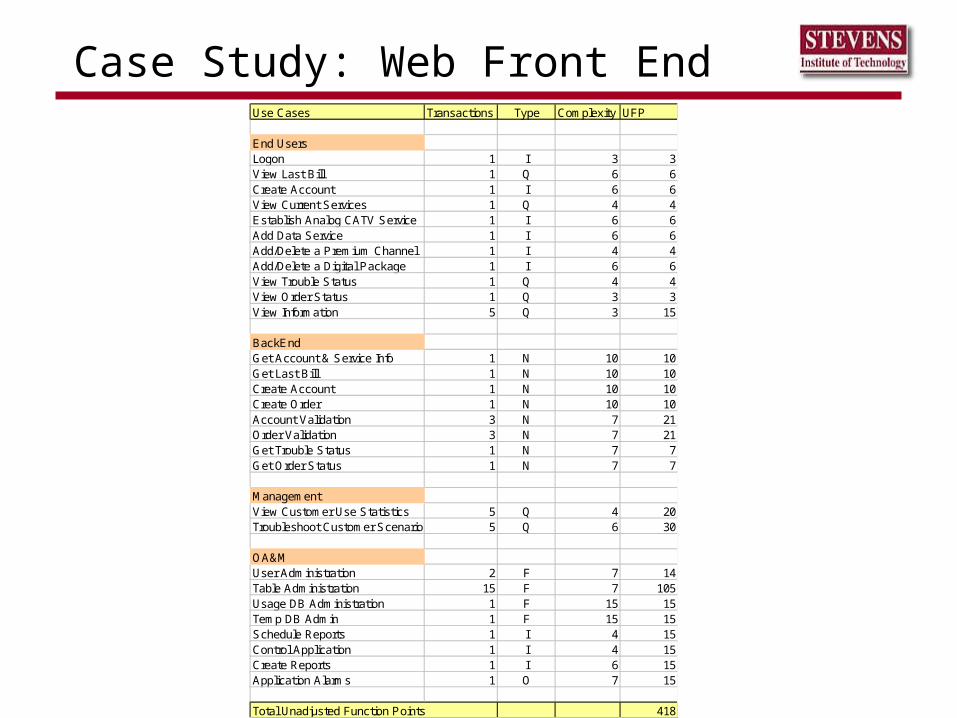
Case Study: Web Front EndUse Cases Transactions Type Complexity UFP
End UsersLogon 1 I 3 3View Last Bill 1 Q 6 6Create Account 1 I 6 6View Current Services 1 Q 4 4Establish Analog CATV Service 1 I 6 6Add Data Service 1 I 6 6Add/Delete a Premium Channel 1 I 4 4Add/Delete a Digital Package 1 I 6 6View Trouble Status 1 Q 4 4View Order Status 1 Q 3 3View Information 5 Q 3 15
BackEndGet Account & Service Info 1 N 10 10Get Last Bill 1 N 10 10Create Account 1 N 10 10Create Order 1 N 10 10Account Validation 3 N 7 21Order Validation 3 N 7 21Get Trouble Status 1 N 7 7Get Order Status 1 N 7 7
ManagementView Customer Use Statistics 5 Q 4 20Troubleshoot Customer Scenario 5 Q 6 30
OA&MUser Administration 2 F 7 14Table Administration 15 F 7 105Usage DB Administration 1 F 15 15Temp DB Admin 1 F 15 15Schedule Reports 1 I 4 15Control Application 1 I 4 15Create Reports 1 I 6 15Application Alarms 1 O 7 15
Total Unadjusted Function Points 418
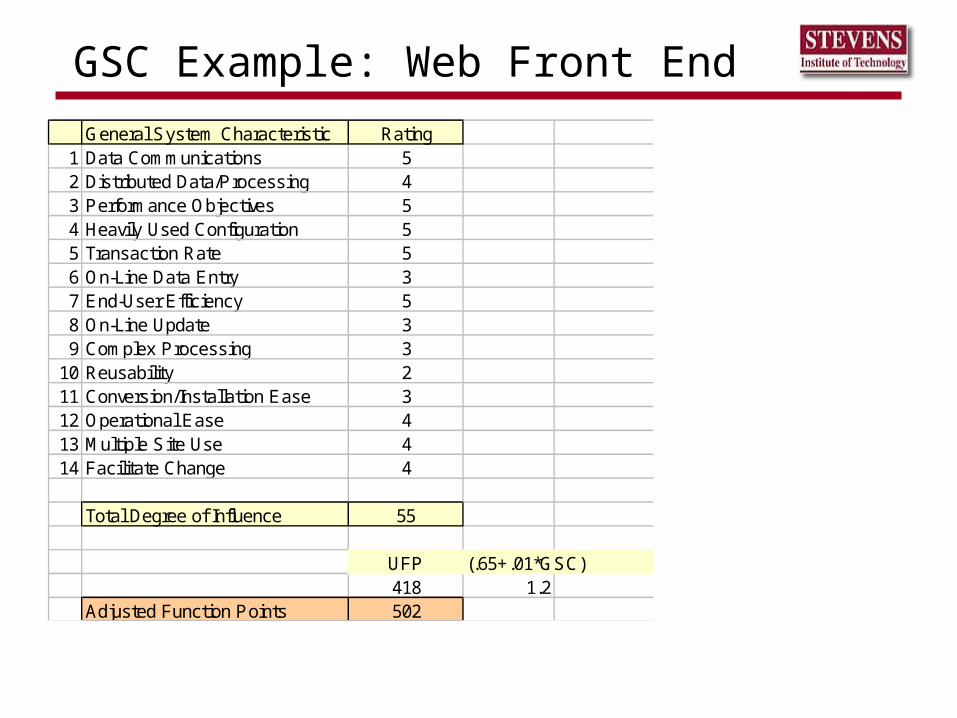
GSC Example: Web Front End
General System Characteristic Rating1 Data Communications 52 Distributed Data/Processing 43 Performance Objectives 54 Heavily Used Configuration 55 Transaction Rate 56 On-Line Data Entry 37 End-User Efficiency 58 On-Line Update 39 Complex Processing 3
10 Reusability 211 Conversion/Installation Ease 312 Operational Ease 413 Multiple Site Use 414 Facilitate Change 4
Total Degree of Influence 55
UFP (.65+.01*GSC)418 1.2
Adjusted Function Points 502

Software Costing
• Cost Development using FPA
• Estimate • Requirements
Engineering (1/3 of implementation
• Design (1/5 of implementation)
• Testing (1/4 of implementation
• Documentation & Training
FP per mo 5Dev Staff Mos 65.8Dev Staff Yrs 5.5Sys Eng 1.8Design 1.1Test 1.8Doc 1.0Trng 1.0Total 12.2
Staff Cost $150,000Project Cost $1,836,173
7.6

Function Points Evaluated
Advantages Disadvantages
Standards are established and reviewed frequently. Technology, platform, and language independent.
Largely a manual process primarily for transaction systems. Backfiring, FP derived from SLOC, is inaccurate and misleading.
Results are logical. Estimates are from the user’s perspective.
Accurate counting requires in-depth knowledge of standards and extensive training.
Estimates from requirements through full life-cycle.
Variations exist that are not standardized.

The COCOMO model
• Effort = a(NCSLOC/1000)b
• Embedded systems: a=3.6 b=1.2
• Semi-detached: a=3.0 b=1.12
• Application: a=2.4 b=1.05

COCOM II
• Effort = A(size)b П EM(i)• b = B + 0.01+∑SF(j); SF(j) are 5 scale
factors
• EM(i) : 17 cost drivers
See:
http://sunset.usc.edu/research/COCOMOII
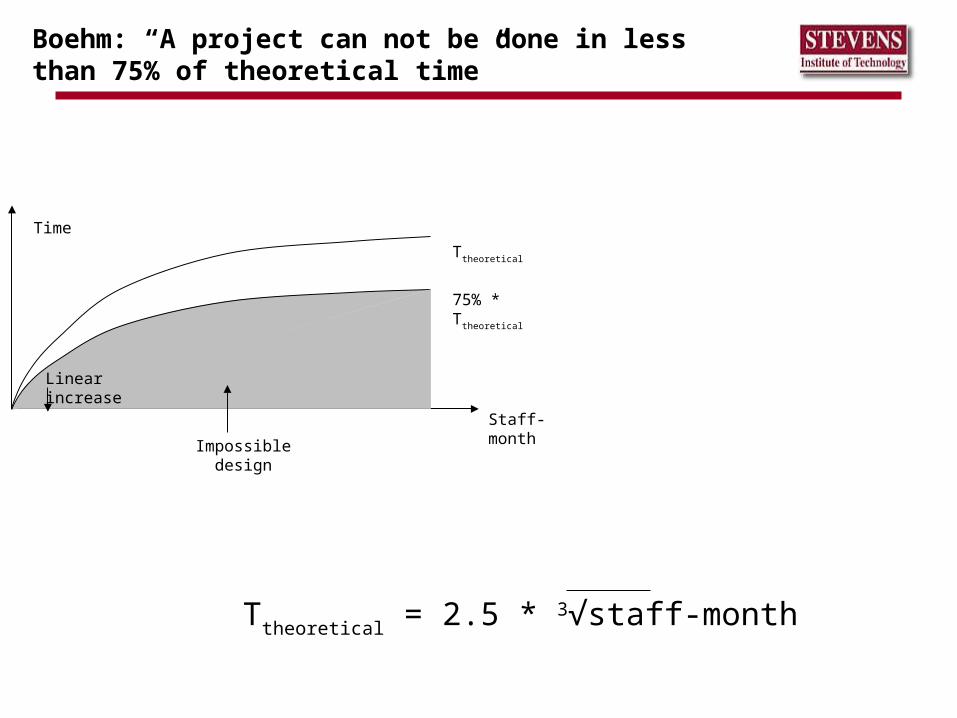
Time
Staff-month
Ttheoretical
75% * Ttheoretical
Impossible design
Linear increase
Boehm: “A project can not be done in less than 75% of theoretical time”
Ttheoretical = 2.5 * 3√staff-month