
Deep cloud observability and advanced AIOps are key to ...
52
Deep cloud observability and advanced AIOps are key to scaling DevOps practices 2021 Global DevOps Report
Transcript of Deep cloud observability and advanced AIOps are key to ...

Deep cloud observability and advanced AIOps are key to scaling DevOps practices
2021 Global DevOps Report

The need for speed has never been more urgent. In today’s hyper-digital age,
organizations are under pressure to deliver new digital services in an increasingly
short timeframe. This places a burden on DevOps and Site Reliability Engineering
(SRE) teams, who must continue to meet their service level objectives (SLOs)
for the business, while driving shorter development cycles, producing better
quality software, and innovating faster than ever before. However, these
teams continue to grapple with time-consuming, manual processes and siloed
cultures. These challenges hinder organizations’ ability to scale DevOps practices
enterprise-wide and achieve ambitious digital transformation goals. A new,
more intelligent approach is needed to ensure faster time-to-market, greater
frequency of releases, and higher quality software, all of which are critical to
keep up with today’s business and customer demands.
This report examines the challenges DevOps and SRE teams face as they
work toward their objectives. Its findings highlight how these difficulties can
be overcome with a platform-based approach that offers full observability,
automation, and AI across the software development lifecycle.
Introduction
What’s inside
DevOps is critical to meet the rising pressure to innovate faster
Reducing friction for developers is critical to digital transformation
A unified toolchain is key to DevOps success
AI-augmented DevOps is essential to balancing speed and quality
Deeper, broader observability will enable DevOps at scale
©2021 Dynatrace2021 Global DevOps Report 2
1
3
5
2
4
2021 Global DevOps Report
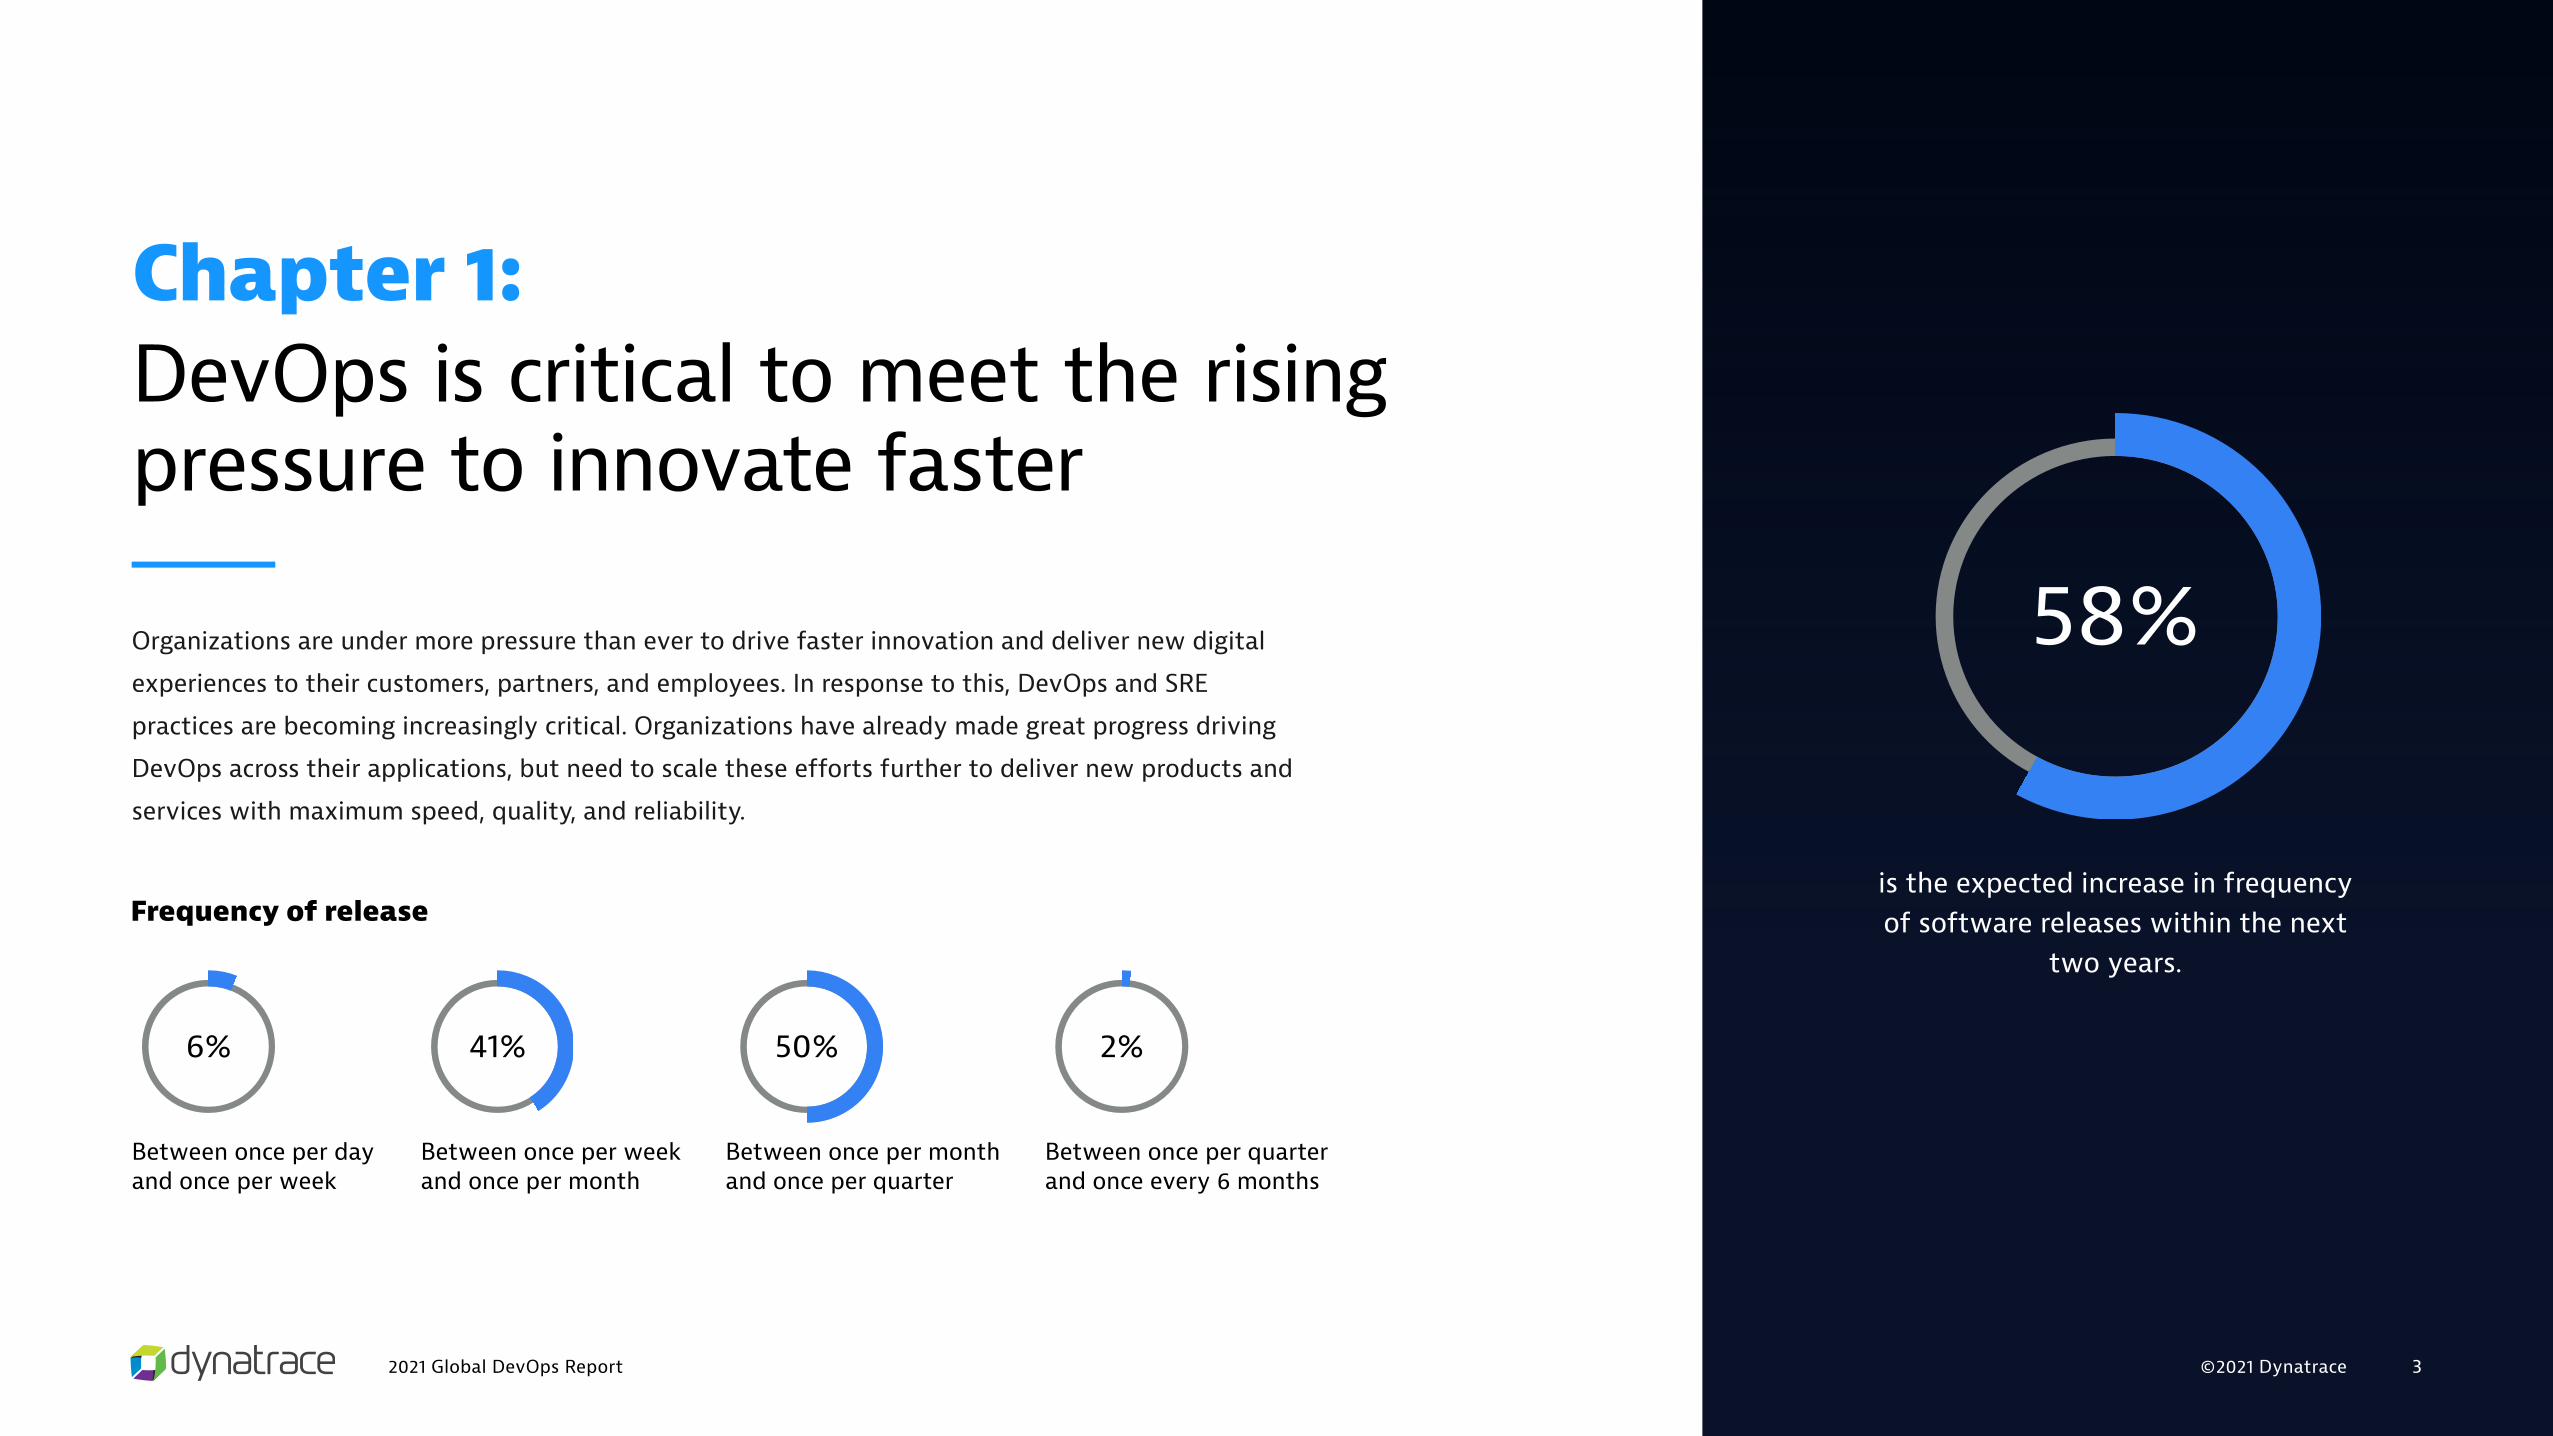
Chapter 1:DevOps is critical to meet the rising pressure to innovate faster
Organizations are under more pressure than ever to drive faster innovation and deliver new digital
experiences to their customers, partners, and employees. In response to this, DevOps and SRE
practices are becoming increasingly critical. Organizations have already made great progress driving
DevOps across their applications, but need to scale these efforts further to deliver new products and
services with maximum speed, quality, and reliability.
is the expected increase in frequency of software releases within the next
two years.
Frequency of release
Between once per day and once per week
Between once per month and once per quarter
Between once per week and once per month
Between once per quarter and once every 6 months
©2021 Dynatrace 3

©2021 Dynatrace2021 Global DevOps Report 4
Chapter 1:
DevOps is critical to meet the rising pressure to innovate faster
admit they are often under
so much pressure to meet the
demand for faster innovation
that they must sacrifice
code quality
of DevOps leaders say
extending DevOps to
more applications is key
for digital transformation
and customer experience
of applications will
be fully DevOps
enabled by 2023

©2021 Dynatrace2021 Global DevOps Report 5©2021 Dynatrace 5
Chapter 2:Reducing friction for developers is critical to digital transformation
Despite their continued efforts to accelerate innovation, DevOps teams are held back by siloed and often
conflicting data insights, as well as time-intensive, manual CI/CD processes. This includes a heavy reliance
on human intervention in key stages of delivery, such as quality assurance and incident response, which
makes DevOps teams more reactive than proactive, and reduces the time they have available for more
value-driven tasks. As they seek to address this, organizations are realizing that automation across the
software development lifecycle and breaking down team silos are key to meeting the demand for faster
innovation.
of IT and DevOps teams’ time is spent on
manual CI/CD tasks like detecting code
quality issues, which reduces time
spent on innovation

©2021 Dynatrace2021 Global DevOps Report 6
Chapter 2:
Reducing friction for developers is critical to digital transformation
To boost developer productivity, experience, and quality of life, DevOps leaders are investing in:
Modernizing tool stacks Eliminating manual
incident response
Automation of manual
CI/CD tasks
End-to-end observability AIOps-driven
decision-making
capabilities
DevOps value stream
management and
orchestration
68% 62% 62%45%
39%44%

©2021 Dynatrace2021 Global DevOps Report 7
Chapter 2:
Reducing friction for developers is critical to digital transformation
say siloed team culture
is a barrier to DevOps success
say application complexity
is a barrier to DevOps success

©2021 Dynatrace2021 Global DevOps Report 8©2021 Dynatrace 8
Chapter 3:A unified toolchain is key to DevOps success
The increased prevalence of DevOps and continued adoption of cloud-based services has also resulted
in larger, more complex, and fragmented toolchains across the software development lifecycle. This is
hindering DevOps and SRE teams’ ability to work more effectively and maximize their output. To keep up
with the rapidly accelerating speed of innovation, organizations need to find a way to unify their toolchain
and provide more intuitive solutions that allow teams to perform key tasks with ease. This will enable
their teams to shorten development cycles, release faster, and refocus their efforts on activities that create
more value for the business.

©2021 Dynatrace2021 Global DevOps Report 9
Chapter 3:
A unified toolchain is key to DevOps success
say toolchain
complexity is a barrier
for DevOps success
say their DevOps toolchains
are becoming increasingly
fragmented and impeding
their ability to accelerate
innovation
say modernizing their
tool stacks is a priority
for increasing developer
productivity
say increased automation
will be essential to managing
and operating their DevOps
toolchains in the future

©2021 Dynatrace2021 Global DevOps Report 10©2021 Dynatrace 10
Chapter 4:AI-augmented DevOps is essential to balancing speed and quality
With a growing list of responsibilities, and more demands than ever on their time, DevOps and SRE teams
often find themselves under pressure to make a trade-off between maintaining quality and accelerating
delivery. In an age of 24/7 connectivity, when customers have an increasingly low tolerance for poor
digital experiences, this introduces unacceptable business risk. Therefore, organizations urgently need a
new approach to software delivery so their teams don’t have to choose between quality or speed. This
approach must augment human teams with AI and continuous automation capabilities that enable them
to drive faster, more secure release cycles with greater confidence and less risk.
of respondents say extending AIOps beyond
traditional use cases will play a critical role in the
future success of DevOps and SRE teams
By 2023, investment into automating code
delivery, deployment, and remediation across
DevOps pipelines is set to rise by 34%

©2021 Dynatrace2021 Global DevOps Report 11
Chapter 4:
AI-augmented DevOps is essential to balancing speed and quality
DevOps leaders are investing in the following to boost confidence in quality of software releases:
CI/CD automation Testing-as-a-Service Test automation AIOps-driven root
cause analysis
Testing software
quality earlier in the
development cycle
(shift-left quality)
Chaos engineering Testing security
earlier in the
development cycle
(shift-left security)
58%54%
43% 41%32%
28%34%

©2021 Dynatrace2021 Global DevOps Report 12©2021 Dynatrace 12
Chapter 5:Deeper, broader observability will enable DevOps at scale
Many organizations are still struggling to scale DevOps adoption from a series of lighthouse projects to
a true enterprise-wide culture and methodology. As they work to create more scalable DevOps and SRE
practices, organizations are investing in maturing their observability capabilities. They are also looking
for new ways to empower their teams with a single source of truth throughout the entire software
development lifecycle, which enables better collaboration and greater productivity. As a result, their
teams will be able to deliver higher quality software, shorten development cycles, and have more time
available to drive innovation.

©2021 Dynatrace2021 Global DevOps Report 13
Chapter 5:
Deeper, broader observability will enable DevOps at scale
say end-to-end observability
will be essential to DevOps
in the future
say a unified end-to-end platform
that seamlessly integrates their
toolchains will be critical to their
ability to scale DevOps beyond a
single lighthouse project

©2021 Dynatrace2021 Global DevOps Report 14
The Dynatrace difference
The unified Dynatrace® platform combines observability across the full software development lifecycle with application security and advanced
AIOps. Precise, AI-driven answers and continuous automation free development, DevOps, and SRE teams from time-consuming, manual tasks, while
helping to ensure releases maintain the highest levels of security and reliability. With a single source of truth, these teams can now collaborate more
effectively to deliver high-quality, innovative software faster.
Why Dynatrace is radically different:
Automatic
Zero-touch configuration, continuous
discovery, and topology mapping in
real time, with instant answers
and precise causation.
Full stack
Explainable AI engine, Davis®, which is built into
the core of the Dynatrace® platform, processes
billions of dependencies for instantly precise
answers, prioritized by business impact and
with root-cause determinization.
Intelligent
Understand all the relationships and
interdependencies, top to bottom —
from cloud infrastructure, applications
and microservices, to end-user
experience.
Enterprise scale
Automatic, enterprise-wide
deployment with support for latest
cloud-native architectures and
role-based governance.

©2021 Dynatrace2021 Global DevOps Report 15
Methodology
This report is based on a global survey of 1,300 development and DevOps leaders in large enterprises
with more than 1,000 employees, conducted by Coleman Parkes and commissioned by Dynatrace. The
sample included 200 respondents in the U.S., 100 in Latin America, 600 in Europe, 250 in Asia Pacific,
and 150 in the Middle East. For a detailed breakdown of findings by region, please refer to the global
data summary appendix.

©2021 Dynatrace2021 Global DevOps Report 16
Appendix
Global Data Summary: U.S. & Latin America — Chapter 1
Sample includes 200 respondents from the U.S. and 50 respondents from each of Brazil and Mexico.
Frequency at which organizations release software updates to their critical applications
U.S. Brazil Mexico
On demand (multiple deploys a day) 0% 0% 0%
Between once per day and once per week 1% 12% 8%
Between once per week and once per month 38% 30% 26%
Between once per month and once per quarter 59% 54% 60%
Between once per quarter and once every six months 2% 4% 6%

©2021 Dynatrace2021 Global DevOps Report 17
Appendix
Global Data Summary: U.S. & Latin America — Chapter 1
Country
Average frequency at which organizations release software updates to their critical applications (days)
Average expected increase in deployment frequency
of updates for critical apps by 2023
DevOps leaders that say they are often under so much
pressure for faster innovation they sacrifice code quality
DevOps leaders that say extending DevOps to more
apps is key for digital transformation and CX
Percentage of apps that will be fully DevOps-enabled
by 2023
U.S. 46 55% 16% 95% 41%
Brazil 44 63% 26% 100% 45%
Mexico 49 60% 30% 100% 42%

©2021 Dynatrace2021 Global DevOps Report 18
Appendix
Global Data Summary: U.S. & Latin America — Chapter 2
CountryAverage percentage of IT and DevOps
teams’ time spent on manual CI/CD tasks like detecting code quality issues
Average annual labor cost for DevOps teams’ time spent on manual CI/CD tasks*
U.S. 27% $6.6m
Brazil 30% $8m
Mexico 30% $8m
*(based on average salaries and percentage of working hours dedicated to these tasks)

©2021 Dynatrace2021 Global DevOps Report 19
Appendix
Global Data Summary: U.S. & Latin America — Chapter 2
Areas DevOps leaders are investing in to boost developer productivity, experience, and quality of life
U.S. Brazil Mexico
Modernizing tool stacks 69% 52% 58%
Eliminating manual incident response 56% 62% 56%
Automation of manual CI/CD tasks 61% 52% 70%
End-to-end observability 43% 48% 46%
AIOps-driven decision-making capabilities 41% 50% 54%
DevOps value stream management and orchestration 28% 40% 44%

©2021 Dynatrace2021 Global DevOps Report 20
Appendix
Global Data Summary: U.S. & Latin America — Chapter 2
Barriers to DevOps success identified by DevOps leaders U.S. Brazil Mexico
Siloed team culture 60% 72% 76%
Application complexity 61% 60% 72%
Lack of automation 42% 28% 28%
DevOps toolchains becoming more complex / fragmented 22% 40% 32%
©2021 Dynatrace2021 Global DevOps Report 21
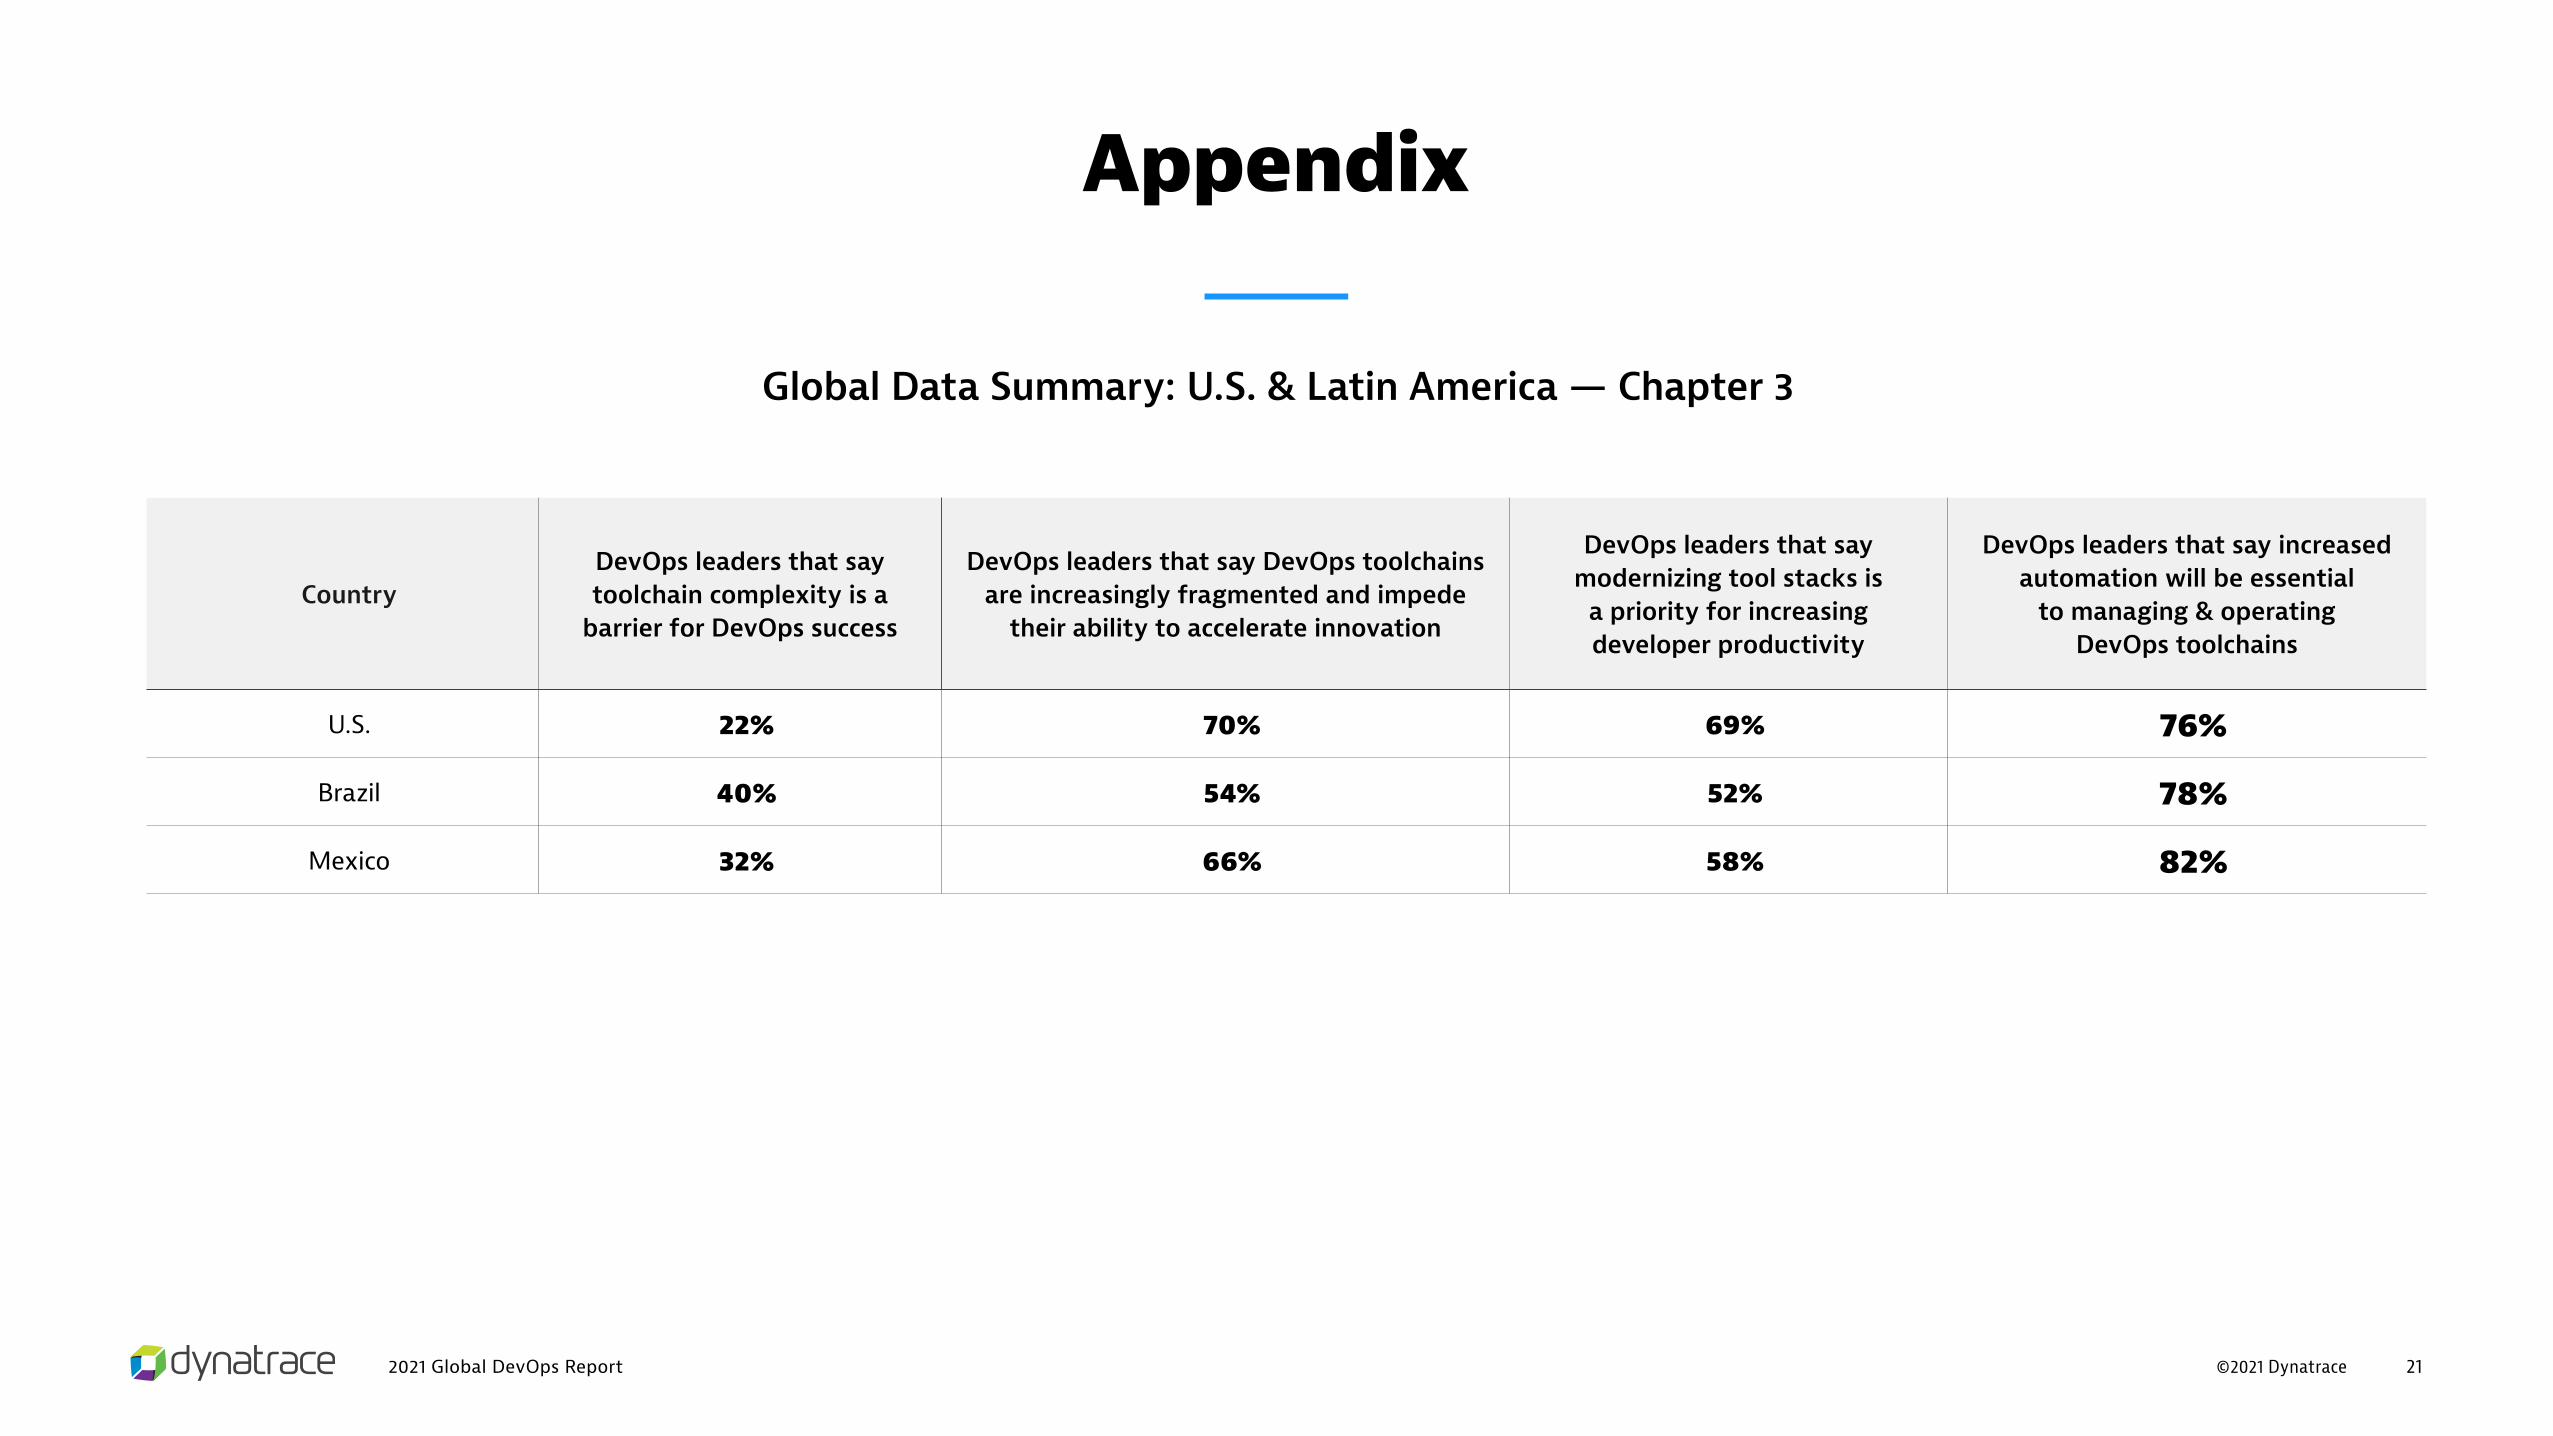
Appendix
Global Data Summary: U.S. & Latin America — Chapter 3
CountryDevOps leaders that say toolchain complexity is a
barrier for DevOps success
DevOps leaders that say DevOps toolchains are increasingly fragmented and impede
their ability to accelerate innovation
DevOps leaders that say modernizing tool stacks is
a priority for increasing developer productivity
DevOps leaders that say increased automation will be essential
to managing & operating DevOps toolchains
U.S. 22% 70% 69% 76%
Brazil 40% 54% 52% 78%
Mexico 32% 66% 58% 82%

©2021 Dynatrace2021 Global DevOps Report 22
Appendix
Global Data Summary: U.S. & Latin America — Chapter 4
Country
DevOps leaders that say extending AIOps beyond traditional use cases will play a critical role in
the future success of DevOps engineers and SRE teams
Average increase expected in investment into automating code delivery, deployment, and
remediation across DevOps pipelines by 2023
U.S. 72% 32%
Brazil 84% 40%
Mexico 70% 37%

©2021 Dynatrace2021 Global DevOps Report 23
Appendix
Global Data Summary: U.S. & Latin America — Chapter 4
Areas DevOps leaders are investing in to boost confidence in quality of software releases
U.S. Brazil Mexico
CI/CD automation 58% 56% 56%
Testing-as-a-Service 49% 66% 56%
Test automation 35% 42% 38%
AIOps-driven root cause analysis 34% 38% 40%
Testing software quality earlier in the development cycle (shift-left quality) 40% 34% 30%
Chaos engineering 30% 20% 32%
Testing security earlier in the development cycle (shift-left security) 27% 28% 26%

©2021 Dynatrace2021 Global DevOps Report 24
Appendix
Global Data Summary: U.S. & Latin America — Chapter 5
CountryDevOps leaders that say end-to-end observability
will be essential to DevOps in the future
DevOps leaders that say a unified end-to-end platform that seamlessly integrates their toolchains
will be critical to their ability to scale DevOps beyond a single lighthouse project
U.S. 82% 84%
Brazil 82% 64%
Mexico 82% 76%

©2021 Dynatrace2021 Global DevOps Report 25
Appendix
Global Data Summary: Europe — Chapter 1
Sample includes 100 respondents from each of the UK, France, Germany, Italy, and Spain, and 25 respondents from each of Sweden, Denmark, Finland, and Norway.
Frequency at which organizations release software updates to their critical applications
UK France Germany Italy Spain Sweden Denmark Finland Norway
On demand (multiple deploys a day) 0% 0% 0% 0% 0% 0% 0% 0% 0%
Between once per day and once per week 11% 6% 4% 2% 4% 0% 8% 4% 20%
Between once per week and once per month 36% 38% 47% 34% 27% 52% 20% 36% 36%
Between once per month and once per quarter 49% 53% 46% 61% 63% 44% 72% 60% 40%
Between once per quarter and once every six months 3% 3% 3% 3% 6% 4% 0% 0% 4%

©2021 Dynatrace2021 Global DevOps Report 26
Appendix
Global Data Summary: Europe — Chapter 1
Country
Average frequency at which organizations release software
updates to their critical applications (days)
Average expected increase in deployment frequency
of updates for critical apps by 2023
DevOps leaders that say they are often under so much
pressure for faster innovation they sacrifice code quality
DevOps leaders that say extending DevOps to more
apps is key for digital transformation and CX
Percentage of apps that will be fully DevOps-enabled
by 2023
UK 43 60% 26% 100% 44%
France 43 67% 22% 100% 50%
Germany 40 63% 15% 99% 45%
Italy 47 58% 30% 99% 41%
Spain 51 57% 25% 99% 42%
Sweden 41 57% 16% 100% 37%
Denmark 47 55% 20% 100% 38%
Finland 43 61% 20% 96% 46%
Norway 37 72% 16% 100% 46%

©2021 Dynatrace2021 Global DevOps Report 27
Appendix
Global Data Summary: Europe — Chapter 2
CountryAverage percentage of IT and DevOps teams’ time spent on manual CI/CD tasks like detecting code
quality issues
Average annual labor cost for DevOps teams’ time spent on manual CI/CD tasks*
UK 30% $7.9m
France 33% $9m
Germany 31% $8.5m
Italy 27% $7m
Spain 29% $7.7m
Sweden 27% $6.4m
Denmark 23% $5.4m
Finland 31% $5.9m
Norway 33% $8m
*(based on average salaries and percentage of working hours dedicated to these tasks)

©2021 Dynatrace2021 Global DevOps Report 28
Appendix
Global Data Summary: Europe — Chapter 2
Areas DevOps leaders are investing in to boost developer productivity, experience, and quality of life
UK France Germany Italy Spain Sweden Denmark Finland Norway
Modernizing tool stacks 70% 58% 65% 67% 55% 60% 64% 60% 60%
Eliminating manual incident response 60% 63% 67% 65% 58% 80% 60% 52% 36%
Automation of manual CI/CD tasks 65% 66% 65% 56% 61% 72% 44% 56% 68%
End-to-end observability 51% 34% 46% 45% 42% 44% 68% 52% 36%
AIOps-driven decision-making capabilities 44% 43% 42% 46% 46% 44% 36% 40% 40%
DevOps value stream management and orchestration 24% 28% 39% 46% 42% 36% 44% 36% 52%

©2021 Dynatrace2021 Global DevOps Report 29
Appendix
Global Data Summary: Europe — Chapter 2
Barriers to DevOps success identified by DevOps leaders UK France Germany Italy Spain Sweden Denmark Finland Norway
Siloed team culture 75% 76% 69% 65% 58% 88% 72% 72% 76%
Application complexity 55% 61% 62% 58% 67% 84% 56% 68% 56%
Lack of automation 43% 31% 38% 44% 40% 28% 40% 24% 28%
DevOps toolchains becoming more complex / fragmented 29% 37% 37% 34% 42% 20% 36% 60% 40%

©2021 Dynatrace2021 Global DevOps Report 30
Appendix
Global Data Summary: Europe — Chapter 3
CountryDevOps leaders that say
toolchain complexity is a barrier for DevOps success
DevOps leaders that say DevOps toolchains are increasingly fragmented
and impede their ability to accelerate innovation
DevOps leaders that say modernizing tool stacks is
a priority for increasing developer productivity
DevOps leaders that say increased automation will be essential to managing and operating
DevOps toolchains
UK 29% 60% 70% 81%
France 37% 72% 58% 74%
Germany 37% 74% 65% 79%
Italy 34% 61% 67% 88%
Spain 42% 69% 55% 81%
Sweden 20% 60% 60% 64%
Denmark 36% 68% 64% 68%
Finland 60% 64% 60% 76%
Norway 40% 64% 60% 76%

©2021 Dynatrace2021 Global DevOps Report 31
Appendix
Global Data Summary: Europe — Chapter 4
CountryDevOps leaders that say extending AIOps beyond
traditional use cases will play a critical role in the future success of DevOps engineers and SRE teams
Average increase expected in investment into automating code delivery, deployment, and
remediation across DevOps pipelines by 2023
UK 84% 36%
France 85% 41%
Germany 85% 38%
Italy 73% 34%
Spain 76% 36%
Sweden 84% 33%
Denmark 56% 31%
Finland 80% 34%
Norway 80% 36%

©2021 Dynatrace2021 Global DevOps Report 32
Appendix
Global Data Summary: Europe — Chapter 4
Areas DevOps leaders are investing in to boost confidence in quality of software releases
UK France Germany Italy Spain Sweden Denmark Finland Norway
CI/CD automation 59% 61% 60% 52% 57% 72% 56% 56% 64%
Testing-as-a-Service 65% 67% 56% 59% 49% 48% 48% 60% 48%
Test automation 40% 30% 43% 32% 27% 60% 36% 40% 36%
AIOps-driven root cause analysis 43% 42% 35% 40% 39% 40% 32% 24% 40%
Testing software quality earlier in the development cycle (shift-left quality) 32% 32% 36% 25% 34% 24% 68% 48% 40%
Chaos engineering 16% 24% 27% 28% 31% 24% 36% 28% 24%
Testing security earlier in the development cycle (shift-left security) 28% 29% 25% 28% 37% 24% 36% 28% 28%

©2021 Dynatrace2021 Global DevOps Report 33
Appendix
Global Data Summary: Europe — Chapter 5
CountryDevOps leaders that say end-to-end observability
will be essential to DevOps in the future
DevOps leaders that say a unified end-to-end platform that seamlessly integrates their toolchains
will be critical to their ability to scale DevOps beyond a single lighthouse project
UK 80% 69%
France 75% 67%
Germany 77% 71%
Italy 84% 67%
Spain 80% 83%
Sweden 60% 72%
Denmark 68% 56%
Finland 76% 80%
Norway 64% 84%

©2021 Dynatrace2021 Global DevOps Report 34
Appendix
Global Data Summary: Middle East — Chapter 1
Sample includes 50 respondents from the UAE, and 20 respondents from each of Egypt, Qatar, Kuwait, Saudi Arabia, and Bahrain (grouped together as ‘Rest of Middle East’ in the tables below).
Frequency at which organizations release software updates to their critical applications
UAE Rest of Middle East
On demand (multiple deploys a day) 0% 0%
Between once per day and once per week 0% 1%
Between once per week and once per month 52% 51%
Between once per month and once per quarter 48% 48%
Between once per quarter and once every six months 0% 0%

©2021 Dynatrace2021 Global DevOps Report 35
Appendix
Global Data Summary: Middle East — Chapter 1
Country
Average frequency at which organizations release software
updates to their critical applications (days)
Average expected increase in deployment frequency
of updates for critical apps by 2023
DevOps leaders that say they are often under so much pressure
for faster innovation they sacrifice code quality
DevOps leaders that say extending DevOps to more
apps is key for digital transformation and CX
Percentage of apps that will be fully
DevOps-enabled by 2023
UAE 38 54% 22% 98% 34%
Rest of Middle East 38 60% 28% 96% 37%

©2021 Dynatrace2021 Global DevOps Report 36
Appendix
Global Data Summary: Middle East — Chapter 2
CountryAverage percentage of IT and DevOps teams’
time spent on manual CI/CD tasks like detecting code quality issues
Average annual labor cost for DevOps teams’ time spent on manual CI/CD tasks*
UAE 25% $5.8m
Rest of Middle East 25% $5.5m
*(based on average salaries and percentage of working hours dedicated to these tasks)

©2021 Dynatrace2021 Global DevOps Report 37
Appendix
Global Data Summary: Middle East — Chapter 2
Areas DevOps leaders are investing in to boost developer productivity, experience, and quality of life
UAERest of
Middle East
Modernizing tool stacks 82% 68%
Eliminating manual incident response 64% 51%
Automation of manual CI/CD tasks 72% 70%
End-to-end observability 40% 42%
AIOps-driven decision-making capabilities 46% 44%
DevOps value stream management and orchestration 52% 52%

©2021 Dynatrace2021 Global DevOps Report 38
Appendix
Global Data Summary: Middle East — Chapter 2
Barriers to DevOps success identified by DevOps leaders UAERest of
Middle East
Siloed team culture 78% 80%
Application complexity 76% 80%
Lack of automation 38% 30%
DevOps toolchains becoming more complex / fragmented 34% 37%

©2021 Dynatrace2021 Global DevOps Report 39
Appendix
Global Data Summary: Middle East — Chapter 3
CountryDevOps leaders that say
toolchain complexity is a barrier for DevOps success
DevOps leaders that say DevOps toolchains are increasingly fragmented
and impede their ability to accelerate innovation
DevOps leaders that say modernizing tool stacks is a priority for increasing
developer productivity
DevOps leaders that say increased automation will be essential to
managing and operating DevOps toolchains
UAE 34% 68% 82% 68%
Rest of Middle East 37% 52% 68% 65%

©2021 Dynatrace2021 Global DevOps Report 40
Appendix
Global Data Summary: Middle East — Chapter 4
CountryDevOps leaders that say extending AIOps
beyond traditional use cases will play a critical role in the future success of DevOps engineers and SRE teams
Average increase expected in investment into automating code delivery, deployment, and
remediation across DevOps pipelines by 2023
UAE 66% 28%
Rest of Middle East 76% 34%

©2021 Dynatrace2021 Global DevOps Report 41
Appendix
Global Data Summary: Middle East — Chapter 4
Areas DevOps leaders are investing in to boost confidence in quality of software releases
UAERest of
Middle East
CI/CD automation 64% 60%
Testing-as-a-Service 54% 57%
Test automation 42% 48%
AIOps-driven root cause analysis 56% 52%
Testing software quality earlier in the development cycle (shift-left quality) 18% 40%
Chaos engineering 44% 40%
Testing security earlier in the development cycle (shift-left security) 26% 21%

©2021 Dynatrace2021 Global DevOps Report 42
Appendix
Global Data Summary: Middle East — Chapter 5
CountryDevOps leaders that say end-to-end observability
will be essential to DevOps in the future
DevOps leaders that say a unified end-to-end platform that seamlessly integrates their toolchains
will be critical to their ability to scale DevOps beyond a single lighthouse project
UAE 72% 72%
Rest of Middle East 65% 68%
©2021 Dynatrace2021 Global DevOps Report 43
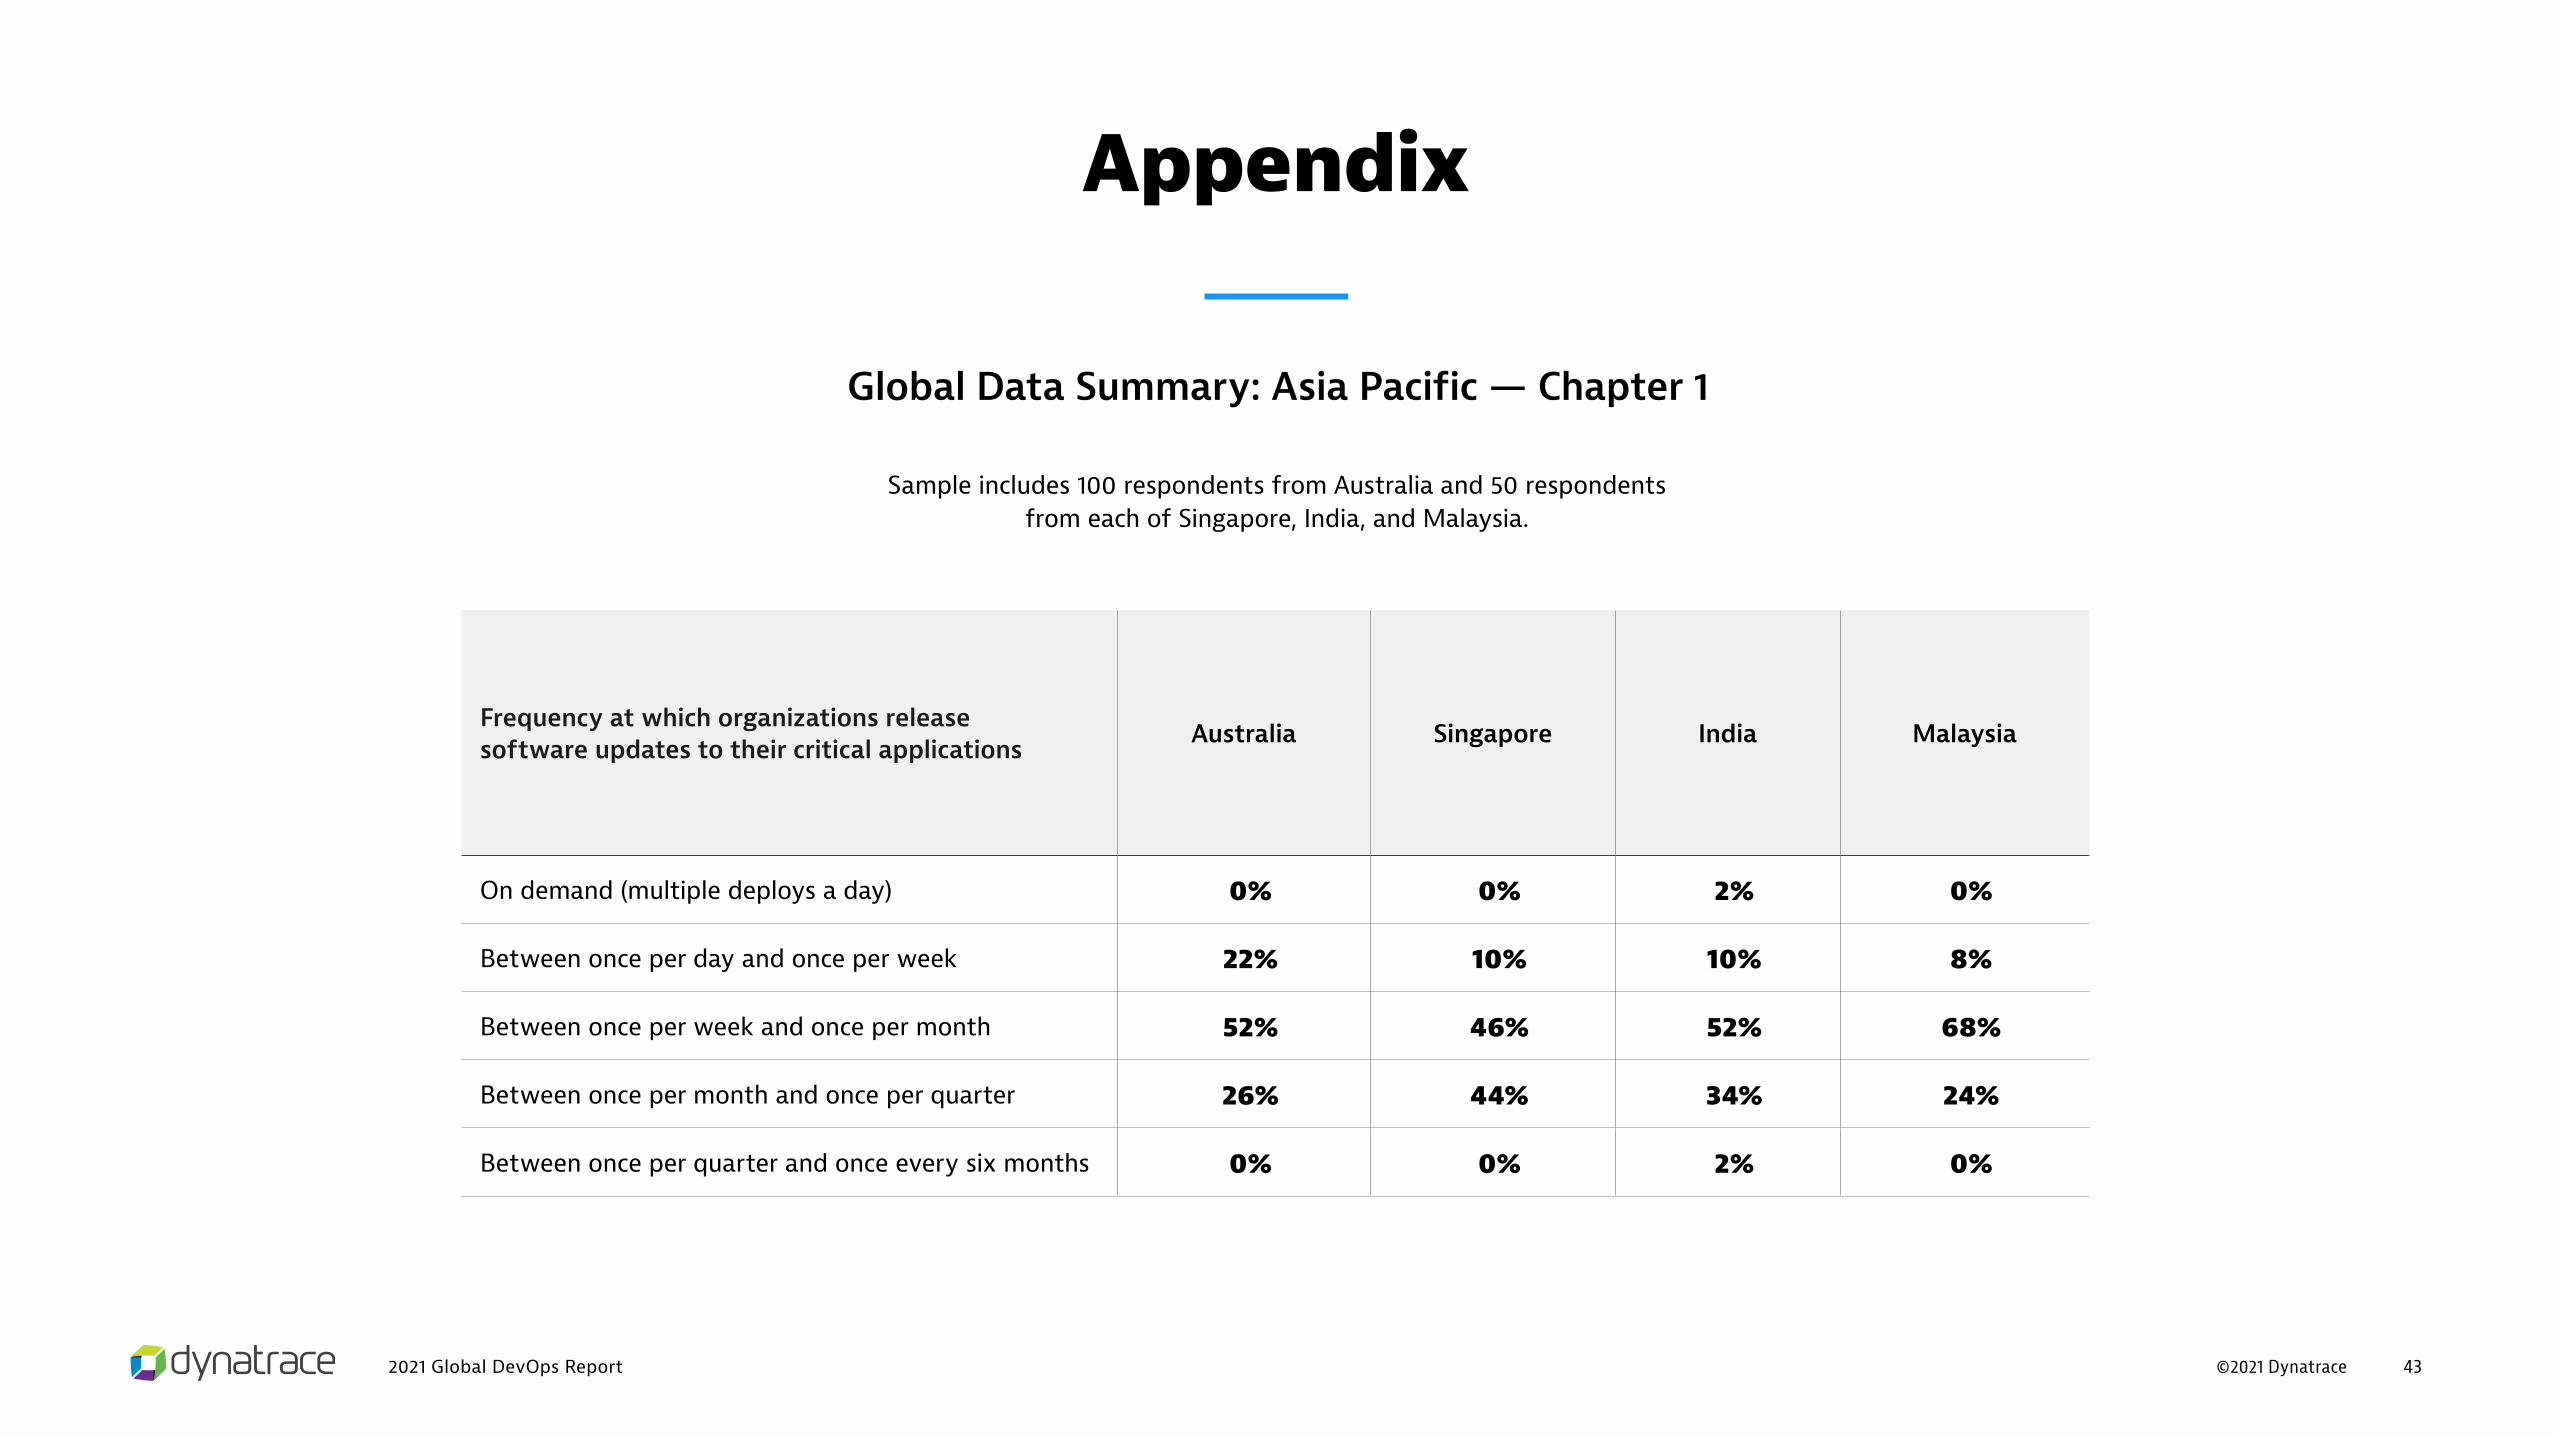
Appendix
Global Data Summary: Asia Pacific — Chapter 1
Sample includes 100 respondents from Australia and 50 respondents from each of Singapore, India, and Malaysia.
Frequency at which organizations release software updates to their critical applications Australia Singapore India Malaysia
On demand (multiple deploys a day) 0% 0% 2% 0%
Between once per day and once per week 22% 10% 10% 8%
Between once per week and once per month 52% 46% 52% 68%
Between once per month and once per quarter 26% 44% 34% 24%
Between once per quarter and once every six months 0% 0% 2% 0%

©2021 Dynatrace2021 Global DevOps Report 44
Appendix
Global Data Summary: Asia Pacific — Chapter 1
Country
Average frequency at which organizations release software
updates to their critical applications (days)
Average expected increase in deployment frequency
of updates for critical apps by 2023
DevOps leaders that say they are often under so much pressure
for faster innovation they sacrifice code quality
DevOps leaders that say extending DevOps to more
apps is key for digital transformation and CX
Percentage of apps that will be fully
DevOps-enabled by 2023
Australia 26 54% 22% 98% 33%
Singapore 35 55% 86% 96% 31%
India 33 53% 92% 96% 33%
Malaysia 27 56% 90% 98% 31%

©2021 Dynatrace2021 Global DevOps Report 45
Appendix
Global Data Summary: Asia Pacific — Chapter 2
CountryAverage percentage of IT and DevOps teams’
time spent on manual CI/CD tasks like detecting code quality issues
Average annual labor cost for DevOps teams’ time spent on manual CI/CD tasks*
Australia 21% $4.4m
Singapore 22% $4.6m
India 23% $4.9m
Malaysia 23% $5m
*(based on average salaries and percentage of working hours dedicated to these tasks)

©2021 Dynatrace2021 Global DevOps Report 46
Appendix
Global Data Summary: Asia Pacific — Chapter 2
Areas DevOps leaders are investing in to boost developer productivity, experience, and quality of life
Australia Singapore India Malaysia
Modernizing tool stacks 85% 78% 88% 86%
Eliminating manual incident response 69% 80% 76% 66%
Automation of manual CI/CD tasks 52% 58% 70% 60%
End-to-end observability 55% 42% 50% 44%
AIOps-driven decision-making capabilities 45% 46% 54% 46%
DevOps value stream management and orchestration 47% 50% 34% 58%

©2021 Dynatrace2021 Global DevOps Report 47
Appendix
Global Data Summary: Asia Pacific — Chapter 2
Barriers to DevOps success identified by DevOps leaders Australia Singapore India Malaysia
Siloed team culture 99% 98% 92% 100%
Application complexity 93% 100% 96% 100%
Lack of automation 15% 14% 14% 8%
DevOps toolchains becoming more complex / fragmented 27% 6% 8% 10%

©2021 Dynatrace2021 Global DevOps Report 48
Appendix
Global Data Summary: Asia Pacific — Chapter 3
CountryDevOps leaders that say
toolchain complexity is a barrier for DevOps success
DevOps leaders that say DevOps toolchains are increasingly
fragmented and impede their ability to accelerate innovation
DevOps leaders that say modernizing tool stacks is a
priority for increasing developer productivity
DevOps leaders that say increased automation will be essential to
managing and operating DevOps toolchains
Australia 27% 51% 85% 67%
Singapore 6% 38% 78% 62%
India 8% 34% 84% 68%
Malaysia 10% 44% 86% 60%

©2021 Dynatrace2021 Global DevOps Report 49
Appendix
Global Data Summary: Asia Pacific — Chapter 4
CountryDevOps leaders that say extending AIOps
beyond traditional use cases will play a critical role in the future success of DevOps engineers and SRE teams
Average increase expected in investment into automating code delivery, deployment, and
remediation across DevOps pipelines by 2023
Australia 82% 31%
Singapore 86% 33%
India 92% 35%
Malaysia 90% 31%

©2021 Dynatrace2021 Global DevOps Report 50
Appendix
Global Data Summary: Asia Pacific — Chapter 4
Areas DevOps leaders are investing in to boost confidence in quality of software releases Australia Singapore India Malaysia
CI/CD automation 49% 54% 66% 58%
Testing-as-a-Service 42% 54% 32% 46%
Test automation 58% 66% 62% 78%
AIOps-driven root cause analysis 46% 48% 48% 50%
Testing software quality earlier in the development cycle (shift-left quality) 40% 16% 44% 24%
Chaos engineering 42% 52% 42% 58%
Testing security earlier in the development cycle (shift-left security) 30% 28% 32% 24%

©2021 Dynatrace2021 Global DevOps Report 51
Appendix
Global Data Summary: Asia Pacific — Chapter 5
CountryDevOps leaders that say end-to-end observability
will be essential to DevOps in the future
DevOps leaders that say a unified end-to-end platform that seamlessly integrates their toolchains
will be critical to their ability to scale DevOps beyond a single lighthouse project
Australia 62% 61%
Singapore 50% 62%
India 72% 68%
Malaysia 60% 62%

About DynatraceDynatrace provides software intelligence to simplify cloud complexity and accelerate digital transformation. With automatic and intelligent observability at scale, our all-in-one platform delivers precise answers about the performance and security of applications, the underlying infrastructure, and the experience of all users to enable organizations to innovate faster, collaborate more efficiently, and deliver more value with dramatically less effort. That’s why many of the world’s largest enterprises trust Dynatrace® to modernize and automate cloud operations, release better software faster, and deliver unrivalled digital experiences.
blog @dynatrace
Automatic and intelligent observability for hybrid multiclouds
We hope this ebook has inspired you to take the next step in your digital journey.Dynatrace is committed to providing enterprises the data and intelligence they need to be successful with their
enterprise cloud and digital transformation initiatives, no matter how complex.
If you are ready to learn more, please visit dynatrace.com/platform for assets, resources, and a free 15-day trial.
©2021 Dynatrace10.14.21 13488_EBK_USlet_mt
Learn more


![Learning to Communicate with Deep Multi-Agent ... · (RIAL), uses deep Q-learning [3] with a recurrent network to address partial observability. In one variant of this approach, which](https://static.fdocuments.us/doc/165x107/5ec6a87b9a01e55b0f5d5eb4/learning-to-communicate-with-deep-multi-agent-rial-uses-deep-q-learning-3.jpg)