
Decision Support System for In Situ Melon Fruit Harvesting ...
8
Abstract—Melon has a large variety in horticultural and is widely used in scientific research such as biology and geneticist’s developments. This study aims to develop a system for detecting the correct harvest time. The farmers currently harvest melons based on their experience, and melon cannot maintain their quality after harvesting. Thus, the melon needs to be harvested at the right time. Melon harvesting is a daily task; Melon is not mature on the same day even though the melon plant was planted in the same period due to genetics and environment. Therefore, the decision support system should detect and classify the ripeness level of the fruit on the tree. The system will categorize the maturity level into three categories: Ripe, About to Ripe, or Under Ripe (within a rate from 0 to 10 obtained from fuzzy inference system result). The ripeness levels are confirmed by the expert, depending on the skin color of the fruit. As a result, we get 100% accuracy in classifying each category using phone camera images and video. Furthermore, this decision support system can be implemented in melon’s harvesting robot. The melon used in this study is honeydew Cucumis melo L, var. Alisha F1. Index Terms— fuzzy logic, HSV color space, image processing, melon harvesting, skin color extraction, SSD- Mobilenet. I. INTRODUCTION HE agricultural development is one of the most powerful approaches for ending extreme poverty, promoting shared prosperity, and feeding an estimated 9.7 billion people by 2050 [1]. According to WBG (World Bank Group), growth in the agricultural sector is two to four times more effective in increasing income among the poor than in other sectors. Employment in agriculture in 2016 analyses found that 65% of poor working adults earn their livelihood through agriculture. Agriculture is also essential for economic growth. In 2014, it accounted for a third of global GDP [1]. It’s challenging to apply the Decision Support System (DSS) in agriculture due to the farmer and scientist's information management challenge to increase the economic and crop productivity rate. However, it is essential to explore, and model data flow between decision-making processes and the user’s feedback for successful outcomes. And this can be done by implementing the DSS, which 1 Jaafar AL-Dilphi, Sri Wahjuni, Willy Suwarno, and Wulandari (email: [email protected], [email protected], [email protected], and [email protected]) IPB University, Bogor, Indonesia. provides crop selection with precise and comprehensive agricultural details [2]. Melon has inner and outer characters, including skin color, aroma, and taste, determining melon quality. Quality must be preserved before harvest, as production cannot be maintained after harvest. Norms of quality are based chiefly on plant genetics. Therefore, critical fruit production, managing, and maturation conditions are essential at harvest times [3], [4]. When we talk about quality and freshness, melon’s fruit and many other fruits strongly relate to their skin color. Thus the color is the main factor to identify fruit quality and freshness [5]. Harvesting takes place daily because ripening is uneven simultaneously, which reduces melon profits for farmers if collectors conduct total soluble solids (TSS) inspections to define their sweetness level, whereas there are amounts of damaged fruits. Measuring the maturity of a melon by humans is a dynamic phenomenon based on internal and external factors, as discussed in [6]. Thus, the selection for an object is maintained by a person’s eyes to identify the object and deciding the personal experience. At the same time, the automated decision doesn’t possess the human mind and uses a sensor and control system to simulate the selection process; the automated decision is processing the information of the fruit that comes from a camera by image processing or sensors. It recognizes the target fruit and correctly locates the target fruit [7], [8]. This study's type of melon fruit is honeydew (Cucumis melo L.) of Alisha F1 variety; it has a flattened shape and a crunchy flesh texture. The under-ripe skin color is green, and the ripe one is yellow. The flesh color is a white-orange. For more details about this melon, refer to this study [9]. Making the harvesting decision will be based on these melon characteristics to classify and detect the ripe, about to ripe, and under-ripe melon by using Fuzzy Logic and find the desired harvest time. Ambiguous logic is a section of human reasoning. The methods are synthesized by establishing a computer program called a fuzzy rule-based system [10]. The theory that applies mathematics to diffused concepts was forwarded by Lofty Asker Zadeh in 1965 and tried to approach human reasoning by fuzzy sets, also described by linguistic variables [11]. Fuzzy logic has a statistical output for which can be used for better and accurate decision-making in such a variety of applications. The fuzzy control system is represented in shape close to the primary language form for showing the actual knowledge needed for a task in different Decision Support System for In Situ Melon’ s Fruit Harvesting Time Based on Fuzzy Logic and Single Shot Detector (SSD) Jaafar Mohammed AL-dilphi 1 , Member, IAENG, Sri Wahjuni, Member, IAENG, Willy Suwarno, and Wulandari T Proceedings of the World Congress on Engineering 2021 WCE 2021, July 7-9, 2021, London, U.K. ISBN: 978-988-14049-2-3 ISSN: 2078-0958 (Print); ISSN: 2078-0966 (Online) WCE 2021
Transcript of Decision Support System for In Situ Melon Fruit Harvesting ...
Abstract—Melon has a large variety in horticultural and is
widely used in scientific research such as biology and
geneticist’s developments. This study aims to develop a system
for detecting the correct harvest time. The farmers currently
harvest melons based on their experience, and melon cannot
maintain their quality after harvesting. Thus, the melon needs
to be harvested at the right time. Melon harvesting is a daily
task; Melon is not mature on the same day even though the
melon plant was planted in the same period due to genetics and
environment. Therefore, the decision support system should
detect and classify the ripeness level of the fruit on the tree.
The system will categorize the maturity level into three
categories: Ripe, About to Ripe, or Under Ripe (within a rate
from 0 to 10 obtained from fuzzy inference system result). The
ripeness levels are confirmed by the expert, depending on the
skin color of the fruit. As a result, we get 100% accuracy in
classifying each category using phone camera images and
video. Furthermore, this decision support system can be
implemented in melon’s harvesting robot. The melon used in
this study is honeydew Cucumis melo L, var. Alisha F1.
Index Terms— fuzzy logic, HSV color space, image
processing, melon harvesting, skin color extraction, SSD-
Mobilenet.
I. INTRODUCTION
HE agricultural development is one of the most
powerful approaches for ending extreme poverty,
promoting shared prosperity, and feeding an estimated 9.7
billion people by 2050 [1]. According to WBG (World Bank
Group), growth in the agricultural sector is two to four times
more effective in increasing income among the poor than in
other sectors. Employment in agriculture in 2016 analyses
found that 65% of poor working adults earn their livelihood
through agriculture. Agriculture is also essential for
economic growth. In 2014, it accounted for a third of global
GDP [1].
It’s challenging to apply the Decision Support System
(DSS) in agriculture due to the farmer and scientist's
information management challenge to increase the economic
and crop productivity rate. However, it is essential to
explore, and model data flow between decision-making
processes and the user’s feedback for successful outcomes.
And this can be done by implementing the DSS, which
1 Jaafar AL-Dilphi, Sri Wahjuni, Willy Suwarno, and Wulandari (email:
[email protected], [email protected],
[email protected], and [email protected]) IPB
University, Bogor, Indonesia.
provides crop selection with precise and comprehensive
agricultural details [2].
Melon has inner and outer characters, including skin
color, aroma, and taste, determining melon quality. Quality
must be preserved before harvest, as production cannot be
maintained after harvest. Norms of quality are based chiefly
on plant genetics. Therefore, critical fruit production,
managing, and maturation conditions are essential at harvest
times [3], [4]. When we talk about quality and freshness,
melon’s fruit and many other fruits strongly relate to their
skin color. Thus the color is the main factor to identify fruit
quality and freshness [5]. Harvesting takes place daily
because ripening is uneven simultaneously, which reduces
melon profits for farmers if collectors conduct total soluble
solids (TSS) inspections to define their sweetness level,
whereas there are amounts of damaged fruits. Measuring the
maturity of a melon by humans is a dynamic phenomenon
based on internal and external factors, as discussed in [6].
Thus, the selection for an object is maintained by a person’s
eyes to identify the object and deciding the personal
experience. At the same time, the automated decision
doesn’t possess the human mind and uses a sensor and
control system to simulate the selection process; the
automated decision is processing the information of the fruit
that comes from a camera by image processing or sensors. It
recognizes the target fruit and correctly locates the target
fruit [7], [8].
This study's type of melon fruit is honeydew (Cucumis
melo L.) of Alisha F1 variety; it has a flattened shape and a
crunchy flesh texture. The under-ripe skin color is green,
and the ripe one is yellow. The flesh color is a white-orange.
For more details about this melon, refer to this study [9].
Making the harvesting decision will be based on these
melon characteristics to classify and detect the ripe, about to
ripe, and under-ripe melon by using Fuzzy Logic and find
the desired harvest time.
Ambiguous logic is a section of human reasoning. The
methods are synthesized by establishing a computer
program called a fuzzy rule-based system [10]. The theory
that applies mathematics to diffused concepts was forwarded
by Lofty Asker Zadeh in 1965 and tried to approach human
reasoning by fuzzy sets, also described by linguistic
variables [11]. Fuzzy logic has a statistical output for which
can be used for better and accurate decision-making in such
a variety of applications. The fuzzy control system is
represented in shape close to the primary language form for
showing the actual knowledge needed for a task in different
Decision Support System for In Situ Melon’s
Fruit Harvesting Time Based on Fuzzy Logic
and Single Shot Detector (SSD)
Jaafar Mohammed AL-dilphi1, Member, IAENG, Sri Wahjuni, Member, IAENG, Willy Suwarno, and
Wulandari
T
Proceedings of the World Congress on Engineering 2021 WCE 2021, July 7-9, 2021, London, U.K.
ISBN: 978-988-14049-2-3 ISSN: 2078-0958 (Print); ISSN: 2078-0966 (Online)
WCE 2021
manners. Fuzzy logic does not need to be modeled using a
complex mathematical design, and easily converting the
expert experience to rules programmatically, and finally,
system behavior can be implemented and adapted easily and
quickly. As a result, the long-term modification will quickly
be done [11], [12].
Fuzzy logic has several computation types that are used
regarding the number of input and output. The commonly
used one is Mamdani for this work that needs to translate the
expert’s natural language to the machine by formulating
what he suggests as IF-THEN rules.
A series of optimization standards is undertaken for
decision-making according to planning criteria. The current
assay develops a DSS to detect melon in the image using a
Tensorflow pre-trained deep learning model SSD [13], then
employing Fuzzy Inference System (FIS) to manage
melon’s fruit aiming at good cultivation.
II. METHODOLOGY
A. Data
The data used are images of honeydew Cucumis melo L,
var. Alisha F1 melon captured by phone camera at ATP
greenhouse owned by IPB University in Bogor, Indonesia.
The phone used was the iPhone 6s, the rear camera that has
((12 MP (f/2.2, 29mm, 1/3 inch), dual-LED), and default
image size 4032*3024). When capturing, the camera's
distance was 25-35 cm with an eye-level angle about the
same level as the melon’s fruit. The captured images were in
July 2020; the time was 4 PM to 7 PM. The total pictures
are 190, 170 are the captured images, and 20 others were
collected from Google Image. All images were resized to
640*480—and the labeling of the pictures done by the
greenhouse expert’s guidance.
The melon age was captured at 60 days in the first
attempt, and we continue capturing every two days until the
age of 78. The harvesting was every day while collecting the
images; thus, at age 78, the last harvesting was done of the
reminded melon group. The planting of all melons in the
greenhouse was on 15/May/2020.
In December 2020, there was another planting of the
same melon type. We captured new images in February
2021 to test our Fuzzy Logic output. The details of the new
images are explained in the discussion section of this paper.
B. System Development
The harvesting time varies for each fruit in the
greenhouse. There are ripe and under-ripe melons at more or
less than 70 days' ages. The expert decided where the ripe
one is to be harvested depending on the skin color. Thus, we
need to convert this experience from the expert/farmer to the
machine. To find the ripeness level, we must dive into four
steps, as explained in Fig. 1.
1) Melon’s Fruit Detection
The first step of this method is to find the existence of the
melon fruit in the image. There is a possibility that multiple
melon fruit existed in one picture due to the environmental
condition. The dataset is separated into two classes. Our
desired Melon class and the other class are the backgrounds
that included images for unwanted objects (i.e., small
melon, far or on the left/right corner of the image tree’s
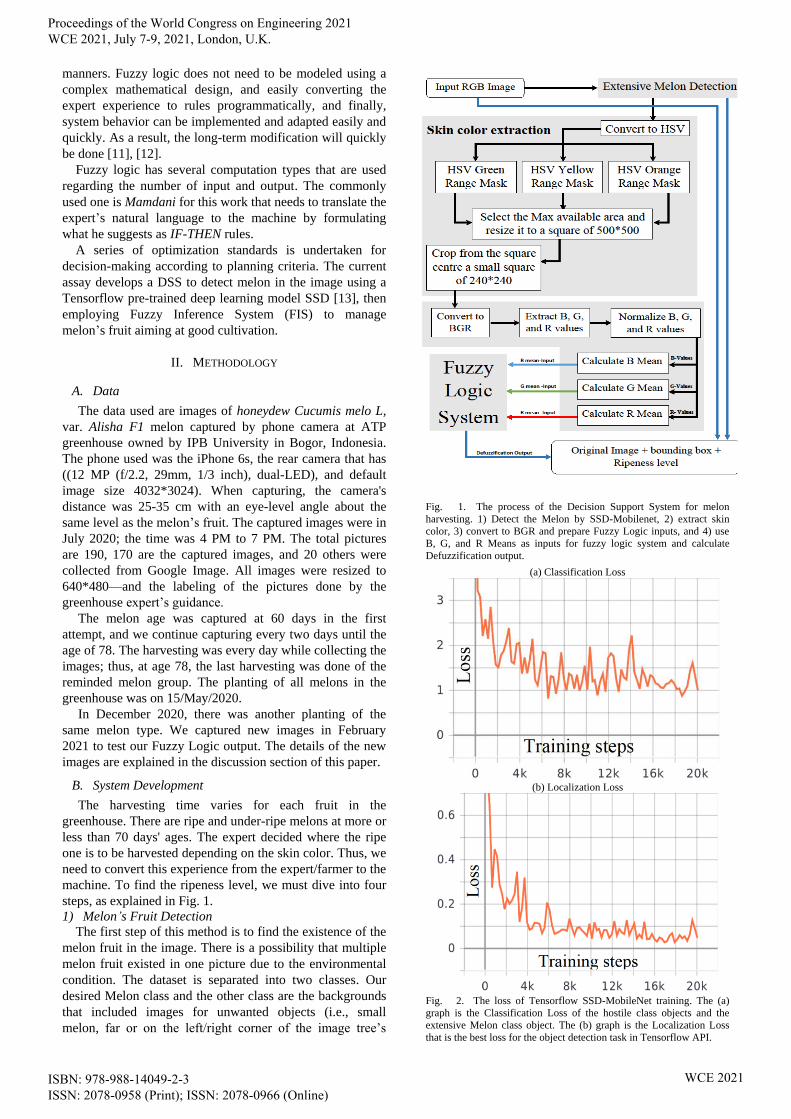
Fig. 1. The process of the Decision Support System for melon
harvesting. 1) Detect the Melon by SSD-Mobilenet, 2) extract skin
color, 3) convert to BGR and prepare Fuzzy Logic inputs, and 4) use
B, G, and R Means as inputs for fuzzy logic system and calculate
Defuzzification output.
(a) Classification Loss
(b) Localization Loss
Fig. 2. The loss of Tensorflow SSD-MobileNet training. The (a)
graph is the Classification Loss of the hostile class objects and the
extensive Melon class object. The (b) graph is the Localization Loss
that is the best loss for the object detection task in Tensorflow API.
Proceedings of the World Congress on Engineering 2021 WCE 2021, July 7-9, 2021, London, U.K.
ISBN: 978-988-14049-2-3 ISSN: 2078-0958 (Print); ISSN: 2078-0966 (Online)
WCE 2021

stem, leaves, and roots). The images are annotated by
drawing a rectangle (i.e., the bounding box) on each object
in the image. e.g., if the image includes the Region of
Interest (ROI), then annotate it as melon, and annotate all
other parts of the image as a background), the total
annotated objects in 190 images are 554 annotations (i.e.,
554 bounding boxes coordinates for each object in all
images). The annotation process is done by using the
labeling application [14]. We were then separating the
annotated images dataset to 85% for training and 15% for
testing.
The model is trained on 554 bounding boxes (20%
background, 20% melons not in the center of the image of
the hostile class), and (60% for the desired class, that is the
most existence melon object located in the middle of the
image)
A Pre-trained deep learning model SSD-Mobilenet that is
preferred for extensive object detection in an image [15],
used with Tensorflow object detection API [13], to train the
images dataset on Colab pro (also known as, Google
colaboratory, Colab allows anybody to write and execute
arbitrary python code through the browser, and is especially
well suited to machine learning, data analysis, and
education), the Colab-pro version is to provide a consistent
massive GPU by subscribing for a periodic payment [16].
The SSD- Mobilenet configuration for the training
process is shown in Table. I.
You can notice that the (Max detections per class and the
Max total detections) is 2 for both, to force the detection in
detecting the preferred object that is where the camera
pointing and not the melons in the background, also
controlling what class/object we want to detect easily.
The training was 20,000 steps takes around 5 hours, with
an excellent low loss for localization and classification, as
shown in Fig. 2. As you can see, the localization loss was
the best at step 18,853, so use this step because our interest
is more toward the localization rather than the classification
in this step.
After training is accomplished, we employ the trained
model, which contains the model structure with the values
of the required variables, such as weights, in the Opencv-
dnn library (i.e., Optimized Computer Vision-Deep Neural
Network) [17] for faster and simple detection usage. In this
step, we localize and classify the Melon Fig. 3(a) compared
to negative objects (i.e., background, small melons objects,
and tree’s contents).
Fig. 3 (a)
Fig. 3 (b)
Fig. 3. In (a) showing the input image and the detected bounding box, the
detected melon image is cropped and prepared to be mapped to the next
step (i.e., Image segmentation step).
In (b) are some examples of applying IoU on multiple images picked
randomly from the test dataset, where the green rectangle is the GT box,
and the red one is the predicted box. The IoU for all images is more than
0.9, so the accuracy of the detection is excellent, according to [18] study.
To test the accuracy of the predicted bounding box, we
have used the Intersection of Union (IOU) approach
introduced by [18]. It’s simply works by comparing the
Ground truth (GT) boxes (i.e., the boxes specified by our
hand) versus the predicted boxes using (1). The accuracy
showed and explained in Fig. 3 (b).
Where, | |A BI is Area of overlap, and | |A BU is Area
of Union. In general, the IOU calculate the distance between
GT box and predicted box.
2) Image Segmentation
Color Image segmentation is to partition the image based
on some features. In this step, the segmentation will be
based on color. The input image used is colored in RGB
color space pixel p(i), which is defined by red, green, and
blue at pixel coordinates (r(i), (g(i), b(i)), implies for three
TABLE I
SSD-MOBILENET CONFIGURATION
The input image size 480 width, 360 height
Batch size 24
Number of layers 6
Scales Min scale 0.2
Max scale 0.95
aspect_ratios
1.0
2.0
0.5
3.0
0.3333
Initial learning rate 0.004
Max detections per class 2
Max total detections 2
| |
| |
A BIoU
A B
I
U (1)
Detected
coordinates
Proceedings of the World Congress on Engineering 2021 WCE 2021, July 7-9, 2021, London, U.K.
ISBN: 978-988-14049-2-3 ISSN: 2078-0958 (Print); ISSN: 2078-0966 (Online)
WCE 2021

columns (R for red channel, G for green channel, and B for
blue channel) [19], [20]. The image segmentation was
applied after detecting the desired melon and recognize it
from the greenhouse environment, then derive to this step to
extract skin color by segmenting the image to remove noise
such as tee’s root or a part of leaf blocking the fruit. Also, to
be sure that we got a pure skin color extraction, to calculate
the R, G, and B means of the skin color.
Fig. 4. The segmentation-based HSV color space for a ripe orangey
melon covered partially with stem and left on the left side, and a green
baby melon blocked with tree stem on the right side. The image in (c)
level was extracted by taking the max mask for the detected melon.
There are many types of color space, and the most used
are L*A*B* and HSV [21], [22]. Reference [23] is an image
segmentation study that compares L*A*B* with HSV, and
they have found that the HSV (Hue Saturation Value) color
space is the best choice for colored image segmentation.
Thus, we studied and analyzed the image color using
HSV color space to find the color range that has the ROI—
then converting the RGB image to HSV. And creating a
group of HSV ranges for the available melon categories.
Then the detected melon will pass through the following
HSV ranges,
Green range mask = is the HSV Range of (min
Green and max Green).
Yellow range mask = is the HSV Range of (min
Yellow and max Yellow).
Orang range mask = is the HSV Range of (min
Orang and max Orang).
Here we got three ranges for the detected melon. As an
example, if the melon was under-ripe (i.e., green melon’s
color), then the most extensive area of the image will be the
green one, and the same case for yellow or orange melon
color (Fig. 4 (a)). The purpose of the masking is to remove
the unnecessary background and noise, such as the tree’s
root, stem, or leaf that overlapping with the melon target.
Thus, the remaining area will be considered as an ROI
candidate (Fig. 4 (a) and (b)). Then it will consider the most
extensive available area as shown in Fig. 4 (b) and (c). The
largest mask area among those three masks will be used as
the final mask. An area (square, with size 240*240 as shown
in Fig 4 (c)), is taken from the last mask, and thus it is used
for the next step.
3) Preparing Fuzzy Logic Input (R, G, B)
Sun reflection or other light noise may change the pixels’
intensities. Thus, the reference values that we will set later
may or may not matches the future lightness effects on the
inputted image and will leads to mismatches between the
fuzzy rules and the input (i.e., R, G, and R means). So we
need to normalize the pixel intensities for the skin sample
produced in the previous step. Then, R, G, and B intensities
will be the same or close to the reference ranges after
normalizing. This step explained in two parts:
a) Normalizing RGB
RGB normalization is used to keep the pixel intensities in
a standard range. For example, at 11 AM, the RGB values of
a pixel in an image are (200, 150, 120), and at 4 PM were
(190, 170, 100). So we have to normalize these values to get
rid of lightness changes.
The typical approach to normalize RGB values is using
MIN-MAX standardization [19]. The maximum value in
RGB channels is 255 representing a white pixel, and the
minimum is 0 representing a black pixel. Equation (2) to (7)
is used to normalize R, G, and B pixels intensities.
( , ) ( , , )f x y R G B (2)
Total R G B (3)
255R
RTotal
(4)
255G
GTotal
(5)
255B
BTotal
(6)
, ( , ) ( , , )thus g x y R G B (7)
b) RGB Mean Calculation
The Mean of each channel of RGB color space of the
sample area of the image is used as input of the Fuzzy Logic
(i.e., the Mean for each column in the image matrix). The
formula for obtaining the Mean of each color channel in
RGB color space is shown in (8), (9), and (10) below. This
step was performed on a Melon image that is mapped from
the previous step. The range value (minimum and
maximum) of the RGB values for each category (Ripe,
About to Ripe, and Under Ripe) is obtained from the above
calculation. Then the fuzzy rules will use them as references
when classifying the melons into their categories.
/ No. of PixelsR RX
(8)
/ No. of PixelsG GX
(9)
Proceedings of the World Congress on Engineering 2021 WCE 2021, July 7-9, 2021, London, U.K.
ISBN: 978-988-14049-2-3 ISSN: 2078-0958 (Print); ISSN: 2078-0966 (Online)
WCE 2021

/ No. of PixelsB BX
(10)
Where,
= Normalized Red pixel.
= Normalized Green pixel.
= Normalized Blue pixel.
R
G
B
= Mean value of normalized Red channel.RX
= Mean value of normalized Green channel.GX
= Mean value of normalized Blue channel.BX
4) Fuzzy Logic to Detect the Ripeness of Melon Fruit
We are using Fuzzy Logic to classify the melon fruits
into ripe, about to ripe, and under-ripe categories. The
classification is made based on the original images
mentioned earlier in this paper, the images captured by the
iPhone 6s rear camera. The melon images are already
labeled with their corresponding ripeness categories by
expert guidance. The Fuzzy Logic algorithm is selected
due to its ability to convert expert experience to
computational logic. The fuzzy logic algorithm process is
explained in three steps; Firstly, it defines the input/output
Membership Function (MF). Secondly, it is setting the
rules and combining all the rules and MFs in the control
system. Lastly, it produces the output for each rule based
on the input. The computation is calculated using scikit-
fuzzy; A fuzzy logic toolbox for Python programming
language [24]. The representation of MFs for (R, G, and
B) and the Defuzzification output are shown in Fig. (5 to
6).
The input set of crisp values is the Mean of the
normalized R, G, and B intensities. The reference RGB
values for each category are the min-max range of all data,
as shown in Table. II below.
TABLE II
MIN-MAX (R, G, AND R) FOR EACH CATEGORY
CATEGORY RED
Min Max GREEN
Min Max BLUE
Min max
ABOUT TO RIPE 94 102 96 106 50 62
RIPE 126 138 90 103 21 37
UNDER RIPE 92 95 100 104 56 62
Min and Max of (red, green, and blue) Means values for each
category. These values from images captured by iPhone camera, other
cameras, or different light environments may change the RGB pixel
intensities and will differ from the reference. Thus, this will lead to
lousy classification.
In the case was ripe melon, and its blue channel value is
more than the Max reference of blue for ripe melon, then it
will consider “About to Ripe.” To get rid of such a
problem, we multiply the Medium-blue-MF (M_blue) by
0.7 to decrease the MF output as shown in Fig. 5(c)
M_blue MF), thus, ignoring the blue when compared to
red by using the “OR” operator (11) [25].
using ( ) _ , Ripe OR MAX M blue red (11)
Fig. 5 (a)
Fig. 5 (b)
Fig. 5 (c)
Fig. 5. The membership functions of the inputs, (a) are the MF of red,
(b) is the MF of green, and (c) is the MF of blue. Note that the (L, M,
H, and vH) that MFs names start with are meaning (Low, Medium,
High, and Very High, respectively).
Fig. 6. The Defuzzification output membership function. The (blue,
orange, and green) lines represent MFs output of Under-ripe, About to
Ripe, and Ripe, respectively.
In this case, the red MF will be the winner because the
“M_blue” MF will never reach 0.8. In comparison, red
values are always “High-red” (i.e., Fig. 5 (a) H_red MF)
in the “ripe” category.
For example, samples of the used rules to classify the
melon categories are shown below:
1. If (red is low) and (blue is very high) then (Melon is
Under Ripe).
2. If ((red is high) or (green is high)) and (Blue is high)
then (Melon is About to Ripe).
Proceedings of the World Congress on Engineering 2021 WCE 2021, July 7-9, 2021, London, U.K.
ISBN: 978-988-14049-2-3 ISSN: 2078-0958 (Print); ISSN: 2078-0966 (Online)
WCE 2021

3. If ((red is medium) or (green is high)) and (Blue is
medium) then (Melon is About to Ripe).
4. If (blue is low) and (red is high) then (Melon is
Ripe)
5. If (blue is medium) or (red is high), then (Melon is
Ripe). Refer to (8).
The above rules will determine the melon category and
show the results in Fig. 6, the Defuzzification output in the
range of “0 to 10”, calculated using the centroid method.
The Defuzzification output explained as follow:
1. Less than 2, the melons are “Under Ripe.”
2. From 2 to 6, the melons are “About to Ripe.”
3. More than 6, melons are “Ripe.”
III. RESULTS AND DISCUSSION
It is so rare to find a classification of fruit ripeness from
the tree. Lighting that varies from one to another fruit in
the greenhouse is impacted by direct sunlight, shadows, or
other light noise.
For the sake of testing our system, we captured new 50
images for available melons categories of the new planting
in the same greenhouse on 20/February/2021. We used the
same distance from the camera and camera direction that
mentioned earlier in the Data section, but different phone
camera (i.e., iPhone XS, 12-megapixel (f/1.8, 1.4-micron)
+ 12-megapixel (f/2.4), and default image size
4032*3024). Also, we picked 31 labeled images from our
previous dataset (i.e., used for training Melon detection).
The images used for testing the output of the Fuzzy Logic
system are 81 images in total.
Box-plot created for each channel to find the range of
each category. The box plot explained in Fig. 7 as follow:
1. (a) Plot is the normalized blue means values for all
melon categories.
2. (b) Plot is the normalized green means values for all
melon categories.
3. (c) Plot is the normalized red means values for all
melon categories.
We noticed that blue and red highly correlated with the
maturity level. You can see in Fig. 7 ((a) blue) and ((c)
red) the “ripe” category has the lowest blue values and
highest red values, whereas the opposite for the “under-
ripe” category. The magic of detecting the “about to ripe”
category is by far the difference between green and red.
The green value is less than red and the opposite in the
“under-ripe.” Also, this category has a slightly lesser red
than “ripe,” whereas blue is high. We can sum up all these
in the following points:
1. Under Ripe: B is high, and G > R, R is low.
2. About to Ripe: B is high, R > G. R is average.
3. Ripe: B is shallow, and R is the highest in all
categories.
The testing procedure is as follow:
1. Creates a loop function to iterate over our melon
fruit images labeled with their actual categories.
2. Input each image value to the fuzzy logic system.
3. Create a data frame for the actual labels and fuzzy
logic output.
A confusion matrix has been used to compare the
system output versus the actual labels to get the accuracy.
As shown in Fig. 8, we get a 100% accuracy in classifying
(Ripe, About to Ripe (AtR), and Under Ripe (UR))
melons. “AtR” has close similarities to “Ripe” in color;
thus, using a different camera leads to less accuracy in
classifying “AtR” versus “Ripe” because of the various
camera lens that causes more or less than our references R,
G, and B values of the corresponding categories. Still, in
general, the R values were the highest in the ripe category,
and this will be solved by using (11) by taking the
maximum (M_blue Fig. 5(c) OR H_red Fig. 5(a)).
However, different light environments may or may not
leads to less classification accuracy. The accuracy in
classifying “UR” or “R” will still be good because of the
vast color differences between the ripe and under-ripe.
(a)
(b)
(c)
Fig. 7. (a) Is the blue mean values, (b) for green, and (c) for the red
channel.
Fig. 8. A heat-map graph to describe the confusion matrix. The
actual melon labels with their corresponding categories on the
“True” axis and the system output on the “Predicted” axis.
Proceedings of the World Congress on Engineering 2021 WCE 2021, July 7-9, 2021, London, U.K.
ISBN: 978-988-14049-2-3 ISSN: 2078-0958 (Print); ISSN: 2078-0966 (Online)
WCE 2021

Fig. 9. The output of the DSS for melon harvesting (M-
HDSS) using a Graphical User Interface (GUI).
As a result, we built a Graphical User Interface (GUI) to
help farmers and scientists manage the harvesting of
Alisha-F1 Melon fruits. The first window of the GUI
displays the detected melon labeled with its category name
as shown in Fig. 9.
IV. CONCLUSION
A novel of melon’s fruit harvesting system is
accomplished in this study by detecting the melon on the
tree, applying image processing technique on the detected
melon extract melon’s color, and finally, using Fuzzy Logic
to classify melon fruit into (ripe, about to ripe, and under-
ripe categories). We got 100% classification accuracy by
using iPhone rear camera as an image source. Whereas
using another camera (another image source) may lead to
different accuracies, thus changing the reference values for
various image sources are essentials because of the
environmental lightness or other camera specifications. And
to get rid of this, we have used a reference image that will
be used to apply the normalization based on it. Lastly, the
system can be modified to classify other fruit's maturity
levels using skin color.
ACKNOWLEDGMENT
The authors appreciate the Head of the Field Laboratory
Sub-Directorate, Directorate of Business Development and
Entrepreneurship, IPB University, Dr. Dwi Guntoro, and
ATP Manager of IPB University, Mr. Sarwono, to collect
the data and the information provided about melon fruit.
Without their support, this feat would not be a reality.
REFERENCES
[1] Employment in agriculture @ worldbank.org 2020, “Employment in
agriculture (% of total employment) (modeled ILO estimate) | Data.”
https://data.worldbank.org/indicator/SL.AGR.EMPL.ZS (accessed
Sep. 11, 2020).
[2] B. Venkatalakshmi and P. Devi, “Decision Support System for
Precision Agriculture,” Int. J. Res. Eng. Technol., vol. 03, no. 19, pp.
849–852, 2014, doi: 10.15623/ijret.2014.0319154.
[3] C. M. M. Coelho, C. de M. Bellato, J. C. P. Santos, E. M. M. Ortega,
and S. M. Tsai, “Effect of phytate and storage conditions on the
development of the ‘ hard-to-cook ,’” J. Sci. Food Agric., vol. 1243,
no. December 2007, pp. 1237–1243, 2007, doi: 10.1002/jsfa.
[4] S. Freilich et al., “Systems approach for exploring the intricate
associations between sweetness, color and aroma in melon fruits,”
BMC Plant Biol., vol. 15, no. 1, pp. 1–16, 2015, doi: 10.1186/s12870-
015-0449-x.
[5] S. J. Kays, “Preharvest factors affecting appearance,” Postharvest
Biol. Technol., vol. 15, no. 3, pp. 233–247, 1999, doi: 10.1016/S0925-
5214(98)00088-X.
[6] U. Ahmad, “The use of color distribution analysis for ripeness
prediction of Golden Apollo melon,” 2017.
[7] S. Zheng, W. Guan, and B. Li, “Digital Display Design of Ethnic
Clothing of Nanling,” no. Icmmcce, pp. 2805–2808, 2015, doi:
10.2991/icmmcce-15.2015.541.
[8] S. Zheng, W. Guan, B. Li, and D. QIN, “Analysis of Internet of
Things Talent Training and Curriculum System Innovation,” no.
Icemct, pp. 957–960, 2016, doi: 10.2991/icemct-16.2016.208.
[9] B. A. Iskandar, W. B. Suwarno, E. Gunawan, and S. K. Saptomo,
“Selection of potential genotypes and traits evaluation of honeydew
(Cucumis melo L.),” IOP Conf. Ser. Earth Environ. Sci., vol. 383, no.
1, 2019, doi: 10.1088/1755-1315/383/1/012012.
[10] M. Amendola, M. Neto, and V. Cruz, “Using fuzzy sets theory to
analyse environmental conditions in order to improve animal
productivity,” World Congr. …, vol. 15, no. July, pp. 29–40, 2005,
[Online]. Available:
http://www.ime.unicamp.br/~biomat/bio15art3.pdf.
[11] L. A. Zadeh, “Roles of soft computing and fuzzy logic in the
conception, design and deployment of intelligent systems,” IEEE Int.
Conf. Fuzzy Syst., vol. 1, no. 4, p. 1, 1997, doi: 10.1007/978-3-642-
58930-0_1.
[12] H. Wang and D. Qiu, “Computing with Words via Turing Machines:
A Formal Approach,” IEEE Trans. Fuzzy Syst., vol. 11, no. 6, pp.
742–753, 2003, doi: 10.1109/TFUZZ.2003.819841.
[13] M. Abadi et al., “TensorFlow: A system for large-scale machine
learning,” in Proceedings of the 12th USENIX Symposium on
Operating Systems Design and Implementation, OSDI 2016, Nov.
2016, pp. 265–283, Accessed: Mar. 14, 2021. [Online]. Available:
https://tensorflow.org.
[14] tzutalin, “labelImg.” 2015, Accessed: Mar. 19, 2021. [Online].
Available: https://github.com/tzutalin/labelImg.
[15] W. Liu et al., “SSD: Single shot multibox detector,” in Lecture Notes
in Computer Science (including subseries Lecture Notes in Artificial
Intelligence and Lecture Notes in Bioinformatics), 2016, vol. 9905
LNCS, pp. 21–37, doi: 10.1007/978-3-319-46448-0_2.
[16] Google, “Colaboratory – Google.”
https://research.google.com/colaboratory/faq.html (accessed Mar. 23,
2021).
[17] G. Bradski, “Open Source Computer Vision Library,” Dr. Dobb’s J.
Softw. Tools, 2000, [Online]. Available:
https://github.com/opencv/opencv.
[18] H. Rezatofighi, N. Tsoi, J. Gwak, A. Sadeghian, I. Reid, and S.
Savarese, “Generalized intersection over union: A metric and a loss
for bounding box regression,” in Proceedings of the IEEE Computer
Society Conference on Computer Vision and Pattern Recognition,
2019, vol. 2019-June, pp. 658–666, doi: 10.1109/CVPR.2019.00075.
[19] O. Marques, “Practical Image and Video Processing Using MATLAB
- Google Books,” in Practical Image and Video Processing Using
MATLAB, John Wiley & Sons, 2011, pp. 387–425.
[20] T. Kumar and K. Verma, “A Theory Based on Conversion of RGB
image to Gray image,” Int. J. Comput. Appl., vol. 7, no. 2, pp. 5–12,
2010, doi: 10.5120/1140-1493.
[21] S. Sural, G. Qian, and S. Pramanik, “Segmentation and histogram
generation using the HSV color space for image retrieval,” IEEE Int.
Conf. Image Process., vol. 2, pp. 589–592, 2002, doi:
10.1109/icip.2002.1040019.
[22] D. J. Bora and A. K. Gupta, “A New Approach towards Clustering
based Color Image Segmentation,” Int. J. Comput. Appl., vol. 107, no.
12, pp. 975–8887, 2014.
[23] D. J. Bora, A. K. Gupta, and F. A. Khan, “Comparing the
Performance of L*A*B* and HSV Color Spaces with Respect to
Color Image Segmentation,” vol. 5, no. 2, pp. 192–203, 2015,
[Online]. Available: http://arxiv.org/abs/1506.01472.
[24] J. Warner et al., “JDWarner/scikit-fuzzy: Scikit-Fuzzy version 0.4.2.”
Nov. 14, 2019, doi: 10.5281/ZENODO.3541386.
[25] J.-S. R. Jang, C.-T. Sun, and E. Mizutani, Neuro-Fuzzy And Soft
Computing.pdf, 1st editio. Prentice Hall India; 1st edition (1996)
(1600), 1996.
Author Biographies
Jaafar Mohammed AL-Delphi is currently a Master’s degree student at
the Department of Computer Science, IPB University, Bogor, Indonesia.
His bachelor’s degree in Computer Science, AL-Rafidain University
College, Baghdad, Iraq. He worked as a programmer at the Iraqi Industrial
Ministry, Baghdad, Iraq. His interests, computer vision, database
management, image processing, and machine learning. Jaafar became a
member of the IAENG in 2021.
Proceedings of the World Congress on Engineering 2021 WCE 2021, July 7-9, 2021, London, U.K.
ISBN: 978-988-14049-2-3 ISSN: 2078-0958 (Print); ISSN: 2078-0966 (Online)
WCE 2021
Sri Wahjuni is an Assistant Professor at the Department of Computer
Science, IPB University. She obtained her Master's and doctoral degrees at
The University of Indonesia. Her research interests include
embedded systems, heterogeneous networks, and the internet of things. She
is a member of IAENG and IEEE
Willy Suwarno is an Associate Professor at the Department of Agronomy
and Horticulture, IPB University. He studied plant breeding and plant
genetics at the IPB University and the University of Wisconsin-Madison.
He is a lead programmer for PBSTAT, web-based statistical software for
plant breeding. His research includes genotype-by-environment interaction,
genetic diversity analysis, and applied breeding of maize and melon.
Wulandari received the Master’s degree from the Graduate of Agriculture,
Kyoto University, Kyoto, Japan. She is currently a LECTURER at the
Department of Computer Science, IPB University, Bogor, Indonesia. Her
research interests include robotics, computer vision, the internet of things,
embedded systems, and machine learning. Wulandari, S,Komp, M.Agr.Sc
became a member of the IEEE Society (M) in 2019 and a member (M) of
the Japanese Society of Agricultural Machinery and Food Engineers
(JSAM) in 2018.
Proceedings of the World Congress on Engineering 2021 WCE 2021, July 7-9, 2021, London, U.K.
ISBN: 978-988-14049-2-3 ISSN: 2078-0958 (Print); ISSN: 2078-0966 (Online)
WCE 2021