
Decision PROPOSED DECISION OF ALJ DUDNEY
568
ALJ/KD1/ar9/jt2/lil PROPOSED DECISION Agenda ID #14308 (Rev. 1 2 ) Ratesetting 11/5/2015 Item 32 Decision PROPOSED DECISION OF ALJ DUDNEY (Mailed 9/18/2015) BEFORE THE PUBLIC UTILITIES COMMISSION OF THE STATE OF CALIFORNIA Application of Southern California Edison Company (U338E) for Authority to, among other things, Increase its Authorized Revenues for Electric Service in 2015, and to reflect that increase in Rates. Application 13-11-003 (Filed November 12, 2013) DECISION ON TEST YEAR 2015 GENERAL RATE CASE FOR SOUTHERN CALIFORNIA EDISON COMPANY 155715659 155735683 - 1 -
Transcript of Decision PROPOSED DECISION OF ALJ DUDNEY

ALJ/KD1/ar9/jt2/lil PROPOSED DECISIONAgenda ID #14308 (Rev. 12)
Ratesetting11/5/2015 Item 32
Decision PROPOSED DECISION OF ALJ DUDNEY (Mailed 9/18/2015)
BEFORE THE PUBLIC UTILITIES COMMISSION OF THE STATE OF CALIFORNIA
Application of Southern California EdisonCompany (U338E) for Authority to, amongother things, Increase its Authorized Revenuesfor Electric Service in 2015, and to reflect thatincrease in Rates.
Application 13-11-003(Filed November 12, 2013)
DECISION ON TEST YEAR 2015 GENERAL RATE CASEFOR SOUTHERN CALIFORNIA EDISON COMPANY
155715659155735683 - 1 -
A.13-11-003 ALJ/KD1/ar9/jt2/lil PROPOSED DECISION (Rev. 12)
Table of Contents
Title Page
DECISION ON TEST YEAR 2015 GENERAL RATE CASE FOR SOUTHERNCALIFORNIA EDISON COMPANY 1Summary 21. Procedural Background 42. Background on Recorded Cost Data 83. Evidentiary Standards and the Burden of Proof 84. Risk Management and Safety Matters 95. Policy 13
5.1. Use of 2013 Recorded Spending Data 135.2. 2013 Recorded Capital Expenditures 14
6. Generation 146.1. Generation – Power Procurement 146.2. Generation – Power Production 156.3. Nuclear Generation – Palo Verde 166.4. Generation – Coal Generation (Mohave) 176.5. Generation – Hydroelectric Generation 17
6.5.1. Hydro O&M 176.5.2. Hydro Capital 20
6.6. Generation – Gas-Fired Generation 206.6.1. Mountainview 20
6.6.1.1. Mountainview O & M 206.6.1.2. Mountainview Capital 23
6.6.2. Peakers 236.6.2.1. Peakers O&M 246.6.2.2. Peakers – Capital 26
6.7. Generation – Other 276.7.1. Solar Photovoltaic Program (SPVP) (FERC 549 and 550) 276.7.2. Catalina (FERC 549.140) 306.7.3. Fuel Cells (FERC 549) 32
7. Transmission and Distribution (T&D) 337.1. T&D – Policy 34
7.1.1. Safety and Reliability Investment Incentive Mechanism(SRIIM) 34
7.2. T&D – Engineering and Grid Technology 39
- i -

A.13-11-003 ALJ/KD1/ar9/jt2/lil PROPOSED DECISION (Rev. 12)
Table of Contents (cont.)
Title Page
7.2.1. Centralized Remedial Action Scheme (CRAS) 407.2.2. Engineering and Grid Technology O&M 437.2.3. Engineering and Grid Technology Capital 457.2.4. Fiber Optic Network Maintenance 467.2.5. Electric Vehicle Technical Center (EVTC) Laboratory
Expansion Project 467.2.6. Distributed Energy Storage Integration (DESI) 467.2.7. Westminster Labs Upgrades 477.2.8. Equipment Demonstration and Evaluation Facility (EDEF) 487.2.9. Phasor Program 48
7.2.9.1. Engineering and Grid Technology CapitalDiscussion 49
7.3. T&D – Electric System Planning 497.3.1. Transmission Planning Projects 52
7.3.1.1. Victor 220/115 kilovolt (kV) Substation 527.3.1.2. Other ORA Proposals 52
7.3.2. Load Growth Planning Projects 537.3.3. System Improvement/Reinforcement Program 55
7.3.3.1. Substation Equipment ReplacementProgram (SERP) 55
7.3.3.2. DSP Circuit Work 567.3.3.3. Capacitor and Circuit Automation Programs 577.3.3.4. Uncontested Programs 58
7.3.4. Generator Interconnection Program 597.3.5. Added Facilities Projects 59
7.4. T&D – Infrastructure Replacement 607.4.1. Underground Cable Programs 62
7.4.1.1. WCR Program 667.4.1.2. Cable in Conduit (CIC) Replacement Program 677.4.1.3. TBCLE Program 697.4.1.4. Discussion 70
7.4.2. A-Bank Transformer Replacement 737.4.3. Distribution Circuit Breaker Replacement 767.4.4. Uncontested Infrastructure Replacement Programs 79
- ii -
A.13-11-003 ALJ/KD1/ar9/jt2/lil PROPOSED DECISION (Rev. 12)
Table of Contents (cont.)
Title Page
7.4.4.1. B-bank Transformers 797.4.4.2. 4 kV Circuit Replacement 807.4.4.3. Other Uncontested Infrastructure Replacement
Programs 807.5. T&D – Customer-Driven Programs and Distribution Construction 81
7.5.1. O&M 817.5.2. Capital 84
7.5.2.1. Customer Meter Connections 877.5.2.2. Underground Conversions – Rule 20A 887.5.2.3. Underground Conversions – Rules 20B and 20C 897.5.2.4. Other Issues 90
7.6. T&D – Distribution Inspection and Maintenance 917.6.1. Underground Structure Rehabilitation Program 917.6.2. Distribution Maintenance O&M and Capital 977.6.3. Inspection and Maintenance O&M 98
7.6.3.1. FERC Account 583.120 987.6.3.1.1. Overhead Detail Inspections (ODI) 987.6.3.1.2. Distribution Intrusive Pole Inspections 997.6.3.1.3. Joint Pole Expenses and Credits 101
7.6.3.2. FERC Accounts 593.120 & 594.120 1037.6.4. Poles – Capital Expenditures 105
7.6.4.1. Pole Replacement Unit Cost 1057.6.4.2. Deteriorated Pole Replacements 1077.6.4.3. Aged Pole Replacements 1097.6.4.4. Joint Pole Replacement Capital Credits and Wood
Pole Disposal 1137.6.5. Other Capital 114
7.7. T&D – Pole Loading 1147.7.1. SCE’s Pole Loading Study 1177.7.2. O&M 119
7.7.2.1. Assessments and Planning (Accounts 583.125 –Distribution and 566.125 – Transmission) 120
7.7.2.2. Repair (Accounts 571.125 – Transmission and 593.125– Distribution) 122
- iii -

A.13-11-003 ALJ/KD1/ar9/jt2/lil PROPOSED DECISION (Rev. 12)
Table of Contents (cont.)
Title Page
7.7.2.3. Related Expense (Accounts 571.125 –Transmission and 593.125 – Distribution) 123
7.7.2.4. Joint Pole Organization (JPO) (Account 583.125) 1247.7.3. Capital 125
7.7.3.1. Pole Replacements 1267.7.3.1.1. Joint Poles, Attachments, and Cost
Recovery 1267.7.3.1.2. Number of Pole Replacements 1307.7.3.1.3. Discussion 133
7.7.3.2. Other Expenditures Related to PLP 1407.7.4. Ratemaking for PLP 1417.7.5. Summary of Pole Replacements 142
7.8. T&D – Grid Operations 1437.8.1. Grid Operations O&M 144
7.8.1.1. GCC Operations (Account 561.170) 1447.8.1.2. Storm Response (Accounts 573.170 and 598.170) 1467.8.1.3. Troubleman/First Responder Activities
(Account 583.170) 1477.8.1.4. Streetlights (Account 585.170) 1487.8.1.5. Service Guarantees (Account 587.170) 1487.8.1.6. Uncontested Accounts 149
7.8.2. Grid Operations Capital 1507.8.2.1. Storm 1507.8.2.2. Streetlights 151
7.8.2.2.1. Discussion – Streetlight DataQuality and Transparency 155
7.8.2.2.2. Discussion – Streetlight Forecast 1557.8.2.3. Operational Facilities Maintenance 157
7.9. T&D – Transmission & Substation Maintenance 1587.9.1. O&M 158
7.9.1.1. Transmission Line Inspection(FERC Account 566.150) 159
7.9.1.2. Transmission Line Maintenance(FERC Account 571.150) 161
- iv -

A.13-11-003 ALJ/KD1/ar9/jt2/lil PROPOSED DECISION (Rev. 12)
Table of Contents (cont.)
Title Page
7.9.1.2.1. Insulator Washing and Road andRight of Way Maintenance 161
7.9.1.2.2. Transmission VegetationManagement 162
7.9.1.2.3. Transmission Overhead andUnderground Maintenance 163
7.9.1.2.4. Transmission Line RatingRemediation 163
7.9.1.3. Substation Inspection and Maintenance(FERC Accounts 568.150 and 592.150) 1647.9.1.3.1. Circuit Breaker Inspection and
Maintenance 1647.9.1.3.2. Transformer Inspection and
Maintenance 1657.9.1.3.3. Relay Inspection and Maintenance 1657.9.1.3.4. Uncontested Forecasts 167
7.9.2. Capital 1677.9.2.1. Transmission Capital Maintenance 1687.9.2.2. Transmission and Substation Claims 1697.9.2.3. Transmission Line Rating Remediation 1707.9.2.4. Transmission Relocations 1707.9.2.5. Transmission Tools and Work Equipment 1717.9.2.6. Substation Capital Maintenance 1717.9.2.7. Online Transformer Monitoring 1727.9.2.8. Substation Protection and Control Replacements 1737.9.2.9. Substation Tools and Work Equipment 1737.9.2.10. Transmission and Substation Spare Parts 174
7.10. T&D – Safety, Training, and Environmental Programs 1747.10.1. T&D Training Seat-Time (Portions of Accounts 566.250 -
Transmission and 588.250 - Distribution) 1767.10.2. T&D Training Delivery Benefits (Portions
of Accounts 566.250 - Transmission and588.250 - Distribution) 178
- v -

A.13-11-003 ALJ/KD1/ar9/jt2/lil PROPOSED DECISION (Rev. 12)
Table of Contents (cont.)
Title Page
7.10.3. Employee Recognition (Portions of Accounts 566.250and 588.250) 178
7.10.4. T&D Environmental Services (Portion ofAccount 566.250 - Transmission and Entiretyof Account 582.250 - Distribution) 179
7.10.5. Uncontested Issues 1797.11. T&D – Other Costs and Other Operating Revenue (OOR) 179
7.11.1. Grid Contract Management (Account 566.280) 1817.11.2. Meter Credits (Account 586.281) 1837.11.3. Distribution Work Order Write-Offs and Underground
Utility Locating Service (Account 588.281) 1837.11.4. Capital-Related Expense (Accounts 594.281 – Distribution
and 560.281 – Transmission/Substation) 1857.11.5. Facility O&M (Accounts 566.282 – Transmission/Substation
and 580.282 – Distribution) 1867.11.6. SCE-Financed Added and Interconnection Facilities
(Accounts 454.300 and 454.350) 1877.11.7. Customer-Financed Added/Interconnection Facilities
(Account 456.700) 1888. Customer Service 188
8.1. Customer Service – O&M 1888.1.1. Meter Reading Operations (Account 902) 1898.1.2. Billing Services (Account 903.500) 1918.1.3. Customer Contact Center (Account 903.800) 1948.1.4. Uncollectible Expense (Account 904) 1958.1.5. Program Management Organization (PMO)
(Account 907.700) 1968.1.6. Test, Inspect and Repair (Account 586.400) 1988.1.7. Customer Installation and Energy Theft Expense
(Account 587) 1998.1.8. Business Customer Division (Account 908.600) 200
8.2. Customer Service – Capital 2018.2.1. Meter Services Organization (MSO) 2018.2.2. Business Customer Division (BCD) 204
- vi -

A.13-11-003 ALJ/KD1/ar9/jt2/lil PROPOSED DECISION (Rev. 12)
Table of Contents (cont.)
Title Page
8.3. Customer Service – OOR 2059. Information Technology and Business Integration 206
9.1. IT – O&M 2069.1.1. Infrastructure Technology Services (ITS)
(Account 920/921) 2079.1.2. Cybersecurity & Compliance (Account 920/921) 2119.1.3. Client Services & Planning (CS&P) (Account 920/921) 2149.1.4. Incremental O&M for New Software (Account 920/921) 217
9.2. IT – Capital 2199.2.1. Reducing 2014 Forecast Due to 2013 Spending 2199.2.2. Detailed Tracking of Costs 2209.2.3. Midrange Enterprise Servers Hardware/Alhambra Data
Center 2229.2.4. Personal Computers – Desktop/Notebook and
Ruggedized Laptops Refresh/Replacement 2239.2.5. Transmission Network Facilities 2259.2.6. Fiber Cable Replacement 2289.2.7. Microwave Replacement 2309.2.8. Mobile Radio System Replacement 2329.2.9. Risk Management Disaster Recovery 2329.2.10. Telecom Costs for Projects 233
9.3. IT – Capitalized Software 2379.3.1. Software Asset Management (SAM) Bundles 237
9.3.1.1. ORA’s 34% SAM Reduction 2379.3.1.2. Renewable Contract Management System 2409.3.1.3. Consolidated Mobile Solution 2419.3.1.4. Cybersecurity and IT Compliance 241
9.3.2. Regulatory Mandates 2429.3.3. Other Capitalized Software 244
9.3.3.1. Safety, Security & Compliance: Master AccessProject (MAP) 244
9.3.3.2. Financial Services 2459.3.3.3. Electronic Document Management/Records
Management (eDMRM) 245
- vii -
A.13-11-003 ALJ/KD1/ar9/jt2/lil PROPOSED DECISION (Rev. 12)
Table of Contents (cont.)
Title Page
9.3.3.4. Customer Service – Digital Experience Project 2469.3.3.5. Generation Management System (GMS) 251
10. Human Resources, Benefits and Other Compensation 25110.1. Human Resources (HR) Department Expenses 254
10.1.1. Executive Officer Expenses 25510.2. Short Term Incentive Program (STIP) 25710.3. Long Term Incentives (LTI) 26110.4. Recognition Programs 26210.5. Pension and Benefits Programs (Account 926) 263
10.5.1. Pensions 26410.5.2. Post-Retirement Benefits Other than Pensions (PBOPs) 26510.5.3. Other Benefits 266
11. Safety, Security & Compliance (SS&C) 27111.1. Ethics and Compliance (Accounts 920/921, 923) 27211.2. Corporate Environmental, Health, and Safety (CEHS) (Accounts
566.250, 582.250, 920/921, 923, and 925) 27411.2.1. CEHS Management and Environmental Services
(Account 920/921) 27411.2.2. Environmental Services for Transmission and Distribution
(Portion of Account 566.250 - Transmission and Entirety ofAccount 582.250 - Distribution) 275
11.2.3. Health and Safety (Account 925) 27711.2.4. Outside Consulting Services (Account 923) 27811.2.5. Marine Mitigation Projects 278
11.3. Corporate Security and Business Resiliency(Accounts 920/921 and 923, and Capital Expenditures) 284
12. Financial, Legal, and Operational Services (FL&OS) 28512.1. Financial Services 286
12.1.1. Accounts 920/921 28612.1.2. Accounts 923/930 287
12.1.2.1. Bain Consulting Costs 28712.1.2.2. Accounts Payable Vendor Discounts 28912.1.2.3. Removal of Tax Consultant Costs 292
12.2. Audit Services Department (ASD) 292
- viii -

A.13-11-003 ALJ/KD1/ar9/jt2/lil PROPOSED DECISION (Rev. 12)
Table of Contents (cont.)
Title Page
12.3. Property and Liability Insurance (Accounts 924 and 925) 29512.4. Legal 296
12.4.1. Law Department 29612.4.1.1. FERC Accounts 920/921: In-House 29712.4.1.2. FERC Accounts 923/925/928: Outside Counsel 297
12.4.1.2.1. Outside Counsel Incentive Payments 29812.4.1.2.2. Grass Valley Fire Outside
Counsel Costs 29912.4.1.2.3. TURN’s Forecasting Methodology 301
12.4.1.3. FERC Account 930: Corporate Governance 30212.4.2. Claims 304
12.4.2.1. FERC Account 920/921/924: ClaimsAdministrative and General 304
12.4.2.2. FERC Account 925: Claims Reserves 30612.4.3. Workers’ Compensation (Account 925) 308
12.5. Operational Services 31012.5.1. Operational Services O&M (other than CRE) 31012.5.2. Operational Services Capital (other than CRE) 31112.5.3. SBUA Proposal to Track Spending with Small Businesses 31112.5.4. CRE O&M 311
12.5.4.1. FERC Accounts 920/921 31212.5.4.2. Rents (Account 931) 31512.5.4.3. Non-Labor Repairs and Maintenance
(Account 935) 31612.5.5. CRE Capital 317
12.5.5.1. Contingency Funding and Project ManagementCosts 319
12.5.5.2. Emergency Operations Center 32412.5.5.3. General Office 2 (GO2) Conference & Training
Center 32612.5.5.4. GO5 Parking Structure 32712.5.5.5. IBC Remodel 32912.5.5.6. Rancho Cucamonga Office Building Optimization33012.5.5.7. Capital Maintenance Program 331
- ix -

A.13-11-003 ALJ/KD1/ar9/jt2/lil PROPOSED DECISION (Rev. 12)
Table of Contents (cont.)
Title Page
12.5.5.8. Ongoing Furniture Modifications Blanket 33412.5.5.9. Energy Efficiency Blanket 33512.5.5.10. Garage Infrastructure Upgrade Program 33812.5.5.11. Service Center Infrastructure Upgrade 34012.5.5.12. IT Equipment & Infrastructure Blanket 34212.5.5.13. Corporate Communications Media Center 344
13. External Relations 34613.1. Corporate Communications 347
13.1.1. Administrative and General (A&G) (Account 920/921) 34713.1.2. Communication Measurement and Ethnic Media Services
(Account 923) 34913.1.3. Communications Products (Account 930) 349
13.1.3.1. Baseline 35013.1.3.2. Public Safety Around Electricity Education
Campaign 35113.1.3.3. Summer Readiness Energy Conservation
Advertising Campaign 35413.1.3.4. Corporate Responsibility Report 355
13.2. Corporate Membership Dues & Fees (Account 930.2) 35613.3. Integrated Planning & Environmental Affairs (IP&EA) 360
13.3.1. Account 557 36013.3.2. Generation Planning (Account 549) 36013.3.3. A&G (Accounts 9210/921) 362
13.4. Regulatory Operations and Regulatory Policy & Affairs (RP&A)(Account 920/921) 362
13.5. Local Public Affairs (LPA) 36413.5.1. A&G (Accounts 920/921) 36413.5.2. Business License Tax (BLT) (Account 408) 366
13.6. Other Uncontested Issues 36714. Ratemaking 367
14.1. Market Redesign and Technology Upgrade MemorandumAccount (MRTUMA) 367
14.2. Residential Service Disconnection Memorandum Account(RSDMA) 368
- x -
A.13-11-003 ALJ/KD1/ar9/jt2/lil PROPOSED DECISION (Rev. 12)
Table of Contents (cont.)
Title Page
14.3. Edison SmartConnect Accounts 36915. Jurisdictional Issues 36916. Sales and Customer Forecast 36917. Other Operating Revenue 37318. Cost Escalation 37519. Post-Test Year Ratemaking (PTYR) 375
19.1. SCE’s Proposed PTYR Mechanism 37619.1.1. Advice Letter Filing to Implement Revenue Requirement 37619.1.2. O&M Costs 37619.1.3. Capital-Related Cost Increases 37719.1.4. Z-Factor for Major Exogenous Cost Changes 377
19.2. ORA’s Position 37819.3. TURN’s Position 38019.4. SCE’s Rebuttal 38119.5. Discussion 382
20. Electric Plant 38621. Depreciation 386
21.1. The Role of Judgment and Supplemental Studies 38821.2. Average Service Life (ASL) and Survivor Curves 391
21.2.1. Account 355 – Transmission Poles and Fixtures 39321.2.2. Account 353 – Station Equipment 39621.2.3. Account 354 – Transmission Towers and Fixtures 39621.2.4. Account 356 – Transmission Overhead Conductors and
Devices 39721.2.5. Account 362 – Distribution Station Equipment 39721.2.6. Account 364 – Distribution Poles, Towers, and Fixtures 39821.2.7. Account 367 – Underground Conductor & Devices 39921.2.8. Account 368 - Line Transformers 40021.2.9. Account 369 – Services 40121.2.10. Account 373 – Street Lighting 40221.2.11. Other Accounts and Summary 402
21.3. Cost of Removal (COR) and NSR 40321.3.1. Account 352 – Transmission Structures and Improvements 40521.3.2. Account 353 – Transmission Station Equipment 406
- xi -

A.13-11-003 ALJ/KD1/ar9/jt2/lil PROPOSED DECISION (Rev. 12)
Table of Contents (cont.)
Title Page
21.3.3. Account 354 – Transmission Towers and Fixtures 40721.3.4. Account 355 – Transmission Poles and Fixtures 40821.3.5. Account 356 – Transmission Overhead Conductor and Devices
40921.3.6. Account 362 – Station Equipment 41021.3.7. Account 364 – Distribution Poles, Towers, & Fixtures 41121.3.8. Account 365 – Distribution Overhead Conductors
and Devices 41321.3.9. Account 366 – Underground Conduit 41421.3.10. Account 367 – Underground Conductor 41521.3.11. Account 368 – Distribution Line Transformers 41621.3.12. Account 369 – Services 41621.3.13. Account 373 – Street Lighting 41721.3.14. Other Accounts and Summary 418
21.4. Decommissioning Projects 41821.4.1. SONGS Marine Mitigation 41821.4.2. Mohave 41921.4.3. Solar 2 and Mountainview Units 1&2 419
21.5. Generation Plant Service Life Estimates 41922. Taxes 421
22.1. Background on Flow-Through vs. Normalized Tax Accounting 42322.2. Safe Harbor Method for Repairs 424
22.2.1. SCE Should Have Informed the Commission 42622.2.2. TURN’s Proposed Remedy 42922.2.3. TURN’s Proposal is Not Retroactive Ratemaking 429
22.2.3.1. Review of Precedents Cited by SCE 42922.2.3.2. Analysis of Additional Case Law 43222.2.3.3. SCE’s Conduct in Relation to the Retroactive
Ratemaking Prohibition 43522.2.3.4. Other Factors 436
22.2.4. A Ratebase Offset Does Not Violate IRS NormalizationRules 436
22.2.5. Adopted Remedy 44322.5. Other Issues 449
- xii -

A.13-11-003 ALJ/KD1/ar9/jt2/lil PROPOSED DECISION (Rev. 12)
Table of Contents (cont.)
Title Page
22.6. Policy Considerations 45023. Rate Base 452
23.1. Customer Advances 45223.2. Materials and Supplies 45423.3. Working Cash – Operational Cash 45623.4. Working Cash – Lead Lag Study 45723.5. Customer Deposits 46023.6. AFUDC 464
24. Results of Examination 46425. Operational Excellence (OpX) 46426. Joint Testimony Regarding Accessibility Issues 46627. Settlements 468
27.1. Underserved and Hard-to-Reach Communities 46827.2. Streetlights 469
28. Other Issues 47028.1. SCE and Logo 47028.2. Greenhouse Gas Revenues 472
29. Comments on Proposed Decision 47229.1. ORA’s Cited “Unresolved Issues” 47229.2. Changes in Response to Comments 473
30. Assignment of Proceeding 474Findings of Fact 474Conclusions of Law 522ORDER 537
APPENDIX A - List of AcronymsAPPENDIX B – Timeline of Events Relevant to Disputed Tax IssuesAPPENDIX C – Results of Operations 2015APPENDIX D – Post-Test Year Results
- xiii -
A.13-11-003 ALJ/KD1/ar9/jt2/lil PROPOSED DECISION (Rev. 12)
DECISION ON TEST YEAR 2015 GENERAL RATE CASEFOR SOUTHERN CALIFORNIA EDISON COMPANY
Summary
This decision approves a test year revenue requirement of $5,189 million
(for a 7.88% decrease) for Southern California Edison Company (SCE) pursuant
to its 2015 General Rate Case Application 13-11-003, as summarized in Appendix
C of this decision. The adopted revenue requirement reflects our careful
assessment of SCE’s 2015 test year base revenue requirements necessary to
provide safe and reliable service. Appendix C contains the results of operations
supporting tables for SCE, which incorporates the forecasted costs we find to be
reasonable, and which are adopted in today’s decision. The adopted 2015
revenue requirements shall become effective upon filing of tariffs pursuant to the
directives of this decision.
This decision also authorizes attrition rate adjustments of $209 million
(4.03%) for 2016 and an additional $272 million (5.03%) for 2017 as set forth in
Appendix D of this decision to provide funds necessary for SCE to continue to
provide safe and reliable service to customers beyond the test year, while
offering a reasonable opportunity to earn the rate of return previously found
reasonable by the Commission. The cumulative adopted effect on rates by 2017,
relative to present rates, is a 0.66% increase.
The authorized amounts are less than SCE requested. SCE’s final updated
request for its total 2015 forecasted revenue requirement was $5,512 million,
representing a 2.15% decrease relative to present rates. SCE requested attrition
year increases of $236 million and $320 million for 2016 and 2017, respectively.
SCE’s requested cumulative increase, relative to present rates, by 2017 is 7.72%.
- 2 -

A.13-11-003 ALJ/KD1/ar9/jt2/lil PROPOSED DECISION (Rev. 12)
One significant component of SCE’s request in this application is for capital
expenditures. The impact of current capital expenditures on current revenue
requirements is small, but the cumulative impact is powerful over time as the
value of the capital assets (including rate of return and cost of removal) is repaid
by ratepayers. SCE requests approximately $3.9 billion in capital expenditures
during 2015 alone, of which it identifies $2.8 billion as directly related to ten
primary risks (many of which are directly linked to safety and reliability).1 We
approve approximately $3.4 billion of total capital expenditures, reflecting our
judgement that the long-term benefits of these investments justify the costs.
However, we also deny notable portions of SCE’s request for expenditures that
SCE has not demonstrated are just and reasonable costs of safe and reliable
service.
SCE identifies several key justifications for its requested revenue
requirements and capital expenditures:
Connecting new customers and responding to customer requests,such as undergrounding;
System reinforcements to accommodate load growth;
Capital investments to replace aging distribution infrastructureand business systems;
Testing and replacement (where needed) of over 1.4 milliondistribution poles; and
An increase in depreciation rates to account for increases in costof removal and other depreciation parameters.2
The authorized increase in revenue requirement reflects the costs forecast
for test year 2015 for delivering electricity to customers, maintaining SCE’s
electric distribution and generation infrastructure, and providing safe and
1 Exhibit SCE-17 at 3-8. 2 Application 13-11-003 at 1-2.
- 3 -
A.13-11-003 ALJ/KD1/ar9/jt2/lil PROPOSED DECISION (Rev. 12)
reliable service. The revenue requirement authorized in this decision does not
include commodity costs of electricity procured for customers or costs of fuel
used in generating electricity, which are addressed in a separate proceeding.
Procedural Background1.
On November 12, 2013, Southern California Edison Company (SCE) filed
its Test Year (TY) 2015 General Rate Case (GRC) Application (A.) 13-11-003. In
support of its application, SCE provided thousands of pages of testimony and
supporting work papers, and sponsored many witnesses. Protests or other
responses were filed on December 16, 2013 by Office of Ratepayer Advocates
(ORA), The Utility Reform Network (TURN), The Greenlining Institute
(Greenlining), Coalition for Affordable Streetlights (CASL), Alliance for Retail
Energy Markets jointly with Direct Access Customer Coalition, and National
Consumer Law Center. SCE proposed a procedural schedule based on the
Commission’s 1989 Rate Case Plan, as modified by numerous subsequent
decisions. Other parties proposed more extended schedules. The prehearing
conference in this proceeding was held on February 11, 2014.
On February 14, 2014, TURN filed a motion asking the Commission to
authorize a GRC Revenue Requirement Memorandum Account (RRMA) to track
the change in revenue requirement ultimately adopted in this proceeding during
the period between January 1, 2015 and the date a final decision is adopted. On
March 3, 2014, SCE filed a response in support of this motion. The motion was
granted in the March 27, 2014 Joint Scoping Memo and Ruling of Assigned
Commissioner and Administrative Law Judges (Scoping Memo).
The Scoping Memo noted a broad scope of issues for the case: “all matters
raised by SCE’s application, or which may be reasonably inferred from the
application, are within scope of this proceeding.” However, the Scoping Memo
- 4 -
A.13-11-003 ALJ/KD1/ar9/jt2/lil PROPOSED DECISION (Rev. 12)
excludes issues relating to the San Onofre Nuclear Generating Station (SONGS),
to the extent practicable, as well as the Four Corners Generating Station.3 SCE
served additional testimony (Exhibit SCE-14) responding to these changes and
other requirements in the Scoping Memo on April 7, 2014.
On May 15, 2014, Commission President Michael Peevey (who was the
assigned Commissioner at that time) issued a Ruling Amending Scoping Memo
and Ordering Supplemental Testimony Regarding Risk Management and Safety
Matters (Amended Scoping Memo). This ruling directed SCE serve testimony
addressing three questions relating to risk management, existing controls, and
alternatives. SCE served the requested testimony (Exhibit SCE-15) on July 3,
2014. The Commission’s Safety and Enforcement Division (SED) served a report
in response to SCE’s testimony on August 15, 2014. SED’s report was later
admitted into evidence (Exhibit ALJ-1).
ORA, California City-County Street Light Association (Cal-SLA), CASL,
California Coalition of Utility Employees (CUE), Small Business Utility
Advocates (SBUA), San Diego Gas & Electric Company (SDG&E), and TURN,
served their direct testimony in August, 2014. Parties served reply and rebuttal
testimony in September, 2014. Joint Minority Parties (JMP)4 did not serve direct
testimony, but did serve rebuttal. Evidentiary hearings began on September 29,
2014 and concluded on October 28, 2014.
On November 17, 2014, the parties jointly served a three-volume Joint
Comparison Exhibit (Exhibits JCE-1, JCE-2, and JCE-1C). This was later updated
with reorganized versions containing the same information (JCE-3 and JCE-4,
3 Scoping Memo at 3-7.4 JMP is a group consisting of: National Asian American Coalition, Ecumenical Center for
Black Church Studies, Jesse Miranda Center for Hispanic Leadership, Los Angeles Latino Chamber of Commerce, National Hispanic Christian Leadership Conference, and Christ Our Redeemer AME Church.
- 5 -
A.13-11-003 ALJ/KD1/ar9/jt2/lil PROPOSED DECISION (Rev. 12)
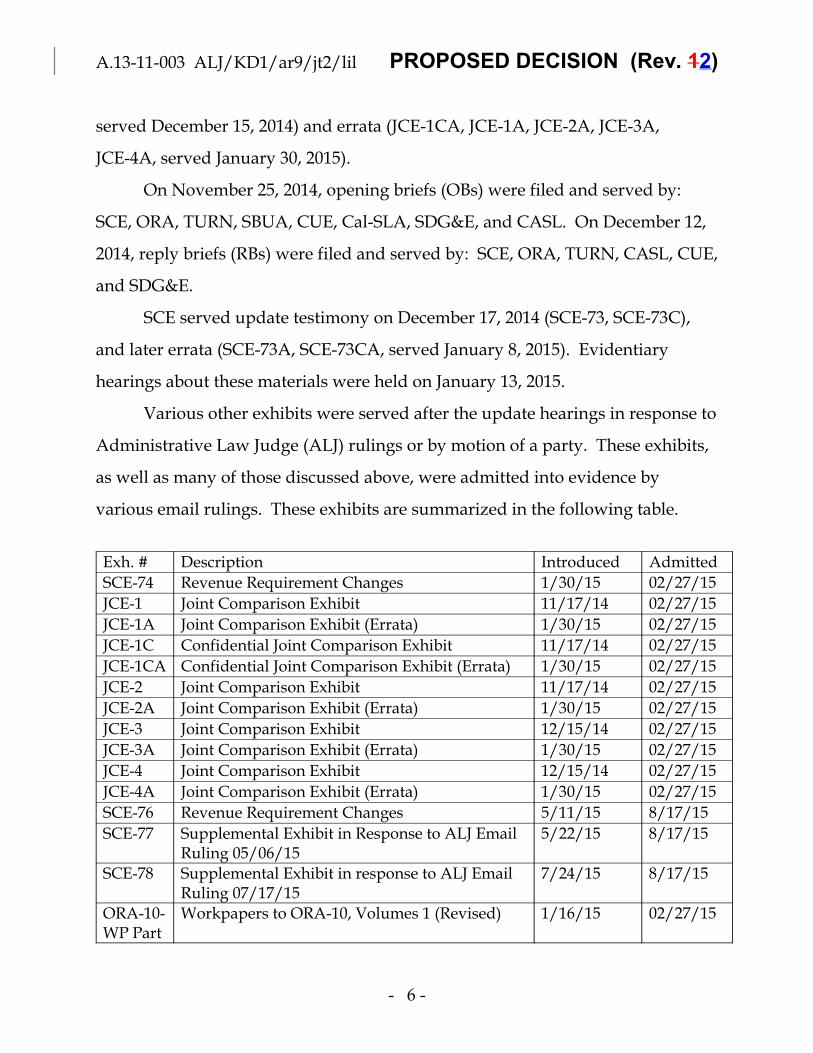
served December 15, 2014) and errata (JCE-1CA, JCE-1A, JCE-2A, JCE-3A,
JCE-4A, served January 30, 2015).
On November 25, 2014, opening briefs (OBs) were filed and served by:
SCE, ORA, TURN, SBUA, CUE, Cal-SLA, SDG&E, and CASL. On December 12,
2014, reply briefs (RBs) were filed and served by: SCE, ORA, TURN, CASL, CUE,
and SDG&E.
SCE served update testimony on December 17, 2014 (SCE-73, SCE-73C),
and later errata (SCE-73A, SCE-73CA, served January 8, 2015). Evidentiary
hearings about these materials were held on January 13, 2015.
Various other exhibits were served after the update hearings in response to
Administrative Law Judge (ALJ) rulings or by motion of a party. These exhibits,
as well as many of those discussed above, were admitted into evidence by
various email rulings. These exhibits are summarized in the following table.
Exh. # Description Introduced Admitted
SCE-74 Revenue Requirement Changes 1/30/15 02/27/15
JCE-1 Joint Comparison Exhibit 11/17/14 02/27/15
JCE-1A Joint Comparison Exhibit (Errata) 1/30/15 02/27/15
JCE-1C Confidential Joint Comparison Exhibit 11/17/14 02/27/15
JCE-1CA Confidential Joint Comparison Exhibit (Errata) 1/30/15 02/27/15
JCE-2 Joint Comparison Exhibit 11/17/14 02/27/15
JCE-2A Joint Comparison Exhibit (Errata) 1/30/15 02/27/15
JCE-3 Joint Comparison Exhibit 12/15/14 02/27/15
JCE-3A Joint Comparison Exhibit (Errata) 1/30/15 02/27/15
JCE-4 Joint Comparison Exhibit 12/15/14 02/27/15
JCE-4A Joint Comparison Exhibit (Errata) 1/30/15 02/27/15
SCE-76 Revenue Requirement Changes 5/11/15 8/17/15
SCE-77 Supplemental Exhibit in Response to ALJ EmailRuling 05/06/15
5/22/15 8/17/15
SCE-78 Supplemental Exhibit in response to ALJ EmailRuling 07/17/15
7/24/15 8/17/15
ORA-10-WP Part
Workpapers to ORA-10, Volumes 1 (Revised) 1/16/15 02/27/15
- 6 -

A.13-11-003 ALJ/KD1/ar9/jt2/lil PROPOSED DECISION (Rev. 12)
1 R
ORA-10-WP Part2 R
Workpapers to ORA-10, Volumes 2 (Revised) 1/16/15 02/27/15
ORA-15-WP R
Workpapers to ORA-15 (Revised) 1/16/15 02/27/15
TURN-06 R
Report on Various Results of Operations Issuesin Southern California Edison’s 2015 Test YearGeneral Rate Case – REVISIONS for The 2014Tax Act
2/17/15 03/10/15
The proceeding was submitted on July 24, 2015.
We thank the parties to this proceeding for their participation in our
testing of the online supporting documents system. We hope that this system
will soon assist parties and the public to access prepared exhibits in California
Public Utilities Commission (CPUC) proceedings.
Background on Recorded Cost Data2.
The record of this proceeding relies heavily on recorded spending
information, particularly for the period 2008 through 2012. In particular, 2012 is
referred to as the base year or last recorded year (LRY). In some areas, 2013
recorded data is also discussed. Some common forecasting techniques that rely
on historical data are LRY or a five-year average (5YA), which generally refers to
2008-2012, unless otherwise noted.
Much of the recorded data in this proceeding is organized using a system
of accounts established by the Federal Energy Regulatory Commission (FERC).
FERC Accounts are used to record operations and maintenance (O&M) costs.
Many FERC Accounts include sub-accounts, and the sub-accounts are the unit of
analysis for many issues. Sub-accounts are shown as three decimal places
following the account number. For example: FERC sub-account 561.170 records
costs related to Grid Control Center (GCC) Operations.
- 7 -

A.13-11-003 ALJ/KD1/ar9/jt2/lil PROPOSED DECISION (Rev. 12)
Evidentiary Standards and the Burden of Proof3.
No party disputes that SCE bears the burden of proof.5 As the applicant,
SCE has the burden of affirmatively establishing the reasonableness of all aspects
of its request.
SCE contends that the appropriate evidentiary standard is “preponderance
of the evidence.” In support of this view, SCE points to its two most recent
GRCs, as well as the two most recent GRCs of Pacific Gas and Electric Company
(PG&E).6 We agree, and have analyzed the record in this proceeding according
to this standard. As a general matter, with respect to individual uncontested
issues in this proceeding, we find that SCE has made a prima facie just and
reasonable showing, unless otherwise stated in this opinion.
Risk Management and Safety Matters4.
One of the central tasks facing the Commission in this proceeding is to
balance safety and reliability risks in comparison with cost. SCE is required by
law to “promote the safety, health, comfort, and convenience of its patrons,
employees, and the public” while including only “just and reasonable” charges in
its rates.7 Our fundamental challenge in many disputed areas of this case is to
reach an outcome consistent with these twin objectives. This is a familiar
challenge that has been present in countless previous GRCs and other
proceedings, even though the approach, framework, and language surrounding
the issues continue to evolve.
In Decision (D.) 14-12-025, we adopted a new framework for future GRCs
to “assist the utilities, interested parties and the Commission, in evaluating the
5 See Public Utilities Code § 454. Unless otherwise noted, statutory citations refer to the Public Utilities Code.
6 SCE OB at 20.7 § 451.
- 8 -

A.13-11-003 ALJ/KD1/ar9/jt2/lil PROPOSED DECISION (Rev. 12)
various proposals that the energy utilities use for assessing their safety risks, and
to manage, mitigate, and minimize such risks.”8 Much of the record of this
proceeding was complete before that decision was adopted, so we are not fully
able to use that framework. Nevertheless, we review SCE’s application with an
eye toward balancing cost and risk.
For its part, SCE appears to agree with the need to balance these objectives,
stating that its showing reflects what SCE’s senior executives and Board of
Directors believe “is the right balance between infrastructure investments,
operational requirements, and moderate rate increases to deliver safe and reliable
service.”9 Further, SCE appreciates our “focus on safety and reliability risks” and
“efforts to incorporate a risk based approach into the ratemaking process.”10 SCE
operates under an Enterprise Risk Management framework that helps it to
identify and manage risks; SCE hopes to continue to develop this approach.11
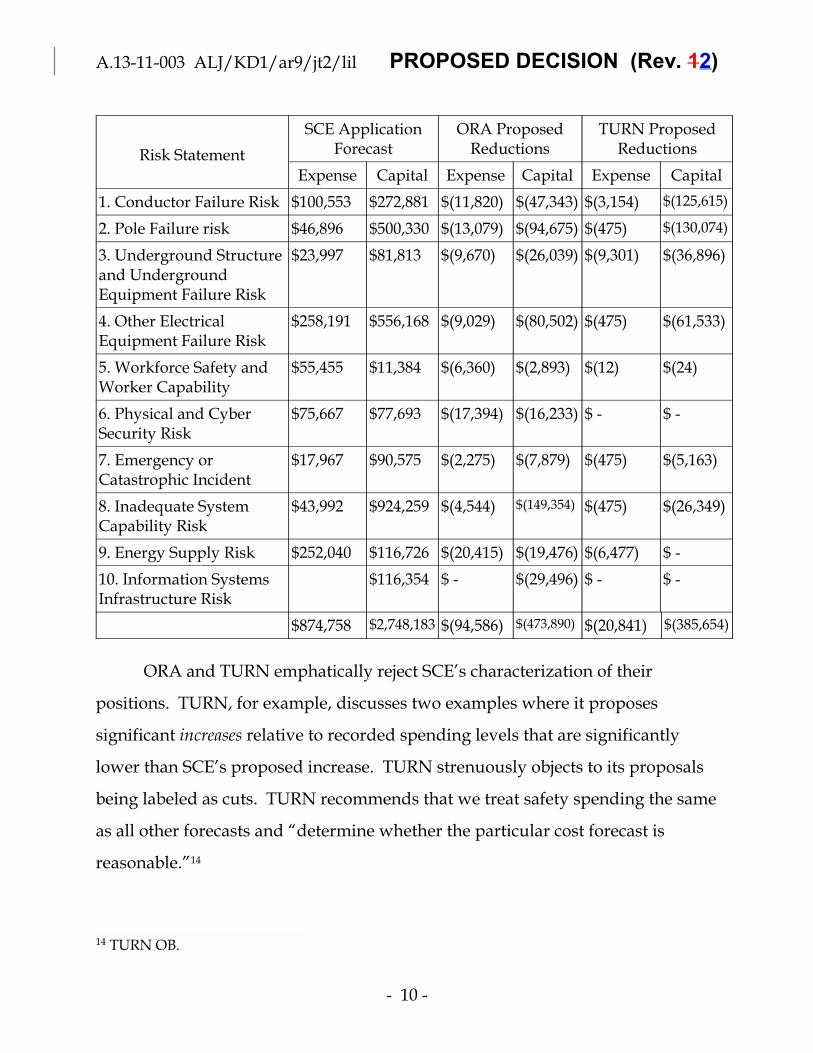
SCE provided an analysis of ten risk statements that serve as organizing
categories for its risk control activities. For each of these risk statements, SCE
describes the potential impacts of a risk event, drivers of the risk, and controls
designed to reduce or manage that risk.12 SCE generally contends that ORA and
TURN propose inappropriately deep cuts to its spending to address these risks.
SCE provides the following table summarizing the parties’ positions ($1,000,
Expense Dollars in $2012, Capital Dollars in nominal$ in 2015).13 Note that this
table reflects the positions of the parties in early stages of the proceeding, not
final positions.
8 D.14-12-025 at 4.9 SCE-17 at 1.10 SCE-15 at 1.11 SCE-1 at 29-30 and SCE-15 at 4.12 SCE-15.13 SCE-17 at 8.
- 9 -
A.13-11-003 ALJ/KD1/ar9/jt2/lil PROPOSED DECISION (Rev. 12)
Risk Statement
SCE ApplicationForecast
ORA ProposedReductions
TURN ProposedReductions
Expense Capital Expense Capital Expense Capital
1. Conductor Failure Risk $100,553 $272,881 $(11,820) $(47,343) $(3,154) $(125,615)
2. Pole Failure risk $46,896 $500,330 $(13,079) $(94,675) $(475) $(130,074)
3. Underground Structureand UndergroundEquipment Failure Risk
$23,997 $81,813 $(9,670) $(26,039) $(9,301) $(36,896)
4. Other ElectricalEquipment Failure Risk
$258,191 $556,168 $(9,029) $(80,502) $(475) $(61,533)
5. Workforce Safety andWorker Capability
$55,455 $11,384 $(6,360) $(2,893) $(12) $(24)
6. Physical and CyberSecurity Risk
$75,667 $77,693 $(17,394) $(16,233) $ - $ -
7. Emergency orCatastrophic Incident
$17,967 $90,575 $(2,275) $(7,879) $(475) $(5,163)
8. Inadequate SystemCapability Risk
$43,992 $924,259 $(4,544) $(149,354) $(475) $(26,349)
9. Energy Supply Risk $252,040 $116,726 $(20,415) $(19,476) $(6,477) $ -
10. Information SystemsInfrastructure Risk
$116,354 $ - $(29,496) $ - $ -
$874,758 $2,748,183 $(94,586) $(473,890) $(20,841) $(385,654)
ORA and TURN emphatically reject SCE’s characterization of their
positions. TURN, for example, discusses two examples where it proposes
significant increases relative to recorded spending levels that are significantly
lower than SCE’s proposed increase. TURN strenuously objects to its proposals
being labeled as cuts. TURN recommends that we treat safety spending the same
as all other forecasts and “determine whether the particular cost forecast is
reasonable.”14
14 TURN OB.
- 10 -

A.13-11-003 ALJ/KD1/ar9/jt2/lil PROPOSED DECISION (Rev. 12)
Notably, the dollar values shown in the table above represent a significant
portion of SCE’s total request. The potential safety and risk consequences of
these investment decisions are very real for customers, employees, and the public
in general. We take our responsibility to review and decide these issues very
seriously.
SED also prepared a response to SED’s exhibit on risk. SED notes that
“risk can never be eliminated, but rather a risk can only be mitigated down to an
acceptable level” and recommends that “[s]electing between the various different
mitigation options should factor in both relative cost and benefits and also the
operator’s knowledge and perspective of that particular part of the system.”15
Generally, SED also concludes that SCE’s risk approach “lacks quantification” of
risk.16 SED comments that “SCE could improve its current risk management
process by having a relative risk ranking model that enables incremental risk
evaluations, since it could help balance affordability and risk reductions.”17 SED
makes the following recommendation for SCE moving forward:
The more that SCE can use data to support its future proposals,the less subjectivity in balancing risk trade-offs will occur. SCEshould continue down the path of developing a robustquantitative approach for both risk ranking and risk mitigation.18
We appreciate SCE’s efforts to analyze risks and make informed,
reasonable investments to reduce risk and to continue to improve its quantitative
approach to risk. Further, we encourage the parties to continue to engage on the
subject of the appropriate balance between affordability and risk reductions
going forward. We appreciate the work that many parties have done to help us
evaluate this balance in this proceeding. This is a complicated question in
15 ALJ-1 at 2.16 ALJ-1 at 8.17 ALJ-1 at 9.18 ALJ-1 at 9.
- 11 -

A.13-11-003 ALJ/KD1/ar9/jt2/lil PROPOSED DECISION (Rev. 12)
general and reasonable people may disagree about the appropriate balance in
any particular context. Like SED, we look forward to having increasingly robust
quantitative information and analysis to inform our choices in the future.
We review the specific issues below seeking to find an appropriate balance
between cost and risk.
Policy5.
Use of 2013 Recorded Spending Data5.1.
One issue that arises numerous times in this proceeding is whether or not
it is appropriate to use 2013 recorded data for forecasting. SCE argues that there
are important adjustments made to recorded data before those data can be
appropriately used for forecasting, and that requiring this across the board is an
undue burden on the utility. SCE cites language from prior decisions in support
of its view, and notes that if GRC schedules (either from past GRC Plans or the
more recent D.14-12-025) were followed strictly, there would be no opportunity
for ORA and intervenors to use 2013 data in their testimony.19 TURN comments
that the goal of reaching an accurate forecast for each specific item outweighs the
disadvantages of using “unadjusted” data in general.20 ORA suggests that the
problem of “unadjusted” data is the result of unnecessary complexity in SCE’s
accounting system, and recommends that SCE be required to provide recorded
adjusted data in the same format as its forecasts.21 Many of the parties accuse
each other of cherry-picking the instances that they recommend using 2013 data
based on the impact on the revenue requirement.
While we do not make any broad statements about this issue as it applies
to other cases, for this decision, we will evaluate the merits of relying on 2013
19 SCE RB at 3-5.20 TURN OB at 2-7.21 ORA OB at 5-6.
- 12 -

A.13-11-003 ALJ/KD1/ar9/jt2/lil PROPOSED DECISION (Rev. 12)
data on a case-by-case basis. This conclusion should not be interpreted as
requiring an across-the-board update of recorded data during a GRC process.
2013 Recorded Capital Expenditures5.2.
SCE agrees to use 2013 recorded capital expenditures in all but two areas
of this case. The exceptions are Palo Verde and Corporate Center, for which no
party disputed SCE’s forecast.22 Other parties generally accept 2013 recorded.
We adopt SCE’s 2013 recorded capital expenditures and the proposed capital
expenditures for the two exceptions, as summarized in Exhibit SCE-77, Appendix
A.
Generation6.
Generation – Power Procurement6.1.
SCE’s forecast of 2015 O&M for power procurement is $39.863 million; no
party disputes this forecast. This forecast is a reduction of $1.33 million relative
to 2012 recorded.23 We find SCE’s forecast of $39.863 million reasonable and
approve it.
SCE requests $1.78 million and $1.85 million in 2014 and 2015,
respectively.24 These capital expenditures are for communications equipment
with generators owned or contracted by SCE, allowing SCE to manage its
generation portfolio.25 ORA notes that 2013 recorded was much lower than
forecast in SCE’s initial testimony, and recommends that 2013 recorded values
should be adjusted for inflation and used for 2014-2015, $1.030 and $1.098
million.26 SCE argues that its forecast, unlike ORA’s, is based on expected
22 SCE-77 at 3. 23 SCE OB at 23.24 Id. at 23-24.25 SCE-02 V4 at 42-43.26 ORA OB at 14.
- 13 -

A.13-11-003 ALJ/KD1/ar9/jt2/lil PROPOSED DECISION (Rev. 12)
numbers of new generators and the geographic locations of those generators.27
We agree and approve SCE’s forecast for 2014-2015.
Generation – Power Production6.2.
ORA describes significant challenges accounting for O&M costs of power
production due to a reorganization of SCE’s Power Production Department
(PPD). ORA recommends that we require SCE “to provide, as part of the five
years of recorded data (in nominal and base year dollars) yearly charges to
expense and capital Sub-FERC Accounts within the [Project Development
Division] PDD lines of business, and yearly charges to expense and capital
Sub-FERC Accounts other than the PDD lines of business.”28 In rebuttal
testimony, SCE noted that this would be burdensome and that ORA has not
stated how this information would be used to forecast future costs. Further, SCE
states that PPD follows company-wide “activity based” accounting practices.29
While we sympathize with ORA’s concern that a staff reorganization complicates
analysis of historical cost data, we find ORA’s request vague and agree with SCE
that activity-based accounts provide appropriate historical data. ORA’s request
is denied. If ORA has specific questions about SCE’s showing in the next GRC, it
should pursue those questions at that time.
Nuclear Generation – Palo Verde6.3.
SCE owns 15.8% of Palo Verde Nuclear Generating Station (PVNGS), a
facility operated by Arizona Public Service (APS). SCE requests $73.8 million in
O&M, based on LRY, and $94.8 million in capital expenditures for 2013-2015.30
27 SCE-18 at 6-7.28 ORA OB at 16-17.29 SCE-18 at 13-14.30 SCE-02 V3 at 1-2, 19.
- 14 -

A.13-11-003 ALJ/KD1/ar9/jt2/lil PROPOSED DECISION (Rev. 12)
TURN proposes disallowing half ($0.123 million) of SCE’s dues to the
Nuclear Energy Institute consistent with recent decisions. SCE does not rebut
this proposal.31 We find this modest adjustment reasonable and it is adopted.
No party otherwise contests these forecasts.
ORA makes four recommendations related to Palo Verde. First, ORA
recommends that the Commission require SCE to present billing data from APS
in a specific format in the next GRC. Such an order is not necessary; ORA can
make discovery requests of this form in the next GRC. Second, ORA requests
that its review of the 2012 Annual Audit Report be allowed to continue in the
next GRC (despite receiving the report before the beginning of hearings in this
case) and that SCE be required to provide the “results of the ‘unresolved’ Palo
Verde audit report dispute” at that time. Again, this issue can be addressed
during discovery in the next GRC, if ORA can demonstrate its relevance to that
proceeding. Third, ORA recommends that SCE provide detailed reports on the
$3.8 million (approved SCE share) Nuclear Administrative and Technical
Manual Replacement project and how SCE ensures that PVNGS capital spending
are spent on projects authorized by this Commission.32 SCE has already
provided testimony showing the completed spending on the Nuclear
Administrative and Technical Manual Replacement project.33 We do not order
any additional showing at this time, but ORA may pursue its normal discovery in
the next GRC.
Generation – Coal Generation (Mohave)6.4.
SCE requests $0.308 million in O&M for the Mohave Generating Station,
ORA accepts this forecast, and no other party disputes it. SCE further requests
31 TURN OB at 11.32 ORA OB at 17-20.33 SCE-02 V3 at 19.
- 15 -

A.13-11-003 ALJ/KD1/ar9/jt2/lil PROPOSED DECISION (Rev. 12)
authority to close the Mohave Balancing Account, and ORA agrees.34 We
approve the forecast and the request to close the Mohave Balancing Account.
Generation – Hydroelectric Generation6.5.
Hydro O&M6.5.1.
SCE’s hydro O&M forecast has two components, a base forecast and an
Operational Excellence (OpX) adjustment (a $0.225 million reduction) for the
Operations account. SCE’s rebuttal forecast is summarized below, with the
amounts shown for FERC Account 539 as net of the OpX adjustment. SCE states
that it used LRY for labor costs because these have been stable over the last three
years and 5YA for non-labor because these costs have fluctuated due to weather
and other factors. SCE’s rebuttal position includes some reductions to FERC 536
made in response to TURN’s recommendations.35
FERC Account Component Forecast Basis Amount ($,millions)
536 - Fees Non-Labor 5-Year Avg. 5.888
539 - Operations Labor LRY 19.108
Non-Labor 5-Year Avg. 12.079
Sub-Total 31.187
545 - Maintenance Labor LRY 9.436
Non-Labor 5-Year Avg. 6.629
Sub-Total 16.065
Grand Total 53.140
ORA proposes that LRY should be used for non-labor expenses in each of
the three FERC Accounts. In support of its recommendation, ORA refers to a
benchmarking study concluding that SCE’s hydro O&M costs were high relative
to other utility hydro systems on a per unit basis. ORA further argues that SCE
was able to reduce O&M costs after implementing recommendations from the
34 SCE-OB at 26, ORA OB at 20.35 SCE-18 at 24-26.
- 16 -
A.13-11-003 ALJ/KD1/ar9/jt2/lil PROPOSED DECISION (Rev. 12)
benchmarking study and that SCE’s 2012 hydro O&M expenses were $12.2
million below authorized. Finally, ORA proposes a larger OpX reduction than
proposed by SCE.36 This larger OpX reduction37 is rejected, as discussed in
Section 25 below.
TURN proposes a number of adjustments. First, TURN suggests that a
six-year average (including 2013, recorded) should be used for Account 536,
excluding dam inspections, with 20% of the most recent dam inspections cost
added back in. Second, TURN recommends excluding the San Gorgonio project
costs from each of the three FERC Accounts because that project is being
decommissioned. Third, TURN proposes forecasting the labor components of
Accounts 539 and 545 based on a two-year average of 2012-2013 recorded, noting
that 2013 is much lower than 2012, after excluding un-forecast, non-recurring
severance costs. In its proposal, TURN has accepted certain technical corrections
pointed out by SCE.38
In response, SCE argues that there is no clear trend in the recorded data,
and that ORA presents an incomplete view of the benchmarking study and
reaches inappropriate conclusions given that no other North American hydro
systems were studied in as much detail as SCE’s. SCE contends that unadjusted
2013 should not be the basis of this forecast, but does not cite any specific
corrections other than those adopted by TURN. Further, SCE argues that, even
though the facility no longer generates electricity, San Gorgonio costs are
contractually required, and should be recovered under cost-of-service
ratemaking principles.39
36 ORA-7 at 15-17.37 ORA-19 at 23-24.38 TURN OB at 12-16, TURN-05 at 10-12, TURN-05A at 10-13.39 SCE-OB at 30-32, SCE-18 at 28-34.
- 17 -

A.13-11-003 ALJ/KD1/ar9/jt2/lil PROPOSED DECISION (Rev. 12)
We agree with SCE that there is no clear trend in recorded data for
non-labor, and that a long term average is appropriate. However, we also agree
with TURN that 2013 recorded data is informative for Account 536 and adopt
TURN’s proposal for that account. For Labor, we agree with SCE that recorded
costs are steady and LRY is appropriate. In order to provide SCE an incentive to
quickly reduce its expenses for San Gorgonio, we will allow only half of SCE’s
San Gorgonio forecast.
FERC Account Component Reduction ($millions) Approved ($millions)
536 - Fees Non-Labor 0.248 5.640
539 - Operations Labor 0.027 19.082
Non-Labor 0.002 12.077
Sub-Total 0.029 31.159
545 - Maintenance Labor 0.012 9.424
Non-Labor 0.003 6.627
Sub-Total 0.015 16.051
Grand Total 0.291 52.849
Hydro Capital6.5.2.
SCE’s rebuttal position on hydro capital includes some adjustments
proposed by ORA. ORA stipulates to SCE’s revised forecast, and no other party
contests the forecast.40 We find reasonable and approve the capital forecast as
follows ($ millions, nominal):
2014 201571.149 90.231
Generation – Gas-Fired Generation6.6.
Mountainview6.6.1.
Mountainview O & M6.6.1.1.
40 SCE-18 at 37-38, ORA OB at 24, ORA-57R.
- 18 -

A.13-11-003 ALJ/KD1/ar9/jt2/lil PROPOSED DECISION (Rev. 12)
After accepting certain reductions and changes proposed by TURN, SCE
requests $48.672 million in O&M.41 TURN has no remaining disputes with SCE’s
forecast.42
SCE’s forecast includes the levelized costs of the 2016 Hot Gas Path
Inspection (HGPI) overhauls on both units; the most recent overhauls were done
in 2013. SCE’s forecast includes two FERC accounts: 549 (operations) and 554
(maintenance). The four components of SCE’s forecast are summarized in the
following table.43
41 SCE OB at 37-38.42 TURN OB at 16.43 SCE-18 at 44-50.
- 19 -

A.13-11-003 ALJ/KD1/ar9/jt2/lil PROPOSED DECISION (Rev. 12)
Component Description Account Forecast Basis Amount ($,millions)
Base Forecast Annual laborand non-labor
549 - Labor LRY 3.790
549 -Non-Labor
LRY 4.419
549 - Other LRY 0.070
554 - Labor LRY 3.718
554 -Non-Labor
2008-2012 average(excluding 2009
overhaul)
8.351
ContractServicesAgreement(CSA) AnnualFees
Annual fees toGE, adjustedfor inflation
554 - Other 2008-2012 average confidential
CSA MajorOutage Fees
CSA feestriggered bymajormaintenance(e.g., HGPI)
554 - Other 2008-2012 average(levelized cost ofHGPI)
confidential
Non-CSA 2016Overhaul CostAdjustment
Other HGPIcosts
554 - LaborandNon-Labor
2009 non-labor costdeviation from2008-2012 average,normalized over2015-2017
1.696
Total 48.672
Of these four components, ORA disputes all except Non-CSA Overhaul
Adjustment.44
ORA proposes a $1.7 million reduction to the Base Forecast, entirely for
non-labor. ORA argues that there has been a consistent trend during 2010-2012
in non-labor O&M (both Accounts 554 and 549), and therefore bases its forecast
on LRY.45 SCE responds that there is no clear trend and that 2012 was a low year
for maintenance for two reasons: fewer breakdowns and less maintenance in
44 ORA OB at 24.45 ORA-7 at 31.
- 20 -

A.13-11-003 ALJ/KD1/ar9/jt2/lil PROPOSED DECISION (Rev. 12)
anticipation of the 2013 overhaul.46 Given the variation in recorded costs and
SCE’s logical explanation for 2012, SCE’s use of historical averaging is
appropriate, and we adopt the SCE forecast.
Within the CSA Annual Fee, ORA argues for a $0.063 million reduction to
the variable fee forecast. There are two major reasons for the difference. First,
ORA proposes averaging 2009-2011 data only, rather than the five years used by
SCE. ORA excludes 2008 because a Power Purchase Agreement (PPA) payment
structure was in place at the time, but does not clearly explain why it proposes to
exclude 2012. Second, ORA proposes using data on Factory Fired Hours (FFH)47
rather than payments that are calculated based on that data, but it is unclear what
the impact of this difference is.48 There is no clear pattern in FFH over the
five-year period, and FFH is not clearly related to the payment structure.49 SCE’s
use of 5YA is appropriate.
For CSA Major Outage fees, ORA recommends using the average of actual
2009-2013 escalation rates, resulting in a $0.334 million reduction.50 ORA’s
proposal to use more recent data is reasonable and is approved.
46 SCE-18 at 53.47 SCE and ORA define the acronym FFH a number of different ways. While the exact proper
terminology is unclear, it is evident that FFH refers to the number of hours the turbines operate.
48 ORA-7 at 32-35; ORA OB at 26-28.49 SCE-18 at 58.50 ORA-7A at 35, SCE-18 at 46.
- 21 -

A.13-11-003 ALJ/KD1/ar9/jt2/lil PROPOSED DECISION (Rev. 12)
In total, we approve $48.338 million as detailed below:
Account Component Requested Approved Disallowed
549 -Operations
Labor 3.79 3.79 0
Non-Labor 4.419 4.419 0
Other 0.07 0.07 0
554 -Maintenance
Labor 3.913 3.913 0
Non-Labor 9.852 9.852 0
Other 26.628 26.294 0.334
Total 48.672 48.338 0.334
Mountainview Capital6.6.1.2.
For Mountainview capital expenditures, SCE and ORA agree to adopt 2013
recorded expenditures of $9.318 million, and SCE’s forecasts of $1.327 million
and $1.131 million for 2014 and 2015 respectively.51 No party opposes these
recommendations; we find them reasonable and approve them.
Peakers6.6.2.
SCE owns and operates five peakers for a total of 245 MWs; four entered
operation in 2007, the fifth (McGrath) began operation in 2012.52
Peakers O&M6.6.2.1.
SCE requests $10.450 million in O&M. SCE’s forecast uses LRY for
operations (FERC Account 549, both labor and non-labor). For maintenance
(FERC Account 554), SCE uses a four-year average for labor and LRY for
non-labor. Due to McGrath only operating for a portion of 2012, SCE includes a
$1.206 million adjustment. SCE accepts TURN’s proposal to move $0.429 million
in added facilities adjustments from non-labor to other within Account 549,
51 SCE-18 at 59, SCE OB at 43, ORA OB at 29, JCE-1 at 40.52 SCE-02 V9.
- 22 -
A.13-11-003 ALJ/KD1/ar9/jt2/lil PROPOSED DECISION (Rev. 12)
which eliminates escalation on these costs for a savings of $0.030 million in
2015$.53
ORA and TURN each propose adjustments, to both the base forecast and
the McGrath adjustment. ORA’s total forecast is $9.711 million and TURN’s is
$9.786 million.
For the base forecast, ORA argues SCE’s method of combining LRY and
four-year averages for labor is inappropriate, and shows that this combination
leads to a higher forecast than either approach applied consistently. ORA
recommends using LRY for Account 554 Labor, and otherwise accepts SCE’s base
forecast, resulting in a total base forecast of $9.074 million.54
TURN’s base forecast uses a two-year average of 2012-2013 for labor and
non-labor in both Accounts 549 and 554. TURN notes that 2013 recorded costs
were lower than SCE’s forecast.55
SCE’s McGrath adjustment was based on a sum of 2012 recorded for all of
the McGrath-specific Final Cost Centers (FCCs), multiplied by three. SCE’s
McGrath adjustment does not include any FCCs shared in common between the
Peakers.56
ORA proposes to take the average direct O&M from the four other
Peakers, and use this average as a McGrath adjustment. ORA notes that SCE’s
testimony does not show that the initial months of O&M are representative for
TY 2015 and that SCE has underspent authorized Peaker O&M for 2010-2012.57
TURN proposes to use 2013 recorded McGrath costs, noting that 2013 costs
(both overall and for McGrath alone) were lower than 2012, recorded. TURN
53 SCE-18 at 60-62, TURN-05 at 21.54 ORA-7 at 39-42.55 TURN-05 at 17-21.56 SCE-18 at 64-65.57 ORA-7 at 42-43.
- 23 -

A.13-11-003 ALJ/KD1/ar9/jt2/lil PROPOSED DECISION (Rev. 12)
further comments that 2013 is likely to be more representative than the last
months of 2012 because of being further removed from construction.58
SCE rejects TURN and ORA proposals. In response to ORA, SCE states
that some 2012 labor costs were recorded as capital due to McGrath construction,
and therefore 2012 should not be used as a sole basis of the base forecast.
Further, SCE notes that McGrath is approximately 50 miles further from the
Peaker headquarters than any of the other peakers, increasing travel and labor
expenses, and that some Peaker common FCCs will be increased by McGrath. In
response to TURN, SCE argues that using recorded-unadjusted 2013 data is
inconsistent with the Rate Case Plan.59 We agree that there is significant variation
FERC 554 (non-labor) and that SCE’s four-year average approach is appropriate.
Similarly, there is low recorded variation in FERC Accounts 549 (labor and
non-labor) and 554 (labor) and LRY is reasonable. For the McGrath adjustment,
we agree with TURN that 2013 is a more appropriate basis than 2012.
Accordingly, we adopt the following forecast ($millions):
Account Component Requested Approved Change
549 - Operations Labor 3.689 3.770 0.081
Non-Labor 2.272 2.066 -0.206
Other 0.429 0.429 0
554 - Maintenance Labor 1.644 1.576 -0.068
Non-Labor 2.416 2.314 -0.102
Total 10.45 10.155 -0.295
Peakers – Capital6.6.2.2.
SCE requests capital expenditures of $2.954 million in 2014 and $3.043
million in 2015. SCE claims that capital improvements that have been largely
completed at the first four peakers will also be beneficial at McGrath, and
58 TURN-05 at 18-21.59 SCE-18 at 63-67.
- 24 -
A.13-11-003 ALJ/KD1/ar9/jt2/lil PROPOSED DECISION (Rev. 12)
requests capital to do these projects there. SCE’s request also includes additional
projects at all of the peakers, including a purchase of three spare transformers
(one of each of the three primary types included at each of the five peakers). The
forecast also includes one assumed turbine overhaul.60
SBUA recommends that we reject SCE’s request for spare transformers
“unless SCE cannot pool shared transformers with other utilities,” notes that it
disfavors use of the Peakers, and that backup transformers are unnecessary
because the Peakers are only used in “exceptional circumstances.”61 SCE rebuts
SBUA’s recommendation noting (among other things): the limited ability to
share transformers among different generators (unlike the Peakers, which share a
common design), long lead times for transformer orders, SCE’s economic benefit
estimate of 1.8, and the logistical difficulties sharing a pool of assets between
utilities.62 We agree with SCE that the reliability benefits of the spare
transformers are sufficient to justify the costs, and that pooling assets between
the utilities is not practical in this instance.
We approve and find reasonable SCE’s capital expenditures of $2.954
million in 2014 and $3.043 million in 2015 for the Peakers.
Generation – Other6.7.
Solar Photovoltaic Program (SPVP)6.7.1.(FERC 549 and 550)
SCE requests $4.290 million ($2012) of O&M for 2015 for the SPVP. SCE
also seeks a reasonableness review of recorded O&M for 2008-2012 totaling
$25.960 million (nominal) and capital expenditures from program inception
through 2013.
60 SCE-18 at 66-71 and SCE-02 V9 at 20.61 SBUA-1 at 17.62 SCE-18 at 69-70.
- 25 -

A.13-11-003 ALJ/KD1/ar9/jt2/lil PROPOSED DECISION (Rev. 12)
SCE’s TY 2015 O&M forecast consists of $2.206 million for labor and
non-labor, in addition to $2.084 million for rooftop lease expenses.63 ORA accepts
the lease expenses, but recommends $1.277 million for labor and non-labor.
ORA’s recommendation is based on its attempt to exclude construction costs
from the O&M forecast, based on analysis of a specific contract.64 SCE argues
that ORA’s approach does not account for O&M performed by SCE personnel.65
SCE, however, does not directly show how construction costs are excluded from
its O&M forecast. TURN proposed reducing SCE’s added facilities costs and
making these costs not subject to escalation.66 SCE partially accepts TURN’s
proposal, but shows that two additional facilities were added that were left out of
TURN’s forecast.67 Accordingly, we adopt ORA’s forecast of $1.277 million for
labor and non-labor, SCE’s revised forecast of $0.142 million in other or added
facilities costs, and SCE’s forecast of $2.084 million for leases for a total of $3.503
million, as shown below. Added facilities costs are not subject to escalation.
FERC Account SCE Request Adopted
($, millions)
Labor 549 0.555 0.320
Non-Labor 549 1.509 0.957
Other 549 0.142 0.142
Leases 550 2.084 2.084
Total 4.290 3.503
SCE’s 2008-2012 O&M expenses are subject to reasonableness review in
this GRC. ORA argues that SCE has exceeded the $15.036 million (2008$)
reasonable cost estimate adopted in D.13-05-033 and specifically contests a $10.1
63 SCE-18 at 72.64 ORA OB at 34-37.65 SCE OB at 48-50.66 TURN-5A at 22.67 SCE-18 at 77-78.
- 26 -

A.13-11-003 ALJ/KD1/ar9/jt2/lil PROPOSED DECISION (Rev. 12)
million ($9,672,063 in 2008$) termination payment to SunPower on the grounds
that the contract was imprudent at the time of signing. ORA argues that, when
SCE signed the SunPower contract in 2010, prices were declining, and it was
imprudent to purchase a large volume at a fixed price given “possible barriers”
to building large amounts of utility owned generation.68 SCE criticizes ORA’s
analysis as being based on perfect hindsight. SCE argues that the contract was
prudent at the time of signing, pointing primarily to the volume discount
structure as evidence, and claiming that without the termination fee, the unit
price would have been higher.69 SCE quantifies the benefits of termination at the
time of termination as $203.7 million and contends that this is the appropriate
time of analysis.70 However, SCE’s testimony does not quantify the benefits at
time of signing, and therefore does not establish that the contract, including the
termination fee, was prudent. We agree with ORA, and accordingly disallow the
termination payment. To be clear, we are not concluding that contracts
structured in this way are generally imprudent, merely that SCE has not met its
burden of proof in this instance. SCE’s other recorded O&M costs for 2008-2012
are approved.
SCE’s capital expenditure request of $0.425 million for 2014 and $1.035
million for 2015 is uncontested.71 This request is reasonable and is approved.
SCE requests authority to eliminate the Solar Photovoltaic Program
Balancing Account (SPVPBA). ORA agrees.72 We approve this request, noting
that the balance of the SPVPBA must be adjusted for the disallowed SunPower
termination payment discussed above.
68 ORA-7 at 52-54 and ORA OB at 39-41.69 SCE-18 at 80, SCE OB at 52, and SCE RB at 20-21.70 SCE Comments at 1-2. 71 SCE-18 at 79, ORA OB at 37.72 ORA-7 at 48.
- 27 -
A.13-11-003 ALJ/KD1/ar9/jt2/lil PROPOSED DECISION (Rev. 12)
Catalina (FERC 549.140)6.7.2.
ORA and SCE agree to TURN’s proposed average of several years of
recorded costs, excluding one-time expenses, to calculate an O&M forecast of
$4.360 million.73 TURN’s approach is consistent with our forecasting guidelines,
and we approve this forecast.
For capital expenditures, SCE and ORA agree to TURN’s alternative
recommendation, except for Allowance for Funds Used During Construction
(AFUDC) and capitalized taxes. As agreed by SCE and ORA, this forecast is:
$1.255 million in 2014 and $2.509 million in 2015.74 TURN’s primary
recommendation is that cost recovery be limited to $5.1 million.75 In support of
this recommendation, TURN notes that the Pebbly Beach Generating Station
Generation Automation Project (PB Project) was originally a $2 million project in
the 2009 GRC, has doubled in cost since being approved in the 2012 GRC, serves
fewer than 2,500 customers, that completion has been delayed at least into 2015,
and that the project benefits have shifted over time and now do not include
monetary benefits.76 In summary, TURN argues that SCE has not demonstrated
that the project should be funded beyond the $4.6 million approved in the 2012
GRC and proposes that only $5.1 million (costs through 2013) should be
approved, using an assumed online date of July 2015. This recommendation
includes disallowance of AFUDC and capitalized property taxes. TURN cites
examples from other jurisdictions in support of the AFUDC and tax proposal,
and argues that SCE’s mistake in project management led to the delay and
resulting costs.77 SCE’s responses to TURN’s concerns are: that there were
73 SCE-18 at 89-90, ORA-57R at 3, and TURN OB at 22-23.74 JCE-V3A at 77.75 SCE-18 at 90-92, ORA-57R at 3, and TURN OB at 23-24.76 TURN-5 at 25-28.77 TURN OB at 26-31.
- 28 -

A.13-11-003 ALJ/KD1/ar9/jt2/lil PROPOSED DECISION (Rev. 12)
“valid” reasons including GRC delays, project sequencing, and other emergent
priorities; recovery of AFUDC is appropriate; TURN’s AFUDC references are
inapplicable; property tax is based in part on CWIP; and recovery of capitalized
property tax is appropriate.78 We largely agree with TURN – even though some
of the reasons for the delay were outside SCE’s control, some were not and SCE
has not justified the PB Project at this level of expense. However, because some
of the reasons for delay during 2012 were beyond SCE’s control, we allow a
larger portion of the AFUDC and capitalized taxes. As shown in the table below,
in addition to the $5.1 million in direct capital expenditures proposed by TURN
through 2013, we also allow the various capital loadings for the PB Project, but
only through the end of 2013; these loadings are automatically calculated by the
RO computer model.
Capital Expenditures - Direct Costs (Millions of $)79
Through 2013 * 2014 2015 2016 2017
SCE Request $5.127 $1.255 $2.509 $0.310 $0.060
Adopted ** $5.127 $0.000 $0.000 $0.000 $0.000
Difference $0.000 $1.255 $2.509 $0.310 $0.060
* Direct expenditures through 12/2013 were obtained from TURN-6 at pages39-40.
** Loadings (AFUDC, Capitalized Property Taxes, etc.) are not shown. They willbe calculated by the RO model and are only allowed through the end of 2013.
Fuel Cells (FERC 549)6.7.3.
SCE requests $0.669 million in O&M for its fuel cells on various university
campuses.80 ORA proposes two reductions: one based on a different assumption
about fuel cell availability ($0.086 million), and reducing labor by one half of an
78 SCE OB at 54-58.79 JCE-V3A at 77.80 SCE-18 at 85.
- 29 -

A.13-11-003 ALJ/KD1/ar9/jt2/lil PROPOSED DECISION (Rev. 12)
Full-Time Equivalent (FTE) ($0.057 million) on the grounds that SCE’s
justification for the FTE is inadequate.81 TURN argues for a reduction of one
third of an FTE arguing that we previously approved one FTE on the basis of
three fuel cells, but now there are only two.82 We agree with TURN that two
thirds of an FTE is adequate given the reduced scope and reduce SCE’s labor
forecast by $0.037 million. For the non-labor costs, based on confidential
historical availability data,83 we conclude that a reduction of $0.043 million is
appropriate. Our approved O&M forecast is, in millions:
SCE Request Approved
Labor $ 0.113 $ 0.076
Non-Labor $ 0.556 $ 0.513
Total $ 0.669 $ 0.589
SCE requests authority to eliminate the Fuel Cell Program Memorandum
Account (FCPMA).84 ORA agrees.85 No party disputes this request, and we
authorize SCE to eliminate FCPMA.
SCE’s capital expenditures for the fuel cell program are addressed in
ERRA; no capital expenditures are approved here.
Transmission and Distribution (T&D)7.
SCE states that its “Transmission and Distribution Business Unit (T&D) is
responsible for planning, engineering, constructing, operating, and maintaining
the transmission and distribution facilities required to safely and reliably deliver
electricity to SCE’s five million customers throughout [SCE’s] 50,000 square-miles
of service territory.”86 At the end of 2012, T&D infrastructure included over
81 ORA OB at 42-44, SCE-18C at 86.82 TURN OB at 31-32 citing D.10-04-028.83 SCE-18C at 87.84 SCE-2 V10 at 28.85 ORA OB at 42.86 SCE-3 V1 at 1.
- 30 -

A.13-11-003 ALJ/KD1/ar9/jt2/lil PROPOSED DECISION (Rev. 12)
90,000 miles of distribution lines, over 1.4 million poles, and over 400,000
underground structures. T&D is SCE’s largest operating unit, including “almost
8,600” people. SCE’s transmission costs are largely recovered through rates set
by FERC.87
ORA suggests that many of the issues in this area are matters of
judgement, namely what is the appropriate balance between reliability and costs.
ORA claims that 2015 shows dramatic funding increases, and that new capital
categories are created in 2014-2015; ORA questions the urgency of these
increases. Similarly, ORA questions SCE’s claims that aging infrastructure needs
replacement, and suggests that aging infrastructure does not necessarily mean
that reliability is compromised.88
We note that this is not the only proceeding dealing with SCE’s T&D
infrastructure. For example, both the Distributed Resource Plan (Rulemaking
(R.) 14-08-013) and Interconnection (R.11-09-011) proceedings are evaluating
changes in the way that this infrastructure should be planned, paid for, and
managed. SCE, the Commission, and the industry are continually transitioning
to newer technologies and approaches to these challenges. We encourage SCE to
use the funds authorized in this decision to adopt improved technologies and
approaches to the extent practicable.
T&D – Policy7.1.
SCE states that T&D is guided by “three areas of focus – safety, reliability,
and affordability” and “cornerstone values of compliance and operational
excellence.”89
87 SCE-3 V1 at 1.88 ORA OB at 45-46.89 SCE-3V1 at 3.
- 31 -

A.13-11-003 ALJ/KD1/ar9/jt2/lil PROPOSED DECISION (Rev. 12)
Safety and Reliability Investment7.1.1.Incentive Mechanism (SRIIM)
In the last several GRC’s, we have adopted some form of Reliability
Investment Incentive Mechanism (RIIM) to require SCE to spend certain funds on
reliability as authorized, or make refunds to ratepayers. RIIM includes two
components: capital spending and staffing. In the capital spending component,
there are two categories: Reliability Investment (which we refer to as “core”) and
High Priority, with the spending target for Reliability Investment adjusted based
on spending in High Priority. In the 2012 GRC, we adopted a CUE-SCE
settlement related to RIIM and directed SCE to consult with other parties about
the feasibility of addressing safety issues in RIIM or a similar program in this
GRC. We also ordered SCE to hire an outside auditor to report on RIIM.90
In this proceeding, SCE proposes to continue a modified RIIM. SCE
proposes seven categories of capital investment in safety or reliability areas to be
core RIIM-eligible; the combined authorized forecast for these categories would
be the RIIM capital target. The seven categories are: Worst Circuit Rehabilitation
(WCR), Underground Cable Life, Cable-in-Conduit (CIC) Replacement,
Underground Switch, Underground Structure Replacement, Circuit Breaker
Replacements, and Substation Transformer Replacement. Further, SCE proposes
three categories of High Priority capital expenditures that are influenced strongly
by external factors: customer growth, storms, and claims. Expenditures in the
combined High Priority areas would be summed and the difference relative to
authorized spending in these high priority areas would be added (or subtracted)
to the core RIIM capital target. For example, if the amount spent on the High
Priority areas is above authorized, the core RIIM capital target would decrease.
For the staffing target, SCE identifies several workforce categories and proposes a
90 D.12-11-051 at 692-701.
- 32 -

A.13-11-003 ALJ/KD1/ar9/jt2/lil PROPOSED DECISION (Rev. 12)
target number of employees approximately equal to the headcount at the end of
2012. SCE would refund $20,000 for each employee shortfall relative to the
target, up to 50 employees short, and $80,000 per employee thereafter. SCE
proposes that, if any employee shortfall that develops in the fourth quarter of
2017, it should have the first quarter of 2018 to address the shortfall.91 SCE
initially requested a reduction in the headcount target by one-fifth of any
percentage reduction in training amounts, but has withdrawn this proposal.92
ORA discusses concerns that 2013 staffing are below the target level
adopted in the last GRC and that no ratepayer refund associated with this
shortfall is apparent in SCE’s application. ORA recommends that we order SCE
to make refunds associated with this shortfall, in the absence of further
documentation from SCE. ORA also appears to oppose any staffing level target
being included in RIIM in this GRC.93
SCE responds that ORA misunderstands the goal of RIIM’s staffing targets
and that it hopes to meet the staffing target by 2014. If it fails to meet the target,
SCE states it will make appropriate refunds.94 We note that in SCE’s Advice
Letter 3191-E, SCE claims to have met the staffing target.
TURN and CUE present a joint statement on the capital spending
component. They propose a one-way balancing account so that underspending
on High Priority categories should be added to the core capital spending target,
but not in the reverse. For example, if SCE spends more on the High Priority
categories than authorized, it would still be subject to the capital spending target
for the core RIIM categories, without an adjustment. In effect, SCE would need
to look to other funding sources, not the RIIM categories, to fund the additional
91 SCE-3V1 at 23-28.92 SCE RB at 30-31.93 ORA-9 at 62-66; ORA OB at 52-53.94 SCE-19V1 at 11-12.
- 33 -
A.13-11-003 ALJ/KD1/ar9/jt2/lil PROPOSED DECISION (Rev. 12)
High Priority work. TURN and CUE argue that SCE should not be able to divert
funding away from the core RIIM categories. TURN also initially proposed (and
still supports) an alternative – eliminating the capital spending component
altogether; CUE opposes this alternative. CUE further recommends we preclude
SCE from diverting any pole replacement money to the High Priority
categories.95
SCE argues that this proposed one-way balancing account treatment
should be rejected. Generally, SCE argues that High Priority work cannot be
delayed to meet core RIIM targets and that shareholders should not be required
to fund these functions. Further, SCE claims that a limiting factor in doing this
work is that the same employees perform the work in both the core RIIM
categories and the High Priority categories; therefore, if extra High Priority work
is required, less core RIIM work can be completed.96
In our review of RIIM, we first note that the relationship between safety,
reliability, and resiliency is complex. As SED observes, sometimes an investment
in one category may serve to reduce risk in another. In other instances, there is
an inverse relationship between safety and reliability: a choice (e.g., a setting on
a circuit breaker) may be “good” for safety but “bad” for reliability, or vice
versa.97 Our goal is to promote safety, reliability, and resiliency in the most
cost-effective manner. A tool like RIIM is very blunt, and indeed, this is
appropriate for our goal. In this proceeding, we cannot and do not seek to
fine-tune SCE’s approach to managing risk. Instead, we seek to create incentives
that align SCE’s financial interests with the community’s interests in safety,
reliability, resiliency, and cost. Encouraging SCE to spend its authorized capital
95 Attachment to TURN OB at 3; Attachment to CUE OB; CUE OB at 7-9.96 SCE-19V1 at 13; SCE OB at 67. 97 ALJ-1.
- 34 -
A.13-11-003 ALJ/KD1/ar9/jt2/lil PROPOSED DECISION (Rev. 12)
forecast on key programs to meet this goal and retain employees in classifications
responsible for this work is reasonable. Therefore, it is reasonable to adopt some
type of RIIM-mechanism. In order to reflect the increased direct focus on safety,
RIIM should be renamed the SRIIM. Even though this proceeding did not
precisely follow the framework of D.14-12-025, this is consistent with the goals of
that decision.
No party disputes that the categories that SCE proposes for the RIIM
capital target, High Priority categories, or staffing target are inappropriate. We
find that the proposed categories are reasonable and appropriate to meet our
goal. Similarly, SCE’s proposed High Priority categories (customer growth,
storms, and claims) are unopposed and are reasonable. Further, SCE’s staffing
target proposal (2,225 employees in the categories identified at SCE-3V1 at 27) is
essentially unopposed.98 We find it reasonable and adopt it.
For the capital spending component, we find that SCE’s proposed method
is reasonable with modification. Like TURN and CUE, we find that it is
suboptimal to divert funding from core SRIIM categories to the High Priority
categories, potentially delaying important work. Like TURN,99 we mostly
discount SCE’s argument that because the same staff performs both the High
Priority and core SRIIM categories, SCE cannot necessarily meet both goals at
once. While this may be true in some cases, SCE’s recorded spending in
2009-2011100 suggests that this is not always a limiting factor. Moreover, given
the limited set of core RIIM categories, SCE should have more flexibility to meet
both goals now than in the past. However, SCE’s response that it is unreasonable
98 ORA expresses concerns about whether or not SCE met past staffing targets; past targets are a separate issue that we need not resolve here. ORA does not present a clear counter-proposal or opposition to SCE’s proposed forward-looking target.
99 TURN OB at 35.100 SCE-19V1 at 13.
- 35 -

A.13-11-003 ALJ/KD1/ar9/jt2/lil PROPOSED DECISION (Rev. 12)
to ask shareholders to fund core utility work has merit. Therefore, we adopt the
TURN/CUE proposal with the following modifications. Overspending in the
High Priority categories can offset underspending in the core SRIIM categories if
two conditions are true: the overspending in High Priority categories exceeds
10% of the adopted forecast for those categories and SCE’s actual rate of return
on rate base for the period does not exceed the authorized rate of return. The
first 10% of overspending on High Priority categories cannot be used to offset
underspending in the core SRIIM categories under any circumstance. These
modifications are designed to ensure that SCE will look to other sources of
funding before reducing core SRIIM spending in the event of overspending on
the High Priority categories. In the event that High Priority spending
significantly exceeds the adopted forecast, SCE has some protection.
T&D – Engineering and Grid Technology7.2.
T&D’s Engineering Department performs technical analyses related to load
growth and grid changes; designs electrical, civil engineering, and structural
components of projects; and manages efforts to evaluate and implement grid
technologies.101
Centralized Remedial Action Scheme (CRAS)7.2.1.
SCE states that it must plan for power flows on its transmission system,
both under normal and emergency/unusual conditions in order to avoid
damaging equipment or outages. To address this need for new generator
interconnections, SCE can build redundant transmission or Remedial Action
Schemes (RAS). RAS can shed generation and/or load to handle a contingency
by reducing power flows.102
101 SCE-3V2 at Summary.102 SCE-3V2 at 11-12.
- 36 -

A.13-11-003 ALJ/KD1/ar9/jt2/lil PROPOSED DECISION (Rev. 12)
SCE argues that, due to numerous, geographically clustered
interconnections of intermittent generators, complexity of system protection has
increased significantly. SCE states that it has initiated Centralized RAS (CRAS)
“to address these issues and the limitations of stand-alone RAS.”103 SCE suggests
that a key benefit of CRAS over RAS is that the logic control is centralized and
approximately 27% fewer relays are needed.104 Further, CRAS allows for a more
“carefully limited solution” to contingencies than RAS by using more arming
points to treat generation customers individually rather than in groups and being
adaptable over time.105
We approved $58.1 million (CPUC jurisdictional portion) in SCE’s 2009
GRC, which SCE largely delayed spending. In the 2012 GRC, we only approved
SCE’s 2010 capital spending and the balance of its 2010 forecast, a total of less
than $7 million, directing SCE to perform more analysis on the viability of using
existing RAS technology.106
For CRAS, SCE’s test year O&M request is $0.043 million.107 SCE’s total
capital expenditure request is (total company nominal, $000s) is shown below.108
2014 2015 2016 2017
$10,326 $11,299 $23,031 $34,825
ORA recommends a one-way balancing account for CRAS so that in the
future, costs may be evaluated more accurately and that SCE should be required
to identify labor and non-labor costs for relays and telecommunications.109
103 Id. at 12.104 Id. at 15.105 Id. at 18-19.106 D.12-11-051 at 124-127.107 JCE-3 at 101.108 SCE-3 V2 A at 11, JCE-3 at 102-103.109 ORA-10 at 23 and ORA OB at 57.
- 37 -

A.13-11-003 ALJ/KD1/ar9/jt2/lil PROPOSED DECISION (Rev. 12)
TURN objects to SCE’s request, arguing that SCE has not shown the
benefits of CRAS exceed costs and has not shown that stand-alone RAS is not
viable.110 More specifically, TURN asserts that CRAS’s benefit of reducing
generation curtailment is not quantified and “are largely illusory and benefit the
generation owners.”111 TURN estimates that the renewable energy lost to
RAS-related curtailment is much lower than that lost to economic curtailment,
and suggests that this makes the benefit of CRAS “even more fleeting.”112 In the
only load curtailment event related to RAS since 2000, the impact on load was
short in duration and would have also occurred if CRAS was in place at the
time.113 TURN claims that the incremental costs of CRAS over additional RAS are
significant.114
TURN recommends reducing SCE’s O&M request by $43,000 and denying
all of SCE’s requested capital expenditures.115
TURN’s argument that the benefits of CRAS are not quantified is
compelling; indeed, we would like to see more concrete cost-benefit analysis than
SCE has provided here. However, the intuitive appeal of the CRAS benefits that
SCE describe are strong and the outcome of any effort to quantify them at this
time may be primarily driven by preliminary assumptions (number of
interconnections, policies on economic curtailment, etc.). As a matter of policy,
this Commission supports a future with renewable generation resources
operating efficiently on the grid and seeks opportunities to improve grid
operations with respect to such resources. CRAS appears to be such an
110 TURN OB at 37-38.111 Id. at 40.112 TURN OB at 46; TURN-80B; and TURN-85.113 TURN-35.114 TURN OB at 46-48.115 TURN-3 at 14 and JCE V2 at 607 and 692-693.
- 38 -

A.13-11-003 ALJ/KD1/ar9/jt2/lil PROPOSED DECISION (Rev. 12)
opportunity, and may be cost effective in some scenarios; accordingly, we adopt
a partial funding compromise.
SCE’s recorded capital expenditures for 2013 are approved; capital
expenditures for later years and O&M are denied. SCE may reapply for the
denied capital expenditures in its next GRC, if it provides a detailed cost-benefit
analysis in support of that request.
Engineering and Grid Technology O&M7.2.2.
SCE requests $51.223 million in O&M for Engineering and Grid
Technology. ORA agrees with this forecast.116 As detailed in ORA’s brief, both
ORA and SCE made concessions on various components of this forecast.117
This forecast is summarized in the following table:
FERCAccount(s) Subject Activities Forecast Basis
560.220
GeneratorInterconnectionContractDevelopment Manage interconnection process 2012 recorded
560.220Transmission LineRating Study
Study and verification processto comply with G.O. 95 andNorth American ElectricReliability Corporation (NERC)recommendations
Cost per verificationtimes spans to bestudied, plus remainingcosts of LiDAR contract
560.220TransmissionPlanning
Identify system modifications;participate in setting standards
2012 recorded plus twopositions
560.220 &588.220
Fiber OpticNetwork
Maintenance and inspection ofcommunications network
2012/2013 recordedplus incrementalinspection costs toimplement new ruleson fire hazards
560.220 &588.220 Grid Engineering
Root cause analysis; engineeringstudies; updating standards;assisting field personnel;designing systems and controls. 2012/2013 recorded
560.221 ReliabilityStandards
Manage regulatory compliance;respond to information requests;
2012 recorded plus twopositions
116 ORA-57R.117 ORA OB at 53-55.
- 39 -

A.13-11-003 ALJ/KD1/ar9/jt2/lil PROPOSED DECISION (Rev. 12)
Compliance develop policyrecommendations
560.260 &580.260
Grid TechnologyIntegration
Technology studies; supportingdevelopment of industrystandards; managingdemonstration projects 2013 expenses
560.260 &580.260
IT Chargebacks –Transmission
Laptops, phones, etc. for T&Dpersonnel 2012 recorded
588.220 Load Side Support
Diagnose customer problemsrelated to power quality, andcollaborate on solutions
Labor: 2012 recorded,plus two additionalemployees; Non-Labor:three-year average
588.260
OperationalProcessEngineering
Expenses related to capital andnon-capital projects and fieldequipment 2012 recorded
588.261
ConsolidatedMobile SolutionsBenefits
920.220 Real Properties Acquire and manage land rights 2012 recorded
Note that TURN proposes a $9,000 disallowance for Grid Technology
Integration and Miscellaneous. This is discussed below in Section 28.1. We
reduce the forecast for FERC Account 588.260 by $165,000118 of $1.866 million to
account for the reductions in capital expenditures discussed in Section 7.2.3
below. All other components ($51.058 million) of this forecast for O&M are
reasonable and are approved.
Engineering and Grid Technology Capital7.2.3.
SCE requests $192.397 million (total company, nominal$) in capital
expenditures between 2013 and 2017, of which over $52 million is related to the
CRAS project discussed in section 7.2.1 above. This request is summarized
below.119
118 Calculated by multiplying the ratio of allowed to requested capital expenditures by the requested O&M.
119 SCE-19 V2 at 10.
- 40 -

A.13-11-003 ALJ/KD1/ar9/jt2/lil PROPOSED DECISION (Rev. 12)
SCE Capital Request - Engineering and Grid Technology(Nominal $000)
2014 2015
Fiber-Optic Network Maintenance $ 2,759 $ 2,822
EVTC Laboratory Expansion Project $ 1,458 $ 1,494
Large Energy Storage Test Apparatus $ 852 $ 206
Distributed Energy Storage Integration(DESI) $ 576 $ 4,388
Westminster Labs Upgrades $ 3,515 $ 4,023
Equipment Demonstration andEvaluation Facility $ 3,274 $ 4,365
Wide Area Voltage/VAR ControlSystem $ 800 $ 529
Geographical Information System $ 16,489 -
CRAS Project Phase $ 9,772 -
CRAS Program Phase $ 554 $ 11,300
Phasor/WASAS - -
DFR/PMU Infrastructure Replacement $ 5,872 $ 6,542
Phasor Advanced Data Analytics $ 1,200 $ 7,700
Benefits $ (1,874) $ (5,313)
Total Capital $ 4 5,248 $ 38,057
With the exception of CRAS, no party opposed this request. Nevertheless,
we briefly discuss each item that is greater than $1 million in 2015.
Fiber Optic Network Maintenance7.2.4.
This work includes replacing capital equipment such as fiber optic cables
and microwave systems. The forecast is based on last recorded year.120
Electric Vehicle Technical Center (EVTC) Laboratory7.2.5.Expansion Project
SCE states that its needs for testing vehicles and stationary batteries have
outgrown the existing center. This request would add dynamometer capability
for heavy duty vehicles and additional equipment and facilities. The forecast is
120 SCE-3 V2 at 34.
- 41 -

A.13-11-003 ALJ/KD1/ar9/jt2/lil PROPOSED DECISION (Rev. 12)
based on specific capital additions each year, and totals $7.696 million from 2013
to 2017.121
Distributed Energy Storage Integration (DESI)7.2.6.
These pilot deployments of three storage systems up to 2.0 MW and
capable of discharging for up to 2 hours are intended to help SCE develop
deployment plans for energy storage. Additionally, SCE plans to procure two
smaller (25 kilowatt (kW)) storage systems. SCE will test the systems for benefits
including feeder load relief and voltage support. The total capital cost of this
project is $13.409 million from 2013 to 2017.122
Westminster Labs Upgrades7.2.7.
SCE claims its labs enable it to evaluate and demonstrate new technologies,
in support of SCE’s Smart Grid Strategy and Deployment Plan. SCE requests to
upgrade its laboratory capabilities. SCE claims that there are “scant” options for
third parties to provide the laboratory services that SCE seeks and that testing
“SCE device interoperability” can only be done cost effectively in SCE labs.
There are four upgrades SCE seeks:
Enhanced real time simulation of protection and controlequipment by adding processing power. This addition wouldallow SCE to do Western Electricity Coordinating Council(WECC) wide simulations and run multiple testssimultaneously for programs such as CRAS. SCE claims thatincreased use of such simulations could save $150,000 pertransmission line study.
Substation automation simulations, in order to achievebenefits of newer network technologies within substationsautomated with older technology.
Communications including cybersecurity, in order to developsolutions for NERC Critical Infrastructure Protection (CIP)
121 Id. at 51-52.122 Id. at 55-57.
- 42 -

A.13-11-003 ALJ/KD1/ar9/jt2/lil PROPOSED DECISION (Rev. 12)
standards. This upgrade will also provide support for otherlabs and test communications equipment for CRAS and otherapplications.
And other miscellaneous upgrades, including replacing olderequipment.
SCE’s total forecast is $13.5 million.123
Equipment Demonstration and7.2.8.Evaluation Facility (EDEF)
SCE proposes a new EDEF to test equipment in a “real SCE grid
environment” that is not an active customer circuit. SCE claims that this will
allow SCE to conduct energized tests of emerging technologies that would be too
disruptive on customer circuits. Testing capabilities would include: high
impedance faults, construction and installation methods, and distribution
substation automation. SCE expects EDEF to reduce implementation timelines
and costs due to more efficient pre-pilot processes.124
Phasor Program7.2.9.
SCE has a contractual commitment to WECC to complete the Phasor
Program, which includes three of the projects in this request. We discuss the
three (Phasor System, Digital Fault Recorded/Phasor Measurement Unit
[DFR/PMU] Infrastructure Replacement, and Phasor Advanced Data Analytics)
in combination. The objective of this project is to provide WECC and California
Independent System Operator (CAISO) information on the bulk power system
that may reduce wide-scale outages. SCE forecasts completion of the Phasor
System, a software and data collection project, in 2013. The DFR/PMU project
replaces obsolete DFRs and PMUs that were installed in the 1980s through 2000s
with new DFR/PMUs. SCE intends to upgrade four substations per year and
123 Id. at 57-67.124 Id. at 67-71.
- 43 -

A.13-11-003 ALJ/KD1/ar9/jt2/lil PROPOSED DECISION (Rev. 12)
add or replace 17 DFR/PMUs from 2013 to 2017. The Advanced Phasor Data
Analytics program will increase SCE’s ability to use the data collected by PMUs
and support increased variable generation. The two primary benefits of this data
are reduced outages and improved transmission line usage. Cost estimates are
based on forecast activities and vendor information.
Engineering and Grid Technology Capital7.2.9.1.Discussion
We disallow a portion of this request. SCE has not shown that portions of
the Westminster Lab Upgrades related to WECC-wide simulations and
developing devices compliant with NERC CIP are SCE specific problems that
should be funded by ratepayers. Further, portions of the Westminster upgrades
are related to CRAS, which we have also partially disallowed. Therefore, we
reduce the Westminster Upgrades request by half for each year. Similarly, we
disallow all EDEF expenditures because SCE has not shown that the technical
problems it would address are unique to SCE and that other more cost-effective
options do not exist for doing this research. All other capital expenditure
requests for Engineering and Grid Technology are approved.
2014 2015
Total Capital Request $45,248 $38,057
Disallowances
Westminster Labs Upgrades $1,757.50 $2,011.50
Equipment Demonstration and Evaluation Facility $3,274 $4,365.00
Total Capital Disallowances $5,032 $6,377
Total Capital Allowed $40,217 $31,681
T&D – Electric System Planning7.3.
SCE performs system planning capital projects to accommodate load
growth, maintain reliability, accommodate generator interconnections, and
- 44 -

A.13-11-003 ALJ/KD1/ar9/jt2/lil PROPOSED DECISION (Rev. 12)
respond to customer requests for non-standard service. SCE divides these
projects into five categories:
Transmission Planning Projects are large scale transmission1.upgrades, including four sub-categories: grid reliability,transmission system generator interconnection, othertransmission planning projects with CPUC costs over $1 million,and other transmission planning projects with CPUC costs lessthan $1 million.
The Load Growth Planning Program increases system capacity2.through projects at a variety of scales. Sub-categories are:A-bank plan, subtransmission lines plan, subtransmissionvolt-ampere reactive (VAR) plan, and Distribution SubstationPlan (DSP).
The System Improvement/Reinforcement Program includes3.smaller projects upgrading substation equipment and thedistribution system to handle load growth.
The Generator Interconnection Program includes projects to4.interconnect generators, who chose to have SCE do this work.
Added Facilities projects provide non-standard service to5.customers based on their requests. Projects may be partlycustomer-funded and partly ratepayer-funded.125
SCE’s forecast126 for these categories is described below (millions of
nominal$), along with a summary of the approved forecast.
SCE Request Adopted
2014 2015 2014 2015
Transmission & InterconnectionPlanning Projects 580.662 214.934 580.662 214.934
Load Growth Planning Programs 371.272 412.991 371.272 412.991
System Improvement /Reinforcement Programs 114.432 108.903 111.861 106.137
Generator Interconnection Program 11.993 11.617 11.993 11.617
Added Facilities Projects 32.466 24.290 32.466 24.290125 SCE-3V3 at 1-2.126 SCE-19V3A at 2.
- 45 -

A.13-11-003 ALJ/KD1/ar9/jt2/lil PROPOSED DECISION (Rev. 12)
Total 1,110.826 772.735 1,108.254 769.969
ORA makes a number of high level recommendations and comments
related to SCE’s showing. ORA proposes a blanket 21% reduction to SCE’s
forecasts for 2014 and 2015 on the basis of SCE’s “underspending” in 2013
relative to its forecast. Further, ORA proposes that SCE be required to include
more detail in its showing in the next GRC, suggesting disaggregation of costs
according to the sub-categories enumerated above and “something akin to zero
based budget accounting.” Finally, ORA notes that the number of new meters
(discussed below in Section 16) has implications for this subject area.127
SCE rejects ORA’s recommendations. SCE claims that ORA’s proposed
21% reduction does not meet ORA’s burden of production and recommends that
we order ORA to expressly analyze individual capital projects in future GRCs.
SCE claims that its showing in this GRC contains at least the same level of detail
as prior GRCs and that the RO model also includes detail on
jurisdictionalization.128
Like SCE, we find that ORA’s 21% reduction is not persuasive.
Underspending (or overspending) in a broad category in one year does not
directly show error in forecasts for individual sub-categories in other years.
However, we disagree with SCE’s apparent view that ORA should be barred
from making any blanket recommendations in future GRCs and decline to adopt
SCE’s proposed constraints on ORA’s showing. Similarly, we decline to adopt
any new broad requirements for SCE’s showing in this area. We do,
nevertheless, agree with ORA that, in future GRCs, SCE should provide clear
unit cost forecast information for the major types of equipment relevant to this
topic. SCE should clearly present the number of units required for each project
127 ORA-10 at 27-30. 128 SCE OB at 70-77.
- 46 -
A.13-11-003 ALJ/KD1/ar9/jt2/lil PROPOSED DECISION (Rev. 12)
or program so that the total cost forecast for the project or program can be
compared to the sum of the unit costs.
Transmission Planning Projects7.3.1.
SCE identifies eight major (>$1 million) grid reliability projects, ten
transmission generator interconnection projects, and several smaller (<$1 million)
projects.129 Most of these are uncontested. We find reasonable and adopt SCE’s
forecasts for the uncontested projects.
Victor 220/115 kilovolt (kV) Substation7.3.1.1.
SCE has installed third and fourth A-bank transformers and a new 115 kV
switchrack. ORA opposes the fourth A-bank, claiming that SCE did not justify
this expenditure. ORA proposes a $0.050 million disallowance in 2013.130 SCE
claims the fourth A-bank was needed to ensure reliable service during
construction.131 We find SCE’s rationale reasonable and make no disallowance.
Other ORA Proposals7.3.1.2.
ORA proposes a $1 million disallowance for upgrades at the Cal Cement
Substation on the grounds that a customer should pay these costs.132 SCE
explains that the relevant equipment is entirely network facilities serving
multiple customers.133 We agree with SCE that costs of upgrades to network
facilities are appropriately recovered from ratepayers in general and approve the
Cal Cement upgrades.
ORA proposes a $0.027 million disallowance on the basis of allocating
certain costs to FERC.134 SCE explains that no part of the relevant equipment is
129 SCE-3V3 at 19-36. 130 ORA-10 at 31-32.131 SCE-19V3 at 6-7.132 ORA-10 at 34.133 SCE-19V3 at 7.134 ORA-10 34.
- 47 -
A.13-11-003 ALJ/KD1/ar9/jt2/lil PROPOSED DECISION (Rev. 12)
FERC jurisdictional.135 SCE’s explanation is reasonable, and we adopt SCE’s
forecast.
ORA proposes a reduction to SCE’s forecast of small projects on the
grounds that discovery information and SCE’s testimony show different
numbers.136 SCE explains that ORA is apparently confusing the gross forecast
with the forecast net of customer contributions.137 SCE’s explanation is
reasonable, and we adopt SCE’s forecast.
Consequently, we find reasonable and adopt SCE’s forecasts for other
transmission planning projects.
Load Growth Planning Projects7.3.2.
As shown above, load growth planning projects represent the largest
category of electric system planning costs. ORA’s primary proposal in this area
is the blanket 21% reduction that we rejected above. Specific issues are
addressed below.
SCE’s A-bank plan seeks to provide adequate A-bank transformer capacity
to meet peak loads under base case and N-1 contingency138 conditions. SCE
replaces or expands equipment to meet peak loads only if growing load cannot
be rebalanced among substations to avoid the expense. SCE identifies 12 A-bank
projects with costs greater than $1 million for a total CPUC-jurisdictional cost of
$396 million during 2013-2017.139 We find SCE’s forecast of A-bank plan
expenditures for 2014-2015 reasonable.
SCE’s subtransmission line plan seeks to provide adequate 66kV or 115kV
capacity to meet peak loads at B-substations under base case and N-1
135 SCE-19V3 at 7-8.136 ORA-10 at 38.137 SCE-19V3 at 8.138 N-1 contingency refers to the condition of one critical element of system equipment out of
service. 139 SCE-3V3 at 36-46.
- 48 -
A.13-11-003 ALJ/KD1/ar9/jt2/lil PROPOSED DECISION (Rev. 12)
contingency conditions. SCE replaces or expands equipment to meet peak loads
only if growing load cannot be rebalanced among subtransmission lines to avoid
the expense of new subtransmission capacity. SCE identifies 22 subtransmission
projects with costs greater than $1 million for a total CPUC-jurisdictional cost of
$213 million during 2013-2017.140 We find SCE’s forecast of subtransmission plan
expenditures for 2014-2015 reasonable.
SCE’s DSP seeks to provide adequate B-bank and distribution circuit
capacity to meet peak loads under base case and N-1 contingency conditions.
SCE replaces or expands equipment to meet peak loads only if growing load
cannot be rebalanced among B-banks or distribution circuits to avoid the expense
of new capacity. Typical projects include adding or upgrading B-banks or
developing new B-substations. SCE identifies 32 DSP projects with costs greater
than $1 million for a total CPUC-jurisdictional cost of $535 million during
2013-2017.141
ORA recommends a $35 million disallowance to SCE’s 2015 forecast
because “that unit cost is excessive” in reference to DSP circuit projects associated
with substation upgrades.142 SCE explains that ORA misunderstands the forecast
and that ORA has apparently concluded that the entire 2015 capital expenditure
supports the single project completed that year rather than the 14 projects
expected to be completed in 2016.143 We agree with SCE that ORA has not
explained a valid basis for its proposed reduction. We find SCE’s DSP forecast
for 2014-2015 reasonable.
140 SCE-3V3 at 47-61.141 SCE-3V3 at 64-66.142 ORA-10 at 48-50.143 SCE-19V3 at 10-11.
- 49 -

A.13-11-003 ALJ/KD1/ar9/jt2/lil PROPOSED DECISION (Rev. 12)
SCE requests $13.251 million in 2015 (nominal) for land purchases for two
projects.144 This expenditure is uncontested, and is approved.
System Improvement/Reinforcement Program7.3.3.
This program includes six cost categories.
Substation Equipment Replacement7.3.3.1.Program (SERP)
SERP evaluates and, if necessary, replaces or adds substation equipment
(e.g., circuit breakers, grounding) to ensure safe operation and avoid equipment
damage. SCE proposes to increase SERP spending from a 2008-2012 average of
$5.9 million per year (2012$) to approximately $12 million per year. The increase
would allow SCE to replace 339 “overstressed” circuit breakers and reduce the
duty on 30 more through 2017.145
ORA considers SCE’s forecast “ambitious” and proposes a slower rate of
circuit breaker replacements, 45 per year. ORA accepts SCE’s unit cost and
proposes a cap of $7.415 million (nominal$) per year.146
In rebuttal, SCE claims that its forecast takes operational constraints into
consideration and that it does not consider replacing 163 circuit breakers in
2014-2015 to be unrealistic.147
We agree with ORA that SCE has not demonstrated the need for the
dramatic increase in replacements or the capacity to execute at this rate; however,
we accept SCE’s argument that some increase is warranted. Therefore, we adopt
funding for 60 replacements per year in 2014-2015, or $9.887 million per year at
the unit cost that SCE and ORA agree on.
144 SCE-3V3 at 84-85.145 SCE-3V3 at 85-87.146 ORA-10 at 47-48.147 SCE-19V3 at 12.
- 50 -

A.13-11-003 ALJ/KD1/ar9/jt2/lil PROPOSED DECISION (Rev. 12)
ORA Adopted
Unit Cost $ 0.165 $ 0.165
Units 45 60
Total $ 7.415 $ 9.887
DSP Circuit Work7.3.3.2.
There are three types of projects in this category: 1) new circuits not
associated with new substations, 2) miscellaneous non-circuit work, and 3)
Circuit Load Reduction Program (CLRP). SCE notes that new circuit work is
decreasing while the two latter types are increasing. Non-circuit work covers
projects to transfer load from substations forecast to exceed loading criteria to
other substations. CLRP covers work (other than adding circuits) to reduce load
on existing circuits.148
ORA recommends reducing non-circuit work to $20 million per year and
reducing CLRP to $14.454 million per year. ORA labels these amounts
“generous” in comparison to five-year recorded averages.149
In rebuttal, SCE argues that its new planning process focuses on
non-circuit and CLRP instead of constructing new circuits, suggesting that ORA
overlooks the offsetting reductions to new DSP circuits. SCE shows that taken as
a whole, this category is decreasing in its forecast, relative to past years.150
SCE’s approach to reduce the emphasis on new circuits and instead focus
on non-circuit work and CLRP appears reasonable. ORA’s selective view of two
components while ignoring cost reductions in the category as a whole is
unreasonable. We find reasonable and adopt SCE’s forecast for DSP circuit work.
Capacitor and Circuit Automation7.3.3.3.Programs
148 SCE-3V3 at 87-94.149 ORA-10 at 50-51.150 SCE-19V3 at 14.
- 51 -

A.13-11-003 ALJ/KD1/ar9/jt2/lil PROPOSED DECISION (Rev. 12)
SCE’s Capacitor Automation Program automates the controls for
distribution capacitors and replaces obsolete control systems. SCE forecasts
replacing 280 control systems per year at a cost of about $1.5 million.
SCE’s Circuit Automation Program automates switches to better respond
to unplanned outages by isolating faults more quickly and restoring service
remotely. SCE forecasts automating approximately 160 switches per year at a
cost around $7 million per year.151
ORA recommends 2013-specific reductions for each program, but accepts
SCE’s 2014-2015 forecasts.152 Since SCE agrees to use 2013 recorded,153 we do not
give this recommendation further consideration. SCE’s forecasts for these
modest programs are adopted.
Uncontested Programs7.3.3.4.
SCE presents forecasts for Distribution Plant Betterment, Distribution VAR
Plan, and Substation Load Information Monitoring. ORA supports SCE’s
forecasts.
Distribution Plant Betterment includes upgrading equipment to
accommodate load growth. SCE forecasts expenditures slightly below recent
historical averages for this program.
Distribution VAR Plan seeks to add capacitors (which supply VARs) to the
distribution system, sufficient so that the entire distribution system will operate
at unity power factor by 2016. Providing VARs on the distribution system
reduces the need for higher voltage systems to meet these needs, and thus
improves reliability. SCE forecasts small increases over recent historical
expenditures.154
151 SCE-3V3 at 97-100.152 ORA-10 at 50-52.153 SCE OB at 80.154 SCE-3V3 at 94-97.
- 52 -

A.13-11-003 ALJ/KD1/ar9/jt2/lil PROPOSED DECISION (Rev. 12)
Substation Load Information Monitoring installs equipment to remotely
monitor load at substations to provide SCE better planning information and
improve real-time operations. SCE plans to add this equipment to 20 substations
per year from 2014 on at an annual cost just over $1 million.155
We find reasonable and approve SCE’s forecasts for these uncontested
programs.
Generator Interconnection Program7.3.4.
This program includes projects to interconnect new generators to SCE’s
transmission or distribution systems. Some or all of the costs for some projects
are recovered from the generators, and recorded as Other Operating Revenue.
None of the 19 projects in this category have CPUC jurisdictional costs greater
than $1 million.156 ORA initially recommended a $0.679 million disallowance in
2013, but later generally accepted 2013 recorded capital for the proceeding. ORA
does not contest 2014-2015 expenditures.157 SCE responds that it does not
generally provide detailed discussion of projects under $1 million and that the
Large Generator Interconnection Agreement for that project specifies the costs
recovered from ratepayers. We adopt SCE’s 2014-2015 forecast.
Added Facilities Projects7.3.5.
This category includes ratepayer costs to add facilities to meet customer
requests for additional or non-standard service. Some projects are financed by
the customer, others by SCE. Revenues recovered from the requesting customer
are recovered as Other Operating Revenue, discussed in Section 7.11 below.
Example projects include additional substations at the Port of Long Beach. SCE
155 SCE-3V3 at 100-101.156 SCE-3V3 at 101-102.157 ORA-10 at 55-56.
- 53 -

A.13-11-003 ALJ/KD1/ar9/jt2/lil PROPOSED DECISION (Rev. 12)
forecasts $96.2 million in CPUC-jurisdictional costs during 2013-2017.158 ORA
agrees with SCE’s forecast for 2014-2015, but raises concerns about 2016-2017.159
We approve SCE’s 2014-2015 forecast.
T&D – Infrastructure Replacement7.4.
SCE owns many pieces of infrastructure, and this infrastructure wears out
over time. SCE considers infrastructure replacement, as discussed in this section,
to generally refer to preemptively replacing infrastructure based on risk or
reliability factors, as opposed to based on an inspection or in-service failure. SCE
preemptively replaces infrastructure if the consequence of an in-service failure is
high and inspections may not be able to accurately assess the risk of failure.
Time-dependent failure rates suggest that the likelihood of failure increases as
assets age. For a population of assets, the replacement rate will plateau at a
“long-term steady-state replacement rate.” SCE asserts that the average ages of
several types of its infrastructure (e.g., poles, underground distribution
transformers) are increasing, and correspondingly, the number of these assets
that need to be replaced each year is growing.
SCE’s total capital request for infrastructure replacement ranges from $279
million recorded in 2013160 to $478 million in 2015 (nominal$). SCE was
authorized $266 million in 2012 and recorded $167 million that year, noting that
the timing of D.12-11-051 “had a significant impact on expenditures.” SCE
subdivides this request into several categories, discussed below.161
The key decision before the Commission in this section is how rapidly to
replace infrastructure considering safety, reliability, and cost, in addition to other
factors.
158 SCE-3V3 at 102-107.159 ORA-10 at 56-57. 160 SCE-77, Appendix A.161 SCE-03V4 at 1-13.
- 54 -

A.13-11-003 ALJ/KD1/ar9/jt2/lil PROPOSED DECISION (Rev. 12)
Our adopted capital expenditure forecast for infrastructure replacement is
summarized in the following table (millions of nominal$).
Activity Requested Adopted
2014 2015 2014 2015
Worst CircuitRehabilitation
85.086 112.961 85.086 104.272
Cable in ConduitReplacement
65.451 93.577 42.228 75.452
Testing-based CableLife Extension
13.167 26.892 13.167 26.892
Underground OilSwitch Replacementand PMH-4 SwitchReplacement
12.558 9.625 12.558 9.625
Capacitor BankReplacement
13.048 13.325 13.048 13.325
Distribution VoltageRegulator
0.524 0.535 0.524 0.535
Automatic RecloserReplacement
2.388 2.438 2.388 2.438
PolychlorinatedBiphenyl (PCB)TransformerReplacement
1.780 1.818 1.780 1.818
Transformer BankReplacement
67.875 72.972 65.816 66.629
Circuit BreakerReplacement 29.259 31.430 24.036 24.375
4 kV CircuitOverload-DrivenCutovers
23.562 26.736 23.562 26.736
4kV SubstationElimination
41.889 85.556 41.889 85.556
Total 356.587 477.865 326.081 437.653
- 55 -

A.13-11-003 ALJ/KD1/ar9/jt2/lil PROPOSED DECISION (Rev. 12)
Underground Cable Programs7.4.1.
SCE discusses three infrastructure replacement programs for underground
cable: WCR, CIC Replacement, and Testing-Based Cable Life Extension (TBCLE).
These three programs manage SCE’s approximately 50,179 miles of underground
cable, including four different cable types. These different cable types were
generally installed during different time periods, have different life expectancies,
and different maintenance characteristics. SCE asserts that underground cable is
unique in that it cannot be visually inspected, and argues therefore that there
must be a preemptive replacement program to avoid unplanned outages. SCE
relies on two primary metrics of reliability in its discussion: System Average
Interruption Duration Index (SAIDI) and System Average Interruption
Frequency Index (SAIFI). Based on an engineering analysis of 20 circuits, SCE
projects that without any preemptive cable replacement, SAIDI would increase
by 61 minutes and SAIFI by 0.269 interruptions over the next 20 years. SCE
believes it will inevitably experience some decline in reliability in coming years
due to infrastructure aging. SCE concludes that replacing 570 conductor miles
per year would be necessary to achieve today’s level of reliability in 20 years.
SCE proposes to replace 500 miles per year, divided between WCR and CIC.162
ORA suggests that the average customer would not notice the “minor”
increase in SAIFI in 20 years of no underground cable replacement. ORA
proposes a cable replacement rate of 400 miles per year in 2015 and beyond,163
estimating the impact of this change on SAIFI to be 0.07 interruptions higher than
SCE’s proposed 500 miles per year. By ORA’s calculation, this is a $50 million
per year saving of capital expenditures, or close to $1 billion over 20 years.
“ORA is confident” that ratepayers would be “happy” to accept these rate
162 SCE-3V4.163 ORA proposes 350 miles in 2014.
- 56 -

A.13-11-003 ALJ/KD1/ar9/jt2/lil PROPOSED DECISION (Rev. 12)
savings for lower levels of reliability. ORA notes that the highest recorded level
of replacement was 272 miles in 2009, and in 2012 only 177 miles were replaced,
far lower than the levels proposed here.164
SCE cites Assembly Bill (AB) 66, which established Pub. Util. Code §
2774.1, as evidence of customers’ dissatisfaction with current reliability levels.
Further, SCE notes a decline in residential customer satisfaction as measured by
J.D. Power surveys.
SCE also suggests that ORA’s cost savings do not account for the cost of
possible additional cable failures resulting from its lower proposed replacement
rate. SCE claims that some of the cable will likely fail soon, and the replacement
will be more expensive due to higher night labor costs and lost economies of
scale from concurrently performing other projects. SCE also notes the increased
inconvenience to customers of unplanned outages.165
ORA rejects this argument, on the grounds that the TBCLE program gives
ORA confidence that cables allowed to remain are unlikely to fail in the near
term. ORA recommends that future GRCs can revisit the issue if ORA’s
recommended replacement rate of 400 miles per year is too low for cable failure
rates. ORA notes that it does not consider its forecast to be “etched in stone” and
expects changes both in SCE’s technology (e.g., the testing and replacement
processes) and funding levels as these, and other, changes occur.166
CUE suggests that ORA ignores the impact on SAIDI of its proposal,
noting that outages due to CIC tend to be longer than outages related to poles.167
164 ORA-11 at 16-21. 165 SCE-19V4 at 4-5.166 ORA OB at 83-86.167 CUE-2 at 10-12.
- 57 -

A.13-11-003 ALJ/KD1/ar9/jt2/lil PROPOSED DECISION (Rev. 12)
ORA rejects this argument, noting that the 69 minutes of outages CUE references,
are spread over 20 years.168
TURN proposes that SCE should have increased its TBCLE program, and
thus decreased the cost of the other two programs. TURN suggests that SCE
should be able to achieve the same number of rehabilitated circuit miles by only
actually replacing 50% of the miles of cable, thus achieving the same reliability
benefits at lower cost. TURN quotes SCE’s testimony from the 2012 GRC, stating
an intent to reduce the amounts and costs of cable replacement through a testing
program.169
SCE argues that TURN’s view of the testing program is overly optimistic
and states “with confidence” that testing will not double the effectiveness of
replacement efforts. Among other factors, SCE argues that TURN does not
consider that the percentage of CIC testing as “bad” varies from 50% to 20% and
that replacement of mainline cable compared to CIC have very different
reliability impacts. SCE argues that TURN incorrectly assumes that SCE has
ignored efficiency gains from testing, but that SCE is actually counting on these
gains to achieve the reliability demanded by customers in the long term. SCE
states that it hopes to improve SAIDI and SAIFI through testing in combination
with cable replacement. Further, SCE suggests that TURN’s proposal to only
replace cable tested as “bad” will delay WCR replacements by at least a year.
TURN’s proposal, SCE argues, would discourage the utility from adopting
innovative approaches in the future.170
CUE notes that WCR and CIC replacement account for more than 75% of
SCE’s proposed capital expenditures to mitigate conductor failure and proposes
168 ORA OB at 85.169 TURN-03 at 13-19.170 SCE-19V4 at 7-11.
- 58 -

A.13-11-003 ALJ/KD1/ar9/jt2/lil PROPOSED DECISION (Rev. 12)
to increase spending on these programs more than SCE. CUE claims that SCE’s
failure rate predictions are much lower than PG&E’s, potentially compounding
the increases in SAIDI and SAIFI in the near term. CUE proposes that SCE
double its CIC replacement rate to a minimum of 350 miles per year, close to the
rate that in-service CIC is reaching its mean time to failure. CUE’s total
replacement proposal (CIC and WCR) is 675 miles per year. At this level, CUE
projects SAIDI and SAIFI to stay above 2012 levels until 2027 and 2024,
respectively. CUE accepts SCE’s unit costs.171
WCR Program7.4.1.1.
The WCR program began in 1997 as the Annual Circuit Review. WCR has
two objectives: 1) minimize the impact of aging infrastructure on reliability, and
2) minimize the disparity in reliability between circuits. Thus, WCR focuses on
circuits with high impacts on SAIDI and SAIFI. Typically, the “most
risk-significant mainline cable” is replaced during rehabilitation, but other
improvements may also be made.
SCE requests capital expenditures of $85.086 million in 2014 and $112.961
million in 2015 at unit costs of $0.340 million and $0.348 million, per mile
respectively. This is an increase from $66.942 million recorded in 2012.
The WCR program aims to invest in circuits that will provide the largest
reliability benefits. SCE notes that, in 2012, 7% of circuits were responsible for
half of SAIDI. SCE selects circuits for further study based on five quantitative
criteria and a variety of qualitative criteria, then designs projects to improve the
selected circuits. Typically, less than 10% of the cable in a circuit is chosen for
replacement based on factors including age, history of failure, and loading. In
171 CUE-1 at 28-35.
- 59 -
A.13-11-003 ALJ/KD1/ar9/jt2/lil PROPOSED DECISION (Rev. 12)
addition to reliability benefits, SCE submits the WCR program has equity
benefits by reducing disparities in reliability among customers.172
ORA recommends 2013 recorded (which is $16.411 million higher than
SCE’s forecast), accepts SCE’s 2014 forecast, and proposes a reduction of $8.689
million for 2015. ORA accepts SCE’s 2014-2015 unit costs. The reduction in 2015
is the result of ORA’s proposed rate of 300 miles of cable replacement, compared
to SCE’s 325 miles.173
TURN proposes that the number of miles to be replaced should be reduced
based on impacts of cable testing. TURN assumes that 50% of tested mainline
cable will need to be replaced, based on SCE’s analysis for testing CIC. From this
assumption, TURN recommends replacing 125 miles in 2014 and 162.5 in 2015.
As a secondary, “much more conservative” assumption, TURN suggests
assuming a 65% failure rate based on the average of 50% and 79% (SCE’s
estimated threshold for cost-effectiveness of testing). This assumption suggests
161 miles in 2014 and 210 in 2015. TURN suggests that SCE’s proposal “borders
on being imprudent” given the inspection program. TURN accepts SCE’s unit
cost estimates.174
Cable in Conduit (CIC) Replacement7.4.1.2.Program
SCE began installing CIC in the 1960s and it now makes up approximately
one fourth of SCE’s cable population. CIC is made with integrated, thin-walled
polypropylene tubing, and is not installed inside rigid ducts. CIC is difficult to
replace because the cable resists being pulled out of the polypropylene tubing,
especially if the tubing is damaged. SCE notes that a typical outage due to
in-service CIC failure is over 20 hours. SCE forecasts $65.451 million in 2014 and
172 SCE-3V4 at 14-28.173 ORA-11 at 21-23. 174 TURN-3 at 16-22.
- 60 -

A.13-11-003 ALJ/KD1/ar9/jt2/lil PROPOSED DECISION (Rev. 12)
$93.577 million in 2015 on unit costs of $0.524 million and $0.535 million per mile,
representing 125 and 175 miles, respectively. SCE notes that 175 miles is about
1% of the CIC population.
SCE describes a new process for removing old cable, and replacing new
cable into the existing CIC ducting. If this method fails in a specific application,
SCE will use traditional open cut trenching for replacement.
For 2013 and 2014, SCE will replace CIC based on historical circuit
performance. For 2015 and beyond, SCE states that all CIC replaced will be
selected based on testing. SCE anticipates a 50% failure rate from the testing.175
ORA accepts SCE’s unit cost forecasts and proposes lower CIC
replacement rates for 2014 and 2015, 100 miles each year. ORA also proposes to
use 2013 recorded spending, which is lower than SCE’s forecast. ORA notes that
SCE’s 2015 proposal represents greater than a 1,000% increase from 2012 miles
replaced. ORA’s proposed reductions are $13.051 million in 2014 and $40.077
million in 2015.176
TURN asserts neither SCE’s unit count nor unit cost is reasonable. TURN
recommends 87.5 miles per year, based on 50% of SCE’s forecast and its testing
rationale described above. For unit cost, TURN proposes a weighted average of
traditional trenching costs and the new method described by SCE, but TURN
proposes lower costs for each category. For traditional trenching, TURN
recommends $0.593 million per mile (2012$) based on an average of 2009-2013,
compared to SCE’s $0.700 million per mile based on 2012. For the new method,
TURN recommends $0.241 million per mile based on an average of recorded
costs for this method through April 4, 2014, compared to SCE’s $0.400 million
175 SCE-3V4 at 28-36.176 ORA-11 at 23-26.
- 61 -

A.13-11-003 ALJ/KD1/ar9/jt2/lil PROPOSED DECISION (Rev. 12)
based on judgement. TURN recommends a weighted average of $0.360
million.177 In its brief, TURN recalculates an average of $0.364 million.178
SCE rejects TURN’s unit cost reduction, arguing that TURN bases its
analysis on 7.8 miles of replacement, without considering the difficulty of
replacement. SCE reiterates its claim that it is working to minimize unit costs,
and its forecast reflects this.179
TBCLE Program7.4.1.3.
Under this program, a vendor will perform “partial discharge” testing on
de-energized segments of underground primary cable. Segments rated “good”
will be guaranteed by the vendor for 10 years against in-service failures; SCE will
replace “bad” rated segments. FERC allows cable testing costs to be capitalized,
with certain requirements; SCE asserts that this program meets the requirements
and counts as capital expenditures.
SCE performed a pilot study in 2012 which it found successful. SCE found
that a rapid pace of testing is possible, and that customers on typical circuits will
only need to experience one planned outage for testing. SCE found that, on
“poorly performing” circuits, about 50% of segments tested needed replacement.
The total cost of testing is about $0.033 million per conductor mile. SCE’s
economic analysis concludes that testing is cost-effective, relative to replacing all
CIC in the circuit. SCE plans to expand the program in 2015 to test mainline
cable.180
TURN proposes that SCE should have begun testing 500 miles per year in
2014 and beyond. TURN calculates the impact of this as a $3.927 million (2012$)
increase in 2014 and an $8.646 million decrease in 2015, relative to SCE’s
177 TURN-3 at 22-24.178 TURN OB at 62-63; TURN-43. 179 SCE-19V4 at 12.180 SCE-3V4 at 37-41.
- 62 -

A.13-11-003 ALJ/KD1/ar9/jt2/lil PROPOSED DECISION (Rev. 12)
proposal. TURN argues that this rate allows SCE to “cost-effectively rehabilitate
the conductor miles that its cable replacement models indicate.” TURN
recommends that we require a cost-benefit study of mainline cable testing in
SCE’s next GRC.181
Discussion7.4.1.4.
One of the key premises of preemptive infrastructure replacement is that
the infrastructure in question cannot be effectively inspected or tested to evaluate
its condition and likely remaining life. Underground cable presents obvious
challenges for inspection, but SCE has developed new approaches for testing that
initially appear successful and cost-effective, at least for CIC. SCE expresses
optimism for similar results for testing mainline cable that could be replaced
under WCR. The potential benefits of this testing program are significant.
Logically, if the remaining life of underground cable can be effectively evaluated
by testing, then only “bad” cable needs to be replaced, significantly reducing
costs (both financial and otherwise) to customers associated with replacement in
order to achieve equivalent reliability benefits. Under an effective testing
paradigm, all underground cable may eventually be appropriately considered
within the DIMP, discussed below in Section 7.6. To the extent that SCE
proposes to replace untested cable (either mainline or CIC) in its next GRC, it
must clearly explain why a testing-based replacement program is not more
cost-effective; we anticipate efficiency improvements based on testing in this
area.
We agree with TURN that SCE’s request to dramatically increase the pace
of cable replacement shortly before the benefits of this testing program are fully
understood or realized is questionable. While we agree with SCE and CUE that
181 TURN-3 at 26-27.
- 63 -

A.13-11-003 ALJ/KD1/ar9/jt2/lil PROPOSED DECISION (Rev. 12)
improving reliability through WCR and CIC replacement is an important goal,
this goal must be balanced against customer costs. However, given the import of
reliability and CUE’s comparison to the rate of CIC reaching mean time to failure,
TURN proposes reductions to the number of miles replaced that are too deep.
Accordingly, we adopt small reductions to SCE’s forecast for miles of cable
replaced. For WCR, we adopt ORA’s proposal for number of miles replaced. For
CIC, we adopt a forecast of 100 miles in 2014 and 175 miles in 2015. These small
reductions relative to SCE’s proposal reflect our belief that SCE can and should
have done more to accelerate its use of testing. We note that we adopt SCE’s full
2015 forecast for CIC because SCE states that all CIC replaced in that year will be
cable that failed testing. We recognize that implementing such a change does
take time, but the benefits to customers of reducing the amount of good cable
replaced outweigh the benefits to customers of accelerated replacement of more
total cable. SCE should direct more effort toward implementing testing, and
reduce the likelihood of replacing cable unnecessarily.
Second, we adopt a reduction to CIC unit costs. TURN’s point that unit
costs should be based on data is valid. SCE’s argument in rebuttal that the data
TURN relied upon is inadequate to support TURN’s proposed unit cost is vague.
SCE suggests that the 7.8 miles of trenchless projects relied on by TURN is too
small a sample, however, SCE presents no direct support for its own figure. We
agree that this may be a small sample, but in the absence of a competing specific
analysis, we find $0.300 million (2012$) per mile to be a reasonable forecast. For
traditional trenching, SCE suggests that the multiple years of data employed by
TURN are not representative, but again is not specific in its reasoning. In
hearing, SCE’s witness offered nothing more than anecdotal evidence and
speculation that the small set of projects relied on by SCE is more representative
- 64 -

A.13-11-003 ALJ/KD1/ar9/jt2/lil PROPOSED DECISION (Rev. 12)
than the larger set evaluated by TURN.182 Therefore, we find TURN’s estimate of
$0.610 million per mile to be a reasonable forecast. Using SCE’s weighting
factors, we calculate a weighted average of $0.403 million as shown below.
(Millions of 2012$) Trenchless Trenched
% of miles 33.33 66.67
$/mile 0.610 0.300
Weighted Avg. 0.403
For TBCLE, we find SCE’s forecast reasonable. Our total forecast for the
three programs is summarized below.
2014 2015
Requested Adopted Requested Adopted
WCR 85.086 85.086 112.961 104.272
Miles 250 250 325 300
$/mile 0.340 0.340 0.348 0.348
CIC 65.451 42.228 93.577 75.452
Miles 125 100 175 175
$/mile 0.524 0.422 0.535 0.431
TBCLE 13.167 13.167 26.892 26.892
Total ($millions) 163.704 140.481 233.430 206.616
A-Bank Transformer Replacement7.4.2.
SCE’s Substation Infrastructure Replacement (SIR) program handles three
types of transformer replacements: AA-bank, which are entirely FERC
jurisdictional; A-bank, which transform 220 kV (transmission voltage) electricity
to subtransmission voltages (115kV or 66kV); and B-bank, which convert
subtransmission to distribution voltages. SCE asserts that SIR replaces
transformers that are “approaching the end of their service lives, that contain
parts which are known to be seriously problematic or are no longer available, or
182 RT 677-681.
- 65 -

A.13-11-003 ALJ/KD1/ar9/jt2/lil PROPOSED DECISION (Rev. 12)
that can no longer be cost-effectively maintained.” SIR also handles circuit
breaker replacement, discussed in Section 7.4.3 below.183
SCE contends that in-service failures of A-bank transformers pose
significant safety and reliability hazards. Inspections reduce the risk of in-service
failures, but cannot prevent them completely. SCE argues that preemptive
replacement is “prudent and responsible.”
SCE claims that, in 2012, it began using formal engineering analysis to
forecast the number of transformers to be replaced, and which specific
transformers would be replaced. SCE’s analysis suggests that the mean time to
wear out for A-bank transformers is 37 years, compared to a current average age
of 28 years in the 162 unit system. Based on the age distribution, SCE predicts
five A-bank transformers will wear out each year from 2013 to 2022. SCE uses a
“Health Index” (inversely proportional to probability of failure) to assess the
physical condition of transformers. The Health Index, in addition to “Criticality,”
a measure of the consequence of an in-service failure, is used to determine the
replacement schedule. This schedule is adjusted for expert judgement and to
optimize with respect to other projects.
Some, but not all, A-bank transformers are FERC-jurisdictional. SCE’s
forecast is summarized in the following table (millions of nominal$):184
Transformers Unit Cost CPUCJurisdictional ForecastCPUC FERC Total
2014 4 1 5 4.119 16.476
2015 5 0 5 4.228 21.141
TURN contends that SCE has a history of “either over-forecasting or
under-delivering A-bank replacements” and that SCE’s forecast should be
183 SCE-3V4 at 68-71.184 SCE-3V4 at 68-76 and SCE-3V4A2.
- 66 -

A.13-11-003 ALJ/KD1/ar9/jt2/lil PROPOSED DECISION (Rev. 12)
reduced to 3.2 replacements per year based on the historical average replacement
rate. In addition to historical replacement data, TURN relies on SCE testimony in
past GRCs that SCE used analysis of the same types of physical information to
forecast transformer replacements as SCE proposes to use in its Health Index.
TURN concludes that this information does not accurately predict A-bank failure.
Anecdotally, TURN notes that the only loss of load event driven by an internal
A-bank failure was a transformer that had not been identified for replacement
when it failed in 2013. Further, TURN points to SCE’s claims in the 2012 GRC
that a new monitoring program would increase A-bank life. TURN notes that
SCE replaced three A-banks in 2013. TURN recommends funding for 2.2 A-bank
replacements in 2014 and 3.2 in 2015, noting that the difference is because one of
the 2014 replacements is FERC-jurisdictional.185
SCE proposes to read TURN’s recommendation as three transformers in
2014 and four in 2015 because “obviously” it is impossible to replace a fraction of
a transformer. Further, SCE argues that its “risk-informed approach” was new in
the 2012 GRC and has resulted in significantly lower forecasts of A-bank
replacements. Lastly, SCE sites SED’s conclusion186 that this approach “could
serve as an example for other programs.”187
As a foundational matter, although we agree with SCE that it must replace
whole numbers of transformers, we agree with TURN188 that ratemaking
forecasts need not be restricted to whole numbers of transformers. Further, even
if we accepted SCE’s rounding premise, we see no justification for SCE’s
proposed creative rounding approach, e.g., why 3.2 should be rounded up to 4
rather than down to 3.
185 TURN-3 and TURN-3A at 26-31. 186 The report SCE cites was later admitted into evidence as exhibit ALJ-1. 187 SCE-26V4 at 13-15.188 TURN OB at 67.
- 67 -

A.13-11-003 ALJ/KD1/ar9/jt2/lil PROPOSED DECISION (Rev. 12)
Substantively, we are swayed by TURN’s argument that historical
replacement rates are an important predictor of future replacements. On the
other hand, we appreciate SCE’s efforts to make risk-informed investments to
avoid in-service transformer failures. Increasing the rate of A-bank replacements
above the historical average is an appropriate step to reduce safety and reliability
risks. Accordingly, we adopt SCE’s recorded A-bank replacement spending for
2013 and 3.5 per year for CPUC-jurisdictional replacements in each of 2014 and
2015, for a total of nine A-bank replacements from 2013 to 2015. We accept SCE’s
uncontested unit costs. Our resulting forecast is shown below (millions of
nominal$).
CPUC A-bank Unit Cost Adopted Forecast
2014 3.5 4.119 14.417
2015 3.5 4.228 14.798
Distribution Circuit Breaker Replacement7.4.3.
The Distribution Circuit Breaker Replacement program identifies and
replaces circuit breakers from 115kV to 2.4kV that are approaching end of service
life, contain problematic or unavailable parts, or can no longer be maintained
cost-effectively. SCE states that circuit breakers are critical for public safety and
protecting other equipment in the event of a fault in the circuit. SCE describes
engineering analysis (similar to A-bank transformers, above) to calculate a Health
Index and select circuit breakers for replacement. SCE’s analysis and forecast is
summarized below. SCE’s total forecast is $29.259 million in 2014 and $31.430
million in 2015.189
189 SCE-3V4 at 84-91.
- 68 -
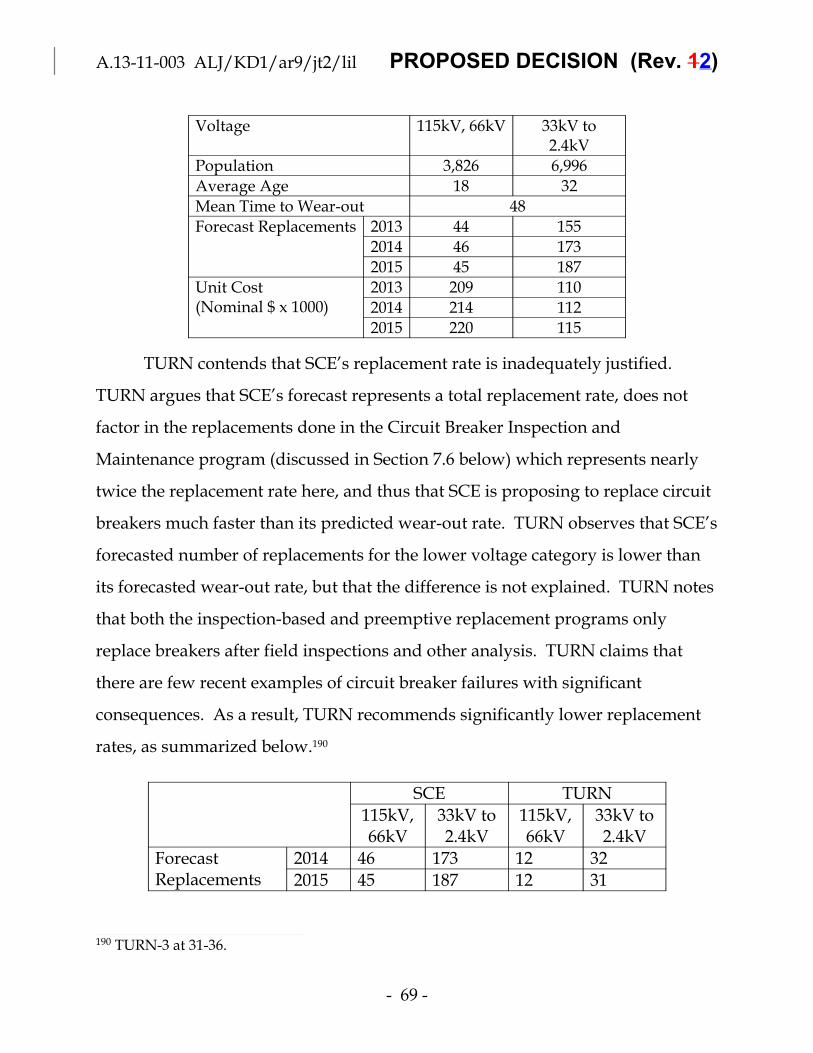
A.13-11-003 ALJ/KD1/ar9/jt2/lil PROPOSED DECISION (Rev. 12)
Voltage 115kV, 66kV 33kV to2.4kV
Population 3,826 6,996
Average Age 18 32
Mean Time to Wear-out 48
Forecast Replacements 2013 44 155
2014 46 173
2015 45 187
Unit Cost(Nominal $ x 1000)
2013 209 110
2014 214 112
2015 220 115
TURN contends that SCE’s replacement rate is inadequately justified.
TURN argues that SCE’s forecast represents a total replacement rate, does not
factor in the replacements done in the Circuit Breaker Inspection and
Maintenance program (discussed in Section 7.6 below) which represents nearly
twice the replacement rate here, and thus that SCE is proposing to replace circuit
breakers much faster than its predicted wear-out rate. TURN observes that SCE’s
forecasted number of replacements for the lower voltage category is lower than
its forecasted wear-out rate, but that the difference is not explained. TURN notes
that both the inspection-based and preemptive replacement programs only
replace breakers after field inspections and other analysis. TURN claims that
there are few recent examples of circuit breaker failures with significant
consequences. As a result, TURN recommends significantly lower replacement
rates, as summarized below.190
SCE TURN
115kV,66kV
33kV to2.4kV
115kV,66kV
33kV to2.4kV
ForecastReplacements
2014 46 173 12 32
2015 45 187 12 31
190 TURN-3 at 31-36.
- 69 -

A.13-11-003 ALJ/KD1/ar9/jt2/lil PROPOSED DECISION (Rev. 12)
SCE argues that TURN’s proposal misses the point of preemptive
replacement. SCE claims that replacing circuit breakers can be complicated due
to space constraints, need to replace related equipment, and other factors. In
some cases, replacement can be a five-year process. Emergency replacements can
lead to sub-optimal and more costly results. SCE asserts that TURN’s proposal to
limit the replacement rate to the forecast wear-out rate minus historic emergency
replacement rate is bad for safety, reliability, and cost.191 SCE also disputes the
assumptions relied on by TURN in calculating its forecast of wear-out rate less
other replacements.192
We agree with TURN that SCE has not adequately justified its proposed
replacement rates, but we agree with SCE that some increase over historical rates
is warranted. In D.12-11-051, we adopted a target of 175 circuit breaker
replacements per year and find a small increase above this level reasonable for
this GRC period. We adopt funding for 180 replacements per year during 2014
and 2015. While this number is below SCE’s forecast wear-out rate, it is
considerably higher than TURN’s calculation of wear-out less other
replacements, thus allowing SCE to make progress toward the goal of reducing
in-service failures. We adopt SCE’s uncontested unit costs. In the next GRC, SCE
should provide analysis of the preemptive replacements in combination with
other types of replacements. Our adopted forecast is summarized below
(millions of nominal$).
Adopted ReplacementsAdopted Forecast, Total115kV, 66kV 33kV to 2.4kV
2014 38 142 24.036
2015 35 145 24.375
191 SCE-19V4 at 17-18.192 SCE OB at 89-90.
- 70 -

A.13-11-003 ALJ/KD1/ar9/jt2/lil PROPOSED DECISION (Rev. 12)
Uncontested Infrastructure Replacement Programs7.4.4.
B-bank Transformers7.4.4.1.
SCE makes the same safety and reliability arguments in favor of its B-bank
transformer replacements as summarized above for A-bank replacements. SCE
also describes the same type of engineering analysis to calculate a Health Index
and select transformers for replacement. SCE’s analysis suggests that the mean
time to wear out for B-bank transformers is 57 years, compared to a current
average age of 40 years in the 2,596 unit system. SCE originally forecast
replacing 30 transformers in 2013, 42 in 2014, and 33 in 2015. These totals are
made up of five different voltage classes of transformers, ranging from 115kV
with a 2015 unit cost of $1.730 million to 12kV with a 2015 unit cost of $0.598
million.193 ORA proposes to use SCE’s recorded 2013 value and to reduce the
2014 forecast to 30 transformers.194 In rebuttal, SCE accepts ORA’s forecast, citing
resource constraints in 2014.195 We adopt ORA’s uncontested forecast as shown
below (millions of nominal$).
2014 2015
29.454 33.529
4 kV Circuit Replacement7.4.4.2.
SCE has approximately 4,600 distribution circuits, mostly operating at
modern standard voltages. However, SCE has 1,100 circuits and 211 substations
operating at 4kV or lower voltages. SCE argues that these circuits are limited,
inefficient, inflexible, and full of obsolete equipment. SCE has two programs to
eliminate these circuits: 4kV Circuit Overload-Driven Cutover reduces the size of
193 SCE-3V4 at 76-82.194 ORA-11 at 26-29.195 SCE-19V4 at 16.
- 71 -

A.13-11-003 ALJ/KD1/ar9/jt2/lil PROPOSED DECISION (Rev. 12)
4kV circuits by transferring load to other circuits, and 4kV Substation Elimination
transfers circuits to higher voltage substations. In D.12-11-051,196 we encouraged
SCE to ensure these programs are coordinated. SCE has indicated that many
projects planned by these programs are coordinated. We find reasonable and
adopt SCE’s uncontested forecasts as summarized below (millions of nominal
$).197
Circuit Overload-Driven Cutovers Substation Elimination
2014 23.562 41.889
2015 26.736 85.556
Other Uncontested Infrastructure7.4.4.3.Replacement Programs
The Commission has reviewed SCE’s other uncontested infrastructure
replacement programs including: PMH-4 switches, underground oil switches,
distribution voltage regulators, automatic reclosers, and Polychlorinated
Biphenyl (PCB) transformers. We find SCE’s forecasts for these programs
reasonable.
T&D – Customer-Driven Programs and Distribution7.5.Construction
SCE pursues many types of work in response to customer requests and to
build out its distribution system, including: new service connections,
undergrounding facilities in accordance with Rule 20, relocating or modifying
service to meet customer requests, and prefabrication and purchase of materials
and equipment for construction activities.198
The primary driver of the expenses in this chapter is the forecast of gross
meter sets, discussed below in Section 16. The parties’ different meter forecasts
196 D.12-11-051 at 159.197 SCE-3V4.198 SCE-19V5 at 1.
- 72 -

A.13-11-003 ALJ/KD1/ar9/jt2/lil PROPOSED DECISION (Rev. 12)
represent the key difference between their positions. We do not review those
positions here, but simply apply our adopted meter forecast to the methods used
by the parties to calculate an adopted forecast for most categories of costs. We
focus our attention in this section on the remaining disputed issues.
O&M7.5.1.
SCE’s total O&M forecast is $16.008 million (2012$) in Accounts 586.140,
588.140, and 588.271 (a credit).
For Account 586.140, Meter Installation and Replacements, SCE uses the
2012 recorded cost per meter of $77, noting that smart meters will be the norm in
the future. SCE levelized its 2015-2017 forecasts to develop its test year
forecast.199 ORA accepts SCE’s unit cost, but opposes the levelized forecast,
claiming that the attrition mechanism provides for appropriate increases.200 SCE
argues that the attrition mechanism does not assume increasing levels of work
and submits that the increasing numbers of meter sets in the forecast necessitates
the levelization approach in order to recover SCE’s costs. SCE claims that we
have adopted the levelized approach in the past, but the citation provided does
not support the claim.201 We accept SCE’s point that the actual number of meters
installed in the post-test years is forecast to be considerably higher than in 2015,
and accept SCE’s proposal to adopt a levelized forecast.
SCE and ORA have the same dispute over levelizing the Distribution Line
Rents portion of Account 588.140. SCE notes that its rents to governmental
landowners are contractually subject to 1.9% escalation per year.202 We have
modified the Results of Operations model used in preparation of this decision so
that O&M costs categorized as “other” in this Account (and the analogous
199 SCE-3V5 at 7-9.200 ORA-8 at 18-20.201 SCE-19V3 at 4.202 SCE-19V3 at 5-7.
- 73 -

A.13-11-003 ALJ/KD1/ar9/jt2/lil PROPOSED DECISION (Rev. 12)
Account for Transmission discussed in Section 7.9.1.1) are not escalated.
Therefore, we accept SCE’s proposal to levelize this expense and adopt SCE’s
forecast.
ORA also disputes SCE’s forecast of Miscellaneous Construction Inspection
Expenses in 588.140 based on applying SCE’s method to ORA’s capital forecast
instead of SCE’s.203 There is no dispute about methods here; therefore, we apply
SCE’s method to our adopted forecast.
SCE’s forecasts for other elements of 588.140 and all of Account 588.271 are
uncontested and are approved.
Our total adopted O&M forecast, based on the meter set forecast discussed
below, is shown in the following table (millions of 2012$).
Category Labor/Non-LaborRatio204
2015 Expenses
SCE Adopted Δ
586.140Meter Installations andReplacements
55/45 $11.492 $11.378 $0.114
Labor Allocation of Total $6.286 $6.258 $0.028
Non-Labor Allocation of Total $5.206 $5.120 $0.086
588.140
Misc. Construction InspectionExpenses
77/23 $1.154 $0.869 $0.285
Facility Inventory Mapping 83/17 $0.782 $0.782 $0
Field Accounting 94/6 $1.799 $1.799 $0
Stand-by Time 74/26 $0.707 $0.707 $0
Distribution Line Rents 100%Other
$1.943 $1.943 $0
Shop Services and Instrumentation 8/92 $0.651 $0.651 $0
203 ORA-8 at 21-23.204 SCE-3V5.
- 74 -

A.13-11-003 ALJ/KD1/ar9/jt2/lil PROPOSED DECISION (Rev. 12)
Division (SSID) OperatingExpenses
Wireless Technology Services 35/65 $0.246 $0.246 $0
Total $7.282 $6.997 $0.285
Labor Allocation of Total $3.888 $3.671 $0.217
Non-Labor Allocation of Total $1.451 $1.383 $0.068
Other Allocation of Total $1.943 $1.943 $0
588.271Productivity Benefits 100%
Non-Labor
($2.766) ($2.766) $0
Grand Total $16.005 $15.609 $0.396
Capital7.5.2.
As noted above, different meter forecasts are a key difference between
parties. ORA states that it has reviewed SCE’s forecasts and supports many of
the component forecasts. Therefore, for many components, the only difference is
the meter forecasts. TURN’s view is similar, although TURN disputes more
issues on grounds other than the meter forecast. We have also reviewed the
component forecasts that are undisputed, aside from number of meters, and find
SCE’s forecasts reasonable. Therefore, we discuss in detail only the otherwise
disputed components.
TURN claims that SCE accepts approximately $90 million of reductions
proposed by TURN to its 2014-2015 capital forecast.205 We note that this is an
exaggeration as there was no material dispute between the parties on the
methods used for two of the four issues that TURN cites.
Our adopted capital forecast for contested issues is summarized below.
205 TURN OB at 73-75 and JCE-3 at 143-150.
- 75 -

A.13-11-003 ALJ/KD1/ar9/jt2/lil PROPOSED DECISION (Rev. 1)
Line #
Category
Capital Expenditures
2014 2/ 2015 3/
SCE 4/ Adopted Δ SCE 4/ Adopted Δ
1 Residential Service Connection Costs(Nominal $) $30,008 $24,063 $5,945 $39,187 $35,961 $3,226
2 Residential Line Extension Costs (Nominal $) $28,542 $21,844 $6,697 $38,617 $34,928 $3,689
3 Residential Tract Development Costs(Nominal $) $81,260 $73,617 $7,644 $91,217 $92,480 ($1,263)
4 Residential Backbone Development Costs(Nominal $) $16,143 $14,624 $1,519 $18,121 $18,372 ($251)
Total Residential $155,953 $134,149 $21,804 $187,141 $181,740 $5,401
5 Commercial Service Connection Costs(Nominal $) $19,935 $17,195 $2,740 $26,780 $22,002 $4,778
6 Commercial Line Extension Costs (Nominal $) $37,868 $34,436 $3,432 $50,977 $44,064 $6,913
7 Commercial Tract Development Costs(Nominal $) $13,150 $11,343 $1,807 $17,719 $14,514 $3,205
Total Commercial $70,953 $62,974 $7,979 $95,476 $80,579 $14,897
8 Agricultural Service Connection Costs(Nominal $) $1,324 $842 $481 $1,367 $868 $499
9 Agricultural Line Extension Costs (Nominal $) $2,731 $3,151 ($420) $2,789 $3,247 ($458)
Total Agricultural $4,055 $3,993 $61 $4,156 $4,115 $41
10 Streetlight Service Installation Costs (Nominal$) $30,575 $23,464 $7,112 $41,403 $37,517 $3,886
11 Rule 20A Costs (Nominal $) $22,575 $22,575 $0 $23,289 $23,289 $0
12 Rule 20B Costs (Nominal $) $34,182 $27,526 $6,656 $43,206 $38,852 $4,354
13 Rule 20C Costs (Nominal $) $10,165 $8,222 $1,943 $12,930 $11,605 $1,325
- 76 -
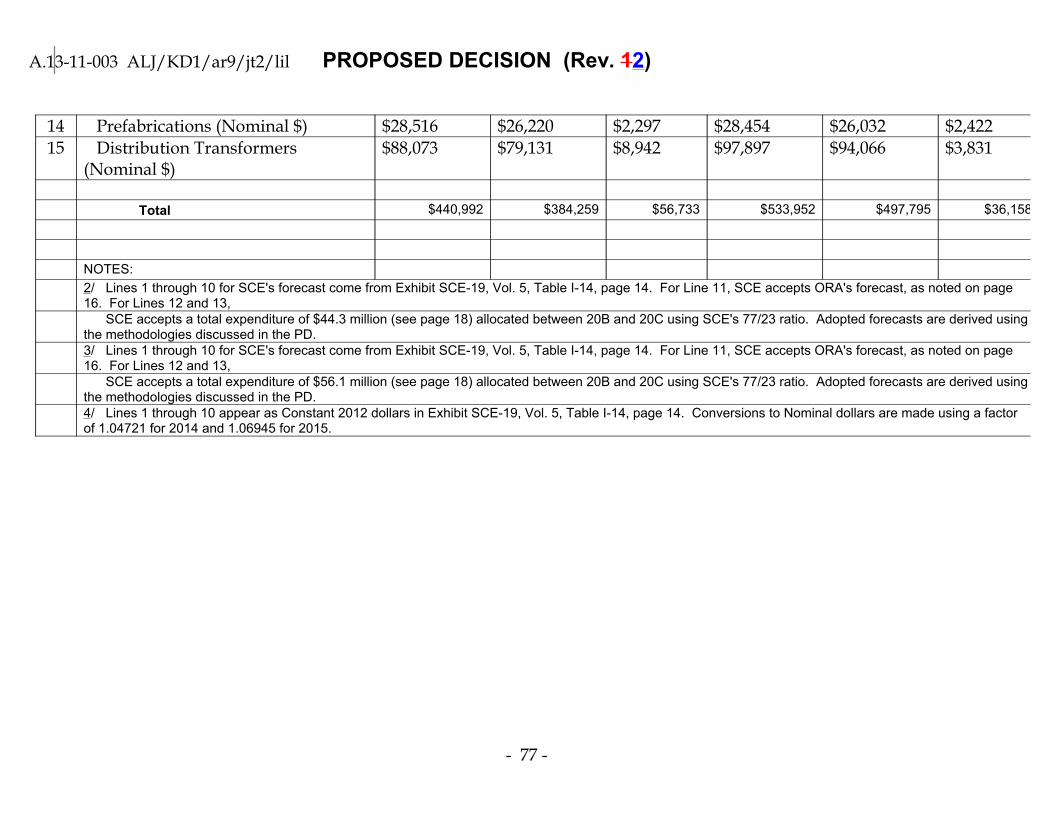
A.13-11-003 ALJ/KD1/ar9/jt2/lil PROPOSED DECISION (Rev. 12)
14 Prefabrications (Nominal $) $28,516 $26,220 $2,297 $28,454 $26,032 $2,422
15 Distribution Transformers(Nominal $)
$88,073 $79,131 $8,942 $97,897 $94,066 $3,831
Total $440,992 $384,259 $56,733 $533,952 $497,795 $36,158
NOTES:
2/ Lines 1 through 10 for SCE's forecast come from Exhibit SCE-19, Vol. 5, Table I-14, page 14. For Line 11, SCE accepts ORA's forecast, as noted on page16. For Lines 12 and 13, SCE accepts a total expenditure of $44.3 million (see page 18) allocated between 20B and 20C using SCE's 77/23 ratio. Adopted forecasts are derived usingthe methodologies discussed in the PD.3/ Lines 1 through 10 for SCE's forecast come from Exhibit SCE-19, Vol. 5, Table I-14, page 14. For Line 11, SCE accepts ORA's forecast, as noted on page16. For Lines 12 and 13, SCE accepts a total expenditure of $56.1 million (see page 18) allocated between 20B and 20C using SCE's 77/23 ratio. Adopted forecasts are derived usingthe methodologies discussed in the PD.4/ Lines 1 through 10 appear as Constant 2012 dollars in Exhibit SCE-19, Vol. 5, Table I-14, page 14. Conversions to Nominal dollars are made using a factorof 1.04721 for 2014 and 1.06945 for 2015.
- 77 -

A.13-11-003 ALJ/KD1/ar9/jt2/lil PROPOSED DECISION (Rev. 1)
Customer Meter Connections7.5.2.1.
SCE installs service connections, line extensions, and tract and backbone
development for residential customers, as well as connections and line extensions
to commercial, industrial, and agricultural customers and street light
installations. There are ten line item forecasts discussed in this category. SCE
forecasts significant growth in expenditures in this area between 2012 and 2017.
Forecasts can be summarized by the following equation:
Capital = Meters * Unit Count per Meter * Cost per Unit
Unit counts can be the number of new connections or feet of line extension,
for example. SCE generally uses five-year averages of historical data to develop
its unit costs, with the exception of agricultural service connections for which
SCE uses a four-year average. To develop its unit count forecasts, SCE typically
uses historical data and statistical analysis of the relation of number of units to
the number of new meters.206
TURN proposes to use a five-year weighted average to forecast unit costs,
as opposed to SCE’s five-year arithmetic average, resulting in some higher and
some lower forecasts relative to SCE.207 SCE notes that the difference between
these unit cost forecasts is small and requests that one approach be used
consistently for all ten forecasts.208 TURN agrees to this clarification.209 We agree
with SCE that the difference is small, but find that, all else equal, a weighted
average is likely to be less influenced by outliers and is preferable to an
206 SCE-3V5 at 21-53.207 TURN-5 at 49.208 SCE-19V5 at 13.209 TURN OB at 74.
- 78 -

A.13-11-003 ALJ/KD1/ar9/jt2/lil PROPOSED DECISION (Rev. 12)
arithmetic average. Therefore, we adopt TURN’s recommended five-year
weighted average approach.210
TURN proposes different equations to forecast the unit counts for several
of the ten line item forecasts. TURN criticizes SCE’s statistical models on various
grounds, including: use of independent variables that are not statistically
significant, overly complex regressions for the sample size, and unexplained
discontinuities.211 TURN includes excerpts from SCE’s workpapers as an
attachment to its testimony.212 SCE states that different models can be used, and
does not specifically rebut TURN’s proposals.213 We generally find that TURN’s
critiques have merit and that TURN’s models are more reasonable. Therefore,
we adopt TURN’s models for calculating unit counts, based on our adopted
meters forecast.
Underground Conversions – Rule 20A7.5.2.2.
Tariff Rule 20A allocates funding to government agencies within SCE’s
territory to underground existing distribution lines. Each government agency
may select which locations it wishes to convert to underground. Thus, SCE states
that the municipalities are the main drivers of Rule 20A spending. SCE notes that
since 2010, government agencies have approved $62 million of Rule 20A projects
and have considered $119 million more. SCE requests $31.8 million (2012$) per
year, a slight increase from 2012 authorized.214
210 Costs in the “TURN Unit Costs” column of Table I-12, pg. 12 of SCE-19V5 are used for most categories. For the agricultural categories for which no TURN Unit Cost is shown and for Commercial/Industrial Line Extensions, we calculate five year weighted average Unit Costs based on the data provided in SCE-3V5.
211 TURN-5 at 50-59.212 TURN-6, attachment 8. 213 SCE-19V5 at 12-13.214 SCE-3V5 at 56-59.
- 79 -

A.13-11-003 ALJ/KD1/ar9/jt2/lil PROPOSED DECISION (Rev. 12)
ORA recommends a $10.818 million (nominal$) “penalty” reduction to
SCE’s 2014-2015 forecasts to correct for SCE underspending relative to
authorized during 2009-2013. In its analysis, ORA cites our decision in SCE’s last
GRC that discussed historic underspending as well as the safety, reliability, and
aesthetic value of undergrounding, and encouraged SCE to “fully support”
undergrounding.215 As a result of SCE’s underspending in light of this direction,
ORA concludes that its proposed penalty is reasonable.216
SCE rejects ORA’s logic that a penalty is appropriate and notes that SCE is
not authorized to spend Rule 20A funds without requests from the government
agencies. Nevertheless, SCE accepts ORA’s forecast.217 We find reasonable and
approve ORA’s uncontested forecast.
Underground Conversions – Rules 20B7.5.2.3.and 20C
Under Rules 20B and 20C, a site-specific undergrounding conversion is
made at the request of an applicant. SCE finds a strong correlation between
conversions and residential line extensions.218 In addition to different meter
forecasts, ORA calculates a lower unit cost than SCE.219 SCE accepts ORA’s
calculated unit cost.220 TURN proposes to lower the forecast of miles of
undergrounding per meter, based on its lower forecast of residential line
extensions per meter, which we adopted in Section 7.5.2.1. above. TURN also
calculates a different unit cost based on a five-year weighted average.221 SCE
accepts TURN’s approach and unit cost.222 Accordingly, we adopt TURN’s unit
215 See D.12-11-051 at 165-166.216 ORA-11 at 60-63.217 SCE-19V5 at 16.218 SCE-3V5 at 61-63.219 ORA-11 at 66-67.220 SCE-19V5 at 17.221 TURN-5 at 62-63.222 SCE-19V5 at 17-18.
- 80 -
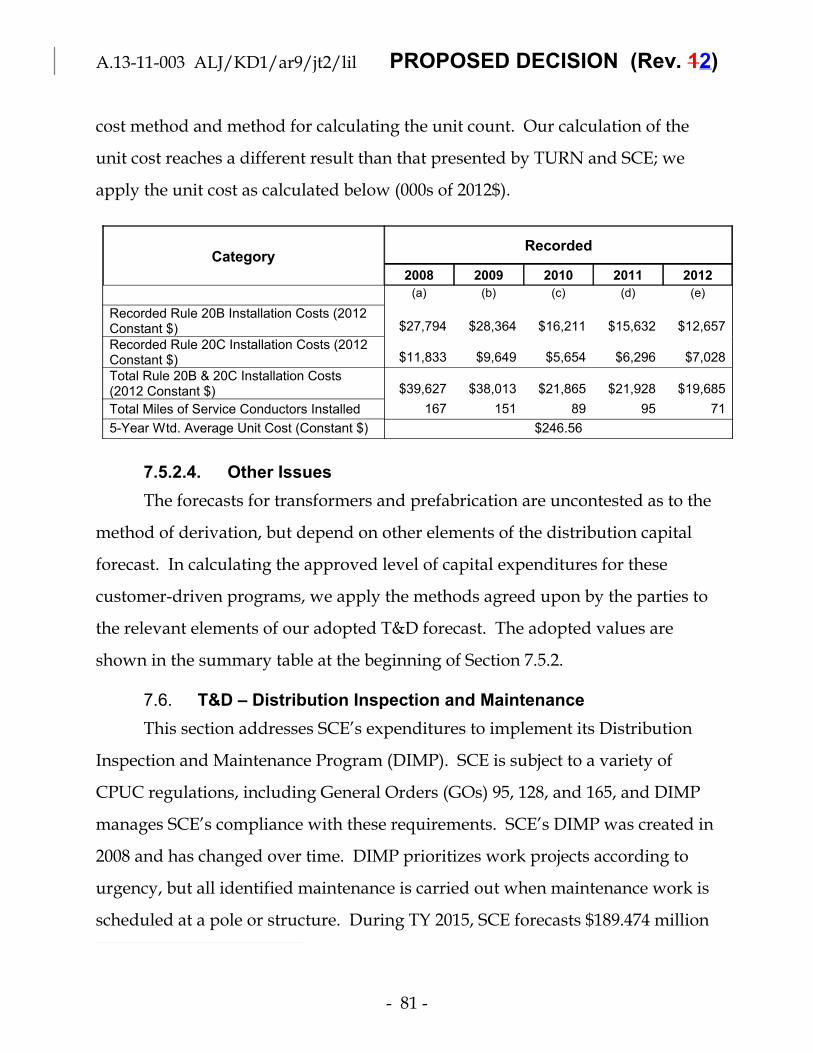
A.13-11-003 ALJ/KD1/ar9/jt2/lil PROPOSED DECISION (Rev. 12)
cost method and method for calculating the unit count. Our calculation of the
unit cost reaches a different result than that presented by TURN and SCE; we
apply the unit cost as calculated below (000s of 2012$).
CategoryRecorded
2008 2009 2010 2011 2012
(a) (b) (c) (d) (e)
Recorded Rule 20B Installation Costs (2012Constant $) $27,794 $28,364 $16,211 $15,632 $12,657
Recorded Rule 20C Installation Costs (2012Constant $) $11,833 $9,649 $5,654 $6,296 $7,028
Total Rule 20B & 20C Installation Costs(2012 Constant $) $39,627 $38,013 $21,865 $21,928 $19,685
Total Miles of Service Conductors Installed 167 151 89 95 71
5-Year Wtd. Average Unit Cost (Constant $) $246.56
Other Issues7.5.2.4.
The forecasts for transformers and prefabrication are uncontested as to the
method of derivation, but depend on other elements of the distribution capital
forecast. In calculating the approved level of capital expenditures for these
customer-driven programs, we apply the methods agreed upon by the parties to
the relevant elements of our adopted T&D forecast. The adopted values are
shown in the summary table at the beginning of Section 7.5.2.
T&D – Distribution Inspection and Maintenance7.6.
This section addresses SCE’s expenditures to implement its Distribution
Inspection and Maintenance Program (DIMP). SCE is subject to a variety of
CPUC regulations, including General Orders (GOs) 95, 128, and 165, and DIMP
manages SCE’s compliance with these requirements. SCE’s DIMP was created in
2008 and has changed over time. DIMP prioritizes work projects according to
urgency, but all identified maintenance is carried out when maintenance work is
scheduled at a pole or structure. During TY 2015, SCE forecasts $189.474 million
- 81 -

A.13-11-003 ALJ/KD1/ar9/jt2/lil PROPOSED DECISION (Rev. 12)
(2012$) in O&M and $462 million (nominal$) in capital expenditures.223 TURN
and ORA forecast significantly lower values.
Underground Structure Rehabilitation Program7.6.1.
This program inspects, repairs, and replaces underground structures. The
primary underground structures are vaults, which typically contain energized
equipment, and manholes, which typically contain spliced cable, but not
equipment. GO 165 requires inspections of underground equipment, but SCE
also inspects underground structures without equipment. SCE’s inspectors
perform Underground Detailed Inspections (UDI), and structural engineers
perform follow-up Field Investigations, if warranted. The Field Investigation
determines whether the failing structure will be repaired or replaced. SCE bases
its forecasts on a mix of historic and expected inspection, investigation, failure,
replacement, and repair rates. For example, SCE expects the 2012 recorded rate
of inspected structures found to be deteriorated (7.76%) to decline to 4%.
Historically, 39% of vaults that receive a field investigation have resulted in
replacements, with repairs to the remaining 61%.224 SCE explains that
underground structure failures, one of the ten risk statements SCE identified in
its supplemental testimony, are unpredictable and a hazard both to employees
and the public. A failure may lead to injury, property damage or outage. For
example, violent equipment failure in the confined space of a vault poses
substantial danger when the energy released by the equipment failure damages
the vault structure, causing surface cave-ins, and ejection of vault lids and debris.
These types of failures can result in injuries to pedestrians and traffic accidents.
Similarly, the risk to workers is greatly increased if a vault structure has
deteriorated and/or water has seeped into a vault. SCE states that structures
223 SCE OB at 93-94 and SCE-3V6P1(A) at 1-4.224 SCE-3V6P1 at 27-28.
- 82 -

A.13-11-003 ALJ/KD1/ar9/jt2/lil PROPOSED DECISION (Rev. 12)
without equipment pose similar risks to structures with equipment.225 SCE’s total
O&M forecast of $22.834 million is summarized below (2012$, millions):226
Account 583.120 583.120 593.120
Activity Underground DetailInspection (UDI)
FieldInvestigations
Underground StructuresRepair and Shoring
Labor 4.389 0.134 1.669
Non-Labor
1.036 0.642 14.964
Total 5.425 0.776 16.633
Basis Forecast UDI * LYRunit cost
Forecastinvestigations *unit cost
Repairs and shorings * unitcost, average of 2015-2017
For capital, SCE forecasts replacing approximately 200 vaults per year at a
cost of $300,000 each and up to 20 manholes per year at $150,000 each. The total
capital forecast is (nominal$, millions):227
2014 2015
70.687 72.188
ORA recommends $6.963 million for O&M in Account 593.120 based on
LRY, noting that this is the highest recorded year and claiming SCE has not
justified the 139% proposed increase. ORA does not address Account 583.120.228
For capital, ORA recommends that 2013 recorded ($43.2 million, nominal) be
allowed, and adjusted for inflation for each of 2014 and 2015. ORA claims that
SCE’s forecast assumes that certain vaults and manholes will be unnecessarily
inspected multiple times in 2012-17, suggesting that SCE’s forecast number of
replacements is too high. Further, ORA argues that SCE’s reliance on 2012 unit
replacement costs is inappropriate because economies of scale will decrease unit
225 SCE-15 at 32-34. 226 SCE-3V6P1 at 13, 27-33, and 54-55.227 SCE-3V6P1 at 34-35.228 ORA-9 at 19-21.
- 83 -

A.13-11-003 ALJ/KD1/ar9/jt2/lil PROPOSED DECISION (Rev. 12)
costs. Anecdotally, ORA claims the engineering report for a specific replaced
vault recommended repair rather than replacement.229
TURN devotes an entire exhibit to this program. TURN notes that SCE
proposes a ten-fold increase in capital expenditures relative to the 2008-2012
average and argues that SCE has not justified this increase. TURN’s primary
critique of SCE’s proposal is that SCE has not adequately justified the proposed
7.8% failure rate assumption, noting that the historical experience of this high
failure rate is limited to 2012 and that previous years were much lower. TURN
hypothesizes that a change in the failure criteria, unexplained and
unacknowledged by SCE, may drive the change. TURN also notes that the
proportion of replacements among failing structures is increasing (39%, up from
25% in the 2012 GRC). TURN accepts SCE’s unit cost forecasts. TURN proposes
$7.807 million in O&M (Account 593.120, Underground Structures Repair and
Shoring) to repair up to 150 vaults per year and up to 137 manholes230 and $33
million in capital to replace 100 vaults for the test year.231
In rebuttal, SCE claims that the increase in failure rate from 2009 to 2012
was driven by the program reaching maturity and that 2013 recorded data is
consistent with SCE’s forecast. Further, SCE calculates that the ORA and TURN
proposals would not allow for SCE to complete replacements identified by the
end of 2013 during the 2014 to 2017 time period. SCE disagrees with ORA’s
prediction that economies of scale will drive down unit costs, citing the
complexity of the projects.232
We
229 ORA-12 at 18-19. 230 TURN’s manhole repair forecast is 53 in 2015, and 137 in each of the attrition years. The
dollar value is normalized. 231 TURN-16 at 18-19. 232 SCE-19V6P1 at 16-24.
- 84 -

A.13-11-003 ALJ/KD1/ar9/jt2/lil PROPOSED DECISION (Rev. 12)
adopt a limited
reduction to
SCE’s request.
We agree with
TURN that
SCE’s
explanation of
the increased
failure rate is
inadequate to
justify the
increase in
costs. SCE has
provided little
detail on what
changes
occurred
leading up to
2012 that
would explain
the increase in
failure rate
beyond the
vague claim of
the program
reaching
- 85 -
A.13-11-003 ALJ/KD1/ar9/jt2/lil PROPOSED DECISION (Rev. 12)
maturity. The
specifically
identified
changes
(structural
engineers
performing
Field
Investigations,
inspecting
structures
without
equipment) are
unlikely to
explain the
entire increase.
We also agree
with ORA that
it is reasonable
to anticipate
some
reduction in
unit costs for
repair and
replacement,
but the record
- 86 -

A.13-11-003 ALJ/KD1/ar9/jt2/lil PROPOSED DECISION (Rev. 12)
in this
proceeding
does not allow
us to quantify
that reduction.
Nevertheless,
we take SCE’s
point that
there is a
considerable
queue of
structures
identified for
replacement.
Allowing these
replacement
projects to
remain
uncompleted
indefinitely
poses a safety
risk that must
be balanced
against the
costs of the
program.
- 87 -

A.13-11-003 ALJ/KD1/ar9/jt2/lil PROPOSED DECISION (Rev. 12)
Accordingly,
we adopt small
reductions to
SCE’s forecast.
We accept
SCE’s forecast
for the UDI
and Field
Investigation
components of
Account
583.120 and
reduce SCE’s
forecasts for
the
underground
structure
repair portion
of Account
593.120 and
capital
expenditures
for 2014 and
2015 by 20%
each. This
reduction
- 88 -
A.13-11-003 ALJ/KD1/ar9/jt2/lil PROPOSED DECISION (Rev. 12)
anticipates
some decrease
in the failure
rate and gives
SCE an
incentive to
achieve unit
cost
reductions. At
SCE’s
proposed unit
costs, this level
of capital
funding allows
SCE to replace
all vaults and
manholes
currently in
the queue
within
approximately
3.4 years, if no
future failures
were
- 89 -
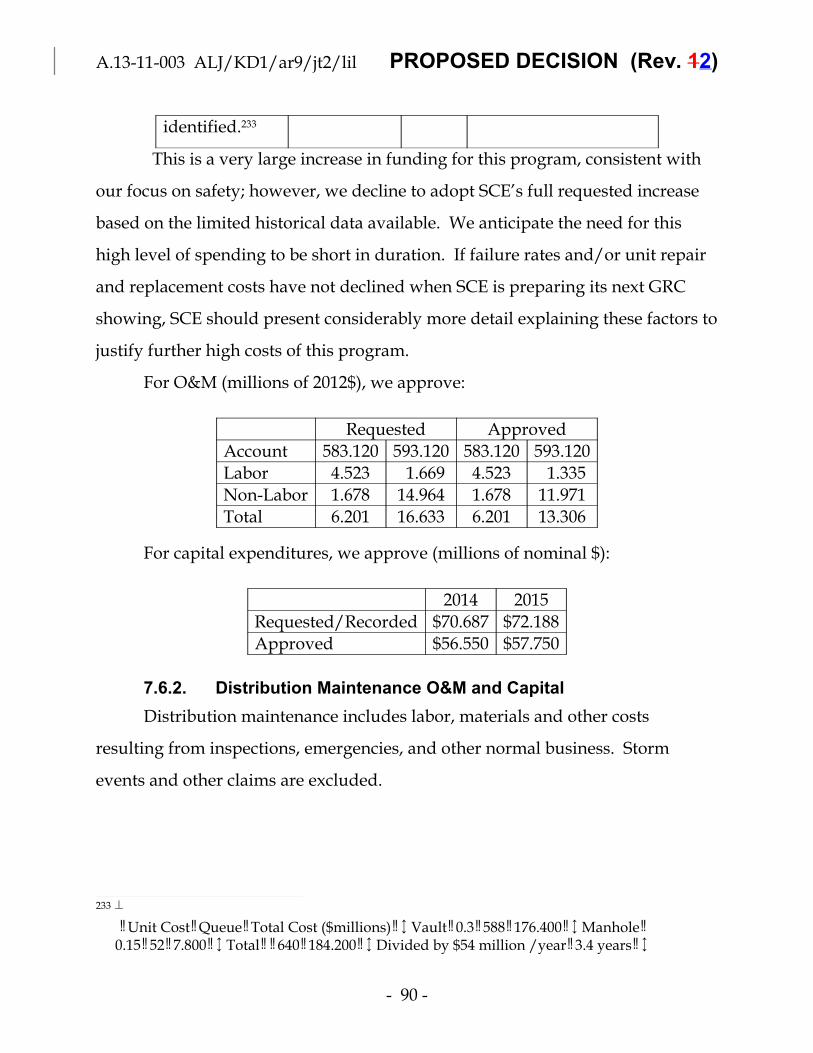
A.13-11-003 ALJ/KD1/ar9/jt2/lil PROPOSED DECISION (Rev. 12)
identified.233
This is a very large increase in funding for this program, consistent with
our focus on safety; however, we decline to adopt SCE’s full requested increase
based on the limited historical data available. We anticipate the need for this
high level of spending to be short in duration. If failure rates and/or unit repair
and replacement costs have not declined when SCE is preparing its next GRC
showing, SCE should present considerably more detail explaining these factors to
justify further high costs of this program.
For O&M (millions of 2012$), we approve:
Requested Approved
Account 583.120 593.120 583.120 593.120
Labor 4.523 1.669 4.523 1.335
Non-Labor 1.678 14.964 1.678 11.971
Total 6.201 16.633 6.201 13.306
For capital expenditures, we approve (millions of nominal $):
2014 2015
Requested/Recorded $70.687 $72.188
Approved $56.550 $57.750
Distribution Maintenance O&M and Capital7.6.2.
Distribution maintenance includes labor, materials and other costs
resulting from inspections, emergencies, and other normal business. Storm
events and other claims are excluded.
233 �� � � �� � � � �� �Unit Cost Queue Total Cost ($millions) Vault 0.3 588 176.400 Manhole
� � �� �� � �� � ��0.15 52 7.800 Total 640 184.200 Divided by $54 million /year 3.4 years
- 90 -
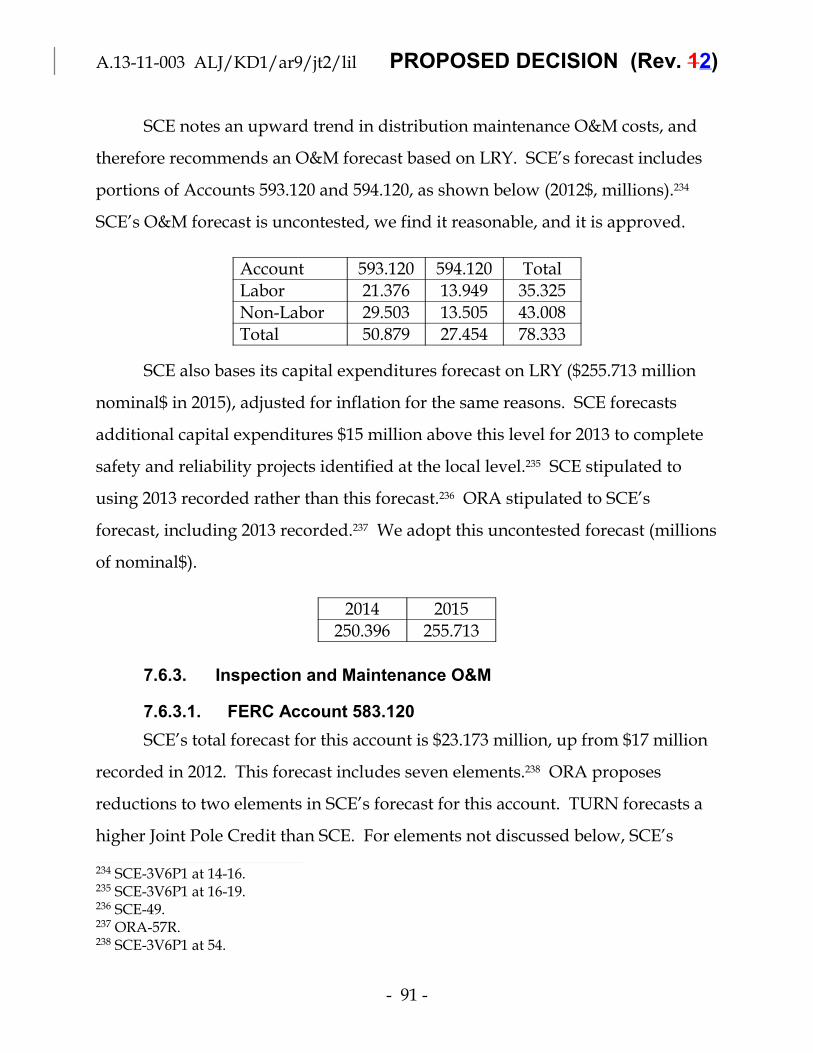
A.13-11-003 ALJ/KD1/ar9/jt2/lil PROPOSED DECISION (Rev. 12)
SCE notes an upward trend in distribution maintenance O&M costs, and
therefore recommends an O&M forecast based on LRY. SCE’s forecast includes
portions of Accounts 593.120 and 594.120, as shown below (2012$, millions).234
SCE’s O&M forecast is uncontested, we find it reasonable, and it is approved.
Account 593.120 594.120 Total
Labor 21.376 13.949 35.325
Non-Labor 29.503 13.505 43.008
Total 50.879 27.454 78.333
SCE also bases its capital expenditures forecast on LRY ($255.713 million
nominal$ in 2015), adjusted for inflation for the same reasons. SCE forecasts
additional capital expenditures $15 million above this level for 2013 to complete
safety and reliability projects identified at the local level.235 SCE stipulated to
using 2013 recorded rather than this forecast.236 ORA stipulated to SCE’s
forecast, including 2013 recorded.237 We adopt this uncontested forecast (millions
of nominal$).
2014 2015
250.396 255.713
Inspection and Maintenance O&M7.6.3.
FERC Account 583.1207.6.3.1.
SCE’s total forecast for this account is $23.173 million, up from $17 million
recorded in 2012. This forecast includes seven elements.238 ORA proposes
reductions to two elements in SCE’s forecast for this account. TURN forecasts a
higher Joint Pole Credit than SCE. For elements not discussed below, SCE’s
234 SCE-3V6P1 at 14-16.235 SCE-3V6P1 at 16-19.236 SCE-49.237 ORA-57R.238 SCE-3V6P1 at 54.
- 91 -

A.13-11-003 ALJ/KD1/ar9/jt2/lil PROPOSED DECISION (Rev. 12)
forecast is uncontested and is adopted. A summary of the adopted forecast is
shown below (2012$, millions).
FERC Account 583.120 Requested Adjustments Adopted
Labor 13.053 13.053
Non-Labor 10.120 -1.913 8.207
Total 23.173 -1.913 21.260
Overhead Detail Inspections (ODI)7.6.3.1.1.
The purpose of an ODI is to evaluate SCE’s equipment for hazardous
conditions, determine corrective action, perform minor repairs, and document
findings. GO 165 requires inspections of overhead equipment every five years.
Beginning in 2013, SCE requires inspectors to gain access to every pole to
complete the inspection. SCE believes this change improves safety. SCE
forecasts $7.750 million for this program, or $29 per pole inspected. The cost per
pole increased “due to changes in work methods and accounting practices” in
2012; further increases in 2013 are driven by the new access requirement.239
ORA bases its forecast of $5.239 million on 2012 recorded costs, noting that
this is the highest recorded year and claiming SCE’s requested 48% increase is
not justified. ORA claims that SCE has provided no detail on the costs associated
with reaching backyard poles.240
SCE argues that the difficult-to-access poles activity is a new program that
is not included in recorded costs, and that it has experience with similar
programs. SCE also points to its workpapers, which include a forecast of the
difficult-to-access poles.241
239 SCE-3V6P1 at 10-12; SCE-19V6P1 at 3-5. 240 ORA-9 at 12-13. 241 SCE-19V6P1 at 6-7.
- 92 -

A.13-11-003 ALJ/KD1/ar9/jt2/lil PROPOSED DECISION (Rev. 12)
SCE’s new emphasis on accessing all poles is appropriate, and SCE has put
forward a credible estimate of the additional cost to reach difficult-to-access
poles. We find SCE’s forecast reasonable and adopt it (2012$, millions).
Labor 4,295
Non-Labor 3,455
Total 7,750
Distribution Intrusive Pole Inspections7.6.3.1.2.
GO 165 requires a continuing 20-year cycle of intrusive242 pole inspections
for all poles over 25 years old; SCE completed its first cycle in 2007. In 2009, SCE
began a transition to a grid-based inspection program in order to increase
consistency in activities year to year and improve efficiency. In 2009, SCE also
began a transition to a ten-year inspection cycle, as later approved in the 2012
GRC;243 SCE performs visual inspections on poles that will not be due for an
intrusive inspection until the next cycle. This ten-year cycle requires that about
130,000 poles (10% of the total) be inspected each year. SCE argues that the
number of inspections was too low in 2011-2012, and plans to inspect more poles
in 2013-2015. Since contractors perform the inspections, most costs are non-labor;
contract rates vary with the type of inspection. SCE bases its forecast on number
of poles, mix of inspection types, the rate for each type, and the 2012 labor to
non-labor ratio. SCE’s total forecast is $7.000 million, at $47 per inspection.244
ORA forecasts $5.502 million, arguing SCE’s requested 123% increase is not
justified. ORA contends that SCE has not explained why it did not spend as
much as authorized in some prior years. ORA claims that its forecast is more
242 Meaning that the internal integrity of the pole is evaluated.243 D.12-11-051 at 180.244 SCE-3V6P1 at 37-40.
- 93 -

A.13-11-003 ALJ/KD1/ar9/jt2/lil PROPOSED DECISION (Rev. 12)
than 2012 recorded and that SCE “should also have embedded funding that can
be reallocated back to this account.”245
SCE claims that it “caught back up” on inspections in 2013, completing
170,613, and has approximately maintained the target ten-year average
(2009-2013 average of 127,292).
SCE claims that ORA’s forecast is based on a four-year average
(2009-2012), and thus represents only 116,462 inspections per year -- not enough
to maintain the ten-year cycle. SCE further contends that inspecting fewer poles
will increase unit costs because SCE would still be required to inspect many poles
for compliance, outside of the grid areas funded by ORA’s proposal. SCE
concludes that under ORA’s proposal, 112,110 poles would be inspected at a
unity cost of $49.246
We support SCE’s ten-year, grid-based cycle as a reasonable approach to
reduce risk and reduce unit costs. In order for SCE to complete the transition to
grid-based inspections, it is necessary to inspect more poles than would be
possible under ORA’s forecast. We adopt SCE’s forecast.
Joint Pole Expenses and Credits7.6.3.1.3.
The Joint Pole Organization (JPO) manages the poles that SCE shares with
other utilities. SCE forecasts $3.287 million in expenses for the JPO based on LRY
with 90% of that to labor.247 No party contests this forecast and we find it
reasonable.
JPO also receives expense credits from other utilities based on three
activities: inspections, maintenance, and penalties for unauthorized use of
SCE-owned poles. SCE’s total forecast of credits is $2.087 million, 100%
245 ORA-9 at 15-17. 246 SCE-19V6P1 at 31-32.247 SCE-03V6P1A at 47-48.
- 94 -
A.13-11-003 ALJ/KD1/ar9/jt2/lil PROPOSED DECISION (Rev. 12)
non-labor, based on: a 5YA of unit credits for inspections, LRY for maintenance,
and LRY for penalty credits.248
TURN argues that JPO credits are too low. TURN argues that SCE’s credit
per inspection ($8) should be $16 (=$47/pole*50% cost share *70% portion of joint
poles), and therefore recommends an increase of $1.3 million for inspection
credits. Similarly, TURN contends that maintenance credits related to vegetation
clearing are too low, and calculates $1.5 million/year (=118,084 poles x $52/pole
* 50%/2 years). Further, TURN claims that SCE is under-collecting credits from
joint owners and suggests that credits flow through the Pole Replacement
Program Balancing Account and that additional reporting on credits should be
required. Finally, TURN proposes that forecast penalties should be quadrupled
to $1.5 million on the grounds that SCE’s planned maintenance, inspection, and
replacement activities in this GRC cycle will reveal more unauthorized pole
attachments. TURN’s proposed increases total $3.4 million.249
SCE claims TURN’s assumptions are incorrect. First, SCE clarifies that 70%
of poles are joint use, not necessarily jointly owned and that renters do not pay
for inspections and that TURN’s assumptions do not accurately reflect agreed
payments among pole owners. SCE argues that TURN’s inference that SCE
under-collects for inspections is incorrect, noting that the number of invoices is
not the same as the number of poles billed. SCE disputes TURN’s assumption
that vegetation is cleared every two years. SCE argues there is no link between
pole replacements and penalty credits. Generally, SCE argues its forecasts based
on recorded data are more reasonable than TURN’s assumptions and
calculations.250
248 SCE-03V6P1A at 48-50. 249 TURN-20 at 35-40.250 SCE-19V6P1 at 34-36.
- 95 -

A.13-11-003 ALJ/KD1/ar9/jt2/lil PROPOSED DECISION (Rev. 12)
While SCE has challenged TURN’s assumptions, it has not proposed clear
alternatives, such as for the portion of jointly owned poles. Clearly identifying
correct numbers for these assumptions would advance SCE’s case and
demonstrate that it is not under-collecting. Further, SCE overstates the
connection between TURN’s proposed penalty increase and pole replacements.
Above, we adopt SCE’s proposals for increased inspections, and find it
reasonable to infer that these inspections are likely to increase the number of
unauthorized attachments identified. In order to reflect this likely increase in
penalties and encourage SCE to ensure it is not under-collecting maintenance and
inspection credits, we adopt a modest increase to SCE’s total joint pole credit
forecast to $4 million.
TURN also proposes that we initiate a review of the rates for pole credits.
TURN expresses concern that SCE ratepayers may bear more than their share of
the cost and risk of pole maintenance and activities.251 SCE replies that TURN is
conflating renters and joint owners, and notes that rental rates under mandatory
access are set by statute. SCE recommends R.14-05-001 as a more appropriate
venue for this subject.252 From the record before us in this proceeding, it is
impossible to reach detailed conclusions about this issue here. Therefore, we
agree with TURN that a review is worthwhile. SCE shall undertake such a
review and present information in its next GRC on its efforts to ensure that SCE
ratepayers are not unduly subsidizing other companies’ use of jointly owned
poles. In this review, SCE should include descriptive information on the number
of joint owned and rented poles and cost sharing in each case. SCE should
coordinate this review with its review of capital costs discussed in Section
7.7.3.1.3 below.
251 TURN OB at 96-98.252 SCE RB at 57-58.
- 96 -

A.13-11-003 ALJ/KD1/ar9/jt2/lil PROPOSED DECISION (Rev. 12)
FERC Accounts 593.120 & 594.1207.6.3.2.
SCE’s total forecast for Account 593.120 is $139 million, up from $124
million recorded in 2012; for 594.120 SCE forecasts $27 million, which is the same
as 2012 recorded.253 Most elements of these accounts are uncontested, and we
find SCE’s forecast reasonable. ORA contests the new overhead conductor
program based on a perceived lack of evidence.
SCE claims that the overhead conductor program will evaluate the entire
overhead distribution system in seven years (beginning late 2013) to mitigate
conductor failure risk and improve public safety. SCE’s forecast of $4.360 million
(86% labor) is based on inspecting conductors associated with 206,000 poles per
year and its assumptions about the number of remediation activities to splices
and connectors. SCE contends it is advisable to perform analysis of this type and
plan for mitigation as opposed to simply beginning to reconductor all lines.254
ORA forecasts $1.453 based on its “normalized” version of SCE’s forecast.
ORA considers SCE’s support for the program lacking, and cites the lack of
historical data.255
ORA does not appear to dispute the specific assumptions underlying SCE’s
cost forecast or SCE’s rationale for the overhead conductor program. We find
SCE’s rationale for the program and its cost forecast reasonable. No other
elements of these two FERC accounts are disputed, and we approve SCE’s
forecasts for Accounts 593.120 and 594.120.
SCE proposes to transition its Bark Beetle-related vegetation management
expenses from the Catastrophic Event Memorandum Account (CEMA) to base
253 SCE-3V6P1 at 55-56. 254 SCE-3V6P1 at 35-36; SCE-15 at 20. 255 ORA-9 at 21-24.
- 97 -

A.13-11-003 ALJ/KD1/ar9/jt2/lil PROPOSED DECISION (Rev. 12)
rates and close the Bark Beetle CEMA because these costs have stabilized. No
party opposes the change, and we approve this request.
Poles – Capital Expenditures7.6.4.
In this section, we address various pole-related capital expenditure issues.
Some of these subjects are inter-related with the Pole Loading Program (PLP) that
is discussed in detail in section 7.7 below.
Pole Replacement Unit Cost7.6.4.1.
SCE uses 2012 recorded data as the basis of its unit costs for all pole
replacements (deteriorated pole, aged pole, and PLP). In constant 2012$, SCE
forecasts $12,130 for each distribution pole and $19,800 for each transmission
pole.256 ORA supports these forecasts.257 A different ORA witness appears to
have made a three-year average calculation of unit costs, but does not provide
details.258 SCE alleges that the second witness’s calculation is not correct because
it relies on nominal dollars.259 TURN contests SCE’s unit costs, noting that some
cost components increased much faster than inflation between 2009 and 2012.
TURN notes that the largest increase is contractor costs ($1,820 from 2011 to 2012
for transmission), which is only partly offset by a decline in labor costs. TURN
submits that SCE must “do better containing these costs” and should consider
using more employee labor and less contractor labor given the 12-year PLP.
TURN recommends using four-year averages: $11,288 for distribution (11% real
increase relative to 2009), and $18,272 for transmission (16%) (2012$). Relative to
SCE’s proposal, TURN’s forecast is a 7% reduction for distribution and 6% for
transmission.260 In rebuttal, SCE maintains that 2012 recorded costs “reflect the
256 SCE-3V6P2 at 26-27, SCE-3V6P1 at 46-47. 257 ORA-11 at 80.258 ORA-12 at 11.259 SCE-19V6P1 at 39.260 TURN-20 at 7-8.
- 98 -

A.13-11-003 ALJ/KD1/ar9/jt2/lil PROPOSED DECISION (Rev. 12)
most recent mix of tasks required for pole replacements” and are therefore the
best forecast of future costs.261 SCE’s rebuttal does not address TURN’s
fundamental point that SCE has not adequately justified the rate of cost increases
or shown that it is taking appropriate steps to control costs. Nevertheless, SCE’s
proposal is consistent with our guidance to use LRY when there is a clear trend in
historical data. In order to give SCE an incentive to contain the unit costs, we
adopt a 3% reduction to SCE’s unit costs for both transmission and distribution
pole replacements. This forecast is summarized below (2012$).
2012Recorded
SCEforecast
TURNforecast
Adopted
Distribution 12,123 12,130 11,288 11,766
Transmission 19,436 19,800 18,272 19,206
Converted to nominal dollars, the adopted forecast of pole replacement
unit costs is:
2014 2015
Distribution 12,322 12,583
Transmission 19,956 20,486
Separately, TURN contends that SCE miscounts the cost of removal of
jointly owned poles.262 SCE shows that its forecast is based on the recorded,
average costs actually incurred by SCE, net of joint pole credits.263 Thus, SCE’s
forecast does not double count in this way, and we make no change on this basis.
Deteriorated Pole Replacements7.6.4.2.
The Deteriorated Pole Replacements are based on inspection programs
described above in Section 7.6.3. We approved SCE’s forecasts for both ODI and
intrusive inspections.
261 SCE-19V6P1 at 44. 262 TURN-20 at 16-18.263 SCE-19V6P1 at 40-42.
- 99 -

A.13-11-003 ALJ/KD1/ar9/jt2/lil PROPOSED DECISION (Rev. 12)
SCE describes the following priority ratings based on the inspections, the
number of poles to be replaced each year is determined by the “due date” for
replacements from poles failing inspection.
Priority 1 if the pole needs to be replaced within 72 hours of1.inspection
Priority 2A, if the pole needs to be replaced within one year of2.inspection
Priority 2B, if it needs to be replaced within two years of3.inspection
Priority 2C, if it needs to be replaced within three years of4.inspection
SCE’s unit forecast is summarized below.264
(# of poles) 2014 2015
Distribution 6,100 6,602
Transmission 1,500 1,500
ORA recommends 8,670 distribution pole replacements per year, based on
the 2010-2012 average and 667 transmission poles per year based on a 2009-2011
average. ORA notes that the SCE’s proposed rate of distribution pole
replacements is lower than the historical average that ORA recommends.265
TURN recommends a 3% reduction in the number of poles replaced, due
to its calculation of the likely overlap between PLP and deteriorated pole
replacements.266
SCE suggests that TURN is double-counting the overlap because
deteriorated pole replacement estimates were included in the forecast of other
264 SCE-3V6P1 at 40-43.265 ORA-12 at 11 and 16.266 TURN-20 at 32-34.
- 100 -
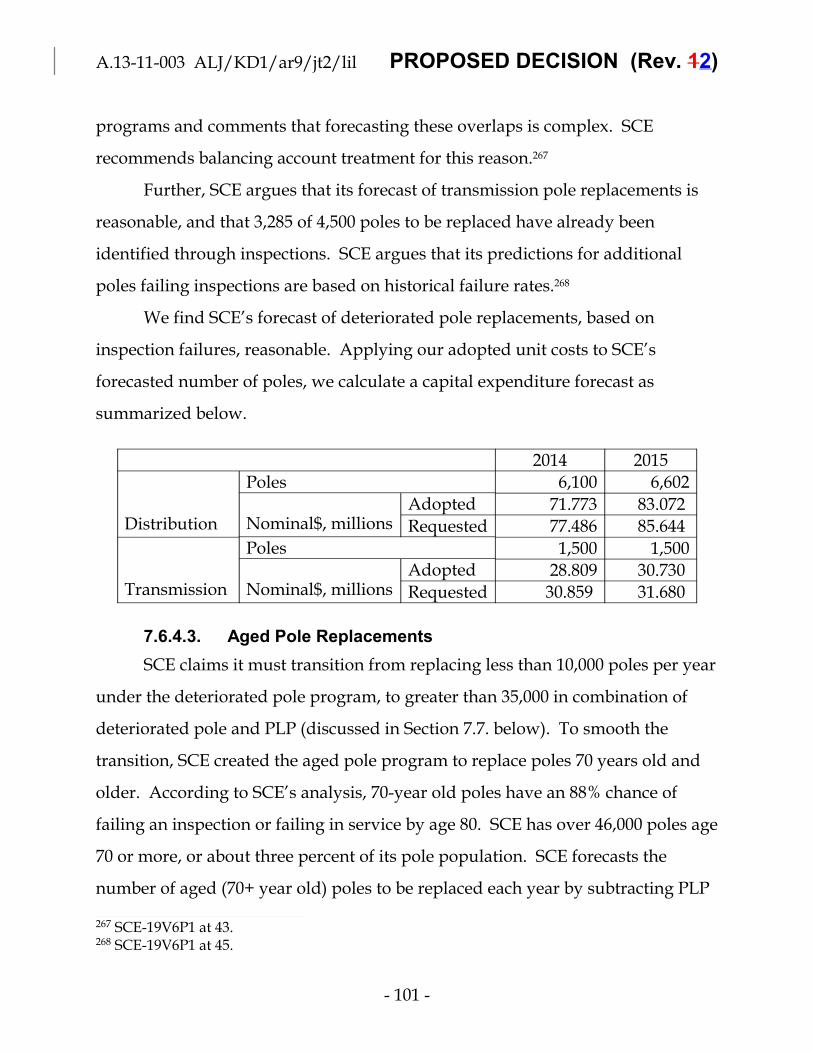
A.13-11-003 ALJ/KD1/ar9/jt2/lil PROPOSED DECISION (Rev. 12)
programs and comments that forecasting these overlaps is complex. SCE
recommends balancing account treatment for this reason.267
Further, SCE argues that its forecast of transmission pole replacements is
reasonable, and that 3,285 of 4,500 poles to be replaced have already been
identified through inspections. SCE argues that its predictions for additional
poles failing inspections are based on historical failure rates.268
We find SCE’s forecast of deteriorated pole replacements, based on
inspection failures, reasonable. Applying our adopted unit costs to SCE’s
forecasted number of poles, we calculate a capital expenditure forecast as
summarized below.
2014 2015
Distribution
Poles 6,100 6,602
Nominal$, millionsAdopted 71.773 83.072
Requested 77.486 85.644
Transmission
Poles 1,500 1,500
Nominal$, millionsAdopted 28.809 30.730
Requested 30.859 31.680
Aged Pole Replacements7.6.4.3.
SCE claims it must transition from replacing less than 10,000 poles per year
under the deteriorated pole program, to greater than 35,000 in combination of
deteriorated pole and PLP (discussed in Section 7.7. below). To smooth the
transition, SCE created the aged pole program to replace poles 70 years old and
older. According to SCE’s analysis, 70-year old poles have an 88% chance of
failing an inspection or failing in service by age 80. SCE has over 46,000 poles age
70 or more, or about three percent of its pole population. SCE forecasts the
number of aged (70+ year old) poles to be replaced each year by subtracting PLP
267 SCE-19V6P1 at 43.268 SCE-19V6P1 at 45.
- 101 -

A.13-11-003 ALJ/KD1/ar9/jt2/lil PROPOSED DECISION (Rev. 12)
and deteriorated pole replacements from its target number of total pole
replacements. SCE forecasts 14,500 aged pole replacements in 2014 and 1,898 in
2015.269
ORA opposes the aged pole program, noting that it has not previously
been authorized by the Commission. ORA claims that the poles studied by SCE
to analyze aged poles were installed between 1951 and 1960, and thus will not
begin turning 70 until 2021. ORA claims that SCE’s GO 165 reports do not
support SCE’s calculated 88% failure rate. ORA concludes that this program is
not supported by engineering data and should be denied.270
TURN “strongly opposes this expenditure as unnecessary and imprudent,
shortening the life of poles that are otherwise meeting inspections and
functioning adequately.” TURN notes that 2013 aged pole replacements were
lower than forecast because SCE prioritized other pole replacements. TURN
claims the PLP pilot study shows “roughly the same” failure rates for poles
under and over age 70. TURN submits that poles that have passed their last
inspection should not be “presumed” to need replacement. TURN observes that
newer poles appear to have shorter mean time to failure than older poles, and
hypothesizes that mean time to failure in SCE’s data is driven by pole
inspections, and that many poles “failed” after the inception of GO 165 and the
resulting inspection program in 1997. TURN generally questions the data and
conclusions of SCE’s analysis. TURN comments that if we find a need to ramp
up pole replacements, we should address high priority work, namely
deteriorated poles or overloaded poles.271
269 SCE-3V6P1 at 43-47.270 ORA-12 at 11-16.271 TURN-20 at 40-44.
- 102 -

A.13-11-003 ALJ/KD1/ar9/jt2/lil PROPOSED DECISION (Rev. 12)
CUE contends that SCE’s proposal is too slow and too short in duration
because it would leave aged poles on the system. Consequently, CUE proposes
that SCE continue the aged pole replacement program through 2017 at a slower
rate than SCE proposes for 2013-2014.272
In rebuttal, SCE argues that statistical analysis supports the Aged Pole
replacements and analogizes this program to the infrastructure replacement
programs discussed in Section 7.4 above. SCE claims that ORA mischaracterizes
statistical data. SCE states that the average inspection failure rate for aged poles
is over 25% for twelve years, and that its statistical models (only including
vintages in the data set) show annual failure rate of 3.8% per year for poles age 60
and over. Further, SCE argues that this same data273 shows that aged poles are
approximately twice as likely to fail inspections as younger poles, on average.
SCE rejects TURN’s argument about the relation between inspection counts and
failed inspections, noting that an inspection not completed cannot result in a
failure. SCE replaced 5,330 poles in 2013 and states that, at the time of rebuttal
testimony, it was on schedule to meet its forecast of 14,500 aged pole
replacements in 2014. SCE concludes that TURN and ORA recommendations to
disallow aged pole expenditures are confiscatory because the new poles are used
and useful.274
The fact that the new poles provide service to ratepayers and are used and
useful is insufficient to prove that the expenditures to purchase and install the
poles should be recovered from rates. That question turns on the prudency of the
investment decision.
272 CUE-1 at 7-13. 273 See: SCE-19V6P2 at A-32.274 SCE-19V6P2 at 50-56.
- 103 -

A.13-11-003 ALJ/KD1/ar9/jt2/lil PROPOSED DECISION (Rev. 12)
SCE apparently misunderstands TURN’s argument that the new (in 1997)
GO 165 inspection program led to a temporary increase in inspection failures.
The point is not that failure counts were higher in years with high inspection
counts; the point is that failure rates are much lower beginning in 2009, after poles
were being inspected for the second time under the new program. SCE’s data
clearly shows lower failure rates for all poles (both aged and non-aged) that are
much lower in 2009 and beyond than in 2008 and earlier.
Another key argument SCE makes in support of the aged program is that it
is necessary to “ramp-up” replacement rates to minimize execution risk of the
considerably higher volumes of pole replacements it forecasts for the PLP. As
discussed in Section 7.7.3.1.3 below, we partly approve SCE’s PLP forecast and
make a significant reduction to the number of pole replacements in PLP. This
reduction in turn reduces the need for aged pole replacements as a “ramp-up”
program.
We support SCE’s goal of reducing the risk of an in-service pole failure.
However, SCE has not demonstrated that the aged pole replacements are
prudent, at the level requested. For instance, SCE has not presented any
cost-benefit analysis relative to alternative approaches to aged poles, such as
higher frequency of inspections for aged poles or pole reinforcements. As
discussed in Section 7.4 above, infrastructure replacement may be appropriate in
circumstances of limited effective testing options; SCE has not demonstrated this
circumstance in the case of the aged pole replacements.
In order to balance these varying factors, we approve 9,000 aged pole
replacements in 2014 and zero in 2015. This level provides a reasonable ramp up
in 2014 toward the approved level of pole replacements for PLP in 2015, making
2014 approximately a mid-point between 2013 and 2015 levels. Moreover, this
- 104 -

A.13-11-003 ALJ/KD1/ar9/jt2/lil PROPOSED DECISION (Rev. 12)
aged pole funding level recognizes that a portion of the aged poles actually
replaced by SCE in 2014 are in fact providing value to ratepayers because some of
the replaced poles may have otherwise failed in service. However, we also
recognize that another portion of these new poles replaced existing poles that
could have continued to serve ratepayers for years to come.
For context of the ramp-up effect, our approved pole replacements are
shown below.
2008 2009 2010 2011 2012 2013 2014 2015
Deteriorated 9,354 8,291 7,194 8,399 8,794 7,500 7,600 8,102
Aged 5,330 9,000 -
PLP 3,000 18,213
Total 9,354 8,291 7,194 8,399 8,794 12,830 19,600 26,315
The approved forecast is summarized below:
Aged PoleReplacements
2014 2015
PolesReplaced
Adopted
9,000 0
Requested
14,500 1,898
Nominal$,millions
Adopted
114.32 0
Requested
184.189
24.622
Joint Pole Replacement Capital Credits7.6.4.4.and Wood Pole Disposal
SCE forecasts $844 in capital credits per pole replacement, regardless of
which program replaces the pole. SCE’s total capital credit forecast for 2015 for
Deteriorated Poles, Aged Poles, and other programs (excluding Pole Loading
Program) is $16.244 million (nominal $) in 2015. For wood pole disposal, SCE
- 105 -

A.13-11-003 ALJ/KD1/ar9/jt2/lil PROPOSED DECISION (Rev. 12)
forecasts $100 (2012$) per pole based on a five-year recorded average.275 SCE’s
pole disposal unit cost forecast is uncontested and is adopted. We address the
subject of capital credits per pole in Section 7.7.3.1.1 below and adopt SCE’s
forecast.
2012$ Nominal$
2014 2015
Disposal $100.00 $104.72 $ 106.95
Credit $844.00 $883.85 $ 902.62
Applying the adopted credit and disposal amounts to our forecast of pole
replacements yields the following capital forecast.
Joint Pole Replacement CapitalCredits and Wood Pole Disposal(Nominal$, millions)
SCE Adopted
2014 2015 2014 2015
Aged Poles- Disposal $1.518 $0.203 $0.942 $-
Aged Poles-Joint Pole Credit $(12.816) $(1.713) $(7.955) $-
Deteriorated DistributionPoles-Disposal
$0.639 $0.639 $0.706 $0.706
Deteriorated DistributionPoles-Credits
$(5.391) $(5.391) $(5.959) $(5.959)
Deteriorated TransmissionPoles-Disposal
$0.157 $0.160 $0.157 $0.160
Deteriorated TransmissionPoles-Credits
$(1.326) $(1.354) $(1.326) $(1.354)
Total $(17.219) $(7.456) $(13.434) $(6.447)
Other Capital7.6.5.
SCE’s capital expenditure forecasts that are not specifically addressed are
uncontested and are adopted. Some expenditures (e.g., removal of idle facilities)
were initially contested, but the parties reached agreement through stipulation.276
275 SCE-3V6P1 and SCE-3V6P1A at 50-53.276 ORA-57R.
- 106 -

A.13-11-003 ALJ/KD1/ar9/jt2/lil PROPOSED DECISION (Rev. 12)
T&D – Pole Loading7.7.
“Pole loading” refers to the calculation of whether a pole meets certain
design criteria called “safety factors” based on wind in that location and facilities
attached to the pole. GO 95 establishes pole loading safety factors for California
utilities. Pole loading calculations consider many factors including the size,
location, and type of pole; types of attachments; length of conductors attached;
and number and design of supporting guys. Some of the information related to
third party attachments may not be known to SCE, such as unauthorized
attachments.
SCE is required to allow certain other utilities to attach to poles and
approximately 70% of poles are shared. Joint owners are responsible for pole
loading calculations when attaching to a pole; renters are responsible for
providing the necessary input to SCE, who will then perform the calculation.
SCE notes that safety factors have increased over time, and some older
poles may not meet current standards. Further, the technology and approach for
performing pole loading calculations has changed considerably over time, as
have the number and type of attachments placed on poles. Also, poles that do
comply with safety factors may still fail.
Pole loading is a significant safety issue; overloaded poles may have
contributed to the 2007 Malibu Canyon Fire. This event has increased the
scrutiny of pole loading issues. In addition to indirect damage from fires, poles
or the equipment they support can directly injure people or damage property in
the event of a pole failure. Finally, a pole failure can lead to an outage. SCE
states that overloaded poles are more likely to fail, especially during wind storms
or other unusual conditions.
- 107 -

A.13-11-003 ALJ/KD1/ar9/jt2/lil PROPOSED DECISION (Rev. 12)
In D.12-11-051,277 we ordered SCE to undertake a study of pole loading.
SCE claims that preliminary results of this study inform its forecasts for pole
loading. Additionally, SCE has hired a meteorological firm to help update its
designated high wind areas.
SCE proposes a comprehensive PLP to address pole loading issues. The
program is designed to assess non-engineered poles and structures for
compliance with GO 95 and SCE’s internal standards. SCE proposes a
seven-year (2014-2020) assessment program, which will evaluate the highest
priority poles in the first three years. SCE’s planners will review the assessments
and design remediation approaches including repair (e.g., adding guys) or
replacement of poles. The planners will attempt to efficiently coordinate the
remediations with other work in the region (e.g., undergrounding, infrastructure
replacement). SCE intends to complete the remediations by 2025. Further, SCE
intends to improve the joint pole process to reduce pole loading problems
through better information sharing. To this end, SCE is participating in several
Commission proceedings and working with the SCJPC.
SCE forecasts 2015 O&M of $38.424 million (2012$) and capital
expenditures of $40.672 million in 2014 and $341.295 million in 2015 (nominal$).
SCE forecasts slightly increasing capital expenditures in each of 2016 and 2017 for
a total capital forecast of $1.089 billion (nominal$) for 2013-2017. SCE
shareholders have pledged to contribute $17 million toward pole loading in the
Malibu area as a result of a settlement. SCE’s forecast is net of this amount,
which is mostly applied to reducing the capital expenditures during 2015-2017.
The PLP began after the 2012 GRC and the activities are incremental to the
DIMP and other pole activities discussed in this decision. Therefore, with limited
277 At 181-182.
- 108 -

A.13-11-003 ALJ/KD1/ar9/jt2/lil PROPOSED DECISION (Rev. 12)
exceptions, SCE did not have recorded costs or past authorizations to present
along with its forecasts.278
One key contested issue is the number of poles to be replaced during this
GRC period and the corresponding capital expenditures. ORA and TURN
propose significantly lower numbers than SCE, while CUE proposes higher
numbers. TURN notes that:
capital expenditures in the PLP could exceed $3 billion over the12-year replacement cycle,
SCE forecasts capital related revenue requirement increases of$35 million for 2016 and $60 million for 2017 due to prior PLPcapital expenditures,
The capital revenue requirement for PLP could exceed $500million per year by 2026.
While TURN acknowledges uncertainty in the magnitude, TURN
concludes that PLP will lead to “hugely increasing revenue requirements.”279
SCE’s Pole Loading Study7.7.1.
As discussed above, SCE performed a pole loading study after the 2012
GRC, served on July 31, 2013. SCE’s sample of poles studied is summarized
below:
278 SCE-3V6P2, SCE-19V6P2, and SCE-15.279 TURN-20 at 6-7.
- 109 -

A.13-11-003 ALJ/KD1/ar9/jt2/lil PROPOSED DECISION (Rev. 12)
SCE defines high wind areas as “regions in which, based on SCE’s
judgement and the analyses of subject matter experts, the appropriate wind load
used for pole design exceeds the GO 95 minimum of eight pounds per square
foot (psf).” Thus, strata 3, 4, 7, and 8 are high wind regions. SCE uses
boundaries defined by the California Department of Forestry and Fire Protection
to define the high fire areas (HFA), including strata 5-8.
SCE also provides a later (May 2014) table summarizing the number of
poles in the different wind and fire areas. SCE notes that the number of poles is
slightly larger. Using this table, SCE calculates that 59% of poles are in a high
wind area (>8 psf), HFA, or both.280
Wind Rating (psf) no HFA HFA Total
6 60,134 148,055 208,189
8 520,511 45,197 565,708
12 407,995 95,801 503,796
18 104,310 39,645 143,955
24 4,180 1,077 5,257
Total 1,097,130 329,775 1,426,905
280 SCE-76.
- 110 -

A.13-11-003 ALJ/KD1/ar9/jt2/lil PROPOSED DECISION (Rev. 12)
We note that, in addition to the slight increase in total pole count, there are
some other important differences between this table and the preceding table.
First, the 24 psf category was not originally included. Second, large decreases in
the number of poles in strata 2, 6, and 7 are offset by increases in the other
categories (including the 24 psf poles in the 18 psf strata for comparison
purposes). More total poles are shown in the high wind areas (12 to 24 psf) and
non-HFA regions. These shifts are summarized below.
Shift from low to high wind Shift from HFA to non-HFA
Wind (psf) 6, 8 12, 18 (including 24) Any Any
Strata 1, 2, 5, and 6 3, 4, 7, and 8 1 to 4 5 to 8
Change -91,811 95,615 154,654 -150,850
O&M7.7.2.
PLP O&M includes several activities and FERC accounts. Our total
adopted forecast is summarized below (millions of 2012$).
- 111 -

A.13-11-003 ALJ/KD1/ar9/jt2/lil PROPOSED DECISION (Rev. 12)
Account Activity Labor Non-Labor
Total
593.125 Related Expense $0.520 $1.480 $2.000
Repair $5.132 $3.202 $8.334
Malibu Adjustment $0 $(0.537) $(0.537)
Total $5.652 $4.145 $9.797
571.125 Related Expense $0.064 $0.292 $0.356
Repair $0.634 $0.396 $1.030
Total $0.698 $0.688 $1.386
583.125 Joint Pole Organization $1.123 $0.125 $1.247
Distribution Assessments $13.034 $7.989 $21.023
Total $14.157 $8.114 $22.270
566.125 Transmission Assessments $1.611 $0.988 $2.599
Total $22.118 $13.394 $36.052
Assessments and Planning (Accounts7.7.2.1.583.125 – Distribution and 566.125 –Transmission)
Assessments will be performed by contractors and recorded as non-labor
expenses; planning activities are recorded as labor expenses. Additionally,
$0.844 million in the 2013 forecast is for the pole loading study ordered by
D.12-11-051. Beginning in 2015, SCE forecasts performing 205,754 poles per year
at $111 per pole ($22.839 million 2012$) and dedicating 14 planners to the PLP
($1.812 million) for transmission and distribution, combined. $21.939 million of
this total is for distribution, $2.712 million is for transmission. SCE plans to
complete the assessments in seven years.281
ORA forecasts $14.663 million for distribution and $1.812 million for
transmission assessments. ORA notes that spending and assessments completed
281 SCE-3V6P2 at 19-21.
- 112 -

A.13-11-003 ALJ/KD1/ar9/jt2/lil PROPOSED DECISION (Rev. 12)
during the first five months of 2014 represent only 7% of the forecast total for the
year. In ORA’s view, 2014 results suggest that SCE cannot actually complete the
assessments at the rate assumed in SCE’s forecast. ORA argues that SCE does
not have adequate experience or historical data to forecast the PLP assessments.
To calculate its forecast, ORA assumes a ten-year assessment schedule, or 144,028
assessments per year. Further, ORA applies a unit cost of $106 per pole, based on
SCE’s 2014 recorded costs as of May.282
SCE contends that its proposed seven-year time frame is an appropriate
balance between safety and execution risk. Early months of a large program,
SCE argues, should not be used to discount SCE’s ability to execute during the
test year. Further, SCE contends that the balancing account proposed for the PLP
(see Section 7.7.3.1.3 below) shields customers from the cost risk of SCE being
unable to execute as many assessments as authorized. Nevertheless, SCE offers
that it can maintain its proposed prioritization of PLP on high risk regions in a
ten-year assessment program, if requested to do so. Separately, SCE contests
ORA’s proposed lower unit cost, claiming that preliminary 2014 results are an
insufficient basis for this reduction.283
TURN recommends that the assessments include data relevant to
alternatives to pole replacement or for cost sharing, such as which companies
have attachments on the pole and the load of each attachment.284 SCE does not
directly respond to this point. We agree with TURN that this data should be
recorded in the assessment process.
We adopt ORA’s proposed unit cost of $106 per pole. While we agree with
SCE that preliminary recorded data should not always be used for forecasting, in
282 ORA-8 at 25-32.283 SCE-19V6P2 at 4-5.284 TURN-20 at 29.
- 113 -

A.13-11-003 ALJ/KD1/ar9/jt2/lil PROPOSED DECISION (Rev. 12)
this instance SCE has not advanced any other persuasive rationale for its own
forecast. Further, SCE itself expects the pace of assessments to increase in the
future, which may decrease unit costs due to economy of scale.
We accept SCE’s proposed assessment schedule. We find that the public
interest in quickly developing a more comprehensive understanding of the extent
of overloaded poles outweighs the potential cost deferral advantage of slowing
the pace of assessments. Further, we adopt SCE’s uncontested forecast of
planning and analysis costs. Our adopted forecast is below.
Assessments per year 205,754
Unit Cost (2012$) $ 106
Subtotal (millions of 2012$) $ 21.810
Planning & Analysis Cost (millionsof 2012$) $ 1.812
Total Assessment Cost (millions of2012$) $ 23.622
89% to 583.125 – Distribution285 $ 21.023
11% to 566.125 - Transmission $ 2.599
Repair (Accounts 571.125 – Transmission7.7.2.2.and 593.125 – Distribution)
SCE intends to repair poles, specifically, guy wires at electrical levels
within two years of an inspection that identifies needed repairs. Repairs (as
opposed to replacements) are relevant to all poles with deficient guy wire safety
factors and 40% of poles with vertical or buckling safety factor failures. SCE
estimates that 3% of poles will need repairs, and forecasts 2,100 repairs in 2014
and 5,700 per year beginning in 2015. SCE estimates unit planning costs of $89
per pole based on contractor rates and $1,554 (2012$) based on 2012 recorded
values. SCE’s total O&M forecast is $9.364 in 2015 (millions of 2012$).286
285 Allocated to the Distribution vs Transmission accounts using the same ratio as SCE-3V6P2. 286 SCE-3V6P2 at 21-22.
- 114 -

A.13-11-003 ALJ/KD1/ar9/jt2/lil PROPOSED DECISION (Rev. 12)
ORA accepts SCE’s unit costs, but projects a lower rate of repairs based on
a ten-year assessment schedule as discussed above. Additionally, ORA contends
that SCE overestimated its ability to ramp up repair rates during 2014.287
As discussed above, we find SCE’s proposed pace of assessments
reasonable. SCE’s unit costs are uncontested and are reasonable. Therefore, we
accept SCE’s forecast of repair costs, as shown below.
AccountApproved
(millions of 2012$)
593.125 8.334
571.125 1.030
Related Expense (Accounts 571.125 –7.7.2.3.Transmission and 593.125 – Distribution)
This category records costs related to capital expenditures (pole
replacements) that do not qualify for capitalization. SCE’s forecast is
summarized below.288
AccountRequested
(millions of 2012$) Labor
593.125 2.745 26%
571.125 0.489 18%
ORA proposes reducing SCE’s forecast by 19.68% to match ORA’s
proposed reductions to SCE’s replacement forecast (discussed in Section 7.7.3.1
below).289 SCE acknowledges that this forecast should be adjusted dependent on
the approved replacement forecast.290 The relation between the replacement
forecast and related expense is uncontested and is reasonable. We apply the ratio
287 ORA-8 at 32-34.288 SCE-3V6P2 and SCE-3V6P2A at 23-24.289 ORA-8 at 35. 290 SCE-19V6P2 at 7.
- 115 -

A.13-11-003 ALJ/KD1/ar9/jt2/lil PROPOSED DECISION (Rev. 12)
of approved to requested pole replacements in 2015 (72.9%) to calculate this
forecast (millions of nominal$).
Account 593.125 571.125
Labor 0.520 0.064
Non-Labor 1.480 0.292
Total 2.000 0.356
Joint Pole Organization (JPO) (Account7.7.2.4.583.125)
As discussed in Section 7.6.3.1.3 above, JPO manages poles that SCE owns
jointly. SCE forecasts 24 additional JPO employees to handle its proposed 25,000
annual pole replacements, beginning in 2015. SCE’s total forecast is $1.712
million, of which 90% is allocated to labor.291
ORA proposes reducing SCE’s forecast by 19.68% to match ORA’s
proposed reductions to SCE’s replacement forecast (discussed in Section 7.7.3
below).292 SCE acknowledges that this forecast should be adjusted dependent on
the approved replacement forecast.293 The relation between the replacement
forecast and JPO expense is uncontested and is reasonable. We apply the ratio of
approved to requested pole replacements in 2015 (72.9%) to calculate this forecast
(millions of nominal$).
Account 583.125
Labor 1.123
Non-Labor 0.125
Total 1.247
291 SCE-3V6P2 at 25-26.292 ORA-8 at 36. 293 SCE-19V6P2 at 9.
- 116 -

A.13-11-003 ALJ/KD1/ar9/jt2/lil PROPOSED DECISION (Rev. 12)
Capital7.7.3.
The primary capital item is the replacement of poles failing pole loading
assessments. In addition to the number and timing of pole replacements, cost
recovery for joint poles is a disputed issue. Our adopted capital forecast is
summarized below (millions of nominal$).
SCE Adopted
2014 2015 2014 2015
Pole Replacements -Distribution
$33.916 $288.636 $32.899 $203.963
Pole Replacements -Transmission
$6.789 $58.080 $6.585 $41.043
Malibu Adjustment $(5.130) $- $(5.130)
Distribution Transformers $1.371 $11.668 $1.371 $ 8.500
Prefabrication $0.931 $7.926 $0.931 $5.774
Joint Pole - Distribution $(2.360) $(20.083) $(2.360) $(14.631)
Joint Pole - Transmission $(0.289) $(2.476) $(0.289) $(1.804)
Wood Pole Disposal $0.314 $2.674 $0.314 $1.948
Total $40.672 $341.295 $39.452 $239.664
Pole Replacements7.7.3.1.
Joint Poles, Attachments, and Cost7.7.3.1.1.Recovery
As noted above, SCE forecasts $844 in credits from joint owners per pole
replaced (2012$); these credits offset a portion of the costs to ratepayers. This
figure is based on a five-year recorded average.294 ORA does not contest the unit
credit amount.
TURN makes several proposals related to non-SCE equipment on poles
found to be overloaded by SCE’s PLP assessments. Generally, in TURN’s view,
SCE’s proposal places too much of the burden of PLP replacements on SCE
ratepayers and too little on joint owners and/or renters. TURN challenges two
294 SCE-3V6P2A at 31.
- 117 -
A.13-11-003 ALJ/KD1/ar9/jt2/lil PROPOSED DECISION (Rev. 12)
assumptions of SCE’s proposal: 1) removing attachments is not an option to
remediate an overloaded pole; and 2) pre-existing cost allocation practices
(between SCE and attachers) must be used for PLP replacements. TURN makes
numerous arguments and assertions on this subject. We do not attempt to repeat
TURN’s showing here, but only to summarize key themes.
In support of its view, TURN notes that our decision instituting mandatory
access also concluded that electric utilities should be allowed to place restrictions
on attachments in order to protect safety and reliability.295 TURN further
suggests that we have expressed interest in cost-sharing arrangements related to
upgrades of joint poles.296
PLP replacements should not necessarily be treated as “mutual benefit”
remediation, TURN contends, because SCE has not analyzed whether any
replacements should be considered “rearrangements” for which all costs would
be borne by an attacher. This would be appropriate if there is an unauthorized
attachment or if the last attacher is the cause of the overload.
TURN acknowledges the role of the Southern California Joint Pole
Committee (SCJPC), of which SCE is one of 33 members, in setting the rates for
pole replacement and other costs. TURN provides a hypothetical example of
SCE ratepayers paying 64% of the SCJPC authorized new pole cost with the
remainder paid by the joint owner. SCE ratepayers also pay 100% of the
substantial difference between SCE’s total cost and the SCJPC authorized
amount. Renters typically do not pay for pole replacements. However, TURN
enumerates paragraphs of the SCE attachment contracts (negotiated with
California Cable and Telecommunications Association, representing renters) that
TURN believes may allow SCE to charge renters for replacements or remove
295 See: D.98-10-058 at 72.296 See: D.14-02-015 at 33.
- 118 -

A.13-11-003 ALJ/KD1/ar9/jt2/lil PROPOSED DECISION (Rev. 12)
attachments in pole overloading circumstances. TURN criticizes SCE for not
presenting analysis on the impact of removing attachments.
TURN considers the SCJPC approach inappropriate for PLP, due to the
scale of the program and nature of the pole loading problem. TURN further
emphasizes that our mandatory access decision was premised on the idea of
“surplus space, or use of excess capacity”297 and suggests that attachments may
not be on excess capacity to the extent that they contribute to pole overloading.
Further, TURN shows that poles with non-SCE attachments are
significantly more likely to fail the bending analysis in the Pole Loading Study.
Similarly, in a 2012 study, poles with attachments were found to be 64% more
likely to not meet GO 95 safety factors. TURN concludes that, absent
attachments, the percentage of poles failing the bending analysis (and thus
needing replacement) would be considerably lower than the 19% proposed by
SCE.
TURN notes that the $844 per pole credit corresponds to 7% of SCE’s
proposed $12,130 unit cost.
TURN contends that SCE’s attachment fees may be below SCE’s
cost-of-service, and recommends that we order SCE to conduct a study on this
issue. The study should include direct, administrative, information technology,
and other costs that are reasonably allocated to attachments.
TURN contends that SCE’s forecast double counts removal and disposal
costs in its net credit calculations. TURN notes that the last owner to remove
equipment from a pole is responsible for removal and disposal of joint poles, and
that SCE is not usually responsible for this work. As a result, TURN proposes
297 D.98-10-058, Appendix A at 3.
- 119 -
A.13-11-003 ALJ/KD1/ar9/jt2/lil PROPOSED DECISION (Rev. 12)
reducing removal and disposal costs by 56%, corresponding to the fraction of
poles that other owners remove.
TURN notes that SCE proposes wind standards greater than 8 pounds on
46% of poles, consistent with Rule 31.1 of GO 95.
TURN specific proposals:
Catch-up fee: TURN proposes that we authorize SCE to charge aPLP specific catch up fee for each pole found to need replacementthat supports an attachment. TURN views PLP as a catch-upprogram for which responsibility is shared, benefits are sharedand costs should also be shared. TURN suggests that this feewould also send an appropriate price signal to attachers. Suchfees should be considered as Contributions in Aid ofConstruction (CIAC) to offset capital costs. TURN does notrecommend a specific fee amount or structure.
Electric-service first: TURN proposes that if an existing polecould safely support SCE equipment, without attachments, SCEshould pursue an outcome consistent with such an option. Theattacher would be notified that space is no longer available andgiven the choice to either relocate or pay a larger share of thereplacement costs. TURN considers the portion currently paid byjoint owners to be too low and claims that renters pay less than$20 per year, 70% of which is captured by shareholders. TURNdescribes options for attachers to relocate, and argues suchoptions should be explored.298
SCE generally rejects TURN’s arguments on procedural grounds but
expresses interest in coordinating with TURN on proposals related to cost
recovery. Specifically, SCE notes that attachers (whether renters or owners) are
not parties to this proceeding and suggests that R.14-05-001 is a more appropriate
forum. SCE also notes that there are significant policy questions (e.g., impacts on
communications infrastructure including 911 service) that may arise from
removing attachments.
298 TURN-20.
- 120 -

A.13-11-003 ALJ/KD1/ar9/jt2/lil PROPOSED DECISION (Rev. 12)
SCE also discounts TURN’s assertion that rental fees are recorded to
Non-Tariffed Products and Services (NTP&S), and clarifies that only a small
portion (i.e., rents from entities not entitled to mandatory access) goes to
NTP&S.299
CUE comments that TURN’s suggestions are fine, but are not guaranteed
to work. Accordingly, CUE recommends that we authorize PLP replacements
without making any assumptions about alternative solutions. Further, CUE
suggests that we provide SCE an incentive, in the form of shareholders keeping a
portion of savings, to successfully realize TURN’s proposals.300
Number of Pole Replacements7.7.3.1.2.
Based on preliminary results of the Pole Loading Study, SCE anticipates
19% of poles will require replacement. Parties’ forecast pole replacement rates
(poles/year) are summarized below, with the 2015 rate forecast to continue
through 2025.
Party 2014 2015
SCE Distribution 2,670 22,250
SCE Transmission 330 2,750
SCE Total 3,000 25,000
ORA Distribution 0 17,871
ORA Transmission 0 2,209
ORA Total 0 20,080
TURN Distribution n/a 18,854
TURN Transmission n/a 2,330
TURN Total n/a 21,184
CUE Distribution 2,670 29,370
CUE Transmission 330 3,630
CUE Total 3,000 33,000
299 SCE-19V6P2 at 15-16.300 CUE-2 at 27-28.
- 121 -

A.13-11-003 ALJ/KD1/ar9/jt2/lil PROPOSED DECISION (Rev. 12)
At SCE’s proposed unit costs, SCE’s total forecast is $347 million
(nominal$) in 2015;301 however, applying the unit costs adopted in Section 7.6.4.1
above to SCE’s proposed number of pole replacements, the forecast would be
reduced to $336 million. For purposes of simplifying discussion in this section,
we will only address forecast pole replacements, and apply the adopted unit cost
to our adopted unit count in the conclusion.
ORA proposes two separate reductions to SCE’s proposed replacement
rates. First, ORA calculates that in order to replace the 268,688 poles that SCE
claims need to be replaced by 2025 only requires replacing 24,153 poles per year
from 2015 on. Second, ORA calculates an 11-year recorded average of 21,443
poles replaced per year under other programs (not including Aged Pole
Replacements), and assumes that 19% of these would have been replaced under
PLP. Therefore, to avoid this overlap in pole replacement programs, ORA
proposes an additional reduction of 4,074 poles per year (0.19 * 21,443 = 4,074).
ORA proposes no pole replacements in 2014 and 20,079 poles per year beginning
in 2015.302
TURN supports ORA’s proposed reduction of 847 poles per year based on
SCE’s “over forecast.” Further, TURN estimates an additional reduction of 2,969
poles per year based on its estimate of overlap with other programs for a total
forecast of 21,184 poles per year beginning in 2015. TURN does not explicitly
address 2014. TURN recommends that the PLP initially focus on high hazard
areas, but does not propose any specific reduction on that basis.303
CUE recommends a higher replacement rate of 33,000 poles per year in
2015 and beyond. CUE contends that this will reduce the delay in remediating
301 SCE-3V6P2 at 26-28.302 ORA-11 at 76-81.303 TURN-20 at 33.
- 122 -

A.13-11-003 ALJ/KD1/ar9/jt2/lil PROPOSED DECISION (Rev. 12)
poles that have failed the PLP inspections, will not overextend SCE’s capabilities,
and will still be repairing fewer poles than are identified for replacement during
this GRC period.304
In rebuttal, SCE contends that ORA and TURN overestimate overlap of
PLP with other programs. SCE particularly rejects ORA’s estimate of zero poles
for 2014, claiming that 1.5% of SCE’s proposed 3,000 is more realistic. SCE also
argues that its assessments will identify more pole replacements than it will
actually accomplish during this GRC period. Therefore, the impact of overlap
will materialize later in the PLP program.
Separately, SCE explains that it structured the PLP replacements to end
during the 12th year and that this explains the 847 poles per year reduction
proposed by ORA. SCE recommends rejecting the reduction.305
Discussion7.7.3.1.3.
A few seminal facts are not disputed:
A significant fraction, nearly 19%, of poles reviewed in SCE’s PLPstudy are overloaded, and specifically failed the bending analysis.The study suggests similar failure rates in SCE’s total populationof poles. SCE proposes to replace these poles.
An additional 3% of poles in the study are overloaded and couldbe repaired through addition or repair of guy wires. Again, thestudy suggests a similar rate in the total pole population. SCEproposes to repair these poles.
Overloaded poles present a significant safety hazard andreliability risk.
Approximately 70% of poles are joint use, supportingattachments of either renters, joint owners, or both.
304 CUE OB at 36-38.305 SCE-19V6P2 at 12-15.
- 123 -

A.13-11-003 ALJ/KD1/ar9/jt2/lil PROPOSED DECISION (Rev. 12)
Attachments contribute to overloading,306 but the extent of thiscontribution is not clearly quantified in the evidentiary record ofthis proceeding.307
SCE’s proposal does not consider removing attachments ordistinguish between joint use and SCE-only poles for purposes ofdetermining what remediation strategy to select. SCE’s proposalrelies on pre-existing cost sharing arrangements for joint usepoles.
SCE’s 2015 capital forecast includes distribution polereplacements of $288.636 million, offset by $20.083 million incredits from joint users, and transmission pole replacements of$58.080 million, offset by $2.476 million in credits (nominal$).308
These credits are less than 10% of the pole replacement forecast.
Joint owners and renters are generally not parties to thisproceeding and the costs and other implications of removingtheir attachments is not clearly detailed in the evidentiary recordof this proceeding.
Based on these facts, we agree with the parties that some form of the PLP
should be authorized. However, like TURN and ORA, we do not find that SCE
has adequately justified its specific proposal.
First, we note that SCE has not clearly presented analysis of alternatives to
pole replacement for poles failing the bending analysis. For example, SCE did
not present a cost-benefit analysis of repairing, buttressing, or otherwise
increasing the load carrying capacity of existing poles compared to replacing
those poles.
Further, like TURN, we find that SCE has not explored all appropriate
alternatives with respect to joint use poles in designing PLP. Unlike TURN, we
decline to adopt any specific fee or surcharge because there is not an adequately
306 See: RT 1427.307 See: RT 1496. 308 SCE-19V6P2 at 10.
- 124 -

A.13-11-003 ALJ/KD1/ar9/jt2/lil PROPOSED DECISION (Rev. 12)
developed record on the subject.309 TURN frames the issue from the perspective
of SCE ratepayers with its electric service first principle, noting that from
ratepayers’ perspective it may be cost effective to pay penalties for terminating
rental agreements rather than pay to replace poles. However, we also note that
from the perspective of society more broadly, options besides replacing
overloaded poles should be considered. If the cost to a joint owner (or to society,
if there are externalities) is less to remove an attachment (ameliorating a
hypothetical overload) than the total cost of replacing a pole (regardless of how
that cost is allocated), the economically more efficient outcome is to remove the
attachment. We agree with SCE that the implications of removing
communications attachments may be significant. However, a statement of that
possibility does not meet SCE’s burden of proof that its implicit proposal not to
fully explore this option is reasonable.
Before undertaking a program of this scale, SCE should have more fully
explored additional options, including: renegotiating or terminating agreements
or seeking higher replacement credits, either directly with joint owners and
rentersor via SCJPC; evaluating the prevalence of unauthorized attachments;
and, repairing, buttressing, or otherwise increasing the load carrying capacity of
existing poles.
We agree with TURN that prior Decisions indicate that SCE can and
should seek to negotiate with joint users to reach efficient sharing of joint poles
and safely provide electric service. Specifically, in addition to the language cited
by TURN, our decision on mandatory access states:
We expect parties to resolve most issues relating to safety andreliability restrictions not explicitly covered in our rules through
309 We agree with TURN that non-participation in a proceeding does not guarantee that a stakeholder’s interests may not be impacted by the outcome of a proceeding. See TURN OB at 104.
- 125 -
A.13-11-003 ALJ/KD1/ar9/jt2/lil PROPOSED DECISION (Rev. 12)
mutual negotiation among themselves. In the event that partiescannot resolve disputes among themselves over whether aparticular restriction or denial of access is necessary in order toprotect public safety or ensure the engineering reliability of thesystem, any party to the negotiation may request Commissionintervention under the dispute resolution procedures we adoptbelow. In the event of such dispute, the burden of proof shall beon the incumbent utility to justify that its proposed restrictions ordenials are necessary to address valid safety or reliabilityconcerns and are not unduly discriminatory or anticompetitive.310
We note that the PLP assessments approved in Section 7.7.2.1 should
provide exactly the factual information necessary to meet the burden of proof
described in that decision, including the extent to which attachments contribute
to any “valid safety or reliability concerns” and potentially non-compliance with
GO 95 standards. Cost sharing in proportion to that contribution is not “unduly
discriminatory or anticompetitive.” Although we do not specifically require a
stand-alone study of joint-pole issues, the PLP assessments should provide the
raw data that would be the basis of such a study. SCE should use the assessment
results to conduct any analysis it considers appropriate to support negotiations
with joint owners and renters.
In Section 7.6.3.1.3 above, we express concerns about O&M credits of joint
poles and direct SCE to present additional information on that subject in the next
GRC. We follow the same path here. In the next GRC, SCE shall present
evidence of its attempts to pursue optimal solutions to remediating overloaded
joint poles, including removal of attachments or fair allocation of costs among
joint pole users. SCE should consider the allocation of costs to each joint pole
user in relation to the relative responsibility for the load on the joint poles. SCE
should also quantitatively address the role of unauthorized attachments in pole
310 D.98-10-058 at 76.
- 126 -

A.13-11-003 ALJ/KD1/ar9/jt2/lil PROPOSED DECISION (Rev. 12)
loading and discuss its efforts to minimize this impact. If SCE believes that a
Commission proceeding including joint owners and renters as participants is
necessary in order to achieve good results, SCE may propose a procedural
approach; SCE does not need to wait for its next GRC to do so. To be clear, SCE
and joint owners and renters should all recognize that we believe the costs of
remediating overloaded joint poles should be allocated approximately in
proportion to the causes of the overloading. SCE should seek to quantify the
causes of pole loading, and attribute those causes among SCE, joint owners, and
renters. Then, SCE should develop solutions to remediate overloading while
avoiding an allocation of costs that results in SCE ratepayers bearing a
disproportionate share. We encourage SCE and other interested parties to
expeditiously address these issues.
We are neither reaching a conclusion that the proposed cost allocation
advanced by SCE in this proceeding is not fair, nor that the best alternative is to
remove any attachments. We are merely concluding that SCE has not adequately
demonstrated that its proposal is reasonable.
Notwithstanding the guidance above, we believe it is important for SCE to
continue the work of repairing and replacing overloaded poles via the PLP. SCE
should not stop the PLP while seeking to achieve the improvements discussed
above. Thus, we must turn to the question of what amounts to approve for
capital expenditures at this time. In recognition of the concerns and guidance
expressed above, we adopt lower PLP expenditures than SCE’s request. SCE
may wish to prioritize SCE-only pole replacements in the initial years of the PLP
as well as poles in high wind and high fire areas.
For purposes of 2014 and 2015 capital expenditures, we adopt SCE’s
forecast of $844 (2012$) in credits per pole replaced. We recognize that this
- 127 -
A.13-11-003 ALJ/KD1/ar9/jt2/lil PROPOSED DECISION (Rev. 12)
number may grow in the future as SCE seeks to implement our guidance related
to joint owners and renters.
Based on our analysis above, we are optimistic that SCE may be able to
remediate additional overloaded poles per dollar of SCE ratepayer expense,
either by removing attachments, strengthening existing poles, or achieving
greater cost share contributions from joint pole owners and renters. This is a
potential efficiency gain in the PLP. More poles remediated per dollar can be
viewed, for purposes of our analysis of how many pole replacements should be
funded by ratepayers now, as a reduction in the total number of poles to be
replaced over the life of the program. SCE shall provide analysis of these
potential efficiency gains in its next GRC.
Further, overlap between PLP and other programs may reduce the number
of poles ultimately replaced by PLP. The parties acknowledge considerable
uncertainty in the total number of poles to be replaced, particularly in their
disagreement about the level of overlap between PLP pole replacements and
other programs. One complication in our review of the parties’ estimates of
overlap is the different reference points, i.e. does a PLP replacement displace the
need for a deteriorated pole replacement, or vice versa? We choose to view the
overlap as reductions to the number of PLP replacements, noting that in Section
7.6.4.2 above, we approve SCE’s proposed deteriorated pole replacements.
Thus, there are two factors which may reduce the total number of poles to be
replaced by PLP: non-replacement remediation and replacement by other
programs, both of which we anticipate increasing over time.
We estimate an average annual replacement rate of 18,213 poles per year
using the following values: 20% efficiency gain in the remediation of joint use
poles (e.g., poles that can be remediated without replacement funded by SCE
- 128 -

A.13-11-003 ALJ/KD1/ar9/jt2/lil PROPOSED DECISION (Rev. 12)
ratepayers; increased cost share from joint owners or renters) and 12% of the
poles to be replaced (at SCE ratepayer expense) will be replaced by other
programs. The calculation of this estimate is shown in the table below, and the
discussion of the estimated values follows. Our calculation uses the same
approach advocated by ORA and TURN, based on the replacements spread
evenly over the entire 11-year period.
Item Formula/SourceNumber ofPoles
1 Total Poles SCE-76 1,423,101
2Total Poles Replaced in SCE's PLPProposal SCE-3V6P2 268,688
3 70% Joint Use 0.7*Line 2 188,082
420% efficiency gain in joint poleremediation 0.2*Line 3 37,616
5Total Poles to be Replaced by PLP,before Overlap Line 2 - Line 4 231,072
612% of Poles to be Replaced by OtherPrograms 0.12*Line 5 27,729
7 Total Poles to be Replaced by PLP Line 5 - Line 6 203,343
8 PLP Poles Replaced in 2014 SCE-3V6P2 3,000
9Poles to be Replaced by PLP (2015through 2025) Line 7 - Line 8 200,343
10Pole Replacements per year (2015through 2025) (Line 9)/(11 years) 18,213
No party explicitly advances an estimate for an efficiency improvement of
joint pole remediation as funded by SCE ratepayers. As TURN points out, SCE’s
implicit assumption is zero improvement. SCE has not justified this assumption.
The tone of TURN’s argument suggests it foresees a much higher possible
improvement, but TURN has not justified any particular value. We find 20% to
be a reasonable starting point forecast in light of the known contribution of
- 129 -

A.13-11-003 ALJ/KD1/ar9/jt2/lil PROPOSED DECISION (Rev. 12)
attachments to overloading, the balancing account treatment adopted in Section
7.7.4 below, and the considerable uncertainty surrounding the total number of
poles replaced.
Our estimate of 12% of overlap with other programs is approximately
consistent with TURN’s estimate (2,969/25,000 = 11.9%) of overlap, and is
considerably lower than ORA’s proposed 19%. This estimate strikes a reasonable
middle ground between the likely limited overlap in the early years and the
higher potential overlap in later years.
We approve SCE’s forecast number of pole replacements for 2014. For
2015, we approve 18,213 replacements. SCE must apply for approval of 2016 and
later years’ capital expenditures in its next GRC. At our adopted unit costs (see
Section 7.6.4.1 above), this results in capital expenditures as shown below.
Poles Per Year 2014 2015
Distribution 2,670 16,210
Transmission 330 2,003
Total 3,000 18,213
Millions of Nominal$
Distribution $32.899 $203.963
Transmission $6.585 $41.043
Total $39.485 $245.006
SCE, ORA, and TURN all recommend that the initial focus of PLP should
be on high hazard areas. We agree, and direct SCE to focus its early PLP efforts
on high hazard areas. In doing so, SCE should consider hazard maps developed
in R.15-05-006 and other relevant information.
Other Expenditures Related to PLP7.7.3.2.
SCE forecasts several other categories of expenditures related to PLP:
distribution transformers, prefabrication, and wood pole disposal. ORA disputes
the amounts of these expenditures solely on the basis of its lower PLP pole
- 130 -
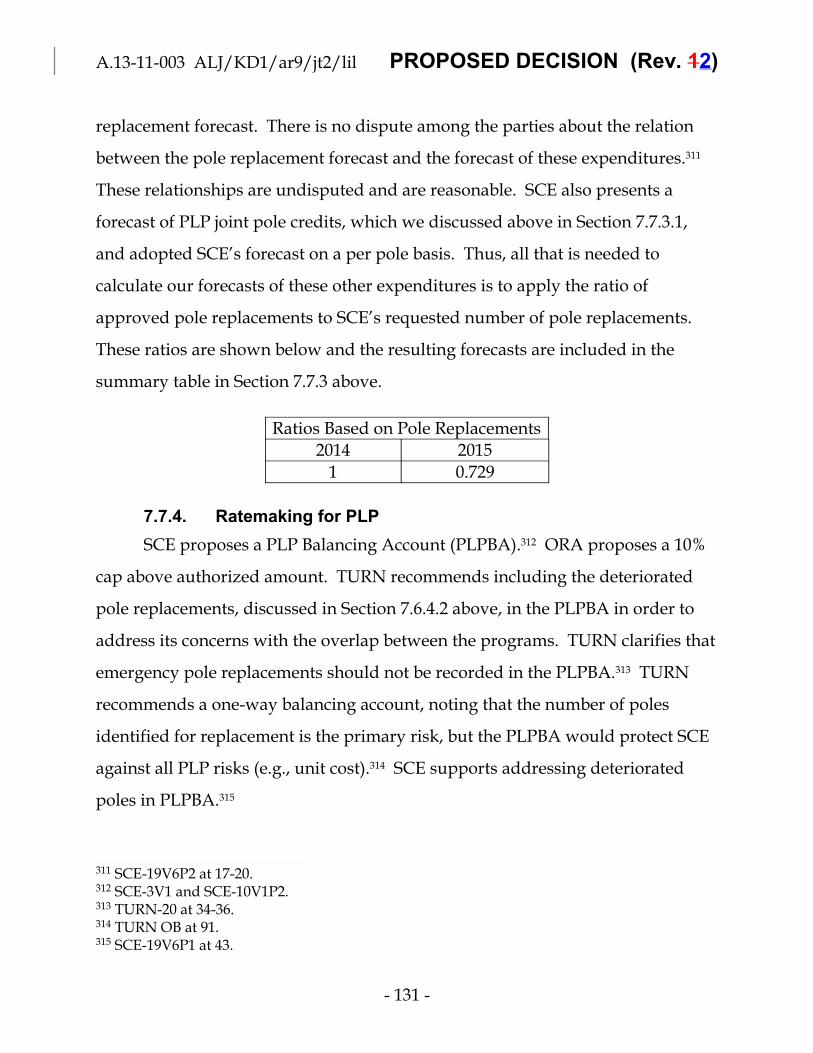
A.13-11-003 ALJ/KD1/ar9/jt2/lil PROPOSED DECISION (Rev. 12)
replacement forecast. There is no dispute among the parties about the relation
between the pole replacement forecast and the forecast of these expenditures.311
These relationships are undisputed and are reasonable. SCE also presents a
forecast of PLP joint pole credits, which we discussed above in Section 7.7.3.1,
and adopted SCE’s forecast on a per pole basis. Thus, all that is needed to
calculate our forecasts of these other expenditures is to apply the ratio of
approved pole replacements to SCE’s requested number of pole replacements.
These ratios are shown below and the resulting forecasts are included in the
summary table in Section 7.7.3 above.
Ratios Based on Pole Replacements
2014 2015
1 0.729
Ratemaking for PLP7.7.4.
SCE proposes a PLP Balancing Account (PLPBA).312 ORA proposes a 10%
cap above authorized amount. TURN recommends including the deteriorated
pole replacements, discussed in Section 7.6.4.2 above, in the PLPBA in order to
address its concerns with the overlap between the programs. TURN clarifies that
emergency pole replacements should not be recorded in the PLPBA.313 TURN
recommends a one-way balancing account, noting that the number of poles
identified for replacement is the primary risk, but the PLPBA would protect SCE
against all PLP risks (e.g., unit cost).314 SCE supports addressing deteriorated
poles in PLPBA.315
311 SCE-19V6P2 at 17-20.312 SCE-3V1 and SCE-10V1P2.313 TURN-20 at 34-36. 314 TURN OB at 91.315 SCE-19V6P1 at 43.
- 131 -

A.13-11-003 ALJ/KD1/ar9/jt2/lil PROPOSED DECISION (Rev. 12)
CUE supports the PLPBA. Further, CUE proposes an incentive mechanism
to “deal with under-spending.” CUE’s mechanism would refund to ratepayers
110% of unspent money if SCE falls short of the target percentage for pole
replacements by more than 10%. The target would be calculated as: (# poles
approved for replacement through 2017)/(# poles expected to be identified as
overloaded).316 SCE rejects CUE’s proposed incentive mechanism claiming that it
unnecessarily duplicates existing incentives for SCE to replace poles,
inappropriately constrains managerial discretion, and may have unintended
consequences.317 We agree with SCE that existing compliance requirements are
sufficient and do not adopt CUE’s proposal.
We approve SCE’s request to create a PLPBA to track expenditures for
poles replaced through both the PLP and the deteriorated pole program. The
basic proposal is uncontested. Given the significant uncertainty in the number of
poles involved, this balancing account appropriately reduces risk for both
customers and investors. We adopt a variation on ORA’s proposed 10% cap to
further protect ratepayers, but except for that cap, we find that a two-way
balancing account is appropriate. Specifically, we place a 15% cap on the 2016
and 2017 spending only, and do not impose any cap on 2015 spending in
recognition of the timing of this decision.
Summary of Pole Replacements7.7.5.
Our total approved pole replacement rate for all programs is compared to
SCE’s request in the following table. Although our approved level of
replacements is significantly lower than SCE’s request, it is significantly higher
than historical levels. Notably, this rate of replacement is below the equilibrium
replacement rate assuming average service lives (ASLs) for distribution poles of
316 CUE-1 at 27 and CUE OB at 38-40. 317 SCE-3V6P1 at 59.

A.13-11-003 ALJ/KD1/ar9/jt2/lil PROPOSED DECISION (Rev. 12)
47 years and 50 years for transmission poles, as adopted in Section 21.2 below.318
However, the increase in total pole replacements is a step toward achieving
equilibrium, without going beyond the equilibrium replacement rate as proposed
by SCE and CUE.319 We recognize that an equilibrium replacement rate must be
achieved in the future. Nevertheless, individual pole replacements should be
based on testing, loading, or other pole-specific analysis, and options to extend
pole life (and thus increase ASL) should be considered.
SCE Adopted
2014 2015 2014 2015
Aged Pole Replacements 14,500 1,898 9,000 0
Deteriorated Pole Replacements 7,600 8,102 7,600 8,102
Pole Loading Driven Pole Replacements 3,000 25,000 3,000 18,213
Total Poles Replaced Per Year 25,100 35,000 19,600 26,315
% Total Pole Replacements Adopted/Requested 78.1% 75.2%
T&D – Grid Operations7.8.
SCE’s grid operations organization is responsible for several major
activities:
Operate and monitor electrical facilities,1.
Provide storm and unplanned outage response, and2.
Inspect and maintain SCE’s street lights and outdoor lighting.3.
SCE requests $115 million (2012$) in O&M and $99 million (nominal$) in
capital expenditures for 2015.320
318 1.4 million poles replaced at 26,415 poles per year suggests an ASL of 53 years. An equilibrium replacement rate for the adopted ASLs would be approximately 29,000 poles per year.
319 35,000 poles replaced per year suggests an ASL of 40 years.320 SCE-3V7.
- 133 -

A.13-11-003 ALJ/KD1/ar9/jt2/lil PROPOSED DECISION (Rev. 12)
Grid Operations O&M7.8.1.
SCE forecasts O&M expenses in nine different FERC accounts, four of
which are contested by ORA. The parties’ forecasts321 and our adopted forecast
are summarized below (millions of 2012$).
Account Activity Requested ORA Adopted
561.170 Grid Control Center Operations 8.834 6.678 8.834
562.170 Transmission SubstationOperations 18.667 18.667 18.667
573.170 Substation and TransmissionStorm Expenses 1.536 1.536 1.536
582.170 Distribution SubstationOperations 26.206 26.206 26.206
583.170 Troubleman Activities 32.665 31.336 32.665
585.170 Streetlight Expenses 8.763 8.763 8.763
587.170 Service Guarantees 0.489 0 0
588.170 Grid Operations Support 2.699 2.699 2.699
598.170 Distribution Storm Expenses 12.431 10.156 12.431
Total 112.291 106.041 111.801
GCC Operations (Account 561.170)7.8.1.1.
GCC has over 30 employees and three main responsibilities: operating and
monitoring SCE’s bulk power system, coordinating planned outages, and
developing and maintaining operating procedures. SCE forecasts costs based on
2012 recorded costs per employee ($0.159 million), with a growth in number of
employees from 31 to 41 from 2012 to 2015. SCE forecasts the ratio of labor to
non-labor based on 2012 recorded.
SCE cites increases in the number of planned outages and in the amount of
equipment in SCE’s grid as justification for the increased number of employees.
Further, SCE claims it must increase staffing to prepare for impending future
retirements.322
321 SCE-19V7 at 2. 322 SCE-3V7 at 5-8.
- 134 -

A.13-11-003 ALJ/KD1/ar9/jt2/lil PROPOSED DECISION (Rev. 12)
ORA notes that SCE’s request represents a 32.3% increase over 2012
recorded, and proposes to use 2012 recorded expenses. ORA states that 2012 is
the highest recorded figure for this account in the last five years. Further, ORA
claims that SCE was authorized additional staff in its recent GRCs and that
recorded expenses do not reflect these positions being filled. ORA claims that
SCE’s arguments for increased GCC staffing in this case repeat arguments from
past cases, but that SCE has not increased staffing and has incurred overtime and
double-time costs. In conclusion, ORA states that SCE has sufficient staff and
funding for GCC.323
In rebuttal, SCE notes that at the time of its direct testimony, it had already
hired five of six positions authorized by D.12-11-051, and that by the time of its
rebuttal it had hired four additional staff for a total of 39 employees. Therefore,
SCE argues, ORA’s forecast would not account for staff that was authorized by
the last GRC decision. SCE also cites a NERC Standard (EOP-008-1) requiring it
to maintain an Alternate GCC.324
We agree with SCE that ORA’s forecast unreasonably discounts staffing
increases that were previously approved. SCE’s basic argument is reasonable:
staffing must increase to accommodate increases in work due to the growing
electric grid. We find reasonable and adopt SCE’s forecast.
Storm Response (Accounts 573.170 and7.8.1.2.598.170)
Storm O&M includes costs to manage the storm command center, identify
affected facilities, assessments, isolation of problem areas, and repair of damaged
equipment. SCE bases its forecast on a five-year recorded average, noting that
this approach has been adopted in SCE’s last three GRCs. Certain storm events
323 ORA-9 at 36-30.324 SCE-19V7 at 3-4.
- 135 -
A.13-11-003 ALJ/KD1/ar9/jt2/lil PROPOSED DECISION (Rev. 12)
can be recorded in and recovered through a CEMA filing; such costs are removed
from the storm response accounts.325
ORA proposes using a three-year (2010-2012) average for Account 598.170,
accepts SCE’s forecast for Account 573.170, and proposes that the two accounts
be covered by a one-way balancing account. ORA’s rationale is that SCE’s
forecast is unreasonably higher than 2012 recorded.326
SCE rejects ORA’s forecast as unsupported and inconsistent with
precedent.327 We agree. SCE also rejects the asymmetric one-way balancing
account treatment that would lead to ratepayer refunds in some years and would
require shareholders to fund storm activities in other years.328 We agree. ORA’s
arguments in this area have no merit. SCE’s five-year average forecast method is
reasonable given the inherent variability of storm expenses.
Troubleman/First Responder Activities7.8.1.3.(Account 583.170)
SCE refers to the first responders to service problems as troublemen.
These first responders are highly trained in troubleshooting, switching, and
emergency scene control. SCE employees responded to over 200,000 incidents in
2012, up 17% from 2009. SCE’s forecast is based on increasing the number of
troublemen/first responders from 185 in 2012 to 203 in 2015, and a 5% decrease
in the cost per troubleman/first responder. SCE states that it has determined the
increase in number of troublemen/first responders is necessary to achieve its
goal for coverage of its service territory at peak and non-peak times. The
increase in number will lead to a decrease in overtime costs.329
325 SCE-3V7 at 14-17.326 ORA-9 at 33-34.327 SCE-19V7 at 6-7.328 SCE-26V1 at 22-23.329 SCE-3V7 at 20-22.
- 136 -
A.13-11-003 ALJ/KD1/ar9/jt2/lil PROPOSED DECISION (Rev. 12)
ORA bases its forecast on 2012 recorded expenses. ORA argues that 2012
recorded includes nearly $10 million in premium time “which can be reallocated
for additional positions.” ORA notes that its proposed forecast is greater than
either the five-year or three-year recorded average.330
SCE responds that its forecast accounts for the anticipated reduction in
overtime hours and that overtime can only be partially replaced by normal hours.
SCE claims that ORA errs in assuming that the total hours worked will remain
constant; SCE forecasts total hours worked to increase to meet its coverage
goals.331 SCE also claims that hiring additional troublemen/first responders will
reduce safety risks associated with fatigue and reduce the time to restore service
following an outage.332
We find SCE’s forecast reasonable and adopt it. The amount of overtime
identified by ORA is less than half the cost of 18 additional troublemen/first
responders. SCE’s argument that overtime can only be partially replaced by
normal hours is reasonable. Further, we agree with SCE that there are potentially
significant safety and reliability benefits from additional troublemen/first
responders.
Streetlights (Account 585.170)7.8.1.4.
SCE subdivides its forecast into two components. For the inspection and
maintenance portion, SCE 2012 recorded costs per streetlight times the number of
forecast streetlights. For the operations and billing portion, SCE bases its forecast
on 2012 recorded values.333
Cal-SLA supports SCE’s forecasts for Account 585.170, but also
recommends that we require SCE “to correct streetlight inventory errors and
330 ORA-9 at 31-32. 331 SCE-19V7 at 8-9.332 SCE-15 at 42. 333 SCE-3V7 at 22-26.
- 137 -

A.13-11-003 ALJ/KD1/ar9/jt2/lil PROPOSED DECISION (Rev. 12)
provide customer refunds within three months after the customer notifies SCE of
the error.”334 We discuss this issue in Section 7.8.2.2.1 below.
We find reasonable and adopt SCE’s uncontested forecast for Account
585.170.
Service Guarantees (Account 587.170)7.8.1.5.
SCE provides two T&D related service guarantees to its customers: 1)
restore power within 24 hours of learning of an unplanned outage, and 2)
provide three day advance notice of any planned outages to affected customers.
Currently, the guarantee payouts ($30 per incident to each impacted customer)
are shareholder funded. SCE argues that all customers benefit from the
guarantee program because it motivates SCE to meet commitments to customers,
and therefore concludes that ratepayers should fund a baseline level of payouts.
SCE proposes 2012 recorded payouts for this baseline, the lowest level in the
five-year recorded period. SCE attributes a decrease in recorded guarantee
payouts over recent years to improvements in its customer outage notification
process.335
ORA cites prior GRC decisions rejecting ratepayer funding for guarantee
payouts and recommends that we continue that policy.336 As we found in
D.12-11-051, we agree with ORA that SCE has not presented a persuasive
argument for ratepayer funding of service guarantees. Therefore, we reject SCE’s
proposal.
Uncontested Accounts7.8.1.6.
SCE bases its forecast for Substation Operations (Transmission in Account
562.170 and Distribution in Account 582.170) on 2012 recorded costs per
334 Cal-SLA-1 at 3-5. 335 SCE-3V7 at 32-34.336 ORA-9 at 32-33.
- 138 -
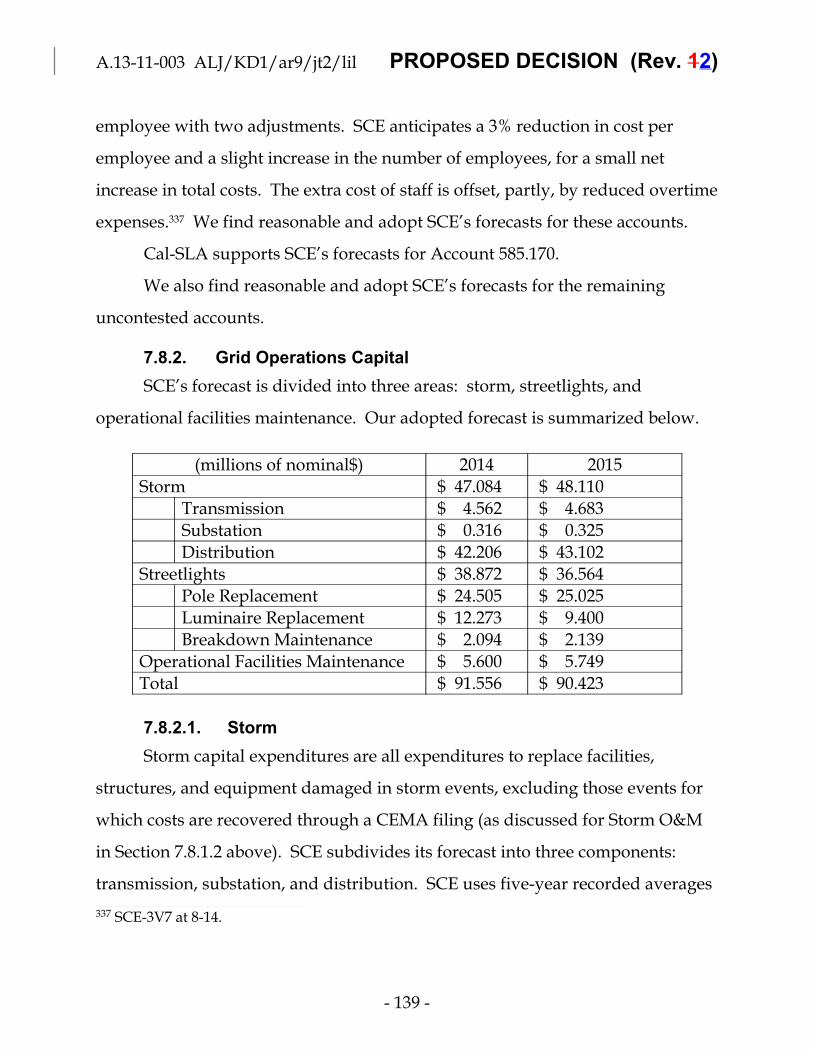
A.13-11-003 ALJ/KD1/ar9/jt2/lil PROPOSED DECISION (Rev. 12)
employee with two adjustments. SCE anticipates a 3% reduction in cost per
employee and a slight increase in the number of employees, for a small net
increase in total costs. The extra cost of staff is offset, partly, by reduced overtime
expenses.337 We find reasonable and adopt SCE’s forecasts for these accounts.
Cal-SLA supports SCE’s forecasts for Account 585.170.
We also find reasonable and adopt SCE’s forecasts for the remaining
uncontested accounts.
Grid Operations Capital7.8.2.
SCE’s forecast is divided into three areas: storm, streetlights, and
operational facilities maintenance. Our adopted forecast is summarized below.
(millions of nominal$) 2014 2015
Storm $ 47.084 $ 48.110
Transmission $ 4.562 $ 4.683
Substation $ 0.316 $ 0.325
Distribution $ 42.206 $ 43.102
Streetlights $ 38.872 $ 36.564
Pole Replacement $ 24.505 $ 25.025
Luminaire Replacement $ 12.273 $ 9.400
Breakdown Maintenance $ 2.094 $ 2.139
Operational Facilities Maintenance $ 5.600 $ 5.749
Total $ 91.556 $ 90.423
Storm7.8.2.1.
Storm capital expenditures are all expenditures to replace facilities,
structures, and equipment damaged in storm events, excluding those events for
which costs are recovered through a CEMA filing (as discussed for Storm O&M
in Section 7.8.1.2 above). SCE subdivides its forecast into three components:
transmission, substation, and distribution. SCE uses five-year recorded averages
337 SCE-3V7 at 8-14.
- 139 -

A.13-11-003 ALJ/KD1/ar9/jt2/lil PROPOSED DECISION (Rev. 12)
for its forecast.338 ORA accepts SCE’s forecasts for this area.339 We find SCE’s
five-year average forecast reasonable and adopt it.
Streetlights7.8.2.2.
Streetlight capital expenditures are grouped into three categories: steel
pole replacements, luminaire replacements, and breakdown maintenance.
SCE states that it has an ongoing program to replace steel streetlight poles
with concrete poles due to age and corrosion, and anticipates replacing all 70,000
poles by 2025. SCE describes three mechanisms for pole failure, all related to
corrosion: rust at top of pole, holes at bottom due to rust, and rusty anchor bolts.
SCE suggests that poles near the ocean corrode more rapidly than others. SCE
initially forecast 5,500 pole replacements in 2014 and 5,000 in 2015 at a unit cost of
$6,300 (2012$).
SCE states that “typically” luminaires last about 15 years. SCE forecasts
replacement of 40,000 luminaires in 2014 and 30,000 in 2015 at a unit cost of $300
(2012$).
SCE forecasts $2 million (2012$) per year of breakdown replacements
based on 2012 recorded data.340 SCE’s revised total forecast is $50.251 million in
2014 and $44.853 million in 2015 (nominal$).341
ORA recommends a lower pole replacement rate. ORA notes that SCE’s
proposed 2013-2015 annual expenditures is more than three times the annual
average of 2009-2012. For pole replacements, ORA calculates a 433% increase in
the average number of poles replaced in SCE’s forecast compared to 2008-2012.
ORA claims that all poles near the ocean have been already been replaced. ORA
asserts that SCE does not select poles for replacement based on specific
338 SCE-3V7 at 17-19.339 ORA OB at 135.340 SCE-3V7 at 26-28.341 SCE OB at 143.
- 140 -

A.13-11-003 ALJ/KD1/ar9/jt2/lil PROPOSED DECISION (Rev. 12)
engineering analysis, instead replacing all poles based on location. Further, ORA
claims that SCE does no maintenance other than painting poles, does not
maintain maintenance records, and could not verify the age of poles. ORA
recommends that 2012 authorized expenditures should be escalated for inflation
and that SCE should not be allowed to accelerate the replacement rate before
conducting additional analysis.342
TURN submits that SCE has not justified the need to replace all steel poles
and recommends $5.661 million (2012$) for each of 2014 and 2015. TURN
suggests that SCE’s recent experience of observing corroded anchor bolts in 80%
of poles replaced during 2005-2013 is due to SCE’s focus on replacing poles near
the ocean. TURN suggests that this focus is appropriate and that corrosion in
poles near the ocean does not establish likelihood of corrosion of inland poles.
Further, TURN suggests that SCE should institute a testing program and
discounts several arguments from SCE (raised in cited discovery responses) that
such testing is inappropriate, ineffective, or infeasible. Finally, TURN notes that
SCE has not recorded pole-replacement locations relative to the ocean or
documented its concerns about corrosion attributable to sprinklers. TURN
initially concluded that SCE should only replace poles within five miles of the
ocean without further analysis, and estimated that a replacement rate of 948
poles per year is adequate to complete this task by 2017. TURN recommends that
we require SCE to develop a cost-effective testing program or provide evidence
to support that such a method is not available.
TURN also disputes SCE’s proposed unit cost and recommends
$5,972/pole (2012$) based on recorded data from 2013 and part of 2014.343
342 ORA-12 at 22-25.343 TURN-03 and TURN-3A at 38-43.
- 141 -

A.13-11-003 ALJ/KD1/ar9/jt2/lil PROPOSED DECISION (Rev. 12)
In its brief, TURN revises its conclusion to recommend replacing poles up
to ten miles from the ocean and calculates a higher corresponding forecast based
on a replacement rate of 3,620 per year. TURN cites data that show only 2% of
bolts in a city greater than ten miles from the ocean suffered severe corrosion and
generally suggests an inverse correlation between distance and severe
corrosion.344
Cal-SLA supports SCE’s capital forecast.345
CASL suggests that methodological changes in SCE’s accounting and
forecasting make it difficult to understand the justification for SCE’s forecast.
CASL discusses the change in how SCE developed its unit costs in this GRC (cost
per pole includes other components, e.g., conductor) versus the 2012 GRC
(individual unit costs for poles and conductor). CASL calculates that, on a
comparable basis, unit costs have doubled relative to SCE’s 2012 request. CASL
also finds confusion in SCE’s historic steel pole replacement quantity records,
and provides an example of the number of poles replaced in 2005, reported as
three different numbers, ranging from 840 to 2,050, in the 2009 to 2015 GRCs. In
conclusion, CASL recommends that we require SCE to develop a plan for better
recording, presenting and analyzing costs and to be consistent in how it estimates
costs in future GRCs.346
CASL also proposes changes to SCE’s forecast of CIAC.347 SCE accepts
these changes in rebuttal.348
SCE suggests that proposals to delay or slow the replacement program are
without merit because of “age of the poles and the fact that the vast majority of
344 TURN OB at 113-120 and TURN-88.345 SCE and Cal-SLA Settlement Agreement, discussed in Section 27.2 below. 346 CASL-1 at 3-9. 347 CASL-1 at 9-10.348 SCE-19V7 at 26.
- 142 -

A.13-11-003 ALJ/KD1/ar9/jt2/lil PROPOSED DECISION (Rev. 12)
poles have heavy to very severe corrosion.” Further, SCE contends that
inspections and testing are costly and unnecessary based on its belief that the
findings would corroborate SCE’s postmortem inspections (i.e., 84% of replaced
poles have corroded anchor bolts). SCE claims that ORA’s proposal would slow
replacements to 2,000 per year, leading to a 30-year replacement schedule. SCE
claims that of 2014 (part year) replacements “most” have occurred in cities more
than five miles from the ocean, and that 75% of the 4,000 poles replaced had two
or more (of four) anchor bolts with heavy to severe corrosion and 86% with at
least one corroded anchor bolt.
Although SCE considers it a moot point, SCE calculates that it will have
over 10,000 steel poles remaining in service within five miles of the ocean at the
end of 2014, considerably higher than TURN’s estimate of 3,300.
SCE also rejects CASL’s concerns about unit costs, noting that its 2012 GRC
forecast incorrectly excluded contractor labor, resulting in a significantly lower
unit cost. SCE notes that recorded costs in 2013 and 2014 (part year) were $6,171
and $6,147 respectively. SCE accepts slightly lower unit costs ($6,230/pole;
$293/luminaire) than proposed in its original testimony.
Finally, SCE contends that its record keeping is in compliance with
applicable regulations and SCE’s past commitments. SCE describes that it has
many work orders related to streetlight property accounts and that to answer all
of the questions posed by CASL would require manually retrieving information
from each in order to meet CASL’s “onerous” request. SCE volunteers to supply
work order data to CASL or to arrange to do the analysis at CASL’s expense.349
349 SCE-19V7 at 16-25.
- 143 -

A.13-11-003 ALJ/KD1/ar9/jt2/lil PROPOSED DECISION (Rev. 12)
Discussion – Streetlight Data Quality7.8.2.2.1.and Transparency
CASL and TURN point to significant problems in SCE’s recorded data and
inconsistencies in SCE’s forecast approach that hinder transparency. SCE’s
responses to these concerns are inadequate in many cases. For example, SCE
offers no substantive response to CASL’s point about inconsistent records of how
many poles have been replaced in past years. Similarly, the range of parties’
initial estimates of steel poles remaining within five miles of the ocean varied
widely, indicating a major dispute on an issue for which there should be little
dispute with appropriate data and transparency. This issue may be a symptom
of the same concern alleged by Cal-SLA about inventory errors (Section 7.8.1.4
above).
We are also sympathetic to SCE’s point that producing detailed analysis or
data on issues not directly tracked in its systems may be costly. Accordingly, we
do not place any specific requirements on SCE for improved data tracking, but
instead take these shortcomings into account in our review of the substantive
issues below, remind SCE that it bears the burden of proof in GRCs, and observe
that needless inconsistencies in how forecasts are developed (or data is recorded)
from GRC to GRC may cast doubt on its showing.
Discussion – Streetlight Forecast7.8.2.2.2.
We agree with TURN that using recently recorded data is valuable to
calculate unit costs for steel pole replacements due to the inconsistency in how
the numbers have been developed in recent GRCs. However, TURN and SCE
present different numerical values for the recorded average unit cost over 2013
and part of 2014, with no discussion of the differences. We adopt a unit cost of
- 144 -

A.13-11-003 ALJ/KD1/ar9/jt2/lil PROPOSED DECISION (Rev. 12)
$6,000/pole replacement (2012$), which is in the range of the values presented by
the parties.
SCE has not presented adequate analysis or support to justify its proposed
replacement of all 70,000 steel poles. SCE’s primary reasons for the program are
the age and condition of the poles. However, SCE does not provide compelling
support based on either factor. SCE does not present any analysis of the age of
the poles. Data in TURN-88, supplied by SCE, does not support SCE’s
conclusion, that all poles, even those greater than ten miles from the ocean suffer
high rates of corrosion. On the contrary, the evidence suggests that low
percentages of inland poles suffer significant corrosion. Whether through
testing, additional postmortem analysis, or some other method, SCE must
provide more persuasive analysis or data to receive approval of the entire steel
pole replacement program. We leave the method for producing this additional
support, in a future GRC, to SCE’s discretion.
In comments on the Proposed Decision, SCE rejects this analysis and
highlights the data on poles in the City of Whittier. While Whittier is a relevant
example, this is anecdotal evidence; Whittier is not a representative sample of
SCE’s inland pole population.
Like TURN, we find that the data provided from SCE’s recent postmortem
analysis suggest that poles within ten miles of the ocean are likely corroding.
Therefore, we adopt TURN’s final proposal for unit counts, with a slight increase
recognizing that poles in Whittier also experience high levels of corrosion.
We accept SCE’s rebuttal proposal for luminaire unit costs of $293 (2012$)
and SCE’s uncontested forecast for the number of luminaires. Similarly, we
adopt SCE’s uncontested forecast for breakdown maintenance. The following
table summarizes our adopted streetlight capital forecast.
- 145 -
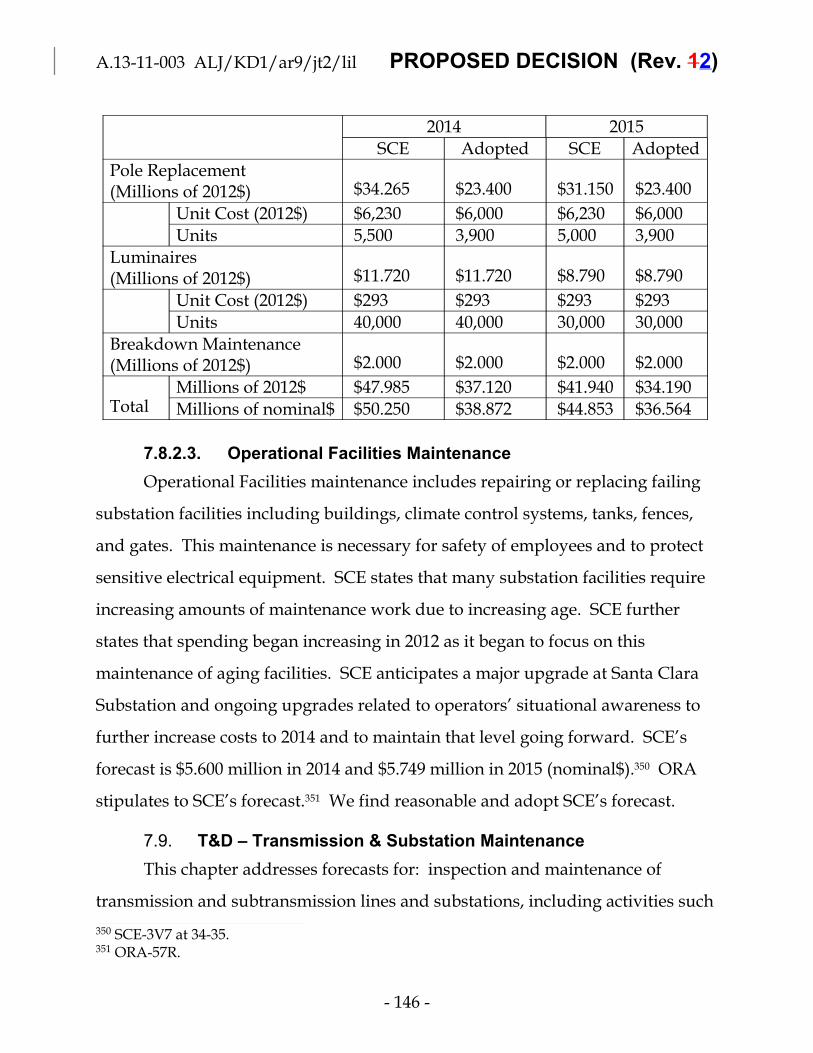
A.13-11-003 ALJ/KD1/ar9/jt2/lil PROPOSED DECISION (Rev. 12)
2014 2015
SCE Adopted SCE Adopted
Pole Replacement(Millions of 2012$) $34.265 $23.400 $31.150 $23.400
Unit Cost (2012$) $6,230 $6,000 $6,230 $6,000
Units 5,500 3,900 5,000 3,900
Luminaires(Millions of 2012$) $11.720 $11.720 $8.790 $8.790
Unit Cost (2012$) $293 $293 $293 $293
Units 40,000 40,000 30,000 30,000
Breakdown Maintenance(Millions of 2012$) $2.000 $2.000 $2.000 $2.000
TotalMillions of 2012$ $47.985 $37.120 $41.940 $34.190
Millions of nominal$ $50.250 $38.872 $44.853 $36.564
Operational Facilities Maintenance7.8.2.3.
Operational Facilities maintenance includes repairing or replacing failing
substation facilities including buildings, climate control systems, tanks, fences,
and gates. This maintenance is necessary for safety of employees and to protect
sensitive electrical equipment. SCE states that many substation facilities require
increasing amounts of maintenance work due to increasing age. SCE further
states that spending began increasing in 2012 as it began to focus on this
maintenance of aging facilities. SCE anticipates a major upgrade at Santa Clara
Substation and ongoing upgrades related to operators’ situational awareness to
further increase costs to 2014 and to maintain that level going forward. SCE’s
forecast is $5.600 million in 2014 and $5.749 million in 2015 (nominal$).350 ORA
stipulates to SCE’s forecast.351 We find reasonable and adopt SCE’s forecast.
T&D – Transmission & Substation Maintenance7.9.
This chapter addresses forecasts for: inspection and maintenance of
transmission and subtransmission lines and substations, including activities such
350 SCE-3V7 at 34-35.351 ORA-57R.
- 146 -

A.13-11-003 ALJ/KD1/ar9/jt2/lil PROPOSED DECISION (Rev. 12)
as vegetation management and transmission line rating remediation. SCE
requests $86 million (2012$) in 2015 O&M and $686 million (nominal$) of capital
expenditures (2013-2017), of which $418 million is CPUC-jurisdictional.352 ORA
contests many of SCE’s forecasts.
O&M7.9.1.
ORA proposes a forecast $8.408 million lower than SCE’s, contesting
several elements of SCE’s forecast. Two Accounts (562.150 and 582.150), both
recording work performed by other parts of SCE’s organization are uncontested.
We find these uncontested forecasts reasonable. Our approved forecast is
summarized below.
352 SCE OB at 149.
- 147 -

A.13-11-003 ALJ/KD1/ar9/jt2/lil PROPOSED DECISION (Rev. 12)
Account Activity SCE Adopted
562.150 Work Performed by Others $ 1.282 $ 1.282
582.150 Work Performed by Others $ 0.164 $ 0.164
566.150 Overhead Inspections and Patrols $ 4.337 $ 4.337
Transmission Line Rents $ 15.351 $ 15.351
Line Expenses $ 2.960 $ 2.960
Intrusive Pole Inspection $ 0.829 $ 0.829
Underground Inspections $ 1.163 $ 1.163
Total $ 24.640 $ 24.640
568.150 Circuit Breaker Inspection and Maintenance $ 2.855 $ 2.855
Relay Inspection and Maintenance $ 3.664 $ 3.463
Transformer Inspection and Maintenance $ 1.563 $ 1.563
Miscellaneous Equipment $ 3.135 $ 3.135
SSID Maintenance $ 1.910 $ 1.910
Maintenance Crew Supervision $ 2.390 $ 2.390
Total $ 15.517 $ 15.316
592.150 Circuit Breaker Inspection and Maintenance $ 3.722 $ 3.722
Relay Inspection and Maintenance $ 1.627 $ 1.627
Transformer Inspection and Maintenance $ 1.386 $ 1.386
Miscellaneous Equipment $ 3.795 $ 3.795
Miscellaneous Substation Maintenance $ 0.447 $ 0.447
Maintenance Crew Supervision $ 2.699 $ 2.699
Total $ 13.676 $ 13.676
571.150 Insulator Washing $ 5.678 $ 5.678
Road and Right of Way Maintenance $ 9.161 $ 9.161
Vegetation Management $ 4.345 $ 4.345
Vegetation Management - Big Creek $ 2.158 $ 1.079
Overhead and Underground Maintenance $ 6.019 $ 6.019
Line Rating Remediation $ 3.379 $ 3.379
Total $ 30.740 $ 29.661
Total $ 86.019 $ 84.739
- 148 -
A.13-11-003 ALJ/KD1/ar9/jt2/lil PROPOSED DECISION (Rev. 12)
Transmission Line Inspection7.9.1.1.(FERC Account 566.150)
SCE’s total forecast for this subaccount is $24.640 million (2012$),
composed of: Line Expenses, Overhead Inspections and Patrols, Intrusive Pole
Inspections, Line Rents, and Underground Inspections. Of these, ORA contests
Overhead Inspections and Patrols and Line Rents, for a total forecast of $24.354
million.
Overhead Inspections are performed at least annually to comply with GO
165 and are approved by CAISO. SCE’s forecast is based on a 5YA cost per mile
multiplied by the forecast number of miles of transmission lines.353 ORA accepts
the cost per mile, but disputes SCE’s forecast of increased miles of transmission
lines. ORA notes that the actual increase during 2013 was 51 miles compared to
SCE’s forecast of 301 and that some of the added line miles are related to projects
rebuilding existing lines. ORA uses a five-year recorded average of increased
line miles to calculate its forecast.354 In response, SCE notes that its forecast of
line miles is based on specific projects that it is constructing, claims that it expects
these lines to go into service in 2014 or 2015, and explains that rebuilt lines are
replacing out of service lines or adding double circuits in place of single circuit
lines.355 We find SCE’s explanation of rebuilt lines reasonable. Further, SCE’s
forecast of line miles based on specific construction projects is superior to a
forecast based on historical averages. SCE’s forecast of Overhead Inspections
and Patrols is reasonable and is adopted.
Transmission line rents are paid to public and private landowners,
including the U.S. Forest Service, for use of property for transmission lines. SCE
forecasts an increase due to a new line rent for a line through the Morongo
353 SCE-3V8 at 1-7.354 ORA-8 at 39-41.355 SCE-19V8 at 4.
- 149 -

A.13-11-003 ALJ/KD1/ar9/jt2/lil PROPOSED DECISION (Rev. 12)
Indian Reservation. Further, SCE forecasts 1.9% increase per year for rent
increases.356 ORA disputes SCE’s proposal to levelized 2015-2017 expenses to
develop its test year forecast. ORA argues that the attrition mechanism provides
for these type of increases.357 As we discussed in Section 7.5.1 above, the Results
of Operations model used in preparation of this decision does not escalate this
cost. Therefore, we adopt SCE’s proposed test year forecast.
The remainder of SCE’s forecast for this account is uncontested, and is
approved.
Transmission Line Maintenance (FERC7.9.1.2.Account 571.150)
Insulator Washing and Road and Right7.9.1.2.1.of Way Maintenance
For each of these forecasts, SCE applied a 5YA cost per mile to its forecast
of line miles.358 In both cases, ORA accepts SCE’s cost per mile, but uses its lower
line mile forecast.359 As discussed in Section 7.9.1.1 above, we adopt SCE’s line
mile forecast. SCE’s five-year averages are undisputed. Therefore, we adopt
SCE’s forecasts for these areas.
Transmission Vegetation Management7.9.1.2.2.
SCE uses 2012 recorded costs plus an additional forecast of the Big Creek
area. SCE describes past challenges in managing trees in the mountainous Big
Creek area, and states that it is launching a new effort to manage vegetation
along the lines in September 2013. SCE will begin with highest risk areas. SCE
argues that this proactive management is necessary under NERC regulations
(NERC-FAC-003-2). SCE bases its forecast on contract costs from its bark beetle
356 SCE-3V8 at 18-19. 357 ORA-8 at 49-50.358 SCE-3V8 at 14-16.359 ORA-8 at 42-44.
- 150 -

A.13-11-003 ALJ/KD1/ar9/jt2/lil PROPOSED DECISION (Rev. 12)
program, which involves similar activities. SCE’s forecast is $2.158 million, all
non-labor.360 SCE’s total transmission vegetation management forecast is $6.503
million, with the remaining $4.345 million representing based on 2012 recorded
values.361
ORA accepts the 2012 recorded costs as a basis for 2015 forecast, but
contests the Big Creek forecast. ORA contends that this project had not begun by
March 21, 2014, and SCE did not have permits to begin. ORA proposes a forecast
of $4.345 million based on recorded 2012 expenses, stating that SCE is not ready
to begin the Big Creek project and that SCE has “embedded” funding to complete
this work if it receives permits.362
SCE responds that it has obtained permission from private landowners to
start work, expects to receive permits during 2014, and does not change its test
year forecast.363
We agree with ORA that possible further permitting delays suggest a
decrease to SCE’s forecast. However, given that SCE has permission to start
work from private landowners, we decline to reduce SCE’s request to zero.
Instead, we approve 50% of SCE’s Big Creek request and all of the other
transmission vegetation management. Thus, we approve a total forecast as
shown below (2012$, millions).
Base ExpensesRequested
Adjustment
Approved
Labor $0.066
$0.066
Non-Labor $4.279
$4.279
360 SCE-3V6P1 at 21-23.361 SCE-03V8 at 17-18.362 ORA-8 at 44-48. 363 SCE-19V6P1 at 11.
- 151 -

A.13-11-003 ALJ/KD1/ar9/jt2/lil PROPOSED DECISION (Rev. 12)
Total $4.345
$4.345
Big Creek
Non-Labor $2.158
$(1.079)
$1.079
Total Expenses
Labor $0.066
$0.066
Non-Labor $6.437
$(1.079)
$5.358
Total $6.503
$(1.079)
$5.424
Transmission Overhead and7.9.1.2.3.Underground Maintenance
SCE forecasts these maintenance costs on the basis of a five-year average,
after subtracting out the cost of significant programmatic maintenance performed
during 2009-2010.364 This forecast is uncontested, and we find it reasonable.
Transmission Line Rating Remediation7.9.1.2.4.
SCE has undertaken a study of line clearance requirements and prioritized
its lines for remediation, including replacing towers, clearing brush, replacing
insulators, and removing slack from lines. A high percentage of expenses are
subject to FERC jurisdiction. SCE’s forecast is based on specific projects,
levelized from 2015 to 2017.365 ORA contends there is insufficient evidence to
justify these expenses, noting that there were no expenses prior to 2013 and
claims that SCE was unable to identify 2013 recorded on a comparable basis to its
request. To develop its forecast, ORA removes all FERC-jurisdictional costs and
does not levelize costs over three years.366 In response, SCE notes that GRC costs
364 SCE-3V8 at 12-14. 365 SCE-3V8 at 20-21. 366 ORA-8 at 50-52.
- 152 -

A.13-11-003 ALJ/KD1/ar9/jt2/lil PROPOSED DECISION (Rev. 12)
are presented on a total company basis.367 We find that SCE’s forecast is
reasonable and adopt it, consistent with our finding that SCE’s jurisdictional
allocation factors are reasonable in Section 15 below.
Substation Inspection and Maintenance7.9.1.3.(FERC Accounts 568.150 and 592.150)
Circuit Breaker Inspection and7.9.1.3.1.Maintenance
SCE explains that substation circuit breakers are complex and require
routine maintenance, including both prescriptive and condition-based
maintenance. SCE performs periodic inspections of a variety of types. SCE’s
forecast is based on a 5YA of recorded costs per breaker times its forecast of
circuit breakers.368 ORA claims that SCE “vastly overstated” the number of new
circuit breakers in 2013 and that the number of breakers actually decreased rather
than increased. ORA proposes a lower forecast of the number of breakers, but
accepts SCE’s unit costs. ORA notes that its forecasts are greater than the
five-year averages.369 SCE asserts that ORA inappropriately relied on numbers of
inspections performed in 2013 rather than the number of breakers actually on the
system. SCE contends its forecast of additional breakers is based on specific
projects and should be relied on rather than historical averages.370 SCE’s forecast,
based on specific projects, is reasonable and should be adopted.
Transformer Inspection and7.9.1.3.2.Maintenance
SCE notes that transformers are among the most expensive and critical
pieces of equipment. SCE’s forecast is based on a 5YA cost per transformer times
367 SCE-19V8 at 9.368 SCE-3V8 at 22-23.369 ORA-8 at 53-57.370 SCE-19V8 at 10-11.
- 153 -

A.13-11-003 ALJ/KD1/ar9/jt2/lil PROPOSED DECISION (Rev. 12)
the forecast number of transformers.371 ORA contends that SCE overstates the
number of distribution transformers, and calculates a lower value based on the
average rate of change (2008-2013) and applying this to 2013 recorded. ORA
accepts SCE’s cost per transformer and number of transmission transformers.372
As above, SCE notes that ORA incorrectly relied on the number of inspections in
2013 rather than the number of transformers.373 SCE’s forecast, based on specific
projects, is reasonable and should be adopted.
Relay Inspection and Maintenance7.9.1.3.3.
SCE implemented a new maintenance program in 2011 that focuses on
relays, among other components, in response to a new NERC standard. SCE
contends this standard drives up documentation costs. SCE also foresees
needing to install cyber security patches in response to future standards. SCE’s
forecast is based on 2012 recorded unit costs times forecast number of
inspections. SCE forecasts 1,258 transmission inspections in 2015 at a cost of
$2,447 each.374 ORA disputes the number of inspections, noting that there has
been a decrease from 2008 to 2012 and that SCE’s 2013 recorded is 300 inspections
lower than 2013 forecast. ORA claims SCE had “ample funding” from the last
GRC to complete relay inspections and that current ratepayers should not be
charged for deferred maintenance. ORA forecasts 779 inspections, based on a
2011-2013 average. ORA proposes to remove costs for FERC jurisdictional
expenses. ORA accepts SCE’s forecast for distribution relays.375 SCE calculates
that it must complete 1,575 inspections per year during 2014-2016 to meet
compliance obligations. SCE claims that it defines deferred maintenance based
371 SCE-3V8 at 24-26.372 ORA-8 at 56-58.373 SCE-19V8 at 12-13.374 SCE-3V8 at 28-30.375 ORA-8 at 58-62.
- 154 -

A.13-11-003 ALJ/KD1/ar9/jt2/lil PROPOSED DECISION (Rev. 12)
on meeting (or missing) regulatory deadlines, not internal schedules, and that it
is on track to meet 2016 compliance obligations. SCE notes again that all costs are
presented on a total company basis.376 We accept SCE’s uncontested distribution
forecast. However, for transmission relay inspections, we agree with ORA that
SCE has not adequately justified its proposed level. We base our forecast on
1,178 relays per year, the rate needed to actually levelize inspections over the
six-year period identified by SCE. We find reasonable and approve SCE’s
uncontested forecast of NERC/CIP-related relay work. Our adopted forecast for
transmission relays (Account 568.150) is shown below (millions of 2012$).
Total $ 3.463
Labor $ 2.874
Non-Labor $ 0.589
Uncontested Forecasts7.9.1.3.4.
SCE’s forecasts for SSID maintenance costs, miscellaneous substation
expenses, miscellaneous equipment inspection and maintenance,377 and
maintenance crew supervision are uncontested. We find SCE’s forecasts for these
activities reasonable.
Capital7.9.2.
SCE’s total 2014-2015 capital forecast is $262.577 million (nominal$), while
ORA recommends $192.226 million. ORA calculates that SCE is requesting an
80% increase in 2015 over 2012 expenditures. For many components of this
forecast, ORA accepts SCE’s 2013-2015 total forecast, but proposes adjustments to
2014-2015 based on SCE’s 2013 recorded expenditures, in order to keep the total
2013-2015 amount equal to SCE’s original application request. SCE opposes these
376 SCE-19V8 at 14-15.377 ORA initially contested the miscellaneous equipment inspection and maintenance forecasts,
but stipulated to SCE’s forecasts in ORA-57R.
- 155 -

A.13-11-003 ALJ/KD1/ar9/jt2/lil PROPOSED DECISION (Rev. 12)
adjustments, claiming that 2013 expenditures over the forecast do not reduce the
need for later expenditures. Many of the relevant expenditures are for
unplanned work. SCE cites several instances in the 2014 PG&E GRC decision
wherein we rejected similar adjustments proposed by ORA.378 Generally, we
uphold that precedent and find that, in the case of unplanned work, there is no
clear inverse relationship or anti-correlation between amounts spent in one year
and later years. Stated differently, overspending in 2013 does not indicate that
lower expenditures are appropriate for 2014-2015. ORA appears to assume that
short-term reversion to the mean should be expected, but provides no evidence
for this assumption. We briefly address several subjects for which ORA makes
this argument below. ORA’s proposed adjustments on this basis are rejected.
However, in other areas, such as replacing long lasting tools and equipment, it is
reasonable to expect that increased spending in one year would lead to decreased
expenditure needs in the immediately following years.
Our adopted capital forecast is summarized below.
Activity SCE Adopted
2014 2015 2014-15 2014 2015 2014-15
Transmission CapitalMaintenance
$10.587 $10.869 $21.456 $10.587 $10.869 $21.456
TransmissionRelocation
$25.218 $26.088 $51.306 $25.218 $26.088 $51.306
Transmission Claims $2.305 $2.366 $4.672 $2.305 $2.366 $4.672
Transmission LineRating Remediation
$24.183 $28.575 $52.757 $24.183 $28.575 $52.757
Transmission SpareParts
$0.104 $0.107 $0.211 $0.104 $0.107 $0.211
Transmission Toolsand Work Equipment
$1.524 $1.558 $3.082 $0.497 $0.508 $1.005
Substation CapitalMaintenance
$37.797 $38.803 $76.600 $37.797 $38.803 $76.600
Online Transformer $2.347 $5.911 $8.258 $2.347 $5.911 $8.258
378 SCE-19V8 at 16-19 and ORA-12 at 27-28. .
- 156 -
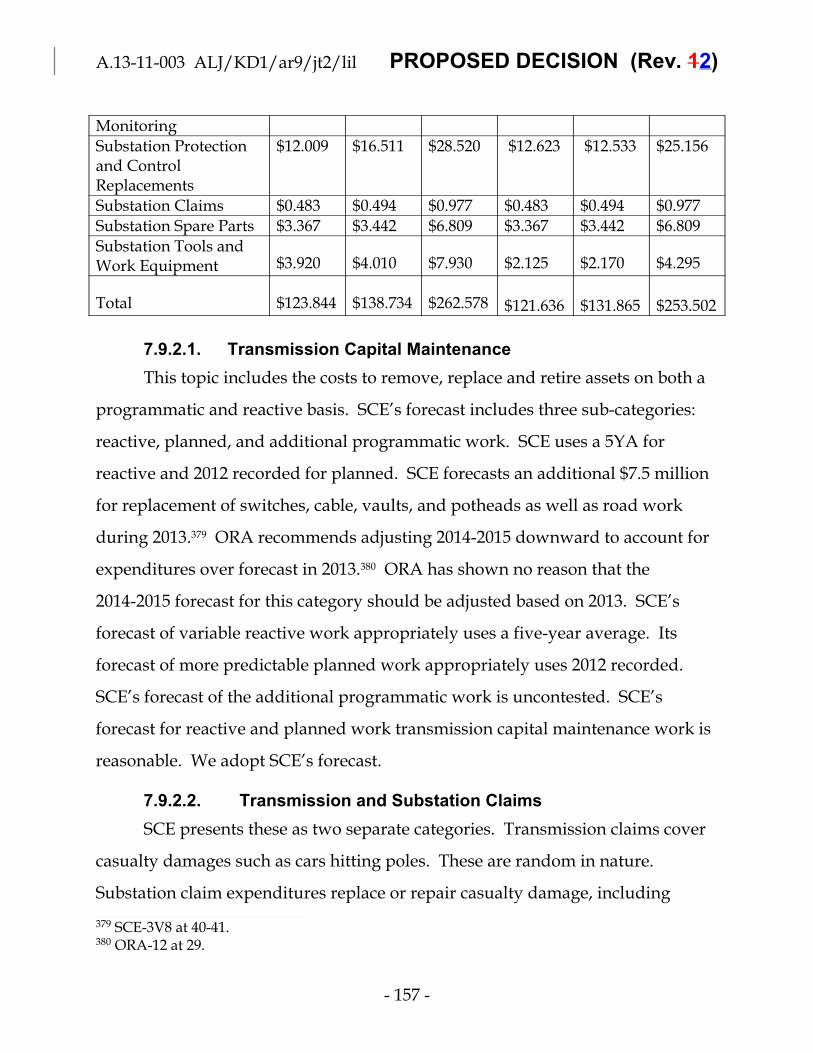
A.13-11-003 ALJ/KD1/ar9/jt2/lil PROPOSED DECISION (Rev. 12)
Monitoring
Substation Protectionand ControlReplacements
$12.009 $16.511 $28.520 $12.623 $12.533 $25.156
Substation Claims $0.483 $0.494 $0.977 $0.483 $0.494 $0.977
Substation Spare Parts $3.367 $3.442 $6.809 $3.367 $3.442 $6.809
Substation Tools andWork Equipment $3.920 $4.010 $7.930 $2.125 $2.170 $4.295
Total $123.844 $138.734 $262.578 $121.636 $131.865 $253.502
Transmission Capital Maintenance7.9.2.1.
This topic includes the costs to remove, replace and retire assets on both a
programmatic and reactive basis. SCE’s forecast includes three sub-categories:
reactive, planned, and additional programmatic work. SCE uses a 5YA for
reactive and 2012 recorded for planned. SCE forecasts an additional $7.5 million
for replacement of switches, cable, vaults, and potheads as well as road work
during 2013.379 ORA recommends adjusting 2014-2015 downward to account for
expenditures over forecast in 2013.380 ORA has shown no reason that the
2014-2015 forecast for this category should be adjusted based on 2013. SCE’s
forecast of variable reactive work appropriately uses a five-year average. Its
forecast of more predictable planned work appropriately uses 2012 recorded.
SCE’s forecast of the additional programmatic work is uncontested. SCE’s
forecast for reactive and planned work transmission capital maintenance work is
reasonable. We adopt SCE’s forecast.
Transmission and Substation Claims7.9.2.2.
SCE presents these as two separate categories. Transmission claims cover
casualty damages such as cars hitting poles. These are random in nature.
Substation claim expenditures replace or repair casualty damage, including
379 SCE-3V8 at 40-41.380 ORA-12 at 29.
- 157 -

A.13-11-003 ALJ/KD1/ar9/jt2/lil PROPOSED DECISION (Rev. 12)
copper theft, and vary significantly year to year. SCE used a 5YA for each of
these items.381 ORA proposes to reduce 2014-2015 on the basis of overspending
in 2013. ORA’s proposal is illogical in context of the random nature of these
claims. SCE’s five-year average forecasts of transmission and substation claims
are reasonable and is adopted.
Transmission Line Rating Remediation7.9.2.3.
This category includes replacing towers, clearing brush, and other efforts
to remediate clearance requirements. SCE’s forecast is project based.382 ORA
proposes to accept SCE’s three-year forecast and reduce 2014-2015 on the basis of
overspending in 2013.383 In response, SCE notes that 2013 recorded was actually
below 2013 forecast and that its revised forecast for 2013-2015 is actually lower
than the original amount that ORA proposes to adopt.384 ORA’s premise is
inaccurate in this instance. SCE’s forecast of line rating remediation is reasonable
and is adopted.
Transmission Relocations7.9.2.4.
Relocations involve moving existing facilities in response to requests from
public or private entities. SCE’s forecast is based on specific projects anticipated,
and SCE expects significant growth in expenditures. Over 80% of forecast
expenditures are customer funded.385 ORA recommends that 2013 recorded
values, adjusted for inflation, be used for 2014-2015 forecast. In support of this,
ORA claims that SCE did not identify any projects starting after 2013.386 In
rebuttal, SCE provides its updated schedule, including specific projects through
381 SCE-3V8 at 43-44 and 52-53.382 SCE-3V8 at 44-45.383 ORA-12 at 31-32. 384 SCE-19V8 at 23-24.385 SCE-3V8 at 42-43. 386 ORA-12 at 30.
- 158 -
A.13-11-003 ALJ/KD1/ar9/jt2/lil PROPOSED DECISION (Rev. 12)
2015. Further, SCE cites two factors increasing relocations: federal
transportation legislation (MAP-21) and increasing residential development.387
SCE provided a reasonable, project-based forecast of these expenditures, and
ORA does not present a persuasive rationale not to adopt this forecast. SCE’s
forecast is adopted.
Transmission Tools and Work Equipment7.9.2.5.
Portable tools and equipment in this category cost more than $1,000, such
as generators and cable pulling equipment that have relatively long lives. SCE
uses 2012 recorded cost as the basis of its forecast noting that transmission work
has increased since 2008 and that it expects the level of work to remain high,
necessitating more tools.388 ORA proposes to accept SCE’s three-year forecast
and reduce 2014-2015 on the basis of overspending in 2013. ORA notes that as of
May 2014, SCE’s annualized spending was below ORA’s forecast.389 In rebuttal,
SCE repeats its arguments about precedent and claims that ORA’s proposal does
not consider safety impacts.390 In this case, we find that SCE has not met its
burden of proof. For the long lasting equipment contemplated here, it is
reasonable to expect that increased spending in one year would lead to a
decreased need to replace equipment in the immediately following years.
Preliminary 2014 recorded information cited by ORA is consistent with that
expectation. We find ORA’s 2014-2015 forecast reasonable and adopt it.
Substation Capital Maintenance7.9.2.6.
This category includes costs to replace assets on a reactive or
programmatic basis. SCE cites two reasons for recent increases in expenditures:
387 SCE-19V8 at 21.388 SCE-3V8 at 46-47.389 ORA-12 at 32-33. 390 SCE-19V8 at 25-26.
- 159 -

A.13-11-003 ALJ/KD1/ar9/jt2/lil PROPOSED DECISION (Rev. 12)
increasing programmatic maintenance and increasing reactive replacements due
to aging infrastructure. SCE anticipates these increases continuing, and therefore
used 2012 recorded to develop its forecast.391 ORA notes that SCE’s forecast was
developed in three parts. For two of the component parts, ORA adjusts
2014-2015 down on the basis of 2013 overspending. For the remaining part, ORA
recommends using 2013 recorded for 2014-2015.392 SCE observes that ORA’s
method is inconsistent and not factually supported.393 We agree with SCE that
ORA’s forecast is baseless. SCE’s forecast of substation capital maintenance is
reasonable and is adopted.
Online Transformer Monitoring7.9.2.7.
SCE proposes this program to monitor dissolved gas and bushings in
transformers in order to provide a more cost-effective means to identify
equipment in need of repair or replacement and reduce in-service failures. SCE’s
forecast is based on its installation plans.394 ORA recommends disallowing
CPUC-jurisdictional expenditures until SCE provides “concrete evidence” that
this program benefits ratepayers. ORA notes that SCE has not included any
savings in its forecast for this program, despite an estimated five-year payback
time.395 SCE notes that in exhibit ALJ-1, SED staff suggests that predictive
maintenance, such as this program may be valuable means of reducing risk.
Further, SCE notes that the business case prepared by its consultants suggests
that this monitoring may allow SCE to maximize transformer life and that a
single year of additional transformer life is sufficient to pay for monitoring of that
transformer.396 SCE’s arguments that transformer monitoring is cost effective are
391 SCE-3V8 at 47-48.392 ORA-12 at 33-34.393 SCE-19V8 at 27-29.394 SCE-3V8 at 49-50.395 ORA-12 at 35.396 SCE-19V8 at 30-31.
- 160 -

A.13-11-003 ALJ/KD1/ar9/jt2/lil PROPOSED DECISION (Rev. 12)
persuasive. SCE’s forecast of online transformer monitoring is reasonable and is
approved.
Substation Protection and Control7.9.2.8.Replacements
This program replaces control equipment approaching the end of its
service life. SCE presents this in three sub-categories: distribution protection
and control system replacement updates dated equipment, digital fault recorder
replacement updates fault recorders to current WECC requirements, and 500 kV
and 220 kV relay replacements which are FERC-jurisdictional. SCE’s forecast is
based on its plan for replacing equipment.397 ORA proposes to accept SCE’s
three-year forecast and reduce 2014-2015 on the basis of overspending in 2013.398
In rebuttal, SCE repeats its arguments about precedent and claims that ORA’s
proposal is not factually supported.399 In this case, we find that SCE has not met
its burden of proof. For the long lasting equipment contemplated here being
replaced according to a multi-year plan, it is reasonable to expect that increased
spending in one year would lead to a decreased need to replace equipment in the
following years. We find ORA’s 2014-2015 forecast reasonable and adopt it.
Substation Tools and Work Equipment7.9.2.9.
Portable tools and equipment in this category cost more than $1,000 such
as generators and power tools that have relatively long lives. SCE uses 2012
recorded as the basis of its forecast noting that capital work has increased relative
to the past and that it expects the level of work to remain high, necessitating
more tools.400 ORA proposes to accept SCE’s three-year forecast and reduce
2014-2015 on the basis of overspending in 2013. ORA notes that as of May 2014,
397 SCE-3V8 at 50-52. 398 ORA-12 at 36-37 and ORA-12A. 399 SCE-19V8 at 32.400 SCE-3V8 at 54-55.
- 161 -
A.13-11-003 ALJ/KD1/ar9/jt2/lil PROPOSED DECISION (Rev. 12)
SCE’s annualized spending was below ORA’s forecast.401 In rebuttal, SCE repeats
its arguments about precedent and claims that ORA’s proposal is not factually
supported and does not consider safety.402 In this case, we find that SCE has not
met its burden of proof. For the long lasting equipment contemplated here, it is
reasonable to expect that increased spending in one year would lead to a
decreased need to replace equipment in the immediately following years.
Preliminary 2014 recorded information cited by ORA is consistent with that
expectation. We find ORA’s 2014-2015 forecast reasonable and adopt it.
Transmission and Substation Spare Parts7.9.2.10.
SCE’s forecasts for transmission and substation spare parts are
uncontested; we find these forecasts reasonable and adopt them.
T&D – Safety, Training, and Environmental Programs7.10.
This chapter addresses costs for safety, training, environmental programs,
and employee-related costs such as informational meetings and employee
recognition. All costs in this area are O&M. SCE’s forecast is approximately $68
million (2012$) compared to: 2012 authorized of $80 million, 2012 recorded of
$58 million, and ORA’s forecast of $58 million. SCE cites lower hiring due to the
timing of the 2012 GRC decision as the primary reason for the difference between
2012 authorized and recorded; ORA notes that SCE was not able to quantify or
document that effect. SCE’s safety statistics show improvement from 2008 to
2012, and SCE states that it believes continued progress can be made by
continuing to provide safety training programs.403 Our adopted forecast for this
area is summarized below.
401 ORA-12 at 38-39. 402 SCE-19V8 at 35-36.403 SCE-03V9 at 1-10; ORA 9 at 35.
- 162 -

A.13-11-003 ALJ/KD1/ar9/jt2/lil PROPOSED DECISION (Rev. 12)
Account Description SCE Adopted
566.250
Employee Recognition for TransmissionPersonnel $0.065 $0.065
Safety Programs for Transmission Personnel $3.338 $3.338
Informational Meetings for TransmissionPersonnel $0.606 $0.606
Transmission Environmental Services $5.174 $5.174
Training Delivery for Transmission Personnel $4.388 $4.388
Training Seat-Time for TransmissionPersonnel $6.775 $6.098
Training Delivery Benefits $ (0.238) $ (0.238)
Total 566.250 $20.108 $19.431
573.250 Transmission Toxic Waste Disposal $0.392 $0.392
582.250 Distribution Environmental Services $2.289 $2.289
588.250
Employee Recognition for DistributionPersonnel $0.489 $0.489
Safety Programs for Distribution Personnel $11.533 $11.533
Informational Meeting for DistributionPersonnel $3.633 $3.633
Training Delivery for Distribution Personnel $10.758 $10.758
Training Delivery Benefits $ (0.643) $ (0.643)
Training Seat-Time for Distribution Personnel $14.345 $12.911
Total 588.250 $40.115 $ 38.681
598.250 Distribution Toxic Waste Disposal $5.120 $5.120
Total $68.024 $65.912
T&D Training Seat-Time (Portions of Accounts 566.2507.10.1.- Transmission and 588.250 - Distribution)
These are the labor and non-labor costs for employees to attend
SCE-sponsored trainings. Non-labor costs include travel to attend trainings.
SCE’s total forecast is $21.120 million, which is $6 million higher than 2012
recorded and $5 million lower than the five-year average. SCE claims that
- 163 -
A.13-11-003 ALJ/KD1/ar9/jt2/lil PROPOSED DECISION (Rev. 12)
reduced hiring and delayed capital projects reduced the need for training in 2012.
SCE states that it intends to hire additional front-line employees to execute the
forecast increases in T&D capital and O&M activities, leading to increased
training needs. SCE’s forecast is based on specific planned training programs for
different job categories and the number of employees expected to attend. Labor
costs are forecast as: number of employees in the training * average wage *
number of hours of training. SCE used a 5YA labor to non-labor ratio to forecast
non-labor expenses.404
For the transmission account, ORA recommends using 2012 recorded for
its total forecasts. ORA notes that costs declined considerably during 2008-2011,
and that timing of the 2012 GRC decision would not explain low 2011 spending.
ORA reviews historical data and concludes that “SCE has spent well below
authorized in this area for a number of years . . . .” Similarly, ORA recommends
2012 recorded for the distribution account.405 In rebuttal, SCE emphasizes that its
forecast is based on program-by-program analysis and claims that ORA’s forecast
is insufficient. SCE notes that ORA’s statements about embedded funding are
illogical because costs for trainings that did not occur in 2012 are not in 2012
recorded. Finally, SCE notes that its total forecast is lower than any of 2008-2011
recorded.406 As in D.12-11-051, we find that SCE’s approach to developing its
forecast by considering specific training needs and number of relevant employees
is preferable to relying only on 2012 recorded. In particular, we note that SCE’s
forecast is considerably lower than the five-year average of recorded costs,
casting doubt on ORA’s analysis. However, as in D.12-11-051, we find that
training costs are directly related to the number of employees, particularly new
404 SCE-3V10 at 17-19.405 ORA-9 at 40-44 and 50-51.406 SCE-19V9 at 5-7.
- 164 -

A.13-11-003 ALJ/KD1/ar9/jt2/lil PROPOSED DECISION (Rev. 12)
employees. Since our total adopted labor forecast is lower than SCE’s it is
reasonable to adopt a 10% lower training forecast. Our adopted forecast is
summarized below (millions of 2012$).
SCE Adopted
Training Seat-Time for Transmission Personnel $6.775 $6.098
Training Seat-Time for Distribution Personnel $14.345 $12.911
Total $ 21.120 $19.008
T&D Training Delivery Benefits (Portions of Accounts7.10.2.566.250 - Transmission and 588.250 - Distribution)
SCE forecasts certain benefits (cost reductions) related to consolidation of
training in Operational Excellence.407 As discussed in Section 25 below, we adopt
SCE’s estimates.
Employee Recognition (Portions of Accounts 566.2507.10.3.and 588.250)
Employee recognition includes awards for safe practices and exemplary
job performance. SCE claims that this program has been scaled down to focus on
safety in recent years and that this type of program is encouraged in the industry.
SCE anticipates future benefits such as fewer injuries and associated costs. SCE’s
forecast is based on 2012 recorded.408 ORA recommends disallowing these
expenses entirely on the basis that they are discretionary, not necessary to
operate the business.409 As noted in Section 10.4 below, SCE contends that these
programs benefit ratepayers. In the case of T&D, we agree with SCE that these
modest programs promote safety and are reasonable costs. We adopt SCE’s
forecasts.
407 SCE-3V9 at 16-17.408 SCE-3V9 at 25-26.409 ORA-9 at 47.
- 165 -

A.13-11-003 ALJ/KD1/ar9/jt2/lil PROPOSED DECISION (Rev. 12)
T&D Environmental Services (Portion of Account7.10.4.566.250 - Transmission and Entirety of Account 582.250- Distribution)
Forecasts for environmental services include expenses for a variety of
services (e.g., water quality) provided by the Corporate Environmental Health
and Safety organization incurred on behalf of T&D projects and recorded in these
T&D FERC Accounts. These are discussed in Section 11.2.2 below, where we
adopt SCE’s forecasts.
Uncontested Issues7.10.5.
There are many uncontested issues in this area, including: three entire
Accounts (573.250, 582.250, and 598.250) and portions of Accounts 566.250 and
588.250. We have reviewed SCE’s forecasts for these issues, and find them
reasonable. SCE’s uncontested forecasts are approved.
T&D – Other Costs and Other Operating Revenue (OOR)7.11.
This chapter addresses O&M expenses for contract management,
write-offs, services, credits and related expense in addition to OOR not related to
the sale of electricity. SCE’s 2012 recorded expenses were $84.5 million (2012$)
compared to $103.3 million authorized; SCE attributes the difference primarily to
the timing of the 2012 GRC decision.410
There are several uncontested accounts in this area. We find reasonable
and adopt SCE’s forecasts for these uncontested items.
Our total forecast for operational support and other costs is shown below
(millions of 2012$).
Account Description SCE Adopted
566.280 Grid Contract Management $ 2.485 $ 2.226
588.280 Distribution Construction Contract $ 0.846 $ 0.846
410 SCE-3V10 at 1-2.
- 166 -
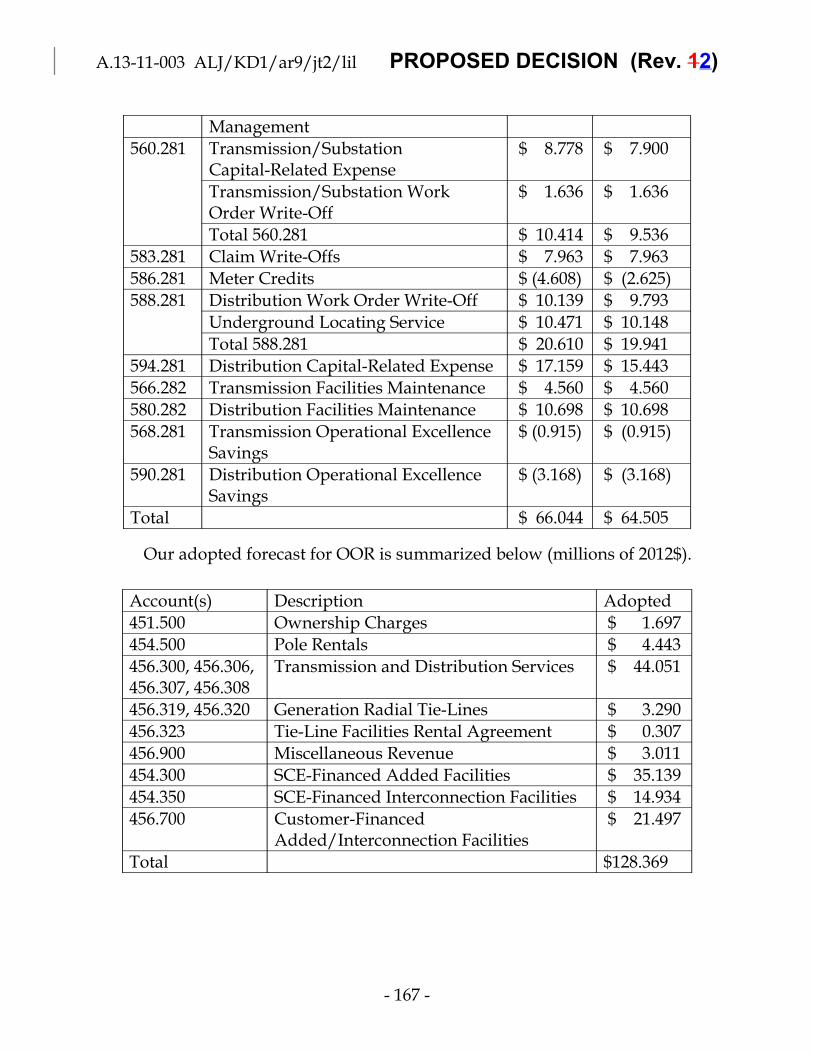
A.13-11-003 ALJ/KD1/ar9/jt2/lil PROPOSED DECISION (Rev. 12)
Management
560.281 Transmission/SubstationCapital-Related Expense
$ 8.778 $ 7.900
Transmission/Substation WorkOrder Write-Off
$ 1.636 $ 1.636
Total 560.281 $ 10.414 $ 9.536
583.281 Claim Write-Offs $ 7.963 $ 7.963
586.281 Meter Credits $ (4.608) $ (2.625)
588.281 Distribution Work Order Write-Off $ 10.139 $ 9.793
Underground Locating Service $ 10.471 $ 10.148
Total 588.281 $ 20.610 $ 19.941
594.281 Distribution Capital-Related Expense $ 17.159 $ 15.443
566.282 Transmission Facilities Maintenance $ 4.560 $ 4.560
580.282 Distribution Facilities Maintenance $ 10.698 $ 10.698
568.281 Transmission Operational ExcellenceSavings
$ (0.915) $ (0.915)
590.281 Distribution Operational ExcellenceSavings
$ (3.168) $ (3.168)
Total $ 66.044 $ 64.505
Our adopted forecast for OOR is summarized below (millions of 2012$).
Account(s) Description Adopted
451.500 Ownership Charges $ 1.697
454.500 Pole Rentals $ 4.443
456.300, 456.306,456.307, 456.308
Transmission and Distribution Services $ 44.051
456.319, 456.320 Generation Radial Tie-Lines $ 3.290
456.323 Tie-Line Facilities Rental Agreement $ 0.307
456.900 Miscellaneous Revenue $ 3.011
454.300 SCE-Financed Added Facilities $ 35.139
454.350 SCE-Financed Interconnection Facilities $ 14.934
456.700 Customer-FinancedAdded/Interconnection Facilities
$ 21.497
Total $128.369
- 167 -
A.13-11-003 ALJ/KD1/ar9/jt2/lil PROPOSED DECISION (Rev. 12)
Grid Contract Management (Account 566.280)7.11.1.
Grid Contract Management group manages interconnection contracts, both
FERC- and CPUC-jurisdictional. After contracts are executed this group
manages them from beginning to end, including: security postings, meter data,
production forecasts, billing, and contract modification or termination. SCE
states that despite an increase in workload, labor costs have remained flat during
2008-2012. SCE includes six additional full-time equivalent employees in its labor
forecast, citing its expectations that the number of contracts managed will double
by the end of 2017. SCE cites several productivity improvements including
templates, improved billing through software, and streamlined tax and reporting
efforts. SCE’s forecast includes a 4.5% annual productivity improvement.
Non-labor costs have been flat from 2009-2012, after a new contract was
implemented. SCE’s non-labor forecast includes an increase at the same ratio as
the labor forecast.411
ORA contends that SCE’s requested increase is not justified, noting that
expenses have fluctuated over the five recorded years. ORA claims that while
SCE has received funding for additional staff in its last two GRCs, staff in this
group has not actually increased. ORA recommends a forecast based on 2012
recorded.412
In rebuttal, SCE contends that ORA’s recommendation ignores the
consistent increase in number of contracts. SCE provides data and analysis
suggesting that it is on track to meet its 2012 authorized staffing levels by late in
2014 and that number of contracts is increasing.413
411 SCE-3V10 at 2-5. 412 ORA-9 at 55-58.413 SCE-19V10 at 4-5.
- 168 -

A.13-11-003 ALJ/KD1/ar9/jt2/lil PROPOSED DECISION (Rev. 12)
SCE’s data shows an approximately 30% increase in contracts from 2012 to
end of August 2014. We agree with SCE that productivity improvements alone
may not be adequate to address the forecast growth in number of contracts.
However, ORA’s point that recorded data does not support SCE’s proposed
increase is well-taken; SCE is likely able to make further productivity
improvements in Grid Contract Management. Accordingly, we reduce the
increment over 2012 recorded to $0.300 million, approximately enough for three
additional employees. Our adopted forecast is shown below (millions of 2012$).
SCE Adopted
Labor $ 2.217 $ 1.981
Non-Labor $ 0.268 $ 0.245
Total $ 2.485 $ 2.226
Meter Credits (Account 586.281)7.11.2.
Neither TURN nor ORA disputes SCE’s forecast of meter credits.
However, this forecast depends directly on the number of new meters adopted in
Section 8.2.1 below. Applying this forecast ($16.269 million in 2015), using the
approach suggested by SCE,414 yields a credit of $2.625 million, which we adopt
here.
Distribution Work Order Write-Offs and Underground7.11.3.Utility Locating Service (Account 588.281)
For distribution work order write-offs, SCE forecasts $10.139 million
(2012$) based on a five-year average, excluding the Catalina undersea cable and
50% of a satellite system based on guidance in D.12-11-051.415 ORA proposes a
three-year average forecast of $8.759 million, citing a lack of detail in SCE’s
documentation.416 TURN proposes removing two write-offs from SCE’s
414 SCE-19V10 at 8-9.415 SCE-3V10 at 11-13.416 ORA-9 at 59-60.
- 169 -

A.13-11-003 ALJ/KD1/ar9/jt2/lil PROPOSED DECISION (Rev. 12)
calculation. For one write-off, TURN claims that the entire amount has been
recovered; for the other, TURN contends the original provision was made in
error and that ratepayers lost the time value of money due to the escalation
calculation. Adjusting for these, TURN recommends a forecast of $9.793
million.417 SCE contends that ORA’s recommendations should be rejected
because SCE’s forecast follows our guidance. SCE argues that TURN’s proposal
to exclude the first past write-off requires a “complicated and burdensome
exercise” and that reversals in write-offs in one period naturally offset write-offs
at that time. For the second proposed change, SCE explains that the original
provision was not made in error and provides an illustration and recommends
against an escalation rate adjustment provision.418 In hearings, SCE admitted that
the first write-off was caused by an organizational change, represented a rare
circumstance, had been at least partly billed, but the amount collected was
unknown.419 We find that SCE has not adequately demonstrated that ratepayers
have not lost the time value of money from the second adjustment as the impact
of escalation is not shown in SCE’s illustration or TURN-50. Further, we do not
agree with SCE that TURN’s proposal requires a complex analysis, and we do not
require any general new reporting for write-offs. TURN’s proposal is a
reasonable adjustment to the recorded write-offs and is adopted.
For underground locating services, SCE forecasts $10.471 million based on
a four-year (2009-2012) average. SCE excludes 2008 because of a significant rate
change from one of its suppliers in 2009.420 ORA proposes forecasting based on
the 2012 recorded amount: $9.850 million. ORA notes that 2012 is comparable to
417 TURN-5 at 35-36.418 SCE-19V10 at 11-13.419 10 RT 939-943.420 SCE-3V10 at 16-18.
- 170 -
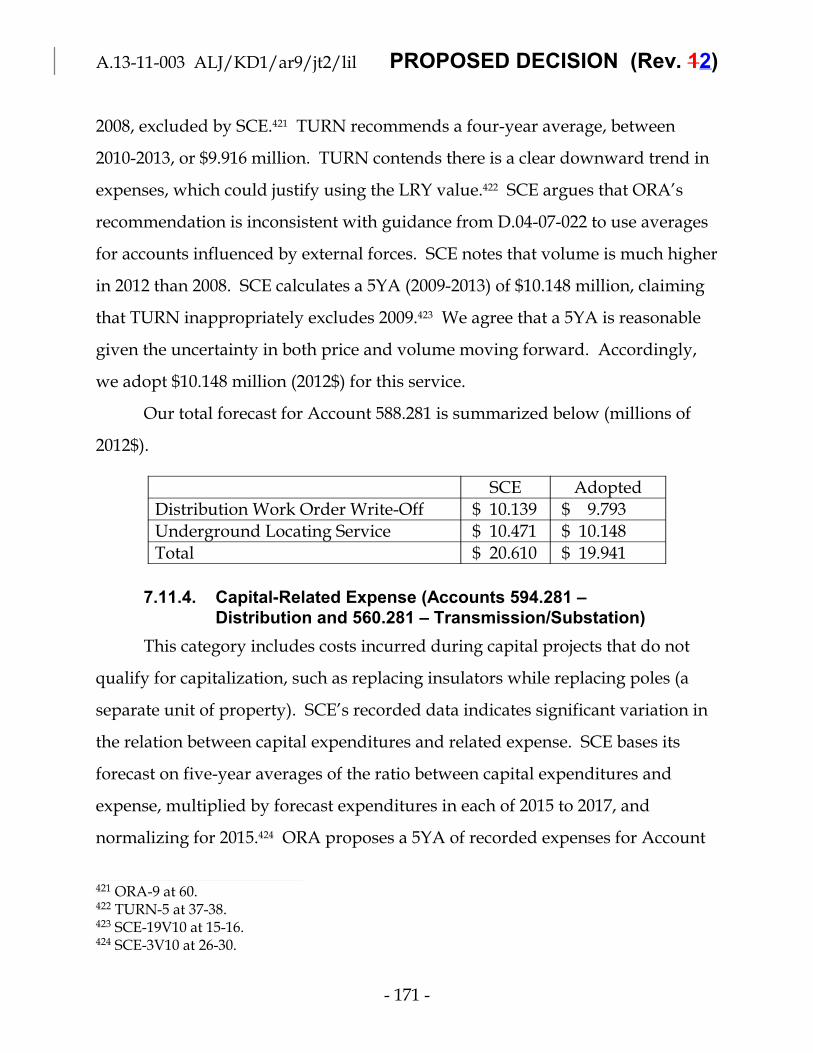
A.13-11-003 ALJ/KD1/ar9/jt2/lil PROPOSED DECISION (Rev. 12)
2008, excluded by SCE.421 TURN recommends a four-year average, between
2010-2013, or $9.916 million. TURN contends there is a clear downward trend in
expenses, which could justify using the LRY value.422 SCE argues that ORA’s
recommendation is inconsistent with guidance from D.04-07-022 to use averages
for accounts influenced by external forces. SCE notes that volume is much higher
in 2012 than 2008. SCE calculates a 5YA (2009-2013) of $10.148 million, claiming
that TURN inappropriately excludes 2009.423 We agree that a 5YA is reasonable
given the uncertainty in both price and volume moving forward. Accordingly,
we adopt $10.148 million (2012$) for this service.
Our total forecast for Account 588.281 is summarized below (millions of
2012$).
SCE Adopted
Distribution Work Order Write-Off $ 10.139 $ 9.793
Underground Locating Service $ 10.471 $ 10.148
Total $ 20.610 $ 19.941
Capital-Related Expense (Accounts 594.281 –7.11.4.Distribution and 560.281 – Transmission/Substation)
This category includes costs incurred during capital projects that do not
qualify for capitalization, such as replacing insulators while replacing poles (a
separate unit of property). SCE’s recorded data indicates significant variation in
the relation between capital expenditures and related expense. SCE bases its
forecast on five-year averages of the ratio between capital expenditures and
expense, multiplied by forecast expenditures in each of 2015 to 2017, and
normalizing for 2015.424 ORA proposes a 5YA of recorded expenses for Account
421 ORA-9 at 60.422 TURN-5 at 37-38.423 SCE-19V10 at 15-16. 424 SCE-3V10 at 26-30.
- 171 -

A.13-11-003 ALJ/KD1/ar9/jt2/lil PROPOSED DECISION (Rev. 12)
594.281, but accepts SCE’s forecast for 560.281. ORA cites its belief in embedded
funding and notes that SCE’s capital expenditure forecast may not be entirely
adopted.425 SCE discusses certain inconsistencies in ORA’s testimony, including
that ORA only makes its proposal for the FERC account for which it leads to a
reduction. SCE concludes that we should adjust these forecasts only based on
adjustments to the capital forecast, excluding pole loading.426 We agree with SCE
that this forecast should be based on the historical relationship and the adopted
capital forecast. Accordingly, we adjust SCE’s forecasts for each account by 10%
to approximate our reductions to non-pole loading capital expenditures, as
shown below (millions of 2012$).
Account Description SCE Adopted
560.281Transmission/Substation Capital-RelatedExpense 0020 $ 8.778 $ 7.900
594.281 Distribution Capital-Related Expense $ 17.159 $ 15.443
Facility O&M (Accounts 566.282 –7.11.5.Transmission/Substation and 580.282 – Distribution)
These costs are for certain facilities occupied by T&D personnel, such as
cleaning, landscaping, and maintenance. SCE contends that costs were flat
during 2008-2010 and that decreases in 2011-2012 were due to short-term cost
savings (e.g., due to reduced frequency of certain cleanings) and SCE’s concern
with the timing of the 2012 GRC decision. SCE uses 2011 as the basis of its
forecast, which SCE claims includes the results of aggressive cost-cutting relative
to earlier years.427 TURN recommends averaging 2011-2012, contending that
some of the changes made during 2012 should be continued.428 In rebuttal, SCE
425 ORA-9 at 60-62.426 SCE-19V10 at 17-18. 427 SCE-19V10 at 18-23. 428 TURN-5 at 38-39.
- 172 -
A.13-11-003 ALJ/KD1/ar9/jt2/lil PROPOSED DECISION (Rev. 12)
accepts a small change proposed by TURN related to spill prevention, but rejects
TURN’s proposal to average 2011-2012. SCE contends that 2011 already includes
aggressive savings and that 2012 maintenance practices are unsustainable.429 We
encourage SCE to continue to pursue cost-effective cleaning and maintenance
strategies, while protecting employees and assets. We find SCE’s forecast based
on 2011 reasonable, and agree that 2012 may represent unsustainably low levels
of maintenance.
SCE-Financed Added and Interconnection Facilities7.11.6.(Accounts 454.300 and 454.350)
Added facilities are facilities owned by SCE in addition to those required
for base service. Interconnection facilities connect a customer’s generator to
SCE’s system. SCE may choose to finance these facilities. SCE charges the
relevant customers a monthly charge designed to ensure that general customers
do not pay costs associated with these assets, and the revenues are recorded to
OOR. SCE created its forecasts based on forecast net investment, multiplied by
applicable rates, and normalized 2015 through 2017.430 ORA recommends a
five-year average, claiming that SCE’s method is less reliable.431 TURN accepts
SCE’s method, but proposes a different “erosion” rate (i.e., the amount of
contracts terminating) based on 2007-2012 rather than 2003-2012, as proposed by
SCE. TURN claims the first four years had a much higher erosion rate and that
the later years are “more reflective” of the forecast period.432 In rebuttal, SCE
accepts ORA’s forecast based on identifying some new, additional projects. SCE
429 SCE-19V10 at 19-20.430 SCE-3V10 at 47-49.431 ORA-9 at 69-72.432 TURN-5 at 40-41.
- 173 -
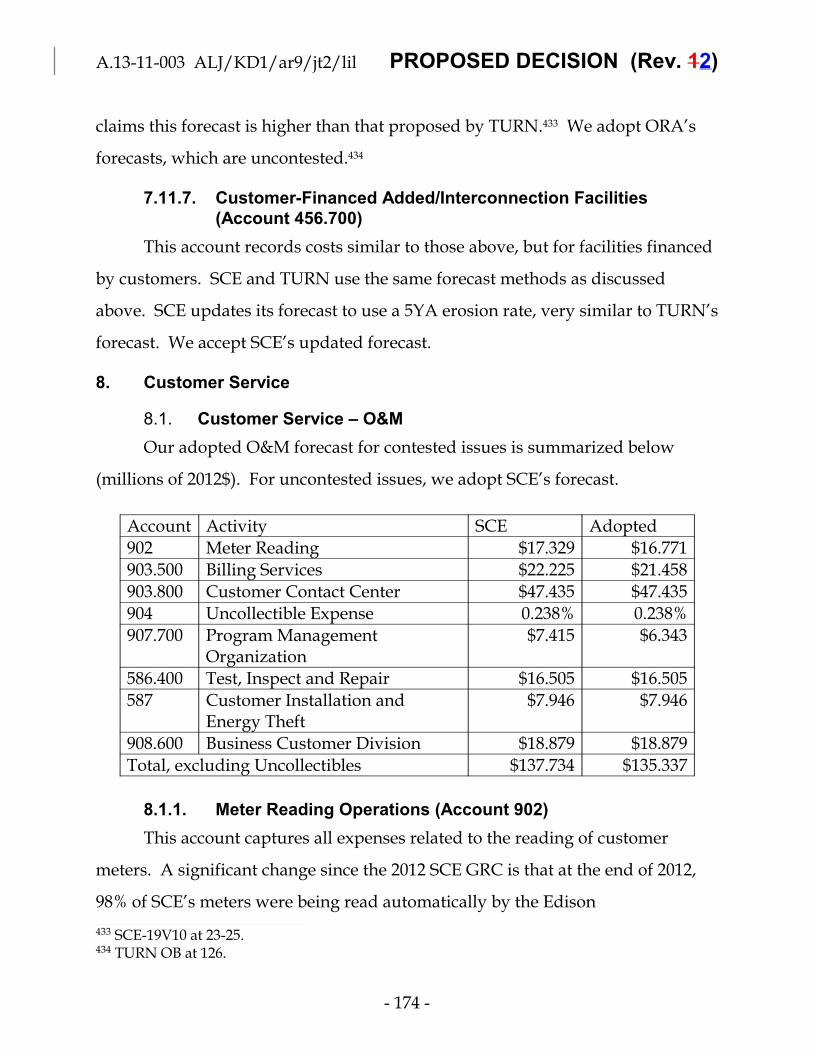
A.13-11-003 ALJ/KD1/ar9/jt2/lil PROPOSED DECISION (Rev. 12)
claims this forecast is higher than that proposed by TURN.433 We adopt ORA’s
forecasts, which are uncontested.434
Customer-Financed Added/Interconnection Facilities7.11.7.(Account 456.700)
This account records costs similar to those above, but for facilities financed
by customers. SCE and TURN use the same forecast methods as discussed
above. SCE updates its forecast to use a 5YA erosion rate, very similar to TURN’s
forecast. We accept SCE’s updated forecast.
Customer Service8.
Customer Service – O&M8.1.
Our adopted O&M forecast for contested issues is summarized below
(millions of 2012$). For uncontested issues, we adopt SCE’s forecast.
Account Activity SCE Adopted
902 Meter Reading $17.329 $16.771
903.500 Billing Services $22.225 $21.458
903.800 Customer Contact Center $47.435 $47.435
904 Uncollectible Expense 0.238% 0.238%
907.700 Program ManagementOrganization
$7.415 $6.343
586.400 Test, Inspect and Repair $16.505 $16.505
587 Customer Installation andEnergy Theft
$7.946 $7.946
908.600 Business Customer Division $18.879 $18.879
Total, excluding Uncollectibles $137.734 $135.337
Meter Reading Operations (Account 902)8.1.1.
This account captures all expenses related to the reading of customer
meters. A significant change since the 2012 SCE GRC is that at the end of 2012,
98% of SCE’s meters were being read automatically by the Edison
433 SCE-19V10 at 23-25. 434 TURN OB at 126.
- 174 -
A.13-11-003 ALJ/KD1/ar9/jt2/lil PROPOSED DECISION (Rev. 12)
SmartConnect® (ESC) system. By the end of 2015 the level of automated meter
reading/data collecting is expected to increase to 99%. However, for the 1% of
customers that opt-out of the ESC system, which SCE states is about 52,500
meters, these will still need to be manually serviced. SCE forecasts total costs of
meter reading in 2015 to be $0.31 per read, compared to $0.86 in 2008.
SCE originally sought $19.255 million ($13.821 million Labor and $5.434
million Non-labor) for TY2015, an increase of $6.035 million (46%) over 2012
recorded adjusted expenses of $13.220 million with adjustments for ESC
incremental costs and benefits. Future year adjustments include ongoing
incremental ESC costs of $5.740 million, customer growth of $273,000, a program
change adjustment of $1.146 million for ESC opt-out meter reading costs, and
Operational Excellence savings of $1.123 million to be achieved by lowering
staffing levels.435
ORA recommends the Commission adopt a forecast of $14.544 million
($10.720 million Labor and $3.823 million Non-labor) which is 25% less than
SCE’s forecast.436
TURN recommends the Commission authorize $12.984 million which is
36% less than SCE’s forecast.437
ORA’s main argument to adopt a forecast 25% less than SCE’s forecast is
that it is consistent with SCE’s 2013 recorded expenses because 2013 should be
representative of ESC steady-state operations.438 TURN proposes a related
reduction in automatic meter reading costs of $1.4 million based on 2013
recorded, arguing that year is more representative than 2012, used by SCE.
435 SCE-04V2 at 13-22.436 ORA-13 at 12, Lines 4-18437 TURN-08A at 33.438 ORA-13 at 12, Lines 6-9
- 175 -

A.13-11-003 ALJ/KD1/ar9/jt2/lil PROPOSED DECISION (Rev. 12)
SCE responds that it was only by the end of 2012 that 98% of SCE’s meters
were being read automatically by the ESC system. The ESC system/program is
still in the infant stages and will take time to mature and reach a steady-state of
operations. As such, ESC SOC cost is still in a dynamic state as are the Opt-Out
Program costs. SCE notes that SOC hiring was not completed during 2012 and
that SOC has been adding services in 2013 and 2014. Some of these services also
entail further expenses such as leased air time. SCE argues that TURN
misunderstands the 2013 data.439
SCE has shown that there are important changes occurring at SOC that are
not captured by historical data. We find that SCE’s forecast of automatic meter
reads via the ESC system and SOC costs is most reasonable.
In update testimony, SCE lowered its labor forecast related to manual
meter reading by $1.926 million.440 In light of this adjustment, portions of ORA’s
and TURN’s comments on manual meter reading are moot. TURN’s proposed
reduction of $0.558 million for manual readings of Non-Opt Out meters is
reasonable.
Therefore we find it reasonable to adopt a forecast for O&M in this account
of $16.771 million (2012$) based on SCE’s updated forecast and TURN’s
adjustment.
Billing Services (Account 903.500)8.1.2.
Expenses recorded to this account are for routine billing, special billing,
rebilling and customer account analysis.
For 2015, SCE originally forecast $22.277 million ($19.773 million Labor and
$1.893 million Non-Labor),441 a 2.5% increase for this subaccount. The forecast is
439 SCE-20 at 3-8.440 SCE-74 at 3. 441 SCE-04V2 at 85.
- 176 -

A.13-11-003 ALJ/KD1/ar9/jt2/lil PROPOSED DECISION (Rev. 12)
based on 2012 adjusted and recorded data and includes upward adjustments of
(1) $2.057 million adjustment for incremental Meter Data Management System
steady-state billing exception related costs; (2) a $435,000 adjustment to reflect
customer growth; and (3) $1.069 million adjustment for program changes
including program enrollments, support for the enlarged font and Braille bill
format, and funding for a base level of credits for two of SCE’s Service
Guarantees.442 SCE reduced its labor forecast by $0.052 million after hearings and
briefs.443
ORA recommends the following be denied: SCE’s Service Guarantee
Program funding request of $173,000; SCE’s request for incremental funding of
$250,000 for the Medical Baseline program; SCE’s request for incremental
funding of $515,000 for the Home Area Network (HAN); and SCE’s request for
$79,000 incremental funding to support customer enrollments in customer
Lifestyle Packages.444
ORA cites the last three GRC’s445 in which we agreed that shareholders
should continue to fund payments of inconvenienced customers. This is clearly
stated in SCE’s TY 2006 GRC Decision:
Regarding the payments to customers, these are payments thatresult from the company not meeting its commitments toindividual customers. If the company is unable to meet itscommitments, the shareholders and not the ratepayers should beresponsible for reimbursing the inconvenienced customer.446
Therefore, we deny SCE’s request of $173,000 for the Service Guarantee
Program.
442 SCE OB at 172-173.443 SCE-74 at 3.444 ORA-13 at 31-34.445 D.06-05-016 at 122; D.09-03-025 at 108; D.12-11-051 at 228.446 Ibid.
- 177 -
A.13-11-003 ALJ/KD1/ar9/jt2/lil PROPOSED DECISION (Rev. 12)
SCE’s Medical Baseline Program forecast was based on historic growth and
the historic ratio of enrolment volume to total program participation and ORA
did not dispute the 9% historic growth rate in total medical baseline
participation.447
Therefore, we find SCE’s request for incremental funding of $250,000 for
the Medical Baseline program reasonable.
ORA contends that the forecast in the increase of HAN enrollments in
2015TY over 2012 recorded expenses is not significant enough to increase
funding for the HAN, and SCE discontinued the Lifestyle Package.448
Therefore, we do not adopt SCE’s recommendation for incremental
funding of $515,000 and $79,000 for HAN and customer enrollments in customer
Lifestyle Packages respectively.
SBUA recommends the Commission reduce SCE’s Customer Service
forecast for capital requirements by at least 20%.449 SBUA challenged SCE’s
self-reported Service Guarantee results and is concerned SCE is moving too fast
with Customer Service software projects which will not be beneficial to small
businesses.450 SBUA did not provide any evidence to substantiate questioning
the validity of SCE’s results and only speculate that Customer service software
projects will not be beneficial to small businesses.
Therefore we do not accept SBUA’s recommendations.
Customer Contact Center (Account 903.800)8.1.3.
Costs recorded in this subaccount relate to customer contact centers
providing 24-hour access to an SCE representative. In this rate cycle, SCE
assumes more calls and more complex problems that take longer to resolve.
447 ORA-13 at 33-34.448 ORA-13 at 34.449 SBUA-01 at 6.450 Ibid. at 20.
- 178 -

A.13-11-003 ALJ/KD1/ar9/jt2/lil PROPOSED DECISION (Rev. 12)
SCE’s revised forecast of $47.435 million is an increase over 2012. The
forecast is based on 2012 recorded costs plus adjustments for (1) incremental
ESC-related costs of $3.533 million; (2) customer growth of $956,000; (3) program
changes of $2.625 million for emerging customer contact channels and increased
compensation for Customer Service Representatives (CSRs); and (4) a cost
reduction of $4.731 million for Operational Excellence initiatives.451
ORA recommends a lower increase in ESC related costs, based on fewer
employees and no increase in phone bills. ORA rejects the customer growth
adjustment. ORA rejects SCE’s proposed increase in ratio of supervisors to CSRs
and SCE’s proposed $2.00 per hour wage increase for CSRs, claiming the Total
Compensation Study (TCS) discussed below in Section 9 shows that CSR
compensation is above market.452
TURN recommends no rate adjustment for CSR wage increases, claiming
that this increase is implicitly captured by the escalation rates adopted in Section
18 below.453
SCE contends that ORA’s recommendations do not consider the factors
driving increased Average Handle Time and thus Customer Contact Centercosts,
such as new ESC data enabling CSRs to provide more services to customers as
“Energy Advisors.” SCE explains that phone bills are not included in CSRs’
non-labor expenses. Further, SCE explains that although customer-call volume
has declined, total customer-contact volume has increased. Finally, SCE argues
that increased supervision and salaries are necessary to support CSRs handling
increasingly complex calls. These increases are not covered in the attrition year
mechanism, which is targeted at inflation.454
451 SCE OB at 175 and SCE-74 at B-1.452 ORA-13 at 41-45.453 TURN-8 at 42.454 SCE-20 at 34-45.
- 179 -
A.13-11-003 ALJ/KD1/ar9/jt2/lil PROPOSED DECISION (Rev. 12)
We agree with SCE that call center employees face increasingly complex
tasks, warranting both increased supervision and increased wages, and further
that these specific wage increases are tied to a change in job skills required, not
general inflation. Therefore, we adopt SCE’s forecast.
Uncollectible Expense (Account 904)8.1.4.
Costs recorded in this subaccount relate to expenses for all revenue
components of uncollectible customer accounts. Historically, recorded expenses
are authorized based on an estimate of uncollectible expense factor expressed as
a percent of gross SCE revenue. This “uncollectible factor” is applied to various
components of SCE’s revenue as each is reviewed in proceedings other than the
GRC.
For TY2015, SCE forecasts an uncollectible factor of 0.238%, based on a
5YA before removal of the impact of the residential disconnection Order
Instituting Rulemaking (OIR Impact). This proposal is above the current factor of
0.205%455 and above the 2012 recorded factor excluding OIR Impact of 0.222%. In
the 2012 GRC we found that a 10-year average of recorded uncollectible factors
was reasonable.456 The 10-year average stated by SCE is 0.201%.457
However, ORA recommends that SCE’s uncollectible factor be based upon
the 2012 LRY factor of 0.222% with no adjustments for the impact that the change
in OOR and OIR deposit policy change will have on future uncollectible
expense.458 TURN simply recommends reducing SCE’s uncollectible expense by
$1.3 million, the uncollectible portion of customer bills that it believes will be
paid by the California Climate Credit and other greenhouse gas revenues.459
455 D.12-11-051 at 337.456 D.12-11-051 at 337.457 SCE-04V2, Figure IV-22 at 132.458 ORA-13 at 50.459 TURN-05 at 117.
- 180 -

A.13-11-003 ALJ/KD1/ar9/jt2/lil PROPOSED DECISION (Rev. 12)
We agree with SCE and the prior GRC decision that a historical average is
appropriate to avoid undue influence of variable economic factors. SCE’s
forecast is reasonable. We agree with SCE that TURN’s suggestion of
incorporating the California Climate Credit and other GHG revenues would be
double counting.
Program Management Organization (PMO)8.1.5.(Account 907.700)
Costs recorded in this subaccount relate to costs for SCE’s PMO. The PMO
develops and maintains the Customer Service long-term capital systems and
business capabilities plan, the portfolio planning, and governance process and
assesses the sustainability of critical systems.
For TY2015 SCE forecasts $7.415 million ($3.936 million Labor and $3.479
million Non-Labor) a $1.437 million increase (19%) over 2012. The forecast is
based on 2012 recorded expenses with upward adjustments of (1) $630,000 for the
development of optimized data management and complex business analytics; (2)
$267,000 to reflect the total annual costs associated with the three employees it
hired in 2012; and (3) $541,000 to support 2014 to 2017 forecasts of capital
software projects.460
The expenses recorded in this account demonstrate year-to-year historical
cost fluctuations.461 The dispute here is whether or not SCE provided adequate
details as to what additional expenses will be incurred in TY2015. ORA and
TURN both recommended using multi-year averages, 4 and 6 years respectively.
ORA’s forecast removed outlier expenses within the 2008-2012 data and
recommends a forecast of $6.343 million which is $1.072 million (15%) less than
SCE’s request. TURN uses a 2008-2013 average, noting that SCE forecast a $1.06
460 SCE OB at 179.461 SCE-04V2, Figure VI-28 at 166.
- 181 -
A.13-11-003 ALJ/KD1/ar9/jt2/lil PROPOSED DECISION (Rev. 12)
million increase in 2013, but only recorded a $0.072 million increase.462 SCE
acknowledges this fluctuation as a result of project lifecycles and contends that
TURN and ORA ignore known information about additional costs (e.g. data
management, portfolio oversight staffing).463
Because of the historical fluctuations resulting from the length of project
lifecycles and the lack of information of the current project lifecycles in SCE’s
forecast, we adopt ORA’s proposed $6.343 million (15% less than SCE’s request)
for TY2015. We agree with TURN that the fact that SCE’s 2013 recorded results
are well below SCE’s forecast, despite including a significant portion of the
increase calls the validity of SCE’s forecast increases into question. This forecast
is a significant increase over 2012 recorded, and allows SCE some funding to
implement the additional functions it proposes.
Test, Inspect and Repair (Account 586.400)8.1.6.
Costs recorded in this subaccount relate to SCE’s Electrical Metering
Services, Engineering and Meter Shop operations, and the field maintenance and
repair of electric billing and load survey meters.
For TY2015 SCE forecasts costs of $16.505 million an increase of
approximately 24% over 2012 recorded expenses. The forecast is based on 2012
recorded expenses with upward adjustments for (1) ESC incremental costs of
$2.831 million; (2) customer growth related expenses of $278,000; (3) program
changes of $1.263 million for acceptance testing of 50 percent of all SmartConnect
meters that are returned from the manufacturer under warranty; and (4)
Operational Excellence savings of $1.183 million for consolidation of
management and supervisory positions, as well as technical specialists,
462 TURN-8A at 45-46.463 SCE-20 at 46.
- 182 -

A.13-11-003 ALJ/KD1/ar9/jt2/lil PROPOSED DECISION (Rev. 12)
engineering, administrative, and analytical support personnel throughout all
functional areas in the 26 field locations.464
For TY2015, ORA recommends $13.210 million which is $3.464 million
(21%) less than SCE’s request for TY2015. Specifically, ORA recommends no
additional funding for ESC incremental costs of $2.831 million and no additional
funding of $1.262 million reflecting added O&M costs of performing warranty
meter acceptance testing.465
SCE rejects ORA’s arguments for a variety of reasons including that O&M
in this account is related to the total population of meters instead of new meters
and that there are new functions and new employees required in the ESC.466
We find that SCE’s revised forecast of $16.505 million is reasonable. SCE
demonstrated that ORA did not recognize that 2013 was not a reflective of the
Test Year, and the implementation of ESC is still in a state of ongoing change and
has not reached a steady-state in which there is a stable state of expenses.
Customer Installation and Energy Theft Expense8.1.7.(Account 587)
SCE‘s TY2015 forecast of $7.946 million ($6.947 million Labor and $0.999
million Non-Labor) is a 14% increase above 2012 recorded expenses. Adjustments
include (1) ESC incremental costs of $1.180 million for two new energy theft
programs and (2) customer growth related expenses of $144,000.
SCE’s reasoning for the increase is that the impact ESC has had on
Customer Installation and Energy Theft operating costs incurred prior to 2012 are
not representative of future expectations and thus are not suitable to support the
use of historical averages or trends to forecast future costs.467
464 SCE-04V2 at 23-32 and SCE-74 at B-1.465 ORA-13 at 19-23.466 SCE-20 at 52-57.467 SCE-04V2 at 49.
- 183 -

A.13-11-003 ALJ/KD1/ar9/jt2/lil PROPOSED DECISION (Rev. 12)
ORA contends that ESC deployment was completed in 2012, and that 2013
recorded expenses declined relative to 2012. Accordingly, ORA recommends
using 2012 recorded.468
We agree with SCE that 2012 is not representative in this instance. With
the implementation of ESC and the accuracy of the data being analyzed and the
ability to detect patterns of theft which triggers follow-up and investigations that
previously would not have happened, new expenses will arise. Again the theme
of the impact of the newly implemented ESC is displayed, as this is a maturing
program that has not yet reached a steady state. SCE’s forecast for Account 587
of $7.946 million ($6.947 million Labor and $0.999 million Non-Labor) is
reasonable.
Business Customer Division (Account 908.600)8.1.8.
SCE forecasts $18.879 million based on 2012 recorded and three
adjustments, for a net reduction of $1.340 million.
SBUA made a number of specific recommendations on funding levels for
specific issues of interest to small commercial customers. Chief among these
recommendations is that the Commission should condition approval of SCE’s
Economic Development Services (EDS) funding on the promise that SCE will
spend 30% of this funding to support retention of small businesses as defined
under the California Department of General Services.469 SCE responds that this
recommendation is impractical because SCE does not track relevant data and that
that SBUA ignores the existing EDS contributions to small business.470
We agree with SCE. SBUA’s recommendations are general based on its
witness’s expert opinions but does not provide evidence that their
468 ORA-13 at 26.469 SBUA-1 at 6.470 SCE-20 at 47-49.
- 184 -

A.13-11-003 ALJ/KD1/ar9/jt2/lil PROPOSED DECISION (Rev. 12)
recommendation benefits ratepayers. SCE’s forecast for this account is otherwise
uncontested, and we find it reasonable.
Customer Service – Capital8.2.
Meter Services Organization (MSO)8.2.1.
This section addresses capital requirements for the MSO. The largest
component of the MSO general capital forecast is for meters. SCE’s forecast is
divided into four components: new growth meter installations, replacement
meters, legacy meters, and Real Time Energy Meters (RTEM).471
SCE originally forecast $28.508 million in 2014 and $33.766 million in 2015
in MSO capital expenditures.
ORA recommend a total of $11.613 million in 2014, and $12.457 million in
2015 in MSO capital expenditures.
In the 2012 GRC SCE forecasted $73.288 million in meter capital
expenditures for 2010-2012. The Commission adopted $51.3 million for meter
capital expenditures for the same time frame. SCE’s actual recorded meter
capital expenditures form 2010-2012 was $31.709 million. SCE spent only 62% of
the Commission authorized meter capital expenditures for 2010-2012.
In this GRC, the main driver creating the difference in SCE and ORA’s
forecast is the number of meters forecasted in each of their calculations. In
Section 16 below, we adopt TURN’s forecast of new meter connections. The
parties agree that the new meter connections forecast should be the basis of the
new growth meter installations.
SCE’s revised meter unit cost forecast is uncontested.472 We apply these
unit costs to our adopted new meter connections to calculate a new meter
installation expenditure forecast.
471 SCE-04V2 at 60.472 SCE-20 at 62-63.
- 185 -

A.13-11-003 ALJ/KD1/ar9/jt2/lil PROPOSED DECISION (Rev. 12)
For residential replacement meters, ORA proposes a method based on the
ratio of growth meters to replacement meters.473 SCE shows there is no
correlation between these quantities.474 We find SCE’s forecast reasonable.
For Commercial and Industrial (C&I), agricultural, and RTEM replacement
meters, ORA proposes to use 2013 recorded meter volumes in place of SCE’s
five-year average.475 SCE rejects ORA’s approach as arbitrary, and claims that the
averaging method is appropriate to smooth fluctuations in the pattern. SCE also
notes that some meter replacements during 2010-2012 were charged to the ESC
balancing account and that ESC deployment has delayed some RTEM
replacements.476 SCE’s data shows a clear downward trend for these volumes,
with overall changes from 2008 to 2013 from negative 77% to negative 83%. SCE
has not adequately explained why it does not foresee this trend to continue in the
future. Accordingly, we adopt ORA’s proposed volumes.
For RTEM meter unit costs, ORA proposes using 2013 recorded value of
$1,400.477 SCE neither rebuts this value, nor explains its own proposed value in
testimony.478 ORA’s value is reasonable and is adopted.
For legacy/opt-out meters, ORA accepts SCE’s unit costs, but proposes
lower volumes based on recorded monthly increases in opt-out customers.479
SCE does not rebut this proposal, and in update testimony, SCE reduces its
forecast, consistent with D.14-12-078. We adopt SCE’s updated forecast.
SCE requests funding for 16,667 delayed ESC meter installations in 2015.
SCE also plans to replace 1,010 outdated agricultural meters (called PCAN
473 ORA-13 at 68.474 SCE-20 at 64-65. 475 ORA-13 at 69-72.476 SCE-20 at 66-67.477 ORA-13 at 72.478 SCE-4V2 at 65, SCE-20.479 ORA-13 at 69-70.
- 186 -

A.13-11-003 ALJ/KD1/ar9/jt2/lil PROPOSED DECISION (Rev. 12)
meters) during 2014-2016, claiming they are obsolete and a safety hazard.480 ORA
recommends a slower replacement rate for the PCAN meters, noting that SCE
had not begun this project or selected a contractor by May 2014. ORA proposes
rejecting the delayed installations outright, noting that SCE recorded capital
expenditures for this program in 2013, counter to its direct testimony.481 SCE
does not rebut either of these positions. We find ORA’s forecast reasonable.
For other items, SCE’s forecast is undisputed and is adopted. Our adopted
forecast is summarized below (millions of nominal$).
Growth Meters 2014 2015
Residential $ 3.986 $ 6.370
C&I $ 3.452 $ 4.417
Agricultural $ 0.203 $ 0.209
Replacement Meters
Residential $ 0.792 $ 0.724
C&I $ 1.438 $ 1.469
Agricultural $ 0.275 $ 0.281
RTEM $ 0.630 $ 0.643
Delayed ESC Installations $ - $ -
PCAN Meters $ 2.024 $ 2.066
Opt-Out/Legacy Meter Replacements $ - $ -
Specialized Equipment $ 0.314 $ 0.214
Structures and Improvements $ 0.775 $ -
Total $ 13.888 $ 16.392
Business Customer Division (BCD)8.2.2.
SCE forecast a total of $1.415 million in 2014 and $1.815 in 2015 in BCD
capital expenditures including two categories: structures and improvements and
specialized equipment. SCE states the structures and improvements funds will
480 SCE-4V2 at 65-66.481 ORA-13 at 70-71.
- 187 -

A.13-11-003 ALJ/KD1/ar9/jt2/lil PROPOSED DECISION (Rev. 12)
be used to improve energy education centers. The specialized equipment is used
to assist customers seeking to improve energy consumption management.482
For structures and improvements, ORA accepts SCE’s forecast.483 ORA
recommends 2013 recorded for specialized equipment.484
SCE responds that ORA’s forecast for specialized equipment ignores
support SCE provided for its own forecast and inappropriately ignores
inflation.485 We agree. SCE’s forecast is reasonable and is approved.
Customer Service – OOR8.3.
D.14-12-078 directs SCE to include certain information about its Opt-Out
program in its “next available” GRC and adopted the following Opt-Out fees and
charges for SCE:486
For Non-California Alternative Rates for Energy (CARE) Customers:Initial Fee $75.00Monthly Charge $10.00/month
For CARE Customers:Initial Fee $10.00Monthly Charge $5.00/month
These adopted fees are lower than those originally proposed by SCE in this
proceeding, with the exception of the initial, non-CARE fee (SCE proposed
$71).487 In D.14-12-078, we also anticipated that the fees and charges would need
to be adjusted over time, as additional cost and revenue information is
collected.488 SCE stated in update testimony that it would remove $7.2 million in
482 SCE-4V3 at 49-51.483 ORA OB at 218.484 ORA-13 at 72-74. 485 SCE-20 at 69-70.486 Ordering Paragraphs 8, 12.487 SCE-04V2 at 208-209.488 D.14-12-078 at 3-4.
- 188 -
A.13-11-003 ALJ/KD1/ar9/jt2/lil PROPOSED DECISION (Rev. 12)
opt-out fees from its OOR revenue to account for the new fees.489 This change has
the effect of eliminating opt-out fees from SCE’s forecast entirely. This is
necessary to avoid double counting of this revenue in the GRC and in the
balancing account.490
We adopt SCE’s final forecast, as summarized below (millions of
nominal$).
OOR Revenue Forecast SCE -original
Adopted
Opt-Out CARE-Initial $0.051 $0.000
Opt-Out NON-CARE-Initial $0.192 $0.000
Opt-Out CARE-Monthly $1.433 $0.000
Opt-Out NON-CARE-Monthly $5.564 $0.000
Subtotal, Opt-Out $7.240 $0.000
Subtotal, Other Fees and Charges $25.569 $25.569
Total $32.809 $25.569
Information Technology and Business Integration9.
The Information Technology (IT) Operating Unit (OU) is responsible for
the management of SCE’s applications and technology infrastructure. Expenses
for IT are separated into three categories: Operation & Maintenance (O&M),
Capital, and Capitalized Software. O&M encompasses cybersecurity, managing
software license and maintenance agreements, and supporting new capitalized
software applications. Capital expenses, in addition to software, support
hardware refresh and growth, disaster recovery, regulatory requirements, electric
delivery support services, maintenance of fiber optic cable and microwave
communication equipment, and cybersecurity.
489 SCE-74 at 3.490 SCE Comments at 12.
- 189 -

A.13-11-003 ALJ/KD1/ar9/jt2/lil PROPOSED DECISION (Rev. 12)
IT – O&M9.1.
Our adopted O&M forecast is summarized in the following table (millions
of nominal$):
Description Account Adopted
Infrastructure Technology Services 920/921 $106.680
Information Technology Services 931 $4.107
Technology Delivery & Maintenance 920/921 $48.943
Cybersecurity & Compliance 920/921 $17.384
Enterprise Information Management & Architecture 920/921 $16.946
Client Services & Planning 920/921 $17.666
Incremental O&M for New Software 920/921 $8.820
Total $220.546
Infrastructure Technology Services (ITS) (Account9.1.1.920/921)
The primary purpose of the Infrastructure Technology Services Division is
to provide “reliable, responsive, and cost-effective operational IT products and
services for more than approximately 20,000 SCE and contingent workers across
SCE.”491 SCE’s 2015 ITS forecast requested $38.762 million for labor expenses and
$74.692 million for non-labor, totaling $113.454 million.492 ORA recommended
$45.005 million for labor and $57.26 million for non-labor, a $102.265 million
total.493 The difference between these two forecasts rests on disagreements over
the methodology used to calculate the baseline, the addition of an itemized list to
non-labor expenses, and how to account for workforce reductions.
SCE and ORA disagree over whether to use the LRY or Four-Year
Averaging methodologies to calculate the forecast baseline for 2015. SCE
491 SCE-05, Vol. 1 at 10.492 Id. at 22.493 ORA-15 at 5-6.
- 190 -

A.13-11-003 ALJ/KD1/ar9/jt2/lil PROPOSED DECISION (Rev. 12)
calculates its baseline forecast using LRY to build off the 2012 recorded amounts.
It does so knowing that “[a]lthough historical recorded data indicates an
averaging methodology would most closely follow the Commission’s guidance,
we have chosen the last recorded year as it best represents the basis for expenses
we anticipate beginning in 2015” and “it yields a lower number than ORA’s 4
year average.”494 ORA, on the other hand, argues for using a four-year average to
calculate the baseline since “this is what Commission guidance would
recommend, which SCE acknowledges.”495
Past decisions have addressed the circumstances necessary for applying
each methodology. In particular, both parties cite to the PG&E 1990 GRC to
distinguish between averaging and LRY: LRY should be used when recorded
figures have been stable or trending in a certain direction for three or more years
whereas averaging is used for accounts with “significant fluctuations in recorded
expenses from year to year.”496 Here, from 2009-2012, labor shows year-to-year
changes of +10.8%, 0%, and -6.8% respectively while non-labor shows changes of
+2.7%, +6.6%, and -10.5%; and the totals show changes of +6.2%, +3.6%, and
-8.9% (SCE-05, Vol. 1, Figure II-5). Since these numbers are neither stable nor do
they indicate a trend, the four-year averaging methodology proposed by ORA is
the most appropriate for determining the baseline forecast.
SCE and ORA also disagree about whether SCE should be allowed to add
itemized, non-labor expenses to its baseline forecast. According to D.89-12-057,
itemized expenses may be added if they are “specific changes in the level of
expenses in a particular account, which are known or reasonably expected to
occur.”497 SCE asserts that its itemized expenses for non-labor will increase “due
494 SCE-05 V1 at 22; SCE-21 at 3.495 ORA-15 at 6.496 D.89-12-057 at 15; see also ORA-1 at 6 and SCE-05, Vol. at 9.497 D.89-12-057 at 15.
- 191 -
A.13-11-003 ALJ/KD1/ar9/jt2/lil PROPOSED DECISION (Rev. 12)
to software license and maintenance expenses for capitalized software projects
entering into the capitalized five-year maintenance and support period, as well as
growth in the number of licenses and escalation of the cost of existing licenses.”498
ORA, however, “does not accept SCE’s itemized list of additional expenses as
these expenses for software license increases are not new. They are accounted for
in historical costs and therefore no incremental increase is required.”499 Indeed,
SCE responded to an ORA data request that the “drivers of costs” for 2012
recorded expenses of software licenses and maintenance expenses were 72%
“new software licenses” and 19% due to escalation of the cost of existing
licenses.500
SCE argues that it “typically capitalizes the license and maintenance fees
for 5 years” while, after that period, “SCE continues to pay annual license and
maintenance fees, which are a recurring O&M expense, until the software is
replaced or retired.”501 SCE misunderstands ORA. In fact, ORA contends those
O&M expenses for capitalized software projects entering into the expensed
five-year maintenance and support period, growth in the number of licenses, cost
increases of licenses, and new software licenses “are adequately captured in
historical costs.” Indeed, SCE stated that these particular items already drove the
costs of the 2012 recorded expenses for software licensing and maintenance in
response to ORA data requests.502 Since many of these costs are captured in the
historical costs, we see no reason to allow 100% of SCE’s increase to non-labor
spending; however, it also seems unlikely that the historical costs could cover
100% of the costs of SCE’s itemized expenses. Accordingly, to account for new
498 SCE-05, Vol. 1 at 23.499 ORA-15 at 6.500 Id. at 6-7.501 SCE-21 at 6.502 ORA-15 at 6-7.
- 192 -

A.13-11-003 ALJ/KD1/ar9/jt2/lil PROPOSED DECISION (Rev. 12)
licenses and some escalation in the cost of existing licenses, we will allow 30% –
$4.170 million (SCE proposed non-labor increase of $13.901 million x 0.3) – of the
itemized increase to be added to the non-labor baseline.
Finally, ORA and SCE differ on how to account for reductions in SCE’s
workforce. ORA argues that SCE’s 11% forecast decrease in the number of
desktop and laptop computers between 2012 and 2015 indicates an overall
workforce reduction of approximately 10%, thereby requiring a 10% reduction to
the ITS baseline forecast.503 In fact, SCE made a direct link between the number
of employees and ITS expenses during the 2012 GRC.504 However, a 10% forecast
reduction would be too high here since half (three of six) of the ITS groups do not
carry out functions related to employee headcount.505 If workforce reductions
were not otherwise accounted for, a 5% decrease in the baseline forecast would
be appropriate absent specific numbers quantifying the actual reduction.
Nevertheless, since SCE’s $11.117 million OpX adjustments already factor in
workforce reductions,506 utilizing both SCE’s and ORA’s reductions would be
double-counting and, therefore, untenable. As such, because SCE’s $9.826
million OpX reduction to labor costs and $1.291 million OpX reduction to
non-labor costs considers not only labor cost reductions but efficiency reductions
as well, it is most appropriate to reduce the baseline forecast by those amounts.
In sum, since the OpX reductions, partial increase of the itemized expenses,
and ORA’s four-year averaging methodology are appropriate, we adopt the 2015
503 Id. at 7.504 See ORA-42 excerpting SCE TY 2012 Ex. SCE-05, Vol. 2.505 SCE-21 at 5.506 Id. at p. 4.
- 193 -

A.13-11-003 ALJ/KD1/ar9/jt2/lil PROPOSED DECISION (Rev. 12)
ITS forecast in the following amounts: $40,179,500 for Labor and $66,500,750 for
Non-Labor (total: $106,680,250).507
Cybersecurity & Compliance (Account 920/921)9.1.2.
The Cybersecurity & Compliance Division (C&C) maintain “the
confidentiality, availability, integrity, and accountability of information
technology systems and operations through security engineering and risk
management.”508 For C&C in 2015, SCE requests $7.529 million for labor and
$11.494 million for non-labor (total of $19.023 million), whereas ORA
recommends $6.801 million for labor and $8.078 million for non-labor ($14.879
million total). For purposes of comparison, in 2012 SCE recorded $5.254 million
for labor and $1.224 million for non-labor (totaling $6.478 million) in the same
category.509
Though ORA does not dispute the importance of cybersecurity and
protection or the need to increase funding above 2012 levels, it nevertheless takes
issue with SCE’s 2015 C&C forecast. ORA asserts that SCE’s forecast is too high
in part because it “neglected to remove” C&C costs for its SONGS Nuclear
Operating Unit.510 SCE explains that “historical and forecast costs for all C&C
employees” working in the Nuclear Operating Unit were embedded in the
Technology Delivery and Maintenance (TDM) FERC Account 517 “to simplify
and condense the [GRC] submission.”511 Those costs are listed in an SCE
workpaper, TDM SONGS 517 Savings, in the line item for “Cybersecurity
507 The baseline is the 2009-2012 Labor average of $50,005,500 and the 2009-2012 Non-Labor average of $63,621,750. $9.826 million and $1.291 million are then subtracted from the baseline, respectively, for the OpX reduction and $4.170 million is added to Non-Labor for itemized expenses.
508 SCE-05, Vol. 1 at 46.509 SCE-05, Vol. 1 at 52.510 ORA-15 at 12.511 SCE-21 at 9.
- 194 -

A.13-11-003 ALJ/KD1/ar9/jt2/lil PROPOSED DECISION (Rev. 12)
reductions (cumulative).”512 When the Commission ordered the removal of
SONGS costs from the GRC Application, SCE complied by submitting SCE-14 on
April 7, 2014 with FERC Account 517 removed, thereby eliminating the C&C
costs related to SONGS. As such, ORA’s assertion that SCE failed to remove
these costs is incorrect and is not considered.
ORA also argues that SCE’s rate of increase of contracted, i.e. non-labor,
workers “is likely to be unattainable.” For example, SCE only spent 60% of its
non-labor budget in 2013. If it could not spend its entire allotment in 2013, there
is no reason to believe SCE will be able to do so in the future.513 SCE counters
that while it only spent 60% of its non-labor budget, it filled seven of a forecast
nine positions in 2013, 78% of its target.514 Additionally, “[a]pproximately half of
the requested non-labor increase is for contracts with external firms for
penetration testing, vulnerability assessments, tools for real time controls and
monitoring as well as software license and maintenance agreements. The
remainder of the non-labor increase would be for 4 new contractors in the
2013-2014 time frame and 7 additional contractors in 2015. In 2014 alone SCE has
added 22 new employees and brought in 2 new contractors in this area.
Additionally we have brought in several fixed price contractors for the types of
specialized services already mentioned. SCE believes our goals are reasonable
and attainable.”515 Considering SCE hired 78% of its non-labor positions in 2013
and hired at least two more contractors in 2014 out of a forecast four, budgeting
for seven additional contractors in 2015 does not seem “unattainable.”
Nevertheless, a broader question remains as to whether SCE has presented
sufficient evidence explaining the need for a substantial increase in non-labor
512 Workpaper SCE-05, Vol. 1, Ch. I-II at 271-272; see also SCE-05, Vol. 1, fn. 46.513 ORA-15 at 12.514 SCE-21 at 8.515 Id.
- 195 -

A.13-11-003 ALJ/KD1/ar9/jt2/lil PROPOSED DECISION (Rev. 12)
spending for C&C. While labor spending gradually increased from $5.254
million in 2012 to $7.529 million (forecast) in 2015, an average yearly increase of
12.7%, non-labor spending grew dramatically from $1.224 million in 2012 to
$11.494 million in 2015, an average yearly increase of 111% and an 839% increase
overall. SCE has presented sufficient evidence to demonstrate the importance of
addressing cybersecurity and compliance issues, but it has not explained the
drastic increase in non-labor spending over such a short time frame. This sharp
increase stands out even more when contrasted with the gradual rise in expenses
for labor over the same period as well as the decrease in non-labor spending from
$4.792 million in 2010 to $1.224 million in 2012. While we recognize that
non-labor expenditures on contracts with external firms and contractors may be
more costly than internal labor expenditures, justification for the current 111%
rate of increase requires a more detailed explanation. Therefore, we cannot adopt
SCE’s entire non-labor forecast. Comparing 2014 and 2015, the labor forecast
increased by nearly 11%. Since SCE has demonstrated the critical nature of
cybersecurity and compliance and that costs are growing, in this instance, we
find that an increase of 22% (double the labor rate) over the 2014 non-labor
forecast to $9.855 million, is appropriate. Furthermore, because SCE’s increase in
the labor forecast from 2014 to 2015 is in line with year-to-year increases starting
in 2011,516 and due to cybersecurity’s growing importance, we adopt SCE’s labor
forecast of $7.529 million, bringing the total adopted 2015 C&C forecast to
$17.384 million.
Client Services & Planning (CS&P) (Account 920/921)9.1.3.
SCE requests a 2015 CS&P forecast of $15.44 million for Labor and $2.376
million for Non-Labor (total: $17.816 million). This forecast is based on the 2012
516 SCE-05, Vol. 1 at 52, Figure II-9.
- 196 -

A.13-11-003 ALJ/KD1/ar9/jt2/lil PROPOSED DECISION (Rev. 12)
recorded ($19.267 million for Labor and $3.514 million for non-labor; $22.781
million Total) with reductions attributable to OpX savings and an addition of
$180 thousand for severance pay.517 ORA recommends reducing SCE’s forecast
by 20% to $12.352 million for Labor and $1.901 million for Non-Labor ($14.253
million total).
Of ORA’s 20% reduction, 16% is intended to remove historical costs from
certain cost centers associated with duplicate activities and SONGS costs.518 ORA
argues that even though one of CS&P’s functions is to “minimize duplication,”519
it has several functions that are “substantially similar to subgroups within other
IT divisions.”520 In particular, ORA claims that CS&P data collection and
performance monitoring functions are duplicated by the ITS Service
Management & Planning (SM&P) group, and the long-term planning and
prioritization of technology investment is duplicated by EIMA’s Enterprise
Architect. SCE explains that while both CS&P and SM&P both perform data
collection and performance monitoring functions, they are not duplicative since
CS&P “provides this service to all IT divisions for areas that are common
activities that they all share as well as summary level reporting” requiring “broad
knowledge of how the divisions function and how the data is gathered uniformly
across all of IT.” SM&P has a narrower function, collecting and analyzing “key
operational performance and service level indicators [ ] responsible for ITS
unique data that is detailed and technical.” SCE also contrasts CS&P and EIMA
functions by observing that they are “complimentary, not duplicative. …CS&P
personnel gather future business capability needs and turn them into business
517 Id. at 71.518 ORA-15 at 14-15.519 SCE-05, Vol. 1 at 64.520 ORA-15 at 15.
- 197 -

A.13-11-003 ALJ/KD1/ar9/jt2/lil PROPOSED DECISION (Rev. 12)
requirements” while EIMA uses “these business requirements to drive
technology decisions and directions.”521
ORA also argues that a portion of its proposed 16% reduction is due to
SCE’s failure to remove “the SONGS cost center from historical costs.”522 SCE
states that “it made every attempt to remove the testimony and forecast costs for
SONGS in SCE-14 as directed in the Scoping Memo …The Director costs
referenced likely includes a small amount of incremental SONGS related costs
that would need to be determined.” The referenced “Director SONGS/Power
Production” item has a cost of $0.607 million according to SCE’s workpapers.523
Though ORA states that several CS&P functions are duplicated elsewhere
in IT and the forecast should therefore be reduced by 16%, SCE successfully
points out that those functions are either complimentary or different in scope,
despite having similar descriptions. ORA’s examination of functionality by
studying descriptors rather than a more detailed look at the actual scope of the
work done in each group did not lead us to conclude there was any duplication.
As such, SCE’s forecast should not be reduced by 16%. ORA, however, was
correct in asserting that a small amount of SONGS-related costs were not
removed from the historical costs as directed in the Scoping Memo. SCE did not
determine what portion of the $0.607 million for “Director SONGS/Power
Production” is attributable to SONGS, only that it was a “small amount.” We
estimate that “small amount” to be $0.150 million and apply that reduction
evenly between labor and non-labor.
The other 4% of ORA’s overall 20% proposed reduction is due to the
productivity and benefits deriving from central planning and gatekeeping
521 SCE-21 at 10-11.522 ORA-15, fn. 43.523 Workpapers SCE-05, Vol. 1, Pt. 2 at 169.
- 198 -

A.13-11-003 ALJ/KD1/ar9/jt2/lil PROPOSED DECISION (Rev. 12)
functions of CS&P. ORA would like to reduce SCE’s CS&P forecast by 4% largely
because SCE could show “measurable benefits for only five of its 148 proposed
capitalized software projects.”524 However, as SCE points out, “measuring the
productivity components [of projects] separately from other drivers is very
difficult” and true “productivity projects…are very rare.”525 As such, even if
“[p]roductivity should result from the type of coordination, oversight, and
gatekeeping function that CS&P provides,” as ORA argues, it would be difficult
to tease out of the numbers. More frequently, that productivity is incorporated
on the front end where, as SCE states, the benefits of the central planning and
gatekeeping functions come from “ensuring that the highest value projects are
implemented and that standard criteria, including productivity, are used to
evaluate and prioritize IT projects.”526 Therefore, since SCE considers
productivity and has shown there are benefits, the CS&P forecast should not be
reduced by 4%.
We adopt a 2015 CS&P forecast of $15.365 million for Labor and $2.301
million for Non-Labor ($17.666 million total).
Incremental O&M for New Software (Account 920/921)9.1.4.
When SCE has a new software project exceeding $5 million, the recurring
O&M support costs are tracked separately as incremental O&M for new
capitalized software. Projects are deemed new either because they did not exist
before, or they are a new phase (exceeding $5 million) of an existing project.527
For 2015, SCE forecasts spending $5.204 million for Labor and $3.616 million for
Non-Labor ($8.82 million total). ORA recommends $1.555 million for Labor and
$1.08 million for Non-Labor ($2.635 million total). SCE’s estimates reflect a 59%
524 ORA-15 at 14-15.525 SCE-05, Vol. 1 at 67.526 SCE-21 at 12.527 SCE-05, Vol. 1 at 71.
- 199 -

A.13-11-003 ALJ/KD1/ar9/jt2/lil PROPOSED DECISION (Rev. 12)
to 41% division between labor and non-labor respectively based on the “2012
actual/recorded costs breakdown.”528
ORA recommended the removal of the incremental O&M costs for any
proposed capital software project it argued to disallow in ORA-14, resulting in a
20% reduction to SCE’s forecast.529 SCE does not object to removing O&M costs
for any projects the Commission does not approve.530 We agree with the parties
that the incremental O&M costs for rejected or reduced projects should be
removed, however we have not rejected or reduced the 2015 costs of any of SCE’s
listed projects531 and, accordingly, make no changes to the forecast.
Each year, the applications supported by IT change as some systems are
decommissioned and others are added. ORA argues that the savings in support
costs from system decommissioning should be netted against incremental O&M
for capitalized software and recommends reducing the forecast by the average
“O&M labor and non-labor recurring maintenance costs” from 2011 and 2012, i.e.
$1.769 million.532 However, as SCE points out, these “savings were in prior
periods [and therefore] would already be reflected in recorded spend” as part of
TDM’s 920/921 FERC account.533 As such, reducing the 2015 forecast by that
amount would double-count the savings from the decommissioning.
Consequently, ORA’s $1.769 million reduction to SCE’s request should not be
adopted.
ORA states that many of SCE’s projects here have a history of capital
spending and, since those systems “were in service in the historical recorded
period, ORA assumes that the historical recorded costs in other parts of IT’s
528 Id. at 73.529 ORA-15 at 17.530 SCE-21 at 14.531 SCE-14, Attachment 7 at 74.532 ORA-15 at 17-18.533 SCE-21 at 14.
- 200 -

A.13-11-003 ALJ/KD1/ar9/jt2/lil PROPOSED DECISION (Rev. 12)
testimony include the recurring maintenance costs for those systems” and
removes 50% of the forecast to account for those embedded costs.534 ORA does
not, however, provide a list of these projects. Based on SCE’s testimony, ORA
seems mistaken on this subject. All projects in this category are “new,” defined
as “projects that implement new functionality that needs to be supported. Even
if the project is an expansion of existing systems or applications, additional
support will be needed as the new functionality is implemented.”535 Put more
succinctly, these are projects “which did not exist in the recorded period”536 and,
as such, cannot have historical recorded costs for recurring maintenance as ORA
argues. Without those historical costs, there is no basis for reducing SCE’s
forecast by 50%. Therefore, ORA’s 50% forecast reduction should not be
adopted.
To sum up, SCE’s forecast should not be reduced by $1.769 million to
reflect reduced support costs due to system decommissioning, nor should it be
reduced by 50% due to historical support costs. Therefore, we adopt SCE’s 2015
forecast of $8.82 million.
IT – Capital9.2.
Reducing 2014 Forecast Due to 2013 Spending9.2.1.
In many instances in this GRC, ORA has recommended reducing 2014 IT
forecasts for accounts where the 2013 recorded amount exceeded the 2013
forecast.537 When ORA has proposed a reduction to 2014 spending “in equal and
opposite amount to the amount spent greater than the 2013 forecast, SCE has
agreed with this adjustment” since there is frequently a connection between
534 ORA-15 at 18.535 SCE-21 at 14.536 SCE-05, Vol. 1 at 72.537 SCE-21 at 17, Table II-7.
- 201 -

A.13-11-003 ALJ/KD1/ar9/jt2/lil PROPOSED DECISION (Rev. 12)
spending in one year and subsequent years.538 However, SCE takes issue with
ORA’s failure to apply this principle in the opposite direction, i.e. SCE believes
underspending in one year should be presumed to be followed by an increase in
spending in the following year.539 We agree with the former proposition and
disagree with the latter.
An overspend in a prior recorded year typically results in the reduction of
the subsequent year’s forecast by the amount overspent in order to protect the
ratepayers from excessive spending by maintaining the original total forecast.
This is a presumption that can be overcome with testimony refuting the need for
that reduction. However, the reverse – an underspend in a prior recorded year
resulting in an increase in the subsequent year’s forecast by the amount
underspent – is neither automatic nor assumed. The addition of the underspend
to the subsequent year must be justified to ensure the added expense is still
necessary. We will evaluate such requests according to these principles in the
sections below.
Detailed Tracking of Costs9.2.2.
ORA recommends “that the Commission require SCE to track the different
forecast costs to actual costs by the same categories, and any scope changes, and
include this information as part of the GRC application. This recommendation
would have the effect of making the forecast costs more relevant and improve the
forecast accuracy in future GRCs.”540 SCE opposes ORA’s recommendation
because it “already provides historical costs of all the projects requested in the
prior case. We also provide historical costs for every category of IT spend.
538 Id. at 18.539 Id. at 17.540 ORA-14 at 5-6.
- 202 -

A.13-11-003 ALJ/KD1/ar9/jt2/lil PROPOSED DECISION (Rev. 12)
…ORA presented no evidence for this assertion [of relevance] or estimate of how
much it would cost to provide such information.”541
Since ORA’s request here is only two sentences, it is subject to some
interpretation. Nevertheless, it seems that ORA is asking SCE to include in
future GRCs (1) historical forecasts and (2) changes in the scope of any category.
SCE insists ORA did not demonstrate relevance, but the relevance is inherent in
the requested information. Providing historical costs is important, but providing
those costs alongside historical forecasts offers greater context for the numbers.
For example: $5 million in recorded costs for 2010 is helpful information, but not
as helpful as also knowing that the approved forecast for that year was $1
million. Such context is naturally relevant. Similarly, any changes in a category’s
scope would also provide necessary context. For instance, if the longstanding
category of widgets now includes not just widgets, but widgets and widget plug
adapters, that is necessary context to better understand the numbers in recorded
costs as well as past and future forecasts. SCE’s concern over the potential costs
to provide such information is understandable, but overstated: all the
information requested by ORA should be available in previous GRCs, which SCE
assuredly already reviews when putting together its current GRC. Therefore, in
future GRCs, we find it reasonable to require SCE to include its own forecast and
the Commission’s adopted forecast from the previous GRC alongside historical
costs, and brief explanations detailing any changes in the scope of a category.
Midrange Enterprise Servers Hardware/Alhambra Data9.2.3.Center
In SCE’s forecast request for Midrange Enterprise Servers Hardware, there
is a budget line item for the “Alhambra Data Center Forecast.” SCE’s 2015
forecast for this line item is $13.6 million while ORA recommends $1.6 million.
541 SCE-21 at 20.
- 203 -

A.13-11-003 ALJ/KD1/ar9/jt2/lil PROPOSED DECISION (Rev. 12)
ORA argues that since the new Alhambra Data Center addition will not
begin construction until 2016, “ORA recommends removing the associated IT
capital costs from 2015.”542 ORA does not assert that the Data Center expansion
is unnecessary, just that most of the work is unnecessary in 2015. SCE counters
that the 2016 construction start date used by ORA is a reflection of SCE’s
Corporate Real Estate team needing to specify actual construction of the physical
facilities, while the “$12 million that IT will spend on the Data Center project in
2015 is for planning, detailed design, and pre-staging activities for the servers
and supporting infrastructure (e.g. racks) that will go into the newly expanded
data center. These server related planning activities do not require the Data
Center physical expansion to be complete.”543 Moreover, the build out of the
Data Center is needed to accommodate the influx of new data from the expansion
of the SmartMeter program.544 Therefore, since SCE has demonstrated that the
Alhambra Data Center project is necessary and, despite the 2016 construction
start date, expenditures in 2015 are appropriate as part of planning, designing,
and pre-staging the Center’s servers and infrastructure, we approve SCE’s $13.6
million forecast for the Alhambra Data Center. As ORA and SCE do not disagree
about any other elements of the 2015 forecast for Midrange Enterprise Servers
Hardware, we adopt SCE’s 2015 forecast of $39.504 million.
Personal Computers – Desktop/Notebook and9.2.4.Ruggedized Laptops Refresh/Replacement
The following table details the relevant 2013, 2014, and 2015 forecasts by
SCE and ORA as well as the 2013 recorded costs (millions of nominal$): 545
542 ORA-14 at 8.543 SCE-2 at 22-23.544 SCE-08, Vol. 3, Part 2 at 44.545 SCE originally forecast $8.725 million for 2014 but requested to change it to $10.347 million
in its Opening Brief, which is reflected in this table. ORA did not comment on this change in its Opening or Reply Briefs. SCE Brief at 197. See also SCE-05, Vol. 1 at 95; ORA-14 at 11.
- 204 -

A.13-11-003 ALJ/KD1/ar9/jt2/lil PROPOSED DECISION (Rev. 12)
2013Recorded
2013 Forecast 2014 Forecast 2015 Forecast
SCE $9.728 $11.350 $10.347 $9.128
ORA $7.132 $8.538
There are two issues here: (1) ORA characterizing SCE’s 2013 recorded
expenditures as an overspend while SCE characterizes it as an underspend, and
then both parties applying that difference to the 2014 forecast; and (2) the
quantification of SCE staff reductions. Each issue will be addressed separately.
SCE forecast $11.35 million for 2013 but recorded $9.728 million.546 On its
face, this is an underspend of $1.622 million. SCE added the $1.622 million to its
original 2014 forecast of $8.725 million to get a final forecast of $10.347 million.547
SCE justified the carryover on the grounds that the underspend occurred due to
“delays in timing or refreshing devices” and that the “need for refreshing [those]
devices still exists.”548 On the other hand, ORA claims “the 2013 actual exceeded
SCE’s 2013 forecast,” but provides no explanation about how it arrived at a
conclusion contrary to the numbers.549 SCE explains in its rebuttal testimony that
ORA “focused on discrete components of the PC and Ruggedized Laptop refresh,
selected the one component where there was overspending and reduced by that
amount.”550 Examining the underspending and overspending of individual line
items and then correspondingly adjusting the forecast can be appropriate, but not
without further explanation for each adjusted item. Therefore, as SCE argues,
“[t]he adjustment that should be made to 2014 is the net, not a selective
546 SCE-21 at 24.547 SCE Opening Brief at 197.548 SCE-21 at 25.549 ORA-14 at 10.550 SCE-21 at 25.
- 205 -
A.13-11-003 ALJ/KD1/ar9/jt2/lil PROPOSED DECISION (Rev. 12)
adjustment.”551 Since SCE’s need to refresh additional computers was due to
delays in 2013 and this need is recurring, adding the 2013 underspend to the
original 2014 forecast is reasonable and, therefore, adopted.
ORA also recommends reducing the 2014 and 2015 forecasts by 10% each
based on a 2014 Los Angeles Times article which states that SCE plans to reduce
its workforce by 11.4%.552 Though ORA did not independently verify the
information in the article, sources quoted in the article include then State Senator
and current California Secretary of State Alex Padilla and SCE itself (confirming
the existence of layoffs but not the number of people affected).553 Later, during
evidentiary hearings, SCE witnesses confirmed staffing reductions of 1,100
employees at SONGS alone.554 SCE rejects ORA’s 10% reduction because its use
of the LA Times article lacks independent verification, ORA doesn’t consider
SCE’s OpX reductions, and SCE’s own estimates are “based upon SCE’s current
workforce projections.”555 SCE’s workforce projections were used consistently in
a variety of areas of this case.556 Therefore, we reject ORA’s proposed rejection
and adopt SCE’s forecast. Nevertheless, SCE’s forecast could have and should
have been more transparent in this regard. Therefore, we require that SCE
document its headcount forecast in all future General Rate Cases and show how
that headcount forecast is applied in any cost forecast that relies on it.
Transmission Network Facilities9.2.5.
The Transmission Network Facilities budget provides for the life-cycle
replacement of obsolete, failed, and damaged telecommunications network
551 Id.552 ORA-14 at 10-11.553 Los Angeles Times, April 15, 2014 “SoCalEdison to lay off hundreds in effort to streamline
Management.” See also ORA-14 at 10-11.554 SCE/Inlander, 10 RT 992 lines 1 – 5.555 SCE-21 at 25.556 See: SCE-10V2 and SCE-8V3P1 at 5)
- 206 -

A.13-11-003 ALJ/KD1/ar9/jt2/lil PROPOSED DECISION (Rev. 12)
equipment.557 SCE’s original testimony (SCE-05) on Transmission Network
Facilities was supplemented by SCE-16,558 which updated recorded and forecast
numbers for this item due to the inadvertent failure to include testimony for the
Netcomm Radios line item.559 ORA does not appear to have accounted for the
changes made in SCE-16.560 Nevertheless, since ORA recommends using a
five-year recorded cost average to calculate the forecast, that methodology can be
considered even if ORA’s numbers cannot. SCE disagrees with the use of the
averaging methodology.
Since so many changes occurred between SCE-05, SCE-16, and SCE-21, it is
instructive to first review the numbers in one consolidated table:
SCE Recorded (in millions) SCE Forecast (in millions)
2008 2009 2010 2011 2012 2013 2014 2015 2016 2017$14.68 $16.48 $16.64 $15.13 $14.43 $13.35 $25.40 $23.81 $23.94 $24.17
* $17.85 was SCE’s original forecast for 2013 ($17.85*) ($20.90*)* $20.90 was SCE’s original
forecast for 2014
The original 2013 forecast was $17.85 million so SCE added the $4.503 million
underspend from that year to the original 2014 forecast to come up with a final
request of $25.403 million.
ORA argues for the use of a 5YA of recorded costs since they had shown “a
clear downward trend” during that time.561 On the other hand, SCE argues that
there was a 275% rate of increase in data traffic from 2012-2014, a trend it expects
to continue, and that a 5YA would not account for such rapid growth.562 SCE
does not offer evidence supporting its assertion that data traffic increased by
275% nor any specifics supporting the continuation of that “trend.” Even if we
557 SCE-05, Vol. 1 at 105.558 SCE-16, Appendix A at A-13 – A-18.559 SCE-21 at 27.560 ORA-14, pp. 13-14; ORA Opening Brief at 236-237.561 ORA-14 at 13.562 SCE-21 at 28.
- 207 -

A.13-11-003 ALJ/KD1/ar9/jt2/lil PROPOSED DECISION (Rev. 12)
accept the 275% at face value,563 SCE has not demonstrated a link between an
increase in data traffic and a need for an increased budget, as SCE’s recorded
amounts in 2012 and 2013 indicate a 7.5% decrease in expenditures. Indeed, 2013
marked the fourth consecutive year of decreased expenditures in this category.
This running decrease is more notable since, according to SCE, expenditures all
the way back to 2010 have been “more than typical years with increases to
support increased network capacity to our data network hubs that support all the
users of SCE’s data network.”564 In other words, the need for expanded network
capacity to accommodate increased data traffic has existed for several years
without resulting in an increase in actual expenditures. Nevertheless, SCE seeks
a 43% increase in its requested forecast here.565 Without a demonstrated need for
increased expenditures, SCE’s forecasts are unjustified as is its request to add the
2013 underspend to the 2014 forecast. Therefore, since SCE’s spending in this
category will address expenditures typical for the last five years, ORA’s five-year
recorded cost average methodology better calculates the appropriate forecasts.
ORA calculated the average between 2009 and 2013;566 however we calculate the
average from 2008 to 2012 in order to remain consistent with the application of
averaging elsewhere in this GRC. Applying this methodology to SCE’s 2008-2012
numbers, we adopt a Transmission Network Facilities forecast of $15.471 million
for both 2014 and 2015.
563 In D.14-08-032 at 499, the Commission accepted PG&E’s assertion that their bandwidth would grow by 300% over the next 5-10 years.
564 SCE-05, Vol. 1 at 108.565 SCE-16, Appendix B at B-42.566 ORA-14 at 13-14.
- 208 -

A.13-11-003 ALJ/KD1/ar9/jt2/lil PROPOSED DECISION (Rev. 12)
Fiber Cable Replacement9.2.6.
Fiber Optic Cable Replacement provides for the replacement of aging or
failing fiber optic cables.567 In SCE’s direct testimony, it requested forecasts of $2
million for 2013, $1.2322 million for 2014, and $4.400 million for 2015.568 When
SCE recorded only $0.189 million in 2013, it adjusted its 2014 forecast by adding
the $1.811 million underspend from 2013, resulting in a new 2014 forecast of
$3.043 million.569 Also of note, SCE recorded $0.936 million in 2012 versus a
$5.148 million forecast.570 ORA recommends forecasts of $1.232 million for 2014
and $1.620 million for 2015.571
SCE states that it wants to focus on replacing 188 miles of its oldest fiber
cable by 2017 due to obsolescence.572 It planned to replace 27 miles of cable in
2013, 16 miles in 2014, and 59 in 2015, while removing 25, 18, and 58 miles
respectively.573 SCE also states that its forecasts are achievable even if they seem
to be “escalating quickly [since] [m]ost of the work is done by contractors that are
overseen and managed by SCE and therefore manpower should not be a
constraint.”574 However, as ORA noted,575 SCE has not demonstrated an ability to
fulfill its past forecasts: its 2012 forecast was intended to replace about 100 miles
of cable for $5.148 million but SCE only spent $0.936 million;576 in 2013 it forecast
$2.0 million but only spent $0.189 million. Based on those numbers, SCE
removed/replaced an estimated 21 out of 127 miles, or 17%, of cable.577 Notably,
567 SCE-05, Vol. at 115.568 Id. at 117.569 SCE-21 at 30.570 D.12-11-051 at 404-405.571 ORA-14 at 16.572 SCE-05, Vol. 1 at 116.573 Workpaper SCE-05, Vol. 1, Ch. 3 at 128.574 SCE-21 at 30.575 ORA-14 at 17.576 D.12-11-051 at 404-405.577 (0.936/5.148) X 100 miles = 18 miles; (0.189/2.0) X 27 = 3 miles; 18 + 3 = 21 miles.
- 209 -

A.13-11-003 ALJ/KD1/ar9/jt2/lil PROPOSED DECISION (Rev. 12)
SCE’s recorded amount dropped by 80% from 2012 to 2013 even though it had
already been slowed by permitting problems in 2012, and the recorded amount in
2012 was relatively small to begin with.578 Out of more than $7 million forecast
over those two years, SCE only spent 16% of that amount which is inconsistent
with an “expeditious” need to replace obsolete cable.579 As such, SCE’s stated
desire to expeditiously replace 188 miles of “obsolete” fiber cable has, to date, not
been matched by its actions.
ORA takes a more reasonable approach with its recommendations. For
2015, ORA recommends a forecast of $1.620 million, an amount based on the
installation and removal of 21.5 miles of fiber cables, i.e. the average of the 27
miles and 16 miles of cable scheduled for installation/removal by SCE in 2013
and 2014.580 We find ORA’s approach more appropriate and adopt its forecast of
$1.620 million for 2015.
For 2014, ORA recommended $1.232 million, the same amount SCE
requested in its original testimony.581 Since SCE intended to install 16 miles of
cable and remove 18 miles in 2014, both below average, and SCE underspent in
2013, we believe it appropriate to approve more than the $1.232 million
recommended by ORA. However, due to SCE’s demonstrated difficulties
fulfilling its forecasts in this area, we cannot approve SCE’s $3.043 million
request, an amount that essentially follows ORA’s approach discussed above.
Instead, we take a measured approach in order to allow SCE the funding to
install and remove the intended amount for 2014 as well as a portion of what it
578 SCE-05, Vol. 1 at 117.579 Id.580 ORA-14 at 17. SCE’s Workpaper, SCE-05, Vol. 1, Ch. 3 at 128, prices fiber optic cable
installation at $60,000/mile and removal at $15,000/mile: (21.5 X 60K) + (21.5 X $15K) = $1.62 million.
581 ORA-14 at 17.
- 210 -

A.13-11-003 ALJ/KD1/ar9/jt2/lil PROPOSED DECISION (Rev. 12)
intended to install and remove in 2013. Accordingly, we adopt the original 2013
forecast of $2.0 million for 2014.
Microwave Replacement9.2.7.
SCE requested $9.905 million for 2014 and $6.5 million for 2015, while ORA
recommended $2.475 million for each year.582 Additionally, SCE originally
forecast $6.5 million for 2013 but ultimately recorded only $3.1 million. SCE also
originally forecast $6.5 million for 2014, but requested that the “2014 forecast be
revised to $9.9 million to account for the amount that the 2013 recorded was less
than the 2013 forecast.”583 SCE’s present cost per microwave replacement unit is
$0.165 million.584
Since SCE started replacing its microwave equipment in 2009, it has only
replaced between 13 and 21 units in any given year; it now seeks to replace 40
units per year.585 Even though SCE states its “work is governed by the available
funding” and it could therefore replace 40 units/year if only it had the money to
do so, its authorized amount of $7.8 million in 2012586 as compared to its recorded
expenditure of only $2.25 million for 13 units in 2012,587 and a requested $6.5
million for 2013 versus a recorded $3.1 million suggests otherwise,588 raising
doubts as to whether SCE is truly interested in or capable of replacing 40 units in
one year in the first place. Moreover, though SCE never explicitly states this, its
request for $9.905 million in 2014 suggests SCE believes it can replace 60 units,589
a number of replacements it has never approached, attempted, or requested. In
582 SCE-21 at 31.583 Id.584 Workpaper “Project Cost Estimating Summary – Microwave Replacements,” SCE-05, Vol. 1,
Ch. 3 at 134.585 ORA-14 at 18.586 D.12-11-051 at 400.587 SCE-05, Vol. 1 at 119.588 SCE-21 at 31.589 $9.905 million/$0.165 million per unit = 60 units.
- 211 -

A.13-11-003 ALJ/KD1/ar9/jt2/lil PROPOSED DECISION (Rev. 12)
past and future cases, SCE states that replacement occurs to address “obsolete,
failed, and damaged microwave equipment,” however SCE has not stated a
reason for its increased request to replace 40 units/year, nor has it presented any
evidence to support a need for it.590 As such, SCE’s requests for $9.905 million in
2014 and $6.5 million in 2015 appear unsupported by the record.
ORA has recommended a forecast of $2.475 million for both 2014 and 2015
based on replacing 15 units per year at SCE’s stated cost per unit of $165,000. We
find ORA’s per unit methodology to be sensible, but since SCE’s average number
of replaced units per year 2009 through 2013 was 16,591 we adopt 2014 and 2015
forecasts of $2.640 million each to reflect that average.
Mobile Radio System Replacement9.2.8.
SCE and ORA agree that the 2014 forecast should be reduced by SCE’s
2013 forecast overspend. The two disagree over whether SCE’s 2014 and 2015
forecasts should also be reduced by the same 10% discussed above in Personal
Computers, a reduction based on a 2014 Los Angeles Times article. Though SCE
rejects the article,592 the accuracy of the claimed 11.4% reduction in SCE’s
workforce appears to be beside the point here as the purported SCE employees
subject to layoffs or outsourcing are not the ones stationed in the field using the
mobile radio system.593 Even the LA Times article points out that most of the job
losses will be at either SONGS or SCE’s “sprawling Irwindale office complex.”
Since the 10% reduction does not appear to impact the “field force” users of the
mobile radio system, ORA’s 10% reduction to SCE’s forecasts should be rejected
here. Furthermore, since ORA does not otherwise object, SCE’s forecasts of
$4.601 million for 2014 and $14 million for 2015 are hereby adopted.
590 SCE-05, Vol. 1 at 118-120.591 ORA-14 at 18.592 See Personal Computers section above for a discussion of the article’s efficacy.593 SCE-21 at 33; SCE-01 at 8.
- 212 -

A.13-11-003 ALJ/KD1/ar9/jt2/lil PROPOSED DECISION (Rev. 12)
Risk Management Disaster Recovery9.2.9.
SCE requests an increase in disaster recovery spending to $3.474 million in
2014 and $4.1 million for 2015, levels well above its previous expenditures in this
category, while ORA recommends applying a 5YA of recorded costs from
2009-2013 to reflect SCE’s actual spending: $2.549 million for both 2014 and
2015.594 SCE argues that ORA’s cost-average approach might be appropriate if
SCE were only refreshing existing disaster recovery systems, but that it does not
account for the need to enhance SCE’s recovery capabilities.595 However, SCE
also describes its expenditures from 2008-2012 as “primarily driven by refresh of
disaster recovery hardware at the end of its useful life for the period 2008 to 2012.
In addition, disaster recovery hardware was acquired to enhance disaster
recovery capabilities for a number of key business systems.”596 As such,
averaging those costs would still take into account SCE’s stated need for both
refreshing and enhancing its disaster recovery systems. Moreover, an
examination of SCE’s workpapers shows no delineation between “refresh” items
and “enhancement” items; indeed, all items listed in the workpapers are
subtotaled or totaled as “refresh” items.597 Therefore, according to SCE’s own
reasoning, ORA’s five-year recorded cost average is the most appropriate
methodology and should be adopted, in addition to being more reflective of
SCE’s actual expenditures.598 We adopt ORA’s forecast of $2.549 million for both
2014 and 2015.
594 SCE-21 at 33-34; ORA-14 at 21-22.595 SCE-21 at 33-34.596 SCE-05, Vol. 1 at 125-126.597 Workpaper SCE-05, V1, Ch. 3 at 146.598 See ORA-14 at 21-22.
- 213 -

A.13-11-003 ALJ/KD1/ar9/jt2/lil PROPOSED DECISION (Rev. 12)
Telecom Costs for Projects9.2.10.
There are 92 discrete telecommunication projects requested in this GRC,
for which SCE requested forecast spending of $43.046 million in 2014 and $51.756
million in 2015.599 ORA recommends $35.26 million for 2014 and $40.8 million for
2015. The primary differences between the two requests is that both parties
disagree about the inclusion of a $26.3 million line item for “[Corporate Real
Estate] CRE Projects” and whether or not a “least-squares trend” should be used
to calculate the forecast.600 Each issue will be addressed in turn.
As a result of ORA data requests in February 2014, SCE realized it had
“inadvertently left out referencing the telecom portion of [twelve] project costs in
various exhibits, and had not included the material necessary to support the
missing costs in workpapers.”601 Forecast costs for the twelve project line items,
however, were included in both the overall IT telecom request totals and the
Results of Operations model, with prepared testimony supporting the associated
projects.602 SCE reviewed each of the twelve line items, dropped three of them
from its request, and adjusted the forecasts for others resulting in a $20 million
reduction in its overall telecom forecast.603 SCE submitted errata, supplemental
testimony, and data responses to address these oversights. However, one of the
line items – CRE Projects (CIT-00-OP-NS-000154) – was addressed via
“incremental testimony” in SCE-14 due to its sizable cost of $26.3 million.604
SCE-14 was submitted on April 7, 2014 and explained that the $26.3 million in
telecom costs are necessary since “[p]roviding IT equipment and infrastructure at
our new and existing non-electric facilities is an essential part of optimizing use
599 SCE-16.600 ORA-14 at 70-71.601 SCE-16 at 2.602 Id. at 3.603 Id. at 4.604 Id.
- 214 -

A.13-11-003 ALJ/KD1/ar9/jt2/lil PROPOSED DECISION (Rev. 12)
of such facilities by SCE personnel.”605 Additionally, SCE is moving out of leased
office space into SCE-owned space that it must now outfit with new equipment to
support its staff.606 SCE’s forecast of $26.3 million for this line item is based on
the number of planned projects and the “average ratio of historical IT
expenditures to the total annual recorded costs respectively.”607 The $26.3 million
in forecast expenditures was not “included in the capital project cost estimates
discussed in other testimony and related workpapers (e.g. the project planning
estimates).”608
ORA recommends the Commission “reject” the $26.3 million on procedural
grounds. ORA points out that page seven of the Joint Scoping Memo states all
parties are “responsible for making their case in their direct testimony and
pleadings, not in rebuttal or during hearings.” ORA additionally notes that Rule
13.8(b) of the Rules of Practice and Procedure provides that “Direct testimony in
addition to the prepared testimony previously served, other than the correction
of minor typographical or wording errors that do not alter the substance of the
prepared testimony, will not be accepted into evidence unless the sponsoring
party shows good cause why the additional testimony could not have been
served with the prepared testimony or should otherwise be admitted.” SCE
admitted the failure to include testimony on the $26.3 million was inadvertent,
which ORA argues “should not be considered good cause” and that “SCE should
not be given a ‘second bite of the apple.’”609
By a strict interpretation of the Scoping Memo and Rules of Practice and
Procedure, it is possible to view SCE’s submissions as additional direct testimony
605 SCE-14, Attachment 14 at 78a.606 Id.607 Id.608 Id.609 ORA Opening Brief at 230.
- 215 -
A.13-11-003 ALJ/KD1/ar9/jt2/lil PROPOSED DECISION (Rev. 12)
and, generally speaking, simply forgetting to include testimony would not be
considered “good cause.” However, in this case, during the July 18, 2014 Status
Conference, the Commission specifically addressed the submission of
supplemental testimony regarding the telecom projects, stating that while timely
submission of testimony is important and “[e]rrata should be limited to
correcting small errors…not providing a significant showing for the first
time…we do recognize that in a huge case like this, many people are involved
and it is possible for some things to be missed.”610 SCE was given until July 28,
2014 to submit additional testimony, but those days were unnecessary as SCE-14
had already been submitted on April 7th. Moreover, since SCE-14 was submitted
nearly four months in advance of ORA’s IT Capital analysis in ORA-14 and seven
months in advance of its opening brief, ORA was not prejudiced by the delay in
the submission of the $26.3 million in costs. Therefore, since the procedural
delays did not prejudice ORA and there are no substantive objections to the CRE
Projects, that line item should not be rejected.
ORA also examined the actual expenditures from 2009-2013 for the telecom
projects and concluded that “because a clear trend exists,” a least-squares trend
should be applied to the forecast. SCE disagrees, noting that the historical data
used by ORA to develop its forecast is incomplete.611 Additionally, the
least-squares methodology “is a regression against time, treating telecom costs as
a stand-alone item, independent of projects.”612 SCE’s telecom forecasts here are
tied directly to their individual projects; i.e. the forecast costs go up or down
depending on the number and size of the projects each year. Using a
least-squares trend for the forecast would ignore this and result in future
610 July 18, 2014 Status Conference, Transcript Vol. 5 at 208-209.611 SCE-21 at 67.612 Id. at 68.
- 216 -
A.13-11-003 ALJ/KD1/ar9/jt2/lil PROPOSED DECISION (Rev. 12)
forecasts being tethered to “historical data” rather than the actual proposed
projects. As such, a least-squares trend would be inappropriate here. As SCE
states, “whether the Commission approves or rejects funding for any of these
telecom requests should be based on the value of the underlying business project
as they have in past rate cases.”613 Consequently, since there is no disagreement
between SCE and ORA over the necessity, scope, or cost of any of the individual
telecom projects (save for the $26.3 million CRE Projects already discussed
above), we adopt SCE’s forecast of $43.046 million for 2014 and $51.756 million
for 2015.
IT – Capitalized Software9.3.
Software Asset Management (SAM) Bundles9.3.1.
ORA’s 34% SAM Reduction9.3.1.1.
In the 2012 SCE GRC, the Commission approved funding for a collection of
thirty-six capitalized software projects grouped together under the title SAM
Bundle.614 Generally, projects in the SAM Bundle prioritized “software upgrades
and replacements to mitigate risks due to security problems, technology
obsolescence, and application failure.”615 Of the thirty-six projects in the 2012
SAM Bundle, SCE requested funding for ten of them in this general rate case.616
ORA examined the 2010-2012 SAM Bundle and determined that while
$100.963 million was authorized, the total recorded was only $66.706 million
(ORA-14, p. 31). Based on this $34.257 million difference, ORA recommended
that all projects in the 2014-2015 SAM Bundle “be reduced by 34% to reflect the
actual to authorized variance experienced by SCE for the 2010 to 2012 period.”
613 Id. at 67.614 D.12-11-051 at 412-425.615 Id. at 412.616 ORA-14 at 31; SCE-21 at 19-20.
- 217 -

A.13-11-003 ALJ/KD1/ar9/jt2/lil PROPOSED DECISION (Rev. 12)
(id.) This 34% reduction was then applied to forecasts for the following projects:
Consolidated Mobile Solution (CMS), Design Manager Refresh, Enterprise Core
Platform Refresh, GE Smallworld Refresh, Integrated Work Management System
and related Systems Upgrade, Renewable Contract Management System,
Scheduling Refresh, and Usage Measurement System.617 Despite its
recommendation, ORA did not object to any of the SAM Bundle projects on their
merits.
ORA’s across the board 34% cut should not be adopted. Each of the
projects in the SAM bundle was approved in the 2012 GRC. Their inclusion in
the 2015 GRC reflects reevaluations of the projects and, in some cases, delays in
their implementation.618 ORA has not objected to any of the projects on the
merits; rather it asks for a 34% cut because SCE underspent by that amount on
the SAM Bundle from 2010-2012. Were such an across the board cut proposed
based on the merits of the projects or a demonstrated pattern of
over-forecasting/underspending, then perhaps it would warrant consideration.
However, here, the cut is proposed for neither reason. As SCE explains, the
underspend was due largely to a planned reduction in non-essential and
non-safety-related spending since the 2012 GRC was not concluded until that
December.619 The projects, in turn, still require completion but on the new
schedule reflected in the forecasts. As such, ORA’s 34% across the board
reduction should not be adopted with regard to any of these SAM Bundle
projects: CMS, Design Manager Refresh, Enterprise Core Platform Refresh, GE
Smallworld Refresh, Integrated Work Management System and related Systems
617 Respectively, SCE-05, Vol. 2, Pt. 2 at 56; SCE-05, Vol. 2, Pt. 2 at 47; SCE-05, Vol. 2, Pt. 1 at 68; SCE-05, Vol. 2, Pt. 2 at 53; SCE-05, Vol. 2, Pt. 1 at 93; SCE-05, Vol. 2, Pt. 1 at 203; SCE-05, Vol. 2, Pt. 2 at 45; and SCE-05, Vol. 2, Pt. 1 at 210.
618 SCE-05, V2, Pt. 1 at 203 and 210; SCE-21 at 61 and 69.619 SCE-21 at 19-20.
- 218 -

A.13-11-003 ALJ/KD1/ar9/jt2/lil PROPOSED DECISION (Rev. 12)
Upgrade, Renewable Contract Management System, Scheduling Refresh, and
Usage Measurement System. The adopted 2014-2015 forecasts for these projects
are listed in the table below with explanations for the Renewable Contract
Management System (RCMS) and CMS forecasts following (millions of
nominal$):
SAM Projects 2014 2015Consolidated Mobile Solution $5.424 0
SAM - Design Manager Refresh $1.625 0
Enterprise Core Platform Refresh $1.067 $4.610
SAM - GE Smallworld Refresh 0 $1.300
Integrated Work Management System $3.360 0
Renewable Contract Management System $12.520 $7.305
SAM - Scheduling Refresh $5.400 $2.500
Usage Measurement System 0 $1.500
Total $29.396 $17.215
Renewable Contract Management System9.3.1.2.
In addition to reducing the 2014 RCMS forecast by $5.277 million for the
across the board 34% reduction discussed above, ORA recommended reducing
the total 2013-2015 RCMS forecast of $20.52 million by another $4.305 million due
to unspent 2013 budget. SCE’s original and adjusted forecasts as well as ORA’s
recommendations are listed in the table below:
2013 2014 2015
SCE Original $5 million $15.520 million $0
SCE Adjusted $0.695 million $12.520 million $7.305 million
ORA Recommended $0.695 million $10.243 million $0
ORA offers no explanation for its $4.305 million reduction to the project
total.620 SCE explains that RCMS was included in the 2012 GRC,621 but was
620 ORA-14 at 55.621 SCE-05, Vol. 2, Pt. 1 at 204.
- 219 -

A.13-11-003 ALJ/KD1/ar9/jt2/lil PROPOSED DECISION (Rev. 12)
delayed in order to “enlist the services of a qualified and experienced system
integrator consultant to help implement the system. System integrator
consultants are commonly used across the industry to help implement projects of
this nature.”622 Even though this meant work on the project was delayed, the
scope of work was not reduced.623 As a result, the full $20.520 million funding
need remains unchanged. As discussed previously, adding the underspend
from one year to subsequent forecast years requires justification. Since SCE has
demonstrated that the underspend was due to a reasonable delay, total project
spending remains unchanged, and the forecast changes only reflect changes in
the project’s timing, SCE’s adjusted forecast is adopted.
Consolidated Mobile Solution9.3.1.3.
In 2013, SCE overspent its forecast for CMS by $1.608 million. ORA
recommended reducing the 2014 CMS forecast by that amount in order to remain
consistent with its total project forecast.624 SCE disagreed and requested $7.032
million for 2014.625
ORA’s recommendation to reduce the 2014 CMS forecast is reasonable
since it maintains the total project spending and SCE offered no explanation to
justify increasing its project expenses. Therefore, the adopted 2014 CMS forecast
is $5.424 million.
Cybersecurity and IT Compliance9.3.1.4.
ORA recommends reducing SCE’s Original 2014 Cybersecurity and IT
Compliance forecast by $2.63 million626 to account for SCE’s 2013 overspend in
the Interior Defense sub-account while ignoring that three other sub-accounts –
622 SCE-21 at 61.623 Id.624 ORA-14 at 68.625 SCE-05, Vol. 2, Pt. 2 at 56; SCE-21 at 68.626 SCE-05, Vol. 2, Pt. 1 at 6-30.
- 220 -

A.13-11-003 ALJ/KD1/ar9/jt2/lil PROPOSED DECISION (Rev. 12)
Perimeter Defense, Data Protection, and Common Cybersecurity Services – all
underspent in 2013 and the account as a whole had a net underspend of $1.796
million.627 SCE’s revised forecast asks to increase its original $20.340 million
forecast for 2014 by $1.79 million (SCE slightly miscalculated: the net is actually
$1.796 million) to $22.130 million to account for the 2013 net underspend.628 As
stated, “SCE is willing to stipulate to a decrease in 2014 due to overspend in 2013
as long as the reciprocal is true.”629 As discussed previously, an overspend in a
prior recorded year typically results in the reduction of the subsequent year’s
forecast while the reverse – an underspend in a prior recorded year resulting in
an increase in the subsequent year’s forecast by the amount underspent – is
neither automatic nor assumed. The latter proposition requires justification to
protect the ratepayers from unnecessary spending. When SCE made a similar
proposition above regarding Personal Computers, the increase in spending was
justified by delays in procurement and an ongoing need to refresh the devices.
No justification has been offered here; SCE’s demand for an increase exists only
by virtue of the existence of the underspend.630 Since SCE has failed to justify its
request for an increase in its original forecast and accepts the reduction of the
2014 Interior Defense sub-account due to a 2013 overspend, ORA’s
recommended forecast is adopted with the following adjustment: ORA reduced
the 2014 forecast for the Data Protection sub-account by $500 to $6.2715 million
without any explanation; that amount is restored to $6.272 million as originally
proposed by SCE. This results in an adopted 2014 forecast totaling $17.711
million, broken down as follows: Interior Defense – $0.590 million; Perimeter
627 ORA-14 at 25.628 SCE-21 at 36.629 Id.630 SCE-21 at 36.
- 221 -

A.13-11-003 ALJ/KD1/ar9/jt2/lil PROPOSED DECISION (Rev. 12)
Defense – $5.509 million; Data Protection – $6.272 million; Common
Cybersecurity Services – $5.339 million; and Emerging Legislative Mandates – $0.
Regulatory Mandates9.3.2.
ORA recommends reducing SCE’s forecast for 2014 and 2015 to reflect a
five-year average. As discussed previously regarding the Infrastructure
Technology Services Forecast, averaging is an appropriate methodology when
there are significant fluctuations in recorded expenses from year-to-year. Given
that the recorded costs here show substantial variation in expenses from
2009-2013,631 averaging would usually be appropriate. However, in this instance,
averaging would ignore a significant change in circumstances. Regulatory
Mandates reflect a need for SCE to comply with the NERC mandated CIP
standards.632 A revised definition impacting the CIP scope went into effect in
April 2013 and auditable compliance for CIP Version 5 will be required by early
2016.633 This new version coupled with the revised definition “will significantly
broaden the scope of assets and controls requiring compliance with CIP
standards” and “[t]he number of facilities and assets in-scope for compliance is
estimated to be nine to ten times compared to that of Version 4.”634 Moreover,
due to the prolonged process of developing these new standards, SCE deferred a
“major portion of [its] capital funding from the years 2010-2012 to the years
2014-2017 based on the understanding that CIP Version 5” would go into effect
then (id. at p. 42). Since using an averaging methodology could not take these
changed circumstances into account and SCE presented ample evidence about
those changes and their impacts, SCE’s forecast of $6.526 million in 2014 and $7
million in 2015 is adopted.
631 ORA-14 at 27.632 SCE-05, Vol. 2, Pt. 1 at 34.633 Id.634 Id. at 35.
- 222 -

A.13-11-003 ALJ/KD1/ar9/jt2/lil PROPOSED DECISION (Rev. 12)
Other Capitalized Software9.3.3.
Safety, Security & Compliance: Master9.3.3.1.Access Project (MAP)
The MAP will implement new processes and common controls that
improve access management and provide compliance with NERC CIP Version 5
by April 1, 2016.635 SCE originally forecast expenses of $10.55 million for 2013
and $1.806 million for 2014. SCE’s actual recorded costs for 2013 were only
$1.859 million (just 18% of the initial forecast) due to delays resulting from
“bringing on a new implementation partner to complete the project, which has
also helped…to lower the project costs.”636 Since SCE still needs to comply with
NERC CIP Version 5 and therefore must complete the project, SCE adjusted its
2014 request to $6.794 million.637 This amount is greater than the original 2014
request, but lowers the project’s overall cost from the original request of $12.356
million to $8.652 million, a 30% reduction.638 ORA recommended using SCE’s
original $1.806 million forecast for 2014.639 While ORA offers no objections to the
project, it does not acknowledge the need to carry the underspend from 2013 into
2014 – even at a reduced amount – in order to complete the project.640 Since SCE
demonstrated that the project is necessary and the (reduced) underspend will be
applied to the project’s completion, we adopt SCE’s $6.794 million forecast for
2014.
Financial Services9.3.3.2.
SCE revised its forecast due to lower actual recorded costs for 2013, with
its 2014 forecast adjusted to $0.500 million and the 2015 forecast to $1.612
635 SCE-21 at 39; see also discussion above in Regulatory Mandates.636 SCE-21 at 40.637 Id.638 Id.639 ORA-14 at 35.640 Id.
- 223 -

A.13-11-003 ALJ/KD1/ar9/jt2/lil PROPOSED DECISION (Rev. 12)
million.641 In its brief, ORA accepts this revised forecast.642 We find SCE’s
uncontested, revised forecast reasonable and it is adopted.
Electronic Document9.3.3.3.Management/Records Management(eDMRM)
SCE requests $11.4 million for eDMRM in 2015.643 ORA “does not oppose
SCE’s request” but “recommends that SCE’s forecast for 2015 be reduced by
$2.850 million, the amount assigned to SONGS.”644 ORA offers no details
explaining this recommendation. SCE noted in its initial testimony that the
document management systems for SONGS were being decommissioned since
they no longer had vendor support, and that SCE planned to “migrate
documents from those legacy systems into eDMRM.”645 Moreover, even though
the SONGS facility has ended its generating capabilities, that shutdown has not
ended SCE’s “requirement to maintain SONGS records for compliance with the
company’s Records Retention Schedule, or to provide access to documents in
response to ongoing and future regulatory and legal proceedings or inquiries.”646
Since maintenance of SONGS records is necessary despite the SONGS shutdown,
there is no reason to exclude it from the forecast. Therefore, the Commission
adopts SCE’s request of $11.4 million for 2015.
Customer Service – Digital Experience9.3.3.4.Project
For the Digital Experience Project, SCE requests $8.44 million and $22.3
million for 2014 and 2015 respectively.647 ORA, on the other hand, recommends
641 SCE-21 at 40-41.642 ORA Opening Brief at 247.643 SCE-21 at 42.644 ORA-14 at 42.645 SCE-05, Vol. 2, Pt. 1 at 105.646 SCE-21 at 47.647 Id. at 51.
- 224 -

A.13-11-003 ALJ/KD1/ar9/jt2/lil PROPOSED DECISION (Rev. 12)
rejecting the project, i.e. $0 for 2014 and 2015.648 ORA’s rejection of the project
rests on several issues which we will address in turn.
First, ORA strongly disagrees with SCE’s benefit-cost ratio estimate and,
since ORA determines that the project’s costs outweigh the benefits, it
recommends the Commission not fund this program.649 SCE’s original
benefit-cost analysis resulted in a 1.96 ratio.650 A revised ratio based on
adjustments in response to some of ORA’s criticisms resulted in a 1.70 ratio.651
ORA made its own adjustments to the ratio and calculated it to be only 0.46.652
At the core of ORA’s disagreement is SCE’s use of “phantom avoided
costs…that will likely occur if SCE does not implement the full Digital Experience
Program.”653 The avoided costs are the potential penalties from violations of two
laws: the Controlling the Assault of Non-Solicited Pornography and Marketing
(CANSPAM) Act of 2003 and the Telephone Consumer Protection Act (TCPA) of
1991. These laws deal with electronic and telephonic communication and include
penalties for violations. SCE estimates the cost of avoided violations at $99.9
million for the next eight years, based on assuming $500 per incident and a three
percent risk of occurrence. ORA not only believes that CANSPAM “is not
complicated” to follow, but that SCE’s estimates of “avoided costs for the next
eight years assumes that SCE would not take corrective actions if SCE was
notified of a violation, i.e., SCE keeps breaking the law even after being
notified.”654
648 ORA-14 at 47 – 50.649 Id. at 48.650 SCE-05, Vol. 2, Pt. 1 at 142.651 SCE-21 at 55-56.652 ORA-14 at 49.653 SCE-05, Vol. 2, Pt. 1 at 145.654 ORA-14 at 48-49.
- 225 -

A.13-11-003 ALJ/KD1/ar9/jt2/lil PROPOSED DECISION (Rev. 12)
However, ORA misconstrues the logistics of a violation. As ORA presents
it, violations occur in sequence and can be halted once a customer raises a red
flag with a complaint, thereby ending the violation and any associated costs.655
But, as SCE demonstrated through its cited cases, violations typically involve a
single e-mail, text message, or phone call sent to tens, or even hundreds, of
thousands of consumers/customers, which is subsequently deemed a violation of
CANSPAM or TCPA.656 The concern is not the $500 cost of a single violation per
se, but that amount multiplied by the tens of thousands of recipients. A violating
message sent to just 2,000 people could result in costs of $1 million. Considering
SCE estimates it will send “70.5 million emails, alerts and notifications” to
customers in 2015 alone and that number will only increase going forward, SCE’s
concern regarding violations is well-founded.657
ORA may be correct that SCE has overstated the avoided costs to a small
degree since SCE has the collective guidance of numerous CANSPAM and TCPA
lawsuits to help it avoid violations in the future, but is unlikely that would be
enough to make costs outweigh benefits here. Indeed, SCE notes that it could
reduce avoided costs “to $32M over the five-year period and still show a positive
benefit-to-cost ratio.”658 As such, ORA did not properly evaluate the
benefit-to-cost ratio and the Digital Experience Project should not be rejected as a
result of that evaluation.
The second issue involves SCE’s failure to include additional capital costs
in its benefit-cost analysis. “ORA states that SCE does not estimate any
additional capital cost for IT refreshes or to maintain vendor support after four or
655 Id. at 49.656 SCE-05, Vol. 2, Pt. 1 at 144 and fn. 145.657 Id. at 144.658 SCE-21 at 56.
- 226 -
A.13-11-003 ALJ/KD1/ar9/jt2/lil PROPOSED DECISION (Rev. 12)
five years. SCE agrees this omission was in error.”659 In order to correct this
omission, SCE recalculated the benefit-cost analysis by adopting the
Commission’s 2012 GRC approach that “did not consider capital additions in the
attrition years. This approach removes the SCE.com/CRM sub-project initial cost
($38.7 million) and associated benefits from the cost-benefit analysis. The project
schedule does not begin until 2016, which is beyond the current rate case Test
Year. By removing the SCE.com/CRM sub-project, the project timeline is
reduced to five years, and no software package in the Digital Experience would
mature beyond four years. Thus, the analysis requiring IT refresh expenditure or
vendor support costs are appropriately excluded from the cost-benefit
calculation.”660 ORA did not dispute or even discuss this change in the
timeline.661 Moreover, even if we reject SCE’s timeline change, ORA already
calculated the impact of including “additional total refresh cost” as reducing the
benefit-cost ratio by 0.24.662 In the absence of the avoided cost issue discussed
previously, a 0.24 reduction of SCE’s 1.96 ratio or its adjusted 1.70 ratio would
fail to lower it sufficiently to conclude that costs outweigh benefits. Therefore,
the failure to include additional capital costs in the analysis is not sufficient to
reject this project.
Third, in its rebuttal, ORA objects to the inclusion of the Advanced Speech
Recognition/Text to Speech Technologies and Customer Alerts and Notification
sub-projects because “the Commission disallowed funding for [them] in the
previous GRC decision as being unnecessary at that time.”663 Such a limited
evaluation, however, relies on the circumstances for 2012 without examining the
659 SCE-21 at 55, see also ORA-14 at 49.660 SCE-21 at 55-56.661 ORA Opening Brief at 253.662 ORA-14 at 49.663 Id.
- 227 -
A.13-11-003 ALJ/KD1/ar9/jt2/lil PROPOSED DECISION (Rev. 12)
circumstances for 2015. In fact, the 2012 GRC noted that the implementation of
these two projects “may be more appropriate in 2013 or 2014.”664 According to
SCE, implementation of the Alerts and Notification system “will promote
accurate, timely, non-redundant communication to all SCE customers,
government agencies, and business partners” and streamline compliance with
“Do Not Contact” and “Do Not Call” requirements in Federal statutes.665 This
new system is needed because the current one “impedes SCE’s ability to deliver
timely, accurate, and non-redundant communication to customers.”666 Similarly,
Advanced Speech Recognition (ASR) capability “is an industry standard for
telephony self-service technology. SCE must invest in ASR to meet customer
expectations now and in the future. PG&E, San Diego Gas & Electric, and
Southern California Gas Company have all confirmed their use or pending
deployment of ASR.”667 As such, given current industry standards and the need
to avoid redundancy, funding for these programs should be allowed.
ORA’s objections to SCE’s benefit-cost analysis do not persuade the
Commission the Digital Experience Program is fundamentally flawed. Likewise,
ORA’s rejection of the ASR/Text to Speech Technologies and Customer Alerts
and Notification projects do not persuade the Commission that those
components of the Program are unnecessary. More broadly, need is still an issue,
just as it was for similar programs in 2012. While the Commission rejected those
programs because it determined that SCE’s existing systems were sufficient in
2012,668 SCE has demonstrated that there is a current need for new systems based
on the increasing growth of digital usage and changes in customer service
664 D.12-11.051 at 369.665 SCE-05, Vol. 2, Pt. 1 at 134-135.666 Id.667 Id. at 131.668 D.12-11-051 at 369.
- 228 -

A.13-11-003 ALJ/KD1/ar9/jt2/lil PROPOSED DECISION (Rev. 12)
expectations for expanded support, personalized energy management, and
streamlining information.669 Moreover, ORA has not objected to any of the
components of the Digital Experience Program based on need, instead focusing
on the accuracy of the benefit-cost analysis. Therefore, we adopt SCE’s Digital
Experience Project forecast requests of $8.44 million for 2014 and $22.3 million for
2015.
Generation Management System (GMS)9.3.3.5.
The GMS project is designed to upgrade SCE’s existing GMS to current
vendor software versions, increase the capacity for telemetry connections to
renewable generators, and lower future costs for the configuration of each
generator connection.670 SCE originally requested $1.5 million for 2013 and $0.194
million for 2014, however it spent only $0.891 million in 2013 due to delays in the
contracting process pushing back the project start date.671 Since the delays did
not reduce the overall cost of the project but merely shifted its timeframe, SCE
adjusted its 2014 forecast to account for the remaining $0.803 million of the total
$1.5 million project budget. As discussed previously, an underspend in a prior
recorded year resulting in an increase in the subsequent year’s forecast by the
amount underspent is neither automatic nor assumed – the increase requires
justification to protect the ratepayers from unnecessary spending. Here, SCE’s
increase is justified by the project’s delay and budget continuity. Since ORA
“does not oppose SCE’s request”672 and the increased spending is justified, SCE’s
2014 forecast is adopted.
669 SCE-04, Vol. 2, Table VIII-66 and at 128-130.670 SCE-21 at 63.671 Id. at 63-64.672 ORA-14 at 57.
- 229 -
A.13-11-003 ALJ/KD1/ar9/jt2/lil PROPOSED DECISION (Rev. 12)
Human Resources, Benefits and Other10.Compensation
This chapter discusses the costs of hiring, retaining, and managing SCE’s
workforce. Although this includes the administrative costs of the human
resources function, the majority of the costs represent the costs of compensation
for SCE employees across many departments.
In each rate case, SCE and ORA jointly manage a TCS to analyze the total
compensation of SCE employees relative to industry peers. In this case, Aon
Hewitt prepared the TCS. The TCS concludes that SCE’s overall compensation is
5% below market; the study has a 5% margin of error.673 TURN questions the use
of a peer group survey, such as the TCS, due to “bias” and notes that spot
bonuses are not included in the TCS.674
One disputed issue is the role of rate recovery for incentive compensation.
SCE argues that cost of service ratemaking principles require that if total
compensation is at market levels, the total amount should be allowed. SCE
further argues that it is inappropriate to consider whether ratepayers or
shareholders are the primary beneficiary of variable incentive pay. SCE cites a
number of precedents, both by this Commission and other venues, in support of
its analysis, and quickly discards several recent Commission decisions
concluding that none “withstands scrutiny.”675 We disagree. None of the
precedents cited approvingly by SCE directly address the distinction between
ratepayer and shareholder benefits. In our view, as evidenced by our recent
precedents, this distinction is a key point in terms of incentive compensation. We
agree with SCE that there are many examples of issues where shareholder and
ratepayer benefits are aligned, including, for example, attracting, retaining, and
673 SCE-6V2P2.674 TURN OB at 137-138. 675 SCE-06V2P1 at 7-15.
- 230 -

A.13-11-003 ALJ/KD1/ar9/jt2/lil PROPOSED DECISION (Rev. 12)
motivating high quality employees. We also agree with SCE that not all utility
transactions have a “winner” and a “loser.” On the other hand, we observe that
SCE’s implication that past decisions have inferred otherwise (i.e., that “many, if
not every, transactions” have a winner and loser) is a transparently self-serving
strawman argument not supported by the text of those decisions. We caution
SCE against employing such logical fallacies and suggest that SCE seek to
manage its business to minimize the number of transactions which create a
“loser” at all. We prefer a model where ratepayers, shareholders, and the
community generally are all “winners” to the greatest extent possible. Further,
we acknowledge that incentive pay programs can focus employee attention
toward achieving goals that align with ratepayer interests. However, the
interests of shareholders are only our concern to the extent that they align with
ratepayer interests. Implicit in cost of service ratemaking is the concept that not
all costs are reasonable costs of service: some costs may be unreasonable due to
the magnitude of costs; other costs may be inadequately related to providing
utility service to ratepayers. To the extent an incentive program (or any other
cost) is designed to further objectives other than providing safe and reliable
service at just and reasonable rates, the costs of that incentive program are not a
reasonable cost of service, even if total compensation (including incentives) is at
market. This is not unique to incentive compensation; if SCE pays an employee a
salary to further objectives other than providing safe and reliable service at just
and reasonable rates, that salary is not a reasonable cost of service, regardless of
the level of total compensation. SCE bears the burden of proving that the costs of
an incentive program are a reasonable cost of service. To the extent that SCE fails
to meet this burden, ratepayers should not pay the costs. Such a finding in no
- 231 -

A.13-11-003 ALJ/KD1/ar9/jt2/lil PROPOSED DECISION (Rev. 12)
way bars SCE’s shareholders from funding such an incentive program. This is
consistent with cost of service principles.
In its comments on the Proposed Decision, SCE ignores much of the
discussion above and attempts to suggest that this guidance is constraining SCE’s
discretion and that the “essential directive” is toward increased base pay and
reduced incentive compensation.676 We reject SCE’s analysis, and highlight one
alternative option for SCE management: target incentive compensation to achieve
ratepayer benefits. This does not mean that shareholders cannot benefit from the
incentives created, but simply that the metrics used to award incentive
compensation should be designed explicitly to advance ratepayer interests.
Human Resources (HR) Department Expenses10.1.
SCE requests a total of $40.317 million in O&M for HR Department
Expenses, excluding executive compensation, discussed below. These expenses
are in FERC accounts 920/921, 923, and 926. SCE uses a combination of LRY and
five-year recorded averages for the labor and non-labor components of these
accounts, along with OpX adjustments and certain reductions related to
SONGS.677
No party disputes the basics of the forecast, but ORA proposes an
additional SONGS related reduction of $0.990 million to Accounts 920/921.
ORA’s reduction is based on removing 15 SONGS employees that charged to HR
during 2012.678
In rebuttal, SCE explains that the 11 positions in dispute were temporarily
dedicated to SONGS during 2012 due to the outage and were reassigned to
support other groups within SCE. SCE notes that the scoping memo in this
676 SCE Opening Comments at 7-8.677 SCE-6V1 at 46-50; SCE-6V1R at 9. 678 ORA-16 at 10-12; ORA 16-A-R-2 at 4.
- 232 -

A.13-11-003 ALJ/KD1/ar9/jt2/lil PROPOSED DECISION (Rev. 12)
proceeding directed SCE to remove SONGS costs from its forecast, and claims it
complied with this directive.679
SCE’s rebuttal does not fully address the data presented by ORA, which
shows that the number of SONGS HR employees peaked at 17 in 2011 and has
been higher than the four positions removed by SCE from 2008 to 2012.680
Nevertheless, we understand SCE’s point that HR employees move between
different parts of the company from time to time. Since SCE has failed to account
for the full number of SONGS HR employees in the recorded data, we adopt one
third of ORA’s proposed reduction. We reduce SCE’s forecast for HR
department labor expenses in Accounts 920/921 by $0.330 million; other portions
of SCE’s HR department expenses are approved.
Executive Officer Expenses10.1.1.
SCE requests $21.022 million for executive cash compensation (including
the Executive Incentive Compensation Plan [EIC], but not long term incentives)
in FERC Accounts 920/921 and 923. SCE bases its forecast on five-year averages
for Account 920/921 and a four-year average for Account 923. SCE’s forecast
includes a number of officers of Edison International (EIX) and officers shared
between EIX and SCE.681
ORA accepts SCE’s forecast and methods, but proposes that shareholders
fund 91.25% of the EIC. ORA’s primary rationale is that SCE did not
demonstrate how executive incentives benefit ratepayers, beyond stating that
ratepayers benefit from a focus on public safety, customer satisfaction, and other
factors. Instead, ORA argues, the EIC is tied to financial performance and
shareholder benefits. ORA uses information from EIX’s Joint Proxy Statement,
679 SCE-22 at 2. 680 ORA-16 at 11.681 SCE-6V1 at 51-60.
- 233 -

A.13-11-003 ALJ/KD1/ar9/jt2/lil PROPOSED DECISION (Rev. 12)
and analysis of how specific goals do or do not benefit ratepayers to calculate its
proposed 8.75% ratepayer contribution to EIC. In support of its proposal, ORA
notes that the TCS found that SCE executive compensation is 9.5% over-market
and that in D.12-11-051 we authorized 50% of EIC costs to be paid by ratepayers.
ORA’s recommendation leads to a $6.251 million reduction to SCE’s forecast for
labor in Account 920; ORA does not contest other elements of SCE’s forecast.682
TURN argues that 60% of EIC goals are tied to financial performance (40%)
or lobbying (20%) based on TURN’s analysis of SCE’s joint proxy statement.683
In rebuttal, SCE makes several responses to ORA. SCE argues that ORA
misuses the TCS, claiming it is inappropriate to look at any individual job
category and showing that the TCS evaluation of executive compensation has
fluctuated in recent GRCs. SCE claims that reducing EIC to the level proposed
by ORA would harm SCE’s ability to attract and retain qualified executives by
reducing total compensation to 24% below market. SCE also suggests that it is
inappropriate micromanagement for the Commission to set specific components
of compensation, and that if the Commission does so, SCE would likely shift
compensation to base pay. SCE claims that financial performance of the utility
benefits ratepayers through lower borrowing costs. Finally, SCE claims that no
party has shown its costs are unreasonable or imprudent, and that disallowing
them would be confiscatory and counter to cost of service ratemaking.684
In D.12-11-051,685 we allowed rate recovery of 50% of SCE’s forecast for
EIC, noting that this was based on what was reasonable to charge to ratepayers.
In this case, ORA and TURN have put forward analysis indicating that the EIC
awards are largely given based on shareholder benefits. Although SCE claims
682 ORA-16 at 16-23.683 TURN-12 at 18.684 SCE-22 at 4-11.685 At 450.
- 234 -

A.13-11-003 ALJ/KD1/ar9/jt2/lil PROPOSED DECISION (Rev. 12)
that the Joint Proxy Statement was written for a shareholder audience,686 it does
not provide any credible alternative reading of the awards criteria to support its
implication that EIC awards are targeted to achieve ratepayer benefits. SCE’s
comments that some of the awards are based on benefits shared by ratepayers
and shareholders are very limited examples. We agree with SCE that financial
performance may benefit ratepayers, however the ratepayer benefit is much less
direct than the shareholder benefit. Further, in some instances, financial
performance may be achieved at the detriment of ratepayers. Accordingly, we
adopt 40% of SCE’s EIC forecast for rate recovery and approve the non-EIC
portions of SCE’s executive compensation request. If SCE seeks rate recovery of
higher portions of the EIC in its next GRC, it should provide substantially more
evidence that the EIC awards incent executives to achieve ratepayer benefits.
Short Term Incentive Program (STIP)10.2.
SCE’s STIP consists of: (a) Results Sharing (RS) program; (b) Management
Incentive Program (MIP); and (c) Non-Officer Executive Incentive Compensation
Plan (NOEIP). In some instances, the terms STIP and RS are used synonymously
in testimony. These programs (together with EIC, above) provide an opportunity
for all employees to earn a bonus linked to individual, OU, or Company
performance. SCE describes an annual cycle for setting OU and Company goals
and evaluating performance. SCE claims that the company goals “are
overwhelmingly tied to matters benefiting ratepayers.” SCE’s total forecast is
$143 million in FERC Accounts 500, 588, 905, and 920/921, down 18% from 2012
recorded. SCE’s forecast is based on the 2012 ratio of STIP costs to total
non-capital labor costs, applied to the 2015 labor forecast.687
686 SCE-22 at 9.687 SCE-6V2P1 and SCE-6V2P1R at 1, 16-22.
- 235 -

A.13-11-003 ALJ/KD1/ar9/jt2/lil PROPOSED DECISION (Rev. 12)
ORA proposes using a 2008-2013 average of the ratio of STIP to labor,
instead of SCE’s use of 2012 recorded, which ORA notes is the highest year in
that period. ORA calculates this as 12.08% compared to SCE’s 15.97%. Using
ORA’s labor forecast, ORA calculates a STIP forecast of $97.543 million. Further,
ORA proposes to “allocate” different fractions of STIP costs to ratepayers (0% for
NOEIP, 50% for MIP, 50% for RS non-union employees, and 75% for union
employees in RS), averaging to 45.5% to shareholders and the remaining 54.5% to
ratepayers. ORA claims its proposal recognizes benefits to ratepayers and
shareholders. ORA further argues that the STIP gives disproportionate awards
to managers and executives relative to rank and file employees. In ORA’s view,
NOIEP should be shareholder funded because it is driven by financial
performance, PG&E did not seek rate recovery of its analogous program in its
most recent GRC, and SCE executives are above market by more than the margin
of error (5%) in the TCS. For MIP and non-union employees in RS, ORA’s
analysis of the payout criteria suggests that both shareholders and ratepayers
benefit, and ORA proposes a 50-50 split. ORA considers union contracts and the
reduced flexibility of management in its proposal for 75% ratepayer funding of
RS for union employees. In summary, ORA proposes ratepayer funding of
$53.155 million.688
TURN proposes a variety of reductions to SCE’s STIP forecast. First,
TURN recommends retaining the 10.94% factor for calculating the STIP forecast
adopted in D.12-11-051, noting that SCE proposes a 46% increase in this ratio and
that SCE’s 2012 recorded payments were 127% of target. Second, TURN
proposes that goals related to lobbying should not be eligible for ratepayer
funded STIP payouts, citing both of SCE’s most recent GRC decisions. Using
688 ORA-16 and ORA-16AR2 at 24-36.
- 236 -

A.13-11-003 ALJ/KD1/ar9/jt2/lil PROPOSED DECISION (Rev. 12)
2014 goals, TURN enumerates several STIP goals that it finds related to lobbying,
not necessarily in the interest of ratepayers. TURN calculates reductions of 14%
for External Relations and 37% for Government Affairs. Third, TURN proposes
that ratepayers fund half or none of O&M savings goals depending on whether
ratepayers receive all or half of OpX savings addressed below in Section 25.
TURN argues that benefits for O&M savings are “at best” shared between
ratepayers and shareholders, depending on whether efficiency drives the
savings. Fourth, TURN calculates that 40% of NOEIP are based on financial
performance and an additional 20% is based on strategic initiatives, including
lobbying, and correspondingly recommends that ratepayers fund 40% of
NOEIP.689 TURN agrees with ORA that STIP disproportionately rewards
managers.690
SBUA recommends that “quality of service to small businesses be
included” in STIP, but does not elaborate.691
In rebuttal to ORA and TURN, SCE makes several arguments. SCE claims
that ORA’s six-year average method is flawed for two reasons. First, it relies on
unadjusted 2013 data and incorrectly addresses inflation. Accounting for these
errors, SCE calculates a six-year average of 12.11%. Second, SCE alleges that the
recorded data shows a clear upward trend, and that therefore, LRY is
appropriate. SCE argues that TURN’s proposal to use a 10.94% ratio
inappropriately “assumes Company and OU performance remains static and
eliminates any incentive to achieve better than target performance.” Further,
SCE suggests that TURN and ORA do not consider the TCS’s conclusion that
total compensation is 5% below market and repeats its cost of service arguments
689 TURN-12 at 2-20. 690 TURN OB at 140.691 SBUA-1 at 23.
- 237 -

A.13-11-003 ALJ/KD1/ar9/jt2/lil PROPOSED DECISION (Rev. 12)
discussed above, in favor of 100% rate recovery. SCE claims that none of the
employees covered by NOEIP are included in the “Executive” category of TCS,
and that therefore ORA misrepresents the TCS. SCE claims that its testimony
shows ratepayer benefits from STIP goals.692
In recent GRCs, we have adopted reductions to short term incentives to
account for payouts that are driven by shareholder benefits rather than ratepayer
benefits. For example, in D.12-11-051, we allowed rate recovery of 90% of STIP
and in D.14-08-032 excluded certain categories. As TURN and ORA demonstrate
here, significant portions of the payout criteria are directly related to shareholder
benefits such as achieving decisions in CPUC proceedings (GRC, cost of capital)
with certain outcomes and achieving specified public policy objectives that may
or may not provide secondary benefits to ratepayers. As discussed above, SCE
bears the burden of proving that incentive programs are a reasonable cost of
service, and has not demonstrated that costs related to these criteria are
reasonable. Moreover, we agree with TURN and ORA that the proposed
significant increase in the ratio of STIP payments to total labor is not adequately
justified, especially given that STIP payments in 2012, on which SCE bases its
proposal, were 27% above target. We find SCE’s argument that an historical
average of this ratio is inappropriate to be unpersuasive – we disagree that
2008-2013 shows a clear trend. However, we do place weight on the results of
the TCS and decline to adopt the deep cuts proposed by TURN and ORA. To
calculate STIP forecast, we apply the 12.11% ratio of STIP to total labor, as
calculated by SCE based on ORA’s proposed six-year average, to SCE’s total
labor forecast, then reduce that amount by 10% to account for STIP payout
criteria that are not appropriate to charge to ratepayers. This forecast would be
692 SCE-22 at 14-25.
- 238 -

A.13-11-003 ALJ/KD1/ar9/jt2/lil PROPOSED DECISION (Rev. 12)
approximately $98 million using SCE’s labor forecast, but we calculate the actual
forecast using adopted labor values.
Long Term Incentives (LTI)10.3.
SCE forecasts $18.18 million in LTI, noting that LTI is an important
(24-53%) component of total direct compensation for its executives, and that this
is common practice among large companies. LTI is recorded in FERC Account
920. SCE describes the two criteria for granting LTI stock options; both are solely
based on EIX financial performance. SCE argues that LTI helps to retain
employees and motivate them to take actions in the long-term best interest of
customers. SCE repeats its cost of service arguments described above.693
ORA, TURN, and SBUA all oppose rate recovery of LTI on the grounds
that SCE has not clearly shown benefit to ratepayers. For example, SBUA argues
that LTI “do not have a direct relationship to utility services.”694
In recent decisions, we have held that LTI is not recoverable from
ratepayers because LTI does not align executives’ interests with ratepayer
interests.695 SCE’s arguments to the contrary are vague, limited, and
unpersuasive. SCE has not demonstrated that LTI furthers the provision of safe
and reliable service at just and reasonable rates. We continue our consistent
practice and reject rate recovery of SCE’s LTI program.
Recognition Programs10.4.
SCE has two recognition programs: Spot bonuses and Awards to
Celebrate Excellence (ACE). Spot bonuses are cash awards for achievements
such as promoting safety or leading programs that improve efficiency. ACE is a
points-based program for participants in safety efforts. SCE does not provide a
693 SCE-6V2P1 at 23-28.694 SBUA OB at 12, ORA 16 at 38-39, and TURN OB at 145-148. 695 D.12-11-051 at 451-452; D.13-05-010 at 882-884.
- 239 -
A.13-11-003 ALJ/KD1/ar9/jt2/lil PROPOSED DECISION (Rev. 12)
specific forecast for these programs; instead they are included in the labor
component of OU forecasts.696
ORA opposes these programs, finding the forecast unclear and claiming
that SCE has not established ratepayer value. ORA notes that for ACE, SCE’s
data request responses suggest that costs are recorded as non-labor. Further,
ORA argues that these programs are inappropriately duplicative of the STIP
discussed above.697
In rebuttal, SCE emphasizes the safety connection of the ACE program and
differentiates Spot bonuses from STIP based on timing. SCE argues that,
therefore, these programs provide real and unique ratepayer value at a
reasonable cost.698
We agree with SCE that the types of behaviors (e.g., a focus on safety) that
these programs reward do further the provision of safe and reliable service at just
and reasonable rates. Further, we agree that the costs appear reasonable relative
to the benefits. However, we share ORA’s concern (noted previously in
D.12-11-051699) that SCE’s forecast is not transparent. Therefore, we consider
these programs in context of the individual OU budgets, rather than making any
specific authorization or disallowance here. Further, we direct SCE to present a
clear and coordinated showing on its forecast for these recognition programs in
its next GRC direct testimony.
Pension and Benefits Programs (Account 926)10.5.
SCE forecasts $384.662 million for benefits including: pension, 401(k),
health care, disability, group life insurance, and executive benefit plans. All costs
are recorded in FERC Account 926, with the large majority recorded in the
696 SCE-6V2P1 at 29-30.697 ORA-16 at 41-47.698 SCE-22 at 31-35. 699 At 459-460.
- 240 -

A.13-11-003 ALJ/KD1/ar9/jt2/lil PROPOSED DECISION (Rev. 12)
“Other” cost category.700 The table below summarizes our adopted forecast
(millions of 2012$). We note that the numbers presented in the table assume that
SCE's labor forecast is adopted, but in fact the actual adopted labor forecast
contains numerous differences relative to SCE's forecast. The actual adopted
pension and benefit figures (not shown here) are calculated in the RO model,
using the same ratio of pensions or benefits to labor expense as the illustrative
adopted numbers shown here, applied to the adopted labor forecast.
SCE Illustrative Adopted
Pensions 88.326 88.326
Post-Retirement Benefits Other than Pensions 44.573 44.573
Other Benefits 251.763 243.130
Total 384.662 376.029
Pensions10.5.1.
In the update phase, SCE reduced its pension forecast to $88.326 in
response to a change in law and updated actuarial information. SCE cites this
change as support for the importance of two-way balancing account treatment.701
This value is considerably lower than ORA’s prior forecast of $155.077 million.
ORA also proposes a change to a one-way balancing account, or alternatively a
90-10 sharing mechanism for ratepayer-shareholder responsibility for any actual
pension contributions above the authorized amount. ORA argues that these
approaches provide just and reasonable “checks and balances” for cost control in
this area.702
In D.12-11-051, we directed SCE to review its pension practices. In
response, SCE includes a comparison of its pension practices to those of other CA
utilities (public and investor owned) and state employees. Generally, this review
700 SCE-6V2P1 and SCE-6V2P1R at 31-32.701 SCE-73 at 21-22.702 ORA-17 and ORA-17A at 3-7.
- 241 -

A.13-11-003 ALJ/KD1/ar9/jt2/lil PROPOSED DECISION (Rev. 12)
concludes that employees receive comparable total benefits for comparable total
contributions, even though there are relative differences between defined-benefit
and defined-contribution portions.703
SCE contends that its pension contributions are set by law and actuarial
standards, and are not under its control.704
We adopt SCE’s updated forecast and proposed balancing account
treatment. Minimum pension contributions are not controlled by SCE and are
appropriate for balancing account treatment.
Post-Retirement Benefits Other than Pensions (PBOPs)10.5.2.
SCE offers PBOPs. These benefits include post-retirement medical, dental,
vision, Medicare Part B premium reimbursement, Employee Assistance Program,
and term life insurance. SCE describes significant changes to reduce costs for
PBOPs over time. SCE has established certain trust funds to make tax deductible
contributions to finance PBOP costs. PBOP costs are recovered via the existing
two-way PBOP Balancing Account. In most recent years, PBOP costs have been
lower than authorized, and excess contributions have been periodically returned
to customers. Aon Hewitt, SCE’s PBOP actuary, estimates a 2015-2017 average
PBOP costs of $44.156 million, down from $53.378 authorized in the 2012 GRC.
This estimate includes workforce reductions through May 2013. SCE also
requests $0.42 million for PBOP actuarial fees. SCE’s total PBOP forecast is
$44.573 million.705
ORA recommends a total PBOP forecast of $42.017 million based on an
updated actuarial calculation.706 SCE observes that ORA’s updated 2014-2015
forecast is actually higher than the 2015 estimate that SCE used, as a component
703 SCE-6V2P1 at 32-51 and SCE-73 at 21-22.704 SCE-22 at 40-45. 705 SCE-6V2P1 at 80-90.706 ORA-17 at 7.
- 242 -

A.13-11-003 ALJ/KD1/ar9/jt2/lil PROPOSED DECISION (Rev. 12)
of its 2015-2017 average. SCE argues that the three-year average approach
should be continued and that it is inappropriate to recalculate the forecast every
time new information is available. We agree with SCE and adopt SCE’s forecast.
Other Benefits10.5.3.
This section addresses several other benefits provided by SCE, including:
401(k) savings plans; medical, dental, and vision programs; disability; life
insurance; and executive benefits. SCE’s proposals are briefly summarized
below:
401(k) – SCE forecasts $64.940 million in costs for matchingemployee contributions (up to 6% of each employee’s salary).SCE’s forecast is based on the ratio of 2012 recorded 401(k) coststo 2012 recorded labor costs, escalated by the labor escalationfactor discussed in Section 18 below, and applied to SCE’s total2015 labor cost forecast.
Medical – SCE forecasts $131.110 million, including a variety ofhealth insurance plans, preventive health accounts, and employeeassistance program for short-term counseling services. Theforecast is based on number of eligible employees andper-eligible-employee costs, escalated by an annual trend rate of5.4% in 2013 and 8% for 2014 and 2015. This trend rate wasproduced by SCE after “review of Edison’s actual medical plantrends, the trend rates provided by the administrators of SCE’smedical plans, as well as outside consulting firm projections oftrend, and taking into account the significant pressures onmedical plan costs . . . “.707 SCE’s medical plan administratorsprovided estimates of escalation rates ranging from 9.8% to 11%in 2014 and 2015. SCE discusses the cost increases expected byother employers and concludes that its forecast trend rate isreasonable. SCE cites recent federal health care reform legislationand increasing utilization of health care services as examples offactors leading to increased cost per-eligible-employee.
707 SCE-6V2P1 at 73.
- 243 -

A.13-11-003 ALJ/KD1/ar9/jt2/lil PROPOSED DECISION (Rev. 12)
Dental – SCE forecasts $14.777 million based on the number ofeligible employees times per-eligible-employee cost forecast,increased based on trends provided by the dental plan providers.
Vision – SCE forecasts $3.122 million based on the same methodas dental and medical, with per-eligible-employee cost escalatedby 2% per year, as projected by the plan provider.
Disability – SCE forecasts $14.533 million based on the samemethod as dental and medical, with per-eligible-employee costsbased on 2012 costs, escalated by the labor escalation rate asdiscussed in Section 18.
Group Life Insurance – SCE forecasts $1.252 million based on thesame method as dental and medical, with per-eligible-employeecosts based on 2012 costs, unescalated.
Miscellaneous Benefits – SCE forecasts $4.763 million based onthe same method as dental and medical, withper-eligible-employee costs based on 2012 costs, escalated by thenon-labor escalation rate as discussed in Section 18. This benefitis primarily a 25% discount on electric service for employeesliving in SCE’s service territory.
Executive Benefits - SCE forecasts $17.266 million based on anannual actuarial valuation calculated by Aon Hewitt, consideringfactors including number and age of executives, bonuses, andexpected mortality. Executive benefit costs are net of the SCE’spension system and 40% of social security benefits.708
ORA rejects SCE’s basic approach and contends that 2013 data should be
used for the forecast. ORA bases its primary proposed adjustment to the forecast
on comparing SCE’s 2013 forecast to SCE’s 2013 FERC Form 1 data, adjusting for
capitalization. On this basis, ORA reduces SCE’s forecast by 15.1%. ORA makes
further reductions for medical and disability escalation rates and using its own
total labor forecast. ORA proposes to disallow entirely the executive benefits.
708 SCE-6V2P1 and SCE-6V2P1R.
- 244 -

A.13-11-003 ALJ/KD1/ar9/jt2/lil PROPOSED DECISION (Rev. 12)
ORA’s total medical forecast is $96.997 million based on the above factors.
ORA uses the Berkeley Healthcare Forum for its medical escalation rate of 6.6%
per year, noting that this is a California-specific forecast. ORA also notes a
variety of lower, national forecasts of medical inflation, including Global Insight
which is used by both SCE and ORA to escalate other rates in this GRC.
For disability, ORA forecasts $11.132 million by using SCE’s proposed
labor escalation rate, in addition to the 15.1% reduction and using ORA’s forecast
for total labor.
ORA proposes to disallow the executive benefits entirely, arguing that
costs and benefits beyond those of other employees should be funded by
shareholders. ORA claims that because these benefits are above those specified
in the Internal Revenue Code (section 401(a)), these benefits are not appropriate
for rate recovery. ORA cites several decisions from other jurisdictions in support
of its view, and notes that in 2009 and 2012, we reduced SCE’s recovery of these
benefits by 50%. ORA also specifically objects to supplemental survivor,
disability, and severance benefits that are afforded to executives, but not other
employees.709
SCE objects to ORA’s 15.1% reduction, claiming that ORA inappropriately
relies on preliminary, unadjusted data from FERC Form 1. SCE claims to have
identified two adjustments, totaling $28 million in a “cursory” review and that
applying these adjustments would reduce ORA’s 15.1% to 5%. SCE further
claims that it is inappropriate and mathematically flawed for ORA to apply the
reduction to individual programs. SCE also suggests that the approved labor
forecast should be used for all benefit calculations. For certain benefits, SCE also
makes specific arguments, as discussed below.
709 ORA-17 at 8-16.
- 245 -

A.13-11-003 ALJ/KD1/ar9/jt2/lil PROPOSED DECISION (Rev. 12)
SCE finds no basis for ORA’s proposed reduction to the 401(k) program in
ORA-17, and recommends rejecting this proposal.
SCE rejects ORA’s use of the Berkeley Healthcare Forum’s 6.6% medical
escalation rate. After reviewing the report, SCE concludes that a key component
of the 6.6% forecast is “simply an educated guess.” Further, SCE argues that
certain other sources discussed by ORA for medical escalation are inapplicable
for various reasons.
SCE believes that ORA’s calculation of dental benefits inadvertently relied
on an outdated per-eligible-employee cost.
For disability, SCE claims that ORA’s proposed reductions are based on
using the general labor escalation factor are already included in SCE’s testimony
and that ORA inadvertently used an outdated per-eligible-employee cost.
SCE claims that the executive benefits program promotes retention of qualified
executives, is market competitive (citing the TCS), and should be recovered in
rates. SCE cites counterexamples to ORA’s citations in other jurisdictions.710
In its brief, ORA notes that the FERC Form 1 data it relied on was labeled
as “2013 Recorded Adjusted” and that SCE would later provide an update, and
that no such update was provided before ORA submitted its testimony. ORA
also points out that SCE’s witness could not describe whether any additional
adjustments were found beyond those discussed in SCE’s rebuttal. Further, ORA
notes that SCE’s rebuttal states that the FERC Form 1 data includes other
expenses, not discussed in this section, suggesting that the 15.1% calculated by
ORA may be an underestimate.711
With the exception of Executive Benefits, we adopt SCE’s forecast. SCE’s
basic approach of calculating per-eligible-employee costs, escalating those costs,
710 SCE-22711 ORA OB at 290-291.
- 246 -

A.13-11-003 ALJ/KD1/ar9/jt2/lil PROPOSED DECISION (Rev. 12)
and multiplying by the number of eligible employees is reasonable. While we are
sympathetic to ORA’s desire to use 2013 data, the differences between the
recorded and forecasted data are unclear. Further, the continued use of the
Medical Programs Balancing Account ensures that customers will only pay the
actual cost of the medical, dental, and vision benefits. However, we do remind
SCE that it bears the burden of proof in its GRCs, and that it must be careful to
accurately label data (e.g., adjusted or unadjusted) in its data request responses
and to update responses when better information is available. For medical
escalation, we give significant weight to SCE’s reference to escalation rates
provided by its plan administrators, and find this preferable to relying on a
broader public study as proposed by ORA.
For Executive Benefits, we follow the precedent of the 2009 and 2012
GRCs,712 and allow 50% rate recovery of SCE’s forecast. These Executive Benefits
are, in part, based on bonuses received by the executives. As discussed above,
these bonuses may not be appropriate for rate recovery. Accordingly, benefits
based on those bonuses are also not appropriate.
The adopted forecast is (millions of 2012$):713
SCE ORA Illustrative Adopted
Medical Programs 131.110 96.998 131.110
401(k) Savings Plan 64.940 58.367 64.940
Dental Plans 14.777 10.669 14.777
Vision Service Plan 3.122 2.381 3.122
Disability Program 14.533 11.132 14.533
Group Life 1.252 0.952 1.252
Miscellaneous Benefits 4.763 3.616 4.763
Executive Benefits 17.266 0.000 8.633
712 D.12-11-051 at 476-477.713 The employee benefits shown in the table are dependent on the number of employees based
on labor expenses approved by this decision. The adopted expenses shown in the table are illustrative and may not match the final amounts.
- 247 -

A.13-11-003 ALJ/KD1/ar9/jt2/lil PROPOSED DECISION (Rev. 12)
Total 251.763 184.115 243.130
Safety, Security & Compliance (SS&C)11.
SS&C operating unit was formed in 2012 of existing departments. The
group focuses on safety of workers and the public, security of people and
infrastructure, preparation to respond to events, and compliance with law and
regulation. SCE forecasts an increase in O&M costs relative to 2012 recorded,
driven by a need to increase security and secure more locations according to
NERC CIP. SCE also states that it needs to improve its resiliency to respond to
major disruptions (e.g., earthquakes). Capital expenditures are driven by the
same factors in addition to marine mitigation programs related to SONGS (See
Section 11.2.5 below). SCE states that safety is a paramount objective of the
company, and all four departments of SS&C (Ethics and Compliance; Corporate
Environmental, Health, and Safety; Corporate Security; and Business Resiliency)
contribute to this goal. Additionally, SS&C contributes to reliability and
sustainability of SCE’s electric service.714
714 SCE-7V1.
- 248 -

A.13-11-003 ALJ/KD1/ar9/jt2/lil PROPOSED DECISION (Rev. 12)
Our adopted O&M forecast is summarized below (millions of 2012$).
Account(s) SCE Adopted
Ethics and Compliance 920/921,923 $ 8.120 $ 8.120
CEHS Management andEnvironmental Services
920/921 $ 4.833 $ 4.833
CEHS - Marine Mitigation 920/921 $ - $ 3.702
Transmission Environmental Services 566.250 $ 5.174 $ 5.174
Distribution Environmental Services 582.250 $ 2.289 $ 2.289
Health and Safety 925 $ 3.785 $ 3.785
Outside Consulting 923 $ 0.475 $ 0.475
Corporate Security and BusinessResiliency
920/921,923 $ 44.368 $ 44.368
Total $ 69.044 $ 72.746
Our adopted capital forecast is summarized below (millions of nominal$).
SCE Adopted
2014 2015 2014 2015
Corporate Security & BusinessResiliency
$60.623 $20.369 $60.623 $20.369
SONGS Marine Mitigation $ - $24.693 $ - $ -
Total $60.623 $45.062 $60.623 $20.369
Ethics and Compliance (Accounts 920/921, 923)11.1.
This department was formed in 2005. SCE forecasts $8.120 million in O&M
for Ethics and Compliance, based on 2012 recorded. In addition to the O&M
request, two IT capital projects, discussed above in Section 9.3, are important to
this department’s work. SCE details the work of the department and provides
data in response to certain requirements in D.12-11-051.715
ORA proposes a 10% reduction on the basis that shareholders should pay a
portion of the costs. ORA contends that many of the functions within the Ethics
and Compliance department benefit shareholders via reduced risk of lawsuits,
715 SCE-7V2.
- 249 -

A.13-11-003 ALJ/KD1/ar9/jt2/lil PROPOSED DECISION (Rev. 12)
for example. Moreover, ORA questions the efficacy of the department and
believes that there are inconsistencies in SCE’s showing. For instance, ORA
asserts that there are fewer staff in the Drawings Management group in 2012 than
in 2009, but increases in staffing are cited by SCE as a basis for its request.716
TURN proposes certain adjustments that are addressed in Section 28.1
below.717
SCE rebuts ORA’s attack on the efficacy of the department by showing that
much of the information relied on by ORA predates significant improvements
following the 2012 GRC. Further, SCE argues that there is no basis for ORA’s
proposal to allocate 10% of costs to shareholders, that there is no precedent for
such an allocation.718
In its brief, ORA discusses the impact of federal legislation (Sarbanes Oxley
Act) in support of its position that compliance benefits shareholders more than
ratepayers. Further, ORA argues that SCE provided no recent information
supporting the success of Ethics and Compliance, and that SCE’s criticism of
ORA’s sources is unfair.719
Notwithstanding ORA’s arguments, we agree with SCE that the forecast
O&M costs of the Ethics and Compliance department are reasonable. Ratepayers
benefit from a strong culture of ethics and compliance, and SCE has
demonstrated success in making improvements in the department. SCE’s
forecast is adopted.
716 ORA-18 at 7-12.717 TURN-5 at 121-122.718 SCE-23 at 4-5. 719 ORA OB at 303-305.
- 250 -

A.13-11-003 ALJ/KD1/ar9/jt2/lil PROPOSED DECISION (Rev. 12)
Corporate Environmental, Health, and Safety (CEHS) (Accounts11.2.566.250, 582.250, 920/921, 923, and 925)
CEHS is responsible for two basic areas: environmental services, and
health and safety. CEHS develops and manages programs across SCE in these
areas, including compliance with various statutory and regulatory requirements.
CEHS works with many OUs, and costs for projects specific to an OU unit are
charged back to the OU.
SCE contends that an increase above 2012 recorded-adjusted O&M
expenses is needed because 2012 was anomalous. CEHS also forecasts costs for
SONGS marine mitigation. Finally, CEHS presents certain environmental
services costs for transmission and distribution, but these costs are accounted for
in Section 7.10.4 above.720
CEHS Management and Environmental Services11.2.1.(Account 920/921)
This category includes costs not tied to a specific capital project or
OU-specific project such as: coordination, environmental siting, permitting,
reporting, development and implementation of company-wide management
systems and controls, compliance assurance, and training. SCE finds “significant
fluctuation” during 2008-2012 in recorded costs. SCE forecasts labor and
non-labor costs based on five-year averages.721
ORA accepts SCE’s forecast, but recommends an additional incremental
O&M expense associated with SONGS Marine Mitigation, discussed in Section
11.2.5 below.722 SCE opposes ORA’s recommendation, but also provides an
alternative calculation of the impact of accepting ORA’s recommendation.723
720 SCE-7V3 at 1-2.721 SCE-7V3 at 3-8.722 ORA-18 at 14.723 SCE-23 at 7.
- 251 -

A.13-11-003 ALJ/KD1/ar9/jt2/lil PROPOSED DECISION (Rev. 12)
We adopt SCE’s uncontested forecast plus $3.703 million (2012$) in
expenses for SONGS Marine Mitigation, as describedbelow.
Environmental Services for Transmission and11.2.2.Distribution (Portion of Account 566.250 -Transmission and Entirety of Account 582.250 -Distribution)
CEHS performs these activities, but the costs record to FERC Accounts in
T&D in Section 7.10.4 above. CEHS provides services including environmental
program development, implementation and onsite mitigation for T&D projects.
SCE’s costs have increased during 2008-2012 due to major transmission
projects and implementation of the Compliance Management System (CMS).
SCE explains that as projects are completed environmental costs, shift from
capital to expense, particularly onsite mitigation.
SCE’s transmission forecast for 2015 is based on 2012 recorded plus an
estimate based on capital project completion. The incremental estimate is based
on an average of SCE’s forecasts for 2015-2017. SCE refers to draft Habitat
Mitigation Plans, as available, to create the forecast.
SCE’s distribution forecast is based on 2012 recorded. SCE notes it
considers the work and costs stable, and does not anticipate changes.724
For transmission, ORA opposes most of SCE’s incremental estimate, and
instead proposes that SCE’s 2013 forecast be adopted for the test year. ORA
notes that this forecast is 111% more than SCE’s 2012 recorded and asserts that
SCE has not justified its requested increase relative to historic levels. ORA
recommends we require SCE to provide more recorded cost detail on projects in
the next GRC.725 For distribution, ORA does not contest SCE’s forecast.
724 SCE-7V3 at 9-17.725 ORA-9 at 44-47.
- 252 -

A.13-11-003 ALJ/KD1/ar9/jt2/lil PROPOSED DECISION (Rev. 12)
SCE responds that it would be unreasonable to rely solely on historical
data because costs are driven by the transmission projects that will be brought
into service and begin on-site mitigation. SCE considered historical costs for the
relevant activities, but also anticipated changes to the amount of work required.
SCE notes that ORA provided no analysis for selecting SCE’s 2013 forecast for
2015. SCE provides considerable details supporting its cost estimates related to
transmission projects as attachments to its rebuttal. Further, SCE notes that we
approved significant increases for these activities for PG&E, despite similar
arguments from ORA.726
We find SCE’s uncontested distribution forecast reasonable. For
transmission, we find that SCE has justified its requested increase based on a
credible analysis of work likely to be required due to new transmission projects.
SCE’s forecasts are reasonable and are adopted.
Health and Safety (Account 925)11.2.3.
Health and safety personnel provide expertise on industrial hygiene,
electrical safety, confined space, and safety culture and work with OUs to
implement standards. SCE shows improvement in injury rates 2008 to 2012.
Recorded costs are stable, except for a periodic (every three years) Safety Culture
Assessment, last done in 2011. Labor costs are based on 2012 recorded; non-labor
costs use a three-year (2010-2012) average. SCE notes that the Safety Culture
Assessment adds nearly $1 million to the base non-labor expense.727
ORA recommends a five-year recorded average for labor costs, noting
“slight fluctuations” and a 25.3% increase from 2008 to 2012. ORA accepts SCE’s
non-labor forecast.728
726 SCE-23 at 8-10727 SCE-7V3 at 18-22.728 ORA-18 at 17-18.
- 253 -

A.13-11-003 ALJ/KD1/ar9/jt2/lil PROPOSED DECISION (Rev. 12)
Citing D.04-07-022, SCE argues that ORA’s proposal is inconsistent with
our forecasting guidance. Further, SCE contends that cuts to safety labor would
be inconsistent with our focus on safety.729
We agree with SCE that labor expenses have been stable and therefore
SCE’s forecast based on 2012 recorded is appropriate. SCE’s non-labor forecast is
uncontested. SCE’s forecast for Health and Safety in Account 925 is reasonable
and is adopted.
Outside Consulting Services (Account 923)11.2.4.
SCE forecasts this account based on a five-year average, noting significant
annual variation. All expenses are non-labor.730 ORA recommends using 2012
recorded, citing a downward trend in the last three years and claiming that SCE
is not aware of specific projects that will require services.731 SCE responds that
this uncertainty is why the average is appropriate. SCE foresees cost increases
based on increasing regulatory emphasis on safety.732 SCE’s forecast follows our
guidance to use an average for accounts with high variability. SCE’s forecast is
reasonable and is adopted.
Marine Mitigation Projects11.2.5.
SONGS Marine Mitigation Projects are required by the Coastal
Development permit (CDP) for SONGS. The projects are intended to mitigate
impacts of SONGS operations on the marine environment. The projects include
four components: reef, wetland, fish return system, and a fish hatchery program.
The CDP requires these projects for “the full operating life of SONGS.” The reef
and wetland have not yet been accepted by the California Coast al Commission.
729 SCE-23 at 11-12.730 SCE-7V3 at 23-24.731 ORA-18 at 17.732 SCE-23 at 12-13.
- 254 -

A.13-11-003 ALJ/KD1/ar9/jt2/lil PROPOSED DECISION (Rev. 12)
SCE states that, although the projects are complete, additional capital is required
to maintain and improve the projects.
For the wetland, SCE began monitoring in 2012 and believes that some, but
not all, standards will be met in 2012. SCE’s forecast is based on its expectation
for specific work to be completed.
For the reef, CCC scientists have completed 2009-2012 performance
monitoring, indicating that seven of fourteen standards are met. SCE forecasts
expenditures for oversight and monitoring as well as further construction.733
SCE removed 2013 and 2014 capital expenditures from its application due
to approval of D.14-11-040.734
SDG&E owns a 20% interest in SONGS and is responsible for 20% of
SONGS costs, including marine mitigation. SDG&E requests a revenue
requirement consistent with 20% of the total marine mitigation costs approved
plus contractual overheads added by SCE and will file an Advice Letter to
implement this revenue requirement. SDG&E calculates its revenue requirement
including its own overheads, taxes, and rate of return.735
ORA recommends that these costs be expensed rather than capitalized and
that SCE attempt to amend the CDP to reflect a lesser environmental impact due
to SONGS’s retirement. Further, ORA recommends a 50/50 cost sharing
recommendation to incent SCE to pursue these changes. ORA contends that
SONGS is no longer used or useful and that circumstances have changed
significantly since D.96-04-059. ORA proposes an increase to SCE’s
environmental services forecast (Account 920/921, Section 11.2.1 above) to
733 SCE-7V3 at 25-30.734 SCE OB at 244 and SCE-73 at 20.735 SDGE-1 and SDGE-2.
- 255 -

A.13-11-003 ALJ/KD1/ar9/jt2/lil PROPOSED DECISION (Rev. 12)
implement its recommendation. Finally, ORA contends it is “unlikely” that SCE
will largely complete reef construction in 2015.736
SCE rejects ORA’s cost sharing proposal as baseless, noting that the
mitigation requirements predate the shutdown and are written to continue even
after SONGS is fully decommissioned. Further, SCE explains that it intends to
file an amendment request for the CDP during Fall 2014 seeking a change that
would potentially relieve SCE of an obligation to build additional reef. However,
the result of this request is uncertain. SCE argues that an “added incentive”
would not change its course of action. Finally, SCE argues that mitigation is a
proper cost of service and that cost sharing constitutes an unjustified penalty.
SCE does not oppose expensing mitigation costs, as long as the full costs
are included. SCE calculates a normalized O&M requirement of $7.867 million
for reef construction and $1.989 million (2012$) for wetlands restoration.
Finally, SCE contends that ORA is wrong in its view that SCE will not be
able to do major work on the reef in 2015 and presents an expected schedule.737
SDG&E expresses willingness to expense costs, but recommends that we
leave the determination of which costs to expense to SDG&E and SCE.738
TURN recommends that we deny cost recovery of these costs in GRC rates
for several reasons: CCC has not yet required the reef construction contemplated
in SCE’s forecast and TURN believes SCE should attempt to recover any costs
through the decommissioning trust.
TURN considers the mitigation costs here largely indistinguishable from
costs addressed in D.14-11-040. TURN argues that costs (other than reef
736 ORA-18.737 SCE-23 at 14-17.738 SDG&E OB at 8-9.
- 256 -

A.13-11-003 ALJ/KD1/ar9/jt2/lil PROPOSED DECISION (Rev. 12)
construction) are “completed CWIP” as defined by that decision, and
recommends that they be treated accordingly.
TURN recommends that we require SCE to file an application for reef
construction costs in the event that CCC actually institutes such a requirement.
Further, TURN submits that SCE’s cost estimates for reef construction rely on
prior estimates rather than recorded costs and an unsupported 4% escalation
rate.
TURN recommends seeking an IRS letter ruling on use of the
decommissioning trusts to fund marine mitigation, and argues that a prior letter
ruling did not address this subject.
Finally, TURN supports ORA’s proposal to expense any costs approved in
this proceeding. TURN notes that, other than reef construction, the forecast costs
all relate to supporting existing projects. Citing overspending on marine
mitigation relative to past authorizations, TURN argues that expensing these
costs creates a stronger disincentive to overspending.739
For reef construction, SCE claims that cost recovery through a separate
application would be inefficient and that its forecast for reef expansion is
reasonable. In response to TURN’s comments, SCE presents a revised forecast
incorporating TURN’s proposed escalation rates and recorded cost data.
SCE argues that applying the ratemaking approach of the settlement
adopted in D.14-11-040 to marine mitigation costs is inappropriate because that
settlement does not address this subject.
SCE considers TURN’s request for an IRS letter ruling to be an inefficient
use of resources, noting that the existing IRS letter specifically categorizes
739 TURN-1 at 14-24.
- 257 -

A.13-11-003 ALJ/KD1/ar9/jt2/lil PROPOSED DECISION (Rev. 12)
“environmental remediation for off-site locations” as nonqualified for trust
funding.740
SDG&E also opposes ORA’s and TURN’s recommendations to reduce
SCE’s forecast or delay consideration of reef construction costs. SDG&E supports
SCE’s views that mitigation costs are not eligible decommissioning costs and
should not be addressed similar to D.14-11-040.741
In its brief, TURN argues for a different interpretation of the IRS letter
ruling, emphasizing that the IRS gives deference to local commissions to
determine whether a cost is a decommissioning cost.
Further, TURN calculates a reef-maintenance (i.e., excluding construction)
O&M forecast of $1.278 million.
TURN also rejects SCE’s updated reef construction forecast, noting that it
includes line items for “monitoring” and “site selection,” for example, and is not
limited to construction costs.
Moreover, TURN rejects SCE’s schedule (showing reef completion in early
2016) as baseless and unrealistic in light of past experience.742
Rate recovery for costs up to 2014 have been resolved by D.14-11-040. We
agree with ORA and TURN that it is appropriate to shift 2015-2017 rate recovery
for marine mitigation to expense rather than capitalization. SCE does not oppose
this change, and SDG&E provides no adequate basis for its recommendation that
this important detail be left to the discretion of the utilities. Further, we agree
with SCE that D.14-11-040 does not address post-2014 mitigation costs, and we
are not constrained to categorize later costs according to that decision.
740 SCE-23 at 17-20.741 SDG&E OB at 10-14.742 TURN OB at 151-159.
- 258 -
A.13-11-003 ALJ/KD1/ar9/jt2/lil PROPOSED DECISION (Rev. 12)
We agree with SCE that compliance with the CDP is a required cost of
service. SCE has stated its intention to advocate for a decision from the CCC that
it believes will reduce ratepayer costs. We expect SCE to zealously represent
ratepayers’ interests in all matters of this kind. While we appreciate ORA’s
desire to align ratepayer and shareholder interests, the record does not identify
any clear additional or different action that SCE should take, even if given an
incentive to do so, in this instance.
We need not determine here whether or not marine mitigation costs are
eligible for reimbursement from the nuclear decommissioning trust. Instead, we
simply reiterate that the utilities are not permitted to recover any cost twice. If a
cost permitted for recovery here is also recovered from the decommissioning
trust (or any other source), SCE and SDG&E shall refund the revenue
requirement associated with that cost to ratepayers, with interest.
There is no remaining reason that ongoing costs for either the wetlands or
the reef (excluding reef construction) should not be permitted as an O&M
expense. We find TURN’s forecast for ongoing mitigation costs, $3.703743 million
(2012$), (=SCE’s wetlands forecast + TURN’s reef maintenance forecast),
reasonable and it is approved. Specifically, this amount is included in Section
11.2.1 above.
For reef construction, we agree with TURN that it is premature to approve
costs for a compliance-driven project that is not yet required. In the event that
CCC does require additional reef construction, or other measures, SCE and
SDG&E may file an application to recover costs at that time. In that application,
SCE should demonstrate that it has made a reasonable effort to represent
ratepayers’ interests in front of all applicable regulatory bodies and that its cost
743 Corrected to 2012$ per SDG&E’s Comments at 21.
- 259 -

A.13-11-003 ALJ/KD1/ar9/jt2/lil PROPOSED DECISION (Rev. 12)
forecast is reasonable. As decided above, SCE and SDG&E shall recover any
such costs as O&M expense, not capital expenditures.
SDG&E’s approach for developing its revenue requirement is reasonable,
but must be modified to apply to expense rather than capitalization. In its advice
letter implementing its revenue requirement, SDG&E shall use the method
approved for SONGS expense approved in recent rate case decisions.
Corporate Security and Business Resiliency11.3.(Accounts 920/921 and 923, andCapital Expenditures)
SCE cites four issues leading to increased O&M costs: improving security,
emergency preparedness, regulation (NERC CIP), upgrades to security
infrastructure. SCE also forecasts capital expenditures due to NERC CIP and
security improvements.744 ORA proposes a 28.6% reduction to SCE’s O&M
forecast for a variety of reasons, primarily insufficient justification for security
force upgrades. ORA also proposes reductions in capital including reductions
due to schedule changes in SCE’s implementation of NERC CIP and updating the
forecast for protection systems based on 2013 spending.745 In rebuttal, SCE states
that it “respectfully disagrees” with ORA’s proposals, but accepts them.746 We
find reasonable and adopt ORA’s uncontested forecast.
Financial, Legal, and Operational Services (FL&OS)12.
FL&OS consists of a variety of departments and functions. Our total
adopted O&M forecast is summarized below (millions of 2012$).
Department/Subject SCE Adopted
Financial Services $ 62.289 $ 54.870
Audit Services Department $ 8.658 $ 7.721
744 SCE-7V4.745 ORA-18 at 19-40.746 SCE-23 at 25-26.
- 260 -

A.13-11-003 ALJ/KD1/ar9/jt2/lil PROPOSED DECISION (Rev. 12)
Property and Liability Insurance $ 94.431 $ 89.308
Legal - Law Department $ 48.252 $ 45.254
Legal - Claims $ 23.282 $ 23.082
Legal - Workers' Compensation $ 21.207 $ 19.736
OS - Planning and Performance $ 7.339 $ 7.339
OS - Supplier Diversity and
Development $ 1.835 $ 1.835
OS - Corporate Real Estate $ 48.148 $ 47.172
FLOS, Total O&M $ 315.441 $ 296.317
Our capital forecast is summarized below (millions of nominal$).
Department/Subject SCE Adopted
2014 2015 2014 2015
Supply Management $ 1.058 $ 0.565 $ 1.058 $ 0.565
Transportation $ 6.179 $ 5.150 $ 6.179 $ 5.150
Corporate Real Estate $ 94.279 $ 112.090 $ 71.163 $ 80.383
Total $ 101.516 $ 117.805 $ 78.400 $ 86.098
Financial Services12.1.
SCE forecasts $64.762 million for Financial Services for 2015, which
includes (1) maintaining its accounting systems, (2) budgeting and financial
forecasting, (3) managing credit and liquidity needs; and (4) compliance with
federal and state tax codes. SCE’s test year forecast reflects a reduction of $18.003
million from 2012 recorded expenses. The decrease is primarily due to (1) the
implementation of organizational changes to improve operational and service
quality and (2) use of a five-year-average forecast methodology for Accounts
923/930. Our adopted forecast is summarized below (millions of 2012$).
Account SCE Adopted
920/921 27.248 27.248
923/930 35.041 27.622
Financial Services, Total 62.289 54.87
- 261 -

A.13-11-003 ALJ/KD1/ar9/jt2/lil PROPOSED DECISION (Rev. 12)
Accounts 920/92112.1.1.
SCE forecast $27.248 million for Financial Services relating to Accounts
920/921, for a reduction of $7.354 million from 2012 recorded expenses. The
reduction is primarily due to projected savings from SCE’s OpX program which
was implemented in 2011 to streamline and improve SCE business processes
relating to financial services. TURN does not dispute SCE’s forecast for Accounts
920/921.
As part of this program, SCE established Planning & Performance
Reporting (P&PR) in December 2012 to centralize finance activities to begin
realizing savings associated with centralization. SCE centralized its financial
services functions by transferring employees performing finance activities within
each operating unit into the Financial Services organization.
ORA recommends a reduction of $1.353 million from SCE’s forecast for
Accounts 920/921 to reflect additional savings from SCE’s OpX Program related
to the phrase “Add to fully staff.” As discussed in Section 25 below, we reject
ORA’s proposal to forecast higher OpX savings. No other issues in this area are
contested, and we find SCE’s forecast reasonable.
Accounts 923/93012.1.2.
SCE originally forecast 2015 expenses of $36.941 million in Financial
Services for Accounts 923/930, a reduction of $10.649 million from 2012 recorded
expenses. Use of a five-year forecasting methodology in Accounts 923/930
accounted for most of the reduction ($9.335 million).
ORA did not recommend an adjustment to SCE’s forecast for Accounts
923/930, other than a reduction of $33,000 for the allocated portion of savings for
the OpX “add to fully staff” issue addressed in Section 25 below.
- 262 -

A.13-11-003 ALJ/KD1/ar9/jt2/lil PROPOSED DECISION (Rev. 12)
TURN recommends three adjustments related to FERC Accounts 923/930:
(1) removal of 50% of Bain consulting costs from the five-year average on the
premise it is unlikely to recur (resulting in a $3.3 million TY reduction); (2) use of
a two-year average instead of a 5YA for Accounts Payable vendor discounts
(using data from 2012 and 2013); and (3) removal of $8.9 million in 2009 tax
consulting costs from the five-year average (resulting in a $1.9 million TY
reduction) on the premise this expense is non-recurring and was removed in
SCE’s 2012 GRC.
Bain Consulting Costs12.1.2.1.
SCE’s forecast reflects $7.9 million paid in 2011 to Bain & Co. for
management consulting to support its OpX initiative, plus $25 million paid in
2012. These amounts represent a large portion of the total costs of consulting
support by Bain & Co. for the OpX program. TURN removes 50% of these costs
from 2011 and 2012 for forecasting purposes, arguing that this type of extremely
expensive endeavor is unlikely to recur at a frequency of every five years and
unlikely to recur in the test year and attrition years. TURN’s adjustment reduces
the forecast for Accounts 923/930 by $3.311 million.
SCE opposes TURN’s reduction, claiming that this expense is ongoing and
likely to recur, and has appeared in the past two rate case cycles. SCE argues that
its OpX initiative is focused on producing customer benefits, so that customers
should thus fund the reasonable cost of this effort. SCE argues that TURN’s
proposed reduction would not provide sufficient resources to continue OpX
work.
We adopt TURN’s recommendation to exclude 50% of the Bain consulting
costs from the 2015 forecast. We find conflicting information in the record
concerning SCE’s plans for funding Bain consulting costs through 2015 and
- 263 -

A.13-11-003 ALJ/KD1/ar9/jt2/lil PROPOSED DECISION (Rev. 12)
beyond. On the one hand, SCE argues that OpX efforts are continuing, and that
consultant services will thus likely be needed again (particularly because the staff
reductions have resulted in an increased need for outside services). Yet, SCE
previously indicated in a data response to TURN that the OpX Initiative
concluded in the April 2013 timeframe.747 SCE also stated in a data response that:
“[a]t this time, no additional headcount reductions and associated savings or
severance forecasts are planned for 2016 and/or 2017 in IT,” and similarly for
Customer Service, that “[n]o additional Operational Excellence savings are
forecast for 2016 and 2017. All Operational Excellence savings are embedded in
the forecast for 2016 and 2017.”748
We conclude that it is inconsistent for SCE to forecast continuing
consulting costs for OpX but not to credit ratepayers with additional savings that
will result. We conclude that TURN’s proposed adjustment provides a
reasonable way to reconcile these conflicts, providing SCE with some degree of
continuing consultant funding, but with corresponding recognition of cost
savings credited to customers. Adopting TURN’s adjustment to Account
923/930 to remove 50% of Bain consulting costs incurred in 2011 and 2012
reduces the forecast for Accounts 923/930 by $3.311 million.
Accounts Payable Vendor Discounts12.1.2.2.
SCE’s forecast for Financial Services -- Accounts 923/930 includes a credit
of $1.118 million for Accounts Payable Vendor Discounts, based on the 5YA of
such discounts (or credits).
747 Ex. TURN-60 (Financial Services Cross Exhibits), SCE Response to TURN-SCE-018, Q1.a.748 � Ex. TURN-60 (Financial Services Cross Exhibits), SCE Response to TURN-SCE-004, Q5.f
and Q6.e.
- 264 -

A.13-11-003 ALJ/KD1/ar9/jt2/lil PROPOSED DECISION (Rev. 12)
TURN recommends that vendor discounts be removed from the 5YA and
forecast with a methodology that TURN believes more accurately captures their
magnitude. TURN recommends the use of the 2012-2013 2YA for vendor
discounts, $5.227 million, which reduces SCE’s forecast by $4.108 million.
TURN argues that its proposed adjustment corrects for the effects of
overstatement that results from SCE’s use of five years of data in developing its
forecast of vendor discounts. SCE changed its accounting of these vendor
discounts in 2011. SCE had treated these discounts as a revenue item through
2010. Beginning with an accounting change retroactive to January 2011, SCE now
treats them as an expense offset. SCE’s 5YA thus includes three years with $0
values for vendor discounts, even though vendor discounts existed during those
years, because they were accounted for elsewhere in a revenue account as Other
Non-Electric Income. SCE’s 5YA thus includes only two years of vendor
discounts, $2.183 million in 2011 and $3.409 million in 2012, and incorrectly
deflates their value in the test year forecast.749
SCE opposes TURN’s adjustment to reduce the forecast, and to use a
two-year average (reliant on unadjusted 2013 data) for Accounts Payable Vendor
Discount. SCE claims that use of recorded, unadjusted 2013 costs to forecast
Accounts Payable Vendor credits conflicts with the Rate Case Plan and that
unadjusted data is inherently unreliable. As with many of the instances where
TURN proposes the use of 2013 data in forecasting 2015 test year expense, TURN
believes that 2013 data on vendor discounts is more reflective of current
conditions, since that year captures benefits of OpX not otherwise credited to
ratepayers in SCE’s approach.
749 TURN-5 at 67.
- 265 -

A.13-11-003 ALJ/KD1/ar9/jt2/lil PROPOSED DECISION (Rev. 12)
SCE claims that use of 2008-2012 historical average for FERC Accounts
923/930 follows the rate case plan, appropriately relies only on adjusted data,
and already results in a significant reduction of $9.335 million. SCE claims it is
inconsistent to apply a different forecasting method to one Final Cost Center
among many in the same FERC Account simply to lower the forecast, as TURN
proposes.
We accept TURN’s adjustment to vendor discounts, and conclude that
TURN’s treatment reflects a consistent approach to analyzing this account.
TURN isolated vendor discounts for different treatment because it was the only
Final Cost Center for which a 5YA would produce incomplete and inaccurate
results. SCE had treated these discounts as a revenue item through 2010,
beginning with an accounting change retroactive to January 2011, SCE now treats
them as an expense offset. As a result, SCE’s 5YA includes three years with $0
values for vendor discounts, even though vendor discounts existed during those
years, because they were accounted for elsewhere in a revenue account as Other
Non-Electric Income. SCE’s 5YA thus includes only two years of vendor
discounts, $2.183 million in 2011 and $3.409 million in 2012, and deflates their
value in the test year forecast. For this reason, we conclude that in order to
produce a more accurate forecast, vendor discounts should be removed from the
5YA and forecast with TURN’s methodology.
We conclude that 2013 data on vendor discounts is more reflective of
current conditions, since such data captures benefits of OpX not otherwise
credited to ratepayers in SCE’s approach. We find no reason to ignore 2013 data
based on SCE’s claim that such data is “unadjusted.” In SCE’s last GRC
(D.12-11-051), we made use of 2010 recorded data even though the Rate Case
- 266 -

A.13-11-003 ALJ/KD1/ar9/jt2/lil PROPOSED DECISION (Rev. 12)
Plan was based on use of recorded data only through 2009. As stated in
D.12-11-051:
[W]e adopt 2010 unadjusted, recorded capital expenditures for allbusiness units where these recorded costs were made availableduring the course of the proceeding. According to the Rate CasePlan, SCE is required to prepare its application based on 2009, not2010, recorded expenses. However, there is nothing in the RateCase Plan which limits discovery of 2010 actual recordedexpenditures and the Commission finds them informative.750
TURN’s approach to forecasting Accounts Payable Vendor Discounts
increases these credits by $4.108 million and correspondingly reduces the forecast
for Accounts 923/930 by the same amount relative to SCE’s request.
Removal of Tax Consultant Costs12.1.2.3.
SCE accepted TURN’s third recommended adjustment (the removal of $8.9
million of tax consultant costs from 2009 recorded costs).751 We accordingly
adopt TURN’s third recommended adjustment for removal of $8.9 million in 2009
tax consulting costs from the five-year average (resulting in a $1.9 million TY
reduction) on the premise this expense is non-recurring and was removed in
SCE’s 2012 GRC.
Audit Services Department (ASD)12.2.
SCE’s forecast for FERC Accounts 920/921 for ASD is $8.658 million, a net
reduction of $319,000 from 2012 recorded expenses. The reduction reflects the
absence of future audit work for the former EIX subsidiary Edison Mission
Energy (EME), partially offset by anticipated additional work in Sarbanes-Oxley
Act manual key-control testing.
750 D.12-11-051 at 13. 751 SCE OB at 250.
- 267 -
A.13-11-003 ALJ/KD1/ar9/jt2/lil PROPOSED DECISION (Rev. 12)
ORA proposes a $7.693 million 2015 TY forecast, or $965,061 below SCE’s
proposal. The proposed reduction reflects ORA’s forecast of additional OpX
savings (related to the “add to fully staff” issue discussed in Section 25). TURN’s
forecast for Audit Services – Accounts 920/921 is $7.721 million, a reduction of
$937,000 to SCE’s request. (TURN’s adjustment is independent of the ORA
adjustment for OpX.)
TURN argues that the historical years used by SCE (2008-2012 for
non-labor and 2012 for labor) are out of sync with the post-EME workload for
affiliates, and that SCE did not sufficiently reduce ASD’s workload to reflect the
work formerly performed for EME. Based on 2013 recorded costs, TURN argues
that SCE’s 2015 forecast should be reduced further to more accurately reflect the
work of Audit Services now that SCE no longer owns EME.
To better capture the impacts of EME’s bankruptcy on Audit Services,
TURN modifies SCE’s forecasting methodology to: (a) separately forecast
utility-only costs (net of non-utility affiliate credits) and non-utility affiliate
credits, using the 6YA for the former and 2013 recorded affiliate credits for the
latter; (b) use a historical average to forecast both labor and non-labor costs,
whereas SCE uses 2012 recorded costs for labor; and (c) use a 2008-2013 6YA
instead of SCE’s 5YA.
In evaluating SCE’s assumptions about the reduction in affiliate audit costs
in the absence of EME, TURN looked at 2013 recorded non-utility affiliate credits
and discovered two interrelated things.
SCE’s non-utility affiliate credits for Audit Services dropped precipitously
in 2013. Such credits ranged in 2008-2012 from a low of $2.2 million (2012) to a
high of $2.7 million (2009). Yet, non-utility affiliate credits in 2013 were only
$96,000 (in 2012$). Non-utility affiliate credits for Audit Services in the first
- 268 -

A.13-11-003 ALJ/KD1/ar9/jt2/lil PROPOSED DECISION (Rev. 12)
quarter of 2014 were on pace to be even lower than in 2013. This reduction of
approximately $2.1 million from the lowest year, 2012, was much greater than
that anticipated by SCE for affiliate audit costs in 2013 of $743,000, as well as in
2015 of $960,000. Based on these figures, TURN argues that non-utility affiliate
credits should be forecast at 2013 levels.
TURN also forecasts Audit Services costs other than non-utility affiliate
credits using a 2008-2013 6YA, as opposed to SCE’s approach. Excluding affiliate
credits, these costs have fluctuated within a $600,000 range from 2008-2011 and in
2013 (varying from $7.975 million to $7.363 million), though costs were lower in
2012.
TURN includes 2013 recorded costs in this average because these costs
reflect the changing volume of work of Audit Services. Audit Services
utility-only costs increased by about $1 million in 2013 over 2012 levels.
According to SCE, Audit Services was to absorb additional work related to
Sarbanes-Oxley Act manual key-control testing beginning in 2013, due to the
centralization of some processes. Likewise, 2013 recorded costs capture the cost
impacts from the EME bankruptcy (other than less affiliate audit work)
highlighted by SCE in its rebuttal testimony, such as the loss of cost-sharing with
EME for Audit Services functions that are not eliminated.
SCE claims that TURN’s approach assumes that ASD can eliminate costs
on a dollar-for-dollar basis based on previous EME affiliate credits (which
included fixed costs, a labor mark-up, and allocations for corporate support
functions). SCE now bears the entire cost of the ASD, rather than sharing it with
EME. For instance, SCE claims that the size of ASD declined, but SCE now pays
the entire cost of the General Auditor.
- 269 -
A.13-11-003 ALJ/KD1/ar9/jt2/lil PROPOSED DECISION (Rev. 12)
We find that TURN’s forecast of ASD expenses, $7.721 million in Accounts
920/921, is reasonable. Recorded data from 2013 and early 2014 suggest
significant declines in affiliate credits following the EME bankruptcy. TURN’s
approach of forecasting ASD expenses based solely on utility-only costs is a
reasonable approach to forecast costs in light of the bankruptcy.
Property and Liability Insurance (Accounts 924 and 925)12.3.
SCE’s 2015 TY forecast for property and liability insurance is $94.431
million (reflecting removal of SONGS and Four Corners costs). The property
insurance forecast in FERC Account 924 is $18.973 million and the liability
insurance forecast in FERC Account 925 is $75.458 million.752 TURN did not
comment on SCE’s insurance forecast.
ORA does not dispute SCE’s forecast for Account 924. For Account 925,
however, ORA recommends removal of $4.990 million, arguing that SCE has not
removed all SONGS and Four Corners costs. ORA states that the $4.98 million
was for SONGS when it was operational. ORA argues that SCE’s removal of
$4.990 million, only to re-allocate it to Corporate so that SCE can still collect it
from ratepayers is not what the Scoping Memo ordered.753
SCE responds that its calculation of the SONGS portion of excess liability
insurance expense was updated to incorporate the correct headcount reflecting
SONGS in a shut-down state and the change in the participants’ share of the cost.
SCE claims it removed the entire portion of SONGS and Four Corners insurance
costs.754
SCE’s uncontested forecast of property insurance in Account 924 of $18.973
million is reasonable and is approved. ORA’s recommendation to reduce the
752 SCE-24V1P2 at 1.753 ORA-19 at 37-39.754 SCE-24V1P2 at 1-4.
- 270 -
A.13-11-003 ALJ/KD1/ar9/jt2/lil PROPOSED DECISION (Rev. 12)
liability insurance forecast in Account 925 to $70.335 million is reasonable for two
reasons. First, there is no dispute that the difference is a SONGS cost. Second,
SCE’s testimony on the subject is inconsistent. SCE states that the total premium
forecast has not changed, but that the allocation of the premium among SCE’s
business units is related to the number of employees. SCE has not explained why
the total premium forecast did not decline along with the number of total
employees.
Legal12.4.
SCE forecasts $92.741 million for the Legal Operating Unit, consisting of
$48.252 million for the Law Department including Corporate Governance,
$23.282 million for the Claims Department, and $21.207 million for the Workers’
Compensation Department.
Law Department12.4.1.
SCE forecasts $48.252 million for the Law Department: Law’s FERC
Accounts 920/921/923/925/928 and Corporate Governance’s FERC Account 930.
ORA recommends a reduction of $2.698 million. TURN recommends a reduction
of $1.999 million. Our adopted forecast is summarized below (millions of 2012$).
Account Activity SCE Adopted
920/921 In-House Total $ 30.539 $ 30.539
Labor $ 25.245 $ 25.245
Non-Labor $ 5.294 $ 5.294
923/925/928 Outside Counsel Total $ 14.503 $ 12.503
Labor $ - $ -
Non-Labor $ 14.503 $ 12.503
930 Corporate Governance Total $ 3.210 $ 2.212
Labor $ 0.014 $ 0.014
Non-Labor $ 3.196 $ 2.198
Law Department, Total Total $ 48.252 $ 45.254
- 271 -

A.13-11-003 ALJ/KD1/ar9/jt2/lil PROPOSED DECISION (Rev. 12)
Labor $ 25.259 $ 25.259
Non-Labor $ 22.993 $ 19.995
FERC Accounts 920/921: In-House12.4.1.1.
SCE’s forecast for Accounts 920 and 921 for in-house costs is $30.539
million, $1.457 million below 2012 recorded.755 ORA recommends that SCE’s
In-House forecast be reduced by $98,000 to reflect SONGS’ share of the Financial
Services centralization savings.756 We reject ORA’s argument as discussed in
Section 25 below. SCE’s forecast for Accounts 920 and 921 for in-house costs of
$30.539 million is reasonable and is approved.
FERC Accounts 923/925/928: Outside12.4.1.2.Counsel
SCE’s forecast for Accounts 923, 925, and 928 is $14.503 million for outside
counsel expenses, based on recorded costs from 2012.
Three areas of controversy exist regarding outside counsel costs: (1) ORA
proposes that SCE’s incentive payments be removed from its forecast; (2) ORA
removes expenses related to the Grass Valley Fire; and (3) TURN proposes to
utilize years 2008, 2009, and 2012 for averaging instead of SCE’s proposal of 2012
recorded costs. Of these three proposed adjustments, we adopt two: (1) and (3).
We note that the sum of these two adjustments individually is $2.538 million.
However, the record before us does not clearly demonstrate the impact of these
two adjustments in combination, which is likely less than the sum of the two
parts due to interactive effects. Therefore, we estimate an adjustment of $2
million and adopt a forecast of $12.503 million for outside counsel.
755 SCE-24V2 at 3.756 ORA-19 at 3, 17-18.
- 272 -

A.13-11-003 ALJ/KD1/ar9/jt2/lil PROPOSED DECISION (Rev. 12)
Outside Counsel Incentive Payments12.4.1.2.1.
SCE’s forecast for Account 923 includes incentive payments provided to
seven strategic law firms. ORA recommends removing the incentive payments
from SCE’s 2015 forecast in the amount of $1.538 million. Under SCE’s incentive
program, SCE’s strategic law firms can earn discretionary payments when
providing exceptional legal work beyond the high level of work already
expected, being efficient in such work, adhering to budgets, and/or providing
diverse legal teams. SCE argues that such incentives encourage outside counsel
to provide an exceptionally high level of services benefiting both SCE and its
customers. The Commission recognized such benefit when it stated “[i]t may be
reasonable to provide incentives to outside counsel to motivate them to achieve
good results.” Therefore, SCE argues that the incentive payments are properly
included in SCE’s outside counsel forecast.
D.12-11-051 stated that:
It may be reasonable to provide incentives to outside counsel tomotivate them to achieve good results. Combined with reducedfees, it may result in lower costs and revenue requirement.Therefore, we find that these are ordinary recoverable businesscosts. However, to receive recovery in future GRCs, SCE shallprovide information to support that it is obtaining base fees atdiscount compared to market.757
ORA claims the only support SCE provided in its testimony in this GRC is
a chart that compares “Real Rate Report to Edison,”758 but has not provided
verifiable information that, with these discretionary bonuses, SCE is obtaining
base fees at a discount. ORA thus opposes SCE’s request for ratepayers to fund
them in TY 2015. ORA removed discretionary bonuses from the 2008-2012
757 D.12-11-051 at 490-491.758 Ex. SCE-08, Vol.2 at 16, Figure II-4.
- 273 -
A.13-11-003 ALJ/KD1/ar9/jt2/lil PROPOSED DECISION (Rev. 12)
recorded adjusted costs before forecasting for TY 2015. ORA forecasts $12.973
million for Outside Services for TY 2015.
SCE disputes ORA’s claim that SCE provided no support that it is
obtaining base fees at discount compared to the market. SCE cites to a copy of a
confidential report that SCE provided to TURN.759
SCE claims it provided ORA with supporting documentation detailing
how outside counsel rates paid by SCE are lower on average than the market.
ORA claims, however, that SCE refused to disclose partner and associate rates
and contracted fees for 2008 -2013, and that the information was provided about
SCE’s bonus payment determinations is hardly an objective process. ORA
expresses doubt that SCE is actually obtaining base fees at discount compared to
market. ORA claims that SCE’s request to make its ratepayers pay for unjustified
discretionary bonuses should be denied.
We adopt ORA’s proposed reduction. As we stated in D.12-11-051, it may
be reasonable to provide incentives to outside counsel to motivate them to
achieve good results. We conclude, however, that SCE has not met its burden of
proof as called for in D.12-11-051, to support that it is obtaining base fees at
discount compared to market.
Grass Valley Fire Outside Counsel Costs12.4.1.2.2.
SCE’s forecast includes outside counsel costs in defending itself in
litigation arising from a fire that occurred in Grass Valley. ORA argues that such
costs should be removed from the forecast. ORA makes a similar claim related to
the forecast of claims discussed in Section12.4.2.2 below. ORA’s basis for seeking
removal is that a civil party litigant made an allegation of SCE wrongdoing.
759 SCE-24V2 at 6-7.
- 274 -

A.13-11-003 ALJ/KD1/ar9/jt2/lil PROPOSED DECISION (Rev. 12)
ORA admits, however, that the civil case settled and SCE was not found
liable of wrongdoing, nor did SCE admit any fault when settling. SCE claims
there is no legal basis to remove the Grass Valley Fire costs from forecasting. The
Grass Valley Fire litigation was a typical fire-related action filed against SCE. As
with most fire-related actions, negligence and inverse condemnation was pled.
Under California law, a successful inverse condemnation claim results in a party
paying for property damage and the costs are to be socialized via rates. SCE
argues that ORA has presented no reason why the Grass Valley Fire should be
treated any differently.
SCE argues that the Grass Valley Fire costs should not be removed from
forecasts as there has been no judicial finding of SCE fault in the Grass Valley
Fire. Since practically all litigants allege wrongdoing in civil lawsuits, SCE
argues that an allegation alone cannot be a basis for cost removal.760
We find that SCE’s proposal to include these costs is reasonable. Absent a
finding of error or fault, it is reasonable to include costs related to litigation
resulting from fires. As we noted previously, however, in the event SCE is later
found to be in error or fault, the Commission may take appropriate action to
restore these funds to the ratepayers.761
TURN’s Forecasting Methodology12.4.1.2.3.
To forecast outside counsel costs, SCE used 2012 recorded expenses. SCE
defends use of this method given the downward trend in such costs from
2010-2012. TURN recommends funding outside counsel expenses at a level of
$13.503 million, for a reduction of $1.000 million to SCE’s forecast. TURN
proposes a forecasting based on the average of the 2008, 2009 and 2012 recorded
figures, and removal of the 2010 and 2011 figures from the average. TURN
760 SCE-24V2 at 7-8, 18-21.761 See D.12-11-051 at 498.
- 275 -

A.13-11-003 ALJ/KD1/ar9/jt2/lil PROPOSED DECISION (Rev. 12)
claims that SCE failed to adequately explain the high levels recorded in those
years or to demonstrate their reasonableness.
TURN labeled the amounts for 2010 and 2011 as “outliers,” since each year
was 22-31% higher than the next highest recorded figure during 2008-2012. The
Commission has previously removed outlier or anomalous years from averages
of recorded data or made similar adjustments to develop a reasonable forecast.
SCE claims that TURN’s proposal is arbitrary, and that the Commission
has directed what methodologies should be utilized given historical data and
SCE’s forecast is based on such direction. SCE argues that simply averaging
“good” years is not proper.
We accept TURN’s adjustment as appropriate, and conclude that 2010 and
2011 data are not reliable as a basis to develop test year forecasts. We do not
consider it “arbitrary” to exclude cost data from the development of the test year
forecast if such exclusion produces a more reliable forecast. The burden is on
SCE to establish the reasonableness of including the 2010 and 2011 costs for
forecast purposes. We conclude that SCE failed to meet that burden. The
recorded figures for the 2010-11 period reflect largely unexplained and
unjustified increases as compared to the 2008-09 period. SCE has not explained
why the costs were so much higher in 2010 and 2011, nor demonstrated that the
higher costs are likely to recur going forward. Absent an adequate explanation
from SCE, we exclude those years from the basis for the test year forecast, and
reduce SCE’s forecast by $1.000 million, as proposed by TURN.
FERC Account 930: Corporate12.4.1.3.Governance
SCE’s 2015 forecast for Corporate Governance Account 930 is $3.210
million.
- 276 -

A.13-11-003 ALJ/KD1/ar9/jt2/lil PROPOSED DECISION (Rev. 12)
ORA and TURN recommend that $998,095 be subtracted from SCE’s 2015
forecast to disallow recovery of SCE’s Board of Directors’ (“Board”)
supplemental benefits and stock-based compensation. ORA claims that the
Board does not benefit customers. TURN contends that SCE did not prove the
reasonableness of the costs.
SCE claims that an analysis completed by an independent consultant,
Frederick W. Cook & Co., proves that both the Board’s total compensation and
equity compensation are reasonable. The Commission previously held “that as
long as total compensation levels are appropriate, we will not dictate how … [a
utility] distributes compensation among various types of employment benefits.”
SCE has also put forth evidence demonstrating that the Board benefits the
customers by reviewing proposals and reports on major capital projects, thereby
increasing the safety and reliability of SCE’s facilities and by ensuring that SCE’s
operations are cost-efficient. Given that California law requires that corporations
have board of directors, SCE argues that all of its Board compensation and
benefits should be recovered as normal costs of doing business.
ORA argues that SCE offers no proof to support the claim that this
compensation is necessary to attract and retain highly skilled and qualified Board
members which ultimately benefits ratepayers. ORA claims there is lack of proof
connecting such costs to SCE’s ability to “obtain experienced outside directors.”
ORA characterizes SCE’s arguments about how experienced Board Members
“ultimately benefits ratepayers” as “unsubstantiated trickle-down economic
theory with no basis in fact.”
TURN also opposes rate recovery of these expenses. In addition to
arguments raised by ORA, TURN claims SCE’s request is almost entirely a
rehash of the request made (and rejected) in the 2012 GRC. TURN claims that
- 277 -

A.13-11-003 ALJ/KD1/ar9/jt2/lil PROPOSED DECISION (Rev. 12)
SCE failed to demonstrate the reasonableness of the requested amount, given the
cost forecast increases of 24% for per-director compensation and 50% for stock
options as compared to the 2012 GRC request.
We adopt the proposal of ORA and TURN to disallow SCE’s Board
supplemental benefits and stock-based compensation, and thus subtract $998,095
from SCE’s 2015 test year forecast.
SCE did not substantiate its claim that the Board’s review of SCE’s
activities promotes cost efficiency that serves ratepayer interests. As indicated by
SCE’s Corporate Governance Guidelines, the primary functions of the Board
include representing the interests of shareholders, and acting in the interests of
shareholders whenever there are conflicting interests among shareholders,
customers, and the general public.762
Where a utility requests the same relief that was denied in a previous GRC,
the utility must explain what has changed to warrant a different outcome in the
present case. Significant portions of SCE’s direct testimony in this 2015 GRC are
similar to corresponding 2012 GRC testimony.763 As previously indicated in
SCE’s 2012 GRC, whether an expense is part of SCE’s business model is a
separate question from whether the costs are necessary for the delivery of electric
service.764 We find SCE’s claims unpersuasive that the Board’s review of SCE’s
activities and purported benefits necessarily warrants ratepayer funding. Under
these circumstances, we reach the same conclusion on this topic that previously
reached in SCE’s 2012 GRC, and deny SCE’s funding request.
762 TURN-59 (SCE Corporate Governance Guidelines), pp. 1 and Exhibit A-2, p. 1; Swartz, SCE, 11, RT 1133, l. 27 to 1134, l. 13.
763 Compare SCE-8V2 at 20-23 with the testimony in TURN-58 (Excerpt of 2012 GRC testimony).
764 D.12-11-051 at 494.
- 278 -

A.13-11-003 ALJ/KD1/ar9/jt2/lil PROPOSED DECISION (Rev. 12)
Claims12.4.2.
The Claims Department administers many claims each year, including
claims on behalf of SCE and against SCE. Our adopted forecast is summarized
below (millions of 2012$).
Account Activity SCE Adopted
920/921/ 924 Administrative and
General
Total $ 3.858 $ 3.658
Labor $ 3.057 $ 3.057
Non-Labor $ 0.801 $ 0.601
925 Reserves Total $ 19.424 $ 19.424
Labor $ - $ -
Non-Labor $ 19.424 $ 19.424
Claims Department Total $ 23.282 $ 23.082
Labor $ 3.057 $ 3.057
Non-Labor $ 20.225 $ 20.025
FERC Account 920/921/924: Claims12.4.2.1.Administrative and General
SCE’s 2015 forecast for Claims FERC Accounts 920/921/924 is $3.858
million. ORA does not dispute SCE’s forecast.
SCE includes $400,000 of lease costs for a 44,000 square foot indoor storage
facility to properly retain and safeguard evidence related to investigations, per
the Commission’s own rules and SED’s interpretation of such rules. TURN
disputes such costs. TURN claims that SCE failed to demonstrate that it needs
the storage facility.
SCE claims it urgently needs a proper indoor storage facility, and that its
current facilities are inadequate and filled to capacity. SCE explains that it plans
to build an SCE-owned storage facility in 2017 to meet this need; the lease
requested now is temporary.765
765 SCE-24V2 at 15-17.
- 279 -

A.13-11-003 ALJ/KD1/ar9/jt2/lil PROPOSED DECISION (Rev. 12)
We partially approve SCE’s request for funding for an indoor storage
facility. We are not persuaded that SCE has fully justified the reasonableness of
obtaining a large central indoor repository for storage of failed utility equipment,
rather than continuing its current practice of storing that equipment at various
SCE sites and, as needed, at leased locations on an ad hoc basis. The incremental
cost of such a leased outdoor space appears to be on the order of $3,000 per
month, and SCE is leasing “a couple” at this time.766 TURN asserts that
ratepayers would be better off were SCE to incur incremental costs of $9,000 per
month (for three such outdoor facilities). The total cost would be approximately
$108,000 per year, rather than the $400,000 annual expense SCE seeks for the
lease of the indoor facility.767
We deny $200,000 of SCE’s request. It is reasonably necessary for SCE to
have access to secure space to store evidence. This amount of funding will cover
the costs for a greater number of outdoor sites, a smaller indoor facility, or some
combination of the two. While we support the prioritization of retaining
evidence for important investigations, we encourage SED to work with SCE to
ensure that only relevant evidence is retained and allowing other items to be
discarded, reused, etc.
FERC Account 925: Claims Reserves12.4.2.2.
SCE forecasts $19.424 million for FERC Account 925, Claims Reserves.
SCE’s forecast is based on a 5YA of historical costs due to the significant cost
fluctuations from year-to-year, and the unpredictable nature of Claims Reserve
costs.
766 Ramos, SCE, 11 RT at 1169, l. 29 to 1170, l. 8.767 TURN OB at 177-179.
- 280 -

A.13-11-003 ALJ/KD1/ar9/jt2/lil PROPOSED DECISION (Rev. 12)
ORA recommends that $976,000 paid towards settlement of the Grass
Valley Fire be removed from Claims Reserves for forecasting purposes (see
Section 12.4.1.2.2. above.768
TURN’s forecast is $16.727 million, a reduction of $2.697 million from
SCE’s request.
TURN derived its forecast by removing recorded costs for 2009 and using a
four-year average, claiming that the 2009 figure is an outlier compared to
amounts during 2008-12. TURN also added back to the recorded figure for 2011
the $7.5 million offset that occurred that year due to a one-time credit from the
Mohave-related settlement. The average of these amounts for 2008 and
2010-2012 is $16.727 million. In the alternative, TURN recommends that 2012
costs be utilized for forecasting, which would yield a forecast of $17.631 million.
TURN claims that use of the recorded 2012 amount is consistent with SCE’s
approach to forecasting outside counsel expenses when the recorded amounts in
2008-2012 showed a similar pattern over that period. This alternative would
reduce SCE’s forecast by $1.793 million. TURN also raises a policy question
related to ORA’s proposal to exclude Grass Valley costs.769
SCE claims that both of TURN’s proposals defy this Commission’s
forecasting methodology directives. SCE claims that removing all of 2009 costs
from averaging is “cherry-picking” that should not be allowed. SCE argues that
because claims reserves are highly unpredictable with large variations year to
year, averaging is appropriate. SCE claims that this Commission has indicated
that the appropriate forecast methodology for accounts with significant
768 ORA-19, ORA-26.769 TURN OB at 173-177.
- 281 -

A.13-11-003 ALJ/KD1/ar9/jt2/lil PROPOSED DECISION (Rev. 12)
fluctuations and those influenced by unpredictable external factors is
averaging--not the last recorded year.770
The Commission has previously removed or otherwise adjusted outlier
years in the development of a forecast based on averaging of recorded years’
data. TURN is not arguing that any and all outlier years should be removed from
averages. TURN asserts that SCE could have presented testimony explaining the
underlying circumstances that caused the recorded figure in the outlier year to be
as high as it was and, in doing so, potentially demonstrate that it was reasonably
included in the recorded data relied upon to develop the test year forecast.771
We reject both TURN and ORA’s arguments and approve SCE’s forecast.
A 5YA forecast is a reasonable approach to forecasting accounts with high
variation in recorded costs. SCE’s forecast of $19.424 million for Account 925,
Claims Reserves is reasonable.
Workers’ Compensation (Account 925)12.4.3.
SCE forecasts $21.2 million for FERC Account 925, consisting of $7.0
million for Workers’ Compensation staff expenses and $14.2 million for Workers’
Compensation Reserves. ORA does not dispute SCE’s $21.2 million forecast;
TURN opposes the reserves portion. The staff portion of Workers’
Compensation is undisputed and we find it reasonable. Our total adopted
forecast is summarized below (millions of 2012$).
770 SCE OB at 256-257.771 TURN OB.
- 282 -

A.13-11-003 ALJ/KD1/ar9/jt2/lil PROPOSED DECISION (Rev. 12)
Account Activity SCE Adopted
925 Staff Total $ 7.029 $ 7.029
Labor $ 3.833 $ 3.833
Non-Labor $ 3.196 $ 3.196
925 Reserves Total $ 14.178 $ 12.707
Labor $ - $ -
Non-Labor $ 14.178 $ 12.707
Workers' Compensation Total $ 21.207 $ 19.736
Labor $ 3.833 $ 3.833
Non-Labor $ 17.374 $ 15.903
SCE’s Reserve forecast is based on a 5YA due to cost fluctuations and the
unpredictable nature of reserves. TURN agrees with SCE that a historical
average is appropriate but recommends the exclusion of 2008 and inclusion of
2013. TURN’s forecast, based on the 2009-2013 5YA, is $12.707 million, which is
$1.471 million less than SCE’s forecast.772
We adopt TURN’s reduction of $1.471 million, based on use of a 2009-2013
5YA. SCE’s costs dropped precipitously after 2008 and have remained lower. In
SCE’s 2012 GRC, the Commission recognized that 2008 costs were out of line
with the subsequent years and rejected SCE’s theory that the outcome of pending
workers’ compensation litigation might reverse the downward trend in reserve
expenses, finding this potential “too speculative” to justify the inclusion of
2007-2008 in the forecast.773 We authorized a forecast of $14.77 million for 2012,
more than enough to meet SCE’s actual reserve expenses of $13.624 million.
SCE claims that 2008-2012 recorded data is a complete and accurate data
set to use for forecasting. SCE claims it is inappropriate to ignore a certain year
because of higher costs that year and utilize an incorrect and unadjusted year
simply to arrive at a lower number. SCE argues that 2013 data has not been
772 SCE-OB at 257.773 D.12-11-051 at 501.
- 283 -

A.13-11-003 ALJ/KD1/ar9/jt2/lil PROPOSED DECISION (Rev. 12)
adjusted, is inappropriate for rate-making purposes, and does not adjust for a
$2.7 million insurance recovery (associated with insurance recovery for “the
Rivergrade and burn incidents”), which would result in a 2013 amount of $9.687
million instead of TURN’s initial $6.987 million. SCE argues that the preliminary
adjustment of $2.7 million may not be the only adjustment to 2013 recorded costs,
and until all adjustments are accounted for, 2013 numbers should not be included
in the forecast.774
TURN however accepts this 2013 adjustment in errata.775 TURN notes that
SCE’s adjustments to workers’ compensation reserve expenses have been small
as a percentage of total recorded costs (less than 0.5%) in each year from
2008-2012, with the exception of 2012. Based on the magnitude of SCE’s
adjustments to data since 2008 – with the exception of those for the Rivergrade
and burn incidents – it is reasonable to expect that SCE might find other small
adjustments to 2013 recorded costs that could increase or decrease costs by 0.5%
or so, or about $50,000.
Given these considerations, we find it reasonable to include 2013 recorded
costs in the average to forecast SCE’s 2015 reserve expenses. We note that this
includes both the 2012 and 2013 for the Rivergrade and burn incidents.
Operational Services12.5.
Operational Services (OS) is comprised of four departments: CRE, PPO,
Supplier Diversity and Development, and Transportation. For OS’s O&M
expenses, SCE forecast $57.322 million in 2015, a 6.86% decrease under 2012
recorded/adjusted levels.
The total OS capital expenditure forecast for 2013-2017 totals $544.49
million and includes funding for: CRE, Transportation and Supply Management.
774 SCE-24V2 at 23-24.775 TURN-3A.
- 284 -

A.13-11-003 ALJ/KD1/ar9/jt2/lil PROPOSED DECISION (Rev. 12)
SCE forecasts a cumulative $312.343 million in OS capital expenditures over the
2013-2015 period.776
Operational Services O&M (other than CRE)12.5.1.
SCE forecast $7.339 million in FERC 920/910 for OS Planning and
Performance Organization (PPO) and $1.835 million for OS Supplier Diversity
and Development Department (SDD). O&M expenses for Transportation were
not included in OS’ forecast as those costs are charged back to other SCE
Operating Units and included in those respective Operating Unit’s recorded costs
and forecasts.777 No party challenged SCE’s TY forecast for PPO and SDD, and
we find PPO’s forecast of $7.339 million and SDD’s forecast of $1.835 million
reasonable and they are adopted.
Operational Services Capital (other than CRE)12.5.2.
No party challenges SCE’s OS forecast of non-CRE capital projects for
2014-2015. Accordingly, we adopt the SCE’s capital expenditure forecast for
non-CRE OS projects from 2014-2015 totaling $12.952 million.
SBUA Proposal to Track Spending with Small12.5.3.Businesses
SBUA proposes that SCE track and publish information on its spending
with small businesses.778 We agree with SCE that, if this proposal is to be
implemented, it should be done on a statewide basis. If SBUA chooses to pursue
this proposal further, it should do so in a generic rulemaking such as R.14-10-009
so that all relevant stakeholders may participate.
CRE O&M12.5.4.
Our adopted forecast of CRE O&M is summarized below (2012$ millions).
776 SCE OB at 258.777 SCE OB at 259.778 SBUA OB at 8-10.
- 285 -

A.13-11-003 ALJ/KD1/ar9/jt2/lil PROPOSED DECISION (Rev. 12)
FERC Account SCE Rebuttal Adopted
920/921( Labor) $ 14.347 $ 14.120
920/921 (Non-Labor) $ 11.781 $ 10.037
931 (Non-Labor) $ 11.115 $ 11.115
935 (Non-Labor) $ 10.905 $ 10.905
935 (Non-Labor) - Rancho CucamongaOffice Building Optimization $ - $ 0.995
Total CRE O&M $ 48.148 $ 47.172
FERC Accounts 920/92112.5.4.1.
CRE records labor and non-labor expenses for managing SCE’s nonelectric
facility portfolio (226 buildings) to FERC Accounts 920/921. SCE’s TY 2015
forecast of $26.13 million for CRE was based on a three-year average of recorded
costs. SCE claims that ORA’s and TURN’s forecasts do not accurately reflect
CRE’s projected expenses.
ORA recommends using 2012 recorded levels of CRE’s non-labor forecast
resulting in $4.860 million reduction. SCE claims ORA’s recommendation fails to
consider that CRE’s 2012 level of spending was unsustainable and increased
non-labor costs are needed to restore sustainable levels of facility maintenance
and to address the significant increase in employee moves arising from
organizational realignments and exiting leased facilities and the need for more
contingent workers and outside services due to CRE’s reduced workforce.779
TURN recommends reducing CRE’s TY forecast for labor and non-labor
costs by $2.371 million. TURN utilizes a three-year average of costs recorded
from 2011-2013 to forecast CRE’s labor and non-labor expenses along with
retroactive application of future year Operational Excellence savings to 2011 and
2012 recorded costs.780 SCE claims that : (1) TURN’s use of 2013 unadjusted data
779 SCE OB at 259-260.780 TURN OB at 184-186.
- 286 -

A.13-11-003 ALJ/KD1/ar9/jt2/lil PROPOSED DECISION (Rev. 12)
inappropriately excluded approximately $2 million of 2013 expenses and an
additional $640,000 of 2013 affiliate credits; (2) CRE’s forecast already reflects a
downward future-year adjustment for Operational Excellence savings and
TURN’s application of the same adjustment to 2011-2012 results in
double-counting the savings; and (3) TURN relies on an incorrect calculation of
CRE 2013 recorded costs as the basis to discount SCE testimony detailing the
reasons for CRE’s higher non-labor forecast.781
We decline to adopt ORA’s proposed use of 2012 data for forecasting. We
find it inconsistent that ORA accepted CRE’s lower TY labor forecast (FERC 920)
due to reduced staffing, but did not accept the corresponding increases in CRE’s
non-labor costs (FERC 921) associated with such reduced staffing.
We conclude, however, that TURN’s use of a three-year average is
appropriate and adopt that approach. We are not persuaded by SCE’s objections
to TURN’s methodology.
We find no double-counting in TURN’s methodology. SCE’s labor cost
forecast for 2013 included $1.222 million to reflect a work force reduction that
would not occur until 2013. To ensure that the full amount of those forecasted
savings flowed to ratepayers in 2015, they needed to either be reflected in each
year’s data (the approach TURN took) or added back to the 2013 data, then
removed from the resulting average. Mathematically, the result is the same, and
the $1.222 million adjustment appears once, not twice. SCE does not show that
its forecast applies the full value of this savings to 2015 forecast, and thus does
not show how TURN’s adjustment should be considered double counting.
SCE also claims that TURN’s use of unadjusted 2013 data fails to reflect
affiliate credits that would cause 2013 unadjusted recorded costs to appear
781 SCE OB at 260.
- 287 -

A.13-11-003 ALJ/KD1/ar9/jt2/lil PROPOSED DECISION (Rev. 12)
approximately $640,000 lower as compared to 2013 adjusted costs. As TURN
notes, however, a non-utility affiliate credit adjustment is not essential in
developing a 2015 forecast. With the sale of the Edison Mission Energy assets to
NRG, SCE is the only subsidiary of EIX generating any material funds. This is
why the 2013 affiliate credits figure SCE reported in rebuttal testimony is
substantially below the 2011 and 2012 figures for this account. EIX and other
affiliates, however, will continue to create affiliate credits for SCE.782
SCE identified 2013 recorded amounts associated with cost centers that
were not reflected in TURN’s calculation of 2013 recorded costs. TURN
addressed this in errata, increasing the 2013 recorded cost figures by $907,000 for
labor and $1.391 million for non-labor, with corresponding increases to the
three-year average calculated for 2011-13. However, TURN’s showing is
inconsistent on this point, showing different values in OB and TURN-8A.
SCE claims its increased O&M forecast in 2015 is justified in part because it
added facilities in 2009-12 based on a headcount that is now a thing of the past.
But SCE readily acknowledges that one result of its non-electric facilities boom of
recent years is that the utility expects to have 6.2 million square feet of
non-electric facilities for a work force that would reasonably be expected to
require five million square feet, an excess of 24%783. TURN submits that even if
the 2013 recorded costs had not come in so far below SCE’s forecasts for that
year, casting doubt on the validity of the utility’s assumptions and calculations
for the 2015 forecast, the increase SCE seeks for 2015 should be rejected to
mitigate the ratepayer impact of a building fleet sized for a work force that is
nearly a quarter larger than the one SCE now expects to have in place.784
782 SCE RB at 127.783 11 RT 1184-1186.784 TURN OB at 186.
- 288 -

A.13-11-003 ALJ/KD1/ar9/jt2/lil PROPOSED DECISION (Rev. 12)
In conclusion, we accept TURN’s premise that a 3YA, with adjustments for
OpX savings is reasonable. However, we find that further adjustments to
TURN’s forecast are necessary to account for affiliate credits and excluded cost
centers. We estimate the combined impact of these adjustments as $1.200 million
in 2013, and thus $0.400 million to the 3YA of non-labor. Our adopted forecast is
$14.120 million in labor, and $10.037 million in non-labor.
Rents (Account 931)12.5.4.2.
CRE records expenses in FERC Account 931 for rental and lease costs of
non-SCE owned property and buildings. SCE’s TY2015 forecast of $18.106
million was based on rent payments, lease escalations, and other charges per
actual lease agreement terms. Subsequent to filing its GRC Application, SCE
finalized plans to exit certain leased facilities, either in whole or in part, with
terms expiring in 2015 and 2016.
TURN recommends normalizing the expected 2015-2017 lease savings
based on updated plans, which results in a $10.95 million forecast ($7.139 million
below SCE’s forecast).
SCE agrees with TURN’s proposal relative to normalizing the expected
2015-2017 lease savings. SCE requests a higher forecast of $11.115 million,
however, (approximately $164,000 above TURN’s forecast) based upon certain
additional costs arising from a lease negotiated subsequent to TURN’s
submission of testimony.785 SCE requests that the Commission authorize TY
funding in FERC Account 931 of $11.115 million, a net decrease of $6.991 million
from the original TY forecast. TURN accepts SCE’s modification to the
TURN-proposed figure, and the resulting forecast of $11.115 million.786 We
adopt the $11.115 million forecast, as mutually agreed by SCE and TURN.
785 SCE OB at 260-261.786 TURN OB at 183-184.
- 289 -

A.13-11-003 ALJ/KD1/ar9/jt2/lil PROPOSED DECISION (Rev. 12)
Non-Labor Repairs and Maintenance12.5.4.3.(Account 935)
CRE’s FERC Account 935 is for non-labor repairs and maintenance
(non-capital) of facility structures and parking areas that SCE owns, uses,
occupies, or operates, including repairs to infrastructure and equipment. SCE’s
TY forecast of $10.905 million is $3.2 million over the 2012 costs and is based on a
three-year average. The increase is primarily attributable to the increase in
critical facility maintenance resulting from the addition of the Alhambra Data
Center and restoration of sustainable maintenance at SCE’s other critical facilities.
ORA’s proposed $9.705 million forecast is based on 2012 recorded
spending levels ($7.7 million) plus a $2 million increase in support of higher
levels of critical facility maintenance.
Similar to CRE’s forecast for FERC Accounts 920/921, SCE claims that
ORA fails to account for (1) substantial fluctuations in recorded expenses for this
account during the 2008-2012 period (rendering a LRY an inappropriate base)
and (2) SCE’s uncontested showing that 2012 maintenance levels are
unsustainable and restoration of proper maintenance levels at critical facilities is
essential to support the IT and telecom equipment housed at these sites.
We adopt SCE’s forecast of $10.905 million for CRE’s FERC Account 935
for non-labor repairs and maintenance (non-capital) of facility structures and
parking areas that SCE owns, uses, occupies, or operates. Given the level of
variation in recorded data, SCE’s 3YA is appropriate.
CRE Capital12.5.5.
CRE projects support SCE’s non-electric facility portfolio housing SCE’s
workforce and equipment and maintain the performance and lifecycle of SCE
non-electric facility assets and infrastructure. ORA and TURN only provide
- 290 -

A.13-11-003 ALJ/KD1/ar9/jt2/lil PROPOSED DECISION (Rev. 12)
recommendations on CRE’s capital forecast for the period from 2013 through
2015. SCE accepts ORA’s and TURN’s corresponding recommendations to adopt
2013 recorded expenditures in place of the 2013 forecast, but rejects their
recommendations for CRE’s 2014-2015 capital forecast. As noted in Section 5.2
above, we approve use of 2013 recorded capital.
ORA accepts SCE’s forecast of CRE capital expenditures for 2014-2015,
except for: (1) the Irwindale Business Center (IBC) Remodel; and (2) the IT
Equipment and Infrastructure Blanket. ORA’s recommendations reduce CRE’s
2014-2015 capital forecast by $33.330 million.
TURN challenges SCE’s 2014-2015 forecast relative to the following CRE
projects: (1) Emergency Operations Center; (2) General Office 2 (GO2)
Conference/Training Center; (3) GO5 Parking Structure; (4) IBC Remodel; (5)
Rancho Cucamonga Lease Optimization; (6) Capital Maintenance Blanket; (7)
Ongoing Furniture Modification Blanket; (8) Energy Efficiency Blanket; (9)
Garage Infrastructure; Upgrade Program; (10) Service Center Infrastructure
Upgrade; (11) IT Equipment and Infrastructure Blanket; and (12) Corporate
Communications Media Center. TURN also seeks removal of certain amounts
included in the CRE project forecasts tied to contingency. In total, TURN
recommends reducing CRE’s 2014-2015 capital forecast by $107.163 million.
Our adopted forecast is summarized below:
Project 2014 2015
Requested
Adopted Requested
Adopted
Pre-Adjustment
Post-Adjustment
Pre-Adjustment
Post-Adjustment
EmergencyOperationsCenter (EOC) $ - $ - $ - $5.000 $5.000 $4.524
GO2Conference &
$0.300 $0.300 $0.271 $0.700 $0.700 $0.633
- 291 -

A.13-11-003 ALJ/KD1/ar9/jt2/lil PROPOSED DECISION (Rev. 12)
TrainingCenter
GO5 ParkingStructure $4.700 $ - $ - $6.200 $ - $ -
IrwindaleBusinessCenter (IBC) $ - $ - $ - $20.000 $17.000 $15.383
RanchoCucamongaOfficeBuildingOptimization $ - $ - $ - $3.300 $1.100 $0.995
CapitalMaintenance $20.446 $20.446 $18.501 $20.912 $20.912 $18.922
OngoingFurnitureModifications $2.916 $2.916 $2.639 $2.982 $2.982 $2.698
EnergyEfficiencyBlanket $2.500 $2.500 $2.262 $2.614 $2.614 $2.365
GarageInfrastructureUpgradeProgram $5.112 $2.585 $2.339 $5.228 $2.585 $2.339
Service CenterInfrastructureUpgradeProgram $10.223 $3.500 $3.167 $10.456 $3.500 $3.167
CorporateCommunications MediaCenter $1.000 $ - $ - $ - $ - $ -
OtherNon-BlanketProjects
$41.053 $41.053 $37.147 $27.166 $27.166 $24.582
Other Blanket& ProjectsUnder 1million
$0.383 $0.383 $0.347 $0.392 $0.392 $0.355
Subtotal $88.633 $73.683 $66.673 $104.950 $83.951 $75.964
Less: Blankets $(41.580) $(32.330) $(29.254) $(45.884) $(34.085) $(30.842)
- 292 -

A.13-11-003 ALJ/KD1/ar9/jt2/lil PROPOSED DECISION (Rev. 12)
& ProjectsUnder 1million
Total forCalculating ITAdder
$47.053 $41.353 $37.418 $59.066 $49.866 $45.122
IT Adder(12%)
$5.646 $4.962 $4.490 $7.088 $5.984 $5.415
Grand Total $94.279 $78.645 $71.163 $112.038 $89.935 $81.379
CapitalExpenditure
$71.163 $80.383
Treated asO&M
$- $0.995
Contingency Funding and Project12.5.5.1.Management Costs
TURN makes two recommendations that are applicable to many of the
specific CRE projects discussed below: disallowance of contingency funding and
disallowance of project management costs.
SCE has included contingency amounts in its CRE capital expenditure
forecasts, both in the planning estimates for particular projects and as separate
adders to the forecasts for its energy efficiency, garage infrastructure, and service
center infrastructure blanket projects. TURN argues that the Commission should
remove these contingency amounts from SCE’s capital expenditure blankets,
consistent with the outcome adopted in SCE’s 2009 and 2012 GRC decisions.
TURN recommends reducing SCE’s capital forecast by $4.539 million in 2014 and
$8.365 million in 2015 for contingency amounts applied by SCE within CRE
construction projects and blankets.
In SCE’s 2009 GRC, the utility proposed CRE capital expenditure forecasts
that included contingency estimates that averaged approximately 15% of the
project costs. Despite SCE’s arguments that such contingency percentages are
standard industry practice and that the proposed percentages varied based on
- 293 -

A.13-11-003 ALJ/KD1/ar9/jt2/lil PROPOSED DECISION (Rev. 12)
the level of risk for each project, the Commission concluded that SCE had
inadequately substantiated the contingency percentages it applied to its capital
projects for CRE.
In SCE’s 2012 GRC, the utility again included contingency amounts in its
CRE capital project forecasts, this time based on an across-the-board 10%
contingency factor. SCE claimed that by reducing the factor and limiting its
application to only “hard construction costs, it responded to the Commission’s
concerns stated in the 2009 GRC, at least as understood by SCE. The Commission
disagreed, stating that SCE’s cost estimates were at a preliminary stage and not
sufficiently reliable to determine that any contingency funding was warranted.
The Commission removed the 2012 contingency factor for such construction
projects.
TURN argues that in SCE’s 2015 GRC, contingency costs should once again
be removed from CRE capital forecasts.787
SCE responds that TURN’s recommendation is solely based on the
Commission’s 2009 and 2012 GRC decisions rejecting system-wide contingency
adjustments, and that TURN cited no other authority rejecting individual
contingency percentages developed by SCE on a project by project basis. In
recognizing the basis of previous Commission disallowances of single
system-wide contingency adjustments, SCE forecast contingency on
project-by-project basis incorporating contingency amounts within each project
per RS Means industry standards.
As described by SCE’s Director of Corporate Real Estate, SCE included no
explicit contingency forecast in direct testimony as a blanket and uniform
contingency percentage was not applied in generating the forecasts for CRE
787 TURN OB at 187-188, citing D.09-03-025 at 247 and COL 186 and D.12-11-051 at 568.
- 294 -

A.13-11-003 ALJ/KD1/ar9/jt2/lil PROPOSED DECISION (Rev. 12)
capital projects in this GRC. Rather than applying a system-wide and uniform
contingency percentage to the CRE projects, SCE (in consultation with
professional construction cost-estimator Cumming, Inc.) applied unique
contingency percentages based on the nature and scope of the subject CRE
project.
SCE’s Planning Estimates incorporate contingency adjustments ranging
from 8% to 13% for individual projects and 2% to 15% for blanket projects. SCE
claims these percentages represent reasonable contingency levels for CRE
projects based on project type and phase of planning. Per industry standard, the
separate and distinct contingency percentages were applied to each project cost
estimate to provide the best indicator of the ultimate costs of the projects. If the
contingency percentages applied by SCE to CRE’s capital projects are disallowed,
SCE believes TURN’s proposed contingency-related disallowances must be
adjusted to remove disallowances tied to any CRE projects where the
Commission accepts TURN’s recommendation of zero customer funding for
2014-2015.
TURN’s disallowance figures incorporate contingency adjustments totaling
$2.476 million (out of $4.549 million) in 2014 and $5.629 million (out of $8.365
million) in 2015 which SCE claims are already accounted for in TURN’s
recommendations for zero funding on those CRE capital projects. SCE argues
that any denial of funding for CRE capital projects forecast during 2014 and 2015
will already remove the respective contingency adjustment for such project.
TURN agrees that disallowed contingency amounts should reflect the
project-specific contingency percentages SCE provided in a supplemental
discovery response, applied to Commission-approved project cost estimates.
- 295 -

A.13-11-003 ALJ/KD1/ar9/jt2/lil PROPOSED DECISION (Rev. 12)
We adopt TURN’s recommendation to disallow the contingency amounts
that SCE included relating to the CRE projects and for which funding is
authorized for 2015. SCE’s direct showing did not address whether CRE
estimates included a contingency adjustment, much less explain or support the
amounts of any such adjustment. Through supplemental discovery, SCE
revealed the amounts of design and other contingency in each project forecast,
totaling $32.959 million for 2013-2017. SCE attempted to augment its showing by
presenting support for its contingency amounts in its rebuttal testimony, but the
ALJ issued a ruling striking that testimony.788 We affirm the ruling of the ALJ.
In hearings, SCE’s witness described, in general terms, the process for
developing contingency estimates, but this testimony did not discuss project
specifics or provide detail to support specific amounts.789
Given the absence of adequate record support for SCE’s request for
contingency amounts and the prior GRC decisions rejecting SCE’s request for
contingency amounts even where the utility had presented some amount of
record support for its request, we conclude that SCE’s request to include
contingency amounts here should also be rejected.
TURN observes that in the 2012 GRC, we reduced SCE’s project
management costs due to a lack of support in SCE’s showing. TURN contends
that SCE’s showing in this proceeding is essentially unchanged and provides no
more detail, other than an additional comment on precedent. Accordingly,
TURN recommends a reduction of 50% or more of SCE’s project management
costs, which TURN calculates as $12.943 million across various projects. TURN
admittedly raises this argument for the first time in its opening brief.790
788 ALJ Kevin Dudney, 11 RT 1218-1219, striking the testimony proffered in Ex. SCE-24V3 at 19, line 7 through at 22, line 2.
789 11 RT 1199-1204.790 TURN OB at 190-191, citing D.12-11-051 at 569.
- 296 -
A.13-11-003 ALJ/KD1/ar9/jt2/lil PROPOSED DECISION (Rev. 12)
SCE responds that its work-papers and discovery materials provided
TURN with detailed cost estimates, including project management costs, and that
it provided testimony sufficient to demonstrate total project costs were
reasonable. SCE notes that the reduction we made in the 2012 GRC was related
to SCE’s use of a flat percentage of costs, and argues that its estimates here are
distinguishable because they are detailed estimates of labor hours. SCE argues
TURN could have and should have raised this concern earlier.791
While we agree with SCE that TURN could have and should have raised
this concern earlier, we also remind SCE that TURN does not bear the burden of
proof in this case. As in the 2012 GRC, we find that SCE’s direct showing was
inadequate to support its full project management request, but decline to
disallow the full amount.
We combine these two disallowances (contingency and project
management) into a single percentage disallowance that we apply to each project
we approve below, including the undisputed projects. The contingency
estimates cited by TURN are approximately $12.904 million and project
management costs are $12.943 million. Comparing these to the total capital of
$271.665 million yields a factor of 9.5%792
Emergency Operations Center12.5.5.2.
SCE requests $5 million in 2015 to construct a new 20,000 square foot
Emergency Operations Center (EOC) capable of supporting 24 hours, 7 days a
week operations and meeting Uniform Building Code standards for “essential
facilities” with additional upgrades to provide seismic quake resistance. The
EOC will benefit the customers and the community at large through enhanced
791 SCE RB at 134, citing D.12-11-051 at 569. 792 TURN OB at 187 and Appendix B at 2, SCE-24V3 at 15.
- 297 -
A.13-11-003 ALJ/KD1/ar9/jt2/lil PROPOSED DECISION (Rev. 12)
response to and timely and efficient recovery from emergencies of varying
scale.793
TURN’s recommendation that the Commission reject funding of the EOC
relies on two arguments: (1) TURN contends that SCE previously received
funding for an emergency operations center in the 2012 GRC; and (2) SCE’s
construction of an interim emergency operations center at its Gateway facility
obviates the need for the EOC. As an alternative, TURN recommends that if we
approve the EOC, we should remove the undepreciated portion of the Gateway
facility from rate base.794
SCE’s supporting testimony in the 2012 GRC states that the “emergency
operations command center” portion of the Pomona Transportation Services
Department (TSD) was never intended to serve the same purpose as the EOC
and, instead, was an emergency communications hub solely serving the vehicle
fleet. SCE’s uncontested testimony also reflects that SCE prioritized the need to
mitigate risks from emergency events and disasters by constructing the interim
EOC in an existing facility and enhancing its emergency response capabilities
temporarily, while a more permanent solution was determined. The interim
facility at Gateway has been utilized to respond to several emergency events and
to host multiple training exercises, meetings, project planning and other
emergency preparedness activities. SCE will continue to use the facility as office
space following the EOC’s construction. Given the need for a more seismic
resistant and advanced facility, SCE argues that it’s requested funding for EOC
remains a pressing need.795
793 SCE OB at 262-263.794 TURN-8 at 15-16.795 SCE-24V3 at 30-31 and SCE OB.
- 298 -

A.13-11-003 ALJ/KD1/ar9/jt2/lil PROPOSED DECISION (Rev. 12)
In its brief, TURN argues that we delay consideration of EOC until after it
is completed and that we require SCE to demonstrate that the interim EOC at
Gateway remains used and useful.796
We approve SCE’s 2015 forecast for the EOC, subject to reductions
described elsewhere in this decision. We agree with SCE that the EOC serves an
important function separate from the TSD and beyond the intent of the interim
EOC. Therefore, we find it reasonable to approve the 2015 portion of the project.
However, SCE must apply for the balance of the project in its next GRC. Further,
we agree with TURN that SCE has not demonstrated that the interim EOC will
remain used and useful after a new EOC is complete. Therefore, SCE must also
make a showing in the next GRC that the interim EOC remains used and useful
or the undepreciated balance shall be removed from rates.
General Office 2 (GO2) Conference &12.5.5.3.Training Center
After the migration of data center operations from GO2 to the Alhambra
Data Center, CRE will repurpose the building into a Conference and Training
Center. SCE’s 2014-2015 forecast for planning, design, engineering and
permitting of this project is $1 million.797
TURN recommends no customer funding for the project, arguing that
funding be secured through SCE’s avoidance of off-site meetings following its
construction. TURN estimates this savings as $4.3 to 4.6 million per year. TURN
recommends that we require a specific adjustment to account for these O&M
savings in the next GRC.798
As the Conference and Training Center will not be completed until late
2017, SCE will realize no savings until 2018, which is outside the forecast period
796 TURN OB at 196-197.797 SCE OB at 263.798 TURN-8 at 11-13 and TURN OB at 194-195.
- 299 -

A.13-11-003 ALJ/KD1/ar9/jt2/lil PROPOSED DECISION (Rev. 12)
for this rate case. A dedicated training and conference space at GO2 will not only
reduce off-site meeting expenses, but will reduce time and safety risks associated
with employees traveling to distant training and meeting locations.799
We agree with TURN that the cost-benefit analysis of this project should be
explicitly presented in the next GRC, and require SCE to provide this analysis in
its direct showing. However, the merits of the project are essentially
uncontested. We find reasonable and approve SCE’s 2014-2015 forecast.
GO5 Parking Structure12.5.5.4.
SCE seeks funding of $10.9 million from 2014-2015 to fund the Parking
Structure for its General Office Headquarters Building (GO5). SCE claims that
construction of the parking structure is needed to ameliorate congestion issues
associated with insufficient parking spaces and to maximize use of the facility
space. The GO5 will host thousands of employees, candidates, and supplemental
workers. SCE claims that it needs to increase the number of existing parking
spaces at the GO5 parking lot by 300 spaces to accommodate the volumes of
employees, contractors and visitors that frequent the facility.800
TURN contends that this funding should be disallowed based upon
excessive cost and historic employee occupancy of GO5. TURN argues that these
are very expensive parking spaces SCE proposes to build. According to the
utility, the price range for parking structures in the Los Angeles area range from
$19-$21,000 per space for above-grade structures, and $23-$25,000 per space for
subterranean parking structures. The $36,000 effective per-space rate for the 300
spaces SCE would gain from this project is 50-100% above the SCE-reported local
market cost.
799 SCE OB at 264. 800 SCE OB at 264.
- 300 -

A.13-11-003 ALJ/KD1/ar9/jt2/lil PROPOSED DECISION (Rev. 12)
Even if SCE’s cost forecast is deemed reasonable for a net gain of 300
parking spaces, TURN argues that we should still deny funding for this project.
SCE is presuming one parking space per employee seated at GO5. Rather than
build more parking spaces, TURN believes SCE should first encourage
alternatives that would reduce this ratio, such as ride sharing, mass
transportation, and similar options other than single occupancy vehicles.
Similarly, SCE should continue to seek out and take advantage of other facilities
to accommodate peak period parking needs, as it has done in the recent past.
TURN argues SCE claims that it already encourages its employees to
pursue alternative forms of commuting, but its assumption of needing one space
per employee belies less than a full commitment to the success of those efforts.
SCE also cites the potential lack of alternative parking options in the future, and
the potential additional operating costs if the utility needs to shuttle employees
from more remote parking locations to GO5. If the shuttle service helps to avoid
a $10.9 million investment in more parking facilities, TURN contends, the utility
could splurge on some extraordinarily nice vehicles for the shuttling and still
come out far ahead.801
SCE claims that TURN fails to account for the heavy volume of visitors to
GO5 and the increased employee occupancy in future years, as SCE continues to
exit leased facilities and the related safety and operational challenges arising
from the substantial deficit of parking spaces. Although SCE has leased overflow
parking from a neighboring facility to address the issue in recent years, this lease
expired on November 17, 2014 and was not extended.802
We agree with TURN that the applicable denominator for the
cost-per-space calculation, from ratepayers’ perspective, is the net increase in
801 TURN-8 at 9-11, TURN OB at 193-194.802 SCE OB at 264.
- 301 -
A.13-11-003 ALJ/KD1/ar9/jt2/lil PROPOSED DECISION (Rev. 12)
parking spaces, not the gross increase. SCE’s attempt to ignore a real
opportunity cost is unreasonable. Further, while we agree with SCE that it may
have an increasing deficit, SCE has not shown that it has adequately explored
alternatives to this project that could reduce the deficit at a cost-per-space of less
than $36,000, either by reducing need (e.g., telework policies are not even
mentioned in SCE’s testimony) or increasing supply. SCE’s request is denied.
IBC Remodel12.5.5.5.
SCE requests $20 million in 2015 to remodel and reconfigure the IBC into a
customer call center in 2015. The move will allow SCE to consolidate its
workforce into fewer facilities and complete its planned exit from leased facility
space in Monrovia in 2016.803
ORA recommends zero funding for the IBC remodel based on the assertion
that the project was addressed in SCE’s 2012 GRC.804 The project, however, was
not substantially addressed or approved in the 2012 GRC.805
TURN also recommends zero funding, claiming that the project will not be
used and useful by the end of 2015. Citing SCE’s decision to exit only a portion
of the leased facility in Rancho Cucamonga, TURN concludes IBC will not be
used and useful until 2016.806
In rebuttal testimony, SCE explains that the IBC Remodel project will
proceed as planned. While SCE’s plan to exit all of the Rancho Cucamonga
facility has changed since the application was filed, SCE employees from its Long
Beach call center and the Environmental Health and Safety group (from the
Monrovia facility with an expiring lease) will be relocated to the IBC during the
803 SCE OB at 264.804 ORA-20. 805 D.12-11-051 at 576.806 TURN-8 at 17-18.
- 302 -

A.13-11-003 ALJ/KD1/ar9/jt2/lil PROPOSED DECISION (Rev. 12)
4th quarter of 2015. The scope of the IBC Remodel project remains substantially
the same.807
TURN rejects SCE’s response, calculating that the number of employees
forecast (in SCE’s rebuttal) to move to IBC is 27-30% lower than in SCE’s
application and that some of these employees do not have the same requirements
as call center employees.808
We reduce SCE’s forecast by 15%, based on the lower forecast number of
employees occupying the IBC. We agree with TURN that it is reasonable to
expect reduced costs given the change in use (both number and type of
employees). However, we also recognize that some portion of the costs are not
dependent on these factors. Our adopted forecast balances these considerations.
Rancho Cucamonga Office Building12.5.5.6.Optimization
SCE requests funding of $3.3 million in 2015 for demolition and removal of
specialized infrastructure built into the leased facility in Rancho Cucamonga
arising from SCE’s exit of two out of three floors in 2015. SCE reduced its
forecast for the Rancho Cucamonga Office Building Optimization project from $5
million down to $3.3 million based upon the modified plan to exit only two of the
three floors formerly occupied. SCE still has a contractual obligation to return
the exited portion to the landlord to its pre-lease condition. SCE claims these
costs are appropriately capitalized, noting that improvements to the leased space
were capitalized. SCE analogizes to T&D salvage operations.809
807 SCE-24V3 at 33-34.808 TURN OB at 197-198.809 SCE-24V3 at 28-29.
- 303 -

A.13-11-003 ALJ/KD1/ar9/jt2/lil PROPOSED DECISION (Rev. 12)
TURN accepts the adjustment to $3.3 million as reasonable. However,
TURN recommends that these costs should be expensed over three years rather
than capitalized. TURN observes that lease costs are treated as O&M.810
We find that TURN’s proposed ratemaking treatment to expense these
costs over three years is reasonable. This treatment avoids any unintended
incentive for SCE to modify and later restore leased facilities in order to inflate
rate base. Accordingly, we approve a $0.995 million (2015$) O&M expense,
calculated as $1.1 million, adjusted as discussed in Section 12.5.5.1. above. We
add this expense as Non-labor in Account 935.
Capital Maintenance Program12.5.5.7.
SCE requests $41.358 million over the 2014-2015 period for the
maintenance and renovation requirements of SCE’s non-electric facility portfolio
(which have an average age of 36 years). SCE claims these expenditures are
needed to address facility system and component age obsolescence and to
provide a safe and habitable environment for its workforce.811
TURN recommends $28.840 million over the 2014-2015 period, a reduction
of $12.518 million from SCE’s forecast. The primary basis for TURN’s
recommendation is its contention that SCE is mischaracterizing its facilities as
being in “poor” condition based on application of Facility Condition Index (FCI)
scores, compared to the way Parsons (an engineering firm) uses FCI. TURN’s
reduced forecast relied on a six-year average of 2008-2013 recorded costs for
Capital Maintenance spending (excluding the highest and lowest years to reduce
variation).812
810 TURN OB at 195-196.811 SCE OB at 266.812 TURN-8 at 20-23.
- 304 -
A.13-11-003 ALJ/KD1/ar9/jt2/lil PROPOSED DECISION (Rev. 12)
SCE claims that TURN’s forecast understates the amount of capital
maintenance needed even to minimally preserve SCE’s non-electric facility
portfolio without risking safety and compliance impacts. SCE explains that it
relied on a separate scale, which it claims is standard and is more stringent than
the scale recommended by Parsons. The Parsons’ Assessment projects that
capital maintenance spending of approximately $47 million per year is necessary
to prevent further deterioration of SCE’s non-electric portfolio and maintain its
existing FCI rating of 19.84 %. SCE’s forecast is lower than what Parsons
projected as the level of spending needed to maintain the facilities in their current
conditions. SCE claims that its forecast of Capital Maintenance forecast
represents the minimum level of spending to prevent further, unacceptable
deterioration to those facilities.813
TURN argues that SCE offers no basis to claim that the Parsons report
substantiates a higher forecast. SCE does not describe how it developed the
spending projections for any of the categories, or otherwise demonstrate that the
projected spending level is reasonable. TURN notes that the Parsons report also
stated that “few, if any, inventories of public buildings ever achieve an overall
rating of 10% or below.” Parsons had routinely found existing average building
conditions throughout the United States to fall within the range of 25-35% FCI.
SCE’s direct testimony refers to a “portfolio FCI score of 22-27%,” but the Parsons
report indicates a FCI score of 19.84% for SCE’s facilities. Any of these scores
would place SCE’s facilities in the upper range of the “fair” rating under
Parsons’s recommended standards for SCE, and would indicate SCE’s facilities at
or better than the top of the range for average building conditions in the United
813 SCE-24V3 at 35-37.
- 305 -

A.13-11-003 ALJ/KD1/ar9/jt2/lil PROPOSED DECISION (Rev. 12)
States. Yet SCE originally chose to present the figures as falling into the “poor”
category.
TURN contends that the $47 million per year figure reflects the totality of
work that Parsons assumes SCE will need to perform through 2023, and covers
all work not only in the most critical categories. TURN notes that this includes
“Priority 4” work with its estimate in excess of $300 million over a five-year
period that is likely to cover two rate case cycles into the future. TURN also
contests the 53% “soft cost” amount included in calculation of the $47 million
figure, and concludes that if this were excluded along with lower priority work,
the estimate would be far below the $14.42 million per year that TURN
recommended.814
Both SCE815 and TURN816 accuse each other of a selective reading of the
Parsons report, and in this regard, both are correct. We agree with TURN that
SCE’s presentation of the Parsons report in its direct testimony is disingenuous.
However, we believe that preventive maintenance is important and are not as
quick as TURN to throw out all of the lower priority categories of maintenance
identified by Parsons to calculate a no-deterioration maintenance budget. In light
of the Parsons report, we conclude that SCE’s forecast is reasonable. We note
that SCE’s proposal is lower than the six-year recorded average, if 2011 and 2013
are included. Further, we apply the adjustment discussed in Section 12.5.5.1
above to this forecast, in light of the soft costs assumed in the Parsons report.
Ongoing Furniture Modifications Blanket12.5.5.8.
SCE requests $5.898 million over 2014-2015 for its Ongoing Furniture
Modifications blanket, which provides funding to address normal wear and tear
814 TURN OB at 200-202.815 SCE RB at 131.816 TURN OB at 201.
- 306 -
A.13-11-003 ALJ/KD1/ar9/jt2/lil PROPOSED DECISION (Rev. 12)
to office furniture and the reconfiguration and modification of furniture and
furniture systems for workspaces.817
TURN recommends funding $3.038 million over the 2014-2015 period, a
reduction of $2.86 million from SCE’s forecast. TURN’s reductions reflected a
six-year average for 2008-2013 recorded spending ($1.688 million), adjusted to
reflect the reduced need for furniture modifications in light of SCE’s reduced
forecast of total and seated employees (a further 10% reduction). TURN
calculates that SCE is requesting a 216% to 315% increase in costs on a
per-employee basis and concludes that this increase is not justified.818
SCE claims that TURN fails to consider SCE’s centralization of furniture
requests and replacements, as formerly split between CRE and the OUs with
large furniture requirements, in March 2013. SCE’s forecast represents no
increase of total furniture spending over historical costs, but reflects the transfer
of the furniture expenditures that formerly resided in other OUs to CRE.
TURN’s proposed forecast compares CRE’s Ongoing Furniture Modifications
forecast with pre-centralization historical expenditures. The recorded furniture
spend for the elements that are now budgeted in CRE shows furniture spending
under this blanket in line with SCE’s forecast.819
TURN responds that SCE fails to provide the data that might back them
up. SCE could have included in its testimony or workpapers the recorded data
for 2008-12 for furniture spending that “resided in the OUs” during that period.
Such data would permit an apples-to-apples comparison with the utility’s 2013
recorded data. SCE did not present the data that might back up its claims.
Instead, it mischaracterizes TURN’s recommendation as being a reaction to the
817 SCE OB at 267.818 TURN-8 at 24-26.819 SCE-24V3 at 40.
- 307 -

A.13-11-003 ALJ/KD1/ar9/jt2/lil PROPOSED DECISION (Rev. 12)
perceived increase from the 2013 forecast to the 2014 forecast. TURN’s
recommendation is based on the recorded amounts as SCE reported them for
2008-2013, and the significant reductions to SCE’s work force forecasted for 2015
as compared to the work force during the 2008-13 period.820
While we agree with TURN that SCE could have provided more data to
“back them up,” we find that SCE’s explanation of the increase (in uncontested
sworn testimony) is logical. Accordingly, SCE’s forecast, as adjusted is
reasonable.
Energy Efficiency Blanket12.5.5.9.
SCE requests $5.1 million over the 2014-2015 period for its energy
management upgrade program, which includes installation of a supplemental
chiller and enhanced building management systems to conserve energy usage
throughout SCE’s non-electric facility portfolio. SCE proposes Energy Efficiency
spending of $2.5 million in 2014, and $2.614 million in 2015. The 2014 forecast
covers an $800,000 chiller plant for SCE’s General Office facility, and $1.7 million
for its new Building Management System. The 2015 forecast would be entirely
spent on the Building Management System.821
TURN recommends denial of SCE’s funding requests because SCE’s
energy efficiency projects, both as pursued in the past and as proposed for this
GRC period, are not cost-effective from a ratepayer perspective. In 2010-2011,
SCE spent $4.9 million on various water conservation projects at three of its
facilities, all recorded under the energy efficiency blanket. The projects achieved
water savings, but in the amount of $10,702 per year. TURN calculates an
820 TURN OB at 203-204.821 SCE OB at 198.
- 308 -

A.13-11-003 ALJ/KD1/ar9/jt2/lil PROPOSED DECISION (Rev. 12)
average simple payback period of 457 years. TURN recommends that we instate
a guideline of a maximum five-year simple payback period.822
SCE claims that TURN’s reading of SCE’s energy efficiency reports are
selective. As reflected in SCE’s showing, the payback period for SCE’s past
energy efficiency projects show a more reasonable payback period than TURN’s
calculation. SCE’s proposed projects in this rate case period are for the reduction
of energy use during peak usage periods and have a calculated payback period of
7.63 years.823
TURN does not disagree with the theory of SCE’s calculation, but notes
that SCE does not charge itself for electricity and, therefore, payback will never
be achieved over any period. TURN states that this is a theoretical payback
period, premised on the notion that SCE’s facilities pay for electricity they
consume. Since the facilities do not actually pay for electricity, there is no actual
“payback period” and there is no chance SCE’s customers will recoup the costs of
the energy efficiency projects through associated energy savings. Therefore,
TURN concludes, whatever the benefits of energy efficiency projects installed at
SCE facilities, the ratepayer savings from reduced electricity consumption will
always be zero.
TURN argues that ratepayers should not fund such projects in GRCs. As
capital expenditures, SCE’s energy efficiency projects require depreciation, tax
and return expenses that are very real. If there were a way to have SCE’s
customers pay theoretical dollars to cover the costs of achieving these theoretical
benefits from SCE’s energy efficiency and water conservation activities,
continued SCE investment in these programs might make sense. Until that
822 TURN-8 at 18-20.823 SCE-24V3 at 40.
- 309 -
A.13-11-003 ALJ/KD1/ar9/jt2/lil PROPOSED DECISION (Rev. 12)
happens, though, TURN argues, ratepayers should not fund such projects
through GRC forecasts.824
TURN’s contention that there are no ratepayer benefits to SCE’s energy
efficiency improvements because SCE does not charge itself for electricity is
wrong. This argument suggests that SCE should never factor utility electricity
usage into its decision making, so long as the energy will be supplied by SCE.
TURN implicitly asks us to ignore the real costs to generate or procure energy
and deliver that energy to SCE’s facilities. While we acknowledge the many
challenges of measuring avoided costs, we decline to simply ignore these costs
that are potentially avoided by energy efficiency. We remind TURN that these
are real costs, paid for in real ratepayer dollars.
SCE’s forecast 7.63-year forecast payback period for the investments
proposed here is uncontested. This is considerably longer than the five-year
target proposed by TURN. However, there is no adopted target for payback
periods, and we decline to do so here with the limited information before us.
Instead, based on our review of SCE’s forecast and the benefits of the specific
projects here, we find that SCE’s forecast is reasonable.
Garage Infrastructure Upgrade Program12.5.5.10.
SCE requests $10.340 million over the 2014-2015 period for its Garage
Infrastructure Upgrade Program. The upgrades would cover SCE’s 43 garages
and maintenance facilities, staffed by approximately 225 employees. Most of
SCE’s garages are older, and are exposed to consistent and demanding use by
large vehicles and equipment. SCE argues that the upgrades are needed to
address wear and tear, and for upgrades as equipment and work methods evolve
to provide a safe and productive workplace for SCE’s employees.825
824 TURN OB at 196-200.825 SCE OB at 268.
- 310 -

A.13-11-003 ALJ/KD1/ar9/jt2/lil PROPOSED DECISION (Rev. 12)
TURN recommends the Commission deny SCE’s entire $10.34 million
request. TURN argues that the Commission’s review of such a request should
take into consideration SCE’s admitted “failure to move forward” with the
authorized spending from the past GRCs. And under the circumstances here,
TURN believes SCE’s requested level of funding for its Garage Infrastructure
Update Program should be denied because of SCE’s track record in the 2009 and
2012 GRCs.826
SCE responds that there is no cited authority for barring it from seeking
recovery for projects in subsequent rate cases simply due to SCE’s failure to
move forward with the same or similar projects for which was authorized in
prior rate cases. SCE claims it exercised its discretion to re-direct funds to higher
priority projects and did not previously move forward with the project. To allay
concerns about SCE’s plans to move forward with this program, SCE claims that
work on portions of the program (including the Ontario Garage) had already
commenced, and the current projected spend by year end 2014 is approximately
$7 million.827
We conclude that SCE has failed to justify ratepayer funding of the entire
$10.340 million over the 2014-2015 period for the Garage Infrastructure Upgrade
Program. SCE has declined to implement garage infrastructure upgrades that
were previously authorized by the Commission. We thus remain skeptical that
the full amount that SCE has forecasted would, in fact, actually be spent on the
program during the 2014-2015 cycle, rather than being redirected into other
purposes deemed by SCE to have higher priority. Nonetheless, since SCE has
shown that some actual work on portions of garage upgrades has already at least
commenced, SCE may implement at least some level of spending on the garage
826 TURN-8 at 22-24.827 SCE-24V3 at 42.
- 311 -

A.13-11-003 ALJ/KD1/ar9/jt2/lil PROPOSED DECISION (Rev. 12)
upgrades during the 2014-2015 cycle. Yet, while SCE estimates spending $10.34
million during 2014-2015, of which $7 million was to occur by year-end 2014, we
remain doubtful that SCE will implement funding at the full level requested,
particularly based on SCE’s past re-prioritization practices. As a way to quantify
our caution in this regard, we will approve funding for only $5.17 million,
representing 50% of the amount that SCE requests. In this manner, while we
provide some funding for a worthwhile program, we mitigate the risks that
ratepayers may be charged for funding programs that are not implemented as
planned.
While SCE is not barred from seeking recovery for projects for which
funding was previously authorized in prior rate cases, SCE must provide a
satisfactory justification of why funds that were previously authorized, but not
spent for the authorized purpose, should be authorized yet again. Our approval
of a reduced budget in this regard reflects our caution in the face of SCE’s past
spending patterns, while recognizing the importance of implementing the garage
infrastructure upgrades over time.
Service Center Infrastructure Upgrade12.5.5.11.
SCE requests $20.679 million over the 2014-2015 period for SCE’s Service
Center Infrastructure Upgrade program to address operational and asset
preservation needs at SCE’s Service Centers. SCE claims that severe and pressing
needs exist at eight of its Service Centers (including, overcrowded workspaces at
Bishop, Kernville, Ridgecrest, San Joaquin, and Fullerton Services Centers and
inadequate parking, garage, storage and vehicle circulation space at all of the
covered Service Centers).828
828 SCE OB at 268-269.
- 312 -

A.13-11-003 ALJ/KD1/ar9/jt2/lil PROPOSED DECISION (Rev. 12)
TURN acknowledges the need to modernize and upgrade the Service
Centers, but recommends $3.5 million per year from 2014-2015, representing a
$13.62 million reduction of SCE’s forecast. TURN’s recommendation relies on
SCE’s request for funding in prior GRCs and challenges SCE’s presentation of
FCI scores, noting that SCE’s direct testimony relied on a preliminary report and
that most FCI scores were lower (better) in the final Parsons report. TURN
argues that a denial of any funding increase would be appropriate given the track
record SCE achieved in the 2009 and 2012 GRCs.829
SCE argues that its prior request for funding for projects in past GRCs does
not bar a request for funding in future rate cases where the funds were used to
cover other, emerging capital needs. SCE argues that failure to move forward
with this project will hasten deterioration of the Service Centers and risks the
need for higher funding to address repair and replacement costs.830
We adopt TURN’s recommended reductions in spending based on SCE’s
past patterns of redirecting funds that were previously authorized.
To address concerns about its commitment to the project, SCE noted that
planning and permitting for work at the Bishop, Kernville, Redlands, Ontario,
and Ridgecrest Service Centers has already commenced, and currently projects
spending approximately $23 million.831 Nonetheless, based on its past patterns of
redirecting approved funding, we question whether SCE will actually spend the
entire amount it is requesting. As TURN observes, SCE sought and received in
excess of $100 million cumulatively in the 2009 and 2012 GRCs for the same type
of work SCE claims is now essential, yet SCE spent zero during the 2009 GRC
cycle and $650,000 in 2013.
829 TURN 8 at 26-28.830 SCE-24V3 at 44-46.831 SCE-24V3 at 45.
- 313 -

A.13-11-003 ALJ/KD1/ar9/jt2/lil PROPOSED DECISION (Rev. 12)
We acknowledge the need to maintain deteriorating service center facilities
over time. The average age of the service centers under SCE’s program is 51
years old. Both SCE work methods and the surrounding communities have seen
significant changes since they were originally constructed. SCE claims the
average FCI scores for the designated Service Centers shows them to be in fair to
poor condition. We question SCE’s claims regarding the condition of its service
center facilities, however, given the changes in the reported FCI scores over time.
SCE reported “preliminary” FCI scores for eight of its service centers in direct
testimony. The final scores for all but one of the eight facilities improved,
illustrating that condition of the service centers was better than SCE had
originally contended. Using the final FCI scores and the consultant’s grading
scale, all of the scored service centers are currently in “fair” condition except for
Bishop and San Joaquin.
IT Equipment & Infrastructure Blanket12.5.5.12.
SCE requests $5.646 million in 2014 and $7.684 million in 2015 for the IT
Infrastructure and Equipment Blanket, which includes equipment such as fiber
installations, SONET terminals, router cores, racks, cable and fiber trays,
radio/cellular/phone/voice over internet protocol systems. This cost was
historically accounted for in previous GRCs as a component within each CRE
capital project, and the expenditures remain an essential component to support
the efficient use of SCE’s non-electric facilities.832
Neither ORA nor TURN question the need of the project, but both
recommend no funding based on SCE’s submission of testimony in April 2014,
after the GRC Application was filed. TURN also submits an alternative proposal,
832 SCE OB at 269-270.
- 314 -

A.13-11-003 ALJ/KD1/ar9/jt2/lil PROPOSED DECISION (Rev. 12)
which removes four CRE projects with high IT spend to calculate a modified
forecast of $3.257 million in 2014 and $3.213 million in 2015.
As detailed in SCE’s data requests and prepared testimony, SCE
inadvertently left out references to the telecom portion of project costs in various
exhibits, including this project. To address this omission, SCE submitted
supplemental testimony to its initial showing as part of Exhibit SCE-14. SCE
argues that it submitted the testimony at the earliest feasible date, and did not
contravene the Scoping Memo’s direction that parties make their case in direct
testimony and pleadings rather than in rebuttal or during hearings. During the
July 18, 2014 Status Conference, SCE was granted the opportunity to submit
additional testimony concerning the telecom projects and ORA and intervenors
were granted the opportunity to submit responsive testimony. SCE thus argues
that the submission of supporting testimony for this project in April 2014 does
not justify denial of funding.833
TURN claims, in addition to its procedural objection, that SCE’s
supplemental exhibit (SCE-14) did not provide adequate justification for these
costs. TURN agrees with SCE’s basic logic in calculating the IT costs, but
recommends that additional IT-oriented projects be excluded from the
calculation (SCE excluded the Alhambra Data Center). TURN proposes to
exclude four more projects, each with a higher share of IT costs to total costs than
Alhambra Data Center. TURN calculates a 10% IT adder in this way, compared
to SCE’s 12%.834
SCE argues that the four CRE projects TURN proposes to exclude from its
modified forecast are very similar in scope and size to projects that SCE will carry
out in this rate case period and are appropriate to include in the calculation. For
833 SCE-24V3 at 47, SCE-17. 834 TURN-8 at 5-8.
- 315 -
A.13-11-003 ALJ/KD1/ar9/jt2/lil PROPOSED DECISION (Rev. 12)
example, SCE contends that the interim EOC’s IT spend is likely very
representative of the permanent EOC which we approve in Section 12.5.5.2
above. Further, SCE already removed (1) the CRE project with the largest
volume of IT-related expenditures (the Alhambra Data Center project), (2) CRE
blanket programs with little or no projected IT expenditures, and (3) CRE projects
under $1 million, from its 2014-2015 forecast to provide the most accurate
estimate of IT-related expenditures needed for CRE projects. SCE thus requests
that the Commission approve SCE’s forecasts of $5.646 million in 2014 and $7.684
million in 2015 for the IT Infrastructure and Equipment Blanket.835
We adopt SCE’s proposed 12% IT adder, and apply this adder to our
adopted, adjusted forecasts for the same projects as SCE. SCE’s explanation that
the IT spend for the projects it used to calculate the adder are representative of
the projects it requests in this GRC is reasonable.
Corporate Communications Media Center12.5.5.13.
SCE seeks to include in its 2014 capital forecast for CRE $1.0 million for a
corporate communications media center constructed at its General Office
facilities in Rosemead. SCE claims the conversion of existing office space into a
media center is necessary to improve SCE’s public communications efforts,
including emergency response activities. TURN recommends denying rate
recovery of such costs, as a new media center for the utility is neither a necessary
nor prudent use of ratepayer funds.
SCE claims customer benefits related to timely information, including in
the case of actual or potential emergencies and that a dedicated facility to
expeditiously generate and disseminate public video communications is needed.
This project provides a secure environment to hold and film press conferences
835 SCE-24V3 at 48-49 and SCE OB at 270-271.
- 316 -
A.13-11-003 ALJ/KD1/ar9/jt2/lil PROPOSED DECISION (Rev. 12)
and briefings and mitigates safety and security concerns with the existing
publicly accessible site exposed to varying levels of street traffic and weather and
lighting conditions. The project has completed the planning and permitting
phase and is under construction and slated for completion in 2015.836
TURN claims that SCE failed to demonstrate that a new media center is
necessary to providing electric service or some other clear benefit to its
customers. TURN notes that SCE has not held many press conferences in recent
years, ranging from one in 2010 to eleven in 2011 and that SCE does not track
attendance. TURN also observes that in some instances, SCE communicates with
the press at the site of an event (e.g., outage). Furthermore, TURN claims, SCE
has not demonstrated that its media or public outreach efforts in recent years
have unduly suffered due to the absence of such a media center.837
SCE contends the media center is needed because currently press
conferences are held on sidewalks and there is increased demand for faster
communication.838
We find that SCE has not justified this expenditure. We agree with SCE’s
premise that timely communications with customers and the public is
increasingly important; however SCE presents no evidence that video
communications are specifically necessary in lieu of simpler forms, e.g., written
communications. Further, as TURN points out, SCE simply has not
demonstrated that it needs to hold enough press conferences to justify this
expenditure. We reject SCE’s request.
836 SCE-24V3 at 22, SCE OB at 271.837 TURN-8 at 8-9.838 SCE-24V3 at 23.
- 317 -

A.13-11-003 ALJ/KD1/ar9/jt2/lil PROPOSED DECISION (Rev. 12)
External Relations13.
External relations includes several departments and a variety of activities.
Our adopted forecast is summarized below (millions of 2012$).
Department Activity Account(s) SCE Adopted
CorporateCommunications
A&G 920/921 Total $ 7.543 $ 7.314
Labor $ 5.739 $ 5.565
Non-Labor
$ 1.804 $ 1.749
Measurement andEthnic MediaServices
923 Non-Labor
$ 0.847 $ 0.847
CommunicationsProducts
930 Non-Labor
$ 11.269 $ 7.339
Corporate Membership Dues and Fees 930.2 Non-Labor
$ 1.796 $ 1.177
Integrated Planning& EnvironmentalAffairs
Integrated Planning 557 Total $ 6.227 $ 6.227
Labor $ 5.244 $ 5.244
Non-Labor
$ 0.983 $ 0.983
Generation Planning 549 Total $ 6.303 $ 3.909
Labor $ 1.320 $ 1.320
Non-Labor
$ 4.983 $ 2.589
A&G 920/921 Total $ 2.990 $ 2.971
Labor $ 1.840 $ 1.840
Non-Labor
$ 1.150 $ 1.131
Regulatory Operations and RP&A 920/921 Total $ 16.283 $ 16.283
Labor $ 14.139 $ 14.139
Non-Labor
$ 2.144 $ 2.144
Local Public Affairs A&G 920/921 Total $ 13.207 $ 12.784
Labor $ 11.072 $ 10.957
Non-Labor
$ 2.135 $ 1.827
Business License Tax 408 Non-Labor
$ 0.585 $ 0.575
Transportation Electrification 588 Total $ 5.595 $ 5.595
Total $ 72.645 $ 65.021
- 318 -

A.13-11-003 ALJ/KD1/ar9/jt2/lil PROPOSED DECISION (Rev. 12)
Corporate Communications13.1.
SCE contends that providing timely information to customers and other
stakeholders is critical. Further, its Public Safety Around Electricity Campaign is
an important initiative that has successfully increased awareness.
ORA generally contends that SCE’s requested increase is too large (94.1%)
relative to 2012 recorded, duplicative of other programs, uncoordinated, and not
limited to programs with ratepayer benefits. ORA proposes a smaller (39.6%)
increase.839
Administrative and General (A&G) (Account 920/921)13.1.1.
SCE forecasts $7.543 million of TY 2012 expenses in Account 920/921 for its
Corporate Communications Department, which is $1.311 million less than 2012
recorded levels. SCE’s forecast was developed by removing $0.715 million in
OpX savings and $0.910 million for the permanent shutdown of SONGS from the
2012 recorded amount, and adding incremental labor and non-labor expenses of:
(a) $0.229 million to support the Summer Readiness Energy Conservation
Campaign and the Public Safety Around Electricity Campaign; and (b) $0.230
million for social media management tools.840
ORA forecasts $4.871 million for this account, a $2.672 million reduction,
based on using “the total authorized level of $13,928,000 from TY 2012 and
reallocating it using relative shares of SCE’s 2013 subaccount forecasts.” ORA
argues that SCE spent less than authorized in 2012 and that SCE’s forecast may
not be reliable.841
SCE claims that ORA’s recommendation is unreasonable, as it does not
take into account SCE’s recorded dollars in each of the FERC Accounts or any TY
839 ORA-21 at 6.840 SCE-25 at 2.841 ORA-21 at 7-8.
- 319 -
A.13-11-003 ALJ/KD1/ar9/jt2/lil PROPOSED DECISION (Rev. 12)
2015 adjustments SCE made in each of the accounts. ORA does not explain why
it used SCE’s 2012 authorized amount and how it re-allocated the amount to
various FERC accounts. SCE contends its method follows Commission
precedent.842
ORA responds that it is SCE’s method that is unreasonable, as it relies on
older, generic Commission decisions, rather than on the most recent decision in
SCE’s TY 2012 GRC. In its decision in SCE’s last GRC, ORA argues, the
Commission expressed concern that SCE had not used effectively the ratepayer
funding it already received when confronted with the 2011 Windstorm.843
To develop its forecast, SCE claims it followed Commission guidance on
forecasting methodology and described why it chose a certain forecasting
methodology in each of the accounts. SCE’s labor forecast in FERC Account
920/921, for example, is less than all recorded years since 2008.844
We find SCE’s approach of using 2012 recorded as a baseline reasonable
because it is consistent with our past guidance. We review SCE’s proposed
adjustments as follows: OpX is reasonable and discussed in Section 27 below, the
SONGS adjustment is uncontested and is reasonable, we deny the expenses
associated with the advertising campaigns (see Section 13.1.3 below), and we
approve the uncontested social media management expenses. Our adopted
forecast is $7.314 million (2012$).
Communication Measurement and Ethnic Media13.1.2.Services (Account 923)
SCE forecasts $0.847 million for FERC Account 923 for communication
measurement and ethnic media services. SCE’s forecast is uncontested,
reasonable, and approved.
842 SCE-25 at 3.843 ORA OB at 341.844 SCE OB at 273.
- 320 -

A.13-11-003 ALJ/KD1/ar9/jt2/lil PROPOSED DECISION (Rev. 12)
Communications Products (Account 930)13.1.3.
SCE forecasts $11.269 million for TY 2015 expenses in FERC Account 930
based on a 5YA ($0.698 million) and the following incremental expenses: (a)
$8.210 million to conduct the new Public Safety Around Electricity Education
Campaign, (b) $2.331 million for the new Summer Readiness Energy
Conservation Campaign, and (c) $0.030 million for SCE’s Corporate
Responsibility Report.845
ORA’s forecast for this account is $6.220 million, a reduction of $5.049
million. TURN’s forecast is $7.067 million for this account, a reduction of $4.202
million. 846 As noted above, ORA bases its forecast on 2012 authorized
reallocated based on 2013 forecast.847
We adopt TURN’s forecast for this account, except for the baseline amount,
for a total forecast of $7.339 million, as discussed and summarized below
(millions of 2012$).
SCE Adopted
Baseline $ 0.698 $ 0.698
Public Safety Around Electricity $ 8.210 $ 6.641
Summer Readiness $ 2.331 $ -
Corporate Responsibility Report $ 0.030 $ -
Total $ 11.269 $ 7.339
Baseline13.1.3.1.
TURN recommends a baseline based on 2012 recorded, due to a claimed
steady decline in costs and to account for a recent reorganization. TURN views
the variation as driven by the safety education component, while the annual
845 SCE-9 at 23.846 SCE OB at 274.847 ORA-21.
- 321 -

A.13-11-003 ALJ/KD1/ar9/jt2/lil PROPOSED DECISION (Rev. 12)
report costs have been declining. The reorganization moved some costs to the
Customer Service OU.848
SCE responds that there is no double counting due to the reorganization –
this has been corrected in adjustments to recorded costs. SCE claims that the
5YA is appropriate because costs have fluctuated, with a relatively high cost in
2010. SCE notes that annual report is only a third of the account, and should not
be an overriding consideration.849
We agree with SCE that a 5YA is a reasonable baseline. SCE’s explanation
of the adjustments due to reorganization is reasonable, and the education
expenses outweigh the decline in annual report costs.
Public Safety Around Electricity13.1.3.2.Education Campaign
SCE has been producing advertisements on this theme since 2008 in its
general advertising activities, funded by shareholders. SCE is increasing the
focus of this campaign on safety and advertisements directed toward ratepayers.
This is the first GRC that SCE has made this request. SCE claims this campaign
had significant impacts on awareness during 2012. SCE cites its 1974 GRC
(D.86794, page 51) as precedent that safety advertising may be included in
rates.850
ORA opposes funding of this Campaign for a few reasons. First, claiming
that the Campaign was fully funded in SCE’s 2012 GRC. ORA also argues that
this program is myopic and inconsistent with the “routine advance planning”
848 TURN-5 at 75-76.849 SCE-25 at 5-6.850 SCE-9 at 23-25.
- 322 -

A.13-11-003 ALJ/KD1/ar9/jt2/lil PROPOSED DECISION (Rev. 12)
approach discussed in the 2012 GRC.851 Finally, ORA appears to suggest that this
campaign is “institutional advertising,” appropriately funded by shareholders.852
SCE argues that the Public Safety Around Electricity Education Campaign
is targeted toward safety and not improving corporate image, although
enhancing its reputation and image may be an indirect result of the campaign.
Its primary objective and the success measure is purely related to increasing
customer awareness of how to be safe around electricity. SCE provided
testimony and workpapers with various examples of safety advertisements
produced as a result of this Campaign.
SCE denies that its safety programs are driven by a single event. For
example, SCE’s public safety education programs, including the electric safety for
tree-trimmers, have been around for years. The Public Safety Around Electricity
Education Campaign was implemented before the 2011 windstorm occurred. A
series of events, including third-party contacts with power lines, led SCE to focus
on providing safety messages to the public.853
TURN recommends a reduction of $1.569 million for SCE’s Public Safety
Around Electricity Education Campaign. TURN recommends the use of 2012
recorded costs amount which is $6.641 million.
TURN claims that SCE has not clearly identified a rationale for forecasting
significant cost increases in this program beyond the 2012 level, when it evolved
into its current form as a “comprehensive, mass-market campaign for residential
and business customers with attention paid to both general and ethnic
audiences.” In 2012, SCE seems to have performed all of the same kinds of
activities that it forecasts for the test year, according to TURN. SCE developed
851 D.12-11-051 at 319.852 ORA-21 at 6-10.853 SCE-25 at 10, SCE OB at 277.
- 323 -
A.13-11-003 ALJ/KD1/ar9/jt2/lil PROPOSED DECISION (Rev. 12)
new safety ads, conducted customer research and focus groups to test new ads,
and bought media placement. SCE indicates that it plans to expand the use of
in-language advertising to reach and interact more effectively with its diverse
customer base, such as by adding more Asian in language media buys in 2013
and reaching into more rural areas. TURN submits that these efforts will likely
increase costs for media buys relative to 2012 in the test year, according to SCE,
while at the same time, creative and production costs will be lower in 2015 than
in 2012. SCE intends to incur the creative and production costs of new safety ads
only every other year, in 2014 and 2016, but not in 2015. TURN recommends
reducing the forecast for this program claiming that SCE offers insufficient
identifiable outcomes (i.e., likelihood of fewer safety issues) for spending $8.2
million in 2015, which is more than a 23% increase over the 2012 spending
level.854
SCE claims that TURN erroneously assumes that “[in] 2012-2013, Edison
seems to have performed all of the same kinds of activities that it forecasts for the
test year” and that SCE’s new media buys “offer no identifiable outcomes (i.e.,
likelihood of fewer safety issues) for spending $8.2 million on this program.”
SCE claims that TURN ignores new work needed in 2014 and 2015 to
continue this Public Safety Advertisement Campaign, including new media buys
to reach more customers and special audiences (seniors, low-income and the
disabled) and to prevent the wear-out factor. SCE was able to increase public
awareness from 34 to 47 percent from 2011-2012.
SCE opposes TURN’s request for proof that dollars spent on this campaign
would lead to a “likelihood of fewer safety issues.” SCE argues that many
safety-related programs are not suited for cost-benefit analysis, as it is impossible
854 TURN-5 and TURN-5A at 76-77; TURN OB at 207-208.
- 324 -
A.13-11-003 ALJ/KD1/ar9/jt2/lil PROPOSED DECISION (Rev. 12)
to track safety-related incidents yet to occur or to quantify actual and direct
benefits.855
We adopt TURN’s recommendation to reduce the forecast for this program
by $1.569 million, and thereby limit ratepayer funding to 2012 levels of $6.641
million. SCE has demonstrated significant progress at current funding levels,
and has not clearly identified marginal ratepayer benefits from further funding.
Summer Readiness Energy Conservation13.1.3.3.Advertising Campaign
SCE claims this program was motivated by concern about energy
shortages during the summer of 2012 and was launched that April. It achieved
447 million impressions in 2012 of messages on how and why to save energy.
This is the first time it has been included in a GRC request. SCE claims its costs
are recoverable in rates as “specific conservation advertising.” SCE’s $2.331
million forecast is based on 2012 recorded.856
ORA opposes ratepayer funding of this program as duplicative of other
Demand Response (DR) programs.857 TURN agrees.858
SCE disputes the claim that that the Summer Readiness Energy
Conservation Campaign duplicates existing DR programs. The DR advertising
focuses on enrollment in specific conservation programs, such as the Summer
Discount Plan, while the Summer Readiness Energy Conservation Campaign
focuses on a broader effort with a long-term goal of affecting attitudes and
behaviors of customers around energy conservation, particularly during hot
summer months. The Commission has allowed these specific energy
conservation advertising expenses to be recovered in rates. SCE claims that its
855 SCE OB.856 SCE-9 at 28-30. 857 ORA-21 at 8.858 TURN-5 at 73-74.
- 325 -

A.13-11-003 ALJ/KD1/ar9/jt2/lil PROPOSED DECISION (Rev. 12)
Summer Readiness Energy Conservation Campaign provides “specific, useful
information about energy conservation” and “can be of great use to individual
customers and can reduce costs for the system as a whole.”859
ORA notes that SCE underspent its Corporate Communications
authorization in 2012, implying that ratepayers effectively funded this campaign
in that year, not shareholders. Further, ORA contends that SCE misses the
relevance of DR programs to a conservation program like Summer Readiness.
ORA claims that this campaign duplicates goals of emergency alerts issued by
the California Independent System Operator. Finally, ORA notes that SCE’s
direct testimony listed one of the goals of the campaign as increasing enrollment
in DR programs.860
We agree with ORA and TURN that SCE has not demonstrated that this
campaign complements rather than duplicates other programs. In particular, we
note that the goals include increasing DR enrollment. Therefore, we exclude it
from our forecast for Account 930.
Corporate Responsibility Report13.1.3.4.
SCE proposes to add $0.030 million for this report to explain actions on
safety, environment, and ethics.861 ORA claims the report is “institutional
advertising” and should not be funded in rates.862 TURN agrees.863 SCE
responds that the report provides important information to customers.864 We
agree with TURN and ORA and exclude this cost from our forecast.
859 SCE-25 at 13.860 ORA OB at 342-344, citing SCE-9 at 28.861 SCE-9 at 30. 862 ORA-21 at 9.863 TURN-5 at 77.864 SCE-25 at 14.
- 326 -

A.13-11-003 ALJ/KD1/ar9/jt2/lil PROPOSED DECISION (Rev. 12)
Corporate Membership Dues & Fees (Account 930.2)13.2.
SCE is requesting $1.796 million for Corporate Membership Dues and Fees
in Account 930.2, based on 2012 recorded expenses.865 ORA stipulates to SCE’s
forecast.866
TURN proposed an adjustment of $1.745 million to charge shareholders,
rather than ratepayers, for dues that TURN claims are political in nature and thus
inappropriately assigned to ratepayers. SCE has revised its forecast for External
Relations – Account 930 downward by $220,000 after accepting two of TURN’s
five adjustments, removing all expenses for the California Foundation on the
Environment and the Economy ($90,000) and the Business Roundtable ($129,800).
Thus, the remaining membership dues contested by TURN is $1.619 million for
dues and memberships. TURN contends that other politically oriented dues and
donations are contained in the CEO’s office and environmental areas.867
Three issues remain in dispute between TURN and SCE: dues and/or
donations paid to (1) Edison Electric Institute (EEI), (2) CCEEB, and (3) the Civil
Justice Association of California.
SCE’s forecast includes $1.462 million in Account 930 for EEI corporate
membership dues, which reflects a reduction from the full amount of dues of
$1.922 million. SCE claims this reduction removes dues identified by EEI
associated with Lobbying, Public and Media Relations, Advertising, and
Marketing, using the National Association of Regulatory Utility Commissioners
(NARUC) definitions for these activities.
TURN recommends additional disallowances. First, TURN claims that
SCE has not removed all of the NARUC categories that the Commission
865 SCE OB at 278.866 ORA-57R.867 TURN OB at 210.
- 327 -
A.13-11-003 ALJ/KD1/ar9/jt2/lil PROPOSED DECISION (Rev. 12)
previously identified as inappropriate for ratepayer funding because of their
inherently political nature. Second, TURN claims that EEI recently waged an
aggressive campaign in Arizona against net energy metering for distributed solar
photovoltaic energy (solar PV), and SCE has not demonstrated that EEI dues to
be recovered from California ratepayers exclude these or similar activities.
Since 2013, EEI has undertaken several activities in support of this
campaign. TURN argues that if SCE is willing to fund EEI’s efforts to fend off
distributed PV through intervention in out-of-state utility regulatory proceedings
and television advertising (including prime spots like during NFL games), then
SCE’s shareholders alone should fund those activities.
SCE claims that the evidence TURN uses to support its argument that EEI
embarked on a political advertisement campaign in Arizona consists of
advertising materials or newspaper articles. SCE claims there is no evidence that
the invoices produced by EEI on its advertising expenses are false or that
California customer dollars were used in a campaign in Arizona. While EEI did
run a TV ad in Arizona, SCE claims the ad was in limited markets for a limited
time.
The percentage of dues used for Lobbying, Public and Media Relations,
Advertising, and Marketing was 20.5% in 2013, less than the 21.2% in 2012.
Based on Commission feedback from SCE’s 2012 GRC, SCE took steps in this
GRC to obtain documentation from EEI to determine an appropriate
shareholder-versus-ratepayer split of EEI member dues. SCE claims that its
forecast accurately accounts for the percentage of dues to EEI applicable to
lobbying and other expenses that should be funded by shareholders.
In D.14-08-032, in PG&E’s 2014 GRC, we adopted TURN’s methodology
for calculating an EEI disallowance, which removed costs in the following
- 328 -

A.13-11-003 ALJ/KD1/ar9/jt2/lil PROPOSED DECISION (Rev. 12)
NARUC categories: Legislative Advocacy, Legislative Policy Research,
Regulatory Advocacy, Advertising, Marketing, and Public Relations. As
explained in D.14-08-032, “We conclude that TURN’s analysis and proposed
allocation reasonably reflects the categories of disallowable EEI dues that offer no
ratepayer benefits.” The full list of NARUC cost categories includes the
following: (1) Legislative Advocacy, (2) Legislative Policy Research, (3)
Regulatory Advocacy, (4) Regulatory Policy Research, (5) Advertising, (6)
Marketing, (7) Utility Operations and Engineering, (8) Finance, Legal, Planning,
and Customer Service, (9) Public Relations, (10) General and Administrative, and
(11) Overhead.
SCE claims that the “methodology adopted by the Commission in
D.14-08-032 is the same methodology followed by SCE in its TY 2015 forecast.”
SCE removed costs labeled: “Lobbying,” plus “Advertising, Marketing, and
Public and Media Relations.” SCE’s claim that it followed the Commission’s
holding in D.14-08-032 can only be true if the category of “Lobbying” includes
the following three NARUC categories, all of which the Commission excluded:
(1) Legislative Advocacy, (2) Legislative Policy Research, and (3) Regulatory
Advocacy. SCE has not demonstrated that this is in fact the case.
While the definitions of the NARUC category “Legislative Advocacy” and
the “Lobbying” category excluded by SCE are not precisely identical, they are
similar, creating a strong presumption that SCE’s “Lobbying” category is
equivalent to the NARUC “Legislative Advocacy” category. In contrast, the
NARUC category “Legislative Policy Research” is wholly distinct; “This account
… shall not include costs for legislative advocacy.” “Regulatory Advocacy” is
also clearly distinguishable from the activities subsumed in the meaning of
“Lobbying.”
- 329 -

A.13-11-003 ALJ/KD1/ar9/jt2/lil PROPOSED DECISION (Rev. 12)
TURN contends that that SCE has partially followed the Commission’s
methodology in D.14-08-032, but not entirely. SCE did not remove two of the
NARUC categories excluded in D14-08-032: “Legislative Policy Research” and
“Regulatory Advocacy.”
We agree with TURN that SCE has not shown that it has removed all
political or lobbying costs from its forecast. However, we decline to follow
TURN’s recommendation to deny recovery of EEI dues outright. SCE ratepayers
do receive some valuable benefits through EEI, including information and
mutual assistance. Accordingly, we reduce SCE’s forecast to $1.000 million to
account for these benefits without unnecessarily contributing to EEI political
activities.
TURN also contests SCE’s dues to the California Council for
Environmental and Economic Balance (CCEEB) ($0.117 million) and Civil Justice
Association of California ($0.040). TURN contends that both of these
organizations are involved in political and/or lobbying activities. We disallowed
costs for CCEEB in PG&E’s most recent GRC868 and do so again here. SCE does
not contest TURN’s characterization of the Civil Justice Association of California.
Accordingly, we reject funding for both organizations. Our total forecast for
Account 930.2 is $1.177 million.
Integrated Planning & Environmental Affairs (IP&EA)13.3.
IP&EA was formed in 2012 to promote reliable and sustainable electric
infrastructure. SCE forecasts $10.654 million for labor expenses and $10.461
million for non-labor.869
868 D.14-08-032 at 566.869 SCE-9.
- 330 -

A.13-11-003 ALJ/KD1/ar9/jt2/lil PROPOSED DECISION (Rev. 12)
Account 55713.3.1.
For TY 2015, SCE estimates a total of $6.227 million for groups in
Integrated Planning that record labor and non-labor expenses to FERC Account
557. ORA recommends no reduction to this account, and TURN’s arguments
related to name and logo are addressed in Section 28 below. SCE’s forecast is
adopted.
Generation Planning (Account 549)13.3.2.
SCE forecasts $6.303 million for FERC Account 549 in TY 2015 to fund
currently authorized Generation Planning activities. ORA recommends $1.627
million for SCE’s non-labor expense, a reduction of $3.356 million.870
SCE forecasts activities including: finding locations for generation,
technology evaluation, tracking initiatives, etc. SCE’s labor forecast is based on
2012 recorded, based on subtracting forecast labor from total 2012 authorized.
SCE proposes to continue recording non-labor costs related to the PDD in
the Project Development Division Memorandum Account (PDDMA) for later
reasonableness review in an ERRA proceeding. SCE proposes to include labor
costs in rates through this GRC, and track only non-labor costs in PDDMA.871
ORA accepts SCE’s labor forecast, but contends SCE’s non-labor forecast is
unreasonable and does not reflect current balances authorized for rate recovery.
ORA’s forecast is based on 2012 recorded.872
SCE disputes ORA’s argument that “this account should not contain
unaudited amounts from previous test years without SCE showing that tracked
expenses are associated only with authorized support functions.“ The non-labor
expenses are reviewed in the annual ERRA review proceedings, which consist of
870 SCE OB at 279.871 SCE-9 at 58-61.872 ORA-21 at 12-13.
- 331 -
A.13-11-003 ALJ/KD1/ar9/jt2/lil PROPOSED DECISION (Rev. 12)
an audit performed by ORA, to verify that Generation Planning’s non-labor
expenses are only for authorized support functions as directed by the
Commission. Because the non-labor expenses remain in a PDDMA
memorandum account, the customers will only pay for actually incurred
expenses which are subject to the reasonableness review in ERRA. SCE is using
the same forecasting methodology for this FERC Account, which has been
approved by the Commission for several rate cases, that is, the TY 2015 forecast
was based on escalating the TY 2012 authorized amount.873
While we agree with SCE that the ERRA process mitigates the risk to
ratepayers in this area, we also agree with ORA that it is reasonable to undertake
a periodic review of the amount, notwithstanding its review in the PDDMA.
SCE’s recorded data shows that it has not approached SCE’s forecast level in any
year in the recorded period, either for the total or non-labor specifically. SCE’s
analysis does not support an increase in non-labor costs at this time. Non-labor
expenses have fluctuated over the five recorded years, and we adopt a 5YA of
$2.589 million for non-labor. We adopt SCE’s uncontested labor forecast and
request to modify PDDMA.
A&G (Accounts 9210/921)13.3.3.
SCE forecasts $2.990 million for IP&EA FERC Account 920/921. ORA does
not contest SCE’s forecast in this FERC account. TURN recommends disallowing
dues paid by SCE to the CCEEB of $0.019 million from SCE’s non-labor expense
forecast. As discussed in Section 13.2 above, we adopt TURN’s related proposed
related reduction and also adopt this small reduction. The remainder of SCE’s
forecast is uncontested and is approved.
873 SCE-25 at 24.
- 332 -

A.13-11-003 ALJ/KD1/ar9/jt2/lil PROPOSED DECISION (Rev. 12)
Regulatory Operations and Regulatory13.4.Policy & Affairs (RP&A) (Account 920/921)
SCE forecasts $16.283 million of TY 2015 expenses for its Regulatory
Operations and Regulatory Policy and Affairs Department (RP&A) in FERC
Accounts 920/921, an increase of $0.993 million over 2012 recorded-adjusted
levels. The increase is primarily due to increased staffing required to meet the
growth in NERC regulatory compliance activities and regulatory activities in
RP&A. RP&A’s labor forecast of $14.139 million includes the addition of five
new positions added in the NERC Compliance group and 3 new positions added
in RP&A. RP&A also forecast $2.144 million for non-labor expenses associated
with the eight new incremental positions.874
ORA accepts SCE’s forecasts for Regulatory Operations and RP&A’s labor
and non-labor expenses for TY 2015.875
TURN originally recommended a forecast of $14.823 million, a reduction of
$1.638 million to SCE’s request. However, upon review of SCE’s rebuttal
testimony, TURN now recommends $16.155 million, proposing that the
Commission make two more modest adjustments than TURN originally
proposed, totaling $306,000.
First, TURN contends that a 5YA base for non-labor inappropriately
includes non-recurring costs from early NERC compliance efforts that are now
done by SCE staff. TURN argues that consistency between the labor and
non-labor forecasts would eliminate the double counting it sees. TURN
recommends a 3YA for non-labor.
874 SCE OB at 280-281.875 ORA-57R.
- 333 -

A.13-11-003 ALJ/KD1/ar9/jt2/lil PROPOSED DECISION (Rev. 12)
Second, TURN proposes to adjust the labor forecast based on the new
employees actually hired in 2013 rather than the forecast.876 SCE explains that
this second reduction is included in SCE’s rebuttal forecast.877
Thus SCE’s revised labor forecast is undisputed, and we find it reasonable.
TURN’s first recommendation does not consider or respond to SCE’s explanation
that there were not non-recurring costs in the first years of the recorded period.
Instead, SCE explains, these apparent costs were the result of an accounting
change and actually represent normal costs, not one-time NERC costs.878 SCE’s
explanation is reasonable, and we find SCE’s non-labor forecast reasonable.
Local Public Affairs (LPA)13.5.
A&G (Accounts 920/921)13.5.1.
For TY 2015, SCE forecasts $13.207 million for LPA, an increase of $0.836
million over 2012 recorded and adjusted amount. The increase is primarily due
to filling four vacant positions and adding four additional positions in LPA to
support the increased workload relating to public safety education, emergency
readiness and response, and infrastructure replacement.879
ORA agrees with SCE’s forecast for LPA.880
TURN makes three recommendations: 1) assign a higher portion of costs
to shareholders, 2) reject the labor increase associated with staffing increases, and
3) base non-labor on a 2012-2013 average. SCE partially accepted TURN’s first
recommendation in rebuttal.881
876 TURN OB at 221-222.877 SCE RB at 142, citing SCE-25 at 32.878 SCE-25 at 31-32.879 SCE OB at 282-283.880 ORA-57.881 TURN OB at 222-223.
- 334 -

A.13-11-003 ALJ/KD1/ar9/jt2/lil PROPOSED DECISION (Rev. 12)
SCE has accepted TURN’s recommendation to share some overhead costs
(e.g. vacation, supervision) between ratepayers and employees, but does not
accept TURN’s recommendation that training should be shared. SCE contends
that its time-tracking study is consistent with our direction in the 2006 GRC. SCE
claims that training time is “mandated by corporate policy, training for
emergency readiness, and training about the transmission and distribution
system.” SCE cites a variety of examples of trainings and argues that these
trainings are essential for safety, emergency preparedness, and the ability to
communicate effectively with customers and stakeholders, and thus, should be
ratepayer funded.
Further, SCE explains that non-labor expenses are booked directly to
shareholder or ratepayer accounts, depending on the activity. Therefore, SCE
argues TURN’s proposal to apply a percentage from the labor forecast to allocate
non-labor costs to shareholders is unreasonable.882
TURN argues that, according to the time-tracking study, LPA staff spend
approximately one day per week in training and one day per week on
shareholder activities, on average. TURN submits that it is unreasonable to
conclude that none of this training supports the shareholder activities. Further,
TURN cites some of the topics addressed in training that, it contends, may
support shareholder activities.
For non-labor expenses, TURN expresses doubt that SCE’s approach is
“clear-cut and equitable” and recommends we split the difference between
TURN and SCE’s original positions, a $0.308 million reduction.883
We agree with TURN that SCE’s contention that all training is related to
ratepayer benefits to the point that shareholders should not share the costs
882 SCE-25 at 37-39.883 TURN OB at 224-225.
- 335 -

A.13-11-003 ALJ/KD1/ar9/jt2/lil PROPOSED DECISION (Rev. 12)
strains credulity, given the portions of time revealed in the study. Further, at
face value many of the topics can reasonably benefit shareholder activities as well
as ratepayer activities. SCE provides a reasonable calculation of these type of
general skill building trainings.884 Accordingly, we adopt an additional allocation
of training costs among shareholders and ratepayers according to SCE’s method.
Further, we adopt TURN’s proposed $0.308 million reduction to non-labor
expenses on the grounds that SCE has not met its burden of proof that its
approach is reasonable.
Next we address the proposed staffing increases. SCE contends that
TURN ignores the fact that it did actually fill the eight incremental positions in
2013 and that this increase is based on a need to support infrastructure projects.885
TURN responds that 2013 labor costs, including these new positions, is below
SCE’s forecast and contends this supports TURN’s lower forecast.886 We
disagree. TURN has not considered the full year cost impacts of these new
positions or substantively disputed the need for the positions. SCE’s gross labor
forecast is reasonable.
Finally, we address the non-labor forecast. SCE argues that 2013
unadjusted data should not be used, and therefore TURN’s forecast is
unreasonable.887 TURN argues that any outstanding adjustments are not
necessarily upward adjustments and may be de-minimis.888 We agree with SCE
that there has been a trend in recorded expenses and that therefore a gross
forecast based on LRY is reasonable.
884 SCE RB at 144-145.885 SCE-25 at 35-36. 886 TURN OB at 225-226.887 SCE-25A at 40.888 TURN OB at 227.
- 336 -

A.13-11-003 ALJ/KD1/ar9/jt2/lil PROPOSED DECISION (Rev. 12)
Business License Tax (BLT) (Account 408)13.5.2.
SCE forecasts $585,000 in BLT for TY 2015, a 5% annual increase over the
amount paid in 2012.889 ORA did not recommend any reductions.
TURN recommends a $24,000 reduction claiming that SCE’s 5% growth
rate is unsupported. TURN calculates a 2.78% growth rate; TURN claims new
BLT fees have also grown by about 3%.890
SCE contends TURN’s recommended reduction of $24,000 to the BLT
forecast failed to recognize new jurisdictions that added BLTs and omitted
$64,352 of new and recurring BLT payments from seven jurisdictions in 2013.891
We agree with TURN that SCE has not shown its 5% growth rate to be
reasonable, but also accept SCE’s point that other cities may begin to charge
BLTs. Accordingly, we adopt a forecast of $0.575 million.
Other Uncontested Issues13.6.
SCE’s forecast also includes a forecast of uncontested expenses for
transportation electrification These uncontested forecasts are approved.
Ratemaking14.
In this Section, we address certain ratemaking proposals that are not
addressed elsewhere.
Market Redesign and Technology Upgrade Memorandum14.1.Account (MRTUMA)
Resolution E-4087 authorized the MRTUMA. SCE proposes to recover its
2013 and 2014 capital forecast in this account, and then close the MRTUMA.
Earlier capital expenditures were reviewed in A.13-04-001.892 O&M expenditures
are approved in Section 6.1 above. ORA proposes reductions to SCE’s capital
889 SCE OB at 284.890 TURN-5 at 227. 891 SCE-25 at 41.892 SCE-10V1R1 at 33-34.
- 337 -

A.13-11-003 ALJ/KD1/ar9/jt2/lil PROPOSED DECISION (Rev. 12)
forecast based on the fact that those costs are recorded to this account.893 ORA
misunderstands the relation between ERRA and this proceeding.894 The ERRA
review ensures that the entries in MRTUMA are correct and consistent with other
Decisions; the GRC decision reviews and potentially approves the capital
forecast. SCE’s forecast and request to eliminate the MRTUMA are approved.
Residential Service Disconnection Memorandum Account14.2.(RSDMA)
ORA and SCE agree that the Commission should extend the RSDMA
through 2017 to record and track all costs associated with the new practices
resulting from R.10-02-005 and D.14-06-036.895 SCE states its intent to calculate
the final recorded 2014 uncollectible expense attributable to the Residential
Disconnection OIR and update the RSDMA in early 2015. SCE requests to
recover the final December 31, 2014 balance of RSDMA in rates by transferring
that balance to BRRBA for recovery through distribution rates. This transfer
would be implemented by the advice letter implementing this GRC decision.
SCE expects the final 2014 balance to be $17.775 million (nominal$), and provides
support for this forecast.896 No party contests SCE’s requests, and we find that
they are reasonable and are approved.
Edison SmartConnect Accounts14.3.
SCE proposes to eliminate the Edison SmartConnect Balancing Account
(ESCBA) and Edison SmartConnect Opt-Out Memorandum Account (SOMA).897
No party contests these changes. Recovery of costs recorded in these accounts is
893 ORA-14 at 52-54.894 SCE-26V1 at 7.895 SCE-73 at 11, ORA-13 at 50.896 SCE-73 at 11-16. 897 SCE-10V1R1 at 37-39.
- 338 -
A.13-11-003 ALJ/KD1/ar9/jt2/lil PROPOSED DECISION (Rev. 12)
addressed in Section 8 above and in other proceedings. SCE’s request to
eliminate these accounts is approved.
Jurisdictional Issues15.
SCE presents a method for developing factors to allocate total company
costs between CPUC and FERC jurisdiction based on D.04-07-022. SCE’s method
was accepted in D.12-11-051. SCE applies the resulting jurisdictional factors to
total system base-related revenue requirements for each year (2015-2017).898 ORA
accepts the method and resulting factors.899 SCE notes that two other ORA
witnesses make recommendations to reduce forecast costs on the basis of
jurisdiction and rebuts these arguments.900 We adopt SCE’s uncontested
jurisdictional allocation factors and address ORA’s specific proposed adjustments
in context of those issues.
Sales and Customer Forecast16.
SCE makes three separate but related forecasts: retail electricity sales,
customer accounts, and new meter connections; each of these forecasts is
composed of customer type or geographic subcategories. SCE, ORA, and TURN
each use econometric regression modeling techniques for these forecasts. The
most significant disagreement between the parties on this topic is the appropriate
method for forecasting new meter connections with SCE and TURN proposing
polynomial distributed lag (PDL) models and ORA proposing an Autoregressive
Integrated Moving Average (ARIMA) model. The primary explanatory variable
in the PDL models is housing starts, lagged from one to twelve months before the
month of the forecast.901
898 SCE-10V1R1 at 15-25. SCE reports the factors by FERC Account at SCE-10V1R1 at 21.899 ORA-2 at 8-9.900 SCE-26V1 at 30-33.901 SCE-10 V1R1 at 53, SCE-26 V1 at 34-36, SCE-66 at 1.
- 339 -

A.13-11-003 ALJ/KD1/ar9/jt2/lil PROPOSED DECISION (Rev. 12)
ORA criticizes SCE’s PDL model on the basis that its residual errors were
not likely to be random, white noise. ORA argues that the residuals of its
ARIMA model is much more likely to be the result of white noise, and that,
therefore, its model is more valid.902 SCE rejects ORA’s model, arguing that:
ORA’s model does not rely heavily enough on housing starts or maintain the
“intuitive” relation with that independent variable, that ARIMA is inappropriate
for long term forecasting, and that random residuals do not necessarily show that
one model is better than another.903 ORA claims that its model is valid and is
appropriate for forecasting the timespans involved by distinguishing its model
from the univariate models discussed in a textbook (Exhibit ORA-58) because its
model relies on housing starts. ORA also claims that SCE used models similar to
ORA’s in its 2012 GRC.904
We are not persuaded by ORA’s criticisms and find that SCE has
adequately justified that the PDL approach is valid. SCE’s demonstration that its
model outperforms ORA’s in an extended validation period and better maintains
the historical correlation between housing starts and new meter sets is
compelling.905
TURN accepts SCE’s basic model, updates it to the latest data, and makes
minor changes to the equations. TURN shows that SCE’s housing start and
residential meter set forecasts for 2013 and early 2014 were higher than actual
levels, and notes that SCE’s vendors’ housing forecasts had been revised
downward for 2014-2015. However, the level of new commercial meters was
slightly higher than forecast.906
902 ORA-3 at 6-7 and Appendix A.903 SCE-26 V1 at 34-36, 40; SCE-66 at 4-10.904 ORA OB at 357-358, ORA-58, ORA-59.905 SCE-66 at 8-10.906 TURN-05 at 43-48.
- 340 -

A.13-11-003 ALJ/KD1/ar9/jt2/lil PROPOSED DECISION (Rev. 12)
SCE argues that TURN’s update changes are unnecessary because the
housing market is likely to pick up during 2015-2017.907
We find that TURN’s forecast is most reasonable given its use of the most
recent available information on new meter sets and housing start forecasts by
SCE’s vendors. Therefore, we adopt TURN’s forecasts of new meters as shown
below.
No party disputes the number of Agricultural meters, and we adopt SCE’s
forecast for Agricultural meters.908
New Meter Connections
Residential Non-Residential Agricultural
# Requested # Adopted # Requested # Adopted # Adopted
2012 17,692 17,692 4,865 4,865 309
2013 27,758 21,841 5,114 5,252 316
2014 38,643 29,648 6,542 5,649909 332
2015 51,238 46,419 8,607 7,078 335
2016 56,320 57,101 10,698 9,527 339
2017 55,939 59,632 11,897 11,609 343
Applying this reduced meter forecast to SCE’s forecast of customers910
yields the following forecast,911 which we adopt:
907 SCE-26 V1 at 40-41.908 SCE-10 V1R1 at 61.909 We note that TURN-5 at 48 lists this value as “5,659,” but elsewhere in TURN-5 (e.g., pages
56-59), the number used is “5,649.” We apply the later value. 910 SCE-10 V1R1 at 61.911 This calculation reduces the growth rate in number of customers in each class by the percent
reduction in number of meters (i.e., approved customer growth rate = requested customer growth rate * (1-% reduction in meters)).
- 341 -

A.13-11-003 ALJ/KD1/ar9/jt2/lil PROPOSED DECISION (Rev. 12)
Year-End Customers by Customer Class
2012 2013 2014 2015 2016 2017
Residential4,321,17
14,338,65
14,360,14
94,393,22
54,434,82
14,479,17
0
Agricultural 21,917 21,851 21,790 21,737 21,690 21,648
Commercial 549,855 553,610 558,233 564,415 572,869 582,779
Industrial 10,922 10,645 10,449 10,257 9,995 9,684
PublicAuthorities 46,600 46,395 46,287 46,229 46,220 46,238
Total Customers4,950,46
54,971,15
14,996,90
75,035,86
35,085,59
55,139,51
9
Assuming that energy sales per customer are the same as in SCE’s retail
sales forecast,912 we calculate the following forecast of energy sales, based on the
above forecast of customers. We adopt this forecast:
Annual Retail Sales by Customer Class (GWh)
2012 2013 2014 2015 2016 2017
Residential30,56
329,30
329,11
829,49
329,89
630,26
6
Agricultural 1,609 1,422 1,415 1,428 1,449 1,469
Commercial40,54
140,80
641,10
941,71
842,26
842,58
3
Industrial 8,504 8,433 8,300 8,135 7,788 7,592
Public Authorities 5,263 4,875 4,667 4,675 4,663 4,568
Total Retail Sales86,48
084,84
084,60
885,44
986,06
486,47
9
Other Operating Revenue17.
OOR is the revenue that SCE collects from customers other than general
ratepayers; OOR reduces the general revenue requirement. In D.99-09-070, we
adopted a Gross Revenue Sharing Mechanism (GRSM) for NTP&S that divides
NTP&S revenues between shareholders and ratepayers. NTP&S is one
component of OOR. In the 2012 GRC, we expressed concern about the recording
and reporting of NTP&S “incremental costs” under the GRSM and noted that
related concerns had been discussed in several prior GRCs. However, we
912 SCE-10 V1R1 at 60.
- 342 -
A.13-11-003 ALJ/KD1/ar9/jt2/lil PROPOSED DECISION (Rev. 12)
concluded not to make any specific changes to the GRSM or SCE’s estimated
OOR in that decision, and instead stated that Energy Division’s next affiliated
transactions audit should include a detailed review of NTP&S.913
In this case, TURN raises the same concerns, estimating the consequence of
these issues as “many million dollars of O&M expense, and tens of millions of
dollars of inflated rate base.” TURN notes that at the time of its opening brief,
Energy Division’s affiliated transactions audit was not yet available.
Consequently, TURN recommends that we order SCE to obtain an independent
audit, in consultation with Energy Division, and bear the cost of this audit as an
incremental cost to NTP&S.914
SCE reviews several categories of OOR, the largest of which are $95.2
million of Other Electric Revenue in FERC Account 456 and $51.7 million of Rent
from Electric Property in Account 454. SCE notes that its forecast for NTP&S is
the $16.672 million threshold adopted in D.99-09-070.915 SCE’s total OOR
estimate is approximately $201 million in 2015. ORA stipulates to this amount.916
We find SCE’s undisputed forecast of total OOR reasonable and adopt it.
As in the last GRC, we do not have adequate information before us to draw
strong conclusions about the GRSM or SCE’s recording and reporting of NTP&S
incremental costs. However, we agree with TURN that it is appropriate to place
a higher priority on an audit of NTP&S. Therefore, if Energy Division has not
published an affiliated transactions audit that includes a focused review of
NTP&S by the end of 2015, SCE shall contract for an independent audit. SCE
shall consult with Energy Division in hiring the auditor, developing the scope of
work, and managing the audit. At a minimum, the audit shall review NTP&S
913 D.12-11-051 at 653-658. 914 TURN-1 at 24-27 and TURN OB at 228-230.915 SCE-10V1R1 at 81-87.916 ORA-57R.
- 343 -

A.13-11-003 ALJ/KD1/ar9/jt2/lil PROPOSED DECISION (Rev. 12)
incremental costs from 2012 to 2015. SCE shall include the results of this audit,
and/or the review from Energy Division’s affiliated transactions audit, in its next
GRC filing.
Cost Escalation18.
SCE developed escalation rates for several categories of labor, non-labor,
and capital expenses during the recorded (2008-2012) and forecast (2013-2017)
periods of this GRC. For many categories, SCE relies on data provided by IHS
Global Insight – Power Planner. SCE also includes information from union
contracts, Arizona Public Service, and the Handy-Whitman Index of Public
Utility Costs for some categories.917 ORA supports SCE’s approach, and
recommends using updated data.918 SCE provided updated escalation
information during the update phase of the proceeding.919
No party contests SCE’s method. The method is the same or very similar
to the method we approved in the previous GRC. SCE’s method is reasonable
and is adopted. Escalation rates during the post-test year period (2016 and 2017)
are addressed in Section 19 below.
Post-Test Year Ratemaking (PTYR)19.
SCE requests a PTYR mechanism to provide additional revenues for SCE to
conduct business in 2016 and 2017. The additional revenues provide for
increases in capital expenditure to replace aging utility infrastructure and
increases in operating expenses to account for price inflation. SCE argues that
the proposed attrition revenue increases provide SCE a fair opportunity to
recover its costs and earn a reasonable return for its investors. Thus, a PTYR
917 SCE-10V1 at 71-83. 918 ORA-4.919 SCE-73 and SCE-73C at 6-10.
- 344 -
A.13-11-003 ALJ/KD1/ar9/jt2/lil PROPOSED DECISION (Rev. 12)
mechanism helps SCE to maintain financial integrity as it faces increasing costs
during the attrition years.
SCE’s Proposed PTYR Mechanism19.1.
For its PTYR mechanism, SCE proposes to use a formula that will
separately escalate O&M expenses and capital expenditures for 2016 and 2017.
Additionally, SCE proposes to continue its current Z-factor mechanism that
allows SCE to request recovery of exogenous and unforeseen costs incurred
during the post-test years. To implement the post-test year revenue requirement,
SCE proposes to file an advice letter by November 1st of 2015 and 2016. Details
of SCE’s proposal are described below.
Advice Letter Filing to Implement Revenue19.1.1.Requirement
SCE requests to instead implement the post year revenue requirements
through annual advice letter filings. SCE proposes to file an advice letter by
November 1 of 2015 and 2016, with the post-test year revenue requirement
updated with the latest IHS Global Insight escalation rates.
O&M Costs19.1.2.
SCE proposes to escalate O&M expenses in the post-test years using the
same price indexes that it proposes to escalate O&M expenses from the recorded
year 2012 to test year 2015. In general, SCE will use the latest IHS Global Insight
escalation rates, except for labor and medical benefits.
Labor O&M - SCE proposes to escalate labor costs based on unionwage increases and target wage increases for non-representedemployees granted prior to the adoption of this decision.
Benefit O&M – SCE requests to escalate medical costs by 8% in2016 and 2017 and to apply this escalation rate to medicalprogram costs and PBOP (Post Retirement Benefits Other Than
- 345 -

A.13-11-003 ALJ/KD1/ar9/jt2/lil PROPOSED DECISION (Rev. 12)
Pensions) costs. For other benefit categories, SCE originallyrequested the escalation rates listed in the table below:
Category 2016 2017
Medical Programs 8.00% 8.00%
Dental Programs 4.50% 4.50%
Vision Service Plan 2.00% 2.00%
Disability Programs 2.66% 2.65%
Group Life Insurance 0.00% 0.00%
Misc. Benefit Programs 3.03% 2.90%
Executive Benefits 2.66% 2.65%
401 (k) 2.66% 2.65%
SCE proposes that it will use the latest IHS Global Insight escalation rates
to calculate the post-test year revenue requirements. SCE will update the
post-test year revenue requirement in its annual advice letter filing by using the
most up-to-date IHS Global Insight escalation rates that are available on October
1 of the year to calculate the next year’s attrition increase. For 2017, the second
attrition year, SCE proposes to use the latest Global Insight escalation rates to
escalate 2015 authorized level of O&M expenses to 2016 and 2017 levels. But, the
2016 authorized level of O&M expenses will not be trued up resulting from
updates to the escalation factor for 2016.
Capital-Related Cost Increases19.1.3.
SCE proposes to escalate capital costs in the post-test years according to a
budget-based forecast of capital expenditures and capital additions. SCE also
proposes to refund a portion of the associated revenue requirement to the extent
that the budgeted capital expenditures are not spent, in a mechanism similar to a
one-way balancing account. Under the budget-based forecast, SCE’s board of
directors determines the forecast budget for capital expenditures annually,
subject to CPUC approval in this proceeding.
- 346 -

A.13-11-003 ALJ/KD1/ar9/jt2/lil PROPOSED DECISION (Rev. 12)
Z-Factor for Major Exogenous Cost Changes19.1.4.
SCE requests to continue its Z-factor mechanism. Currently, the Z-Factor
mechanism allows SCE to seek recovery of extraordinary costs caused by
exogenous events (Z-factors) that are outside of management’s control and that
are incurred during the post-test years. Z-factors are defined as events that cause
a significant financial impact of more than $10 million. Either SCE or ORA can
identify a Z-Factor event by submitting a Letter of Notification to the Executive
Director. The Z-Factor mechanism provides SCE with the assurance that there is
a clear process for it to request cost recovery for unanticipated events that have a
significant financial impact on SCE.920
ORA’s Position19.2.
ORA does not oppose granting SCE a PTYR mechanism to provide SCE a
reasonable level of revenue increases for 2016 and 2017. ORA also does not
oppose SCE’s request to file advice letters to implement the attrition year revenue
requirement. But, ORA opposes SCE’s proposed PTYR mechanism and presents
two different proposals as alternatives for consideration.
ORA’s primary proposal recommends that the test year base revenue
requirement be increased by 1.9% in 2016 and 2.3% in 2017. These percentages
are calculated by adding 0.5% to the Urban Consumer Price Index (CPI-U). ORA
argues that the Commission has used CPI as a basis for determining attrition year
revenue increases in the past. Using CPI is simple and eliminates the need of
using multiple indices for escalation. It also gives SCE an incentive to manage
and control costs.
ORA also proposes an alternate recommendation which provides a
separate escalation mechanism for O&M expenses and capital expenditures. For
920 SCE-10V1R1 at 106-115.
- 347 -
A.13-11-003 ALJ/KD1/ar9/jt2/lil PROPOSED DECISION (Rev. 12)
general O&M expenses, ORA recommends escalating the adopted 2015
operational expenses by 2% per year. For medical benefit costs, ORA
recommends an escalation factor of 6.6% in 2016 and 2017, based on forecasts by
the Berkeley Healthcare Forum, compared to the 8% requested by SCE. For wage
increases, ORA opposes SCE’s request, noting that SCE’s wage escalation rates
for 2008-2013 are over 32% higher than IHS Economics figures. ORA also
suggests that SCE should have an incentive to control labor cost increases via the
PTYR mechanism. Hence, ORA recommends that wages be escalated by CPI,
which are 1.5% for 2016 and 1.9% for 2017, or alternatively, by Global Insight’s
forecast for labor increases, which are 2.3% for 2016 and 2.6% for 2017.
For capital expenditures, ORA recommends escalating the adopted 2015
capital additions by 2.0% per year, since the increase in the forecast of capital
additions from 2016 to 2017 is approximately 2.0%. ORA opposes using a
budget-based forecast to determine capital-related revenue increases, arguing
that the implementation of capital projects can change from plan. ORA notes that
SCE underspent its forecasted capital expenditures by $296 million in 2013. In
addition, ORA and all the other parties do not possess the resources to conduct
detailed analyses of the utility’s budget-based capital expenditures for the test
year and the attrition years. Escalating adopted 2015 is more consistent with past
Commission precedent.
ORA does not oppose the continuation of the Z-factor mechanism. ORA
recognizes that the Z-factor mechanism has protected both SCE and the
ratepayers by allowing revenue adjustments for unexpected and uncontrollable
events.921
921 ORA-25.
- 348 -
A.13-11-003 ALJ/KD1/ar9/jt2/lil PROPOSED DECISION (Rev. 12)
TURN’s Position19.3.
TURN also recommends an alternate proposal, emphasizing that the PTYR
mechanism should motivate the utility to control costs. For operational expenses,
TURN recommends that, instead of using multiple indices for escalation, the
PTYR mechanism should use a broad wholesale pricing index, specifically the All
Manufacturing Commodity Index (WPI-IND). TURN argues that SCE should be
incented to manage costs like other large companies that also have highly skilled
workforces and employ specialized equipment. These should also include
companies in unregulated manufacturing, utility, and mining industries. TURN
argues that these companies face cost pressures similar to that of the utility, but
also face market competition. Thus, an escalation factor based on a broad
wholesale pricing index, like the WPI-IND, reflects inflationary cost increases in
the marketplace. Since the WPI-IND is volatile, TURN recommends using a
rolling three-year average. Additionally, TURN recommends that the second
year attrition be trued up if the actual escalation is lower than the forecasted
escalation in the first attrition year.
TURN recommends escalating capital expenditures by a method based on
averaging seven years of recorded capital expenditures, excluding cost of
removal, in constant dollars on a per customer basis. The average is then
escalated for inflation and multiplied by the forecasted number of customers in
the attrition year. Major plant additions, namely the Pole Loading program, are
excluded from the average and are forecasted separately. TURN considers its
capital proposal consistent with our “traditional” approach.
TURN’s total proposed attrition year increase for each of 2016 and 2017 is
approximately 3.9% per year.922
922 TURN-18.
- 349 -

A.13-11-003 ALJ/KD1/ar9/jt2/lil PROPOSED DECISION (Rev. 12)
SCE’s Rebuttal19.4.
SCE argues against using the CPI or the WPI-IND as a basis for PTYR
mechanism. Even though escalating costs based on an index is simple, that
approach does not accurately reflect the utility’s cost of doing business. These
indices do not use the same basket of labor, materials, and capital inputs that a
utility uses. Rather, they only reflect inflationary price changes for goods and
services that an average consumer or producer buys. Utility specific indices, like
the IHS Global Insight indices, provide better estimates of utility cost increases.
In addition, SCE argues that a price index cannot properly capture growth in
capital expenditures.
In response to TURN and ORA’s comments on labor costs, SCE
emphasizes that it only seeks to include union and non-represented wage
increases granted before this decision in its future PTYR increases.
SCE also notes that, with some modifications, ORA’s alternate proposal for
a two-part separate escalation mechanism for O&M expenses and capital
expenditures could give SCE adequate attrition revenue requirement. These
modifications include escalating O&M expenses with escalation factors that
better align with SCE’s costs and not the CPI. SCE also opposes using ORA’s
proposed 2015 level of capital as the basis for escalating capital additions,
arguing that it is too low. But SCE does not take issue with ORA’s proposal of
escalating capital additions by 2%.923
Discussion19.5.
We allow SCE a PTYR mechanism to increase attrition year revenue
requirement for 2016 and 2017. Attrition year revenue increases give SCE an
opportunity to offset some inflationary price increases, increase capital
923 SCE-26V1 at 48-74.
- 350 -

A.13-11-003 ALJ/KD1/ar9/jt2/lil PROPOSED DECISION (Rev. 12)
investments, and earn its authorized rate of return in the attrition years.
Recognizing that SCE will face increased costs in the attrition years, revenue
increases will help SCE to provide safe and reliable operations while maintaining
financial integrity.
When deciding on an appropriate PTYR mechanism to use, we target a
mechanism that is simple; accurately aligns with how costs are incurred for the
utility; and gives the utility an incentive to manage costs while enhancing
productivity. In weighing these different and sometimes competing goals, we
adopt the following PTYR mechanism for SCE:
O&M expenses shall be escalated as proposed by SCE, using the1)same pricing methodology and pricing indices that we adopt fortest year escalation, except for labor expenses [namely: disabilityprograms, executive benefits, and 401(k)]. For labor expenses, weadopt ORA’s recommendation to use Global Insight’s mostcurrent forecast, consistent with ORA’s recommendation, whichis 2.3% in 2016 and 2.6% in 2017. For medical expenses, we adoptSCE’s escalation rate of 8%, which we adopt for test yearescalation (see Section 10.5.3 above). We also adopt SCE’sproposed escalation rates for other benefits categories. For allother O&M expenses, we adopt SCE’s proposal of using the latestIHS Global Insight escalation rates.
Capital-related revenues shall be escalated by increasing gross2)capital additions in the post test years at a rate of 2% per yearabove the 2015 authorized capital additions.
SCE’s Z-factor recovery mechanism shall continue for 2016 and3)2017.
We allow SCE to file an advice letter to implement the post-test4)year revenue requirement. SCE must file an advice letter byNovember 1st of 2015 and 2016. In these advice letters, SCE mustupdate its post-test year revenue requirement, calculated byusing the latest IHS Global Insight escalation rates for thefollowing attrition year. For the second attrition year of 2017,SCE shall use the latest Global Insight escalation rates to escalate
- 351 -

A.13-11-003 ALJ/KD1/ar9/jt2/lil PROPOSED DECISION (Rev. 12)
2015 authorized level of O&M expenses to 2016 and 2017 levels,but the 2016 authorized level of O&M expenses will not be truedup to reflect the actual escalation factor for 2016.
We find that this PTYR mechanism strikes an appropriate balance between
the goals described above as well as the parties’ different positions. Even though
applying a percentage increase based on CPI, as suggested by ORA’s primary
recommendation, is simple, it does not reflect how utilities incur costs. Since
O&M expenses and capital expenditures affect the revenue requirement
differently, we find a two-part attrition mechanism, where O&M expenses and
capital-related revenues are separately escalated, is reasonable. These
considerations form the bases for the two-part attrition mechanisms that were
adopted in D.13-05-010 and D.14-08-032.
In adopting the O&M escalation rates, we agree with SCE that the Global
Insight escalation rates more accurately forecasts the inflationary increases for the
utility. We decline to adopt escalation based on the CPI, as proposed by ORA, or
a broad wholesale pricing index, the WPI-IND, as proposed by TURN. We
concur with SCE that both the CPI and the WPI-IND reflect price increases for
goods and services that are not sufficiently similar to SCE’s labor and capital
inputs. Since the Global Insight escalation rates are specific to the utility
industry, they more accurately reflect SCE’s inflationary cost increases. SCE’s
estimates for other O&M expenses are reasonable.
For capital-related revenues, we allow SCE to escalate the adopted 2015
end-of-year gross capital additions by 2% for 2016 and an additional 2% for 2017.
We concur with ORA’s alternate recommendation that escalating capital
additions by 2% is appropriate, since SCE’s forecasted capital additions from
2016 to 2017 are increased by approximately 2%. We do not adopt SCE’s
- 352 -

A.13-11-003 ALJ/KD1/ar9/jt2/lil PROPOSED DECISION (Rev. 12)
proposed budget-based forecast for capital expenditures. We find our comments
in D.14-08-032 applicable:
The [Attrition Rate Adjustment] is not intended to replicate a testyear analysis, or to cover all potential cost changes so as toguarantee PG&E’s rate of return through 2015 and 2016. TheARA is merely to mitigate economic volatility between test yearsto a reasonable degree so that a well-managed utility can providesafe and reliable service while maintaining financial integrity.924
SCE shall implement its PTYR revenue requirement changes by advice
letter, as proposed by SCE.
In addition, we allow SCE to continue its Z-factor recovery mechanism.
The Z-factor mechanism, as recognized by D.12-11-051, applies for events that
cause both a decrease and an increase in the utility’s costs. These events can
include tax rate changes or tax law changes.
The adopted escalation rates are summarized below:
Category 2016 2017 Notes
O&M - Labor
Disability Programs 2.89% 3.00% Global Insight
Executive Benefits 2.89% 3.00% Global Insight
401(k) 2.89% 3.00% Global Insight
O&M - Other
Medical 8.00% 8.00% SCE Estimate
Dental 4.50% 4.50% SCE Estimate
Vision 2.00% 2.00% SCE Estimate
Group Life 0.00% 0.00% SCE Estimate
Misc. Benefit 2.29% 2.43% Global Insight
Capital Additions 2.00% 2.00% Applied to 2015 capital additions, basedon 2015 authorized capital expenditures
In comments on the Proposed Decision, ORA and TURN suggest that the
adopted PTYR mechanism inappropriately grants a larger increase in revenue
requirement from 2015 to 2016 than SCE’s final request. These comments are not
924 D.14-08-032 at 652-653.
- 353 -

A.13-11-003 ALJ/KD1/ar9/jt2/lil PROPOSED DECISION (Rev. 12)
persuasive for two reasons. First, the difference between 2015 and 2016 is an
arbitrary metric; instead we note that the total revenue requirement approved for
2016 is well below SCE’s final request. Second, we note that the primary reason
for the different rate of increase is that SCE’s budget-based forecast of
FERC-jurisdictional capital additions is considerably lower in 2016 than 2015.
This decrease is not reflected in the 2% escalation rate applied to capital
additions. Inherently, any simplification relative to a budget-based forecast (e.g.
escalation of the test year amount by any factor) will exclude changes in the
forecast after the test year. We accept this reality as part of the tradeoff between
accuracy and simplicity.
Electric Plant20.
SCE presents a method for converting capital expenditures to
Plant-In-Service. No party contests this method, and SCE asks for us to approve
it.925 SCE forecast its Plant-In-Service to grow from approximately $31 billion in
2012 to $46 billion in 2017. SCE’s method describes booking costs to CWIP
during construction and transferring the balance to rate base at the time of
completion. Monthly capital additions (based primarily on the forecast of capital
expenditures, in addition to other factors such as AFUD) and retirements are
netted to determine the plant additions each period.926 We find SCE’s proposed
method for converting capital expenditures to Plant-In-Service is reasonable and
adopt it.
Depreciation21.
The purpose of depreciation expense is to allocate, in rates, the original
cost of fixed capital assets, less net salvage value, over the life of the asset.
Depreciation attempts to allocate the capital cost of the asset, including the Cost
925 SCE OB at 300.926 SCE-10V2R1 at 1-18.
- 354 -

A.13-11-003 ALJ/KD1/ar9/jt2/lil PROPOSED DECISION (Rev. 12)
of Removal (COR), to all generations of customers on a pro rata basis during the
life of the asset. Depreciation expense is a legitimate cost of service and allocates
the costs of assets and their removal among all customer generations which
benefit from those assets.
In this GRC, SCE applied the Straight-Line Remaining Life Depreciation
method, historically applied by the Commission, where the undepreciated asset
amount (original cost less accumulated depreciation and estimated net salvage) is
depreciated in equal portions over the remaining life of the asset. The net salvage
value includes the COR of the asset at the end of its useful life and any salvage
value the asset may have at the time. Net salvage value is often negative
(indicating that COR exceeds any positive salvage). The ratio of net salvage
value to the original cost is called Net Salvage Ratio (NSR).
SCE combines most assets into broad groups for purposes of calculating
depreciation which include a wide range of service lives and retirement
characteristics. Some assets (e.g., individual generation assets), however, are
addressed individually.
Generally, SCE argues that its currently authorized depreciation rates are
too low, thus shifting costs from current customers to future customers. SCE
claims that its depreciation proposals reduce, but do not eliminate this cost
shifting, while the TURN and ORA proposals would exacerbate it.927 As we
noted in the last GRC decision,928 SCE’s calculations of past depreciation
“deficits” and ongoing or future “deferrals” are merely calculations reflecting the
difference between SCE’s proposals for depreciation parameters and
Commission-adopted or party-proposed parameters. SCE’s point that if ongoing
depreciation expense is “too low,” future customers will be required to pay more
927 SCE OB at 302.928 See, D.12-11-051 at 672.
- 355 -

A.13-11-003 ALJ/KD1/ar9/jt2/lil PROPOSED DECISION (Rev. 12)
may be valid. However, we recognize that determining the “right” level of
depreciation expense is a complex exercise of forecasting future costs and events.
SCE’s calculations of deficits and deferrals are only valid if we assume that SCE’s
past and present proposals are correct. We do not start with this assumption;
instead we remind SCE that it bears the burden of proof that its proposals are
reasonable.
TURN and ORA argue that SCE has generally not met its burden of proof
and specifically that SCE has not adequately complied with Commission
requirements for added detail.929
In addition to changes in depreciation parameters, increases in plant
balances also result in increases in SCE’s depreciation expenses. SCE presents
the combination of the two causes as shown below (in $ millions).930
Recorded 2012 Depreciation Expense $ 1,298
Change in Accrual due to Proposals $ 101
Change in Accrual due to Increase in Plant $ 520
Test Year 2015 Depreciation Expense $ 1,919
The Role of Judgment and Supplemental Studies21.1.
In D.12-11-051, we warned SCE against over-reliance on judgment without
further explanation, and encouraged SCE to provide more transparency in its
depreciation showing.931 We also stated a variety of specific directives for SCE to
address in its showing in this GRC; those directives are addressed below. TURN
and ORA argue that SCE has not met its burden of proof for many of its
proposals discussed below, in part because SCE has not adequately explained its
use of judgment and in part because SCE has not provided adequate detail on its
929 TURN OB at 245-246, citing D.12-11-051 at 664 and ORA OB at 384-385, citing D.12-11-051 at 685.
930 SCE-10 V2R1 at 19.931 See, e.g., D.12-11-051 at 685.
- 356 -

A.13-11-003 ALJ/KD1/ar9/jt2/lil PROPOSED DECISION (Rev. 12)
analysis, particularly in its direct showing. Further, they claim SCE did not
comply with the directives of D.12-11-051. As a result, TURN and ORA propose
shareholder funded supplemental studies, focused on net salvage rates.932 SCE
claims that TURN and ORA have not demonstrated the value of such studies or
why they should be funded by shareholders.933
Wherever ratemaking depreciation differs from the actual lives of utility
assets and associated actual removal costs and actual salvage costs, there will be
intergenerational shifting of depreciation costs. Therefore, one complicating
factor in our review of depreciation parameters is that, under typical ratemaking
approaches, future customers potentially bear the costs of any failure of the
utility to meet its burden of proof for its proposals. These are the “deficits” and
“deferrals” discussed above and in SCE’s testimony. Stated differently, if we
assume that SCE’s proposed parameters are “correct” but are not adopted
because SCE’s showing in support of those parameters is inadequate, the cost of
the deferral falls on future customers (who will need to pay more than their share
for utility assets in order to make up past under-collections) rather than
shareholders. For purposes of this discussion, we refer to this as under-collection
risk. But the converse is true as well—if we were to adopt SCE’s proposed
parameters and they turn out to be incorrect, then current customers would face
an undue cost burden resulting in a “windfall” for future customers.
As discussed in more detail below, we agree with ORA and TURN that
there are a number of significant shortcomings in SCE’s showing for the mass
property accounts. To address these shortcomings in light of under-collection
risk, we offer all parties guidance for the following GRC below.
932 See: TURN-10 at 57 and ORA-23 at 1-2. 933 SCE OB at 306-307.
- 357 -

A.13-11-003 ALJ/KD1/ar9/jt2/lil PROPOSED DECISION (Rev. 12)
First, we believe that SCE can and must do more to explain and justify its
use of judgment in its depreciation showing. SCE provides a lengthy discussion
of the role of judgment in depreciation analysis, concluding that “[t]here is no
single correct result from statistical analysis; hence, there is no answer absent
judgment.”934 We agree with SCE that, under certain circumstances, expert
judgment can and should be used to complement, balance, and even override
statistical results or other quantitative, factual information. We further agree
with SCE that judgment is required to make a decision on issues with multiple,
conflicting factors suggesting different conclusions. However, we also believe
that an expert witness must be able to explain the quantitative or qualitative basis
for such application of judgment, in any specific instance. A statement that “our
judgment suggests X” without supporting analysis or explanation cannot meet
the burden of proof on a contested issue, particularly if the recommended
conclusion conflicts with statistical results and no countervailing evidence is
identified. An adequate showing will avoid statements of judgment without
supporting analysis or explanation.
Second, we direct SCE to provide considerably more detail in support of its
net salvage proposals for at least five of the largest accounts, as measured by
proposed annual depreciation expense. At a minimum, this detail shall include:
A quantitative discussion of the historical and anticipated future1.Cost of Removal (COR) on a per unit basis for the large (greaterthan 15% as measured by portion of plant balance) asset classes inthe account. This discussion should identify and explain the keyfactors in changing or maintaining the per-unit COR.
A quantitative discussion of the historical and anticipated future2.retirement mix (i.e., retirements among different asset classes),identifying and explaining the key factors in changing ormaintaining this mix.
934 SCE-10V3 at 11-12.
- 358 -

A.13-11-003 ALJ/KD1/ar9/jt2/lil PROPOSED DECISION (Rev. 12)
A quantitative discussion of the life of assets and original cost of3.assets being retired, in relation to the COR, on both a historicaland anticipated future basis. This discussion should beintegrated with and/or cross-reference the proposal for lifecharacteristics.
An account-specific discussion of the process for allocating costs4.to COR.
Third, we recognize that this is at least the second consecutive GRC that
the Commission has expressed serious concern with the quality of SCE’s
depreciation showing. In order to motivate SCE to take these concerns seriously
in developing its direct showing for its next GRC, we encourage ORA and TURN
(and any other interested party) to consider making proposals in that GRC to
shift a portion of the under-collection risk from future customers to SCE’s
shareholders. Parties should only make such proposals if SCE’s direct showing
in the following GRC exhibits the same types of shortcomings, discussed here
and in D.12-11-051, in a widespread manner.
Average Service Life (ASL) and Survivor Curves21.2.
Of the mass property categories, SCE proposes no change in the ASL for
several FERC accounts, an increase in ASL for seven accounts, and a decrease in
ASL for a single account (355 – Transmission Poles and Fixtures).935
SCE generally relies on a combination of Simulated Plant Record (SPR)
results, input from SCE personnel, and expert judgment on the part of SCE’s
depreciation consultant to support its positions.936 ORA and TURN place more
emphasis on SPR results.937 Each of the three parties refers to other utilities when
the comparison purportedly supports their position. ORA and TURN also argue,
as noted above, that SCE has not met its burden of proof. TURN devotes six
935 SCE-10 V3, Study at 1-2.936 See SCE-26V3 at 27-80.937 ORA OB at 390-396; TURN-10 at 29-45.
- 359 -
A.13-11-003 ALJ/KD1/ar9/jt2/lil PROPOSED DECISION (Rev. 12)
pages in its opening brief to a detailed review of SCE’s showing for FERC
Account 355 (Transmission Poles and Fixtures) concluding that there is
“virtually NOTHING” to substantiate SCE’s claim that it improved its showing
relative to the 2012 GRC for this account.938 As discussed below, we agree with
TURN that SCE has not met its burden of proof on the subject of ASL and
survivor curves for Account 355, particularly in light of the direction in
D.12-11-051 to provide a better description of changes to underlying causes of
retirement, life characteristics, or mix of investments considered when
forecasting ASL in an account.939 However, we do not reach any general
conclusion that SCE’s proposals are less reasonable than those of TURN and
ORA. While we agree with TURN that SCE’s showing on ASL and survivor
curves is generally disappointing and overly reliant on unexplained “judgment,”
not all of the accounts have the same types of misleading statements as those in
Account 355.
SCE frequently characterizes TURN and ORA proposals as overly reliant
on SPR statistics, without appropriately considering other factors. As a general
matter, this critique may be valid in some cases, however we only find this
critique persuasive in the accounts for which SCE specifically identifies the other
factors and explains its analysis of those factors.
Various parties frequently cite the life curve combinations used either by
specific utilities or by a large sample of utilities. At the same time, the parties
appear to agree that SCE-specific data is most informative, and frequently
criticize comparisons to specific other utilities as arising from different
circumstances. We agree that comparisons may be informative if one or more
directly comparable utilities are identified. However, broad comparisons (e.g.,
938 TURN OB at 249-255; quote from pg 255, emphasis in original.939 D.12-11-051 at 685.
- 360 -

A.13-11-003 ALJ/KD1/ar9/jt2/lil PROPOSED DECISION (Rev. 12)
three of 95 do x while six of 95 do y) provide little value unless there is a clear
industry consensus (which we do not see in any of the contested accounts
discussed below).
Account 355 – Transmission Poles and Fixtures21.2.1.
SCE proposes retaining the existing R1 survivor curve and reducing the
ASL from 50 to 45 years; TURN proposes increasing ASL to 51 and changing to
an R0.5 curve. Both parties discuss SPR results, comparisons to other utilities’
survivor curves, and the impact of SCE’s pole loading and through-boring
programs on ASL.
In direct testimony, SCE claims that its proposed R1 curve is “ranked well”
and suggests that this is consistent with “predominant” choices in the industry.
SCE simply dismisses the highest ranked R0.5 curve as being flatter than
expected and only used by one of 81 companies. Finally, SCE generally asserts
that the PLP will shorten the lives of existing poles and that the through-boring
program may increase ASL in the future, but is currently a small factor. SCE’s
closing statement of its direct showing could be read as a summary of SCE’s case,
had it been presented alongside actual analysis. Instead it is merely a conclusory
assertion: “[b]ased on the SPR analysis, input from Company personnel, and
judgment regarding the asset groups in this account, this study recommends
moving to a 45-year life with a R1 dispersion curve for this account.”940
In its testimony, TURN documents that the ASL for this account has seen a
“general upward trend” since the 1980s, and suggests that SCE “seeks to roll
back” the five-year increase adopted in the last GRC. TURN discusses
through-boring, noting that SCE began this process in 2004 and that SCE
engineers claim this could increase life expectancies of wood poles to 60-70 years.
940 SCE-10 V3, Study at 34.
- 361 -
A.13-11-003 ALJ/KD1/ar9/jt2/lil PROPOSED DECISION (Rev. 12)
TURN suggests that the PLP will lengthen the overall life of the account due to
repair of degraded poles. TURN notes that the five best fitting curves all show
increases in ASL since the last GRC.941
In rebuttal, SCE contends that TURN’s claims on life expectancy do not
take all information into account, but does not clearly identify what was left out
or how this would impact the analysis. SCE cites its workpapers (Ex. TURN-93)
which do contain some information supporting the claim that the life of older
wood poles may be shorter than the ASL proposed by TURN, but this
information does not quantify this impact relative to the other types of poles or
on the account as a whole.942 Further, SCE repeats its argument about the limited
current impact of through-boring, adding only that “most of the existing assets in
service did not receive this pole treatment.”943 SCE suggests that there are
“numerous” factors leading to retirements before design life for poles. Further,
SCE disagrees with TURN on the impact of PLP, stating that SCE will no longer
repair poles after a failed inspection, and they will instead be replaced. SCE
provides a comparison of SPR results (ASL and Conformance Index {CI}) for each
of the proposed survivor curves, noting that for bands 40 years and longer
neither curve produces an excellent CI and claiming that the 50+ year bands
“make the R1 curve a superior choice.” SCE’s provided table plainly supports
exactly the opposite conclusion: each of the 50+ year bands shows a
higher/better CI for TURN’s proposed R0.5 curve than for SCE’s proposed R1.
Finally, SCE’s witness notes that he would expect a more “peaked” dispersion
than the R0.5 and that TURN’s proposal is unreasonable because it would have
941 TURN-10 at 34-35. 942 SCE later notes that steel concrete and light duty steel poles account for 46.0% of the assets
in the account, nearly as much as wood composite poles (47.6%). SCE-26V3 at 43.943 SCE-26V3 at 41.
- 362 -

A.13-11-003 ALJ/KD1/ar9/jt2/lil PROPOSED DECISION (Rev. 12)
some assets living to age 100. SCE claims that no other company uses R0.5, a
direct contradiction to data shown in SCE’s direct testimony.944
In hearings, SCE’s witness further undermined a number of the points
made in SCE’s rebuttal. First, he conceded that the 40 year band SPR result for
TURN’s proposed R0.5 curve is “not any different” than an excellent CI.945
Further, he admitted recommending curves that include lives of the longest lived
assets greater than 100 years for some utilities, but did not explain why he
contended this was unreasonable for SCE.946 SCE’s testimony on the impact of
through-boring was inconsistent and contradicted written testimony, leaving the
Commission with no clear evidence to understand through-boring’s impact in
this account.947
In conclusion, we agree with TURN that SCE’s showing for Account 355 is
conclusory at best, and misleading or inaccurate at worst. However, we do not
entirely accept TURN’s proposal. In our view, the SPR ASL results for the R0.5
curve better support a 50 year ASL (e.g., we round down the 50.4 and 50.6 year
results in the 50, 60, and overall bands). We adopt a 50 R 0.5 for Account 355.
Account 353 – Station Equipment21.2.2.
Both SCE and TURN propose increases from the current 40 year ASL, with
SCE proposing a 41 R 1, and TURN proposing a 45 R 0.5. TURN’s proposal has
better CI results, but as SCE points out, the difference is small.948 However,
TURN points out the top three curves all show an average ASL between 45 and
48 years.949 Although the SPR statistics only weakly favor TURN’s proposal over
944 SCE-26V3 at 40-44.945 15 RT 1571. 946 15 RT 1651.947 15 RT 1575-1578. See also: TURN OB at 253-254.948 TURN 10 at 30, SCE-26V3 at 31-32.949 TURN-10 at 30.
- 363 -

A.13-11-003 ALJ/KD1/ar9/jt2/lil PROPOSED DECISION (Rev. 12)
that of SCE, SCE has not provided any persuasive rationale to overcome the SPR
statistics. Accordingly, we adopt TURN’s proposal.
Account 354 – Transmission Towers and Fixtures21.2.3.
SCE proposes no change to the 65 R 5, while TURN proposes an increase in
ASL to 67 R 5. TURN suggests that best fitting curves in the last several GRCs
have shown increasing ASLs and that in this GRC the 20-year band shows a
68-year ASL.950 However, the longer experience bands are consistent with SCE’s
proposed 65-year ASL.951 Accordingly, we will retain the current 65 R 5.
Account 356 – Transmission Overhead Conductors and21.2.4.Devices
SCE proposes increasing the ASL to 56 while retaining the R4 curve; TURN
recommends a 62 R3. TURN states that the R3 curve ranks higher than the R4 for
all bands, and is the most frequently used in the industry, according to SCE’s
depreciation study. TURN also observes that shorter bands suggest the longer
ASL and that other utilities use ASLs up to 70 years. TURN claims the statistics
justify ASLs up to 69 years. Finally, TURN suggests that aluminum conductor
can last far longer than the ASLs considered here.952 SCE suggests that TURN
misconstrues academic texts and the recommendations of SCE’s witness in other
jurisdictions. SCE’s SPR statistics show that TURN’s proposed curve very
slightly outperforms SCE’s in all bands, but neither curve reaches an “Excellent”
CI for any band wider than 10 years.953 SCE’s various critiques of TURN’s
arguments appear valid. However, SCE cites no rationale for discounting the
better SPR statistics of the R3 curve, therefore we adopt the R3. However, we
950 TURN-10 at 32-33.951 SCE-26V3 at 36. 952 TURN-10 at 37-38.953 SCE-26V3 at 47-49.
- 364 -

A.13-11-003 ALJ/KD1/ar9/jt2/lil PROPOSED DECISION (Rev. 12)
place more weight than TURN on the SPR recommended by the wider bands,
and select a 61-year ASL.
Account 362 – Distribution Station Equipment21.2.5.
SCE proposes retaining the current 45 R1.5. ORA proposes a 50 R0.5,
arguing that it has consistently better CI with equal Retirement Experience Index
(REI) to SCE’s proposal.954 TURN recommends a 51 R0.5, noting better SPR
statistics and claiming that the 51-year ASL is consistent with the
recommendations of SCE’s witness on behalf of other utilities.955 SCE notes that
the CI values are fair or poor for both curves in bands 30 and longer and suggests
that the R0.5 is “too flat of a dispersion pattern based on the results of the SPR
analysis, the predominant curve patterns in the industry, the types of assets in
the account and the current approved parameters.”956 Of these reasons, SCE does
not include any analysis or explanation of its claim that the SPR results show that
R0.5 is too flat, states that more (18 of 95) companies use R1.5 than R0.5 (5 of 95),
and suggests that factors the Commission found important in the last GRC have
not changed. For the types of assets in the account, SCE references its
workpapers (Exhibit TURN-93) which include some discussion (apparently from
workpapers dating to the 2006 GRC) discussing the design life of items in the
account, and concluding that the degree to which SCE’s assets outlive the design
life may be expected to decrease.957 Based on this design life information, we
conclude that the ASL predicted by SCE’s R1.5 curve is more reasonable, and
adopt SCE’s 45 R1.5.
954 ORA-23 at 14-15. 955 TURN-10 at 39-41.956 SCE-26V3 at 55. 957 TURN-93 at 143-144.
- 365 -

A.13-11-003 ALJ/KD1/ar9/jt2/lil PROPOSED DECISION (Rev. 12)
Account 364 – Distribution Poles, Towers, and Fixtures21.2.6.
SCE recommends changing from a 45 R1 to a 45 R0.5, noting the R0.5
outranks the R1 in the 50+ year bands.958 ORA recommends a 47 R0.5, citing
engineering data in SCE’s workpapers and ASL statistics from SPR.959 TURN
recommends a 47 L0.5, claiming that SCE’s SPR analysis “lacks cohesion,” notes
that the 20-40 year bands yield longer ASLs, and finds that the L0 and L0.5
curves are the best fits for bands 40-60 (and almost for the 30 year band). TURN
also discusses SCE’s engineering data, noting the design life of new wood poles
and all composite and steel poles is 60-70 years, that SCE’s territory has favorable
climate for long life of wood poles, that a significant share of investment (in $) is
in newer poles, and that the average age poles retired in each of 2001-2012 were
older than 45 years.960 SCE rejects ORA’s claims, stating that ORA disregards the
same workpaper information cited by TURN (i.e., TURN-93 at 163-165). SCE
does not rebut TURN’s discussion of the engineering data. SCE also suggests
that both ORA and TURN inappropriately rely on shorter experience bands to
support their recommendations, notes that both curves have poor CI for bands
30+, and that almost all of the 40+ year bands suggest an ASL 45 years or less.961
We find that the 47 years life proposed by TURN and ORA is well supported by
the engineering analysis in SCE’s workpapers, as explained by TURN. Further,
while the difference is slight, the SPR statistics favor TURN’s proposed L0.5
curve. Accordingly, we adopt TURN’s proposed 47 L0.5.
958 SCE-10V3 at 48-49.959 ORA-23 at 16-17. 960 TURN-10 at 43-45, TURN-93 at 161-163. 961 SCE-26V3 at 57-61.
- 366 -
A.13-11-003 ALJ/KD1/ar9/jt2/lil PROPOSED DECISION (Rev. 12)
Account 367 – Underground Conductor & Devices21.2.7.
SCE proposes retaining the R1 curve, but increasing to a 42-year ASL. SCE
notes that the R0.5, L0, and R1 curves are best ranked for all bands, and have
high REIs. R1 shows a 42-year life for all bands greater than ten years.962 ORA
proposes a 49 R0.5, noting that R0.5 has better CI in every band and shows ASLs
between 49.6 and 50.8 with only a slightly lower (REI) (96%). ORA notes that
neither curve is used by many companies. Finally, ORA notes that engineering
information provided by SCE supports longer service lives for distribution cable
installed since 2000.963 In response, SCE suggests that R1 is more common across
the industry, that ORA’s proposed 23% increase in the ASL is too aggressive, and
that only four curves have an ASL greater than 42 years. Further, SCE notes that
the assets in this account are fairly homogeneous, suggesting a higher mode
frequency.964 The difference in number of companies using the curves (one vs
three) is too slight to be persuasive. We agree with ORA’s view of the
engineering information supporting a longer ASL and the SPR suggesting a R0.5
curve. However, we also find SCE’s point about the homogeneity of the assets
compelling and are hesitant to make such a drastic change as ORA suggests.
Accordingly, we adopt a 45 R0.5 as a modification of ORA’s proposal; we
anticipate that if the SPR statistics continue to favor an R0.5 curve with longer
ASLs in future GRCs, we will further increase the adopted ASL.
Account 368 - Line Transformers21.2.8.
SCE proposes to increase the ASL from 30 to 33 and move to a flatter R1
from the current R5. The top ranked curves are R0.5, L0, and R1, each with REIs
close to 100, but low CI. SCE focuses on 36 R0.5 vs 33 R1, and concludes that
962 SCE-10V3 at 54-55. 963 ORA-23 at 17-19.964 SCE-26V3 at 62-67.
- 367 -
A.13-11-003 ALJ/KD1/ar9/jt2/lil PROPOSED DECISION (Rev. 12)
33R1 is preferred because the longer life and flatter 36 R0.5 are not appropriate
for this account.965 ORA argues that the 36 R0.5 curve is the best fit in every
observation band and notes that each band is used by eight other companies.966
In rebuttal, SCE notes that the CI differences are small and that the life of
overhead transformers ranges from 25-35 and underground transformers 15-25,
and that these two asset types comprise 67.5% of the account.967 We agree that
the engineering life estimates are more compelling than the slight difference in
SPR statistics and approve SCE’s proposal.
Account 369 – Services21.2.9.
SCE proposes retaining the current R2 and increasing the ASL from 40 to
42. SCE notes that the top ranked curves are “very flat” and that REIs are close to
100, but CI are poor and fair. SCE suggests that the flat curves indicate changing
characteristics. SCE claims R2 is the predominant curve in the industry.968 ORA
agrees that the SPR data indicates a longer ASL and notes that the top ranked
curve is a 57 R0.5, with excellent REI, but considers this 17-year increase too
extreme. ORA recommends a 50 R1 noting that it is one of four curves
consistently outranking SCE’s proposed R2.969 SCE contends that the CI values
are too low and too close between the two curves to strongly favor the R1 and
that homogeneity would suggest a curve with higher mode frequency
dispersion.970 We note that the R2 curve is only slightly more commonly used
than the R1 (18 vs 14) and that the R1.5 is not far behind (11).971 We agree that
ASL is increasing, and that the SPR data suggests that life characteristics may be
965 SCE-10V3 at 56-57. 966 ORA-23 at 19-20.967 SCE-26V3 at 68-70; TURN-93 at 180-191. 968 SCE-10V3 at 58-59.969 ORA-23 at 20-21. 970 SCE-26V3 at 71-76. 971 SCE-10V3 at 58.
- 368 -

A.13-11-003 ALJ/KD1/ar9/jt2/lil PROPOSED DECISION (Rev. 12)
changing. From our review of the SPR data,972 we note that the R1.5 curve
suggest a 44.5-year life and consistently has better CI values than the R2 curve
proposed by SCE. Further, a 45 R1.5 does not represent as extreme a change as
ORA’s proposal. We adopt a 45 R1.5.
Account 373 – Street Lighting21.2.10.
SCE proposes to retain the current 40 L0.5, noting that the top ranked
curves are low modal which SCE finds reasonable given the variety of assets in
the account. SCE notes these curves are common in the industry and that CI
values are fair or poor for all bands greater than ten years.973 ORA proposes an
increase in ASL to a 42 L0.5 based on SPR data.974 SCE argues that the CI is too
low to support an increase in ASL, that most other curves show shorter ASLs,
and that ORA’s recommendation does not account for SCE’s operational
information suggesting a 38.5-year life.975 We agree with SCE that the operational
information is more compelling than the SPR statistics in this instance, and
approve the 40 L 0.5.
Other Accounts and Summary21.2.11.
There are a number of other accounts for which no party contested SCE’s
showing. Unless otherwise noted above, SCE’s proposals are approved. The
following table shows a summary of the contested accounts.
972 TURN-92 at 219-225.973 SCE-10V3 at 61.974 ORA-23 at 21. 975 SCE-26 V3 at 76-78, TURN 93 at 205.
- 369 -

A.13-11-003 ALJ/KD1/ar9/jt2/lil PROPOSED DECISION (Rev. 12)
Account 2012 GRC SCE TURN ORA Adopted
TRANSMISSION PLANT
353 Station equipment 40 R 1 41 R 1 45 R 0.5 45 R 0.5
354 Towers & Fixtures 65 R 5 65 R 5 67 R 5 65 R 5
355 Poles & Fixtures 50 R 1 45 R 1 51 R 0.5 50 R 0.5
356 Overhead Conductors &Devices
50 R 4 56 R 4 62 R 3 61 R 3
DISTRIBUTION PLANT
362 Station Equipment 45 R 1.5 45 R 1.5 51 R 0.5 50 R 0.5 45 R 1.5
364 Poles, Towers &Fixtures
45 R 1 45 R 0.5 47 L 0.5 47 R 0.5 47 L 0.5
367 UndergroundConductors & Devices
40 R 1 42 R 1 49 R 0.5 45 R 0.5
368 Line Transformers 30 R 1.5 33 R 1 36 R 0.5 33 R 1
369 Services 40 R 2 42 R 2 50 R 1 45 R 1.5
373 Street Lighting & SignalSystems
40 L 0.5 40 L 0.5 42 L 0.5 40 L 0.5
Cost of Removal (COR) and NSR21.3.
SCE proposes a weighted-average increase of 17.88% in its NSR for T&D
accounts, representing an increase in future COR of almost $4.2 billion.976 As
with the life analysis discussed above, TURN and ORA contend that SCE did not
meet its burden of proof and did not comply with Commission directives in
D.12-11-051; SCE contends that it did.
In many of the accounts, the proposed NSR is negative. For simplicity, we
will refer to changes in negative NSRs as an increase if it is a move toward a
more negative number (e.g., an increase from -10% to -20%) and vice versa.
One particularly contested requirement is the Commission’s statement that
“SCE shall provide testimony in its next GRC to provide more information about
976 SCE-26V2 at C-1.
- 370 -

A.13-11-003 ALJ/KD1/ar9/jt2/lil PROPOSED DECISION (Rev. 12)
the COR in asset accounts where SCE’s proposed NSR is at least 25% more than
comparable industry averages.”977 We refer to this requirement as the “25%
directive.” SCE argues that it was not aware of such statistics, but necessarily
complied with the 25% directive by providing more information for all
accounts.978 TURN argues that SCE did not comply with this requirement, in part
by misinterpreting the requirement to refer to recorded data rather than
requested or approved NSRs, and in part by devoting no significant discussion to
the issue in its direct testimony.979
Another contested requirement is that SCE review its allocation practices
to ensure that no costs of installing new equipment are booked as COR.980 SCE
argues it complied with this requirement because its outside witness “provided
an unbiased and independent perspective” and concluded that no changes were
required.981 TURN argues that SCE’s showing on this point is insufficient, and
amounts to little more than the utility’s hired witness stating the utility’s process
is adequate, in part based on review of a 2004 report.982 We agree with TURN –
SCE has done little to assure the Commission that it is not inappropriately
booking installation costs to COR. This problem is fundamental – SCE’s primary
justification for its positions on NSR is historical COR data. Other parties also
rely on this same historical data. SCE’s showing does include any significant
quantitative showing beyond its review of historical, account-level NSR data.
For example, SCE’s only quantitative discussion of future trends in COR or
retirement mix are in rebuttal to TURN. While we do not make any
977 D.12-11-051 at 686. 978 SCE OB at 304. 979 TURN OB at 256-258.980 D.12-11-051 at 683.981 SCE OB at 305. 982 TURN OB at 260-261.
- 371 -

A.13-11-003 ALJ/KD1/ar9/jt2/lil PROPOSED DECISION (Rev. 12)
across-the-board reductions to SCE’s proposals based on this problem, we factor
this shortcoming in SCE’s showing into our analysis of the individual accounts.
In PG&E’s most recent GRC, we adopted a cap on the rate of increase in
negative NSRs for disputed accounts of 25% of PG&E’s requested increase (e.g., if
the previously approved NSR was -50% and PG&E requested -100%, we adopted
an NSR no more negative than -62.5%). The primary rationale for this cap was
gradualism. Specifically, we found that this cap appropriately balanced the rate
increase to current customers with the costs to future customers of any deferred
COR.983
Account 352 – Transmission Structures and21.3.1.Improvements
SCE proposes increasing the NSR from -30% to -35% noting that recent
experience has ranged from -50.05 to -77.35%.984 ORA recommends no change to
this account, citing the 25% NSR directive in D.12-11-051 and stating that SCE
provided less testimony than previously. In calculating the industry average,
ORA excludes PG&E as an outlier.985 SCE criticizes ORA’s approach in general,
particularly with regard to excluding PG&E. SCE notes that its COR data shows
NSRs for 2010-2012 that are higher than those considered in the 2012 GRC.986 We
note that SCE’s recorded data for those years is far higher than SCE’s proposal.
Accordingly we approve SCE’s requested increase to -35%.
Account 353 – Transmission Station Equipment21.3.2.
SCE proposes an increase from -5% to -15% based on 10-year rolling
average of -18%.987 ORA recommends an increase to -10%. ORA suggests that
983 D.14-08-032 at 596-602.984 SCE-10V3, Study at 88. 985 ORA-23 at 24-26. 986 SCE-26V3 at 86-88; SCE-10V3, Appendix E at 1. 987 SCE-10V3, Study at 88-89.
- 372 -
A.13-11-003 ALJ/KD1/ar9/jt2/lil PROPOSED DECISION (Rev. 12)
increasing copper prices should lead to an increase in gross salvage, thus making
the NSR less negative, but notes that historical salvage data does not show this
relation.988 TURN proposes no change, claiming that SCE’s change to exclude
spare parts is inappropriate. TURN further argues that future NSR values are
likely to be more influenced by transformers, therefore potentially realizing
higher gross salvage and less negative NSR. TURN also argues that emergency
labor is not appropriately considered by SCE.989 SCE notes that net salvage over
the last four recorded years has been more negative than -20% despite high
copper prices and high gross salvage, noting that there is no certainty of future
copper prices remaining high. SCE argues that TURN’s spare parts argument is
irrelevant on the basis that this is small ($52 million) relative to the account ($3.9
billion), but comments that they “dramatically influence” the results. Further,
SCE notes that spare parts are internal transactions, are not sold, and were
removed from retirement, gross salvage, and life analysis for the depreciation
study. SCE suggests that TURN misconstrues the relative NSR impact of
transformers and switches, arguing that both are long-lived assets and that
transformers are more costly to remove.990 We agree with SCE that the recorded
data supports an increase in the NSR and are not persuaded that copper prices or
other factors will change NSR in the future. Accordingly, we adopt SCE’s
proposed increase to -15%.
Account 354 – Transmission Towers and Fixtures21.3.3.
SCE proposes an increase in the NSR from -70% to -100%, citing five and
ten-year averages of -200% and -185%.991 ORA recommends retaining the current
NSR, noting that it is consistent with industry data, after excluding an outlier that
988 ORA-23 at 27-30.989 TURN-10 at 59 – 62. 990 SCE-26V3 at 88-94.991 SCE-10V3, Study at 89.
- 373 -

A.13-11-003 ALJ/KD1/ar9/jt2/lil PROPOSED DECISION (Rev. 12)
is 22 times greater than the second highest reported NSR.992 TURN recommends
a -40% NSR, discounting SCE’s recorded data as being not representative for two
reasons. First, very little has been retired. Second, double circuit towers have
been disproportionately represented in recent retirements. TURN anticipates
future economies of scale will bring unit COR down in the future. TURN claims
the five-year mean, median, and mode of SCE’s witness’s proposals for this
account is -20%.993
SCE rejects ORA’s outlier removal and claims its proposal is consistent
with the industry data. SCE rebuts TURN’s small sample size arguments by
claiming that there is no reason to suspect the sample is not representative.
Further, SCE admits that there may be some economies of scale to removing
transmission towers, but argues that they will be very small in comparison to the
total cost.994
Given the small sample on which SCE’s historical data is based, we do not
find a compelling reason to increase the NSR for this account. Further, SCE has
not advanced any argument why its NSR should be significantly higher than the
industry data cited by TURN and ORA, and agree with ORA that excluding the
extreme outlier for this account appears appropriate. Accordingly, we adopt a
slight decrease in NSR to -60% in order to make a conservative move toward the
industry central tendency unless SCE’s actual experience or other evidence in
future GRC’s supports a higher NSR.
Account 355 – Transmission Poles and Fixtures21.3.4.
SCE proposes to increase the NSR from -70% to -85%, claiming the recent
five and ten-year averages are -107% and -115%.995 ORA recommends -72%
992 ORA-23 at 30-32.993 TURN-10 at 63-65.994 SCE-26V3 at 94-99.995 SCE-10V3, Study at 90.
- 374 -

A.13-11-003 ALJ/KD1/ar9/jt2/lil PROPOSED DECISION (Rev. 12)
claiming that this is consistent with PG&E and the industry median and mean
after removing certain outliers. Further, ORA anticipates that the pole loading
program will decrease costs in this account by economies of scale and reducing
the fraction of emergency work.996 SCE objects to ORA’s removal of outliers and
use of the median statistic, but does not respond to ORA’s argument about future
cost reductions.997 We find ORA’s argument that per unit COR will be lower in
the future due to the increase in non-emergency retirements persuasive, and we
adopt ORA’s proposed -72%.
Account 356 – Transmission Overhead Conductor and21.3.5.Devices
SCE proposes an increase from -80% to -100%, citing five and ten-year
averages of -204% and -171%.998 ORA recommends no change to this account
citing the 25% directive and industry mean and median figures ranging from
-35% to -71%.999 TURN recommends a decrease to -50%, claiming that this is
above the central tendency of the recent recommendations of SCE’s witness for
other utilities (-30 to -38%), and that this proposal results in annual accruals
approximately equal to the ten-year average of SCE’s actual total COR. TURN
claims SCE’s historical data are inappropriate to rely on.1000 In rebuttal, SCE
repeats its arguments based on recorded data, notes that six other utilities report
higher values, and argues that it met its burden of proof. Without explanation,
SCE expresses surprise that it is not the highest in the industry for this
account.1001 We agree with ORA that SCE has not explained its deviation from
industry averages and adopt ORA’s proposed -80%.
996 ORA-23 at 32-34.997 SCE-26V3 at 99-101.998 SCE-10V3, Study at 90-91.999 ORA-23 at 35. 1000 TURN-10 at 66-67.1001 SCE-26V3 at 102-104.
- 375 -

A.13-11-003 ALJ/KD1/ar9/jt2/lil PROPOSED DECISION (Rev. 12)
Account 362 – Station Equipment21.3.6.
SCE recommends an increase in NSR from -20% to -30%, citing five and
ten-year averages of -58% and -43%.1002 ORA and TURN each recommend no
change. ORA notes that industry mean values are approximately -22% (or -15%
excluding SDG&E) while the industry median is -15%.1003 TURN claims that
transformers have been underrepresented in recent retirements by 68% relative
to their share of plant balance and that copper prices are currently high, arguing
that these factors will increase gross salvage. Further TURN claims that SCE’s
witness has consistently testified to lower NSR for other utilities.1004 SCE rejects
ORA’s analysis, claiming that SDG&E’s experience indicates that COR in
California is high. SCE also claims that transformers are not the only long-lived
assets in the substation, are more expensive to remove than other assets, that
copper prices have only a small impact on NSR for this account, and that eight
other companies report higher NSR than requested by SCE.1005 While we agree
with SCE that copper prices are not a large factor, we find that TURN’s argument
about changing retirement mix has some merit. SCE’s rebuttal that transformers
are expensive to remove is almost entirely based on factors that would also make
them expensive to install (e.g., weight and bulk). This argument is not
convincing in terms of NSR because both parts of the ratio are impacted. We
adopt -25% in order to balance this concern against SCE’s recorded data.
Account 364 – Distribution Poles, Towers, & Fixtures21.3.7.
SCE proposes an increase in the NSR from -190% to -225%, noting the
recent five and ten-year averages both exceed -410% and that it does not foresee a
1002 SCE-10V3, Study at 92-93.1003 ORA-23 at 35-36.1004 TURN-10 at 68-69.1005 SCE-26V3 at 105-109.
- 376 -

A.13-11-003 ALJ/KD1/ar9/jt2/lil PROPOSED DECISION (Rev. 12)
change in the fraction of emergency work.1006 ORA proposes no change, claiming
that COR on a per pole basis has been stable or possibly decreasing. Excluding
either one or two outliers, ORA calculates industry means in the range of -113%
to -152%, and argues that SCE has neither complied with the 25% directive nor
met its burden of proof. ORA suggests that SCE’s proposed increase in annual
net salvage collections (greater than $579 million) is not justified by the 218
words of SCE’s testimony.1007
TURN recommends a decrease in NSR to -132% on the basis that SCE’s
recorded COR values are industry outliers and suggesting that SCE’s allocation
between COR and cost of installation is part of the problem. TURN notes that
SCE’s proposal is much higher than for any other utility that SCE’s witness has
performed the depreciation study. In particular, TURN discusses a utility in
Texas (Southwestern Public Service Company, or SPS), asserting that SCE’s COR
on a per pole basis is 7.6 times higher ($2,400 vs $300). TURN postulates that
labor is a major portion of COR, and that labor is approximately 23% more
expensive for SCE than SPS, and concludes that labor or other cost differentials
are unlikely to explain the difference in COR. TURN contends that SCE’s
allocation process has not been updated enough (e.g., it assumes no relative
changes in labor and materials costs since 2004) and generally challenges the
allocation factors. TURN proposes -132% because that is the “most negative and
most recent level” proposed by SCE’s witness on behalf of another utility.1008
SCE rejects ORA’s and TURN’s characterizations that its COR is unusually
high. SCE’s basis is industry data without removing ORA’s outliers and claiming
that there are seven utilities with higher COR for this account. Further, SCE
1006 SCE-10V3, Study at 93-94. 1007 ORA-23 at 37-39.1008 TURN-10 at 70-75.
- 377 -

A.13-11-003 ALJ/KD1/ar9/jt2/lil PROPOSED DECISION (Rev. 12)
contends that the per pole COR is trending up, not down, relying on the same
data as cited by ORA. SCE’s witness rejects TURN’s comparison to SPS based on
“a dramatic difference in the effort required to replace a pole in many cases” and
discusses a supporting anecdote. Further, SCE suggests that TURN’s calculated
$300/pole for SPS is inaccurate, and provides a comparable value of $447 for SPS.
SCE also observes that TURN’s allocation theory would suggest that SPS books
more cost to new poles than SCE, but SCE’s costs are in fact higher. SCE alleges
that it pays $100 per pole for disposal and that SPS faces no similar disposal fee.
Finally, SCE defends its allocation process noting that allocations are specific to
the configuration of the poles and alleging that work effort per task is unlikely to
change over time.1009
SCE’s response to ORA and TURN’s allegations is insufficient to justify the
full requested increase. SCE’s historical data suggests an increase is warranted,
but SCE’s showing that the allocation practices are reasonable is incomplete.
However, TURN’s suggestion to totally discount SCE’s recorded data is extreme,
and we decline to adopt this approach. While there are clearly differences
between SCE and SPS and their territories, SCE’s anecdotal evidence and
reference to disposal fees does not prove that SCE’s $2,400 per pole COR is
reasonable. Consistent with the logic of gradualism that we applied to PG&E, we
will adopt a -210% NSR. This balances the increase demonstrated by SCE’s
recorded data, our ongoing concerns with SCE’s showing on its allocation
practices, and the rate of increase in depreciation rates.
Account 365 – Distribution Overhead Conductors and21.3.8.Devices
SCE proposes an increase from -110% to -125% citing five and ten-year
averages of -277% and -200%. ORA recommends no change, citing industry
1009 SCE-26V3 at 108-115.
- 378 -
A.13-11-003 ALJ/KD1/ar9/jt2/lil PROPOSED DECISION (Rev. 12)
means and medians ranging from -50% to -84%, noting that the mean drops to
-63% if PG&E is excluded.1010 TURN recommends a decrease to -85% alleging
problems in SCE’s data and citing industry comparisons. TURN claims that the
highest recommendation that SCE’s witness has made for any utility in the last
five years is -85% and that the central tendency is -30 to -40%. TURN also again
compares SCE to SPS, noting that SCE’s witness proposed a COR of $1.07/foot in
Texas, but $3.52/foot for SCE, claiming that labor and other costs cannot explain
this difference, and concluding that only errors in SCE’s allocation process can
explain this difference in full.1011 SCE claims that there are five utilities reporting
higher NSR than SCE and that California utilities are experiencing higher COR.
SCE asserts that TURN’s calculations of COR for SCE and SPS are inaccurate, but
does not propose an alternative comparison. SCE argues that SPS’s cost of new
conductor is not high enough to be consistent with TURN’s theory that SCE is
overbooking to COR and underbooking to new installation.1012
For this Account, we adopt a gradual increase in NSR to -115%. While
SCE’s recorded data shows highly negative values, the evidence that SCE’s
allocation process is reasonable is inconclusive. Similarly, while SCE’s recorded
data is above the central tendency of the industry, there are other utilities
recording much higher values.
Account 366 – Underground Conduit21.3.9.
SCE proposes an increase from –20% to -40%, noting five and ten-year
averages of -125% and -108%. SCE claims its recommendation accounts for the
high COR of vaults and manholes, which have been over represented in recent
1010 ORA-23 at 39-40.1011 TURN-10 at 76-79.1012 SCE-26V3 at 116-120.
- 379 -

A.13-11-003 ALJ/KD1/ar9/jt2/lil PROPOSED DECISION (Rev. 12)
years.1013 ORA recommends -22% because of SCE’s “limited analysis.”1014 TURN
proposes to retain the current -20%, citing concerns about SCE’s allocation
practices, industry data, and claiming that SCE’s analysis of changes in the
retirement mix is incomplete.1015 SCE responds that its proposal is about one
third of the most negative recent historical data and that 15 or more utilities have
higher recorded NSR than SCE. SCE also notes that it proposes an increase in the
life of assets in this account, and claims that this will increase NSR due to
inflation and possibly other factors.1016 We note that the four-year increase in
ASL (from 55 to 59) explains only a small fraction SCE’s proposed doubling of
NSR, but it is a factor. SCE’s recorded data and explanation of increasing life
expectancy, which we adopt above, support an increase. However, SCE has not
presented adequate quantitative analysis on the changing retirement mix to
justify the full request. Therefore, we approve an increase to -30%.
Account 367 – Underground Conductor21.3.10.
SCE proposes an increase to -80% from the current -60%, noting five and
ten-year averages of -162% and – 142%.1017 ORA recommends no change, citing
the 25% directive.1018 TURN recommends a decrease to -50% claiming that SCE’s
showing is inadequate for an account of this size ($4.4 billion). TURN claims that
SCE has not demonstrated that its allocation process is reasonable and that SCE
allocates a higher proportion of costs to COR than does any other utility known
to SCE’s witness. TURN contends that circuit breakers have been
over-represented in recent retirements, skewing NSR upward. TURN cites low
COR for conductor because of economies of scale and abandonment in place.
1013 SCE-10V3, Study at 94-95.1014 ORA-23 at 41.1015 TURN-10 at 80-81.1016 SCE-26V3 at 121-123. 1017 SCE-10V3, Study at 95.1018 ORA-23 at 41-42.
- 380 -

A.13-11-003 ALJ/KD1/ar9/jt2/lil PROPOSED DECISION (Rev. 12)
TURN claims that SCE is an outlier, with a request five to eight times above the
mean, median and mode of the industry, and 60% above the next highest NSR
(-50%) in SCE’s witness’s direct experience.1019 SCE claims there are nine
companies in the industry database with higher recorded NSR than SCE and that
it is therefore not an outlier. SCE claims that it initiated a new process in late
2013 to remove and replace conductor from conduit instead of abandoning the
conduit underground, thus increasing the COR.1020 However, we note that SCE’s
citation to the testimony of one of its T&D witnesses is an error; the correct
citation is to the testimony of Roger Lee in SCE-3V4.
SCE’s showing is not adequate to justify the requested increase. While the
recorded data does suggest an increase, SCE has not made any specific showing
that its allocation process is reasonable. While SCE’s argument may be valid that
replacing conductor may increase COR in the long term, it is uncertain the extent
to which this change will occur. Further, it is clear that a change beginning in late
2013 cannot explain the trends seen in SCE’s recorded NSR. SCE has not
provided any significant analysis of the impact of the changing retirement mix.
SCE has not met its burden of proof for this account, accordingly, we will retain
the current -60% NSR.
Account 368 – Distribution Line Transformers21.3.11.
SCE recommends an increase from the current 0% NSR to -20%, noting five
and ten-year averages of -48% and -27%.1021 ORA recommends -2% noting that,
aside from changed numbers, SCE’s showing for this account is identical to
Account 367.1022 SCE’s recorded data supports its proposed increase, and we
adopt -20%.
1019 TURN-10 at 81-84. 1020 SCE-26V3 at 123-127 and SCE-3V4 at 31.1021 SCE-10V3, Study at 95-96.1022 ORA-23 at 42.
- 381 -

A.13-11-003 ALJ/KD1/ar9/jt2/lil PROPOSED DECISION (Rev. 12)
Account 369 – Services21.3.12.
SCE proposes an increase from -85% to -125%, citing five and ten-year
averages of -431% and -244%1023 ORA and TURN each recommend retaining the
current NSR, arguing that SCE has not met its burden of proof. ORA cites
industry medians around –60% and means from -74% to -166%. Excluding an
outlier, ORA calculates a mean of -83% and claims that SCE has not complied
with the 25% directive.1024 TURN claims that underground services have only
represented 30% of retirements in the last ten years, but account for 60% of the
Account balance. Further, TURN suggests these underground services are likely
to be abandoned in place. Finally, TURN claims that -85% is high relative to the
recommendations of SCE’s witness for other clients.1025 SCE argues that its
request is below the three-year industry mean, without excluding the outlier.
SCE rejects TURN’s retirement mix argument, calculating that even if
underground services had 0% NSR, the account average NSR would be -172%
assuming retirement mix equal to account balance.1026 Although SCE’s responses
to ORA and TURN appear reasonable, SCE has not provided any detailed
showing about future COR trends in this account. Consistent with gradualism,
we adopt an increase to -100%.
Account 373 – Street Lighting21.3.13.
SCE proposes an increase from -20% to -40% based on five and ten-year
averages of -87% and -77%. SCE claims that this recommendation does not
account for the likely increase in NSR when it predicts more electroliers will be
retired in the future relative to fixtures.1027 ORA recommends -22% noting a
1023 SCE-10V3, Study at 96.1024 ORA-23 at 42-44.1025 TURN-10 at 85-87.1026 SCE-26V3 at 128-130.1027 SCE-10V3, Study at 97-98.
- 382 -

A.13-11-003 ALJ/KD1/ar9/jt2/lil PROPOSED DECISION (Rev. 12)
three-year industry mean of -18%.1028 SCE argues that ORA inappropriately
excludes subaccounts from its industry calculation. Instead, SCE calculates three
and five-year means of -166% and -74%.1029 SCE’s recorded data supports an
increase, but due to the lack of specific analysis we only approve -30%.
Other Accounts and Summary21.3.14.
There are a number of other accounts for which no party contested SCE’s
showing. Unless otherwise noted above, SCE’s proposals are approved. The
following table shows a summary of the contested accounts.
Account 2012 GRC SCE ORA TURN Adopted
Transmission Plant
352 - Structures and Improvements -30% -35% -30% -35%
353 - Station Equipment -5% -15% -10% -5% -15%
354 - Towers and Fixtures -70% -100% -70% -40% -60%
355 - Poles and Fixtures -70% -85% -72% -72%
356 - Overhead Conductors & Devices -80% -100% -80% -50% -80%
Distribution Plant
362 - Station Equipment -20% -30% -20% -20% -25%
364 - Poles, Towers and Fixtures -190% -225% -190% -132% -210%
365 - Overhead Conductors & Devices -110% -125% -110% -85% -115%
366 - Underground Conduit -20% -40% -22% -20% -30%
367 - Underground Conductors & Devices -60% -80% -60% -50% -60%
368 - Life Transformers 0% -20% -2% -20%
369 - Services -85% -125% -85% -85% -100%
373 - Street Lighting & Signal Systems -20% -40% -22% -30%
Decommissioning Projects21.4.
SONGS Marine Mitigation21.4.1.
SCE proposes to retain the current 9.5-year remaining life, ending June
2022.1030 This subject is addressed in Section 11.2.10 above.
1028 ORA-23 at 44-45.1029 SCE-26V3 at 131.1030 SCE-10V2R1 at 32.
- 383 -

A.13-11-003 ALJ/KD1/ar9/jt2/lil PROPOSED DECISION (Rev. 12)
Mohave21.4.2.
SCE and ORA dispute the depreciation period for the remaining balance of
the retired Mohave plant. SCE requests completing the depreciation in 2015,
while ORA recommends completion in 2017.1031 Both parties cite D.12-11-051 in
support of their view. We agree with SCE that the intent of the “six years”1032 in
that decision was to end in 2015. Accordingly, we approve SCE’s request.
Solar 2 and Mountainview Units 1&221.4.3.
SCE has accrued more for decommissioning Solar 2 (by $2 million) and
Mountainview 1&2 (by $8 million) than it spent. SCE proposes to refund the
difference to ratepayers over the course of 2015 to 2017. No party opposes this
proposal, we find it reasonable, and it is approved.
Generation Plant Service Life Estimates21.5.
SCE proposes no change to life spans for several generation assets: Hydro,
Pebbly Beach, Mountainview, Peakers, and Solar Photovoltaic (PV). For Palo
Verde, SCE proposes an increased life based on an extension of the plant’s
license.1033 SCE’s estimates are unchallenged for Hydro, Palo Verde, and Pebbly
Beach. We find these unchallenged estimates reasonable, and they are approved.
Parties propose different service lives for the remaining specific generation
assets, as summarized in the table below.1034
TURN & ORA Service Life proposals for select generation plant (years)
GenerationPlant
SCE TURN ∆ 2015 Dep. Expense ∆ (per JCE)
Solar PV 20 30 10 ($7.277 million)
1031 ORA OB at 413.1032 D.12-11-051 at 653.1033 SCE-10 V3, Study at 23-27.1034 JCE V4 at issues ORA 284 and TURN 284.
- 384 -

A.13-11-003 ALJ/KD1/ar9/jt2/lil PROPOSED DECISION (Rev. 12)
Peakers 25 35 10 ($5.990 million)
Mountainview 30 35 5 ($4.462 million)
GenerationPlant
SCE ORA ∆ 2015 Dep. Expense ∆ (per JCE)
Solar PV 20 25 5 ($4.446 million)
For the Peakers, SCE notes that it has no retirement data and “estimates” a
25-year life.1035 TURN contends that industry estimates for similar units are 30-40
years, anticipates new technology and low capacity factors for the units leading
to long lives, and that SCE’s workpapers appear to suggest a “30+ year life cycle
prior to retirement.”1036 In rebuttal, SCE claims that increasing penetration of
variable renewables will lead to increased start-ups of the units and that
economic or regulatory factors may lead to earlier retirement.1037 We agree with
TURN, that SCE has not shown that the life of the Peakers is likely to be short
relative to industry comparisons. We note that this Commission has approved
energy storage and other approaches to address renewable variability in addition
to the Peakers. TURN’s 35-year life estimate is approved.
For Mountainview, TURN similarly proposes a 35-year life based on
industry comparisons.1038 SCE notes that, due to Mountainview’s history, some
equipment is older and was temporarily abandoned.1039 We find TURN’s
estimate reasonable.
For Solar PV, ORA proposes to increase the service life by five years, based
on a statement on SCE’s website that PV systems should operate for more than 25
1035 SCE-10 V3, Study at 26-27.1036 TURN-10 at 13-14.1037 SCE-26 V2 at 26-27.1038 TURN-10 at 14.1039 SCE-26 V2 at 27.
- 385 -

A.13-11-003 ALJ/KD1/ar9/jt2/lil PROPOSED DECISION (Rev. 12)
years.1040 TURN proposes a ten-year increase based on an industry comparison,
including “many” panel manufacturers’ warranties are for 25 years. TURN also
notes that SCE does not present a clear basis for its 20-year estimate.1041 In
response, SCE critiques TURN’s comparison to another utility, but does not
specifically respond to TURN’s assertion about warranties or ORA’s comments
from SCE’s website. On balance, we find that the 25-year life suggested by ORA
is well supported by both TURN’s and ORA’s arguments, and adopt it.
Taxes22.
SCE forecasts $449 million (nominal$) in 2015 tax expense, comprised of
income taxes ($197 million), payroll and miscellaneous taxes ($66 million) and
property taxes ($186 million).1042 Most elements of SCE’s forecast are undisputed.
The contested issues relate to changes in accounting methods. SCE
explains that, for ratemaking purposes, it incorporates changes in accounting
methods in the first GRC after receiving “full approval” from the appropriate tax
authority. SCE defines full approval as
“the point where the Internal Revenue Service (IRS) has granted
consent, where necessary, and the earlier of when the IRS has reviewed
and agreed to the income adjustments of such method change or the point
where in SCE’s judgment the expected outcome of the income adjustments
of such change can be measured with reasonable certainty.”
SCE made three changes in accounting methods in this 2015 GRC relative
to the 2012 GRC: 1) accelerated depreciation of streetlights to a seven-year life as
assets without a class life, 2) accelerated depreciation of smart meters to a
five-year life as computer systems, 3) and selecting a “safe harbor” method for
1040 ORA -23 at 48.1041 TURN-10 at 14-15.1042 SCE-76 at 3. Note that this estimate was revised downward significantly relative to SCE’s
original forecast shown in SCE-10V2R1 at 34.
- 386 -

A.13-11-003 ALJ/KD1/ar9/jt2/lil PROPOSED DECISION (Rev. 12)
repair deductions of generation and T&D assets. SCE used the flow-through
approach for each of these changes.1043
ORA does not contest SCE’s tax forecast.1044 TURN challenges SCE on two
of these three changes: accelerated depreciation of smart meters and the safe
harbor method for repairs.1045
First, as discussed in greater detail hereafter, we adopt a simple ratebase
offset to offset the future tax expense related to the change in accounting for
repair deductions. While our approach is superficially similar to TURN’s the
differences are important. In support of this outcome, we determine that this
outcome is a prospective change, and not prohibited by retroactive ratemaking
principles. Second, we adopt TURN’s proposal on smart meter depreciation.
Finally, we approve the uncontested elements of SCE’s forecast, including the
changes proposed after hearings in exhibit SCE-76, with certain conditions
relative to those changes.
Background on Flow-Through vs.22.1.Normalized Tax Accounting
Both of the primary contested issues relate to accelerated depreciation of
assets for tax purposes. In order to provide context for this change, we review
flow-through and normalized tax accounting methods.
Under the flow-through method, income tax expense in each period
recognized for ratemaking and regulatory purposes is the same as actual tax paid
as to that tax year. Conversely, under the normalization method, income tax
expense for ratemaking is based on the net income recognized for ratemaking
accounting purposes in that period, regardless of when the taxes associated with
1043 SCE-10V2R1 at 35-37.1044 ORA OB at 414.1045 TURN appears to conclude that ratepayers are indifferent or slightly better off because of
the remaining change (streetlights).
- 387 -

A.13-11-003 ALJ/KD1/ar9/jt2/lil PROPOSED DECISION (Rev. 12)
that ratemaking income are actually paid. The flow-through method may be
thought of as cash-basis accounting and the normalization method as accrual
accounting.
In the case of accelerated depreciation, under a normalization approach,
Accumulated Deferred Income Taxes (ADIT) is greater in early years while
ratemaking tax expense exceeds actual tax paid. However, accelerated
depreciation benefits eventually reverse as they decrease below the depreciation
expense calculated under the straight-line approach. ADIT is drawn down in
later years as actual tax paid exceeds ratemaking tax expense.
Safe Harbor Method for Repairs22.2.
TURN has challenged SCE’s tax treatment of its repair costs for the years
2012, 2013, and 2014 in relation to forecast tax expense during test year 2015 and
beyond. The rates for 2012-2014 were established by SCE’s 2012 GRC
proceeding, which ended in late November, 2012.1046
In August of 2012, SCE filed with the IRS its election of a “safe harbor”
method of tax accounting for repair costs. That change was made available by
regulations promulgated during 2011 in IRS Revenue Procedure 2011-43.1047 The
safe harbor method of accounting for repair deductions permits a taxpayer utility
to apply a bright line rule for determining which of its repair costs are
currently-deductible expenses and which are capital expenditures. In SCE’s case,
the election of the safe harbor method increased its current-year deductions. In
other words, SCE elected to increase the amount of repair costs that were
deductible for tax purposes in the year of the election, thereby reducing the
amount of income taxes it paid for that year in comparison to the forecast taxes it
discussed in its GRC filings and testimony. However, the reduction in 2012 tax
1046 See D.12-11-051 at 613-24.1047 Rev. Proc. 2011-43, I.R.B. 2011-37, 326.
- 388 -

A.13-11-003 ALJ/KD1/ar9/jt2/lil PROPOSED DECISION (Rev. 12)
expense was magnified because Revenue Procedure 2011-43 essentially carried
back the change in accounting method to prior tax years.1048 Taxes in attrition
years 2013 and 2014 were also reduced compared with the GRC forecast. As a
result, SCE’s shareholders received $321 million in savings during 2012-2014
relative to forecast tax expense. This tax savings equates to $542 million
(nominal$) in revenue requirement if ratepayers had received those savings.
Additionally, SCE ratepayers will pay $294 million (net present value, $741
million nominal$) of increased tax revenue requirement (including both
increased book depreciation and a reduction in ADIT) from 2015 through 2042.
For instance, the extra tax expense that would be paid by ratepayers in test year
2015 is $26.1 million.1049
SCE does not dispute TURN’s quantification of the impact of its 2012-2014
tax filings on ratepayers and shareholders. We thus accept TURN’s proposed
values as conclusive for the purposes of this analysis.
In Comments on the Proposed Decision, SCE1050 and SDG&E1051 note that
the Proposed Decision did not address the substantial ratepayer benefits ($580
million) of SCE’s safe harbor repair deductions during tax years 2015-2017. We
recognize that the benefits to ratepayers of SCE’s election to use the safe harbor
approach are real and we do not dispute SCE’s election. However, like TURN,1052
we see the repair deductions that occur during later tax years as distinct from
those during 2012-2014. During each year of 2015-2017, ratepayers receive the
tax deduction benefit of the safe harbor repairs made during that year; the lasting
1048 See 26 U.S.C. § 481(a); Rev. Proc. 2011-43 § 7, App’x A. 1049 TURN-5 at 103-106 and TURN-6 at Attachment 13.1050 SCE Comments at 14.1051 SDG&E Comments at 2-4.1052 TURN Reply Comments at 5.
- 389 -

A.13-11-003 ALJ/KD1/ar9/jt2/lil PROPOSED DECISION (Rev. 12)
effect (e.g. increased tax expenses) of prior year repair deductions is a separate
issue.
After reviewing the evidentiary record of the 2012 GRC, it appears SCE
never disclosed the existence of Revenue Procedure 2011-43 or any similar
change in accounting method. SCE certainly did not include any substantive
discussion of this new option in tax law in its 2012 GRC filing, testimony or other
materials within the record. TURN alleges that SCE’s shareholders improperly
received the benefit of the increased deductions because SCE allocated the
difference between forecast and actual tax paid accrued to SCE’s shareholders
during the 2011 through 2014 period, while SCE seeks in the current proceeding
to assign the offsetting future increased tax expenses to ratepayers. Essentially,
TURN claims that SCE received a windfall of rates based on taxes it did not
actually have to pay during 2012 through 2014, and for which ratepayers will see
increased costs in years 2015 and thereafter.
SCE Should Have Informed the Commission22.2.1.
TURN and SCE each devote considerable attention to the subject of if,
when, and how SCE could have and should have informed the Commission of its
election to use the safe harbor method.
Generally, SCE contends that its tax actions were appropriate. More
specifically, SCE urges that it was not practical to inform the Commission during
the 2012 GRC, noting that the change in tax policy only occurred in August of
2011, shortly before SCE’s updated testimony was due. SCE further claims that
there was significant uncertainty after that point as it undertook an analysis of
the impacts of the change in tax policy.1053
1053 SCE-26V2 at 36-42.
- 390 -

A.13-11-003 ALJ/KD1/ar9/jt2/lil PROPOSED DECISION (Rev. 12)
TURN, by contrast, contends that SCE could have and should have
informed the Commission and parties to the 2012 GRC of the option for SCE to
take the safe harbor election, as well as SCE’s decision prior to the close of the
record in the 2012 GRC to take that election. TURN also discusses similar
changes in tax policy that occurred before Rev. Proc. 2011-43 and suggests that
SCE has also inappropriately directed benefits of those changes to
shareholders.1054
SCE’s 2011 10-K filing, submitted to the United States Securities and
Exchange Commission (SEC) in February of 2012,1055 contained the following
representation to the Securities and Exchange Commission and potential
investors: “In August of 2011 the IRS issued guidance on repair deductions and
changes in accounting method related to transmission and distribution assets.
Based on this guidance, SCE will include a second change in tax accounting method in
its 2011 tax return.”1056 SCE’s 2011 10-K filing further explains “Due to the
pending regulatory decision, SCE has not recognized an earnings benefit or
regulatory asset related to this method change.”
Our analysis is simple: it appears that at least a month before the
publication of the 2011 10-K filing, SCE knew or should have known that it
would make a change to its tax accounting method that would have a substantial
impact on its revenue requirement. The proceeding remained open for nine
1054 TURN OB at 281-289.1055 The Sections 13 or 15(d) Securities Exchange Act of 1934 require that large corporations
whose shares are widely held must file under penalty of perjury an annual Form 10-K report with the SEC that provides the public and investment community with a comprehensive summary of a company’s financial conditions and expected performance. Form 10-K filings ordinarily include information such as company history, organizational structure, executive compensation, equity, subsidiaries, pending business risks, and audited financial statements among other information that would be helpful for members of the public to determine the financial status of a business for investment purposes.
1056 TURN-5 at 101, quoting SCE’s 2011 Annual Report at 61. [Emphasis added.]
- 391 -

A.13-11-003 ALJ/KD1/ar9/jt2/lil PROPOSED DECISION (Rev. 12)
months following SCE’s 10-K, leaving ten months for SCE to inform the
Commission. During this time, SCE filed testimony, at least one motion and
participated in multiple ex parte communications, but did not inform the
Commission of this significant change in tax law applicable for the GRC period in
question.1057 The Commission’s Rate Case Plan even expressly states that update
testimony may include known changes such as changes in tax law.1058
SCE thus failed to notify this Commission of the new tax election option, as
well as its decision during the pendency of the 2012 GRC proceeding to exercise
that tax election that it knew would substantially reduce its tax liability for tax
years 2011 through 2014. SCE was aware that this safe harbor tax election
materially differed from its pleadings and testimony regarding estimated tax
liabilities for the 2012 through 2014 GRC period. This omission of material
information relevant to significant rate decisions by the Commission while the
case remained open could constitute a violation of Rule 1.1 of this Commission’s
Rules of Practice and Procedure.1059
The Commission may open a separate proceeding to determine if and how
to penalize SCE for this withholding of material information during an open
1057 Notably, at least one of the ex parte communications discussed the relevant subject of post-test-year ratemaking. For more detail on the timeline, see Appendix B.
1058 D.89-01-040, Appendix B.1059 Rule 1.1 of this Commission’s Rules of Practice and Procedure reads in part “[a]ny person
who signs a pleading or brief, enters an appearance, offers testimony at a hearing, or transacts business with the Commission . . . agrees to . . . never to mislead the Commission . . . by an artifice or false statement of fact or law.” The Commission’s Rules of Practice and Procedure are available at http://docs.cpuc.ca.gov/SearchRes.aspx?docformat=ALL&DocID=154622266. California Public Utilities Code, Section 2109 provides in part “In construing and enforcing the provisions of [Public Utilities Code sections] relating to penalties, the act, omission, or failureof any officer, agent, or employee of any public utility, acting within the scope of his official duties or employment, shall in every case be the act, omission, or failure of such public utility.
- 392 -
A.13-11-003 ALJ/KD1/ar9/jt2/lil PROPOSED DECISION (Rev. 12)
proceeding that resulted in an overstatement of tax expense and foreseeably
produced a windfall to SCE’s shareholders.1060
TURN’s Proposed Remedy22.2.2.
TURN proposes “a relatively straightforward way to reverse” SCE’s
flow-through. TURN proposes a prospective ratebase offset, based on the
normalization of the “excess” repair deductions during 2012-2014. Using this
approach TURN calculates its proposed offset value of $293.118 million
(mid-year, 2015). According to TURN, this change ensures that the benefits of
the change in repair deduction are provided to ratepayers in the same proportion
as the increased costs they bear. TURN calculates the net present value benefits
to ratepayers of this change as $250.8 million, which it acknowledges is less than
$294.3 million (net present value) of increased tax expenses ratepayers will bear
in the future.1061
TURN’s Proposal is Not Retroactive Ratemaking22.2.3.
Review of Precedents Cited by SCE22.2.3.1.
SCE asserts that TURN’s recommendation constitutes retroactive
ratemaking. SCE bases its argument on two Commission decisions, SoCalGas1062
and SoCal Water,1063 and on the California Supreme Court’s holding in Pacific
Telephone.1064 TURN contends these decisions are distinguishable. We review the
pertinence of these decisions.
1060 See Pacific Gas and Electric Company v. Public Utilities Comm., City of San Bruno et al., Real Parties in Interest, 237 Cal. App. 4th 812, 845 (The CPUC “has the authority to impose monetary sanctions for disobedience of its orders made pursuant to the state's police power.”).
1061 TURN-5 at 107, TURN OB at 287.1062 Re Southern California Gas Co., D.92-08-007, 1992 Cal. PUC LEXIS 532, 45 CPUC2d 256
(SoCalGas).1063 Re Southern California Water Co., D.93-04-046, 1993 Cal. PUC LEXIS 223, 49 CPUC2d 60
(SoCal Water).1064 Pac. Tel. and Tel. Co. v. Pub. Util. Comm’n, 62 Cal. 2d 634 (Pacific Telephone).
- 393 -

A.13-11-003 ALJ/KD1/ar9/jt2/lil PROPOSED DECISION (Rev. 12)
In SoCalGas, the IRS had disallowed certain employee benefit expense
deductions from 1983-1985 claimed by Southern California Gas Company
(SoCalGas), and instead required the costs be capitalized. To track the
disallowance, SoCalGas filed an advice letter to request authority to establish a
memorandum account. SoCalGas argued that the adjustment was an
“unexpected situation” because it comprised a “wholesale reversal of prior IRS
policy.”1065 DRA and TURN, however, protested that the creation of the
memorandum account was an impermissibly retroactive attempt at “truing up”
tax expense.1066 We noted DRA’s argument that “[t]he same rule applies whether
the amount at issue is an overcollection, resulting in windfall to the utility, or an
undercollection.”1067 The Commission denied SoCalGas’ request. We held “there
can be no after-the-fact ‘true-up’ . . . unless the Commission specifically made
provision for such an adjustment” previously.1068 Furthermore, we explained
that we do have the ability to address the future implications of tax strategies
developed for past tax years.1069
One year later, the Commission relied on its SoCalGas decision to dispose
of SoCal Water. In SoCal Water, the Southern California Water Company (SoCal
Water) sought authority to institute a tax memorandum account to track
payments resulting from an IRS audit. We noted that the facts were “virtually
identical” to SoCalGas: “A claim was made that the IRS deficiency claim could
not have been foreseen. The disputed tax matter had been part of a rate case.”1070
DRA protested that the memorandum account constituted retroactive
ratemaking. The utility countered that there was no retroactivity because the
1065 SoCalGas at *3.1066 Id. at *4. 1067 Id. at *3-4.1068 Id. at *5.1069 Id. at *6.1070 SoCal Water at *11-12.
- 394 -

A.13-11-003 ALJ/KD1/ar9/jt2/lil PROPOSED DECISION (Rev. 12)
expenses had not yet been paid or incurred. We again denied the creation of a
tax memorandum account. As earlier, we concluded that none of the
considerations raised by the utility overcame “our mandate to set rate increases
and rate reductions on a prospective basis.”1071 The Commission dismissed SoCal
Water’s argument that the potential IRS deficiency was a prospective cost as
“sophistry.”1072 Although any back taxes and penalties were not yet due, any
such deficiency would of course relate to previous tax years.
SCE contends that the facts in these cases are similar to TURN’s proposal
here, and recommends we reach a similar conclusion.1073 TURN contends that
the facts are not similar. As TURN explains, in each of these cases, the
Commission was asked to change the authorized tax expense for past years for
which prior GRCs had already set an authorized tax expense. Here, TURN
proposes a prospective change in the revenue requirement for test year 2015 and
beyond. SCE admits TURN’s proposal is prospective only.1074 This change has
been discussed directly in the record of this proceeding, whereas the IRS changes
in SoCalGas and SoCal Water were not addressed in the GRCs that set rates for the
applicable years.1075 We therefore do not believe TURN’s proposal constitutes
retroactive ratemaking.
Further, this approach is consistent with the California Supreme Court’s
holding in Pacific Telephone. In Pacific Telephone, the Court interpreted § 728 as
embodying a rule against retroactive ratemaking. The Court found that “the
Commission was empowered in GRC proceedings to set rates prospectively only,
and that the Commission had overstepped its statutory power by ordering a
1071 Id. at *12. 1072 Id.1073 SCE-26V2 at 32-35.1074 TURN-70.1075 TURN OB at 294-296.
- 395 -

A.13-11-003 ALJ/KD1/ar9/jt2/lil PROPOSED DECISION (Rev. 12)
refund of previously approved rates after a Commission investigation had
determined that these previously approved rates were too high.”1076 However, as
the Court emphasized, the Commission shall determine rates to be in force after a
hearing. Here, we have held hearings on the issue and set rates to be in force
thereafter.
Analysis of Additional Case Law22.2.3.2.
Several other cases weigh into our consideration of SCE’s flow-through of
tax benefits to its shareholders starting in 2011 with proposed increased tax
expenses to ratepayers in years 2015 and thereafter. In So. Cal. Edison Co. v. Pub.
Util. Comm’n (SCE II),1077 the California Supreme Court explained that California
law has recognized that because “taxes are treated as part of a utility’s cost of
service, any tax savings should not be retained by the utility but should be
immediately passed on to the utility’s customers.”1078 Thus, “[a]ny savings
acquired through the use of accelerated depreciation . . . is to be immediately
flowed through to the ratepayers.”1079 Finally, quoting its decision a year earlier
in SCE I,1080 the Court emphasized that it is “elementary” that “the ‘return’ – i.e.,
the profit – of the utility is calculated solely on the rate base – i.e., the capital
contributed by its investors; the utility is not entitled to earn an additional profit
on its expenses.”1081
SCE I specifically considered whether the Commission’s attempts to
remedy years of over-collection of rates to pay for fuel by SCE, expenses that did
1076 SCE-26V2 at 35. 1077 So. Cal. Edison Co. v. Pub. Util. Comm’n, 23 Cal. 3d 470 (1979) (SCE II). 1078 23 Cal.3d 470, 475.1079 Id. at 475, citing Commission Investigation Regarding Rate Fixing Treatment for
Accelerated Amortization and Depreciation for All Utilities, 57 CPUC 598 (1960) andPacific Southwest Airlines 73 CPUC 697, 708-10 (1972).
1080 So. Cal. Edison Co. v. Pub. Util. Comm’n, 20 Cal .3d 813, 818-19 (1978) (SCE I).1081 SCE II at 476-77.
- 396 -

A.13-11-003 ALJ/KD1/ar9/jt2/lil PROPOSED DECISION (Rev. 12)
not ever accrue to the utility, constituted illegal retroactive ratemaking.1082 There,
the California Supreme Court upheld the Commission’s remedy. Rather than
“subjecting the utilities to the financial hardship of reducing that balance to zero
in a single stroke, the commission adopted a proposal . . . of allowing the
companies to gradually amortize the sum by monthly billing credits spread over
a period of three years. That time span, the commission found, ‘is a fair and
reasonable initial time period over which to amortize such difference, without
unduly burdening either the utility or the ratepayer.’”1083
The California Supreme Court has made clear that it is the duty of the
Commission “to use any means legally at its disposal, including adjustment of
rate of return, to insure that the savings [arising from a federal tax credit] were
passed to the customers.”1084 Moreover, the Court has unanimously annulled a
Commission decision that failed to consider an alternative method to flow
through the benefits of a change in tax law to ratepayers.1085 In light of the
substantial and consistent case law, it is clear that the Commission would fail to
regularly pursue its authority and abuse its discretion if it did not endeavor to
mitigate the harm to ratepayers.
In City of Los Angeles, the Court “proposed alternative methods by which [a
utility] could be prevented from benefiting from the collection of rates which,
although lawful, were higher than necessary because they had made provision
for tax expenses that did not materialize.”1086 To remedy the utility’s overstated
1082 SCE I at 815.1083 Id. at 824. Note that other electric utilities were also affected by the Commission’s
decision in SCE II, but only SCE sought judicial review. Id. at 824 n.14.1084 SCE II at 477, quoting City of Los Angeles v. Pub. Util. Comm’n, 15 Cal. 3d 680, 695, 704-05 &
n.42 (1975).1085 SCE I at 477, citing City and County of San Francisco v. Pub. Util. Comm’n, 6 Cal. 3d 119, 129
(1971). 1086 SCE I at 830.
- 397 -

A.13-11-003 ALJ/KD1/ar9/jt2/lil PROPOSED DECISION (Rev. 12)
tax expense, the Court unanimously held that the Commission could reduce
future rates. Specifically, the Commission “could compensate for such past
overcollections by the device of reducing the utilities’ rates of return in the
future: the commission could choose to mitigate the windfall accruing to the
utilities . . . by setting more modest rates of return in recognition of the additional
source of capital available to the utilities by virtue of the [change in] federal tax
laws.”1087 The SCE I Court endorsed this analysis, stating that “[s]urely our
unanimous opinion . . . would not have advised the adoption of an illegal
procedure.”1088
These conclusions were not dicta. SCE, then as now, raised the defense of
the rule against retroactive ratemaking. The Court’s analysis was therefore
indispensable to establishing the Commission’s authority to remedy past
overcollections by one means or another. Presented again with overstated tax
expense, a prospective adjustment is just as valid here as it was in SCE I and City
of Los Angeles.
SCE’s Conduct in Relation to the22.2.3.3.Retroactive Ratemaking Prohibition
Simply stated, a failure on our part to address the future costs of SCE’s
election would be a failure to uphold our obligation to just and reasonable rates
under §451. Requiring ratepayers to bear the future costs of past tax benefits (or
any other benefits or service) that they did not receive due to a lack of forthright
presentation of material information by a utility is neither just nor reasonable.
1087 Id. (original emphasis) (internal quotation marks omitted).1088 Id. at 831. Importantly, though SCE I centered on an adjustment clause that consisted of a
mechanically-applied formula, City of Los Angeles was a consolidated review of three separate general rate cases. Therefore the SCE I Court’s analysis is not limited to adjustment formulas; rather, the Court was reasoning that because prospective rate reductions were available for general rates in City of Los Angeles, it followed that such reductions were available for extraordinary rates. In City of Los Angeles, the prospective adjustment was the alternative.
- 398 -
A.13-11-003 ALJ/KD1/ar9/jt2/lil PROPOSED DECISION (Rev. 12)
SCE’s conduct in the 2012 GRC makes any claim of retroactive ratemaking
even less tenable than in SCE I. Here, the Commission was denied the
opportunity to consider the appropriate treatment of the tax expense. In
Comments on the Proposed Decision, SCE alleges that the “Wise Exception”1089
has no application in this case.1090 We disagree. Even though no finding of fraud
has been made, this precedent is relevant given SCE’s failure to inform the
Commission of its election. California case law clearly establishes that a utility
may not invoke the rule against retroactive ratemaking when the utility’s own
conduct has prevented the establishment of just and reasonable rates.
Other Factors22.2.3.4.
The mere fact that we consider past events in setting rates prospectively
does not make this “retroactive ratemaking.” In numerous portions of its
application and testimony in this proceeding, SCE itself relies on discussion of
past events, such as recorded costs, to justify its forecast of future costs. This is
common practice, logical, and entirely appropriate. Thus, the common practice
of looking to the past for guidance in predicting future costs of service is not
“retroactive ratemaking.”
A Ratebase Offset Does Not Violate IRS Normalization22.2.4.Rules
In its Opening Comments, SCE states that the rate base adjustment “is an
impermissible flowthrough of part of the benefits of accelerated depreciation
1089 Wise v. Pacific Gas and Electric Company, 77 Cal. App. 4th 287, 299-300 (1999) (“The rule against retroactive ratemaking is based on the presumption that the rate which was formally declared reasonable was considered and set in accordance with proper procedure. It is inconceivable that the Legislature intended the PUC would be powerless to award reparations where a public utility obtained a tariff rate by fraudulent means. Any other interpretation would fly in the face of the maxims of jurisprudence that ‘[n]o one can take advantage of his own wrong’ [citation] and ‘[f]or every wrong there is a remedy’[citation].”).
1090 SCE Comments at 19.

A.13-11-003 ALJ/KD1/ar9/jt2/lil PROPOSED DECISION (Rev. 12)
prohibited by the normalization rules.”1091 It concludes that the adjustment
constitutes a tax deferral for accelerated depreciation on costs that were never
added to its depreciable basis.1092 SCE threatens that if the Proposed Decision’s
adjustment for the Rev. Proc. 2011-43 election is adopted, it will seek an IRS
ruling on whether the adjustment violates the normalization rules. We believe
that any attempt to apply the normalization rules in this context is resolved by
existing sources of tax law. The normalization rules are provided by Internal
Revenue Code (IRC) section 168(i)(9), Treasury Regulations (Treas. Reg.) §
1.167(l)-1, and pertinent IRS rulings, which we now review and apply.
Section 168(f)(2) of the Internal Revenue Code (IRC) provides that a
deduction for depreciation expense shall not be available for public utility
property, as defined by IRC section 168(i)(10), if the utility does not employ a
normalization method of accounting as described in IRC section 168(i)(9). IRC
section 168(i)(9)(A) states a consistency requirement for the use of depreciation
methods and requires the establishment of a tax deferral reserve. IRC section
168(i)(9)(B) describes a violation of these rules, while IRC section 168(i)(9)(C)
provides the tax consequence for a violation.
Specifically, IRC section 168(i)(9)(A)(i) requires that the taxpayer, when
computing tax expense for ratemaking purposes, including the establishment of
its cost of service and regulated books of account, must use a method of
1091 SCE Opening Cmt. on PD at 17. Presumably, “normalization” is used within the meaning of former section 167(l)(3)(G), former section 168(e)(3)(B), or current section 168(i)(9) of Title 26 of the U.S. Code.
1092 SCE also asserts that the rate base adjustment must be a deferred tax because “[f]low-through items cannot create deferred taxes.” We agree that repair deductions are flow-through, but reach a different conclusion: the rate base adjustment is not a deferred tax. SCE argues the adjustment must be a deferred tax because it is unrelated to the repair deductions, and it is unrelated to the repair deductions because the adjustment is a deferred tax. SCE’s circular reasoning, lacking legal support, does not merit further
�analysis. See id. at 16.
- 400 -

A.13-11-003 ALJ/KD1/ar9/jt2/lil PROPOSED DECISION (Rev. 12)
depreciation with respect to its IRC section 168(i)(10) property that is the same as
the method used for calculating its depreciation expense for such regulatory
purposes and over a period no shorter than the period used for that depreciation
expense. Under IRC section 168(a)(i)(9)(A)(ii), if there is a different amount
available as a deduction under IRC sections 168 and 167 when applying the same
calculation method as under IRC section 168(a)(9)(A)(i), then the taxpayer must
reflect that difference in a tax deferral reserve. IRC section 168(a)(9)(B) requires
that the procedures of subparagraph (A) are in fact applied, which includes the
consistent use of forecasts.
Treas. Reg. § 1.167(l) provides the normalization regulations. These
regulations do not relate to other book-tax timing differences other than federal
accelerated depreciation.1093 Treas. Reg. § 1.167(l)-1(h)(2)(i) requires that deferred
income tax based on actual tax liability shall be credited to a reserve for deferred
taxes. Treas. Reg. § 1.167(l)-1(h)(1)(iii) provides that the amount of deferred
income tax is the “excess . . . of the amount the tax liability would have been had
a subsection (l) method been used over the amount of the actual tax liability.”1094
A subsection (l) method includes the straight-line method of depreciation used
here for ratemaking purposes.
SCE argues the normalization rules should apply because the adjustment,
it alleges, consists of “additional deferred taxes.”1095 However, SCE’s
characterization of “additional deferred taxes” is inconsistent with the
normalization rules. Treas. Reg. § 1.167(l)-1(h)(1)(iii) provides that deferred taxes
are calculated with respect to “actual” tax liability, but SCE defines deferred
1093 Treas. Reg. § 1.167(l)-1(a)(1) (“The normalization requirements . . . pertain only to the deferral of Federal income tax liability resulting from the use of an accelerated method of depreciation”).
1094 Emphasis added.1095 SCE Comments at 16.
- 401 -
A.13-11-003 ALJ/KD1/ar9/jt2/lil PROPOSED DECISION (Rev. 12)
taxes with respect to the depreciation “that would have resulted” if it did not
make the Rev. Proc. 2011-43 election.1096 Rev. Proc. 2011-43 permits an electric
utility to recognize current-year business expense deductions for amounts that
would have been capitalized but for the safe harbor election.1097 In other words,
SCE’s “additional deferred taxes” depend on depreciation “that would have
resulted” if SCE had more depreciable basis than it in fact had. That addition to
basis never occurred, and therefore the rate base adjustment cannot be a tax
deferral. As SDG&E correctly states, “normalization [of repair cost expenses] is
not required under the federal tax law.”1098
In contrast, this decision is consistent with Treas. Reg. § 1.167(l)-1(h)(1)(iii).
As stated previously, the deferred taxes reflected on SCE’s regulatory books of
account are based on the differences between SCE’s regulatory tax liability and
its actual tax liability, as calculated on its actual depreciable basis and consistent
with IRC section 168(i)(9)(A)(i). Because the final rate base adjustment is not
based on SCE’s actual or regulatory depreciation, it follows that the rate base
adjustment for the increase in future tax expense cannot invoke the
normalization rules.
Our conclusion is bolstered by SCE’s conspicuous failure to cite to any
legal authority except for oblique references to “normalization rules.” Moreover,
neither Congress nor the IRS has indicated that a taxpayer utility is entitled to
depreciation deductions for expenditures for which there was never an increase
in depreciable basis. This is unsurprising. SCE’s logic would entitle it to
effectively understate its gross income, first by electing to treat repair expenses as
increases in current-year deductions under IRC section 162 and Rev. Proc.
1096 SCE Comments at 16.1097 Rev. Proc. 2011-43 section 2.01 (“expenditures are deductible as repairs under § 162 or must
be capitalized as improvements under § 263(a)”) (emphasis added).1098 SDG&E Comments at 14.
- 402 -

A.13-11-003 ALJ/KD1/ar9/jt2/lil PROPOSED DECISION (Rev. 12)
2011-43, and then by treating those same expenses as increases to depreciable
basis under IRC sections 263 and 1016. There is no principled reason why SCE
should receive the benefits of both a current-year expense deduction and a
depreciation deduction for the same repair costs. A taxpayer cannot receive a tax
benefit twice.1099 Likewise, SCE cannot interpret the tax code as though it
possessed additions to depreciable basis that it elected to forego.1100
A closer inspection of Rev. Proc. 2011-43 and the depreciation and basis
rules also demonstrates that the rate base adjustment is not a deferred tax.
Section 2.02 of Appendix A of Rev. Proc. 2011-43 provides the calculation
methodology for the IRC section 481(a) adjustment. Section 2.02(4) specifically
provides that the “basis of electric transmission and distribution property
calculated after taking into account the repair deduction basis adjustment [for
extrapolation]” shall be the basis for adjustments that must be made “before any
depreciation is computed.” The basis rules stated in Section 2.02(4) are thus
consistent with Rev. Proc. 2011-43’s treatment of repair costs as either
“deductible as repairs under § 162 or . . .capitalized as improvements under §
263(a).” Rev. Proc. 2011-43 therefore distinguishes in two different ways those
costs to be recognized as current-year deductions under the safe harbor and
those costs to be capitalized and later taken into account as IRC section 1016(a)(2)
and (3) adjustments.
1099 The Ilfeld doctrine, as interpreted by Skelly Oil, requires that tax laws be interpreted to deny a double tax benefit unless a statute or regulation specifically authorizes it. See Ilfeld Co. v. Hernandez, 292 U.S. 62 (1934); United States v. Skelly Oil Co., 394 U.S. 678 (1969). Tax regulations also prohibit double deductions or their equivalent. See Treas. Reg. §1.1016-6(a) (basis adjustments “to eliminate double deductions or their equivalent.”); see also Treas. Reg. §§ 1.161-1, 1.212-1(o) (“Double deductions are not permitted.”).
1100 Taxpayers have a duty to treat items consistently. See Unvert v. Commissioner, 72 T.C. 807, 814 (T.C. 1979) (“‘there is a duty of consistency as to [tax] treatment, and one should be held to the consequences of the initial treatment.’”).
- 403 -

A.13-11-003 ALJ/KD1/ar9/jt2/lil PROPOSED DECISION (Rev. 12)
This differential treatment of currently-deductible and capitalized costs
may be stated with greater precision. Specifically, IRC section 1016 adjustments
result in the IRC section 1011 adjusted basis, which in turn provides depreciable
basis under IRC section 167(c). It is accelerated depreciation derived from that
depreciable basis which must be normalized. Neither that basis nor the resultant
depreciation deductions are reduced by the rate base adjustment.1101
Congruently, the full amount of those accelerated depreciation deductions has
been normalized by this proceeding. Because the rate base adjustment does not
interact with any of these components of accelerated depreciation, it is not a
deferred tax.
Finally, the error in SCE’s argument may also be demonstrated by a simple
hypothetical. If, for example, SCE employed straight-line depreciation for both
its actual and regulatory tax expense, a tax deferral for accelerated depreciation
would never arise, consistent with IRC section 168(a)(i)(9)(A)(ii). But if SCE
concealed a tax election (under Rev. Proc. 2011-43 or similar authority) that
increased its repair deductions, the Commission could nevertheless order a rate
base adjustment to compensate for the undisclosed decrease in depreciable basis.
Given the absence of accelerated depreciation, it would be obvious that the rate
base adjustment was not “additional deferred taxes.” To use SCE’s phraseology,
the “difference between [actual] accelerated and [actual] book depreciation times
the tax rate” would be zero because there are not different applicable
depreciation methods.1102 The same logic applies to the facts of this proceeding:
the rate base adjustment is not contingent upon the existence of accelerated
depreciation.
1101 The IRC section 481(a) adjustment merely carries backward the safe harbor election, and therefore the underlying principles for basis adjustments should apply generally to the safe harbor deductions.
1102 SCE Comments at 16.
- 404 -
A.13-11-003 ALJ/KD1/ar9/jt2/lil PROPOSED DECISION (Rev. 12)
SCE is receiving the full benefits of accelerated depreciation, as calculated
on its actual depreciable basis. There is no amount of accelerated depreciation
that will not be normalized. SCE has attempted to mischaracterize this
adjustment as a deferred tax, even though it does not deny SCE the full amount
of the tax deferral as calculated under Treas. Reg. § 1.167(l)-1(h)(1)(iii) and
(h)(2)(i), and even though Treas. Reg. § 1.167(l) only applies to accelerated
depreciation. The rate base adjustment merely corrects for an unforecasted
increase in tax expense that resulted from SCE’s undisclosed tax election.
Accordingly, we believe our approach is consistent with the normalization rules
because it is entirely unrelated.
However, we fully intend that SCE comply with the normalization rules.
While we believe we have reached the correct result, and though SCE has not
cited to any written determination, case, regulation, or statute to support its
position, we recognize that SCE might later obtain a ruling from the IRS.
Accordingly, SCE may track changes in revenue resulting from the rate base
adjustment in the Tax Accounting Memorandum Account adopted in Section
22.6 below. If SCE decides to request an IRS letter ruling, SCE shall file and serve
a copy of its request to the IRS as a Tier 1 Advice Letter at least 30 days before
sending the request to the IRS. In the event that SCE receives a relevant IRS
ruling contradicting this decision, then it shall comply with the IRS’s
interpretation of the applicable tax laws by filing a Tier 2 advice letter with this
Commission to seek an appropriate adjustment to its revenue requirement
and/or rate base.
Adopted Remedy22.2.5.
We agree in principle with TURN that it is inequitable that ratepayers are
burdened prospectively with the higher subsequent year tax requirements
- 405 -

A.13-11-003 ALJ/KD1/ar9/jt2/lil PROPOSED DECISION (Rev. 12)
associated with the tax change, particularly since ratepayers received no
corresponding recognition of the initial savings from the tax change at the time of
SCE’s election. In the interests of consistency in ratemaking treatment, the
prospective tax treatment of repair deductions for ratemaking purposes should
be consistent with the assumptions that applied for ratemaking purposes when
the applicable repair costs were incurred. By contrast, SCE’s proposed
ratemaking treatment creates inconsistencies in applying the effects of the change
for ratemaking tax purposes (a) initially, at the time of the initial tax deduction
recognition and (b) during subsequent years’ recognition of the effects of those
deductions for ratemaking purposes. By applying SCE’s different ratemaking
assumptions, shareholders won at the front end, while ratepayers lose at the back
end of the chain of tax timing adjustments for ratemaking purposes.
Although SCE claims that TURN’s proposal (and the ALJ’s variation
thereof, as described below) invoke retroactive ratemaking, SCE’s own proposed
treatment also involves a prospective ratemaking tax requirement based on past
actions (i.e., SCE’s election to change its repair deduction treatment). Under
either proposal, prospective tax obligations and timing differences must be
determined, in part, as a byproduct of 2011-2014 vintage repair costs. Under
either approach, we must set prospective tax requirements based on ratemaking
assumptions concerning past tax elections and rules. The defining difference
between SCE and TURN, however, more pointedly is whether we apply
ratemaking assumptions going forward for purposes of assigning ratepayer
obligations for the treatment of repair cost deductions that are consistent and fair
in comparison with the ratemaking assumptions that applied when the
applicable repair costs were originally incurred.
- 406 -

A.13-11-003 ALJ/KD1/ar9/jt2/lil PROPOSED DECISION (Rev. 12)
There is no basis for claims that it would constitute retroactive ratemaking
merely to shield ratepayers from paying higher future tax obligations that result
from past tax savings that ratepayers never saw. We decline, however, to adopt
TURN’s proposed remedy and instead adopt an approach inspired by TURN’s
concerns about equity. Rather than look to past repair deductions, we instead
look to the net present value of future excess costs to ratepayers resulting from
SCE’s proposed ratemaking tax treatment for the repair deductions as compared
with the ratemaking tax treatment assumptions in place at the time of the
applicable repairs. A reduction of $294.358 million is required in comparison to
SCE’s proposed ratemaking treatment.
This reduction represents the additional future excess cost, in net present
value terms, that would be faced by ratepayers associated with funding higher
prospective tax provisions under SCE’s approach. Yet burdening ratepayers
with these higher tax provisions would be inconsistent with the ratemaking
assumptions underlying the tax treatment of the initial repair costs.
However, as TURN observes, under TURN’s own proposal ratepayers
would only recoup $250.8 million (net present value) of that extra cost.1103 For
our approach we calculate a ratebase offset of $344.026 million as necessary to
achieve a net present value benefit to ratepayers equal to their increased future
costs attributable to SCE’s election. This calculation assumes the same ratio of
benefits to the ratebase offset as calculated by TURN. By adopting this value as a
ratebase offset, ratepayers would be indifferent to SCE’s election, in TURN’s
calculation. Ratepayers did not get the benefit of SCE’s election during 2012 to
2014. While we do not adjust rates retroactively to change that outcome, we will
apply a prospective ratemaking treatment so that ratepayers are not forced to pay
1103 TURN-5 at 107.
- 407 -

A.13-11-003 ALJ/KD1/ar9/jt2/lil PROPOSED DECISION (Rev. 12)
prospectively for the effects of past tax benefits that they never received. Instead,
applying our adopted adjustment, ratepayers will, in effect, not pay the
prospective additional costs of that election relating to ratemaking tax provisions
for the period 2015 and beyond. Therefore, we adopt a ratebase offset of $344.026
million, applied initially in 2015.
We implement this ratebase offset in a different manner than in the
Proposed Decision. In the RO model supporting this decision, the offset is
implemented as a direct line item adjustment to ratebase, independent of other
factors. The ratebase offset in turn impacts other revenue-dependent portions of
the model (e.g. taxes, franchise requirements). The value of the offset is
amortized (on a straight line basis) over the course of 27 years (2016 to 2042). The
direct net present value of benefits to ratepayers of this change, implemented in
the full context of this decision, is approximately $265 million on a total company
basis or $249 million on a CPUC-jurisdictional basis. Thus, even though the
direct impact of this ratebase offset is lower than calculated in the Proposed
Decision, we believe it is a reasonable amount to compensate ratepayers for the
increased future costs that they will bear.
Advanced Meters22.3.
TURN contests SCE’s state income tax treatment of smart meters (also
called advanced meters, a component of Advanced Metering Infrastructure or
AMI). Specifically, TURN recommends reducing SCE’s state income tax forecast
by $2.090 million, less a $0.731 million increase in federal taxes per year during
2015-2017. In TURN’s view, SCE inappropriately changed the tax depreciation
schedule of advanced meters installed during 2012 after the AMI Balancing
Account was closed at the end of 2012. TURN calculates that as a result of SCE’s
change, ratepayers would pay 100% of the costs of these meters, but receive only
- 408 -

A.13-11-003 ALJ/KD1/ar9/jt2/lil PROPOSED DECISION (Rev. 12)
66% of the state tax depreciation. TURN notes that, although the smart meter
change is very similar to the change in streetlights, TURN does not contest the
change for streetlights because there is a net present value benefit to ratepayers
in that instance.1104
SCE replies that TURN’s proposal would require SCE to return revenue
approved earlier 1105 and is retroactive ratemaking, citing SoCalGas and SoCal
Water. SCE claims that its accounting actions follow regulatory guidance in
D.08-09-039 (use actual amounts through 2012 in the AMI Balancing Account)
and D.12-11-051 (use forecasts for 2013 and 2014 in general rates). 2015 rates
would reflect the most current information via SCE’s forecasts in this
proceeding.1106
This situation is materially similar to the previous discussion of the safe
harbor repair mechanism. This is our first opportunity to review this change,
and TURN asks us to set rates prospectively. SCE does not challenge TURN’s
calculation of the tax and revenue requirement impacts. Accordingly, we adopt
TURN’s recommended $1.359 million net reduction in tax expense.
Updates to Tax Forecast in Exhibit SCE-7622.4.
As discussed in the procedural background, SCE submitted exhibit SCE-76
by motion on May 11, 2015. The ALJ ordered an additional exhibit addressing
certain questions (SCE-78) and later admitted both exhibits into evidence.
This testimony makes two significant decreases to SCE’s forecast revenue
requirement: 1) a revised estimate of tax repair deductions attributable to Pole
Programs in 2015-2017, and 2) a changed formula to allocate tax expense between
1104 TURN-5 at 108-110.1105 In D.12-11-051, AL 2832-E, and AL 2961-E.1106 SCE-26V2 at 44-45.
- 409 -

A.13-11-003 ALJ/KD1/ar9/jt2/lil PROPOSED DECISION (Rev. 12)
FERC and CPUC jurisdictions. The combined test year 2015 revenue
requirement change is $201 million; the amount is higher in 2016 and 2017.
Generally, SCE explains that it discovered a “unique repair-eligible” profile
of pole expenditures while preparing and reviewing its 2014 financial statements.
As discussed in Sections 7.6 and 7.7 above, SCE requests, and we approve (albeit
at a lower level), significant increases in pole expenditures in this decision. Thus,
the impact of this repair-eligible profile is significant in the larger context of this
case. Similarly, SCE explains that the increased spending on poles and related
deductions is a key driver of book tax timing differences. In CPUC jurisdiction,
the deductions are flow-through, but normalized under FERC jurisdiction. The
increase in pole deductions causes a difference relative to SCE’s previous
assumption (book tax timing differences are allocated according to the overall
rate base allocation).1107
No party opposed SCE’s motion to admit SCE-76 or the position SCE took
in either of these exhibits. However, ORA and TURN jointly note the following
points in their response to SCE’s motion: 1) some or all of the revenue
requirement reductions may have been captured by SCE’s proposed balancing
account covering pole programs, 2) the net benefits to ratepayers of the
alternative allocation depend on the level of offsetting costs in FERC rates, and 3)
SCE’s changes do not impact any party’s position on other disputed issues in this
proceeding.
In response to the ALJ ruling, SCE further explains that the revenue
requirement reductions will not result in any offsetting cost increase to ratepayers
(FERC-jurisdiction included) during this GRC period. SCE estimates a net
present value of benefits during this GRC period of $598 million.1108
1107 SCE-76.1108 SCE-78.
- 410 -

A.13-11-003 ALJ/KD1/ar9/jt2/lil PROPOSED DECISION (Rev. 12)
Like TURN and ORA, we appreciate SCE’s efforts to bring this information
to our attention early. This effort appears consistent with our desire for candid
and timely information discussed elsewhere in this tax chapter.
While SCE did not present analysis of periods further into the future, any
net cost increases in those future periods would need to be strongly adverse to
ratepayer interests to offset the $598 million net present value benefits in this
GRC period. Accordingly, we find it reasonable to adopt SCE’s proposed
adjustments in the tax expense forecast in this GRC. Nevertheless, we must be
cognizant of the possibility that future costs may outweigh benefits, even on a net
present value basis. SCE’s exceptionally narrow reading of the phrase “taking
into account future periods” in the ALJ ruling1109 does not help our confidence
that there is no unpleasant surprise lurking around the corner in 2018 or beyond.
Therefore, we require that SCE present a net present value estimate of these tax
changes, as measured from 2015, in its next GRC. That estimate should take into
account the entire tax lives of the relevant depreciable assets. Stated differently,
this estimate should take into account sufficient future periods that considering
further future periods would have no material impact on the outcome of the
analysis. If the Commission’s estimate of the net present value of these changes,
as measured from 2015, is a net cost to ratepayers, that finding may be used as
the basis to compensate ratepayers for those increased costs.
Other Issues22.5.
SCE proposes an Employee Stock Ownership Plan (ESOP) Tax
Memorandum Account (ESOPTMA) to track to track any differences in the
1109 In SCE-78, SCE remarkably limits its analysis of “future periods” to 2015-2017, despite other subparts of the same question referring to “the time period covered by this GRC”which is also 2015-2017. The phrasing of the “future periods” question even implicitly acknowledges the possibility that peering further into the future than this GRC may increase uncertainty with the phrase “To a reasonable approximation.”
- 411 -

A.13-11-003 ALJ/KD1/ar9/jt2/lil PROPOSED DECISION (Rev. 12)
ratemaking tax treatment of dividend deductions that arise due to proposed
treasury regulations.1110 ORA opposes this proposal, noting that we denied this
request in the 2012 GRC.1111 The basic elements of this situation are unchanged
since 2012, the proposed regulations have been pending, but not finalized, for
several years. In the event that they become final during this rate case period,
SCE may file a Tier 3 Advice Letter under the Z-factor mechanism to address this
change in revenue requirement.
Policy Considerations22.6.
TURN’s language strongly condemns SCE’s actions with respect to its tax
accounting changes. We do not review these arguments in detail. Nevertheless,
we note that allowing SCE to use the prohibition against retroactive ratemaking
as a shield, after not clearly calling the underlying change in accounting methods
to our attention in the prior GRC, would be a strikingly poor precedent. We
decline to take any action that might give utilities an incentive to withhold
relevant information from us in the future.1112 Candid utility testimony on the
subjects of cost and accounting is of paramount importance to the proper
completion of our ratesetting duties.
Further, we note that SCE’s post-test-year ratemaking (PTYR) mechanism,
discussed in Section 19 above, also includes a “Z-factor” mechanism designed to
address material changes to costs between rate cases. No party used the Z-factor
approach to bring SCE’s tax accounting changes to our attention, and thus
address the change earlier. As we have previously stated, SCE is responsible for
reporting both positive and negative Z-factors.1113 Handling such changes earlier
1110 SCE-10V2R1 at 43, SCE-10V1R1 at 50-51. 1111 ORA-22 at 2.1112 See Wise, 77 Cal. App. 4th at 300 (“a remedy for the wrong committed and hopefully, serve to deter
such fraudulent conduct in the future.”).1113 See D.94-06-011, 55 CPUC2d 1, at *102.
- 412 -
A.13-11-003 ALJ/KD1/ar9/jt2/lil PROPOSED DECISION (Rev. 12)
may lead to lower levels of controversy and potentially more collaborative
solutions. In comments on the Proposed Decision, SCE contends that its election
to select the Safe Harbor method was ineligible for Z-factor treatment because
SCE management exercised discretion in making the election. SCE also contends
that the specific additional requirements in the Proposed Decision for SCE to
provide notice of major changes are “unworkable.” SCE proposes two
alternative solutions: a two-way memorandum account and a change to a full
normalization policy.1114
First, while we agree with SCE that a full normalization policy may have
avoided the contentious litigation of tax issues in this GRC, we do not have a
record in this proceeding on which to base any general conclusions about the
merits of such an approach. Second, we accept SCE’s point that a simple
memorandum account approach is most appropriate for this GRC period. We
may consider more specific approaches in the future, and welcome such
proposals from parties in the next GRC or other appropriate proceedings.
Therefore, SCE shall create a two-way Tax Accounting Memorandum Account to
track all tax changes during this GRC period.
Although we do not adopt specific criteria for when SCE must bring
accounting changes to our attention directly (beyond simply recording them in
the Tax Accounting Memorandum Account) we wish to send a clear signal to
SCE in favor of prompt disclosure. We expect SCE to bring to our attention any
major changes in tax accounting at least as soon as it notifies the SEC, investors,
or other public agencies. SCE need not have precise calculations of the revenue
requirement impacts in order to alert this Commission of such changes. Failure
1114 SCE Comments at 19-22.
- 413 -
A.13-11-003 ALJ/KD1/ar9/jt2/lil PROPOSED DECISION (Rev. 12)
to disclose such changes in a timely fashion undermines the integrity of the
regulatory process and may be found to be a violation of Rule 1.
Moreover, we note that in a separate post-hearing exhibit, SCE describes
the impact of the Tax Increase Prevention Act of 2014. In addition to revenue
requirement reductions and other changes in 2015, SCE notes a 2014 tax
depreciation increase of $874 million.1115 SCE does not elaborate on the impacts
of this change, and no other party addresses it. Importantly, it is unclear from
the record before us whether benefits of the tax change were flowed-through to
shareholders in 2014 in exchange for long-term cost increases to ratepayers. In
the 2018 GRC, parties should address this subject, if it has not been addressed in
another way sooner. SCE shall include the 2015-2017 impacts of this change in
the Tax Accounting Memorandum Account.
Rate Base23.
Rate Base is the net investment value on which SCE’s return is determined.
Rate Base represents the depreciated value of assets in service. The components
of rate base include: fixed capital, adjustments, working capital, and deductions
for reserves.1116
In addition to the specific issues addressed below, note that there is an
offset to Rate Base adopted in Section 22 above.
Customer Advances23.1.
Customer advances for construction are an adjustment to rate base
representing refundable amounts provided by applicants (generally developers)
before SCE constructs distribution facilities according to Tariff Rule 15. SCE does
not pay interest on these advances, and they are an offset to rate base. Advances
not refunded within ten years are treated as CIAC, an offset to Plant-In-Service.
1115 SCE-74 at 2-3.1116 SCE-10V2R1 at 52-54.
- 414 -
A.13-11-003 ALJ/KD1/ar9/jt2/lil PROPOSED DECISION (Rev. 12)
For electrical services, SCE forecasts a decline in the balance of customer
advances along with an increase in meter sets (which typically trigger refund of
advances). For inflows, SCE forecasts $280 (2012$) in new advances per meter set
based on a 2008-2012 average. SCE used a 5YA to forecast the small temporary
services component of customer advances.1117
ORA forecasts a higher balance than SCE. ORA proposes using a
three-year (2010-2012 ) average of $353 per meter, which it contends “accurately
reflects current economic conditions.”1118
TURN applies the difference between SCE’s 2013 forecast and 2013 actual
to SCE’s 2014 and 2015 forecasts, resulting in a higher forecast. For temporary
services, TURN proposes a four-year (2010-2013) average that is lower than SCE’s
forecast, noting that 2013 actual was lower than SCE’s forecast.1119
SCE contends that ORA’s position is unsupported and inconsistent with
ORA’s arguments in the 2012 GRC.
SCE also rejects TURN’s adjustment, contending that a forecast-actual
variance in one year does not indicate such a variance in later years and that it
would be unreasonable to rely on a single year’s variance. SCE analyzes
historical data in support of its arguments.
Finally, SCE notes that both TURN and ORA argue for lower meter set
forecasts, but do not propose to assume lower meter sets for purposes of this
calculation. SCE cites D.89-12-057 in support of its position.1120
TURN observes that SCE’s rebuttal explains the inflow (i.e., new customer
advance receipts), it does not explain the error in outflow (refunds) during 2013.
TURN also contends that SCE’s analysis of historical data is misleading by
1117 SCE-10V2R1 at 54-57.1118 ORA-24 at 4-6.1119 TURN-5 at 124-125.1120 SCE-26V2 at 46-51.
- 415 -
A.13-11-003 ALJ/KD1/ar9/jt2/lil PROPOSED DECISION (Rev. 12)
comparing end of year and average year forecasts. TURN concludes that error in
the 2013 forecast must be considered in developing the 2015 forecast.1121
There is considerable variation in the year-to-year trend in customer
advances, and SCE’s five-year average forecast method is appropriate. Further,
in Section 16 above, we adopt TURN’s lower meter set forecast and decline to
implicitly assume higher meter set levels reasonable here. Nevertheless, TURN’s
argument that SCE has not explained the variance between 2013 forecast and
2013 actual refunds is compelling. We agree with TURN that some adjustment
based on 2013 actual is appropriate, and that TURN’s proposal to “shift” 2015
upward by the amount of the variance in 2013 is reasonable. TURN’s approach
preserves the five-year average based forecast. Therefore, we adopt TURN’s
forecast.
Materials and Supplies23.2.
Materials and Supplies (M&S) inventory is maintained to facilitate capital
and O&M activities, both on an emergency and planned basis. From 2008 to
2012, M&S grew at a compound annual rate of 5.4%. SCE forecasts a compound
annual growth of -0.4% from 2013 to 2017. SCE explains these trends as driven
by increase in T&D activity, followed by improved inventory management
processes. SCE’s M&S balance is divided into three categories: T&D, generation,
and IT/transportation.
For T&D, M&S including poles, conductor, and switches are stored at over
100 locations across SCE’s service territory. SCE finds a strong correlation
between expenditures and inventory (R-square of 0.89) showing $55,000 in
inventory to support $1 million in incremental T&D construction. SCE applies
this relationship to its forecast T&D expenditures (excluding two major
1121 TURN OB 299-302.
- 416 -
A.13-11-003 ALJ/KD1/ar9/jt2/lil PROPOSED DECISION (Rev. 12)
transmission projects) to calculate its forecast. For this component, SCE forecasts
a compound growth rate of 7.5%.
For generation, SCE forecasts a -1.1% compound growth rate and 2.6% for
IT/transportation. Further, SCE makes adjustments to M&S for liabilities
including unpaid sales taxes as well as Operational Excellence.1122
ORA contests SCE’s T&D M&S forecast, recommending $40,000 in
inventory per $1 million in T&D expenditures. ORA cites the two most recent
GRC decisions in support of this relationship. ORA does not contest the other
components of SCE’s forecast.1123
In rebuttal, SCE observes that: ORA provides no regression or other
analysis in support of its proposed relationship, that SCE’s regression analysis is
the same as that used in the two decisions cited by ORA, and that the correlation
appears stronger including 2013 data (0.90) than ending with 2012 data.1124
We agree with SCE that ORA’s proposal is unsubstantiated. SCE’s
regression analysis of T&D M&S is consistent with those approved in past
decisions, shows a strong correlation, and is, thus, reasonable. However, as in
the last GRC, we find it reasonable to apply the M&S forecast approach to the
adopted capital expenditures instead of SCE’s forecast. Therefore, we reduce the
T&D M&S forecast by 10%, for a total M&S forecast of $116.948 million
(nominal$) in 2015.
Working Cash – Operational Cash23.3.
Working cash (also called cash working capital) is supplied by
shareholders to bridge the gap between the time expenditures are made and the
1122 SCE-10V2R1 at 57-66.1123 ORA-24 at 7-8.1124 SCE-26V2 at 51-55.
- 417 -

A.13-11-003 ALJ/KD1/ar9/jt2/lil PROPOSED DECISION (Rev. 12)
time revenues are received. SCE follows the lead lag approach1125 to calculate
working cash.1126
Operational cash is a component of working cash representing the average
balance of funds supplied by investors to meet daily needs in non-interest
bearing accounts. Operational cash includes cash-bank balances, special deposits
related to relocation, working funds, prepayments for rents and other costs, gas
option premiums to hedge price risk, and other accounts receivable. Certain
deductions are also included for liabilities, such as paid time off, user taxes, and
workers compensation reserve.1127
ORA recommends that cash balances in bank accounts be excluded from
rate base, citing SCE’s 2006 and 2009 GRC decisions as precedent.1128
SCE contends that, although the $6 million balance at issue is not required
explicitly by its banks, it is practically required by virtue of timing of payments
compared to investment deadlines.1129
The same arguments were at the center of the dispute in the prior GRC and
we reach the same conclusion here.1130 We find it reasonable to strictly interpret
Standard Practice U-16 so that SCE has an incentive to manage its cash as
effectively as possible.
TURN makes a number of recommendations related to operational cash,
which SCE accepts on rebuttal. SCE agrees to remove $5.7 million from rate base
if Long-Term Incentive Plan (LTIP) is denied.1131 LTIP is denied in Section 10.3
above, and we accordingly remove this amount from working cash.
1125 See Standard Practice U-16.1126 SCE-10V2R1 at 67-68.1127 SCE-10V2R1 at 68-73.1128 ORA-24 at 10.1129 SCE-26V2 at 57-58.1130 See: D.12-11-051 at 635.1131 SCE-26V2 at 58-59; TURN OB at 302.
- 418 -

A.13-11-003 ALJ/KD1/ar9/jt2/lil PROPOSED DECISION (Rev. 12)
With the exception of these two adjustments, SCE’s operational cash
forecast is undisputed and is reasonable.
Working Cash – Lead Lag Study23.4.
SCE describes many parameters of its lead lag study, but some of the
details are confidential. SCE’s revenue lag estimate is 44.6 days, an increase from
the prior GRC driven by new requirements related to customer disconnections
and the poor economy. For expense lag, SCE calculates an average of 45.93 days
for a subset of expenses that are not confidential.1132
ORA proposes different numbers of lag days for state and federal income
taxes, based on applying an average of 2008, 2009, and 2011, compared to SCE’s
2008-2012 five-year averages. ORA explains that 2010 was “uncharacteristic”
because of tax refunds, but does not address 2012.1133
TURN contends that an arithmetic average of the income tax lag days, as
proposed by SCE, is “not representative of anything” given the variability of
SCE’s actual tax payments. TURN argues that SCE forecasts paying significant
federal income taxes in 2015, and that this is a very different circumstance to
recent years when tax liability was low or even negative. For instance, TURN
observes that a negative number as in 2010, when SCE received a net refund, will
not recur. Further, TURN argues that it is inappropriate to include 2012 as a zero
lag-day data point on the basis that no taxes were paid. Therefore, TURN argues,
a weighted average of 2008-2009, when SCE paid significant income taxes, is
appropriate for federal income tax. For state taxes, TURN recommends a
five-year weighted average. TURN’s proposal leads to a $123.528 million
difference in rate base, compared to SCE.1134
1132 SCE-10V2R1 at 72-82.1133 ORA-24 at 11-12.1134 TURN-5 at 129-132.
- 419 -

A.13-11-003 ALJ/KD1/ar9/jt2/lil PROPOSED DECISION (Rev. 12)
SCE responds that ORA and TURN’s proposals on income tax lag days are
arbitrary and unsupported. SCE notes that it paid no taxes or received refunds in
six years during 2002-2012, and that these years are not anomalies and should not
be excluded. SCE cites the 2009 GRC decision as precedent.1135
As TURN observes in its brief,1136 the 2012 GRC decision reached a
different conclusion than in 2009, finding that it was appropriate to exclude
certain years as non-representative.1137 We agree with TURN that years with
minimal or negative tax payments may not be indicative of 2015; these years
should not be unduly weighted. However, we also see merit in having a
consistent approach to this calculation from GRC to GRC. On balance, we find
that a five-year weighted average, as proposed by TURN for state income tax, is
reasonable for both state and federal. This approach appropriately places more
emphasis on years with larger tax payments while recognizing that years with
low or negative payments do occur. Our calculation, as shown below, yields a
$103.360 million reduction to rate base relative to SCE’s proposal in 2015.
Dollars (millions) Adopted Lag Days Dollar-Days
Federal $ 456.893 85.98 39,285
Deferred $ (72.595) 0.00 -
State $ 97.512 56.34 5,494
Total $ 481.810 92.94 44,778
Dollars (millions) Requested LagDays
Dollar-Days
Federal $ 456.893 7.16 3,273
Deferred $ (72.595) 0.00 -
State $ 97.512 38.75 3,778
Total $ 481.810 14.64 7,052
Lag Day 78.30
1135 SCE-26V2 at 61-62.1136 TURN OB at 302-307.1137 D.12-11-051 at 641-642.
- 420 -

A.13-11-003 ALJ/KD1/ar9/jt2/lil PROPOSED DECISION (Rev. 12)
Difference
Rate BaseDifference
$ 103.360
SCE accepts certain other TURN proposed adjustments, including an
adjustment to labor lag days if LTIP is rejected, as it is in Section 10.3 above.1138
These adjustments are reasonable.
Customer Deposits23.5.
Since SCE’s 2003 GRC, we have used the amount of customer deposits as
an offset to SCE’s working cash, and therefore rate base. SCE seeks to end this
policy and provides a lengthy discussion of its reasoning that customer deposits
should not offset rate base. SCE’s arguments are:
Customer deposits are not defined as offsets to rate base inStandard Practice (SP) U-16.
Customer deposits are different than rate base offsets in SP U-16because they are debts that bear interest and are not the result oftiming differences between utility revenues and expenses.
Commission precedent is inconsistent and many Commissiondecisions have not required other utilities to offset rate base forcustomer deposits.
Compensating SCE for interest paid on customer deposits is notas valuable as the earnings on equivalent rate base, over $10million in 2012.
Lower earnings, due to lower rate base, impacts various ratiosconsidered by credit rating agencies and investors. In particular,SCE discusses the impact on Earnings Before Interest, Taxes,Depreciation, and Amortization (EBITDA) and EBITDA/interest.SCE notes that this has not caused a downgrade, but “willweaken SCE’s credit quality relative to its California peers.”
1138 SCE OB at 315-316, SCE-26V2 at 62-65.
- 421 -

A.13-11-003 ALJ/KD1/ar9/jt2/lil PROPOSED DECISION (Rev. 12)
The amount of customer deposits fluctuates due to factorsoutside of SCE’s control such as CPUC credit policies. SCE notesthat deposits declined 19% between 2009 and 2012.
The rate base offset impacts SCE’s ratemaking capital structure,by 0.5%. This impact is compounded by excluding nuclear fuelinventories.
The rate base offset provides a rate of return to customers as agroup greater than appropriate for the level of risk they assume.
Finally, SCE proposes to continue its practice of depositing up to 10% of
customer deposits in Women, Minority, and Disabled Veteran Enterprise
(WMDVE) banks or banks doing business in those communities. SCE explains
that banking is a challenging area to use WMDVE suppliers, and that supporting
these banks may in turn support lending to other community businesses that
may be potential WMDVE suppliers of other services. If any earnings difference
occurs because of this program, SCE splits the difference 50/50 between
shareholders and ratepayers.1139
TURN argues that the policy should be continued. TURN’s reasons are:
Customer deposits are a permanent source of capital. The “only”difference from other permanent capital sources, aside frominvestors, is interest. TURN notes that interest rates have beenlow since 2009; at the time of TURN’s testimony, the relevant ratewas approximately 0.25%.
Other states view deposits as a source of capital, either as areduction to rate base or an element of the capital structure. Insome states using the reduction to rate base approach, utilitieshave lower portions of equity.
SCE rate case decisions have articulated reasons that SCE’scustomer deposits should offset rate base, SP U-16notwithstanding.
1139 SCE-10V2R1 at 82-94.
- 422 -
A.13-11-003 ALJ/KD1/ar9/jt2/lil PROPOSED DECISION (Rev. 12)
That the CPUC has set capital structure and cost for a decade, forSCE, knowing of this policy and presumably considers thecombined outcome to be reasonable.
The impact of the additional debt on SCE’s risk profile is small.Credit agencies have not made any downgrade of SCE as a resultof this policy.
There are material differences between SCE and PG&E, includingPG&E’s under-collection in certain balancing accounts.
There need not be any connection between ratemaking treatmentof nuclear fuel inventory and customer deposits. SCE’sremaining fuel balance is small.
TURN recommends a reduction to rate base for 90% of customer deposits
($180.629 million at the end of 2013). Interest expense should be authorized on
this 90%. TURN supports SCE’s community bank program for the remaining
10%.1140
SCE claims that TURN “ignores key attributes” of deposits and
“underplays” impacts on SCE. First, SCE states that it anticipates interest rates to
rise, increasing the import of the difference between deposits and other rate base
offsets. Second, SCE contends that deposits are debts, and therefore
distinguishable from other offsets. Third, SCE labels TURN’s comments no
financial risk as “conjecture” and claims that “without looking at each utility and
its particular circumstances . . . no valid insights” can be drawn. Fourth, SCE
reiterates that deposits are debt, not equity. Fifth, SCE contends that differences
between SCE and PG&E, in particular balancing account collections, are not
relevant. Finally, SCE contends that its remaining nuclear fuel inventory is
comparable to the amount of customer deposits.1141
1140 TURN-5 at 132-139.1141 SCE-26V2 at 66-70.
- 423 -

A.13-11-003 ALJ/KD1/ar9/jt2/lil PROPOSED DECISION (Rev. 12)
In our analysis, we first consider SCE’s point that drawing “valid insights”
about the financial implications of this policy requires an analysis of that utility’s
specific circumstances. We agree. However, we note that the majority of SCEs
testimony on this subject is very general. The only analysis SCE provides in its
direct showing that is specific to its circumstances are these points: 1) customer
deposits declined 19% in recent years, 2) the impact to SCE’s capital structure of
the policy is 0.5% if the separate impact of nuclear fuel is excluded or 0.9% if it is
included, 3) SCE estimates the effective rate of return to customers as 11.59%, and
4) SCE’s lost earnings as a result of the $190 million offset in 2012 exceeded $10
million. None of these facts are in dispute here, and TURN’s comments discuss
some of these facts as much as SCE does. TURN’s primary additional point that
is specific to SCE’s circumstances is to differentiate SCE and PG&E on the basis of
their balancing account collections. SCE remarkably dismisses TURN’s point as
irrelevant, despite the clear emphasis on balancing account collections discussed
in context of this issue in D.14-08-032. On balance, it appears that TURN’s
analysis of SCE-specific issues is as in-depth as SCE’s.
SCE has not provided any clear reason, other than those addressed in
previous decisions, to change our policy with respect to SCE here. Therefore, we
decline to make a change and find the existing policy reasonable. SCE’s rate base
shall be offset in the amount of $180.269 million, and SCE may charge an
offsetting interest expense based on the three-month commercial paper interest
rate. We approve the continued 10% for the community banking program, and
SCE may deposit up to $20.030 million in this manner.
However, we note that the issue of the proper rate making treatment of
customer deposits may be appropriately addressed in a future cost of capital
proceeding.
- 424 -
A.13-11-003 ALJ/KD1/ar9/jt2/lil PROPOSED DECISION (Rev. 12)
AFUDC23.6.
SCE presents its proposed rates for AFUDC.1142 No party contests these
rates. We find them reasonable.
Results of Examination24.
ORA states that it conducts examinations in accordance with §§ 314, 314.5,
and 309.5 of the Public Utilities Code. ORA describes certain recommendations
as a result of its examination of SCE’s records and controls.1143 We address
ORA’s recommendations in Section 12 above.
Operational Excellence (OpX)25.
OpX is a framework SCE has created to pursue “Continuous
Improvement” across the company, reduce costs, and improve efficiency. SCE
states that OpX benefits are seen as reductions in O&M expenses, particularly in
A&G accounts.1144 SCE forecasts OpX savings of over $80 million in O&M and
over $30 million in 2015 capital.1145 The drivers for these savings are discussed in
the specific subject sections above.
ORA proposes a number of increases to the forecast OpX savings that
appear to be the result of a misunderstanding of SCE’s use of the phrase “Add to
fully staff.” ORA claims that SCE did not provide any justification for these
“additional” positions.1146 However, SCE explains that the phrase refers to
shifting employees into existing, vacant positions during the OpX reorganization
process, not adding new employees.1147 ORA does not cite any reason that these
existing, vacant positions should not be filled. ORA’s proposal is rejected. No
1142 SCE-10V2R1 at 15-17.1143 ORA OB at 419-421. 1144 SCE-1 at 7.1145 SCE-10 V2R1 at 99.1146 See ORA OB at 422-437.1147 See SCE OB at 325, SCE-28 at 3, and SCE-28 at App. A.
- 425 -

A.13-11-003 ALJ/KD1/ar9/jt2/lil PROPOSED DECISION (Rev. 12)
other party disputes the level of OpX savings forecast by SCE. We find SCE’s
forecast of OpX savings reasonable.
SCE proposes that customers receive 100% of the benefits of 2013 and 2014
OpX savings in 2015 rates, as well as 100% of the 2015 benefits based on mature
cost savings initiatives. SCE further proposes a 50-50 sharing of incremental
savings estimated in 2015 for the course of the GRC cycle for business units such
as IT and Customer Service where savings are less certain.1148 SCE notes that
similar sharing approaches have been adopted before.1149
ORA proposes that 100% of 2015 savings in Customer Service and IT go to
ratepayers. ORA notes that OpX IT downsizing began in 2012 and argues that
customers have been overpaying for these earlier reductions during the
2012-2014 time period as support for its recommendation.1150 ORA calculates the
additional savings to ratepayers as $19.944 million for IT and $4.992 million for
Customer Service.1151 SCE explains that these savings are subject to capitalization
(37% for IT, 7% for customer service) and that in the case of IT, additional
expense is required to realize the savings. After these adjustments, the
incremental savings would be $3.796 million for IT and $4.643 million for
customer service.1152 Both parties make good points, and we adopt a compromise
that 75% of the 2015 forecast savings should go ratepayers, as calculated with the
adjustments for capitalization and additional expense. This resolution gives the
majority of forecast savings to ratepayers, but recognizes that SCE is not certain
to achieve the savings. Therefore we add $1.890 million and $2.321 million to the
forecast savings for IT and customer service, respectively.
1148 SCE-10 V2R1 at 100, SCE-28 at 13, and SCE OB at 319.1149 SCE OB at 319, citing D.91-12-076 and D.06-05-016.1150 ORA OB at 431-432, citing RT 253.1151 ORA-19 AR at 26; ORA OB 431.1152 SCE-28 at 11-12.
- 426 -

A.13-11-003 ALJ/KD1/ar9/jt2/lil PROPOSED DECISION (Rev. 12)
ORA proposes that 100% of “Financial Service Centralization” savings be
allocated to nine business operating units, excluding SONGS, arguing that these
savings were independent of SONGS.1153 SCE responds that a portion of these
savings were SONGS-specific, and should be removed from this GRC, consistent
with the Scoping Memo.1154 We agree with SCE, noting that in Section 12.1.1, we
approved SCE’s reduced forecast for certain finance expenses, including the
financial services centralization.
Joint Testimony Regarding Accessibility Issues26.
SCE and Center for Accessible Technology (CforAT) negotiated a joint
proposal to address accessibility issues tied to SCE’s role as a public utility and
aid SCE’s community of customers who have disabilities. The proposal increases
the scope of activities to be undertaken and takes key steps to institutionalize
such improvements. The parties forecast the average costs of this proposal as
$1.5 million per year during this GRC cycle, incremental to the requests discussed
elsewhere in this decision. Details of the program include:
SCE would be required to provide an annual report to CforAT(and other parties on request) on SCE’s annual spending eachApril. The report would identify SCE’s spending on accessibilityactivities.SCE would hire or designate a full time AccessibilityCoordinator. This person would have no other duties for at leasta year.Annual consultation about planned spending for the followingcalendar year.Costs include costs of the coordinator, trainings, and variousprojects related to ensuring SCE’s facilities and website areaccessible.SCE will track spending via one or more specific internalorders.1155
1153 ORA OB at 427-428.1154 SCE RB at 201-202.1155 SCE-12.
- 427 -

A.13-11-003 ALJ/KD1/ar9/jt2/lil PROPOSED DECISION (Rev. 12)
No party challenged or expressed any concern with the joint proposal.
While we support the goals of the joint proposal, we note that the specific cost
forecasts are very vague. Due to the fact that the parties propose a new program
that potentially includes costs across a wide variety of organizations within SCE,
we are willing to accept this forecast, but only on a temporary basis. If SCE
wishes to continue this program in the next GRC period, it must provide a
considerably more specific forecast and justification. In its direct showing, SCE
shall include: a description of the accomplishments of the program up to that
point, analysis of specific forecast costs, and demonstration that such costs are
complementary and not duplicative of other forecasts.
Settlements27.
Underserved and Hard-to-Reach Communities27.1.
On February 2, 2015 SCE and JMP filed and served a motion for adoption
of a settlement agreement. No other party commented on the motion or
settlement agreement. In the agreement, the parties agree to collaborate on a
variety of issues related to underserved and hard-to-reach communities. Some
specific commitments include:
Collaboration on outreach to minority and low-income customers1.about relevant Commission-authorized programs, including onimproving effectiveness criteria and metrics
Collaboration on outreach to hard-to-reach communities on2.safety issues and rate impacts.
SCE will hire or designate a full-time Veterans Coordinator.3.
SCE will consider JMP nominations for SCE’s Consumer Advisor4.Panel or Small Business Advisory Panel.
SCE will file testimony in its next GRC (or as directed by CPUC)5.on engagement with community-based organizations and SCE’sefforts on employment diversity.
- 428 -

A.13-11-003 ALJ/KD1/ar9/jt2/lil PROPOSED DECISION (Rev. 12)
SCE will strive to improve its supplier diversity.6.
In their joint motion, SCE and JMP assert that the settlement is reasonable
in light of the whole record, consistent with law, and in the public interest. We
agree that the settlement meets the requirements of Rule 12.1(d). In particular,
we note that improving safety-related communications to all communities is in
the public interest. Therefore, we approve the settlement between SCE and JMP.
Streetlights27.2.
On February 2, 2015 SCE and Cal-SLA filed and served a motion for
adoption of a settlement agreement. ORA and TURN contest the settlement.
CASL also filed and served comments on the settlement. On March 9, 2015 SCE
and Cal-SLA jointly replied to the comments of the other parties, and on April 7,
2015 filed and served an amendment to the joint reply comments.
In the settlement, SCE and Cal-SLA agree to work together to on issues
related to AB 719 and converting streetlights to Light Emitting Diode (LED)
bulbs. In particular, SCE agrees to work with Cal-SLA to develop an LED
proposal in R.13-11-005, propose a financing mechanism to eliminate upfront
capital costs to customers for LED conversion, explore the use of LEDs for new
installation programs, and conduct relevant stakeholder meetings. The parties
also agree to support SCE’s forecasts for streetlight programs, discussed in
Section 7.8 above.1156
ORA asks that the we reject “the part of the Settlement that would have the
Commission adopt SCE’s forecast for SCE’s streetlight programs.”1157 SCE and
Cal-SLA acknowledge that adopting the settlement does not require us to adopt
any particular forecast for the streetlight programs.1158 We agree.
1156 SCE and Cal-SLA, February 5, 2015 motion, Appendix B. 1157 ORA Comments on Settlement at 3.1158 SCE and Cal-SLA joint reply at 3.
- 429 -
A.13-11-003 ALJ/KD1/ar9/jt2/lil PROPOSED DECISION (Rev. 12)
TURN opposes the same provision of the settlement, alleging there was no
material disagreement between the parties on the level of costs.1159 As noted
above, the provision does not require us to adopt any particular forecast for the
streetlight programs.
CASL makes a number of comments related to the sale of SCE-owned
streetlights to public agencies.1160 SCE and Cal-SLA claim that the issues raised
by CASL are not relevant to the settlement or this proceeding more generally.1161
We agree.
We find that the settlement is not directly relevant to this proceeding, and
thus we neither approve nor reject the settlement. The settlement does not have
any direct impact on the revenue requirement ultimately approved in this
decision. SCE and Cal-SLA remain free to work with each other on LED and
streetlight issues in the manner discussed in the settlement; indeed, we
encourage such collaboration.
Other Issues28.
SCE and Logo28.1.
SCE disbursed $262,906 on clothing and other gear (excluding uniforms,
hard hats, etc.) containing the SCE name and logo in 2012. Embedded in
non-labor forecasts across numerous operational units, SCE has included a
nominal amount of expense (approximately $156,073) and the remaining amount
($92,536) was allocated to capital. SCE claims this gear is used primarily to
recognize high performance and improve morale.1162
1159 TURN Comments on Settlement. 1160 CASL Comments on Settlement.1161 SCE and Cal-SLA joint reply at 5.1162 SCE-28 at 27.
- 430 -

A.13-11-003 ALJ/KD1/ar9/jt2/lil PROPOSED DECISION (Rev. 12)
TURN claims that these are promotional and image-building expenses that
should not be charged to ratepayers. As a result, TURN proposes reducing O&M
by $0.156 million and gross plant by $0.324 million (2015 weighted average).1163
SCE contends that TURN offers “no rationale” to oppose this “nominal
gesture.” SCE claims these expenses motivate employees to put in extra effort,
and therefore benefit ratepayers. Further, SCE claims that the Commission has
considered and rejected similar adjustments in the 2003 and 2006 General Rate
Cases. SCE cites examples of California state agencies using similar recognition
programs for employees.1164
In PG&E’s most recent rate case, we adopted a similar proposal from
TURN with respect to O&M expense for this type of program. In that case, there
was no analogous capital recommendation.1165
We agree with SCE that this type of modest recognition program is a
reasonable means to motivate employees to perform well. However, we find that
SCE has not fully justified the particulars of its proposal, which we note is larger
than that of PG&E. Further, SCE’s testimony language suggests that some
portion of these costs may be used for other purposes. We disagree with SCE
that any of these costs should be capitalized as the items involved do not remain
utility property. Accordingly, we adopt TURN’s proposal in part and reduce
gross plant by $0.324 million (2015 weighted average). We do not reduce SCE’s
O&M forecasts on this basis. The remaining O&M funding is reasonable to allow
SCE to use this recognition approach to motivate employees to benefit ratepayer
interests.
1163 TURN-5 at 121-122.1164 SCE-28 at 27-29.1165 D.14-08-032 at 581.
- 431 -

A.13-11-003 ALJ/KD1/ar9/jt2/lil PROPOSED DECISION (Rev. 12)
Greenhouse Gas Revenues28.2.
TURN proposes a reduction to SCE’s revenue requirement on the basis of
the gross-up for Franchise Fees and Uncollectibles as well as a change in lag days
for cash working capital.1166 SCE shows that its balancing account handles this
gross-up consistent with Commission decisions and that 2015 GHG revenue
returns are in the scope of A.14-06-010.1167 SCE modified its revenue lag days
calculation based on TURN’s GHG recommendation in rebuttal.1168
Based on SCE’s explanation of the Franchise Fees and Uncollectibles, as
treated in the balancing account, we agree with SCE that TURN’s
recommendation is moot.
Comments on Proposed Decision29.
The proposed decision of the ALJ in this matter was mailed to the parties
in accordance with Section 311 of the Public Utilities Code and comments were
allowed under Rule 14.3 of the Commission’s Rules of Practice and Procedure.
Comments were filed on October 8, 2015 and reply comments were filed on
October 13, 2015 by SCE, ORA, TURN, SDG&E, and CUE.
ORA’s Cited “Unresolved Issues”29.1.
ORA suggests that the Proposed Decision does not resolve all issues in the
case. We disagree.
First, ORA suggests that there are errors in the RO model and that the
model constitutes a “black box” in violation of §1821. In response, SCE observes
that ORA itself has used the model extensively in this proceeding. ORA has
proposed no viable alternative, nor cited any specific errors that are not
addressed in this decision. Accordingly, we reject ORA’s argument.
1166 TURN-5 at 114-120.1167 SCE-26v1 at 26-27.1168 SCE-26V2 at 62-63.
- 432 -

A.13-11-003 ALJ/KD1/ar9/jt2/lil PROPOSED DECISION (Rev. 12)
Second, ORA suggests that the Commission has not addressed its proposal
for an Order to Show Cause related to SCE’s showing on intrusive and visual
pole inspections. We have reviewed the record and approve SCE’s forecast for
intrusive inspections. We do not find that any shortcomings in SCE’s showing on
the topic rise to the level of a violation.
Changes in Response to Comments29.2.
In response to comments, we have made a number of changes relative to
the Proposed Decision. Those changes include the following subjects:
Nuclear Generation in Section 6.3
Hydro O&M in Section 6.5.1
Ratemaking for PLP in Section 7.7.4
Streetlights Capital in Section 7.8.2.2.2
Manual Meter Reading O&M in Section 8.1.1
Customer Service OOR in Section 8.3
Personal Computers Capital in Section 9.2.4
Executive Incentive Compensation in Section 10.1
Short Term Incentive Compensation in Section 10.2
SONGS Marine Mitigation O&M in Section 11.2
Law Department O&M in Section 12.4.1
In addition to these subjects, we have also corrected errors and/or clarified
our discussion of certain issues.
We have changed some of the implementation timing requirements (e.g.
due dates for advice letters) in recognition of the timing of this decision.
Finally, we have also made certain changes in the RO Model. SCE filed a
motion to update the RO Model after the Proposed Decision was published; the
motion was granted by the ALJ and this decision uses the updated model. The
- 433 -

A.13-11-003 ALJ/KD1/ar9/jt2/lil PROPOSED DECISION (Rev. 12)
treatment of the tax-related ratebase offset adopted in Section 22.2 above is also
implemented differently in the version of the RO model supporting this decision
than the version supporting the Proposed Decision.
Assignment of Proceeding30.
Carla J. Peterman is the assigned Commissioner and Kevin Dudney is the
assigned ALJ in this proceeding.
Findings of Fact
Section 6.1
SCE bases its forecast of O&M and capital expenditures for power1.
procurement on expected numbers of new generators.
SCE’s forecast of O&M and capital expenditures for power procurement2.
are reasonable.
Section 6.4
SCE’s unopposed forecast of $0.308 million in O&M for Mohave3.
Generating Station is reasonable.
It is reasonable to eliminate the Mohave Balancing Account.4.
Section 6.5
There is no clear trend in recorded data for non-labor hydro O&M and a5.
long term average is appropriate to forecast these costs.
2013 recorded data is informative for FERC Account 536 and are6.
appropriate to include in the forecast.
Labor costs in FERC Accounts 539 and 545 have been steady and LRY is an7.
appropriate forecast basis for these costs.
A total hydro O&M forecast of $52.849 million is reasonable.8.
SCE’s uncontested revised rebuttal forecast for hydro capital is reasonable.9.
The forecast is ($ millions, nominal):
- 434 -
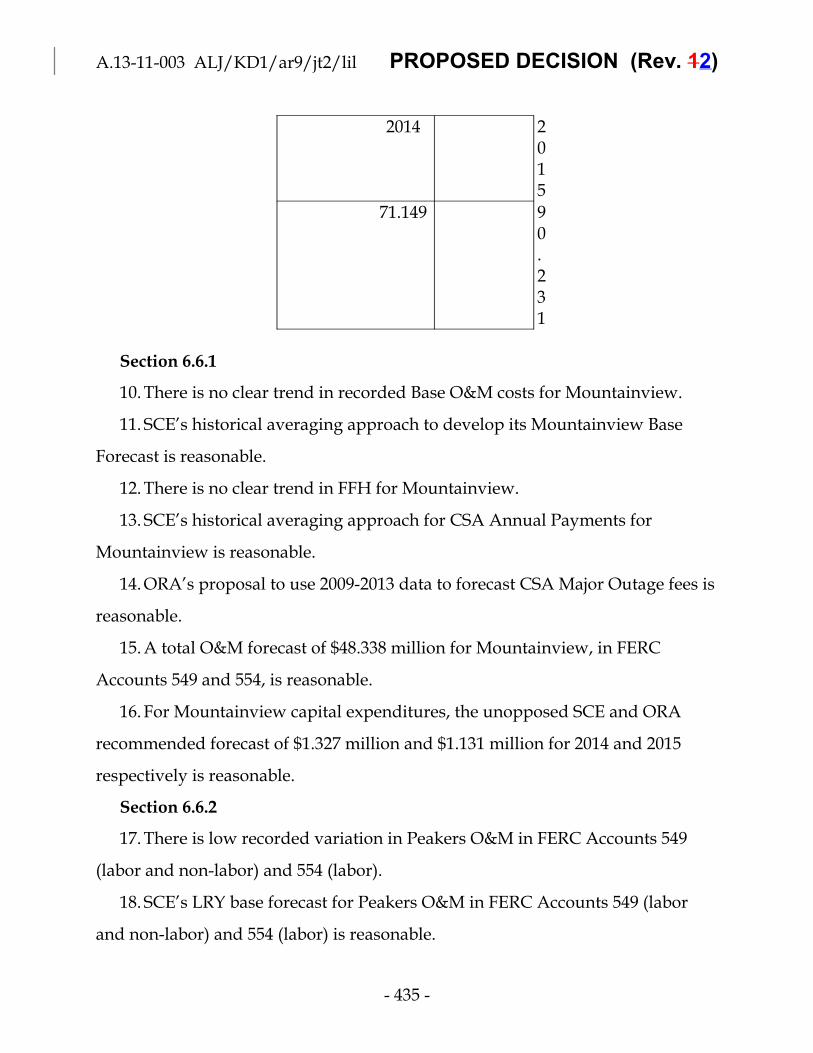
A.13-11-003 ALJ/KD1/ar9/jt2/lil PROPOSED DECISION (Rev. 12)
2014 2015
71.149 90.231
Section 6.6.1
There is no clear trend in recorded Base O&M costs for Mountainview.10.
SCE’s historical averaging approach to develop its Mountainview Base11.
Forecast is reasonable.
There is no clear trend in FFH for Mountainview.12.
SCE’s historical averaging approach for CSA Annual Payments for13.
Mountainview is reasonable.
ORA’s proposal to use 2009-2013 data to forecast CSA Major Outage fees is14.
reasonable.
A total O&M forecast of $48.338 million for Mountainview, in FERC15.
Accounts 549 and 554, is reasonable.
For Mountainview capital expenditures, the unopposed SCE and ORA16.
recommended forecast of $1.327 million and $1.131 million for 2014 and 2015
respectively is reasonable.
Section 6.6.2
There is low recorded variation in Peakers O&M in FERC Accounts 54917.
(labor and non-labor) and 554 (labor).
SCE’s LRY base forecast for Peakers O&M in FERC Accounts 549 (labor18.
and non-labor) and 554 (labor) is reasonable.
- 435 -

A.13-11-003 ALJ/KD1/ar9/jt2/lil PROPOSED DECISION (Rev. 12)
There is significant recorded variation in Peakers maintenance in FERC19.
account 554 (non-labor).
SCE’s four-year average base forecast for Peakers maintenance in FERC20.
account 554 (non-labor) is reasonable.
Because the McGrath peaker only operated for part of 2012, it is reasonable21.
to use 2013 recorded McGrath costs.
A total Peakers O&M forecast of $10.155 million is reasonable.22.
SCE’s capital expenditures request of $2.954 million in 2014 and $3.04323.
million in 2015 for the Peakers is reasonable.
Section 6.7
A total forecast of $3.503 million for SPVP O&M is reasonable. Added24.
facilities costs are not subject to escalation.
SCE’s has not established that its contract with or termination payment to25.
SunPower was prudent.
SCE’s SPVP capital expenditure request of $0.425 million for 2014 and26.
$1.035 million for 2015 is uncontested, and is reasonable.
SPVPBA can be eliminated.27.
TURN’s forecast of $4.360 million in O&M for Catalina is unopposed,28.
consistent with our guidelines, and is reasonable.
SCE has not demonstrated that its capital expenditure request for Catalina29.
is reasonable.
Some delays in the PB Project were beyond SCE’s control, but others were30.
not.
It is reasonable to allow SCE to recover Catalina AFUDC and capitalized31.
property taxes through the end of 2013, in addition to $5.1 million in capital
expenditures recorded by that time.
- 436 -

A.13-11-003 ALJ/KD1/ar9/jt2/lil PROPOSED DECISION (Rev. 12)
Two thirds of an FTE is appropriate for the fuel cell program.32.
Confidential availability data suggests that a reduction of $0.043 million in33.
non-labor for the fuel cell program is reasonable.
A total O&M forecast of $0.589 million is reasonable for the fuel cell34.
program.
The FCPMA can be eliminated.35.
Section 7.1 - (T&D – Policy)
The relationship between safety, reliability, and resiliency is complex.36.
Encouraging SCE to spend its authorized capital forecast on key programs37.
to meet our goals of safety, reliability, and resiliency and retain employees in
classifications responsible for this work is reasonable.
It is reasonable to adopt some type of RIIM-mechanism.38.
SCE’s proposed core RIIM capital categories WCR, Underground Cable39.
Life, CIC Replacement, Underground Switch, Underground Structure
Replacement, Circuit Breaker Replacements, and Substation Transformer
Replacement} are unopposed and are reasonable.
SCE’s proposed High Priority RIIM categories (customer growth, storms,40.
and claims) are unopposed and are reasonable.
SCE’s proposed RIIM staffing target proposal (2,225 employees in the41.
categories identified at SCE-3V1 at 27) is reasonable.
It is suboptimal to divert funding from core categories of the new SRIIM to42.
the High Priority categories, potentially delaying important work.
It is unreasonable to ask shareholders to fund core utility work.43.
It is reasonable to adopt the TURN/CUE proposal for the mechanics of the44.
SRIIM capital spending mechanism with the following modifications.
Overspending in the High Priority categories can offset underspending in the
- 437 -

A.13-11-003 ALJ/KD1/ar9/jt2/lil PROPOSED DECISION (Rev. 12)
core SRIIM categories if two conditions are true: the overspending in High
Priority categories exceeds ten percent of the adopted forecast for those
categories and SCE’s actual rate of return on rate base for the period does not
exceed the authorized rate of return. The first ten percent of overspending on
High Priority categories cannot be used to offset underspending in the core
SRIIM categories under any circumstance.
Section 7.2 - (T&D – Engineering and Grid Technology)
SCE has not fully quantified expected benefits of CRAS, but CRAS may45.
support efficient operation of variable renewable generation resources.
It is reasonable to approve SCE’s 2013 capital expenditure request for46.
CRAS and to allow SCE to reapply for capital expenditures in later years.
SCE requests $51.223 million in O&M for Engineering and Grid47.
Technology. ORA agrees with this forecast.
In order to account for capital expenditure disallowances, a portion of48.
SCE’s O&M forecast is disallowed. $51.058 million of SCE’s O&M request for
Engineering and Grid Technology is reasonable.
Portions of the Westminster Lab Upgrades and EDEF have not been shown49.
to be cost effective and/or focused on SCE specific issues. These capital
expenditures are unreasonable.
SCE has shown the remaining portions of its Engineering and Grid50.
Technology capital expenditures request to be reasonable.
It is reasonable to approve Engineering and Grid Technology capital51.
expenditures as follows ($000s): $40,217 in 2014 and $31,681 in 2015.
Section 7.3.1 - (Transmission Planning Projects)
SCE’s forecasts for uncontested transmission planning projects are52.
reasonable.
- 438 -

A.13-11-003 ALJ/KD1/ar9/jt2/lil PROPOSED DECISION (Rev. 12)
The fourth A-bank transformer at Victor Substation was needed for53.
reliability during construction.
SCE’s forecast for the Victor Substation is reasonable.54.
SCE’s forecasts for other transmission planning projects are reasonable.55.
Section 7.3.2 - (Load Growth Planning Projects)
SCE’s forecast of A-bank plan expenses for 2014-2015 is reasonable.56.
SCE’s forecast of subtransmission line plan expenses for 2014-2015 is57.
reasonable.
SCE’s DSP forecast for 2014-2015 reasonable.58.
Section 7.3.3 - (System Improvement/Reinforcement Program)
Some increase in the rate of circuit breaker replacement is warranted.59.
Funding for 60 circuit breaker replacements per year, or $9.887 million is60.
reasonable.
SCE’s forecast for the DSP circuit work category is reasonable.61.
SCE’s forecasts for Capacitor and Circuit Automation Programs are62.
reasonable.
SCE’s forecasts for Distribution Plant Betterment, Distribution VAR Plan,63.
and Substation Load Information Monitoring are reasonable.
Section 7.3.4 to 7.3.5
SCE’s 2014-2015 forecast for Generator Interconnection Program is64.
reasonable.
SCE’s 2014-2015 forecast for Added Facilities Projects is reasonable.65.
Section 7.4.1 (Underground Cable Programs)
SCE has developed new approaches for testing that initially appear66.
successful and cost-effective, at least for CIC.
- 439 -
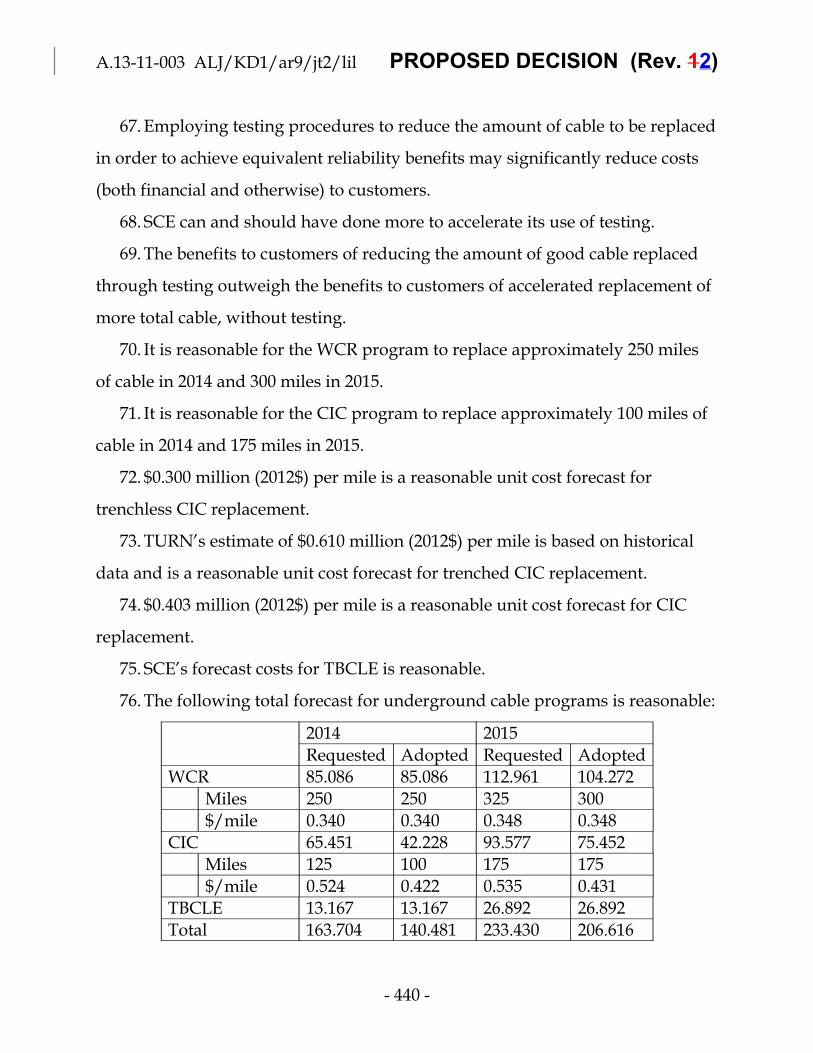
A.13-11-003 ALJ/KD1/ar9/jt2/lil PROPOSED DECISION (Rev. 12)
Employing testing procedures to reduce the amount of cable to be replaced67.
in order to achieve equivalent reliability benefits may significantly reduce costs
(both financial and otherwise) to customers.
SCE can and should have done more to accelerate its use of testing.68.
The benefits to customers of reducing the amount of good cable replaced69.
through testing outweigh the benefits to customers of accelerated replacement of
more total cable, without testing.
It is reasonable for the WCR program to replace approximately 250 miles70.
of cable in 2014 and 300 miles in 2015.
It is reasonable for the CIC program to replace approximately 100 miles of71.
cable in 2014 and 175 miles in 2015.
$0.300 million (2012$) per mile is a reasonable unit cost forecast for72.
trenchless CIC replacement.
TURN’s estimate of $0.610 million (2012$) per mile is based on historical73.
data and is a reasonable unit cost forecast for trenched CIC replacement.
$0.403 million (2012$) per mile is a reasonable unit cost forecast for CIC74.
replacement.
SCE’s forecast costs for TBCLE is reasonable.75.
The following total forecast for underground cable programs is reasonable:76.
2014 2015
Requested Adopted Requested Adopted
WCR 85.086 85.086 112.961 104.272
Miles 250 250 325 300
$/mile 0.340 0.340 0.348 0.348
CIC 65.451 42.228 93.577 75.452
Miles 125 100 175 175
$/mile 0.524 0.422 0.535 0.431
TBCLE 13.167 13.167 26.892 26.892
Total 163.704 140.481 233.430 206.616
- 440 -

A.13-11-003 ALJ/KD1/ar9/jt2/lil PROPOSED DECISION (Rev. 12)
($millions)
Section 7.4.2
Historical replacement rates are an important predictor of future77.
replacements.
Increasing the rate of A-bank replacements above the historical average is78.
an appropriate step to reduce safety and reliability risks.
It is reasonable to adopt SCE’s recorded A-bank replacements for 2013 and79.
3.5 CPUC-jurisdictional replacements in each of 2014 and 2015, for a total of nine
A-bank replacements.
SCE’s uncontested unit costs for A-bank replacements are reasonable.80.
Section 7.4.3
It is reasonable to allow SCE funding to reduce in-service circuit breaker81.
failures.
A small increase in the rate of circuit breaker replacements to 180 per year82.
above the adopted rate of 175 in the last GRC is reasonable.
SCE’s uncontested unit costs for circuit breaker replacements are83.
reasonable.
Section 7.4.4
ORA’s uncontested forecast for B-bank transformer replacements is84.
reasonable.
SCE’s uncontested forecasts for 4kV Circuit replacement programs are85.
reasonable.
SCE’s uncontested forecasts for other infrastructure replacement programs86.
are reasonable.
Section 7.5.1
- 441 -

A.13-11-003 ALJ/KD1/ar9/jt2/lil PROPOSED DECISION (Rev. 12)
The methods adopted for calculating customer driven expenses and87.
expenditures should be applied to the forecast of new meters and other items
adopted in this decision, instead of any party’s forecast of those values.
The actual number of meters installed in the post-test years is forecast to be88.
considerably higher than in 2015.
SCE’s proposal to levelize the forecast of Account 586.140, Meter89.
Installation and Replacements is reasonable.
The attrition mechanism is consistent with rent inflation in the Distribution90.
Line Rents portion of Account 588.140 and this forecast does not need to be
levelized.
SCE’s forecasts for other elements of 588.140 and all of account 588.271 are91.
uncontested and are reasonable.
The total O&M forecast for Customer-Driven Programs and Distribution92.
Construction of $15.573 million is reasonable.
Section 7.5.2
All else equal, a weighted average is likely to be less influenced by outliers93.
and is preferable to an arithmetic average.
TURN’s recommended five-year weighted average approach to calculate94.
unit costs of customer meter connections is reasonable.
TURN’s regression models for calculating unit counts of meter connections95.
are reasonable.
ORA’s uncontested forecast for Rule 20A undergrounding expenditures is96.
reasonable.
TURN’s uncontested unit cost and approach for calculating unit counts for97.
Rule 20B&C undergrounding expenditures is reasonable.
- 442 -

A.13-11-003 ALJ/KD1/ar9/jt2/lil PROPOSED DECISION (Rev. 12)
The following total capital forecast for disputed items of Customer-Driven98.
Programs and Distribution Construction (including transformers and
prefabrication) is reasonable: $384.259 million in 2014 and $497.795 million in
2015 (nominal$).
Section 7.6.1 - Underground Structures
Changes specifically identified by SCE are inadequate to explain the99.
increase in failure rate of underground structures.
Unit repair and replacement costs for underground structures are100.
likely to decline with economies of scale.
SCE has an existing queue of underground structures that have101.
failed an inspection.
Structures that have failed an inspection pose a hazard.102.
It is reasonable to approve O&M as follows for underground103.
structures (millions of 2012$):
Requested Approved
Account 583.120 593.120 583.120 593.120
Labor 4.523 1.669 4.523 1.335
Non-Labor 1.678 14.964 1.678 11.971
Total 6.201 16.633 6.201 13.306
It is reasonable to approve capital expenditures for underground104.
structure replacement as follows (millions of nominal $):
2014 2015
Requested $ 67.500 $ 67.500
Approved $ 54.000 $ 54.000
Section 7.6.2
SCE’s use of LRY to forecast distribution maintenance O&M is105.
appropriate.
- 443 -

A.13-11-003 ALJ/KD1/ar9/jt2/lil PROPOSED DECISION (Rev. 12)
It is reasonable to approve SCE’s uncontested distribution106.
maintenance O&M forecast as follows:
Account 593.120 594.120 Total
millions of 2012$ 50.879 27.454 78.333
It is reasonable to approve SCE’s uncontested distribution107.
maintenance capital forecast as follows:
2014 2015
250.396 255.713
Section 7.6.3 - DIMP O&M
SCE’s decision to require inspectors performing an ODI to access108.
each pole is appropriate.
SCE’s forecast of additional ODI costs to reach difficult-to-access109.
poles is credible.
SCE’s ten-year, grid-based intrusive inspection cycle as a reasonable110.
approach to reduce risk and reduce unit costs.
In order for SCE to complete the transition to grid-based inspections,111.
it is necessary to intrusively inspect more poles than would be possible under
ORA’s forecast.
SCE’s uncontested forecast of JPO expenses based on LRY is112.
reasonable.
SCE may be under-collecting joint pole credits.113.
Increases in pole inspections are likely to increase the amount of114.
joint pole penalty credits.
A forecast of $4 million for joint pole credits is reasonable.115.
A review of pole credits in the next GRC is worthwhile.116.
SCE’s overhead conductor program mitigates conductor failure risk.117.
- 444 -

A.13-11-003 ALJ/KD1/ar9/jt2/lil PROPOSED DECISION (Rev. 12)
SCE presents credible cost assumptions for the overhead conductor118.
program.
SCE’s cost forecast for the overhead conductor program is119.
reasonable.
SCE’s forecasts for the uncontested elements of Accounts 593.120120.
and 594.120 are reasonable.
SCE’s request to close the Bark Beetle CEMA is reasonable.121.
Section 7.6.4 - Poles – Capital Expenditures
Pole replacement unit costs increased significantly during 2009 to122.
2012.
A 3% reduction to SCE’s unit costs for transmission and distribution123.
pole replacement costs is reasonable.
SCE’s forecast of cost of removal is based on recorded, actual costs124.
incurred, net of joint pole credits, and does not double count cost of removal.
SCE’s forecast of deteriorated pole replacements is based on past125.
and predicted inspection failures.
SCE’s forecast of deteriorated pole replacements is reasonable.126.
Pole inspection failure rates are much lower beginning in 2009, after127.
poles were being inspected for the second time under the GO 165 inspection
program.
SCE’s data clearly shows lower failure rates for all poles (both aged128.
and non-aged) that are much lower in 2009 and beyond than in 2008 and earlier.
Infrastructure replacement may be appropriate in circumstances of129.
limited effective testing options; SCE has not demonstrated this circumstance in
the case of the aged pole replacements.
- 445 -

A.13-11-003 ALJ/KD1/ar9/jt2/lil PROPOSED DECISION (Rev. 12)
9,000 aged pole replacements in 2014 provides a reasonable ramp up130.
in 2014 toward the approved level of pole replacements for PLP in 2015, making
2014 approximately a mid-point between 2013 and 2015 levels.
The following forecast of aged pole replacements is reasonable:131.
Aged Pole Replacements 2014 2015
Poles Replaced Adopted 9,000 0
Requested 14,500 1,898
Nominal$,millions
Adopted 114.32 0
Requested 184.189 24.622
SCE’s uncontested forecast of $100 per wood pole disposal is132.
reasonable.
Section 7.6.5 - Other Capital
SCE’s Distribution Inspection and Maintenance capital expenditure133.
forecasts that are not specifically addressed are uncontested and are reasonable.
Section 7.7.2.1 - PLP Assessments and Planning
Economy of scale may decrease unit costs of pole assessments.134.
ORA’s proposed $106 per pole based on recorded data is a135.
reasonable forecast of pole assessments.
The public interest in quickly developing a more comprehensive136.
understanding of the extent of overloaded poles outweighs the potential cost
deferral advantage of slowing the pace of assessments.
SCE’s proposed ten-year assessment schedule is reasonable.137.
SCE’s uncontested forecast of planning and analysis is reasonable.138.
The following total forecast for PLP assessments is reasonable:139.
- 446 -

A.13-11-003 ALJ/KD1/ar9/jt2/lil PROPOSED DECISION (Rev. 12)
2014 2015
Assessments per year 205,754 205,754
Unit Cost (2012$) $ 106 $ 106
Subtotal (millions of 2012$) $ 21.810 $ 21.810
Planning & Analysis Cost (millionsof 2012$) $ 0.301 $ 1.812
Total Assessment Cost (millions of2012$) $ 22.111 $ 23.622
89% to 583.125 – Distribution $ 19.678 $ 21.023
11% to 566.125 - Transmission $ 2.433 $ 2.599
Section 7.7.2.2 - PLP Repair
SCE’s uncontested unit costs for repairs are reasonable.140.
SCE’s total forecast of repair costs is reasonable.141.
Section 7.7.2.3 - PLP Related Expense
The relation between the replacement forecast and related expense is142.
uncontested and is reasonable.
Section 7.7.2.4 - Joint Pole Organization
The relation between the replacement forecast and JPO expense is143.
uncontested and is reasonable.
Section 7.7.3 - PLP Capital
Nearly 19%, of poles reviewed in SCE’s PLP study are overloaded,144.
and specifically failed the bending analysis. The study suggests similar failure
rates in SCE’s total population of poles.
An additional 3% of poles in the study are overloaded and could be145.
repaired through addition or repair of guy wires. The study suggests a similar
rate in the total pole population.
Overloaded poles present a significant safety hazard and reliability146.
risk.
- 447 -

A.13-11-003 ALJ/KD1/ar9/jt2/lil PROPOSED DECISION (Rev. 12)
Approximately 70% of poles are joint use, supporting attachments of147.
either renters, joint owners, or both.
Attachments contribute to overloading.148.
Credits from joint users are less than 10% of SCE’s pole replacement149.
forecast.
Options besides replacing overloaded poles should be considered.150.
PLP assessments should provide factual information about the151.
extent to which attachments contribute to any valid safety or reliability concerns
and potentially non-compliance with GO 95 standards.
Cost sharing in proportion to the contribution to pole overloading is152.
not unduly discriminatory or anticompetitive.
For purposes of 2014 and 2015 capital expenditures, SCE’s forecast of153.
$844 (2012$) in credits per pole replaced is reasonable.
SCE may be able to remediate additional overloaded poles beyond154.
those that are replaced at SCE ratepayer expense, either by removing
attachments, strengthening existing poles, or achieving greater cost share
contributions from joint pole users.
To the extent that poles can be remediated without replacement,155.
fewer total poles may need to be replaced over the entire span of PLP to achieve a
target level of safety and reliability improvements.
Overlap between PLP and other programs may reduce the number156.
of poles ultimately replaced by PLP.
A forecast of 20% remediation without SCE ratepayer funded157.
replacement is reasonable in light of the balancing account treatment adopted
here and the considerable uncertainty surrounding the total number of poles
replaced.
- 448 -

A.13-11-003 ALJ/KD1/ar9/jt2/lil PROPOSED DECISION (Rev. 12)
An estimate of 12% overlap between PLP and other pole158.
replacements strikes a reasonable middle ground between the likely limited
overlap in the early years and the higher potential overlap in later years.
A forecast of 3,000 PLP pole replacements in 2014 and 18,213 in 2015159.
is reasonable.
The following capital expenditures forecast is reasonable for PLP160.
pole replacements:
Millions of Nominal$ 2014 2015
Distribution $32.899 $203.963
Transmission $6.585 $41.043
Total $39.485 $245.006
The relationships between other expenditures related to PLP and the161.
number of pole replacements are undisputed, and SCE’s proposals are
reasonable.
The following ratios should be used to calculate forecasts of other162.
capital expenditures related to PLP.
Ratios Based on Pole Replacements
2014 2015
1 0.6778103
The total adopted pole replacement capital forecast summarized163.
below is reasonable (millions of nominal$).
SCE Adopted
2014 2015 2014 2015
Pole Replacements -Distribution
$33.916 $288.636 $32.899 $203.963
Pole Replacements -Transmission
$.789 $58.080 $6.585 $41.043
Malibu adjustment $(5.130) $ - $(5.130)
Distribution $1.371 $11.668 $1.371 $8.500
- 449 -

A.13-11-003 ALJ/KD1/ar9/jt2/lil PROPOSED DECISION (Rev. 12)
Transformers
Prefabrication $0.931 $7.926 $0.931 $5.774
Joint Pole - Distribution $(2.360) $(20.083) $(2.360) $(14.631)
Joint Pole -Transmission
$(0.289) $(2.476) $(0.289) $(1.804)
Wood Pole Disposal $0.314 $2.674 $0.314 $1.948
Total $40.672 $341.295 $39.452 $239.664
Section 7.7.4 - PLP Ratemaking
SCE’s uncontested PLPBA proposal, as revised to include164.
deteriorated poles, is reasonable.
A 15% cap on expenditures over forecast in the PLPBA is a165.
reasonable protection for ratepayers during 2016 and 2017.
Section 7.8.1
GCC staffing must increase to accommodate increases in work due166.
to the growing electric grid.
SCE’s forecast for Account 561.170 is reasonable.167.
SCE’s five-year average forecast method for storm expenses is168.
reasonable given the inherent variability of storm expenses.
SCE’s storm expenses forecast is reasonable.169.
The amount of overtime identified by ORA is less than half the cost170.
of 18 additional troublemen.
Troublemen overtime can only be partially replaced by normal171.
hours.
SCE’s forecast for Account 583.170 is reasonable.172.
SCE’s uncontested forecast for Account 585.170 is reasonable.173.
SCE’s O&M forecasts for uncontested Grid Operations accounts are174.
reasonable.
- 450 -

A.13-11-003 ALJ/KD1/ar9/jt2/lil PROPOSED DECISION (Rev. 12)
A total Grid Operations O&M forecast of $111.801 million (2012$) is175.
reasonable.
Section 7.8.2
SCE’s five-year average forecast method for storm expenditures is176.
reasonable given the inherent variability of storm expenses.
SCE’s storm expenditures forecast is reasonable.177.
Using recently recorded data is valuable to calculate unit costs for178.
steel pole replacements due to the inconsistency in how the numbers have been
developed in recent GRCs.
A steel pole replacement unit cost of $6,000 (2012$) is in the range of179.
values presented by the parties and is a reasonable estimate.
The evidence suggests that low percentages of inland poles suffer180.
significant corrosion.
The data provided from SCE’s recent postmortem analysis suggest181.
that poles within ten miles of the ocean are likely corroding.
An annual rate of 3,900 steel pole replacements is reasonable.182.
SCE’s rebuttal proposal for luminaire unit costs and replacement183.
counts is reasonable.
SCE’s uncontested forecast for breakdown maintenance spending is184.
reasonable.
SCE’s uncontested forecast for operational facilities maintenance is185.
reasonable.
The following forecast of Grid Operations Capital is reasonable.186.
(millions of nominal$) 2014 2015
Storm $ 47.084 $ 48.110
Transmission $ 4.562 $ 4.683
Substation $ 0.316 $ 0.325
- 451 -
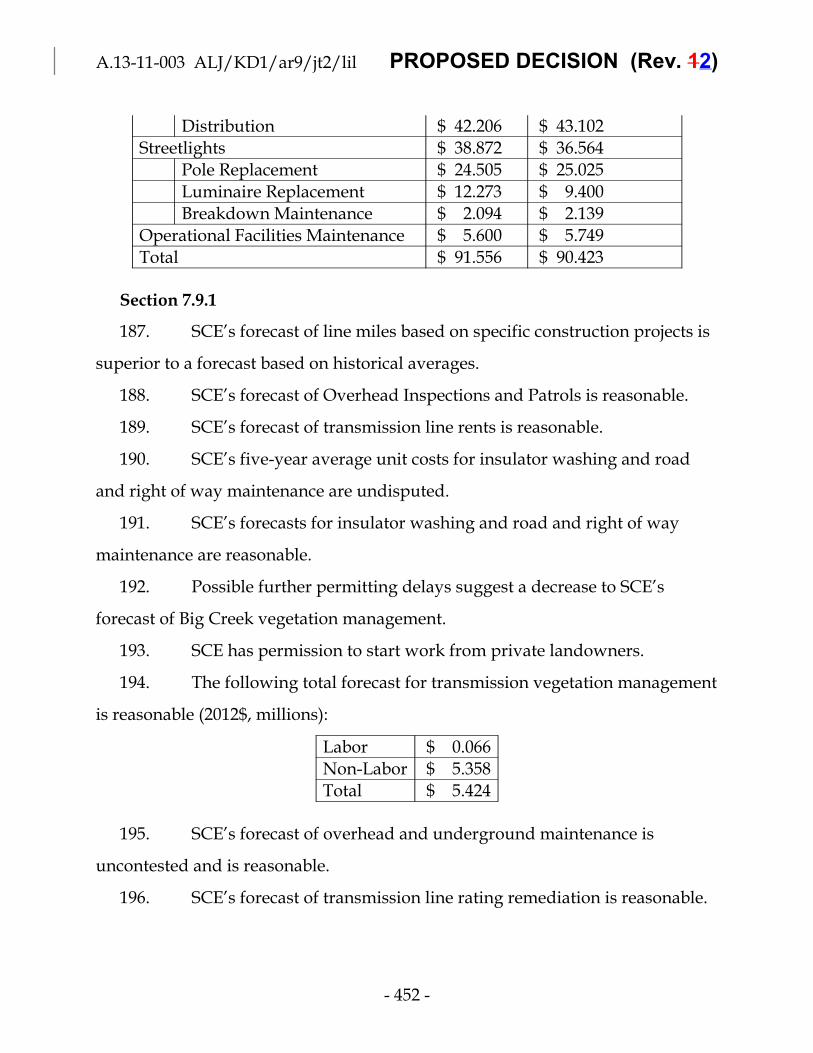
A.13-11-003 ALJ/KD1/ar9/jt2/lil PROPOSED DECISION (Rev. 12)
Distribution $ 42.206 $ 43.102
Streetlights $ 38.872 $ 36.564
Pole Replacement $ 24.505 $ 25.025
Luminaire Replacement $ 12.273 $ 9.400
Breakdown Maintenance $ 2.094 $ 2.139
Operational Facilities Maintenance $ 5.600 $ 5.749
Total $ 91.556 $ 90.423
Section 7.9.1
SCE’s forecast of line miles based on specific construction projects is187.
superior to a forecast based on historical averages.
SCE’s forecast of Overhead Inspections and Patrols is reasonable.188.
SCE’s forecast of transmission line rents is reasonable.189.
SCE’s five-year average unit costs for insulator washing and road190.
and right of way maintenance are undisputed.
SCE’s forecasts for insulator washing and road and right of way191.
maintenance are reasonable.
Possible further permitting delays suggest a decrease to SCE’s192.
forecast of Big Creek vegetation management.
SCE has permission to start work from private landowners.193.
The following total forecast for transmission vegetation management194.
is reasonable (2012$, millions):
Labor $ 0.066
Non-Labor $ 5.358
Total $ 5.424
SCE’s forecast of overhead and underground maintenance is195.
uncontested and is reasonable.
SCE’s forecast of transmission line rating remediation is reasonable.196.
- 452 -

A.13-11-003 ALJ/KD1/ar9/jt2/lil PROPOSED DECISION (Rev. 12)
SCE’s forecast of substation circuit breaker maintenance, based on197.
specific projects, is reasonable.
SCE’s uncontested distribution relay inspection forecast is198.
reasonable.
It is reasonable to base a forecast of transmission relay inspections on199.
1,178 relay inspections per year, the rate needed to actually levelize inspections
over the six-year period identified by SCE.
The following forecast for transmission relay inspections (Account200.
568.150) is reasonable (millions of 2012$).
Total $ 3.463
Labor $ 2.874
Non-Labor $ 0.589
A total transmission and substation maintenance O&M forecast of201.
$84.739 million (2012$) is reasonable.
Section 7.9.2
In the case of unplanned work, there is no clear inverse relationship202.
or anti-correlation between amounts spent in one year and needed in later years.
SCE’s forecast of variable reactive work appropriately uses a203.
five-year average.
SCE’s forecast of predictable planned work appropriately uses 2012204.
recorded.
SCE’s forecast for transmission capital maintenance work is205.
reasonable.
SCE’s five-year average forecasts of transmission and substation206.
claims are reasonable.
SCE’s forecast of line rating remediation is reasonable.207.
- 453 -

A.13-11-003 ALJ/KD1/ar9/jt2/lil PROPOSED DECISION (Rev. 12)
SCE provided a reasonable, project-based forecast of transmission208.
relocation expenditures.
For long lasting transmission tools and work equipment, it is209.
reasonable to expect that increased spending in one year would lead to a
decreased need to replace equipment in the immediately following years.
Preliminary 2014 recorded information cited by ORA is consistent with that
expectation.
ORA’s 2014-2015 forecast of transmission tools and work equipment210.
is reasonable.
SCE’s forecast of substation capital maintenance is reasonable.211.
SCE’s forecast of online transformer monitoring is reasonable.212.
For the substation protection and control equipment being replaced213.
according to a multi-year plan, it is reasonable to expect that increased spending
in one year would lead to a decreased need to replace equipment in the following
years.
ORA’s 2014-2015 forecast for substation protection and control214.
replacements is reasonable.
For long lasting substation tools and work equipment, it is215.
reasonable to expect that increased spending in one year would lead to a
decreased need to replace equipment in the immediately following years.
Preliminary 2014 recorded information cited by ORA is consistent with that
expectation.
ORA’s 2014-2015 forecast of substation tools and work equipment is216.
reasonable.
SCE’s uncontested forecasts for transmission and substation spare217.
parts are reasonable.
- 454 -

A.13-11-003 ALJ/KD1/ar9/jt2/lil PROPOSED DECISION (Rev. 12)
A total transmission and substation maintenance capital forecast of218.
$121.636 million (nominal$) in 2014 and $131.865 million in 2015 is reasonable.
Section 7.10 (T&D – Safety, Training, and Environmental Programs)
SCE’s approach to developing its forecast by considering specific219.
training needs and number of relevant employees is preferable to relying only on
2012 recorded.
Training costs are directly related to the number of employees,220.
particularly new employees.
Since our total adopted labor forecast is lower than SCE’s it is221.
reasonable to adopt a 10% lower training forecast.
SCE’s modest employee recognition programs promote safety.222.
SCE’s employee recognition forecasts are reasonable.223.
SCE’s uncontested forecasts are reasonable.224.
A total forecast of $65.912 million (2012$) for T&D Safety, Training225.
and Environmental Programs is reasonable.
Section 7.11 - T&D – Other Costs and Other Operating Revenue
Productivity improvements alone may not be adequate to address226.
the forecast growth in number of contracts.
SCE is likely able to make further productivity improvements in227.
Grid Contract Management.
Considering potential productivity improvements, $0.300 million,228.
approximately enough for three additional employees, is a reasonable increase
for Grid Contract Management.
A total forecast of $2.226 million is reasonable for Grid Contract229.
Management.
- 455 -

A.13-11-003 ALJ/KD1/ar9/jt2/lil PROPOSED DECISION (Rev. 12)
A forecast of $2.625 for Meter Credits in Account 586.281 is230.
reasonable.
TURN’s proposed forecast of $9.793 million for write-offs in Account231.
588.281 is reasonable.
A 5YA ($10.148 million) for underground locating services is232.
reasonable given the uncertainty in both price and volume moving forward.
SCE’s approach to forecasting capital-related expense based on the233.
historical relationship and the adopted capital forecast is reasonable.
A total reduction of 10% to account for reductions in the adopted234.
capital expenditures forecast for T&D is reasonable.
The following total forecast for capital-related expense is reasonable235.
(millions of 2012$).
Account Description SCE Adopted
560.281Transmission/Substation Capital-RelatedExpense $ 8.778 $ 7.900
594.281 Distribution Capital-Related Expense $ 17.159 $ 15.443
2012 may represent unsustainably low levels of maintenance.236.
SCE’s forecasts of facilities O&M based on 2011 are reasonable.237.
SCE’s uncontested forecasts are reasonable.238.
A total forecast for operational support and other costs of $64.505239.
million (2012$) is reasonable.
ORA’s uncontested forecasts of SCE-financed240.
added/interconnection facilities are reasonable.
SCE’s rebuttal forecast of customer-financed added/interconnection241.
facilities is reasonable.
A total forecast of OOR of $128.369 million (2012$) is reasonable.242.
Section 8.1 - Customer Service O&M
- 456 -
A.13-11-003 ALJ/KD1/ar9/jt2/lil PROPOSED DECISION (Rev. 12)
There are important changes occurring at SOC that are not captured243.
by historical data.
SCE’s forecast of automatic meter reads and SOC costs is reasonable.244.
2013 costs per manual meter read are most representative given the245.
recent changes in the number and distribution of meters.
TURN’s forecast manual meter reading cost is reasonable.246.
A total forecast for O&M in Account 902 of $16.771 million (2012$) is247.
reasonable.
It is reasonable to deny SCE’s request of $173,000 for the Service248.
Guarantee Program, consistent with past precedent that ratepayers are not
responsible for reimbursing inconvenienced customers.
SCE’s Medical Baseline Program forecast was based on historic249.
growth and the historic ratio of enrolment volume to total program participation.
SCE’s request for incremental funding of $250,000 for the Medical250.
Baseline program is reasonable.
Call center employees face increasingly complex tasks, warranting251.
both increased supervision and increased wages; these specific wage increases
are tied to a change in job skills required, not general inflation.
SCE’s revised forecast of $47.435 million for Account 903.800 is252.
reasonable.
A historical average of uncollectible expense is appropriate to avoid253.
undue influence of variable economic factors.
SCE’s forecast uncollectible factor of 0.238% is reasonable.254.
SCE’s 2013 recorded costs for PMO are well below SCE’s forecast,255.
despite including a significant portion of the increase in functions described for
the test year.
- 457 -
A.13-11-003 ALJ/KD1/ar9/jt2/lil PROPOSED DECISION (Rev. 12)
ORA’s proposed PMO forecast is a significant increase over 2012256.
recorded, and allows SCE some funding to implement the additional functions it
proposes.
ORA’s proposed averaging approach for PMO is appropriate given257.
the recorded fluctuations in this account.
ORA’s proposed $6.343 million PMO forecast is reasonable.258.
O&M charged to Account 586.400 is based on the total meter259.
population, more than the number of new meters.
New functions in ESC create incremental costs.260.
SCE’s forecast for Account 586.400 is reasonable.261.
With the implementation of ESC and the accuracy of the data being262.
analyzed and the ability to detect patterns of theft which triggers follow-up and
investigations that previously would not have happened, new Customer
Installation and Energy Theft expenses will arise.
SCE’s forecast for Account 587 of $7.946 million ($6.947 million263.
Labor and $0.999 million Non-Labor) is reasonable.
SCE’s forecast for Account 908.600 is uncontested and is reasonable.264.
Section 8.2 - Customer Service Capital
SCE’s revised meter unit cost forecast is uncontested and is265.
reasonable.
There is no correlation between growth meters and replacement266.
meters.
SCE’s forecast of residential replacement meters is reasonable.267.
SCE’s data shows a clear downward trend for volumes of268.
non-residential meter replacements, with overall changes from 2008 to 2013 from
negative 77% to negative 83%.
- 458 -

A.13-11-003 ALJ/KD1/ar9/jt2/lil PROPOSED DECISION (Rev. 12)
ORA’s proposed volumes of non-residential meter replacements,269.
based on 2013 recorded, is reasonable.
ORA’s proposed $1,400 RTEM meter unit cost is reasonable.270.
SCE’s updated forecast of legacy/opt-out meters based on271.
D.14-12-078 is reasonable.
ORA’s forecasts of PCAN meters and delayed ESC meter272.
installations are reasonable.
A total MSO capital forecast of $13.888 million in 2014 and $16.392273.
million in 2015 is reasonable.
SCE has shown that its capital request for BCD will be used for274.
reasonable improvements to energy education centers and to assist customers
seeking to improve energy consumption management.
SCE’s BCD capital forecast is reasonable.275.
Section 8.3 - Customer Service – OOR
SCE’s charges and fees other than those related to ESC Opt-Out are276.
uncontested and are reasonable.
A total Customer Service OOR forecast of $28.73125.569 million is277.
reasonable.
Section 9.1 - IT – O&M
Since recorded values for ITS are neither stable nor do they indicate278.
a trend, the four-year averaging methodology proposed by ORA is the most
appropriate for determining the baseline forecast.
Many of the costs cited by SCE as reasons for an increase in ITS are279.
captured in historical cost data.
- 459 -
A.13-11-003 ALJ/KD1/ar9/jt2/lil PROPOSED DECISION (Rev. 12)
To account for new licenses and some escalation in the cost of280.
existing licenses, it is reasonable to allow $4.170 million of the itemized increase
to be added to the non-labor baseline.
SCE’s OpX reductions for ITS consider headcount reductions.281.
The following forecast of ITS O&M for ITS is reasonable: $4.180282.
million for Labor and $66.501 million for Non-Labor, and a total of $106.680
million (2012$).
SCE hired 78% of its C&C non-labor positions in 2013 and hired at283.
least two more contractors in 2014 out of a forecast four.
Addressing C&C issues is important.284.
Since SCE has demonstrated the critical nature of cybersecurity and285.
compliance and that costs are growing, in this instance, we find that an increase
of 22% (double the labor rate) over the 2014 non-labor forecast to $9.855 million,
is appropriate.
C&C labor expenses have risen gradually, while there has been a286.
decrease in non-labor expenses from 2010 to 2012.
SCE’s increase in the labor forecast from 2014 to 2015 is in line with287.
year-to-year increases starting in 2011.
SCE’s labor forecast of $7.529 million for C&C is reasonable.288.
CS&P functions are either complimentary or different in scope,289.
despite having similar descriptions.
A small amount of SONGS-related costs were not removed from the290.
historical costs as directed in the Scoping Memo.
It is reasonable to estimate that “small amount” to be $0.150 million,291.
half labor and half non-labor.
- 460 -

A.13-11-003 ALJ/KD1/ar9/jt2/lil PROPOSED DECISION (Rev. 12)
CS&P productivity benefits include ensuring that highest value292.
projects are implemented.
A CS&P forecast of $17.666 million is reasonable.293.
O&M savings for past capital projects are included in recorded data.294.
SCE’s forecast of $8.820 million for incremental O&M associated295.
with new software is reasonable.
A total O&M forecast of $220.546 million (2012$) is reasonable.296.
Section 9.2 - Information Technology – Capital
Expenditures in 2015 are appropriate as part of planning, designing,297.
and pre-staging the Alhambra Data Center’s servers and infrastructure.
SCE’s $13.6 million 2015 forecast for the Alhambra Data Center is298.
reasonable.
SCE’s 2015 forecast for Midrange Enterprise Servers Hardware of299.
$39.504 million is reasonable.
SCE’s need to refresh additional computers was due to delays in300.
2013 and this need is recurring, adding the 2013 underspend to the original 2014
forecast is reasonable.
SCE’s 2014 and 2015 forecasts for personal computers of $10.347301.
million and $9.128 million respectively are reasonable.
The need for expanded network capacity to accommodate increased302.
data traffic has existed for several years without resulting in an increase in actual
expenditures.
Since SCE’s spending in transmission network facilities will address303.
expenditures typical for the last five years, ORA’s five-year recorded cost average
methodology is reasonable.
- 461 -

A.13-11-003 ALJ/KD1/ar9/jt2/lil PROPOSED DECISION (Rev. 12)
A Transmission Network Facilities forecast of $15.471 million for304.
both 2014 and 2015 is reasonable.
SCE’s stated desire to expeditiously replace 188 miles of “obsolete”305.
fiber cable has, to date, not been matched by its actions.
ORA’s 2015 forecast of $1.620 million for cable replacement, based306.
on actual amounts scheduled in 2013 and 2014, is reasonable.
It is reasonable to carry forward a portion of SCE’s 2013307.
underspending into 2014.
$2.000 million is a reasonable forecast of fiber optic cable308.
replacement in 2014.
It is reasonable to approve a forecast of 16 microwave units per year,309.
based on the 2009-2013 average, for each of 2014 and 2015, for a forecast of $2.640
million each year.
SCE’s forecasts of $4.601 million for 2014 and $14 million for 2015 for310.
mobile radio system replacement are reasonable.
ORA’s five-year recorded cost average is the most appropriate311.
methodology for risk management disaster recovery, given SCE’s failure to
differentiate items as “enhancement” or “refresh.”
ORA’s forecast of $2.549 million for both 2014 and 2015 for risk312.
management disaster recovery is reasonable
SCE’s telecom forecasts are tied directly to their individual projects;313.
i.e. the forecast costs go up or down depending on the number and size of the
projects each year.
SCE’s forecast of telecom costs of $43.046 million for 2014 and314.
$51.756 million for 2015 is reasonable.
Section 9.3 - Information Technology – Capitalized Software
- 462 -

A.13-11-003 ALJ/KD1/ar9/jt2/lil PROPOSED DECISION (Rev. 12)
Each of the projects in the SAM bundle was approved in the 2012315.
GRC. Their inclusion in the 2015 GRC reflects reevaluations of the projects and,
in some cases, delays in their implementation.
The RCMS project was delayed, but the scope was not reduced.316.
SCE overspent its 2013 CMS forecast.317.
ORA’s proposal to keep the total CMS project forecast constant is318.
reasonable.
A total forecast of $29.396 million in 2014 and $17.215 million in 2015319.
for SAM bundles is reasonable.
SCE’s forecast for an increase in cybersecurity and IT compliance is320.
premised entirely on a prior underspend with no other justification.
A 2014 forecast of cybersecurity and IT compliance of $17.711 million321.
is reasonable.
NERC CIP Version 5 is a significant change in circumstance relative322.
to past years that justifies SCE’s budget-based forecast for regulatory mandated
capitalized software.
The MAP project is necessary for NERC CIP compliance.323.
It is reasonable to carry forward a portion of the MAP underspend in324.
2013 to 2014 for a 2014 forecast of $6.794 million.
SCE’s uncontested, revised forecast for financial services is325.
reasonable.
Maintenance of SONGS records is necessary despite the SONGS326.
shutdown.
SCE’s eDMRM forecast of $11.4 million for 2015 is reasonable.327.
SCE’s concern regarding violations of CANSPAM and TCPA is328.
well-founded.
- 463 -

A.13-11-003 ALJ/KD1/ar9/jt2/lil PROPOSED DECISION (Rev. 12)
The benefit-cost ratio of the Digital Experience project is greater than329.
one, even if additional capital costs are included.
SCE must invest in ASR to meet customer expectations now and in330.
the future.
Funding for ASR is reasonable.331.
SCE’s Digital Experience Project forecast of $8.44 million for 2014332.
and $22.3 million for 2015 is reasonable.
SCE’s uncontested GMS forecast is reasonable.333.
Section 10 - Human Resources
Cost of service ratemaking principles do not require ratepayers to334.
pay costs that the utility has not shown further the provision of safe and reliable
service at just and reasonable rates.
SONGS HR staffing peaked at 17 in 2011 and has been higher than335.
four positions from 2008 to 2012.
It is reasonable to reduce SCE’s forecast for HR department labor336.
expenses in Accounts 920/921 by $0.330 million to $21.118 million.
EIC awards are largely given based on shareholder benefits.337.
SCE financial performance may benefit ratepayers, however the338.
ratepayer benefit is much less direct than the shareholder benefit.
It is reasonable for ratepayers to fund 50% of SCE’s EIC request.339.
Other portions of SCE’s request for HR department and executive340.
officer compensation request are reasonable.
Significant portions of the STIP payout criteria are directly related to341.
shareholder benefits that may or may not provide secondary benefits to
ratepayers.
- 464 -

A.13-11-003 ALJ/KD1/ar9/jt2/lil PROPOSED DECISION (Rev. 12)
STIP payments in 2012, on which SCE bases its proposal, were 27%342.
above target.
There is no clear trend in the ratio of STIP payments to total labor343.
costs in 2008-2013, and using a historical average of this value is reasonable.
A total 2015 STIP illustrative forecast of $98 million is reasonable.344.
SCE has not demonstrated that LTI furthers the provision of safe and345.
reliable service at just and reasonable rates.
SCE’s employee recognition programs (Spot bonuses and ACE)346.
promote safety and other behaviors that further the provision of safe and reliable
service at just and reasonable rates.
The costs of these recognition programs appear reasonable relative347.
to the benefits.
SCE’s forecast of the employee recognition programs is not348.
transparent.
Updating the actuarial calculations due to the changed number of349.
SONGS employees and other information has a small impact relative to pension
cost uncertainty.
SCE’s forecast of pension costs is reasonable.350.
SCE’s minimum pension contributions are not under SCE’s control.351.
Continuing the two way Pension Cost Balancing Account is352.
appropriate.
SCE’s 2015-2017 average forecast of PBOP costs and actuarial fees is353.
reasonable.
SCE’s basic approach of calculating per-eligible-employee costs,354.
escalating those costs, and multiplying by the number of eligible employees to
create forecasts for other benefits is reasonable.
- 465 -

A.13-11-003 ALJ/KD1/ar9/jt2/lil PROPOSED DECISION (Rev. 12)
SCE’s medical escalation rate is consistent with information355.
provided by SCE’s medical plan administrators.
Continuing the two way Medical Program Balancing Account is356.
appropriate.
It is reasonable for ratepayers to fund 50% of SCE’s Executive357.
Benefits request.
The total adopted forecast for pensions and benefits programs in358.
Account 926 is reasonable.
Section 11 - (Safety, Security, and Compliance)
SCE’s forecast of O&M costs for the Ethics and Compliance359.
department are reasonable.
SCE’s analysis of transmission environmental services work based360.
on new transmission projects is credible.
SCE’s forecasts of environmental services for transmission and361.
distribution are reasonable.
Health and safety labor expenses have been stable and therefore362.
SCE’s forecast based on 2012 recorded is appropriate.
SCE’s health and safety non-labor forecast is uncontested.363.
SCE’s forecast for Health and Safety in Account 925 is reasonable.364.
SCE’s forecast of outside consulting services is reasonable.365.
It is appropriate to shift 2015-2017 rate recovery for marine366.
mitigation to expense rather than capitalization.
TURN’s forecast for ongoing mitigation costs, $3. 703 million (2012$),367.
is reasonable.
It is premature to approve costs for a compliance-driven project that368.
is not yet required.
- 466 -
A.13-11-003 ALJ/KD1/ar9/jt2/lil PROPOSED DECISION (Rev. 12)
It is reasonable to permit SCE and SDG&E to file an application to369.
recover costs in the event that CCC does require additional reef construction, or
other measures.
ORA’s uncontested capital and O&M forecasts for Corporate370.
Security and Business Resiliency are reasonable.
Section 12.1 - Financial Services
SCE’s forecast for accounts 920/921 is uncontested, except for OpX371.
reductions which we reject.
SCE’s forecast for accounts 920/921 is reasonable.372.
It is inconsistent for SCE to forecast continuing consulting costs for373.
OpX but not to credit ratepayers with additional savings that will result.
TURN’s proposed adjustment to remove 50% of Bain & Co costs for374.
forecasting purposes is reasonable.
TURN’s proposed treatment of vendor discounts reflects a consistent375.
approach to analyzing this account.
SCE’s proposed 5YA thus includes only two years of vendor376.
discounts, $2.183 million in 2011 and $3.409 million in 2012, and deflates their
value in the test year forecast.
2013 data on vendor discounts is more reflective of current377.
conditions than earlier years’ data, since 2013 data captures benefits of OpX not
otherwise credited to ratepayers in SCE’s approach.
It is reasonable to remove vendor discounts from the 5YA using378.
TURN’s method.
TURN’s unopposed proposal to remove $8.9 million in 2009 tax379.
consulting costs from the five-year average (resulting in a $1.9 million TY
reduction) is reasonable.
- 467 -

A.13-11-003 ALJ/KD1/ar9/jt2/lil PROPOSED DECISION (Rev. 12)
Section 12.2 - Audit Services Department (ASD)
Recorded data from 2013 and early 2014 suggest significant declines380.
in affiliate credits following the EME bankruptcy.
TURN’s approach of forecasting ASD expenses based solely on381.
utility-only costs is a reasonable approach to forecast costs in light of the
bankruptcy.
TURN’s forecast of ASD expenses, $7.721 million in Accounts382.
920/921, is reasonable.
Section 12.3 - Property and Liability Insurance
SCE’s uncontested forecast of property insurance in Account 924 of383.
$18.973 million is reasonable.
It is reasonable to expect that the total liability insurance forecast384.
would decline with the number of total employees.
ORA’s forecast of liability insurance in Account 925 of $70.335385.
million is reasonable.
Section 12.4.1 - Law
SCE’s forecast for Accounts 920 and 921 for in-house costs of $30.539386.
million is reasonable.
ORA’s proposal to reject SCE’s incentive payments to outside387.
counsel is reasonable because SCE has not demonstrated that it is obtaining base
fees at discount compared to market.
Absent a finding of error or fault, it is reasonable to include costs388.
related to litigation resulting from fires.
The recorded figures for outside counsel costs during the 2010-2011389.
period reflect largely unexplained and unjustified increases as compared to the
2008-09 period.
- 468 -
A.13-11-003 ALJ/KD1/ar9/jt2/lil PROPOSED DECISION (Rev. 12)
It is reasonable to exclude 2010-2011 from the forecast of outside390.
counsel expenses.
A forecast of $12.503 million for outside council is reasonable.391.
The primary functions of the Board include representing the392.
interests of shareholders.
It is reasonable to subtract $998,095 from SCE’s 2015 test year393.
forecast of corporate governance in Account 930.
Section 12.4.2 - Claims
It is reasonably necessary for SCE to have access to secure space to394.
store evidence.
A total forecast for administrative and general functions of the395.
Claims Department in Accounts 920/921/924 of $3.658 million is reasonable.
A 5YA forecast is a reasonable approach to forecasting accounts with396.
high variation in recorded costs.
SCE’s forecast of $19.424 million for Account 925, Claims Reserves is397.
reasonable.
Section 12.4.3 – Workers’ Compensation
Workers’ compensation claims have declined significantly since398.
2008.
It is reasonable to expect that remaining adjustments to 2013399.
recorded data will be small.
It is reasonable to use a 5YA of 2009 to 2013 to forecast workers’s400.
compensation reserves in Account 925.
A total forecast of workers’ compensation costs in Account 925 of401.
$15.903 million (2012$) is reasonable.
Section 12.5.1 and 12.5.2 – Operational Services Other than CRE
- 469 -
A.13-11-003 ALJ/KD1/ar9/jt2/lil PROPOSED DECISION (Rev. 12)
SCE’s uncontested TY O&M forecasts of $7.339 million for PPO and402.
$1.835 million for SDD are reasonable.
SCE’s capital expenditure forecast for non-CRE OS projects from403.
2014-2015 totaling $12.952 million is uncontested and is reasonable.
Section 12.5.4 - CRE O&M
TURN’s 3YA forecast approach, including adjustments for OpX is404.
reasonable.
It is reasonable to increase TURN’s forecast by $0.400 million in405.
non-labor to account for affiliate credits and cost centers excluded by TURN’s
2013 estimate.
The forecast of $11.115 million, as agreed by SCE and TURN and406.
uncontested by other parties, is reasonable for Account 931.
Given the level of variation in recorded data in Account 935, SCE’s407.
3YA is appropriate.
Section 12.5.5 – CRE Capital
It is reasonable to calculate a disallowance factor of 9.5% based on408.
SCE’s inadequately supported $12.943 million in project management and
$12.904 million in contingency compared to its total capital forecast of $271.665
million.
It is reasonable to apply this disallowance factor to approved CRE409.
capital projects.
The EOC serves an important function separate from the TSD and410.
beyond the intent of the interim EOC.
SCE’s 2015 capital forecast for the EOC, as adjusted, is reasonable.411.
It is reasonable to require SCE to make a showing in the next GRC412.
that the interim EOC remains used and useful.
- 470 -

A.13-11-003 ALJ/KD1/ar9/jt2/lil PROPOSED DECISION (Rev. 12)
SCE’s 2014-2015 capital forecast for the GO2 Conference and413.
Training Center, as adjusted, is reasonable.
It is reasonable to require SCE to make a showing in the next GRC414.
that includes a cost-benefit analysis of the GO2 Conference and Training Center.
The number of employees now anticipated to move to IBC is 27-30%415.
below SCE’s initial forecast.
It is reasonable to expect reduced costs given the change in use (both416.
number and type of employees) of IBC, but some portion of the costs are not
dependent on these factors.
It is reasonable to reduce SCE’s forecast for the IBC by 15%.417.
TURN’s proposal to expense costs associated with the Rancho418.
Cucamonga Office Building Optimization is reasonable.
It is reasonable to approve a $0.995 million (2015$) O&M expense for419.
the Rancho Cucamonga Office Building Optimization.
SCE’s capital maintenance forecast is lower than the most420.
conservative scenario developed by Parsons (SCE’s contractor).
SCE’s 2014-2015 capital maintenance forecast, as adjusted, is421.
reasonable.
SCE’s uncontested explanation for the apparent increase in422.
per-person furniture modification costs (that costs previously forecast elsewhere
are now included) is logical.
SCE’s ongoing furniture modification forecast, as adjusted, is423.
reasonable.
Based on our review of SCE’s forecast for the energy efficiency424.
blanket and the benefits of the specific projects here, we find that SCE’s forecast,
as adjusted, is reasonable.
- 471 -

A.13-11-003 ALJ/KD1/ar9/jt2/lil PROPOSED DECISION (Rev. 12)
SCE has declined to implement garage infrastructure upgrades that425.
were previously authorized by the Commission.
It is reasonable to remain skeptical that the full amount that SCE has426.
forecasted would, in fact, actually be spent on the garage infrastructure upgrade
program during the 2014-2015 cycle, rather than being redirected into other
purposes deemed by SCE to have higher priority.
Some actual work on portions of garage upgrades has already at427.
least commenced, and SCE may implement at least some level of spending on the
garage upgrades during the 2014-2015 cycle.
It is reasonable to approve 50% of SCE’s request for the garage428.
upgrades.
SCE sought and received in excess of $100 million cumulatively in429.
the 2009 and 2012 GRCs for the same type of service center upgrade work SCE
claims is now essential, yet SCE spent zero during the 2009 GRC cycle and
$650,000 in 2013.
Planning and permitting for work at the Bishop, Kernville, Redlands,430.
Ontario, and Ridgecrest Service Centers has already commenced, and SCE
currently projects spending approximately $23 million.
The average age of the service centers under SCE’s program is 51431.
years old.
It is important to maintain service center facilities over time.432.
Using the final FCI scores and the consultant’s grading scale, all of433.
the scored service centers are currently in “fair” condition except for Bishop and
San Joaquin.
TURN’s forecast for service center upgrades is reasonable.434.
- 472 -

A.13-11-003 ALJ/KD1/ar9/jt2/lil PROPOSED DECISION (Rev. 12)
SCE’s explanation that the IT spend for the projects it used to435.
calculate the IT adder are representative of the projects it requests in this GRC is
reasonable.
SCE’s proposed 12% IT adder is reasonable.436.
Section 13.1 Corporate Communications
SCE’s use of 2012 recorded as a baseline for Account 920/921 follows437.
prior Commission guidance and is reasonable.
SCE’s uncontested forecast of $0.847 million for FERC Account 923438.
for communication measurement and ethnic media services is reasonable.
SCE’s explanation of the adjustments in baseline costs for Account439.
930 due to reorganization is reasonable, and the education expenses outweigh the
decline in annual report costs.
SCE’s proposed 5YA is a reasonable baseline for Account 930.440.
TURN’s recommendation to reduce the forecast for the Public Safety441.
Around Electricity Education Campaign by $1.569 million, and thereby limit
ratepayer funding to 2012 levels of $6.641 million is reasonable.
One of the goals of the Summer Readiness campaign is increasing442.
enrollment in DR programs.
The Summer Readiness campaign appears to duplicate other443.
programs.
The Corporate Responsibility Report is institutional advertising and444.
it would not be reasonable to include this in our adopted forecast.
- 473 -
A.13-11-003 ALJ/KD1/ar9/jt2/lil PROPOSED DECISION (Rev. 12)
Section 13.2 - Corporate Membership Dues and Fees (Account 930.2)
SCE ratepayers do receive some valuable benefits through EEI,445.
including information and mutual assistance.
It is reasonable to forecast to $1.000 million to account for these446.
benefits without unnecessarily contributing to EEI political activities.
Section 13.3 - Integrated Planning and Environmental Affairs (IP&EA)
SCE’s forecast of $6.227 million for groups in Integrated Planning447.
that record labor and non-labor expenses to FERC Account 557 is uncontested
and is reasonable.
It is reasonable to undertake a periodic review of the amount of448.
non-labor costs in Account 549, notwithstanding its review in the PDDMA and
ERRA proceedings.
Non-labor expenses in Account 549 have fluctuated over the five449.
recorded years, and a 5YA of $2.589 million is a reasonable forecast for non-labor.
SCE’s request to modify the PDDMA to record only non-labor costs450.
is reasonable.
SCE’s uncontested labor forecast in Account 549 is reasonable.451.
SCE’s forecast for Account 920/921 is uncontested, accept for a452.
reduction related to membership dues adopted above.
A forecast of $2.971 million for Account 920/921 is reasonable.453.
Section 13.4 Regulatory Operations and Regulatory Policy & Affairs (RP&A)
Apparent one-time non-labor costs were the result of an accounting454.
change and actually represent normal costs, not one-time NERC costs.
SCE’s revised non-labor forecast is reasonable.455.
SCE’s revised labor forecast is undisputed, and we find it456.
reasonable.
- 474 -
A.13-11-003 ALJ/KD1/ar9/jt2/lil PROPOSED DECISION (Rev. 12)
Section 13.5 - LPA
It is reasonable to conclude that some training supports shareholder457.
benefits given the relative time allocations from the tracking study.
Many of the training topics can reasonably benefit shareholders.458.
It is reasonable to allocate additional costs for general skill-building459.
trainings to shareholders in Account 920/921, as calculated by SCE.
TURN’s proposed $0.308 million reduction to SCE’s non-labor460.
forecast for Account 920/921 is reasonable.
SCE’s gross labor forecast, based on LRY with incremental positions,461.
is reasonable given the trend in recorded costs and its explanation of the need for
new positions.
Given the trend in expenses, SCE’s non-labor forecast based on LRY462.
with adjustments is reasonable.
Other cities may begin to charge BLTs.463.
$0.575 million is a reasonable forecast of BLTs.464.
SCE’s other uncontested External Affairs forecasts are reasonable.465.
Section 14 – Ratemaking
SCE’s forecast of capital expenditures in the MRTUMA is466.
reasonable.
The MRTUMA can be eliminated.467.
SCE’s uncontested request to transfer the final 2014 RSDMA balance468.
to BRRBA for recovery in distribution rates is reasonable.
SCE’s request to eliminate the ESCBA and SOMA is reasonable.469.
It is reasonable to extend the RSDMA through 2017.470.
Section 15 – Jurisdictional Allocation
- 475 -

A.13-11-003 ALJ/KD1/ar9/jt2/lil PROPOSED DECISION (Rev. 12)
SCE’s uncontested jurisdictional allocation factors are calculated471.
according to methods we have approved in the past and are reasonable.
Section 16
SCE’s PDL model maintains the historical and intuitive correlation472.
between housing starts and new meters.
SCE’s PDL model outperforms ORA’s model in an extended473.
validation period.
TURN’s adjustment to update SCE’s PDL model for the most recent474.
available data is appropriate.
TURN’s forecast of new Residential and Non-Residential meters is475.
reasonable.
SCE’s forecast of new Agricultural meters is reasonable.476.
It is reasonable to adjust SCE’s forecasts of retail sales and number of477.
customers based on the adopted forecast of new meters.
Sections 17-20
SCE’s total OOR forecast of approximately $201 million in 2015 is478.
reasonable.
It is appropriate to prioritize an audit of NTP&S.479.
SCE’s uncontested cost escalation method is reasonable.480.
Attrition year revenue increases give SCE an opportunity to offset481.
some inflationary price increases, increase capital investments, and earn its
authorized rate of return in the attrition years.
An appropriate PTYR mechanism is simple; accurately aligns with482.
how costs are incurred for the utility; and gives the utility an incentive to manage
costs while enhancing productivity.
- 476 -

A.13-11-003 ALJ/KD1/ar9/jt2/lil PROPOSED DECISION (Rev. 12)
Global Insight escalation rates are a reasonable forecast of the483.
inflationary increases for O&M labor costs.
SCE’s estimates PTYR escalation rates for other O&M expenses are484.
reasonable.
Escalating capital additions by 2% per year is appropriate.485.
The following escalation rates are reasonable:486.
Category 2016 2017 Notes
O&M - Labor
Disability Programs 2.30% 2.60% Global Insight
Executive Benefits 2.30% 2.60% Global Insight
401(k) 2.30% 2.60% Global Insight
O&M - Other
Medical 8.00% 8.00% SCE Estimate
Dental 4.50% 4.50% SCE Estimate
Vision 2.00% 2.00% SCE Estimate
Group Life 0.00% 0.00% SCE Estimate
Misc. Benefit 3.03% 2.90% SCE Estimate
Capital Additions 2.00% 2.00% Applied to 2015 capital additions,based on 2015 authorized capitalexpenditures
SCE’s Z-factor mechanism is reasonable.487.
SCE’s proposal to implement PTYR updates by advice letter is488.
reasonable.
The adopted PTYR mechanism strikes an appropriate balance489.
between the goals described above as well as the parties’ different positions.
SCE’s uncontested method for converting capital expenditures to490.
Plant-In-Service is reasonable.
Section 21.2
SPR results for Account 355 support a 50 R0.5 life curve.491.
SPR results for Account 353 support a 45 R0.5 life curve.492.
- 477 -
A.13-11-003 ALJ/KD1/ar9/jt2/lil PROPOSED DECISION (Rev. 12)
The longer experience bands for Account 354 support a 65 R5.493.
SPR results for Account 356 support a 61 R3.494.
SCE’s engineering analysis of assets in Account 362 supports the 45495.
R1.5 curve.
SCE’s engineering analysis of assets in Account 364 supports the496.
47-year ASL proposed by TURN and ORA.
SPR results for Account 364 support a 47 L0.5 life curve.497.
SCE’s engineering analysis of assets in Account 367 supports an498.
increase in ASL.
SPR analysis suggests an R0.5 curve for Account 367.499.
A 45 R0.5 curve for account 367 is a reasonable compromise.500.
SCE’s engineering analysis of assets in Account 368 supports the 33501.
R1 curve.
SPR results for Account 369 support a 45 R1.5.502.
SCE’s operational data for assets in Account 373 supports a 40 L0.5.503.
The adopted life curves are reasonable.504.
Section 21.3
SCE’s recorded NSR data supports its proposed increase to -35%505.
NSR for Account 352.
SCE’s recorded NSR data supports its proposed increase to -15%506.
NSR for Account 353.
SCE’s recorded NSR data for Account 354 is based on a small sample507.
which may not be representative.
Industry NSR data for Account 354 supports a decrease in NSR to508.
-60%.
- 478 -

A.13-11-003 ALJ/KD1/ar9/jt2/lil PROPOSED DECISION (Rev. 12)
It is likely that per unit COR for Account 355 may decrease in the509.
future.
Declining per unit COR for Account 355 supports an NSR of -72%.510.
Industry NSR data for Account 356 supports retaining the current511.
-80% NSR.
SCE’s recorded NSR data supports an increase in NSR for Account512.
362, but future changes in the retirement mix suggest that the NSR should not be
increased to more than -25%.
SCE’s recorded NSR data supports an increase in NSR for Account513.
364.
SCE’s recorded NSR data supports an increase in NSR for Account514.
365.
SCE’s recorded NSR data and extended ASL support an increase in515.
NSR for Account 366.
SCE’s recorded NSR data supports its proposed increase to -20%516.
NSR for Account 368.
SCE’s recorded NSR data supports an increase in NSR for Account517.
369.
SCE’s recorded NSR data supports an increase in NSR for Account518.
373.
The adopted NSRs are reasonable.519.
Section 21.4
SCE’s unchanged service life estimates for hydro and Pebbly Beach520.
were found reasonable in the 2012 GRC and are unchallenged.
SCE’s service life estimate for Palo Verde includes the benefit of the521.
extended operating license for the plant. No party challenges this estimate.
- 479 -

A.13-11-003 ALJ/KD1/ar9/jt2/lil PROPOSED DECISION (Rev. 12)
SCE’s service life estimates for hydro, Pebbly Beach, and Palo Verde522.
are reasonable.
TURN’s 35-year life estimate for the Peakers is consistent with523.
industry comparisons and SCE’s workpaper estimates.
TURN’s 35-year life estimate for the Peakers is reasonable.524.
TURN’s 35-year life estimate for Mountainview is consistent with525.
industry comparisons and SCE’s workpaper estimates.
TURN’s 35-year life estimate for Mountainview is reasonable.526.
ORA’s proposed 25-year life estimate for Solar PV is supported by527.
panel manufacturers’ warranties and SCE’s website claims.
ORA’s proposed 25-year life estimate for Solar PV is reasonable.528.
Section 22.2 – Safe Harbor Method for Repairs
As a result of SCE’s 2012 tax election: SCE’s shareholders received529.
$321 million in savings during 2012-2014 relative to forecast tax expense. The tax
savings equates to $542 million (nominal$) in revenue requirement if ratepayers
had received the savings instead. SCE ratepayers will pay $294 million (net
present value $741 million nominal$) of increased tax revenue requirement.
Revenue Proceeding 2011-43, which authorized the tax election, was530.
published in August 2011.
In February 2012, SCE published its 2011 annual report, which531.
contained a representation to the Securities and Exchange Commission and
investors that SCE would elect the safe harbor.
SCE’s 2012 GRC proceeding was ongoing when SCE published its532.
2011 annual report.
SCE did not bring its change in tax accounting to our attention.533.
A ratebase offset remedy is prospective, not retroactive.534.
- 480 -

A.13-11-003 ALJ/KD1/ar9/jt2/lil PROPOSED DECISION (Rev. 12)
A ratebase offset of $344.026 million, applied in 2015, will reasonably535.
compensate ratepayers for their increased future costs attributable to SCE’s safe
harbor tax election.
It is reasonable to adopt a ratebase offset of $344.026 million, applied536.
in 2015.
Section 22.3 – Advanced Meters
SCE changed the tax depreciation schedule of advanced meters537.
installed during 2012 after the AMI Balancing Account was closed at the end of
2012.
As a result of SCE’s change, ratepayers would pay 100% of the costs538.
of the meters, but receive only 66% of the state tax depreciation.
TURN’s proposed remedy to reduce SCE’s state income tax by539.
$2.090 million, less a $0.731 million increase in federal taxes per year during
2015-2017, is solely prospective.
It is reasonable to adopt TURN’s proposed remedy.540.
Section 22.4 – Updates to Tax Forecast in SCE-76
SCE-76 makes two significant decrease to SCE’s forecast revenue541.
requirement: a revised estimate of tax repair deductions from Pole Programs
2015-2017 and a change in allocation formula between CPUC and FERC
jurisdictions.
The combined test year 2015 revenue requirement of these two542.
changes is $201 million.
The net present value of the changes during 2015-2017 is $598543.
million.
No party opposed SCE’s position on these tax changes.544.
- 481 -
A.13-11-003 ALJ/KD1/ar9/jt2/lil PROPOSED DECISION (Rev. 12)
The revenue requirement reductions will not result in any offsetting545.
cost increase to ratepayers (FERC jurisdiction included) during this GRC period.
SCE did not present analysis of periods further into the future.546.
It is unlikely, but not impossible, that future costs would be great547.
enough to offset benefits during 2015-2017, on a net present value basis.
It is reasonable to adopt SCE’s tax changes proposed in SCE-76.548.
Section 22.6 – Policy Considerations
In a post-hearing exhibit, SCE noted a 2014 tax depreciation increase549.
of $874 million due to the enactment of the Tax Increase Prevention Act of 2014
(TIPA). SCE did not elaborate and no other party addressed it.
It is unclear from the record whether the benefits of the change due to550.
TIPA were flowed-through to shareholders and if there will be a cost increase for
ratepayers.
It is reasonable to create a two-way Tax Accounting Memorandum551.
Account to track all tax changes during this GRC period.
Section 23 – Rate Base
There is considerable variation in the year-to-year trend in customer552.
advances.
An adjustment based on 2013 actual customer advances balance is553.
appropriate.
TURN’s proposal to “shift” the 2015 customer advance balance554.
upward by the amount of the variance in 2013 is reasonable.
SCE’s regression analysis of T&D M&S is consistent with those555.
approved in past decisions, shows a strong correlation, and is, thus, reasonable.
It is reasonable to apply the M&S forecast approach to the adopted556.
capital expenditures instead of SCE’s forecast.
- 482 -
A.13-11-003 ALJ/KD1/ar9/jt2/lil PROPOSED DECISION (Rev. 12)
A total M&S forecast of $116.948 million (nominal$) in 2015 is557.
reasonable.
It is reasonable to exclude minimum cash balances that are not558.
mandated by banks from working cash.
It is reasonable to exclude SCE’s $5.7 million forecast for LTIP559.
related working cash from rate base.
Years with minimal or negative tax payments may not be indicative560.
of 2015; these years should not be unduly weighted.
A five-year weighted average is reasonable to calculate both state561.
and federal income tax lag days.
A $103.360 million reduction to rate base relative to SCE’s proposal562.
for income tax lag is reasonable.
SCE’s proposals, including modifications proposed by TURN and563.
uncontested by SCE, for other aspects of working cash lead lag study are
reasonable.
It is reasonable to continue existing policy for SCE with respect to564.
customer deposits as an offset to rate base.
It is reasonable to offset SCE’s rate base by $180.269 million, or 90%565.
of customer deposits.
It is reasonable for SCE to charge an offsetting interest expense566.
based on the three-month commercial paper interest rate for the rate base offset
of customer deposits.
It is reasonable to approve the continued 10% of customer deposits567.
for the community banking program and for SCE to deposit up to $20.030 million
in this manner.
SCE’s uncontested proposed AFUDC rates are reasonable.568.
- 483 -

A.13-11-003 ALJ/KD1/ar9/jt2/lil PROPOSED DECISION (Rev. 12)
Section 25
SCE’s phrase “add to fully staff” refers to shifting existing569.
employees into vacancies during the OpX reorganization, not adding additional
positions.
It is reasonable to credit ratepayers with 75 percent of forecast OpX570.
savings for IT and customer service, net of adjustments for capitalization and
additional expenses.
Section 26 - Joint Proposal on Accessibility Issues
Due to the fact that the parties propose a new program that571.
potentially includes costs across a wide variety of organizations within SCE, it is
reasonable to accept this vague forecast, but only on a temporary basis.
SCE and CforAT’s joint forecast of $1.5 million for accessibility572.
issues is reasonable.
Section 27 - Settlements
The settlement between SCE and JMP is reasonable in light of the573.
whole record, consistent with law, and in the public interest.
The settlement between SCE and Cal-SLA is not directly relevant to574.
this proceeding.
Section 28 - Other Issues
A modest recognition program, using gear with the SCE name and575.
logo, is a reasonable means to motivate employees to perform well.
It is reasonable to adopt TURN’s proposal in part and reduce gross576.
plant by $0.324 million (2015 weighted average).
The remaining O&M funding is reasonable to allow SCE to use this577.
recognition approach to motivate employees to benefit ratepayer interests.
- 484 -

A.13-11-003 ALJ/KD1/ar9/jt2/lil PROPOSED DECISION (Rev. 12)
Conclusions of Law
Section 6
SCE’s forecasts of O&M and capital expenditures for power procurement1.
should be approved.
SCE’s unopposed forecast of $0.308 million in O&M for Mohave2.
Generating Station should be approved.
The Mohave Balancing Account should be closed.3.
A total hydro O&M forecast of $52.849 million should be approved.4.
SCE’s uncontested revised rebuttal forecast for hydro capital should be5.
approved. The forecast is ($ millions, nominal):
2014 2015
71.149 90.231
A total O&M forecast of $48.338 million for Mountainview, in FERC6.
Accounts 549 and 554, should be approved.
For Mountainview capital expenditures, the unopposed SCE and ORA7.
recommended forecast of $1.327 million, and $1.131 million for 2014 and 2015
respectively should be approved.
A total Peakers O&M forecast of $10.155 million should be approved.8.
SCE’s capital expenditures request of $2.954 million in 2014 and $3.0439.
million in 2015 for the Peakers is reasonable
A total forecast of $3.503 million for SPVP O&M should be approved.10.
Added facilities costs should not be subject to escalation.
SCE’s termination payment to SunPower should be disallowed.11.
SCE’s SPVP capital expenditure request of $0.425 million for 2014 and12.
$1.035 million for 2015 should be approved.
SPVPBA should be eliminated.13.
- 485 -

A.13-11-003 ALJ/KD1/ar9/jt2/lil PROPOSED DECISION (Rev. 12)
TURN’s forecast of $4.360 million in O&M for Catalina should be14.
approved.
SCE should be allowed to recover AFUDC and capitalized property taxes15.
through the end of 2013, in addition to $5.1 million in capital expenditures
recorded by that time.
A total O&M forecast of $0.546 million should be approved for the fuel cell16.
program.
The FCPMA should be eliminated.17.
Section 7.1
SCE’s proposed core RIIM capital categories WCR, Underground Cable18.
Life, CIC Replacement, Underground Switch, Underground Structure
Replacement, Circuit Breaker Replacements, and Substation Transformer
Replacement} should be adopted.
SCE’s proposed High Priority RIIM categories (customer growth, storms,19.
and claims) should be adopted.
SCE’s proposed RIIM staffing target proposal (2,225 employees in the20.
categories identified at SCE-3V1 at 27) should be adopted.
The TURN/CUE proposal for the mechanics of the SRIIM capital spending21.
mechanism should be adopted with the following modifications. Overspending
in the High Priority categories can offset underspending in the core SRIIM
categories if two conditions are true: the overspending in High Priority
categories exceeds ten percent of the adopted forecast for those categories and
SCE’s actual rate of return on rate base for the period does not exceed the
authorized rate of return. The first ten percent of overspending on High Priority
categories cannot be used to offset underspending in the core SRIIM categories
under any circumstance.
- 486 -

A.13-11-003 ALJ/KD1/ar9/jt2/lil PROPOSED DECISION (Rev. 12)
Section 7.2
SCE’s CRAS capital expenditure request for 2013 should be approved; SCE22.
should be allowed to reapply for later years’ capital expenditures.
$51.058 million of SCE’s O&M request for Engineering and Grid23.
Technology should be approved.
Engineering and Grid Technology capital expenditures should be24.
approved as follows ($000s): $40,217 in 2014 and $31,681 in 2015.
A total forecast of O&M in Account 583.120 of $23.173 million should be25.
approved.
SCE’s forecasts for O&M in Accounts 593.120 and 594.120 should be26.
approved.
Section 7.3
SCE’s forecasts for uncontested transmission planning projects should be27.
approved.
SCE’s forecast for the Victor Substation should be approved.28.
SCE’s forecasts for other transmission planning projects should be29.
approved.
SCE’s forecast of A-bank plan expenses for 2014-2015 should be approved.30.
SCE’s forecast of subtransmission line plan expenses for 2014- 2015 should31.
be approved.
SCE’s DSP forecast for 2014-2015 should be approved.32.
Funding for 60 circuit breaker replacements per year, or $9.887 million33.
should be approved.
SCE’s forecast for the DSP circuit work category should be approved.34.
SCE’s forecasts for Capacitor and Circuit Automation Programs should be35.
approved.
- 487 -

A.13-11-003 ALJ/KD1/ar9/jt2/lil PROPOSED DECISION (Rev. 12)
SCE’s forecasts for Distribution Plant Betterment, Distribution VAR Plan,36.
and Substation Load Information Monitoring should be approved.
SCE’s 2014-2015 forecast for Generator Interconnection Program should be37.
approved.
SCE’s 2014-2015 forecast for Added Facilities Projects should be approved.38.
Section 7.4
A total forecast for underground cable programs of (millions of nominal$)39.
$140.481 in 2014 and $206.616 in 2015 should be approved.
A total forecast for A-bank transformer replacements of (millions of40.
nominal$) $14.417 in 2014 and $14.798 in 2015 should be approved.
A total forecast for distribution circuit breaker replacement of (millions of41.
nominal$) $24.016 in 2014 and $24.366 in 2015 should be approved.
ORA’s uncontested forecast for B-bank transformer replacements should42.
be approved.
SCE’s uncontested forecasts for 4kV Circuit replacement programs should43.
be approved.
SCE’s uncontested forecasts for other infrastructure replacement programs44.
should be approved.
Section 7.5
The methods adopted for calculating customer driven expenses and45.
expenditures should be applied to the forecast of new meters and other items
adopted in this decision, instead of any party’s forecast of those values.
The total O&M forecast for Customer-Driven Programs and Distribution46.
Construction of $15.609 million should be approved.
The following total capital forecast for disputed items in Customer-Driven47.
Programs and Distribution Construction (including transformers and
- 488 -

A.13-11-003 ALJ/KD1/ar9/jt2/lil PROPOSED DECISION (Rev. 12)
prefabrication) should be approved: $384.259 million in 2014 and $497.795
million in 2015 (nominal$).
Section 7.6
The following forecast of O&M as follows for underground structures48.
should be approved (millions of 2012$):
Requested Approved
Account 583.120 593.120 583.120 593.120
Labor 4.523 1.669 4.523 1.335
Non-Labor 1.678 14.964 1.678 11.971
Total 6.201 16.633 6.201 13.306
The following forecast of capital expenditures for underground structure49.
replacement should be approved (millions of nominal $):
2014 2015
Requested $ 67.500 $ 67.500
Approved $ 54.000 $ 54.000
SCE’s uncontested distribution maintenance capital and O&M forecasts50.
should be approved.
SCE’s uncontested forecast of JPO expenses based on LRY should be51.
approved.
A forecast of $4 million for joint pole credits is reasonable.52.
SCE should undertake a review of joint pole credits and present53.
information in its next GRC on its efforts to ensure that SCE ratepayers are not
unduly subsidizing other companies’ use of jointly owned poles.
SCE’s forecasts for the uncontested elements of Accounts 593.120 and54.
594.120 should be approved.
SCE’s forecast unit costs of transmission and distribution pole55.
replacements should be reduced by 3%.
- 489 -

A.13-11-003 ALJ/KD1/ar9/jt2/lil PROPOSED DECISION (Rev. 12)
SCE’s forecast of deteriorated pole replacements should be approved.56.
The following forecast of aged pole replacements should be approved:57.
Aged PoleReplacements
2014 2015
PolesReplaced
Adopted
8,000 0
Requested
14,500 1,898
Nominal$,millions
Adopted
98.576 0
Requested
184.189
24.622
SCE’s uncontested forecast of $100 per wood pole disposal should be58.
approved.
SCE’s Distribution Inspection and Maintenance capital expenditure59.
forecasts that are not specifically addressed are uncontested and should be
approved.
SCE’s request to close the Bark Beetle CEMA should be approved.60.
Section 7.7
A total forecast for PLP O&M of $36.052 million should be adopted.61.
Cost sharing in proportion to the contribution to pole overloading is not62.
unduly discriminatory or anticompetitive.
The following PLP capital forecast should be adopted.63.
SCE Adopted
2014 2015 2014 2015
Pole Replacements -Distribution
$33.916
$288.636
$32.899 $189.765
Pole Replacements -Transmission
$6.789 $58.080 $6.585 $38.186
Malibu adjustment $(5.130) $ - $(5.130)
Distribution $1.371 $11.668 $1.371 $7.909
- 490 -

A.13-11-003 ALJ/KD1/ar9/jt2/lil PROPOSED DECISION (Rev. 12)
Transformers
Prefabrication $0.931 $7.926 $0.931 $ 5.372
Joint Pole - Distribution $(2.360)
$(20.083)
$(2.360) $(13.612)
Joint Pole -Transmission
$(0.289)
$(2.476) $(0.289) $(1.678)
Wood Pole Disposal $0.314 $2.674 $0.314 $1.812
Total $40.672
$341.295
$39.452 $222.624
SCE should be authorized to establish the PLPBA including deteriorated64.
pole replacements and with a 15% cap on costs above the adopted forecast. The
15% cap should apply to 2016 and 2017 only.
Section 7.8
A total Grid Operations O&M forecast of $111.801 million (2012$) should65.
be adopted.
The following forecast of Grid Operations Capital should be adopted.66.
(millions of nominal$) 2014 2015
Storm $ 47.084 $ 48.110
Transmission $ 4.562 $ 4.683
Substation $ 0.316 $ 0.325
Distribution $ 42.206 $ 43.102
Streetlights $ 38.872 $ 36.564
Pole Replacement $ 24.505 $ 25.025
Luminaire Replacement $ 12.273 $ 9.400
Breakdown Maintenance $ 2.094 $ 2.139
Operational Facilities Maintenance $ 5.600 $ 5.749
Total $ 91.556 $ 90.423
- 491 -

A.13-11-003 ALJ/KD1/ar9/jt2/lil PROPOSED DECISION (Rev. 12)
Section 7.9-7.11
A total transmission and substation maintenance O&M forecast of $84.73967.
million (2012$) should be approved.
A total transmission and substation maintenance capital forecast of68.
$121.636 million (nominal$) in 2014 and $131.865 million in 2015 should be
approved.
A total forecast of $65.912 million (2012$) for T&D Safety, Training and69.
Environmental Programs should be adopted
A total forecast for operational support and other costs of $64.505 million70.
(2012$) should be adopted.
A total forecast of OOR of $128.369 million (2012$) should be adopted.71.
Section 8
A total O&M forecast for Customer Service of $135.337 million, excluding72.
uncollectibles, should be adopted.
A total MSO capital forecast of $13.977 million in 2014 and $16.483 million73.
in 2015 should be adopted.
SCE’s BCD capital forecast should be adopted.74.
A total Customer Service OOR forecast of $28.731 million is reasonable.75.
Section 9
A total O&M forecast of $220.546 million (2012$) should be approved.76.
SCE’s $13.6 million 2015 forecast for the Alhambra Data Center should be77.
approved.
SCE’s 2015 forecast for Midrange Enterprise Servers Hardware of $39.50478.
million should be approved.
SCE’s forecast of personal computers should be approved.79.
- 492 -
A.13-11-003 ALJ/KD1/ar9/jt2/lil PROPOSED DECISION (Rev. 12)
Since SCE’s spending in transmission network facilities will address80.
expenditures typical for the last five years, ORA’s five-year recorded cost average
methodology should be approved.
A Transmission Network Facilities forecast of $15.471 million for both 201481.
and 2015 should be approved.
ORA’s 2015 forecast of $1.620 million for cable replacement, based on82.
actual amounts scheduled in 2013 and 2014 should be approved.
A $2.000 million forecast of fiber optic cable replacement in 2014 should be83.
approved.
A forecast of $2.640 million each year for microwave units should be84.
approved.
SCE’s forecasts of $4.601 million for 2014 and $14 million for 2015 for85.
mobile radio system replacement should be approved.
ORA’s forecast of $2.549 million for both 2014 and 2015 for risk86.
management disaster recovery should be approved.
SCE’s forecast of telecom costs of $43.046 million for 2014 and $51.75687.
million for 2015 should be approved.
A total forecast of $29.396 million in 2014 and $17.215 million in 2015 for88.
SAM bundles should be approved.
A 2014 forecast of cybersecurity and IT compliance of $17.711 should be89.
approved.
A 2014 MAP forecast of $6.794 million should be approved.90.
SCE’s uncontested, revised forecast for financial services should be91.
approved.
SCE’s eDMRM forecast of $11.4 million for 2015 should be approved.92.
- 493 -

A.13-11-003 ALJ/KD1/ar9/jt2/lil PROPOSED DECISION (Rev. 12)
SCE’s Digital Experience Project forecast of $8.44 million for 2014 and $22.393.
million for 2015 should be approved.
SCE’s uncontested GMS should be approved.94.
Section 10
Ratepayers should not pay costs that the utility has not shown further the95.
provision of safe and reliable service at just and reasonable rates.
A total STIP illustrative forecast of $98 million should be approved.96.
No rate recovery of LTI should be approved.97.
A total forecast for pensions and benefits programs in Account 926 should98.
be approved.
The following two-way balancing accounts should continue: Pension Cost99.
Balancing Account and Medical Program Balancing Account.
Section 11
SCE’s forecast of O&M costs for the Ethics and Compliance100.
department should be approved.
SCE’s forecasts of environmental services for transmission and101.
distribution should be approved.
SCE’s forecast for Health and Safety in Account 925 should be102.
approved.
SCE’s forecast of outside consulting services should be approved.103.
TURN’s forecast for ongoing mitigation costs, $3.703 million (2012$),104.
should be approved.
The utilities should not permitted to recover any cost twice. If a cost105.
permitted for recovery here is also recovered from the nuclear decommissioning
trust (or any other source), SCE and SDG&E should be required to refund the
revenue requirement associated with that cost to ratepayers, with interest.
- 494 -

A.13-11-003 ALJ/KD1/ar9/jt2/lil PROPOSED DECISION (Rev. 12)
SCE and SDG&E should be authorized to file an application to106.
recover costs in the event that CCC does require additional reef construction, or
other measures.
ORA’s uncontested capital and O&M forecasts for Corporate107.
Security and Business Resiliency should be approved.
Section 12
SCE should be required to make a showing in the next GRC that the108.
interim EOC remains used and useful, or the undepreciated balance should be
removed from rates.
A total O&M forecast of $296.317 million (2012$) should be adopted109.
for FL&OS.
The following capital forecast should be adopted for FL&OS:110.
$78.400 million in 2014 and $86.098 million in 2015 (nominal$).
Section 13
A total O&M forecast of $65.021 million (2012$) should be adopted111.
for External Relations.
SCE’s request to modify the PDDMA to record only non-labor costs112.
should be approved.
Section 14
The MRTUMA should be eliminated.113.
SCE should be authorized to transfer the final December 31, 2014114.
balance of RSDMA to BRRBA for recovery in distribution rates as part of its
advice letter filing implementing this decision.
The RSDMA should be extended through 2017.115.
SCE’s request to eliminate the ESCBA and SOMA should be116.
approved.
- 495 -

A.13-11-003 ALJ/KD1/ar9/jt2/lil PROPOSED DECISION (Rev. 12)
Section 15
SCE’s uncontested jurisdictional allocation factors should be117.
approved.
Section 16
TURN’s forecast of new Residential and Non-Residential meters118.
should be approved.
SCE’s forecast of new Agricultural meters should be approved.119.
SCE’s forecasts of retail sales and number of customers, as adjusted120.
based on the adopted forecast of new meters, should be approved.
Sections 17-20
SCE’s total OOR forecast of approximately $201 million in 2015121.
should be adopted.
An audit of NTP&S should be conducted.122.
SCE’s uncontested cost escalation method should be adopted.123.
The following PTYR escalation rates should be adopted:124.
Category 2016 2017 Notes
O&M - Labor
Disability Programs 2.30% 2.60% Global Insight
Executive Benefits 2.30% 2.60% Global Insight
401(k) 2.30% 2.60% Global Insight
O&M - Other
Medical 8.00% 8.00% SCE Estimate
Dental 4.50% 4.50% SCE Estimate
Vision 2.00% 2.00% SCE Estimate
Group Life 0.00% 0.00% SCE Estimate
Misc. Benefit 3.03% 2.90% SCE Estimate
Capital Additions 2.00% 2.00% Applied to 2015 capital additions,based on 2015 authorized capitalexpenditures
SCE’s Z-factor mechanism should be adopted.125.
- 496 -

A.13-11-003 ALJ/KD1/ar9/jt2/lil PROPOSED DECISION (Rev. 12)
SCE’s proposal to implement PTYR updates by advice letter should126.
be adopted.
SCE’s uncontested method for converting capital expenditures to127.
Plant-In-Service should be adopted.
Section 21
The adopted life curves, summarized in the following table, are128.
reasonable.
Account Approved Life Curve
353 Station equipment 45 R 0.5
354 Towers & Fixtures 65 R 5355 Poles & Fixtures 50 R 0.5356 Overhead Conductors & Devices 61 R 3362 Station Equipment 45 R 1.5364 Poles, Towers & Fixtures 47 L 0.5367 Underground Conductors & Devices 45 R 0.5
368 Line Transformers 33 R 1
369 Services 45 R 1.5
373 Street Lighting & Signal Systems 40 L 0.5
- 497 -

A.13-11-003 ALJ/KD1/ar9/jt2/lil PROPOSED DECISION (Rev. 12)
The adopted NSRs, summarized in the following table, are129.
reasonable.
AccountApproved NSR
Transmission Plant
352 - Structures and Improvements -35%
353 - Station Equipment -15%
354 - Towers and Fixtures -60%
355 - Poles and Fixtures -72%
356 - Overhead Conductors & Devices -80%
Distribution Plant
362 - Station Equipment -25%
364 - Poles, Towers and Fixtures -210%
365 - Overhead Conductors & Devices -115%
366 - Underground Conduit -30%
367 - Underground Conductors & Devices -60%
368 - Life Transformers -20%
369 - Services -100%
373 - Street Lighting & Signal Systems -30%
SCE’s service life estimates for hydro, Pebbly Beach, and Palo Verde130.
should be approved.
TURN’s estimated service lives of 35 years for the Peakers and for131.
Mountainview should be approved.
ORA’s proposed 25-year life estimate for Solar PV should be132.
approved.
Section 22
The facts of Re Southern California Gas Co., D.92-08-007 (SoCalGas)133.
and Re Southern California Water Co., D.93-04-046 (SoCal Water) are
distinguishable from SCE’s safe harbor repair deduction because they concern
requests to modify the authorized tax expense for past years and the changes
were not addressed in GRCs that set rates for the applicable years.
- 498 -

A.13-11-003 ALJ/KD1/ar9/jt2/lil PROPOSED DECISION (Rev. 12)
The Commission has the authority to address the future implications134.
of tax strategies developed for past tax years.
The adopted ratebase offset is not retroactive ratemaking because it135.
is solely prospective.
Unlike Pacific Telephone, the change has been discussed directly in136.
the record of this proceeding to set prospective rates to be in force only after a
hearing.
We frequently consider past events in setting general rates. The mere137.
fact we consider past events in setting rates prospectively does not make this
“retroactive ratemaking.”
A ratebase offset does not violate normalization.138.
A ratebase offset of $344.026 million, applied in 2015 should be139.
adopted.
TURN’s proposed remedy to reduce SCE’s state income tax by140.
$2.090 million, less a $0.731 million increase in federal taxes per year during
2015-2017, is solely prospective.
TURN’s proposal to reduce SCE’s state income tax by $2.090 million,141.
less a $0.731 million increase in federal taxes should be approved.
SCE should create a two-way Tax Accounting Memorandum142.
Account to track all tax changes during this GRC period.
Section 23
A total M&S forecast of $116.948 million (nominal$) in 2015 should143.
be approved.
A $103.360 million reduction to rate base relative to SCE’s proposal144.
for income tax lag should be approved.
- 499 -

A.13-11-003 ALJ/KD1/ar9/jt2/lil PROPOSED DECISION (Rev. 12)
SCE’s proposals, including modifications proposed by TURN and145.
uncontested by SCE, for other aspects of working cash lead lag study should be
approved.
SCE’s rate base should be offset by $180.269 million, or 90% of146.
customer deposits.
SCE should be authorized to charge an offsetting interest expense147.
based on the three-month commercial paper interest rate for the rate base offset
of customer deposits.
The continued use of 10% of customer deposits for the community148.
banking program, up to $20.030 million, should be approved.
SCE’s uncontested proposed AFUDC rates should be approved.149.
Sections 25-28
SCE’s forecast of OpX savings, as modified to provide 75 percent of150.
forecast, adjusted savings for IT and customer service should be adopted.
SCE and CforAT’s joint forecast of $1.5 million for accessibility151.
issues should be approved.
SCE should be required to provide a more detailed forecast in its152.
next GRC if it seeks to continue the accessibility program.
The settlement between SCE and JMP should be approved.153.
- 500 -
A.13-11-003 ALJ/KD1/ar9/jt2/lil PROPOSED DECISION (Rev. 12)
O R D E R
IT IS ORDERED that:
Application 13-11-003 is granted to the extent set forth in this Decision.1.
Southern California Edison Company is authorized to collect, through rates and
through authorized ratemaking accounting mechanisms, the 2015 test year base
revenue requirement set forth in Appendix C, effective January 1, 2015.
Southern California Edison Company shall file its next General Rate Case2.
for test year 2018 pursuant to the applicable Rate Case Plan adopted in Decision
(D.) 89-01-040, as modified, including the requirements of D.14-12-025.
In its next General Rate Case (GRC), Southern California Edison Company3.
(SCE) shall provide tables with at least five years of recorded spending
information associated with each individual expense or expenditure forecast in
excess of $1 million. SCE shall also provide summary tables, aggregating this
information at the level of major categories (e.g. Transmission and Distribution
Infrastructure Replacement, Human Resources). SCE shall provide its own
comparable forecast and the Commission’s adopted forecast from this GRC as a
component of or accompaniment to these tables, both for individual forecasts and
summary tables. SCE shall briefly explain any changes in scope of the forecasts,
if they are not directly comparable. In the summary tables, SCE shall include any
expenses or expenditures that were included in this GRC request, even if the
individual expense or expenditure was not actually approved in this decision or
implemented by SCE.
In its next general rate case, Southern California Edison Company shall4.
provide an explanation of the workload analysis used to develop estimated labor
increases.
- 501 -

A.13-11-003 ALJ/KD1/ar9/jt2/lil PROPOSED DECISION (Rev. 12)
Southern California Edison Company shall eliminate the following5.
accounts:
Mohave Balancing Account;a)
Solar Photovoltaic Program Balancing Account;b)
Fuel Cell Program Memorandum Account;c)
Catastrophic Event Memorandum Account;d)
Market Redesign and Technology Upgrade Memorandum Account;e)
Edison SmartConnect Balancing Account;f)
Edison SmartConnect Opt-Out Memorandum Account; andg)
General Rate Case Revenue Requirement Memorandum Account.h)
Southern California Edison Company shall continue all accounts not6.
eliminated or modified by this decision.
Southern California Edison Company (SCE) is authorized to institute a7.
Safety and Reliability Investment Incentive Mechanism to replace the previous
Reliability Investment Incentive Mechanism. SCE shall submit an advice letter
on or before April 30, 2018 reporting on the results of its capital spending and
staffing relative to the targets, and implementing any refunds, as described here.
Specifically:
This mechanism will operate during this rate case period, 2015a.through 2017.
The capital spending target is the sum of the authorized amountsb.in the core categories: Worst Circuit Rehabilitation,Underground Cable Life, Cable-in-Conduit Replacement,Underground Switch, Underground Structure Replacement,Circuit Breaker Replacements, and Substation TransformerReplacement.
The High Priority categories are: customer growth, storms, andc.claims.
- 502 -

A.13-11-003 ALJ/KD1/ar9/jt2/lil PROPOSED DECISION (Rev. 12)
If spending does not meet the capital spending target, overspending ind.the High Priority categories can offset underspending in the corecategories if two conditions are true: the overspending in HighPriority categories exceeds ten percent of the adopted forecast for thosecategories and Southern California Edison Company’s actual rate ofreturn on rate base for the period does not exceed the authorized rateof return. The first ten percent of overspending on High Prioritycategories cannot be used to offset underspending in the corecategories under any circumstance. Otherwise, the difference betweenthe capital spending target and the actual capital spending in the corecategories shall be refunded to ratepayers.
The staffing target is 2,225 employees in the categories identified ine.exhibit SCE-3V1 at page 27. If Southern California Edison Companydoes not meet this target by the end of 2017, it shall refund $20,000 peremployee for each of the first fifty employees it falls short of the targetand $80,000 per employee beyond fifty. If a shortfall develops betweenSeptember 31, 2017 and December 31, 2017, Southern California EdisonCompany may cure the shortfall by March 31, 2018 without penalty.
Southern California Edison Company is authorized to establish a Pole8.
Loading Program Balancing Account. This account will record expenditures
related to the Pole Loading Program and deteriorated pole replacements. The
account will be capped at 1015% above the adopted forecast amounts. for 2016
and 2017. There will be no cap for 2015.
Southern California Edison Company (SCE) shall include in its direct9.
showing in its next general rate case, the following:
SCE shall present a review of its efforts to ensure that SCEa.ratepayers are not unduly subsidizing other companies’ use of jointuse poles.
SCE shall present analysis of options to remediate additionalb.overloaded poles beyond those replaced at SCE ratepayer expense.This analysis should address at least the following options:removing attachments, strengthening existing poles, or achievinggreater cost share contributions from joint pole users.
- 503 -

A.13-11-003 ALJ/KD1/ar9/jt2/lil PROPOSED DECISION (Rev. 12)
SCE shall document its employee headcount forecast and show howc.that headcount forecast is applied in any cost forecast that relies onit.
SCE shall present a clear and coordinated showing on its recognitiond.programs including Spot Bonuses and Awards to CelebrateExcellence.
SCE shall present a showing that the interim Emergency Operationse.Center remains used and useful.
SCE shall explicitly present its cost-benefit analysis of the Generalf.Office 2 Conference & Training Center.
If Energy Division has not published an affiliated transactions auditg.that includes a focused review of Non-Tariffed Products & Servicesby the end of 2015, SCE shall contract for an independent audit. SCEshall consult with Energy Division in hiring the auditor, developingthe scope of work, and managing the audit. At a minimum, theaudit shall review Non-Tariffed Products & Services incrementalcosts from 2012 to 2015. SCE shall include the results of this audit,and/or the review from Energy Division’s affiliated transactionsaudit, in its next General Rate Case filing.
SCE shall present a net present value estimate of the impact of itsh.changed formula to allocate tax expense, as measured from 2015, inits next General Rate Case filing. That estimate shall take intoaccount the entire tax lives of the relevant depreciable assets.
SCE shall provide considerably more detail in support of its neti.salvage proposals for at least five of the largest accounts, asmeasured by proposed annual depreciation expense. At aminimum, this detail shall include:
A quantitative discussion of the historical and anticipatedi.future Cost of Removal (COR) on a per unit basis for the large(greater than 15% as measured by portion of plant balance)asset classes in the account. This discussion should identifyand explain the key factors in changing or maintaining theper-unit COR.
A quantitative discussion of the historical and anticipatedii.future retirement mix (i.e., retirements among different asset
- 504 -
A.13-11-003 ALJ/KD1/ar9/jt2/lil PROPOSED DECISION (Rev. 12)
classes), identifying and explaining the key factors in changingor maintaining this mix.
A quantitative discussion of the life of assets and original costiii.of assets being retired, in relation to the COR, on both ahistorical and anticipated future basis. This discussion shouldbe integrated with and/or cross-reference the proposal for lifecharacteristics.
An account-specific discussion of the process for allocatingiv.costs to COR.
If SCE wishes to continue the accessibility program and funding forj.the accessibility coordinator in the next General Rate Case period, itmust provide a considerably more specific forecast and justification.In its direct showing, SCE shall include: a description of theaccomplishments of the program up to that point, analysis of specificforecast costs, and demonstration that such costs are complementaryand not duplicative of other forecasts.
Southern California Edison Company shall file a Tier 1 Advice Letter10.
within twenty days of the effective date of this decision to implement the revenue
requirement and ratemaking adopted herein. The revenue requirement and
revised tariff sheets will be effective January 1, 2015. The balance of the General
Rate Case Revenue Requirement Memorandum Account shall be amortized in
rates from DecemberJanuary 1, 20152016 to December 31, 2017.
San Diego Gas & Electric Company’s (SDG&E’s) request for an authorized11.
revenue requirement for Marine Mitigation is granted. SDG&E shall file a Tier 1
Advice Letter within twenty days of the effective date of this decision outlining
its method to calculate its revenue requirement. SDG&E shall continue tracking
its Marine Mitigation costs and revenue requirement differences in its Marine
Mitigation Memorandum Account until the effective date of the rates adopted in
its General Rate Case Application 14-11-003/4. SDG&E shall implement its
marine mitigation revenue requirement and ratemaking adopted herein for
marine mitigation concurrently with its General Rate Case. The marine
- 505 -

A.13-11-003 ALJ/KD1/ar9/jt2/lil PROPOSED DECISION (Rev. 12)
mitigation revenue requirement and revised tariff sheets, if any, will be effective
January 1, 2015.
Within 45 days of the effective date of this decision, Southern California12.
Edison Company shall issue a true-up of marine mitigation costs billed to San
Diego Gas and Electric Company reflecting the categorization of costs as expense.
Southern California Edison Company shall transfer the General Rate Case13.
Revenue Requirement Memorandum Account balance, as of the effective date of
this decision, to its Authorized Base Revenue Requirement Balancing Account.
Southern California Edison Company and San Diego Gas & Electric14.
Company are not permitted to recover any cost twice. If a cost permitted for
recovery here is also recovered from the nuclear decommissioning trust (or any
other source), Southern California Edison Company and/or San Diego Gas &
Electric Company shall refund the revenue requirement associated with that cost
to ratepayers, with interest.
Southern California Edison Company and San Diego Gas & Electric15.
Company are authorized to file an application to recover costs in the event that
California Coastal Commission does require additional reef construction, or other
measures. In that application, Southern California Edison Company shall
demonstrate that it has made a reasonable effort to represent ratepayers’ interests
in front of all applicable regulatory bodies and that its cost forecast is reasonable.
Southern California Edison Company and San Diego Gas & Electric Company
shall recover any such costs as operations and maintenance expense, not capital
expenditures.
Southern California Edison Company is authorized to modify the Project16.
Development Division Memorandum Account to record only non-labor
expenses.
- 506 -

A.13-11-003 ALJ/KD1/ar9/jt2/lil PROPOSED DECISION (Rev. 12)
Southern California Edison Company should be authorized to transfer the17.
final December 31, 2014 balance of Residential Service Disconnection
Memorandum Account to Base Revenue Requirement Balancing Account for
recovery in distribution rates as part of its advice letter filing implementing this
decision.
Southern California Edison Company is authorized to extend the18.
Residential Service Disconnection Memorandum Account through 2017.
Southern California Edison Company (SCE) is authorized to implement a19.
Post-Test Year Ratemaking mechanism for both 2016 and 2017, as follows:
Expenses shall be escalated as proposed by SCE, using the samea.pricing methodology and pricing indices that we adopt for testyear escalation, except for labor expenses [namely: disabilityprograms, executive benefits, and 401(k)]. For labor expenses,SCE shall use Global Insight’s most current forecast. For medicalexpenses, we adopt SCE’s escalation rate of 8%. We also adoptSCE’s proposed escalation rates for other benefits categories. Forall other expenses, we adopt SCE’s proposal of using the latestGlobal Insight escalation rates.
Capital-related revenues shall be escalated by increasing grossb.capital additions in the post test years at a rate of 2% per yearabove the 2015 authorized capital additions.
SCE’s Z-factor recovery mechanism shall continue for 2016 andc.2017.
We allow SCE to file an advice letter to implement the post-testd.year revenue requirement. SCE must file an advice letter byDecember 1st of 2015 and 2016. In these advice letters, SCE mustupdate its post-test year revenue requirement for the followingattrition year. For the second attrition year of 2017, SCE shall usethe latest Global Insight escalation rates to escalate 2015authorized level of expenses to 2016 and 2017 levels, but the 2016authorized level of expenses will not be trued up to reflect theactual escalation factor for 2016.
- 507 -

A.13-11-003 ALJ/KD1/ar9/jt2/lil PROPOSED DECISION (Rev. 12)
Southern California Edison Company is authorized to create a two-way20.
Tax Accounting Memorandum Account to track all tax changes during this GRC
period.
The settlement between Southern California Edison Company and Joint21.
Minority Parties is approved.
Application 13-11-003 is closed.22.
This order is effective today.
Dated , at Sacramento, California.
- 508 -
A.13-11-003 ALJ/KD1/ar9/jt2/lil PROPOSED DECISION (Rev. 1)
APPENDIX A

A.13-11-003 ALJ/KD1/ar9/jt2/lil PROPOSED DECISION (Rev. 12)
- 3 -

A.13-11-003 ALJ/KD1/ar9/jt2/lil PROPOSED DECISION (Rev. 1)
APPENDIX
List of Acronyms
ACRONYMS MEANING
5YA five-year average
A. Application
AB Assembly Bill
ACE Awards to Celebrate Excellence
ADIT Accumulated Deferred Income Taxes
AFUDC Allowance for Funds Used During Construction
ALJ Administrative Law Judge
APS Arizona Public Service
ARIMA Autoregressive Integrated Moving Average
ASD Audit Services Department
ASLs average service lives
ASR Advanced Speech Recognition
BCD Business Customer Division
BLT Business License Tax
BRRBA Base Revenue Requirement Balancing Account
C&C Cybersecurity & Compliance Division
C&I Commercial and Industrial
CAISO California Independent System Operator
CaL-SLA California City-County Street Light Association
CANSPAM Controlling the Assault of Non-Solicited Pornography andMarketing
CASL Coalition for Affordable Streetlights
CCC California Coastal Commission
CCEEB California Council for Environmental and Economic Balance
- 1 -

A.13-11-003 ALJ/KD1/ar9/jt2/lil PROPOSED DECISION (Rev. 1)
CDP Coastal Development permit
CEHS Corporate Environmental, Health, and Safety
CEMA Catastrophic Event Memorandum Account
CforAT Center for Accessible Technology
CI Conformance Index
CIAC Contributions in Aid of Construction
CIC Cable-in-Conduit
CIP Critical Infrastructure Protection
CLRP Circuit Load Reduction Program
CMS Consolidated Mobile Solution
COR Cost of Removal
CPI-U Urban Consumer Price Index
CPUC California Public Utilities Commission
CRAS Centralized Remedial Action Scheme
CRE Corporate Real Estate
CS&P Client Services & Planning
CSA Contract Services Agreement
CSRs Customer Service Representatives
CUE Coalition of Utility Employees
CWIP Construction Work In Progress
D. Decision
DESI Distributed Energy Storage Integration
DFR/PMU Digital Fault Recorded/Phasor Measurement Unit
DIMP Distribution Inspection and Maintenance Program
DR Demand Response
DSP Distribution Substation Plan
EBITDA Earnings Before Interest, Taxes, Depreciation, andAmortization
EDEF Equipment Demonstration and Evaluation Facility
- 2 -

A.13-11-003 ALJ/KD1/ar9/jt2/lil PROPOSED DECISION (Rev. 1)
eDMRM Electronic Document Management/Records Management
EDS Economic Development Services
EEI Edison Electric Institute
EIC Executive Incentive Compensation
EIX Edison International
EOC Emergency Operations Center
ERRA Energy Resource Recovery Account
ESC Edison SmartConnect®
ESCBA Edison SmartConnect Balancing Account
ESOP Employee Stock Ownership Plan
ESOPTMA Employee Stock Ownership Plan Tax Memorandum Account
EVTC Electric Vehicle Technical Center
FCC Final Cost Centers
FCI Facility Condition Index
FCPMA Fuel Cell Program Memorandum Account
FERC Federal Energy Regulatory Commission
FFH Factory Fired Hours
FL&OS Financial, Legal, and Operational Services
FTE Full Time Equivalent
GCC Grid Control Center
GMS Generation Management System
GO General Order
GO2 General Order 2
GRC General Rate Case
GRSM Gross Revenue Sharing Mechanism
HAN Home Area Network
HGPI Hot Gas Path Inspection
HR Human Resources
- 3 -

A.13-11-003 ALJ/KD1/ar9/jt2/lil PROPOSED DECISION (Rev. 1)
IBC Irwindale Business Center
IP&EA Integrated Planning & Environmental Affairs
IT Information Technology
ITS Infrastructure Technology Services
JMP Joint Minority Parties
JPO Joint Pole Organization
kV kilovolt
kW kilowatt
LED Light Emitting Diode
LPA Local Public Affairs
LRY last recorded year
LTI Long Term Incentives
LTIP Long-Term Incentive Plan
M&S Materials and Supplies
MAP Master Access Project
MIP Management Incentive Program
MRTUMA Market Redesign and Technology Upgrade MemorandumAccount
MSO Meter Services Organization
NARUC National Association of Regulatory Utility Commissioners
NERC North American Electric Reliability Corporation
NOEIP Non-Officer Executive Incentive Compensation Program
NSR Net Salvage Ratio
NTP&S Non-Tariffed Products and Services
O&M Operations and Maintenance
OBs Opening Briefs
ODI Overhead Detail Inspection
OIR Order Instituting Rulemaking
OOR Other Operating Revenue
- 4 -

A.13-11-003 ALJ/KD1/ar9/jt2/lil PROPOSED DECISION (Rev. 1)
OpX Operational Excellence
ORA Office of Ratepayer Advocates
OS Operational Services
OU Operating Unit
P&PR Planning & Performance Reporting
PB Project Pebbly Beach Generating Station Generation AutomationProject
PBOPs Post-retirement Benefits Other than Pensions
PCAN A type of agricultural meter
PCB Polychlorinated Biphenyl
PDD Project Development Division
PDDMA Project Development Division Memorandum Account
PDL Polynomial Distributed Lag
PG&E Pacific Gas and Electric Company
PLP Pole Loading Program
PLPBA PLP Balancing Account
PMO Program Management Organization
PPA Power Purchase Agreement
PPO Planning and Performance Organization
psf Pounds per square foot
PTYR Post-Test Year Ratemaking
PVNGS Palo Verde Nuclear Generating Station
R Rulemaking
RAS Remedial Action Schemes
RCMS Renewable Contract Management System
REI Retirement Experience Index
RIIM Reliability Investment Incentive Mechanism
RO Results of Operations
RP&A Regulatory Operations and Regulatory Policy & Affairs
- 5 -

A.13-11-003 ALJ/KD1/ar9/jt2/lil PROPOSED DECISION (Rev. 1)
RS Results Sharing
RSDMA Residential Service Disconnection Memorandum Account
RTEM Real Time Energy Meters
SAIDI System Average Interruption Duration Index
SAIFI System Average Interruption Frequency Index
SAM Software Asset Management
SBUA Small Business Utility Advocates
SCE Southern California Edison Company
SCJPC Southern California Joint Pole Committee
SDD Supplier Diversity and Development Department
SDG&E San Diego Gas & Electric Company
SERP Substation Equipment Replacement Program
SIR Substation Infrastructure Replacement
SM&P Service Management & Planning
SoCalGas Southern California Gas Company
PV Photovoltaic
SOMA SmartConnect Opt-Out Memorandum Account
SONGS San Onofre Nuclear Generating Station
SPR Simulated Plant Record
SPS Southwestern Public Service Company
SPVP Solar Photovoltaic Program
SPVPBA Solar Photovoltaic Program Balancing Account
SRIIM Safety and Reliability Investment Incentive Mechanism
SS&C The Safety, Security, and Compliance
SSID Shop Services and Instrumentation Division
STIP Short-Term Incentive Program
T&D Transmission and Distribution
TBCLE Testing-Based Cable Life Extension
- 6 -
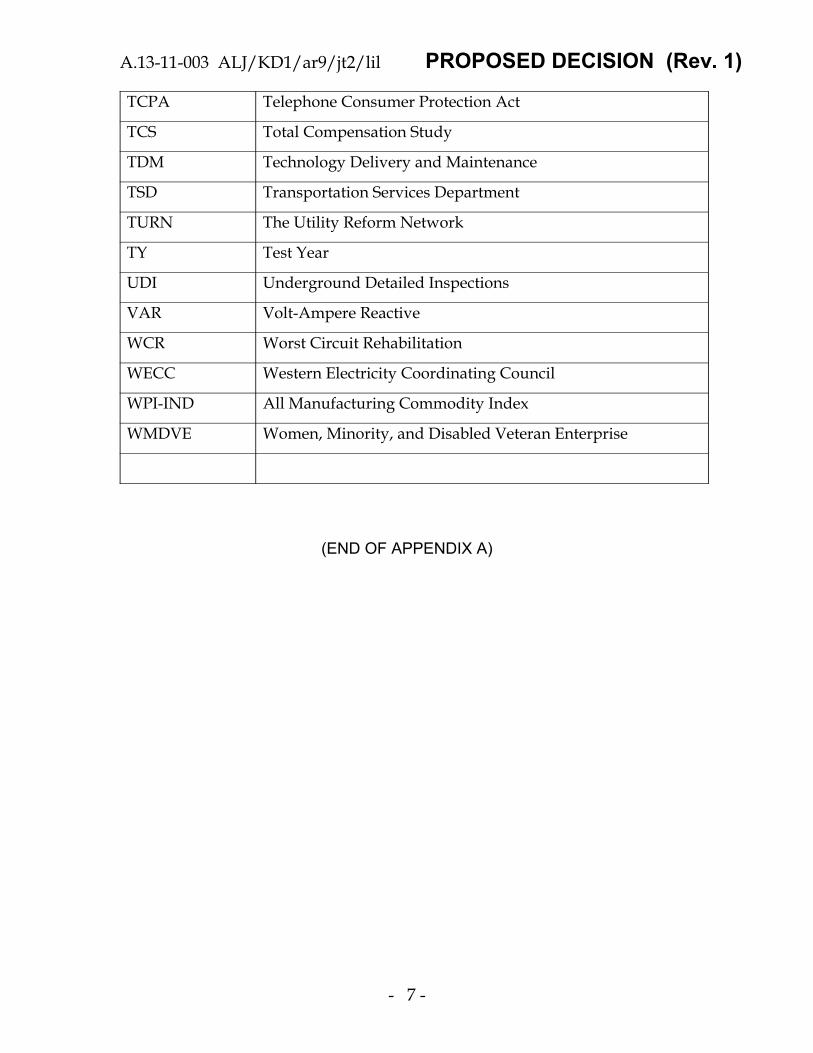
A.13-11-003 ALJ/KD1/ar9/jt2/lil PROPOSED DECISION (Rev. 1)
TCPA Telephone Consumer Protection Act
TCS Total Compensation Study
TDM Technology Delivery and Maintenance
TSD Transportation Services Department
TURN The Utility Reform Network
TY Test Year
UDI Underground Detailed Inspections
VAR Volt-Ampere Reactive
WCR Worst Circuit Rehabilitation
WECC Western Electricity Coordinating Council
WPI-IND All Manufacturing Commodity Index
WMDVE Women, Minority, and Disabled Veteran Enterprise
(END OF APPENDIX A)
- 7 -
A.13-11-003 ALJ/KD1/ar9/jt2/lil PROPOSED DECISION (Rev. 1)
APPENDIX B
Timeline of Events Relevantto Disputed Tax Issues

A.13-11-003 ALJ/KD1/ar9/jt2/lil PROPOSED DECISION (Rev. 1)
Date Event Citation
November 23, 2010 Application A.10-11-015 D.12-11-051
March 1, 2011 Scoping Ruling D.12-11-051
August 19, 2011 Rev. Proc. 2011-43 published Exh. SCE-26 at 39.
July 25-26 and August 8-26,
2011
Evidentiary hearings D.12-11-051
September 26, 2011 Opening briefs due D.12-11-051
October 17, 2011 Reply briefs due D.12-11-051
October 24, 2011 Update Testimony D.12-11-051
November 3, 2011 Update hearing D.12-11-051
November 15, 2011 Update OBs due D.12-11-051
November 25, 2011 LB&I Directive published Exh. SCE-26 at 39.
November 27, 2011 Update reply briefs due D.12-11-051
February, 2012 2011 SCE Form 10-K Exh. TURN-05 at 102.
February, 2012 2011 SCE Annual Report Exh. TURN-05 at 101, fn. 188
August 2012 SCE files 2011 tax return SCE-26V2 at 42
August 24, 2012 Form 3115/Repair Deduction
Election filed with IRS
Exh. TURN-05 at 102.
September 24, 2012 Ex parte communication
between SCE and
Commission staff
[Docket]
October 19, 2012 Proposed Decision D.12-11-051
November 8, 2012 SCE Motion to File
Comments on Results of
Operations Model
[Docket]
November 8, 2012 Comments on PD due D.12-11-051
November 13, 2012 Reply Comments on PD due D.12-11-051
November 13-15, 2012 Ex parte communications
between SCE and
Commission staff
[Docket]
November 16, 2012 Oral argument [Docket]
November 27, 2012 Ex parte communication
between SCE and
Commission staff
[Docket]
November 29, 2012 D.12-11-051 closes
proceeding
D.12-11-051
February, 2013 EIX 2012 Annual Report Exh. TURN-05 at 102.
(End of Appendix B)

A.13-11-003 ALJ/KD1/ar9/jt2/lil PROPOSED DECISION (Rev. 1)

A.13-11-003 ALJ/KD1/ar9/jt2/lil PROPOSED DECISION (Rev. 1)
APPENDIX C
Results of Operations 2015

A.13-11-003 ALJ/KD1/ar9/jt2/lil PROPOSED DECISION (Rev. 1)
Appendix C Appendix D
1. CPUC 2015 Adopted RO 1. 2016 and 2017 Summary of Earnings
2. Total Co Adopted 2015 RO
3. Sales & Customer Forecast
O&M Expense Appendices
4. Total Production
5. Steam Production
6. Nuclear Production
7. Hydro Production
8. Other Production
9. Transmission Expenses
10. Distribution Expenses
11. Customer Accounts Expenses
12. Customer Service and Information and Sales Expenses
13. Administrative and General Expenses
14. Total O&M Expenses
15. Total O&M Labor Expenses
16. Total O&M NonLabor Expenses
17. Total O&M Other Expenses
Tax Appendices
18. Total Other Taxes
19. Total Income Taxes
Capital/Rate Base Appendices
20. Depreciation and Amortization Expenses
21. Summary Electric Rate Base
22. Total Weighted Average Plant
23. Working Cash
24. Average Lag in Payment of Operating Expenses
25. Other Operating Revenue
26. Net-To-Gross Multiplier
27. Jurisdictional Allocation
Southern California Edison
2015 General Rate Case
Application
Results of Operations Model
Table of Contents - Appendices

A.13-11-003 ALJ/KD1/ar9/jt2/lil PROPOSED DECISION (Rev. 12)
APPENDIX C Southern California Edison Company
2015 Results of Operations
Thousands of Dollars
Adopted SCE Request Difference
Line CPUC (Based on May 2015 (Adopted Less
No. Item Total Update Testimony) SCE Request)
1. TOTAL OPERATING REVENUES 5,157,886 64,500 (248) (33,260) 5,188,877 5,511,779 (322,902)
2. OPERATING EXPENSES:
3. Production
4. Steam 9,362 9,362 7,342 2,021
5. Nuclear 73,695 73,695 73,818 (123)
6. Hydro 52,850 52,850 53,142 (292)
7. Other 116,944 116,944 120,835 (3,891)
8. Subtotal Production 252,851 - - - 252,851 255,137 (2,285)
9. Transmission 91,389 91,389 93,402 (2,013)
10. Distribution 514,783 514,783 545,469 (30,685)
11. Customer Accounts 168,209 168,209 174,719 (6,510)
12. Uncollectibles 12,276 131 (1) (79) 12,327 13,095 (769)
13. Customer Service & Information 37,948 37,948 39,020 (1,072)
14. Administrative & General 759,139 759,139 819,258 (60,119)
15. Franchise Requirements 46,911 584 (2) (303) 47,191 50,128 (2,937)
16. Revenue Credits (147,491) (147,491) (147,470) (22)
17. Subtotal 1,736,015 715 (3) (382) 1,736,346 1,842,758 (106,412)
18. Escalation 102,063 - - - 102,063 109,339 (7,276)
19. Depreciation 1,483,191 49,100 - - 1,532,291 1,676,696 (144,404)
20. Taxes Other Than On Income 245,766 245,766 252,343 (6,578)
21. Taxes Based On Income 204,215 5,170 (100) (7,309) 201,976 197,020 4,956
22. Total Taxes 449,981 5,170 (100) (7,309) 447,742 449,363 (1,621)
23. TOTAL OPERATING EXPENSES 3,771,250 54,985 (103) (7,691) 3,818,442 4,078,156 (259,714)
24. NET OPERATING REVENUE 1,386,636 9,514 (145) (25,569) 1,370,435 1,433,624 (63,188)
25. RATE BASE 17,552,347 147,280 1,837 (323,662) 17,375,965 18,175,824 (799,859)
26. RATE OF RETURN 7.90% 6.46% -7.90% -7.90% 7.89% 7.89% 7.90%
27. REVENUES AT PRESENT RATES 5,632,680 5,632,680 5,632,680 -
28.INCREASE OVER PRESENT REVENUE
REQUIREMENT IN RATES (474,794) (443,803) (120,901) (322,902)
AdoptedLegacy
Meters
Mohave
Credit
Rate Base
Adjustment
- 1 -

A.13-11-003 ALJ/KD1/ar9/jt2/lil PROPOSED DECISION (Rev. 12)
Line
No. Item Adopted
1. TOTAL OPERATING REVENUES 6,155,518
2. OPERATING EXPENSES:
3. Production
4. Steam 9,362
5. Nuclear 73,695
6. Hydro 52,850
7. Other 116,944
8. Subtotal Production 252,851
9. Transmission 172,600
10. Distribution 519,191
11. Customer Accounts 168,209
12. Uncollectibles 14,650
13. Customer Service & Information 37,948
14. Administrative & General 806,902
15. Franchise Requirements 55,984
16. Revenue Credits (193,280)
17. Subtotal 1,835,055
18. Escalation 108,344
19. Depreciation 1,705,444
20. Taxes Other Than On Income 304,457
21. Taxes Based On Income 403,576
22. Total Taxes 708,033
23. TOTAL OPERATING EXPENSES 4,356,876
24. NET OPERATING REVENUE 1,798,642
25. RATE BASE 22,767,620
26. RATE OF RETURN 7.90%
APPENDIX C Southern California Edison Company
2015 Total Company Results of Operation
Thousands of Dollars
- 2 -

A.13-11-003 ALJ/KD1/ar9/jt2/lil PROPOSED DECISION (Rev. 12)
Adopted
Sales Forecast (GWh)
Residential 29,493
Commercial 41,718
Industrial 8,135
Other Public Authority 1/ 4,675
Agricultural 1,428
85,449
Customer Forecast (No. of Customers)
Residential 4,393.2
Commercial 564.4
Industrial 10.3
Other Public Authority 1/ 46.2
Agricultural 21.7
5,035.9
1/ Includes Streetlighting class.
APPENDIX C
Southern California Edison
2015 Results of OperationsSales Forecast
- 3 -

A.13-11-003 ALJ/KD1/ar9/jt2/lil PROPOSED DECISION (Rev. 12)
CPUC
Adopted
1. TOTAL STEAM 9,362
2. TOTAL NUCLEAR 73,695
3. TOTAL HYDRO 52,850
4. TOTAL OTHER 116,944
5. TOTAL PRODUCTION Constant 2012$ 252,851
6. Escalation 13,439
7. TOTAL INCLUDING ESCALATION (2015$) 266,290
8. LABOR, NON-LABOR AND OTHER EXPENSE DETAIL:
9. Total Company Constant 2012$
10. Labor 92,207
11. Non-Labor 133,709
12. Other 26,935
13. Subtotal Total Company 252,851
14. Escalation:
15. Labor 7,243
16. Non-Labor 6,196
17. Other -
18. Subtotal Total Company 13,439
19. TOTAL INCLUDING ESCALATION (2015$) 266,290
Line
No.
Account
No. Description
Appendix C
Southern California Edison
Test Year 2015 General Rate Case
Operation And Maintenance Expenses
Thousands of Dollars
Category: Total Production
- 4 -
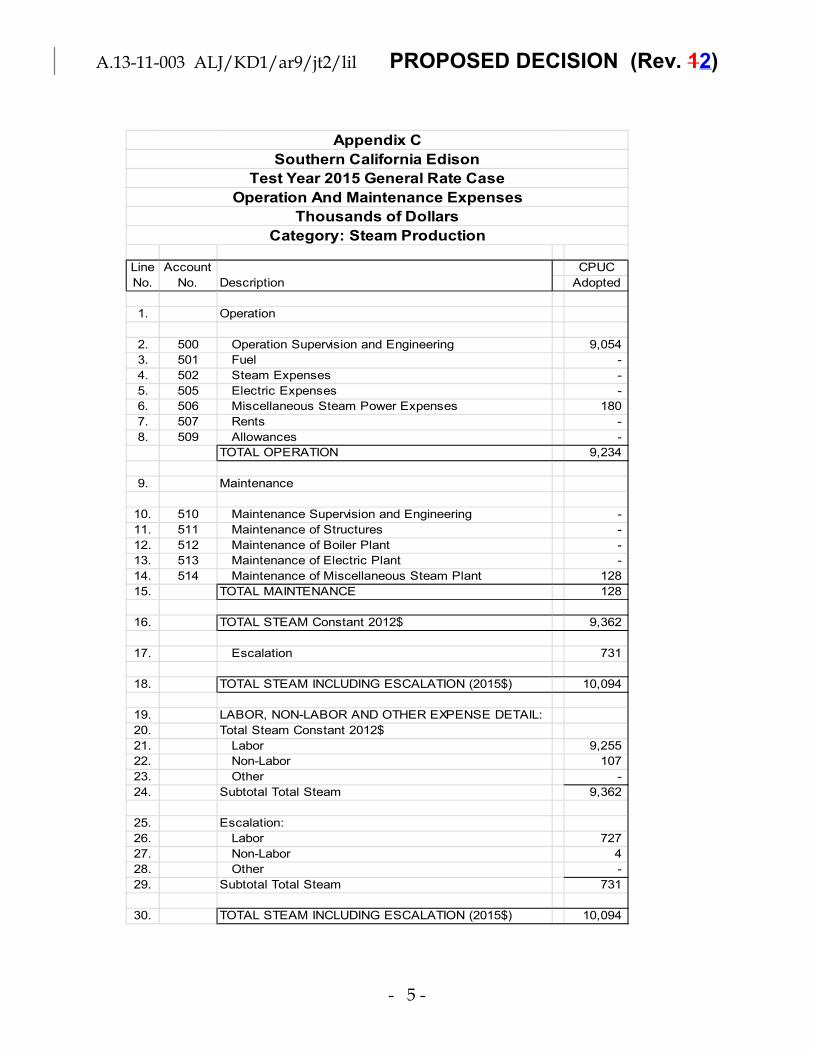
A.13-11-003 ALJ/KD1/ar9/jt2/lil PROPOSED DECISION (Rev. 12)
CPUC
Adopted
1. Operation
2. 500 Operation Supervision and Engineering 9,054
3. 501 Fuel -
4. 502 Steam Expenses -
5. 505 Electric Expenses -
6. 506 Miscellaneous Steam Power Expenses 180
7. 507 Rents -
8. 509 Allowances -
TOTAL OPERATION 9,234
9. Maintenance
10. 510 Maintenance Supervision and Engineering -
11. 511 Maintenance of Structures -
12. 512 Maintenance of Boiler Plant -
13. 513 Maintenance of Electric Plant -
14. 514 Maintenance of Miscellaneous Steam Plant 128
15. TOTAL MAINTENANCE 128
16. TOTAL STEAM Constant 2012$ 9,362
17. Escalation 731
18. TOTAL STEAM INCLUDING ESCALATION (2015$) 10,094
19. LABOR, NON-LABOR AND OTHER EXPENSE DETAIL:
20. Total Steam Constant 2012$
21. Labor 9,255
22. Non-Labor 107
23. Other -
24. Subtotal Total Steam 9,362
25. Escalation:
26. Labor 727
27. Non-Labor 4
28. Other -
29. Subtotal Total Steam 731
30. TOTAL STEAM INCLUDING ESCALATION (2015$) 10,094
Line
No.
Account
No. Description
Appendix C
Southern California Edison
Test Year 2015 General Rate Case
Operation And Maintenance Expenses
Thousands of Dollars
Category: Steam Production
- 5 -

A.13-11-003 ALJ/KD1/ar9/jt2/lil PROPOSED DECISION (Rev. 12)
- 6 -

A.13-11-003 ALJ/KD1/ar9/jt2/lil PROPOSED DECISION (Rev. 12)
CPUC
Adopted
1. Operation
2. 517 Operation Supervision and Engineering -
3. 518 Nuclear Fuel Expense -
4. 519 Coolants and Water -
5. 520 Steam Expenses -
6. 523 Electric Expenses -
7. 524 Miscellaneous Nuclear Power Expenses 73,695
8. 525 Rents -
9. TOTAL OPERATION 73,695
10. Maintenance
11. 528 Maintenance Supervision and Engineering -
12. 529 Maintenance of Structures -
13. 530 Maintenance of Reactor Plant Equipment -
14. 531 Maintenance of Electric Plant -
15. 532 Maintenance of Miscellaneous Nuclear Plant -
16. SONGS 2&3 Refueling Outage Adjustment -
17. TOTAL MAINTENANCE -
18. TOTAL NUCLEAR Constant 2012$ 73,695
19. Escalation 4,103
20. TOTAL NUCLEAR INCLUDING ESCALATION (2015$) 77,798
21. LABOR, NON-LABOR AND OTHER EXPENSE DETAIL:
22. Total Nuclear Constant 2012$
23. Labor 173
24. Non-Labor 73,522
25. Other -
26. Subtotal Total Nuclear 73,695
27. Escalation:
28. Labor 14
29. Non-Labor 4,089
30. Other -
31. Subtotal Total Nuclear 4,103
32. TOTAL NUCLEAR INCLUDING ESCALATION (2015$) 77,798
Line
No.
Account
No. Description
Appendix C
Southern California Edison
Test Year 2015 General Rate Case
Operation And Maintenance Expenses
Thousands of Dollars
Category: Nuclear Production
- 7 -

A.13-11-003 ALJ/KD1/ar9/jt2/lil PROPOSED DECISION (Rev. 12)
CPUC
Adopted
1. Operation
2. 535 Operation Supervision and Engineering -
3. 536 Water for Power 5,640
4. 537 Hydraulic Expenses -
5. 538 Electric Expenses -
6. 539 Miscellaneous Hydraulic Power Generation Expenses 31,160
7. 540 Rents -
8. TOTAL OPERATION 36,800
9. Maintenance
10. 541 Maintenance Supervision and Engineering -
11. 542 Maintenance of Structures -
12. 543 Maintenance of Reservoirs, Dams and Waterways -
13. 544 Maintenance of Electric Plant -
14. 545 Maintenance of Miscellaneous Hydraulic Plant 16,050
15. TOTAL MAINTENANCE 16,050
16. TOTAL HYDRO Constant 2012$ 52,850
17. Escalation 2,951
18. TOTAL HYDRO INCLUDING ESCALATION 2015$ 55,801
19. LABOR, NON-LABOR AND OTHER EXPENSE DETAIL:
20. Total Hydro Constant 2012$
21. Labor 28,506
22. Non-Labor 24,344
23. Other -
24. Subtotal Total Hydro 52,850
25. Escalation:
26. Labor 2,239
27. Non-Labor 712
28. Other -
29. Subtotal Total Hydro 2,951
30. TOTAL HYDRO INCLUDING ESCALATION 2015$ 55,801
Line
No.
Account
No. Description
Appendix C
Southern California Edison
Test Year 2015 General Rate Case
Operation And Maintenance Expenses
Thousands of Dollars
Category: Hydro Production
- 8 -

A.13-11-003 ALJ/KD1/ar9/jt2/lil PROPOSED DECISION (Rev. 12)
CPUC
Adopted
1. Operation
2. 546 Operation Supervision and Engineering -
3. 547 Fuel -
4. 548 Generation Expenses -
5. 549 Miscellaneous Other Power Generation Expenses 24,821
6. 550 Rents 2,084
7. TOTAL OPERATION 26,905
8. Maintenance
9. 551 Maintenance Supervision and Engineering -
10. 552 Maintenance of Structures -
11. 553 Maintenance of Generating and Electric Plant -
12. 554 Maintenance of Miscellaneous Other Power Generation Plant 43,949
13. 555 Purchased Power -
14. 556 System Control and Load Dispatching -
15. 557 Other Expenses 46,090
16. TOTAL MAINTENANCE 90,039
17. TOTAL OTHER Constant 2012$ 116,944
18. Escalation 5,654
19. TOTAL OTHER INCLUDING ESCALATION (2015$) 122,598
20. LABOR, NON-LABOR AND OTHER EXPENSE DETAIL:
21. Total Other Constant 2012$
22. Labor 54,273
23. Non-Labor 35,736
24. Other 26,935
25. Subtotal Total Other 116,944
26. Escalation:
27. Labor 4,263
28. Non-Labor 1,391
29. Other -
30. Subtotal Total Other 5,654
31. TOTAL OTHER INCLUDING ESCALATION (2015$) 122,598
Line
No.
Account
No. Description
Appendix C
Southern California Edison
Test Year 2015 General Rate Case
Operation And Maintenance Expenses
Thousands of Dollars
Category: Other Production
- 9 -

A.13-11-003 ALJ/KD1/ar9/jt2/lil PROPOSED DECISION (Rev. 12)
CPUC
Adopted
1. Operation:
2. 560 Operation Supervision and Engineering 17,461
3. 561 Load Dispatching 4,677
4. 562 Station Expenses 10,563
5. 563 Overhead Line Expenses -
6. 564 Underground Line Expenses -
7. 565 Transmission of Electricity by Others -
8. 566 Miscellaneous Transmission Expenses 28,304
9. 567 Rents -
10. TOTAL OPERATION 61,005
11. Maintenance:
12. 568 Maintenance Supervision and Engineering 7,625
13. 569 Maintenance of Structures -
14. 570 Maintenance of Station Equipment 5,298
15. 571 Maintenance of Overhead Lines 16,439
16. 572 Maintenance of Underground Lines -
17. 573 Maintenance of Miscellaneous Transmission Plant 1,021
18. TOTAL MAINTENANCE 30,383
19. TOTAL TRANSMISSION EXPENSE Constant 2012$ 91,388
20. Escalation 4,328
21. TOTAL INCLUDING ESCALATION (2015$) 95,716
22. LABOR, NON-LABOR AND OTHER EXPENSE DETAIL:
23. Total Constant 2012$
24. Labor 41,878
25. Non-Labor 41,382
26. Other 8,129
27. Subtotal 91,390
28. Escalation:
29. Labor 3,396
30. Non-Labor 932
31. Other -
32. Subtotal 4,328
33. TOTAL INCLUDING ESCALATION (2015$) 95,718
Line
No.
Account
No. Description
Appendix C
Southern California Edison
Test Year 2015 General Rate Case
Operation And Maintenance Expenses
Thousands of Dollars
Category: Transmission Expenses
- 10 -

A.13-11-003 ALJ/KD1/ar9/jt2/lil PROPOSED DECISION (Rev. 12)
CPUC
Adopted
1. Operation:
2. 580 Operation Supervision and Engineering 35,196
3. 582 Station Expenses 28,416
4. 583 Overhead Line Expenses 83,445
5. 584 Underground Line Expenses -
6. 585 Street Lighting and Signal System Expenses 8,689
7. 586 Meter Expenses 29,303
8. 587 Customer Installations Expenses 7,879
9. 588 Miscellaneous Distribution Expenses 107,421
10. 589 Rents -
11. TOTAL OPERATION 300,349
12. Maintenance:
13. 590 Maintenance Supervision and Engineering (3,141)
14. 591 Maintenance of Structures -
15. 592 Maintenance of Station Equipment 13,560
16. 593 Maintenance of Overhead Lines 144,083
17. 594 Maintenance of Underground Lines 42,533
18. 595 Maintenance of Line Transformers -
19. 596 Maintenance of Street Lighting and Signal Systems -
20. 597 Maintenance of Meters -
21. 598 Maintenance of Miscellaneous Distribution Plant 17,402
22. TOTAL MAINTENANCE 214,437
23. TOTAL DISTRIBUTION EXPENSE Constant 2012$ 514,786
24. Escalation 28,798
25. TOTAL INCLUDING ESCALATION (2015$) 543,584
26. LABOR, NON-LABOR AND OTHER EXPENSE DETAIL:
27. Total Constant 2012$
28. Labor 263,503
29. Non-Labor 249,354
30. Other 1,926
31. Subtotal 514,783
32. Escalation:
33. Labor 20,698
34. Non-Labor 8,101
35. Other -
36. Subtotal 28,798
37. TOTAL INCLUDING ESCALATION (2015$) 543,581
Line
No.
Account
No. Description
Appendix C
Southern California Edison
Test Year 2015 General Rate Case
Operation And Maintenance Expenses
Thousands of Dollars
Category: Distribution Expenses
- 11 -

A.13-11-003 ALJ/KD1/ar9/jt2/lil PROPOSED DECISION (Rev. 12)
CPUC CPUC
Adopted Total
1. 901 Supervision 8,078 8,078
2. 902 Meter Reading Expenses 16,771 16,771
3. 903 Customer Records and Collection Expenses 105,329 105,329
4. 904 Uncollectible Accounts 12,276 131 (1) (79) 12,327
5. 905 Miscellaneous Customer Accounts Expenses 37,814 37,814
6. Interest Offset on Customer Deposits 216 216
7. TOTAL CUSTOMER ACCOUNTS Constant 2012$ 180,484 180,535
8. Escalation 13,001 13,001
9. TOTAL INCLUDING ESCALATION (2015$) 193,485 193,536
10. Less: Account 904 (Uncollectible Accounts) - (12,276) (12,327)
11. TOTAL LESS ACCOUNT 904 (2015$) 181,209 181,209
12. LABOR, NON-LABOR AND OTHER EXPENSE DETAIL:
13. Total Constant 2012$
14. Labor 106,957 106,957
15. Non-Labor 60,424 60,424
16. Other 13,103 131 (1) (79) 13,154
17. Subtotal 180,485 180,535
18. Escalation:
19. Labor 8,401 8,401
20. Non-Labor 4,600 4,600
21. Other - -
22. Subtotal 13,001 13,001
23. TOTAL INCLUDING ESCALATION (2015$) 193,486 193,536
24. Less: Account 904 (Uncollectible Accounts) - (12,284) (12,327)
25. TOTAL LESS ACCOUNT 904 (2015$) 181,202 181,209
Category: Customer Accounts Expenses
Appendix C
Southern California Edison
Test Year 2015 General Rate Case
Operation And Maintenance Expenses
Thousands of Dollars
Rate Base
Adjustment
Line
No.
Account
No. Description
Legacy
Meters
Mohave
Credit
- 12 -

A.13-11-003 ALJ/KD1/ar9/jt2/lil PROPOSED DECISION (Rev. 12)
CPUC
Adopted
1. 907 Supervision 12,414
2. 908 Customer Assistance Expenses 25,534
3. 909 Informational and Instructional Advertising Expenses -
4. 910 Miscellaneous Customer Service and Informational Expenses -
5. 912 Demonstrating and Selling Expenses -
6. 913 Advertising Expenses -
7. TOTAL CUSTOMER SERVICE & INFORMATION 37,948
8. 916 Miscellaneous Sales Expenses -
9. TOTAL SALES EXPENSE -
10. TOTAL CSI AND SALES EXPENSE Constant 2012$ 37,948
11. Escalation 2,547
12. TOTAL INCLUDING ESCALATION (2015$) 40,495
13. LABOR, NON-LABOR AND OTHER EXPENSE DETAIL:
14. Total Constant 2012$
15. Labor 24,849
16. Non-Labor 13,099
17. Other -
18. Subtotal 37,948
19. Escalation:
20. Labor 1,952
21. Non-Labor 595
22. Other -
23. Subtotal 2,547
24. TOTAL INCLUDING ESCALATION (2015$) 40,495
Line
No.
Account
No. Description
Appendix C
Southern California Edison
Test Year 2015 General Rate Case
Operation And Maintenance Expenses
Thousands of Dollars
Category: Customer Service And Information And Sales Expenses
- 13 -

A.13-11-003 ALJ/KD1/ar9/jt2/lil PROPOSED DECISION (Rev. 12)
CPUC CPUC
Adopted Total
1. Operation:
2. 920 Administrative and General Salaries/Office Supplies and Expenses 290,407 290,407
3. 921 Administrative and General Salaries/Office Supplies and Expenses 177,128 177,128
4. 922 Administrative Expenses Transferred - Credit (112,687) (112,687)
5. 923 Outside Services Employed 49,326 49,326
6. 924 Property Insurance 17,850 17,850
7. 925 Injuries and Damages 107,430 107,430
8. 926 Employee Pensions and Benefits 184,998 184,998
9. 927 Franchise Requirements 46,911 584 (2) (303) 47,191
10. 928 Regulatory Commission Expenses - -
11. 930 General Advertising Expenses-Miscellaneous General Expenses 19,812 19,812
12. 931 Rents 14,322 14,322
13. Reduction for Productivity Savings/A&G Credit for Catalina Utilities (641) (641)
14. TOTAL OPERATION 794,854 795,134
15. Maintenance:
16. 935 Maintenance of General Plant 11,196 11,196
17. TOTAL MAINTENANCE 11,196 11,196
18. TOTAL A&G Constant 2012$ 806,050 806,329
19. Escalation 39,952 39,952
20. TOTAL INCLUDING ESCALATION (2015$) 1/ 846,001 846,281
21. Less: Account 927 (Franchise Requirements) (46,911) (47,191)
22. TOTAL LESS ACCOUNT 927 (2015$) 799,090 799,090
23. LABOR, NON-LABOR AND OTHER EXPENSE DETAIL:
24. Total Constant 2012$
25. Labor 303,677 303,677
26. Non-Labor 292,692 292,692
27. Other 209,681 584 (2) (303) 209,961
28. Subtotal 806,050 806,330
29. Escalation:
30. Labor 24,289 24,289
31. Non-Labor 15,663 15,663
32. Other - -
33. Subtotal 39,952 39,952
34. TOTAL INCLUDING ESCALATION (2015$) 1/ 846,002 846,282
35. Less: Account 927 (Franchise Requirements) (46,911) (47,191)
36. TOTAL LESS ACCOUNT 927 (2015$) 799,091 799,091
1/ Escalation for pensions & benefits is included in this amount
Category: Administrative And General Expenses
Appendix C
Southern California Edison
Test Year 2015 General Rate Case
Operation And Maintenance Expenses
Thousands of Dollars
Rate Base
Adjustment
Line
No. Account No. Description
Legacy
Meters
Mohave
Credit
- 14 -

A.13-11-003 ALJ/KD1/ar9/jt2/lil PROPOSED DECISION (Rev. 12)
CPUC CPUC
Adopted Total
NON-ESCALATED
1. Production
2. Steam 9,362 9,362
3. Nuclear 73,695 73,695
4. Hydro 52,850 52,850
5. Other 116,944 116,944
6. Subtotal - Production 252,851 252,851
7. Transmission 91,389 91,389
8. Distribution 514,784 514,784
9. Customer Accounts 168,208 168,208
10. Uncollectibles (Account 904) 12,276 131 (1) (79) 12,327
11. Customer Service and Informational and Sales 37,948 37,948
12. Administrative and General 759,140 759,140
13. Franchise Requirements (Account 927) 46,911 584 (2) (303) 47,191
14. TOTAL O&M EXPENSE Constant 2012$ 1,883,506 1,883,837
ESCALATED
15. Production
16. Steam 10,093 10,093
17. Nuclear 77,798 77,798
18. Hydro 55,801 55,801
19. Other 122,598 122,598
20. Subtotal - Production 266,290 266,290
21. Transmission 95,716 95,716
22. Distribution 543,582 543,582
23. Customer Accounts 181,210 181,210
24. Uncollectibles (Account 904) 12,284 131 (1) (79) 12,335
25. Customer Service and Informational and Sales 40,495 40,495
26. Administrative and General 799,092 799,092
27. Franchise Requirements (Account 927) 46,956 584 (2) (303) 47,236
28. TOTAL O&M EXPENSE 2015$ 1,985,625 1,985,956
ESCALATION
29. Production
30. Steam 731 731
31. Nuclear 4,103 4,103
32. Hydro 2,951 2,951
33. Other 5,654 5,654
34. Subtotal - Production 13,439 13,439
35. Transmission 4,327 4,327
36. Distribution 28,798 28,798
37. Customer Accounts 13,002 13,002
38. Uncollectibles (Account 904) 0 8
39. Customer Service and Informational and Sales 2,547 2,547
40. Administrative and General 39,952 39,952
41. Franchise Requirements (Account 927) - 45
42. TOTAL ESCALATION 102,065 102,119
Category: Total O&M Expenses
Appendix C
Southern California Edison
Test Year 2015 General Rate Case
Operation And Maintenance Expenses
($000)
Line
No. Description
Legacy
Meters
Mohave
Credit
Rate Base
Adjustment
- 15 -

A.13-11-003 ALJ/KD1/ar9/jt2/lil PROPOSED DECISION (Rev. 12)
CPUC
Adopted
NON-ESCALATED
1. Production
2. Steam 9,255
3. Nuclear 173
4. Hydro 28,506
5. Other 54,273
6. Subtotal - Production 92,207
7. Transmission 41,878
8. Distribution 263,503
9. Customer Accounts 106,957
10. Uncollectibles (Account 904) 0
11. Customer Service and Informational and Sales 24,849
12. Administrative and General 303,677
13. Franchise Requirements (Account 927) 0
14. TOTAL O&M EXPENSE Constant 2012$ 833,071
ESCALATED
15. Production
16. Steam 9,982
17. Nuclear 187
18. Hydro 30,745
19. Other 58,536
20. Subtotal - Production 99,450
21. Transmission 45,274
22. Distribution 284,201
23. Customer Accounts 115,358
24. Uncollectibles (Account 904) -
25. Customer Service and Informational and Sales 26,801
26. Administrative and General 327,966
27. Franchise Requirements (Account 927) -
28. TOTAL O&M EXPENSE 2015$ 899,050
ESCALATION
29. Production
30. Steam 727
31. Nuclear 14
32. Hydro 2,239
33. Other 4,263
34. Subtotal - Production 7,243
35. Transmission 3,396
36. Distribution 20,698
37. Customer Accounts 8,401
38. Uncollectibles (Account 904) -
39. Customer Service and Informational and Sales 1,952
40. Administrative and General 24,289
41. Franchise Requirements (Account 927) -
42. TOTAL ESCALATION 65,978
Line
No. Description
Appendix C
Southern California Edison
Test Year 2015 General Rate Case
Operation And Maintenance Labor Expenses
($000)
Category: Total O&M Expenses
- 16 -

A.13-11-003 ALJ/KD1/ar9/jt2/lil PROPOSED DECISION (Rev. 12)
- 17 -

A.13-11-003 ALJ/KD1/ar9/jt2/lil PROPOSED DECISION (Rev. 12)
CPUC
Adopted
NON-ESCALATED
1. Production
2. Steam 107
3. Nuclear 73,522
4. Hydro 24,344
5. Other 35,736
6. Subtotal - Production 133,709
7. Transmission 41,382
8. Distribution 249,354
9. Customer Accounts 60,424
10. Uncollectibles (Account 904) -
11. Customer Service and Informational and Sales 13,099
12. Administrative and General 292,693
13. Franchise Requirements (Account 927) -
14. TOTAL O&M EXPENSE Constant 2012$ 790,661
ESCALATED
15. Production
16. Steam 111
17. Nuclear 77,611
18. Hydro 25,056
19. Other 37,127
20. Subtotal - Production 139,905
21. Transmission 42,314
22. Distribution 257,455
23. Customer Accounts 65,024
24. Uncollectibles (Account 904) -
25. Customer Service and Informational and Sales 13,694
26. Administrative and General 308,356
27. Franchise Requirements (Account 927) -
28. TOTAL O&M EXPENSE 2015$ 826,748
ESCALATION
29. Production
30. Steam 4
31. Nuclear 4,089
32. Hydro 712
33. Other 1,391
34. Subtotal - Production 6,196
35. Transmission 932
36. Distribution 8,101
37. Customer Accounts 4,600
38. Uncollectibles (Account 904) -
39. Customer Service and Informational and Sales 595
40. Administrative and General 15,663
41. Franchise Requirements (Account 927) -
42. TOTAL ESCALATION 36,086
Line
No. Description
Appendix C
Southern California Edison
Test Year 2015 General Rate Case
Operation And Maintenance Non Labor Expenses
($000)
Category: Total O&M Expenses
- 18 -
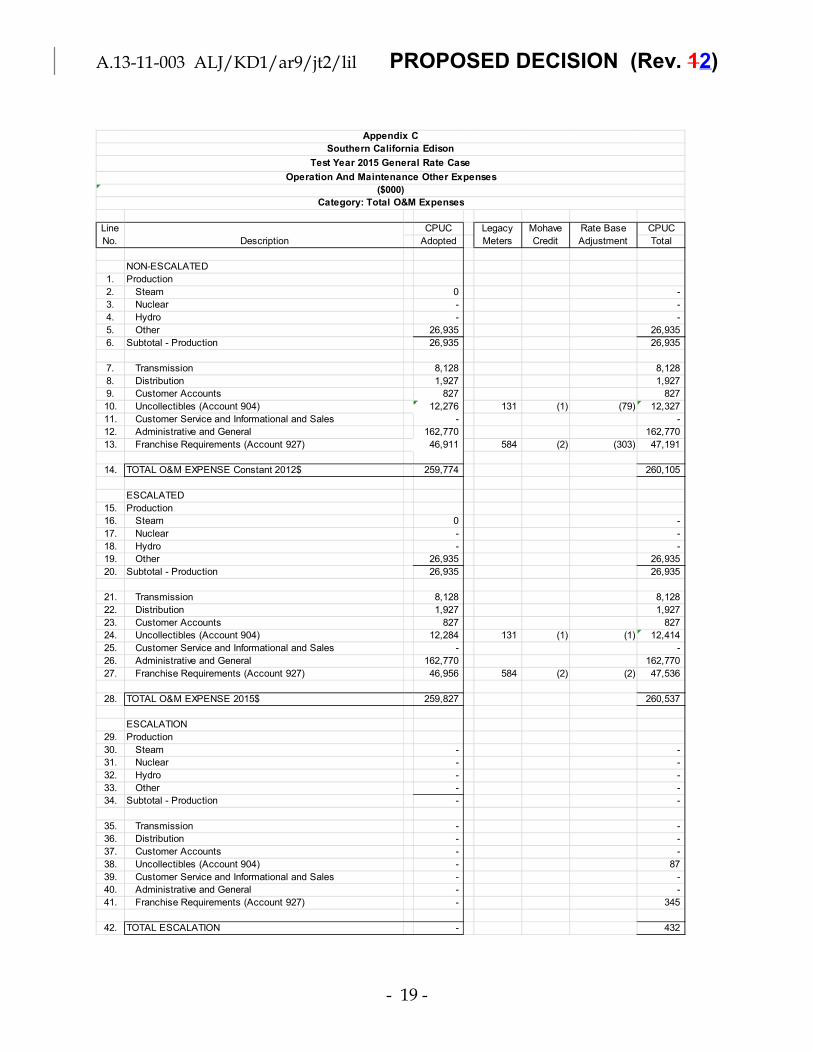
A.13-11-003 ALJ/KD1/ar9/jt2/lil PROPOSED DECISION (Rev. 12)
CPUC CPUC
Adopted Total
NON-ESCALATED
1. Production
2. Steam 0 -
3. Nuclear - -
4. Hydro - -
5. Other 26,935 26,935
6. Subtotal - Production 26,935 26,935
7. Transmission 8,128 8,128
8. Distribution 1,927 1,927
9. Customer Accounts 827 827
10. Uncollectibles (Account 904) 12,276 131 (1) (79) 12,327
11. Customer Service and Informational and Sales - -
12. Administrative and General 162,770 162,770
13. Franchise Requirements (Account 927) 46,911 584 (2) (303) 47,191
14. TOTAL O&M EXPENSE Constant 2012$ 259,774 260,105
ESCALATED
15. Production
16. Steam 0 -
17. Nuclear - -
18. Hydro - -
19. Other 26,935 26,935
20. Subtotal - Production 26,935 26,935
21. Transmission 8,128 8,128
22. Distribution 1,927 1,927
23. Customer Accounts 827 827
24. Uncollectibles (Account 904) 12,284 131 (1) (1) 12,414
25. Customer Service and Informational and Sales - -
26. Administrative and General 162,770 162,770
27. Franchise Requirements (Account 927) 46,956 584 (2) (2) 47,536
28. TOTAL O&M EXPENSE 2015$ 259,827 260,537
ESCALATION
29. Production
30. Steam - -
31. Nuclear - -
32. Hydro - -
33. Other - -
34. Subtotal - Production - -
35. Transmission - -
36. Distribution - -
37. Customer Accounts - -
38. Uncollectibles (Account 904) - 87
39. Customer Service and Informational and Sales - -
40. Administrative and General - -
41. Franchise Requirements (Account 927) - 345
42. TOTAL ESCALATION - 432
Category: Total O&M Expenses
Appendix C
Southern California Edison
Test Year 2015 General Rate Case
Operation And Maintenance Other Expenses
($000)
Line
No. Description
Legacy
Meters
Mohave
Credit
Rate Base
Adjustment
- 19 -
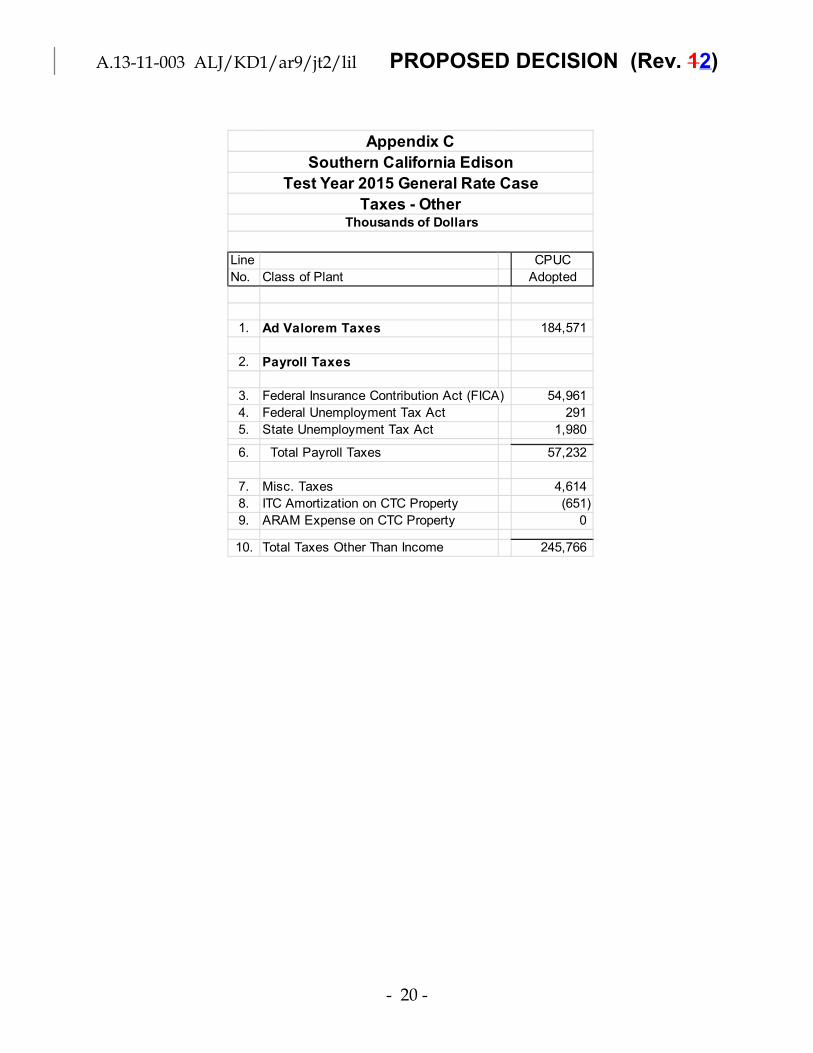
A.13-11-003 ALJ/KD1/ar9/jt2/lil PROPOSED DECISION (Rev. 12)
Line CPUC
No. Class of Plant Adopted
1. Ad Valorem Taxes 184,571
2. Payroll Taxes
3. Federal Insurance Contribution Act (FICA) 54,961
4. Federal Unemployment Tax Act 291
5. State Unemployment Tax Act 1,980
6. Total Payroll Taxes 57,232
7. Misc. Taxes 4,614
8. ITC Amortization on CTC Property (651)
9. ARAM Expense on CTC Property 0
10. Total Taxes Other Than Income 245,766
Appendix C
Southern California Edison
Test Year 2015 General Rate Case
Taxes - OtherThousands of Dollars
- 20 -
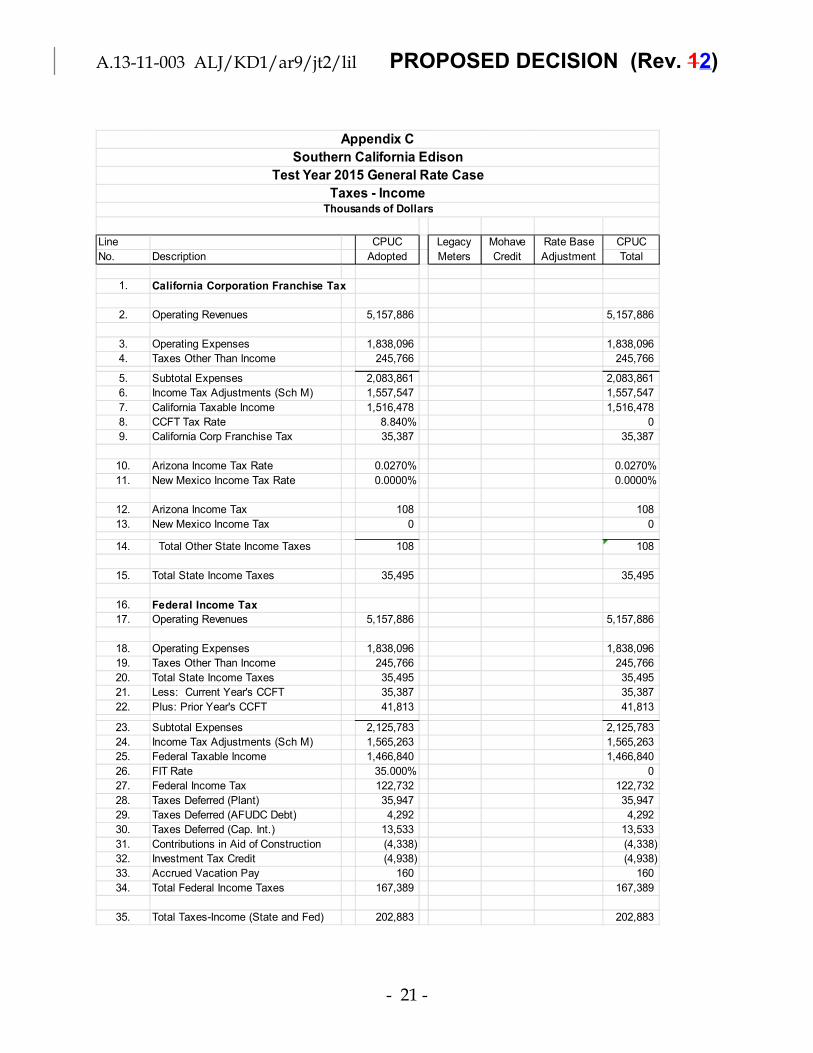
A.13-11-003 ALJ/KD1/ar9/jt2/lil PROPOSED DECISION (Rev. 12)
Line CPUC CPUC
No. Description Adopted Total
1. California Corporation Franchise Tax
2. Operating Revenues 5,157,886 5,157,886
3. Operating Expenses 1,838,096 1,838,096
4. Taxes Other Than Income 245,766 245,766
5. Subtotal Expenses 2,083,861 2,083,861
6. Income Tax Adjustments (Sch M) 1,557,547 1,557,547
7. California Taxable Income 1,516,478 1,516,478
8. CCFT Tax Rate 8.840% 0
9. California Corp Franchise Tax 35,387 35,387
10. Arizona Income Tax Rate 0.0270% 0.0270%
11. New Mexico Income Tax Rate 0.0000% 0.0000%
12. Arizona Income Tax 108 108
13. New Mexico Income Tax 0 0
14. Total Other State Income Taxes 108 108
15. Total State Income Taxes 35,495 35,495
16. Federal Income Tax
17. Operating Revenues 5,157,886 5,157,886
18. Operating Expenses 1,838,096 1,838,096
19. Taxes Other Than Income 245,766 245,766
20. Total State Income Taxes 35,495 35,495
21. Less: Current Year's CCFT 35,387 35,387
22. Plus: Prior Year's CCFT 41,813 41,813
23. Subtotal Expenses 2,125,783 2,125,783
24. Income Tax Adjustments (Sch M) 1,565,263 1,565,263
25. Federal Taxable Income 1,466,840 1,466,840
26. FIT Rate 35.000% 0
27. Federal Income Tax 122,732 122,732
28. Taxes Deferred (Plant) 35,947 35,947
29. Taxes Deferred (AFUDC Debt) 4,292 4,292
30. Taxes Deferred (Cap. Int.) 13,533 13,533
31. Contributions in Aid of Construction (4,338) (4,338)
32. Investment Tax Credit (4,938) (4,938)
33. Accrued Vacation Pay 160 160
34. Total Federal Income Taxes 167,389 167,389
35. Total Taxes-Income (State and Fed) 202,883 202,883
Legacy
Meters
Mohave
Credit
Rate Base
Adjustment
Appendix C
Southern California Edison
Test Year 2015 General Rate Case
Taxes - IncomeThousands of Dollars
- 21 -

A.13-11-003 ALJ/KD1/ar9/jt2/lil PROPOSED DECISION (Rev. 12)
Line CPUC CPUC
No. Class of Plant Adopted Total
1 DEPRECIATION
2 Generation
3 Nuclear
4 San Onofre 0 0
5 Palo Verde 12,269 12,2696 Other Production 29,963 29,963
7 Coal 25,829 25,829
8 Hydro 32,848 32,848
9 Mountainview 20,172 20,172
10 Total Generation 121,081 121,081
11 Transmission
12 Land 921 921
13 Substations 58,640 58,640
14 Lines 38,185 38,185
15 Total Transmission 97,746 97,746
16 Distribution
17 Land 1,137 65 1,202
18 Substations 82,888 4,923 87,811
19 Lines 672,833 44,112 716,945
20 Total Distribution 756,858 805,958
21 General 228,680 228,680
22 TOTAL DEPRECIATION 1,204,365 1,253,465
23 AMORTIZATION
24 Radio Frequency 440 440
25 Hydro Relicensing 3,773 3,773
26 Miscellaneous Intangibles 24 24
27 Capitalized Software 274,587 274,587
28 TOTAL AMORTIZATION 278,824 278,824
29 TOTAL DEPRECIATION
AND AMORTIZATION 1,483,189 1,532,289
Legacy
Meters
Mohave
Credit
Appendix C
Southern California Edison
Test Year 2015 General Rate Case
Depreciation and Amortization ExpenseThousands of Dollars
- 22 -

A.13-11-003 ALJ/KD1/ar9/jt2/lil PROPOSED DECISION (Rev. 12)
Line CPUC CPUC
No. Item Adopted Total
1 FIXED CAPITAL
2 Plant in Service 30,896,213 30,896,213
3 Capitalized Software 1,556,235 1,556,235
4 Other Intangibles 168,512 168,512
5 Subtotal Plant in Service 32,620,960 32,620,960
6 ADJUSTMENTS
7 Customer Advances for Construction (62,142) (62,142)
8 Customer Deposits (180,269) (180,269)
9 Total Adjustments (242,411) (242,411)
10 WORKING CAPITAL
11 Materials & Supplies 110,026 110,026
12 Mountainview Emission Credits 6,901 6,901
13 Working Cash 172,003 172,003
14 Total Working Capital 288,930 288,930
15 DEDUCTIONS FOR RESERVES
16 Accumulated Depreciation Reserve (10,591,518) (10,591,518)
17 Accumulated Amortization (918,847) (918,847)
18 Accum. Def. Taxes - Plant (3,513,108) (3,513,108)
19 Accum. Def. Taxes - Capitalized Interest (127,439) (127,439)
20 Accum. Def. Taxes - CIAC 85,872 85,872
21 Accum. Def. Taxes - Vacation Accrual 24,604 24,604
22 Unfunded Pension Reserve (74,696) (74,696)
23 Total Deductions for Reserves (15,115,132) (15,115,132)
24 RATE BASE 17,552,347 147,280 1,837 (323,662) 17,375,965
25 DEPR'N & AMORT EXPENSE 1,483,189 1,532,289
Legacy
Meters
Mohave
Credit
Rate Base
Adjustment
Appendix C
Southern California Edison
Test Year 2015 General Rate Case
Summary of Electric Rate BaseThousands of Dollars
- 23 -

A.13-11-003 ALJ/KD1/ar9/jt2/lil PROPOSED DECISION (Rev. 12)
Line CPUC
No. Class of Plant Adopted
1. PLANT
2. Generation
3. Nuclear
4. San Onofre -
5. Palo Verde 1,915,572
6. Other Production 879,347
7. Coal -
8. Mountainview 726,957
9. Hydro 1,221,288
10. Total Generation 4,743,164
11. Transmission
12. Land 106,665
13. Substations 2,213,192
14. Lines 1,429,860
15. Total Transmission 3,749,717
16. Distribution
17. Land 117,930
18. Substations 2,661,420
19. Lines 16,956,537
20. Total Distribution 19,735,887
21. General 2,667,444
22. TOTAL PLANT 30,896,212
INTANGIBLE PLANT
23. Radio Frequency 17,615
24. Hydro Relicensing 150,417
25. Miscellaneous Intangibles 481
26. Capitalized Software 1,556,235
27. TOTAL INTANGIBLE PLANT 1,724,748
28. TOTAL PLANT IN SERVICE 32,620,960
Appendix C
Southern California Edison
Test Year 2015 General Rate Case
Total Weighted Average PlantThousands of Dollars
- 24 -
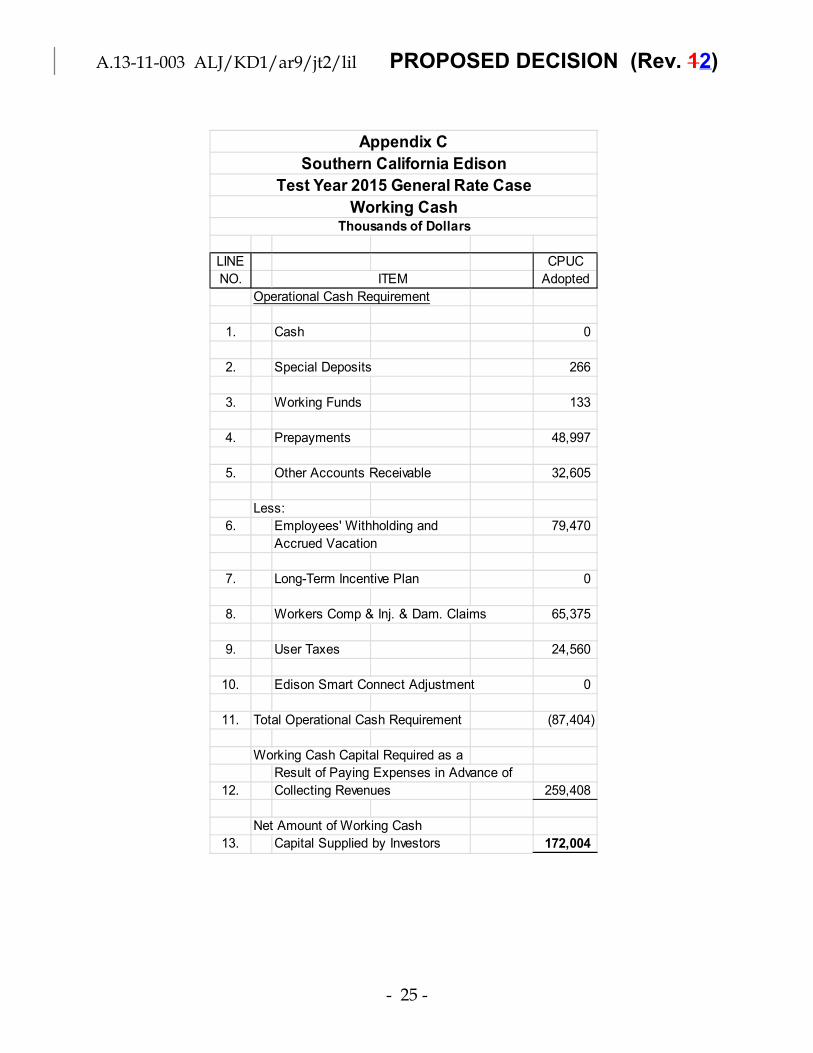
A.13-11-003 ALJ/KD1/ar9/jt2/lil PROPOSED DECISION (Rev. 12)
LINE CPUC
NO. ITEM Adopted
Operational Cash Requirement
1. Cash 0
2. Special Deposits 266
3. Working Funds 133
4. Prepayments 48,997
5. Other Accounts Receivable 32,605
Less:
6. Employees' Withholding and 79,470
Accrued Vacation
7. Long-Term Incentive Plan 0
8. Workers Comp & Inj. & Dam. Claims 65,375
9. User Taxes 24,560
10. Edison Smart Connect Adjustment 0
11. Total Operational Cash Requirement (87,404)
Working Cash Capital Required as a
Result of Paying Expenses in Advance of
12. Collecting Revenues 259,408
Net Amount of Working Cash
13. Capital Supplied by Investors 172,004
Appendix C
Southern California Edison
Test Year 2015 General Rate Case
Working CashThousands of Dollars
- 25 -

A.13-11-003 ALJ/KD1/ar9/jt2/lil PROPOSED DECISION (Rev. 12)
AVERAGE
LINE NO. OF DOLLAR-DAYS
NO. Description Expenses DAYS LAG LAG
1. Fuel 324,207 35.36 11,465,445
2. Purchase Power QF USPS 1,614,193 52.26 84,359,639
3. Purchase Power QF EFT 908,540 44.38 40,318,002
4. Purchase Power Non-QF 2,749,593 23.04 63,362,999
5. Subtotal (Lines 1-4) 5,596,533 35.65 199,506,086
Transmission -Distribution - Customer Accounts -
Customer Service & Information - Admin. & Gen.
6. Company Labor 964,990 11.65 11,242,136
7. Company Labor - Results Sharing 94,253 257.55 24,274,887
8. Other O&M 689,822 43.79 30,208,964
9. Goods & Services 751,797 45.19 33,973,723
10. Materials Issued from Stores 19,580 0.00 0
11. Insurance Provisions 18,973 0.00 0
12. Injuries & Damages Provisions 116,776 0.00 0
13. Funded Pension Provisions 88,326 (15.91) (1,405,064)
14. Benefits & Unfunded Pension Provisions 64,335 3.19 205,118
15. P.B.O.P Provisions 44,573 110.73 4,935,568
16. Franchise Requirements 106,885 262.84 28,093,628
17. Uncollectibles 29,898 0.00 0
18. CPUC Reimbursement Fees 0 0.00 0
19. Sub-Total (Lines 6 - 18) 2,990,208 43.99 131,528,960
20. Depreciation 1,705,444 0.00 0
21. Decommissioning 22,726 24.00 545,432
22. Taxes - Other Than Income 305,149 33.14 10,111,692
23. Taxes - Based on Income 387,336 64.65 25,040,928
24. Mountainview - O&M 0 0.00 0
25. Mountainview - Depreciation 0 0.00 0
26. Mountainview - Taxes 0 0.00 0
0 0.00 0
27. Total Operating Expenses 11,007,396 33.32 366,733,099
28. Average Days Lag in Collection of Revenues 42.46
29. Average Days Lag in Payment of Expenses 33.32
30. Excess Revenue Lag 9.14
31. Average Daily Expense 30,157
32. Working Cash 275,729
Appendix C
Southern California Edison
Test Year 2015 General Rate CaseDevelopment of Average Lag In Payment Of Operating Expenses
(Thousands of Dollars)
- 26 -
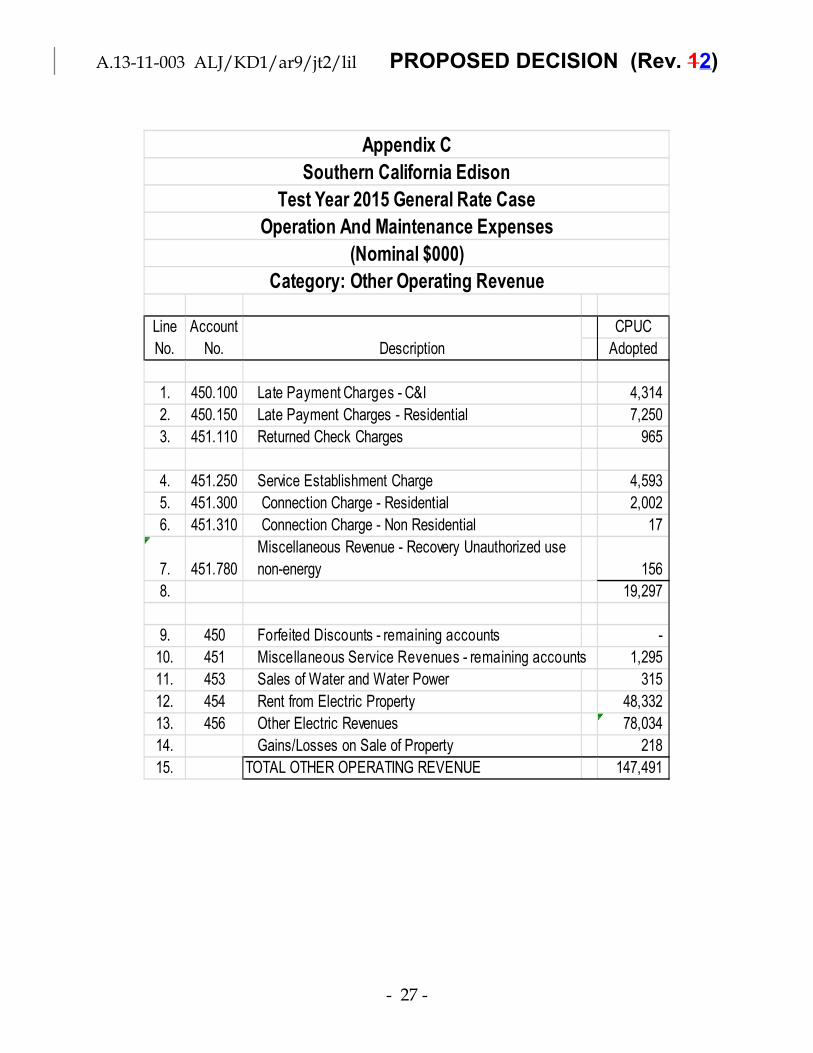
A.13-11-003 ALJ/KD1/ar9/jt2/lil PROPOSED DECISION (Rev. 12)
CPUC
Adopted
1. 450.100 Late Payment Charges - C&I 4,314
2. 450.150 Late Payment Charges - Residential 7,250
3. 451.110 Returned Check Charges 965
4. 451.250 Service Establishment Charge 4,593
5. 451.300 Connection Charge - Residential 2,002
6. 451.310 Connection Charge - Non Residential 17
7. 451.780
Miscellaneous Revenue - Recovery Unauthorized use
non-energy 156
8. 19,297
9. 450 Forfeited Discounts - remaining accounts -
10. 451 Miscellaneous Service Revenues - remaining accounts 1,295
11. 453 Sales of Water and Water Power 315
12. 454 Rent from Electric Property 48,332
13. 456 Other Electric Revenues 78,034
14. Gains/Losses on Sale of Property 218
15. TOTAL OTHER OPERATING REVENUE 147,491
Line
No.
Account
No. Description
Appendix C
Southern California Edison
Test Year 2015 General Rate Case
Operation And Maintenance Expenses
(Nominal $000)
Category: Other Operating Revenue
- 27 -

A.13-11-003 ALJ/KD1/ar9/jt2/lil PROPOSED DECISION (Rev. 12)
Line CPUC
No. Description Adopted
1. Revenues 1.00000
2. Uncollectibles Tax Rate 0.00238
3. Uncollectibles Amount Applied 1.00000 ________
4. Uncollectibles Juris. 0.002385. Subtotal 0.99762
6. Franchise Fees Tax Rate 0.009107. Franchise Fees Amount Applied 1.00000 ________8. Franchise Fees Juris. 0.009109. Subtotal 0.98853
10. Arizona/New Mexico Income Tax Rates 0.0002711. Other State I.T. Amount Applied 0.98853 ________12. Other State I.T. Juris. 0.0002713. Subtotal 0.98826
14. S. I. T. Rate 0.0884015. S. I. T. Amount Applied 0.98853 ________16. S. I. T. Juris. 0.0873917. Subtotal 0.90087
18. Federal Income Tax 0.35000
19. Federal Income Tax Amount Applied 0.98826 ________20. Federal Income Tax Juris. 0.34589
21. Net Operating Revenues 0.55498
22. Uncollectible and Franchise Fees Factor 1.01161
23. State & Federal CompositeTax Factor 1.67567
24. N-T-G MULTIPLIER 1.8019
Appendix C
Southern California Edison
Test Year 2015 General Rate Case
Net-To-Gross Multiplier
- 28 -

A.13-11-003 ALJ/KD1/ar9/jt2/lil PROPOSED DECISION (Rev. 12)
Line
No. Item Total FERC CPUC-GRC FERC % CPUC-GRC % Total %
1. TOTAL OPERATING REVENUES 6,186,510 997,633 5,188,877 16.13% 83.87% 100.00%
2. OPERATING EXPENSES:
3. Production
4. Steam 9,362 - 9,362 0.00% 100.00% 100.00%
5. Nuclear 73,695 - 73,695 0.00% 100.00% 100.00%
6. Hydro 52,850 - 52,850 0.00% 100.00% 100.00%
7. Other 116,944 - 116,944 0.00% 100.00% 100.00%
8. Subtotal Production 252,851 - 252,851 0.00% 100.00% 100.00%
9. Transmission 172,600 81,211 91,389 47.05% 52.95% 100.00%
10. Distribution 519,191 4,407 514,783 0.85% 99.15% 100.00%
11. Customer Accounts 168,209 - 168,209 0.00% 100.00% 100.00%
12. Uncollectibles 14,701 2,374 12,327 16.15% 83.85% 100.00%
13. Customer Service & Information 37,948 - 37,948 0.00% 100.00% 100.00%
14. Administrative & General 806,902 47,762 759,139 5.92% 94.08% 100.00%
15. Franchise Requirements 56,264 9,073 47,191 16.13% 83.87% 100.00%
16. Revenue Credits (193,280) (45,789) (147,491) 23.69% 76.31% 100.00%
17. Subtotal 1,835,386 99,040 1,736,346 5.40% 94.60% 100.00%
18. Escalation 108,344 6,281 102,063 5.80% 94.20% 100.00%
19. Depreciation 1,754,544 222,253 1,532,291 12.67% 87.33% 100.00%
20. Taxes Other Than On Income - Property 239,412 54,841 184,571 22.91% 77.09% 100.00%
21. Taxes Other Than On Income - Payroll 65,045 3,850 61,195 5.92% 94.08% 100.00%
22. Taxes Based On Income 401,337 199,361 201,976 49.67% 50.33% 100.00%
23. Total Taxes 705,794 258,052 447,742 36.56% 63.44% 100.00%
24. TOTAL OPERATING EXPENSES 4,404,068 585,626 3,818,442 13.30% 86.70% 100.00%
25. NET OPERATING REVENUE 1,782,442 412,006 1,370,435 23.11% 76.89% 100.00%
26. RATE BASE 22,591,238 5,215,273 17,375,965 23.09% 76.91% 100.00%
27. RATE OF RETURN 7.89% 7.90% 7.89%
Estimated 2015 % for 2015
Appendix C
Southern California Edison
Test Year 2015 General Rate Case
Jurisdictional Allocation
(Thousands of Dollars)
(End of Appendix C)
- 29 -

A.13-11-003 ALJ/KD1/ar9/jt2/lil ROPOSED DECISION (Rev.12)
APPENDIX D2016 AND 2017 RESULTS
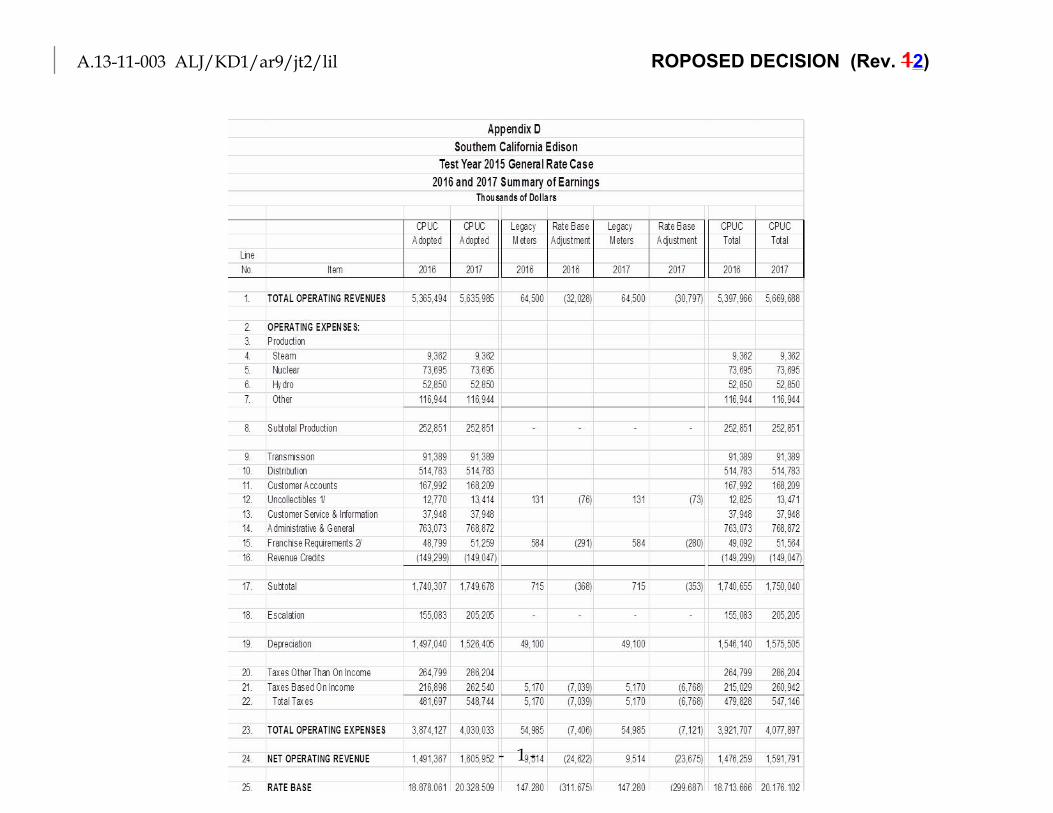
A.13-11-003 ALJ/KD1/ar9/jt2/lil ROPOSED DECISION (Rev. 12)
- 1 -

A.13-11-003 ALJ/KD1/ar9/jt2/lil ROPOSED DECISION (Rev. 12)
(End of Appendix D)
- 2 -

Document comparison by Workshare Compare on Wednesday, November 04,2015 8:21:28 AM
Input:
Document 1 IDfile://d:\lil\Desktop\Dudney Agenda Dec Reivision 1Decision on Test Year 2015 General Rate Case forSCE.docx
DescriptionDudney Agenda Dec Reivision 1 Decision on Test Year2015 General Rate Case for SCE
Document 2 IDfile://d:\lil\Desktop\Final Dudney Agneda Dec.Rev. 2Decision on Test Year 2015 General Rate Case forSCE.docx
DescriptionFinal Dudney Agneda Dec.Rev. 2 Decision on Test Year2015 General Rate Case for SCE
Rendering set Standard
Legend:
Insertion
Deletion
Moved from
Moved to
Style change
Format change
Moved deletion
Inserted cell
Deleted cell
Moved cell
Split/Merged cell
Padding cell
Statistics:
Count
Insertions 17
Deletions 17
Moved from 0
Moved to 0
Style change 0
Format changed 0
Total changes 34


![ALJ/MLC/tcgdocs.cpuc.ca.gov/.../Published/G000/M267/K962/267962193.docx · Web viewC.1710013 ALJ/MOD PODUNC/jt2 DRAFT (Rev. 1) ^ ^/^/jt2 PROPOSED DECISION [^] Internal Review Draft;](https://static.fdocuments.us/doc/165x107/5c75c95109d3f25d028b699c/aljmlc-web-viewc1710013-aljmod-poduncjt2-draft-rev-1-jt2-proposed.jpg)


