DECEMBER | 2008 - denizyatirim.com · TURKEY STRATEGY – A YEAR FOR OPTIMISTS FEBRUARY 7, 2019...
35
Deniz Yatirim Menkul Kıymetler A.S. You may find our research on Bloomberg page; DENI TURKEY | STRATEGY FEBRUARY 7, 2019 Selim Kunter +90 212 348 9078 [email protected] Orkun Godek +90 212 348 5160 [email protected] MSCI Turkey vs MSCI EM 12m fwd. P/E -60% -30% 0% 30% 60% 90% 0 3 6 9 12 15 2009 2011 2013 2015 2017 2019 MSCI Turkey 10-year avg. P/E Discount to MSCI EM 10-year average discount Source: Deniz Invest Research BIST 100 performance Close 12m min 12m max ADT 3m, TRY mln BIST 100 102,448 87,143 120,845 6,089 BIST 30 128,951 107,372 147,936 5,101 BIST Banks 136,216 93,564 192,443 2,079 BIST Indu. 116,913 101,729 136,264 2,054 Note: Report prices as of February 5, 2019. Source: Bloomberg, Deniz Invest Research Coverage rating composition Recom: # of Recom % of Coverage BUY 27 63% HOLD 15 35% SELL 1 2% Total 43 100% Source: Deniz Invest Research Turkey Strategy A year for optimists The BIST 100 has staged a remarkable rally ytd. After the strong underperformance in 2018 along with the strained relations with the US, dispute over the credibility of CBRT and exchange rate volatility, Turkish equities have staged a remarkable rally recently, the benchmark BIST 100 rising 13% ytd, while MSCI Turkey outperformed MSCI EM index by 8% during this period. Some short term profit taking is likely after the rally; though, valuations are still attractive – our 12m target for BIST-100 is 125,000. At current levels, the upside to our BIST 100 target is above our 21% COE. At 6.9x, Turkey’s 12m fwd. P/E discount to EMs has narrowed from 50% to 40% (vs 20% historical disc.). Though, the story and the long-term charts are still appealing with sizeable upsides in select banks given the favorable inflation trajectory, interest rate outlook and global backdrop for EMs in wake slower than anticipated FED rate hikes, if any, and early sector indicators are signaling for better faster than expected NIM evolution and less than feared NPL formation for banks. Key issues for the year will once again circle around unemployment, economic growth, inflation, CAD evolution and CBRT’s rhetoric. An outlook upgrade during the year will not be surprising. We see further downside in Turkey’s key risk parameters, i.e. CDS and implied TRY volatility, particularly following the elimination of local elections from the picture at the end of March. Swap market already seems to be pricing in a 300 bps cut in policy rate (we expect 500 bps cut by YE). On the political front, improving relations with the US and the EU is another plus for the country. Hence, we will not be surprised to see an upgrade on Turkey’s “negative” outlook within this year by one of the 3 major credit agencies. We remain overweight in banks and focus on growth stories in industrials. We like well- capitalized banks with ample buffers to weather an economic downturn. Among industrials, we prefer names with promising growth stories or strong operating leverage amid lira weakness. Look out for high-dividend stocks as they may outperform the market this dividend season. In that sense, we make 3 additions to our Model Portfolio, including TSKB, Ford Otosan and Migros, while removing Isbank and Arcelik on profit taking and Aksa Enerji as increasing WC need has been pressuring stock performance. We keep Yapi Kredi Bank, Vakifbank, Pegasus Airlines, Sabanci Holding, Tekfen Holding, and Turk Telekom, within our top-picks list. Deniz Invest model portfolio TP, TRY/shr Upside Rec Mcap, TRY mln ADT 3m, TRY mln YKBNK 2.45 25% BUY 16,641 158 VAKBN 6.20 31% BUY 11,800 9 TTKOM 6.00 18% HOLD 17,780 196 SAHOL 11.50 23% BUY 19,078 71 TKFEN 29.70 22% BUY 10,989 32 PGSUS 37.50 27% BUY 3,020 45 TSKB 1.05 22% BUY 2,408 29 FROTO 80.00 39% BUY 20,265 20 MGROS 23.20 36% BUY 3,091 23 Source: Deniz Invest Research
Transcript of DECEMBER | 2008 - denizyatirim.com · TURKEY STRATEGY – A YEAR FOR OPTIMISTS FEBRUARY 7, 2019...

Deniz Yatirim Menkul Kıymetler A.S.
You may find our research on Bloomberg page; DENI
TURKEY | STRATEGY
FEBRUARY 7, 2019
Selim Kunter +90 212 348 9078
Orkun Godek +90 212 348 5160
MSCI Turkey vs MSCI EM 12m fwd. P/E
-60%
-30%
0%
30%
60%
90%
0
3
6
9
12
15
2009 2011 2013 2015 2017 2019
MSCI Turkey 10-year avg. P/E
Discount to MSCI EM 10-year average discount Source: Deniz Invest Research
BIST 100 performance
Close 12m min 12m max
ADT 3m,
TRY mln
BIST 100 102,448 87,143 120,845 6,089
BIST 30 128,951 107,372 147,936 5,101
BIST Banks 136,216 93,564 192,443 2,079
BIST Indu. 116,913 101,729 136,264 2,054 Note: Report prices as of February 5, 2019.
Source: Bloomberg, Deniz Invest Research
Coverage rating composition
Recom: # of Recom % of Coverage
BUY 27 63%
HOLD 15 35%
SELL 1 2%
Total 43 100% Source: Deniz Invest Research
Turkey Strategy A year for optimists
The BIST 100 has staged a remarkable rally ytd. After the strong underperformance
in 2018 along with the strained relations with the US, dispute over the credibility of
CBRT and exchange rate volatility, Turkish equities have staged a remarkable rally
recently, the benchmark BIST 100 rising 13% ytd, while MSCI Turkey outperformed
MSCI EM index by 8% during this period.
Some short term profit taking is likely after the rally; though, valuations are still
attractive – our 12m target for BIST-100 is 125,000. At current levels, the upside to
our BIST 100 target is above our 21% COE. At 6.9x, Turkey’s 12m fwd. P/E discount to
EMs has narrowed from 50% to 40% (vs 20% historical disc.). Though, the story and
the long-term charts are still appealing with sizeable upsides in select banks given
the favorable inflation trajectory, interest rate outlook and global backdrop for EMs
in wake slower than anticipated FED rate hikes, if any, and early sector indicators are
signaling for better faster than expected NIM evolution and less than feared NPL
formation for banks. Key issues for the year will once again circle around
unemployment, economic growth, inflation, CAD evolution and CBRT’s rhetoric.
An outlook upgrade during the year will not be surprising. We see further downside
in Turkey’s key risk parameters, i.e. CDS and implied TRY volatility, particularly
following the elimination of local elections from the picture at the end of March.
Swap market already seems to be pricing in a 300 bps cut in policy rate (we expect
500 bps cut by YE). On the political front, improving relations with the US and the EU
is another plus for the country. Hence, we will not be surprised to see an upgrade on
Turkey’s “negative” outlook within this year by one of the 3 major credit agencies.
We remain overweight in banks and focus on growth stories in industrials. We like well-
capitalized banks with ample buffers to weather an economic downturn. Among
industrials, we prefer names with promising growth stories or strong operating leverage
amid lira weakness. Look out for high-dividend stocks as they may outperform the market
this dividend season. In that sense, we make 3 additions to our Model Portfolio, including
TSKB, Ford Otosan and Migros, while removing Isbank and Arcelik on profit taking and
Aksa Enerji as increasing WC need has been pressuring stock performance. We keep Yapi
Kredi Bank, Vakifbank, Pegasus Airlines, Sabanci Holding, Tekfen Holding, and Turk
Telekom, within our top-picks list.
Deniz Invest model portfolio
TP,
TRY/shr Upside Rec
Mcap,
TRY mln
ADT 3m,
TRY mln
YKBNK 2.45 25% BUY 16,641 158
VAKBN 6.20 31% BUY 11,800 9
TTKOM 6.00 18% HOLD 17,780 196
SAHOL 11.50 23% BUY 19,078 71
TKFEN 29.70 22% BUY 10,989 32
PGSUS 37.50 27% BUY 3,020 45
TSKB 1.05 22% BUY 2,408 29
FROTO 80.00 39% BUY 20,265 20
MGROS 23.20 36% BUY 3,091 23 Source: Deniz Invest Research

FEBRUARY 7, 2019 TURKEY STRATEGY – A YEAR FOR OPTIMISTS
2 DENIZ INVEST RESEARCH
Contents
Strategy and Model Portfolio ................................................................................................................... 3
Top-picks ................................................................................................................................................... 5
Global backdrop....................................................................................................................................... 7
US economy .............................................................................................................................................. 8
Euro zone .................................................................................................................................................. 9
EUR/USD .................................................................................................................................................... 9
China ....................................................................................................................................................... 10
2019 outlook for Turkey… ...................................................................................................................... 11
Key risk parameters ................................................................................................................................. 12
Economic growth outlook ....................................................................................................................... 13
TRY........................................................................................................................................................... 14
Interest rates ........................................................................................................................................... 15
Inflation ................................................................................................................................................... 17
Monetary policy ...................................................................................................................................... 17
Current account balance ......................................................................................................................... 18
Credit rating ............................................................................................................................................ 19
Valuations .............................................................................................................................................. 20
Revısıons to macro forecasts and cost of equıty ..................................................................................... 20
Ebıtda and earnıngs growth .................................................................................................................... 20
Key performance and valuatıon metrıcs for BIST .................................................................................... 23
Dividend plays ....................................................................................................................................... 27
Deniz Invest coverage universe .............................................................................................................. 28
Target price and forecast revisions ........................................................................................................ 30
Appendix – 1: Termination of coverage ........................................................................................................ 32
Appendix 2: Calendar of global macro events............................................................................................... 33

TURKEY STRATEGY – A YEAR FOR OPTIMISTS FEBRUARY 7, 2019
DENIZ INVEST RESEARCH 3
Strategy and Model Portfolio
After the strong underperformance in 2018 along with the strained relations with the US, dispute over
the credibility of CBRT and exchange rate volatility, Turkish equities have staged a remarkable rally
recently, the benchmark BIST 100 rising 17% from its lowest level of 87,300 at the beginning of the
year. In dollar terms, the index is up 18% from its lows (40% above lowest dollar based 2018 level seen
in September). However, we think the upside in the market has not been depleted and while we would
not be surprised to see some profit taking after the recent rally, which might be in the form of shift
from banks to laggard industrials, in the absence of a major edge up in interest rates and/or capital
outflow from EMs, a retreat below index levels of 94,000-96,000 should not be awaited. Below are our
arguments:
█ Supportive global backdrop with rate hike expectations for FED and ECB are waning.
█ The CBRT successfully shrugged off jitters over its independence by keeping its tight stance and taking
series of actions to cope with the currency volatility.
█ Turkish banks still trade at discounted levels on a long-term performance basis relative to EM peers,
despite the substantial recovery in their P/E discounts relative to EM peers. We see no near-term upside
potential for interest rates, a main catalyst for banking stocks. On the contrary, easing inflationary
pressures and the stabilization of the Lira, as well as the potential pressure on the US yields are likely to
keep local rates at least at current levels.
█ A further reduction in the earnings yield-to-benchmark bond yield spread is still likely to an extent,
while upside potential for banking stocks based on expected ROE versus P/BV is still at double-digit
levels for certain banks. Note that our talks with banking sector officials indicate that there is
meaningful upside to bank earnings as the early signals suggest a faster than previously anticipated NIM
recovery and less than feared NPL formation for the year.
█ Industrial stocks have lagged banks lately. Nonetheless, despite the recent rally, industrials’ P/E figures
have fallen below both their own historical average P/E and the average historical discount relative to
the P/E figures of EM peers.
█ The 23% upside potential to our bottom-up index target of 125,000 is above our COE (21%), supporting
risk/reward profile.
█ Domestic political uncertainty might subside following the local elections at the end of March, while Turkey’s
relations with the US and EU have improved, which is positive for mid-to-long term external trade figures.
Both of these factors are positive for the country’s future risk premiums. However, the performance of
Turkish equities has mainly been a function of the dollar trade and interest rates in general. We do not think
the current valuations fully reflect the outlook for either.
In our portfolio selection, we slightly overweight banks relative to industrials, taking into account the
relatively cheaper valuation. We would overweight banks that are well capitalized and have healthier
asset quality, tighter cost control and ample buffers to weather any downturn in the economy. Among
industrials, we prefer names with promising growth stories and/or those well positioned operationally for
lira weakness. We also advise to cherry pick among good dividend payers, now that dividend season is
close. The list of our preferred stocks on the next page:

FEBRUARY 7, 2019 TURKEY STRATEGY – A YEAR FOR OPTIMISTS
4 DENIZ INVEST RESEARCH
Model Portfolio
Top-picks
Stock Entry date Target price Upside
Nominal Return
(since inclusion)
BIST 100 relative return
(since inclusion) Portfolio weight
YKBNK 23.01.2018 2.45 25% -28.4% -17.4% 9.7%
VAKBN 23.01.2018 6.20 31% -34.1% -24.0% 7.3%
TTKOM 22.01.2019 6.00 18% 17.3% 14.0% 10.8%
SAHOL 27.09.2018 11.50 23% 24.7% 21.9% 11.4%
TKFEN 28.11.2018 29.70 22% 24.3% 13.9% 10.4%
PGSUS 03.09.2018 37.50 27% 20.4% 10.2% 9.8%
TSKB 22.01.2019 1.05 22% 10%P
FROTO 07.02.2019 80.00 39% 10%P
MGROS 07.02.2019 23.20 36% 10%P
ARCLK 28.11.2018 21.00 8% 28.5% 17.9% 10.8%
ISCTR 27.09.2018 7.30 36% 22.9% 20.2% 11.1%
AKSEN 03.09.2018 4.10 39% -31.3% -37.1% 5.8%
Cash* 11.1% *Estimated cash after transactions
**Entry and exit prices will be the weighted average prices of the specific stocks during the inclusion date
P: Projected
Source: Deniz Invest Research
Model Portfolio return
Nominal Return
2017 47.5%
2018 -11.3%
12m 3.0%
YTD 21.0%
Relative Return vs BIST-100
-0.1%
12.1%
19.7%
7.8% Source: Deniz Invest Research
Model Portfolio performance
95
100
105
110
115
120
125
1.00
1.10
1.20
1.30
1.40
1.50
1.60
1.70
1.80
1.90
Feb-18 Apr-18 Jun-18 Aug-18 Oct-18 Dec-18 Feb-19
Model Portfolio, TRY mln Relative Return vs BIST 100
Source: Deniz Invest Research

TURKEY STRATEGY – A YEAR FOR OPTIMISTS FEBRUARY 7, 2019
DENIZ INVEST RESEARCH 5
Top-picks
█ Vakifbank (VAKBN TI): Vakifbank is our most preferred stock among banks due to its depressed
valuation that does not bode with the stronger profitability of the bank compared to its peers. Being a
state bank Vakifbank has been in an advantageous position in terms of Lira deposits, 22% of which is
composed of deposits of state institutions as of September 2018. Good solvency is expected to enable
the bank to grow faster than the banking sector in 2019. Enhanced exposure to retail segment through
pay-roll accounts is supposed to limit a potential NPL threat in this segment despite the slight surge
expectation in unemployment during the rest of the year. The bank trades at a significant discount at
0.47x P/BV given that we forecast 13.6% RoE in 2019. 3.5x P/E is the lowest in our coverage universe
corresponding to ~30% yield, well above the yield for TR10y.
█ Yapi Kredi Bank (YKBNK TI): We keep Yapi Kredi Bank in our most preferred list on the back of stronger
provisioning ratio compared to peers blended with the expected improvement in profitability thanks to
stronger capitalization over a year ago that is supposed to deliver higher than sector average lending
expansion in 2019. $650 mln AT1 issue in January is not only supportive for the solvency ratios of the
bank but also enhance the FX liquidity despite the high cost in USD terms. We see the bank’s NIM to be
more defensive in 2019 due to lower than peers’ Lira LDR as well as lower than its previous levels. Stage
2 loans comprising 14.4% of the total loan book can be considered as the soft bone of Yapi Kredi Bank;
but 11% coverage ratio for this category is the highest among our coverage. Yapi Kredi Bank is trading at
3.7x P/E and 0.38x P/BV with an expected RoE of 11.0%. We rate the stock as BUY at these relatively
attractive multiples backed by more clean loan book, improved solvency and adequate liquidity
█ TSKB (TSKB TI): We expect TSKB to achieve the highest profitability among our banking coverage
universe after having faced with sizeable NPL inflow in 2018 lifting up the NPL ratio from a mere 0.2% to
2.1%. TSKB has the highest total NPL coverage ratio with around 125% including the TRY220 mln free
provision. Stage 2 loans make up 10.4% of total loans and nearly half of Stage 2 loans is comprised of
Electricity generation and distribution sectors, for which we foresee a contained risk as the bank mainly
focuses on renewable energy. 11.1% CET1 ratio (16.2% CAR) is strong enough to support ~5% FX
adjusted loan growth target of the bank in 2019, in line with our moderate GDP growth forecast of 1%.
Sustainable L/D spread will likely be the main advantage of TSKB while CPI linkers constituting 4.7% of
total assets may act as a natural hedge. 3.6x P/E and 0.60x P/BV multiples are more lucrative than the
banking sector average given the 15.1% RoE beating the sector average in 2019.
█ Ford Otosan (FROTO TI): Despite the sluggish domestic vehicle demand, Ford Otosan is expected to
continue benefiting from strong van demand in Europe. We estimate TRY2.9 DPS from 2018E earnings
(offering 5% yield), to be paid in two installments in by early April and November as has been in the past.
Developments toward strategic partnership between Ford Company and Volkswagen, which may entail
production of Volkswagen vans at Ford Otosan’s facilities in Turkey, are likely to support share price
performance in the coming periods. We have a BUY recommendation for Ford Otosan with a target price
to TRY80.00/share.
█ Migros (MGROS TI): We expect solid y/y top-line and EBITDA growth in 2019 supported by the still high
inflation environment and the synergies from Kipa merger (+16% in 2018-19E). Our key concern remains
to be on the FX based leverage. Though, we think that a sustained strength in the lira should support
the share price performance. Short term catalyst would be the 4Q18 results of the retailer as the
appreciation of the Lira during the quarter is anticipated to translate to a significant earnings
momentum. We have TRY23.20/share target price and BUY recommendation for Migros. Stock trades
an attractive 4.9 2019 EV/EBITDA.
█ Pegasus Airlines (PGSUS TI): Despite the uninspiring passenger volume growth outlook, particularly due to
the weak domestic demand, we expect Pegasus Airlines to manage to keep its margins intact as we
anticipate the allocation of capacity (in ASK terms) away from domestic to international flights will act as
buffer for profitability and revenue growth. Stock outperformed BIST-100 index by 20% since being
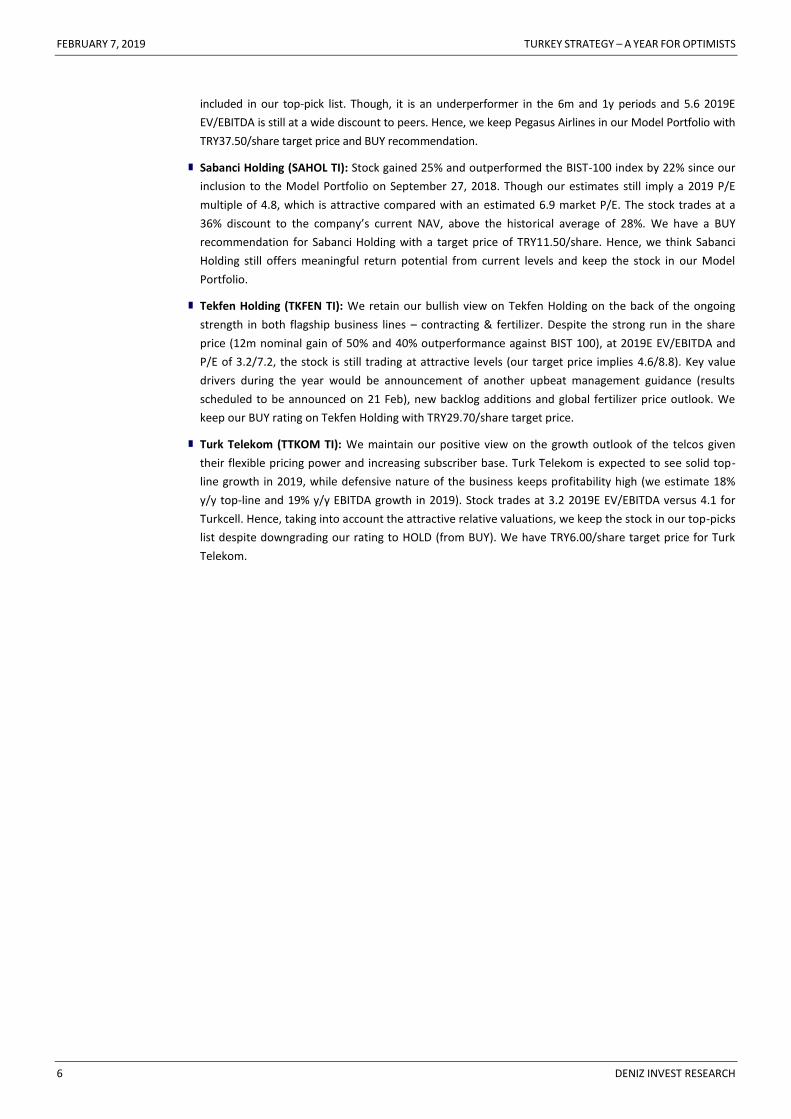
FEBRUARY 7, 2019 TURKEY STRATEGY – A YEAR FOR OPTIMISTS
6 DENIZ INVEST RESEARCH
included in our top-pick list. Though, it is an underperformer in the 6m and 1y periods and 5.6 2019E
EV/EBITDA is still at a wide discount to peers. Hence, we keep Pegasus Airlines in our Model Portfolio with
TRY37.50/share target price and BUY recommendation.
█ Sabanci Holding (SAHOL TI): Stock gained 25% and outperformed the BIST-100 index by 22% since our
inclusion to the Model Portfolio on September 27, 2018. Though our estimates still imply a 2019 P/E
multiple of 4.8, which is attractive compared with an estimated 6.9 market P/E. The stock trades at a
36% discount to the company’s current NAV, above the historical average of 28%. We have a BUY
recommendation for Sabanci Holding with a target price of TRY11.50/share. Hence, we think Sabanci
Holding still offers meaningful return potential from current levels and keep the stock in our Model
Portfolio.
█ Tekfen Holding (TKFEN TI): We retain our bullish view on Tekfen Holding on the back of the ongoing
strength in both flagship business lines – contracting & fertilizer. Despite the strong run in the share
price (12m nominal gain of 50% and 40% outperformance against BIST 100), at 2019E EV/EBITDA and
P/E of 3.2/7.2, the stock is still trading at attractive levels (our target price implies 4.6/8.8). Key value
drivers during the year would be announcement of another upbeat management guidance (results
scheduled to be announced on 21 Feb), new backlog additions and global fertilizer price outlook. We
keep our BUY rating on Tekfen Holding with TRY29.70/share target price.
█ Turk Telekom (TTKOM TI): We maintain our positive view on the growth outlook of the telcos given
their flexible pricing power and increasing subscriber base. Turk Telekom is expected to see solid top-
line growth in 2019, while defensive nature of the business keeps profitability high (we estimate 18%
y/y top-line and 19% y/y EBITDA growth in 2019). Stock trades at 3.2 2019E EV/EBITDA versus 4.1 for
Turkcell. Hence, taking into account the attractive relative valuations, we keep the stock in our top-picks
list despite downgrading our rating to HOLD (from BUY). We have TRY6.00/share target price for Turk
Telekom.
TURKEY STRATEGY – A YEAR FOR OPTIMISTS FEBRUARY 7, 2019
DENIZ INVEST RESEARCH 7
Global backdrop
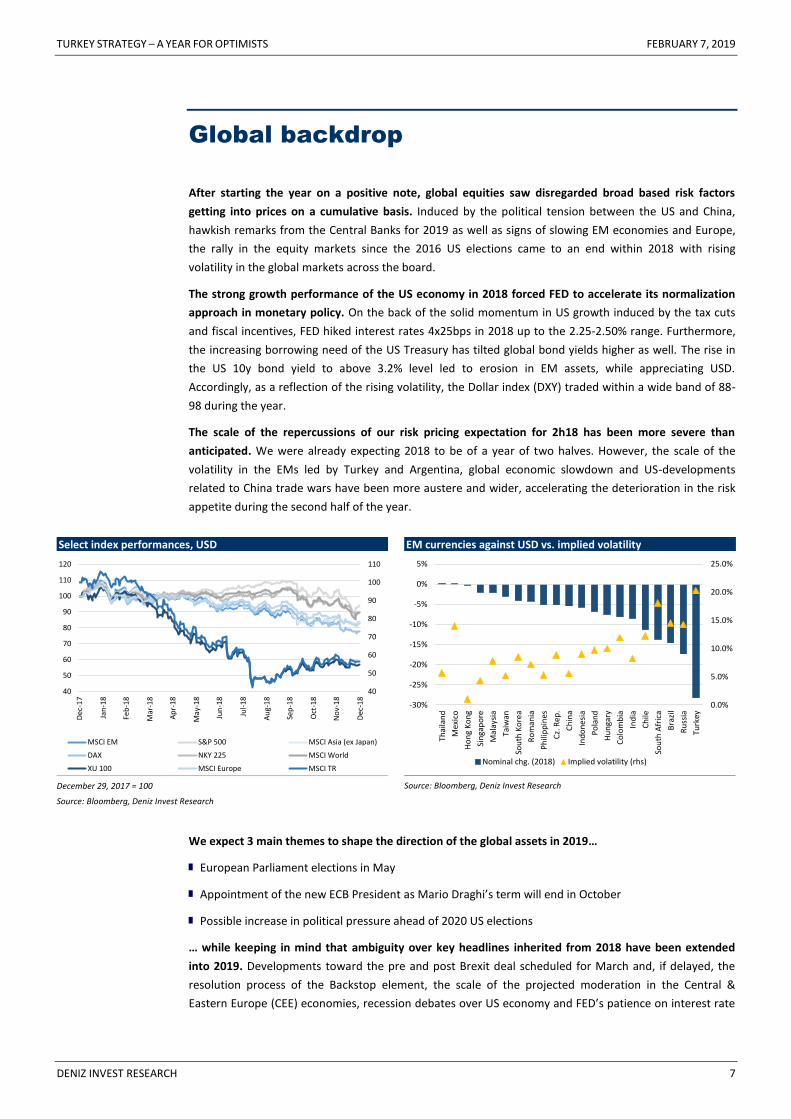
After starting the year on a positive note, global equities saw disregarded broad based risk factors
getting into prices on a cumulative basis. Induced by the political tension between the US and China,
hawkish remarks from the Central Banks for 2019 as well as signs of slowing EM economies and Europe,
the rally in the equity markets since the 2016 US elections came to an end within 2018 with rising
volatility in the global markets across the board.
The strong growth performance of the US economy in 2018 forced FED to accelerate its normalization
approach in monetary policy. On the back of the solid momentum in US growth induced by the tax cuts
and fiscal incentives, FED hiked interest rates 4x25bps in 2018 up to the 2.25-2.50% range. Furthermore,
the increasing borrowing need of the US Treasury has tilted global bond yields higher as well. The rise in
the US 10y bond yield to above 3.2% level led to erosion in EM assets, while appreciating USD.
Accordingly, as a reflection of the rising volatility, the Dollar index (DXY) traded within a wide band of 88-
98 during the year.
The scale of the repercussions of our risk pricing expectation for 2h18 has been more severe than
anticipated. We were already expecting 2018 to be of a year of two halves. However, the scale of the
volatility in the EMs led by Turkey and Argentina, global economic slowdown and US-developments
related to China trade wars have been more austere and wider, accelerating the deterioration in the risk
appetite during the second half of the year.
Select index performances, USD
40
50
60
70
80
90
100
110
40
50
60
70
80
90
100
110
120
Dec
-17
Jan
-18
Feb
-18
Mar
-18
Ap
r-1
8
May
-18
Jun
-18
Jul-
18
Au
g-1
8
Sep
-18
Oct
-18
No
v-1
8
Dec
-18
MSCI EM S&P 500 MSCI Asia (ex Japan)
DAX NKY 225 MSCI World
XU 100 MSCI Europe MSCI TR December 29, 2017 = 100
Source: Bloomberg, Deniz Invest Research
EM currencies against USD vs. implied volatility
0.0%
5.0%
10.0%
15.0%
20.0%
25.0%
-30%
-25%
-20%
-15%
-10%
-5%
0%
5%
Thai
lan
d
Mex
ico
Ho
ng
Ko
ng
Sin
gap
ore
Mal
aysi
a
Taiw
an
Sou
th K
ore
a
Ro
man
ia
Ph
ilip
pin
es
Cz.
Re
p.
Ch
ina
Ind
on
esi
a
Po
lan
d
Hu
nga
ry
Co
lom
bia
Ind
ia
Ch
ile
Sou
th A
fric
a
Bra
zil
Ru
ssia
Turk
ey
Nominal chg. (2018) Implied volatility (rhs)
Source: Bloomberg, Deniz Invest Research
We expect 3 main themes to shape the direction of the global assets in 2019…
█ European Parliament elections in May
█ Appointment of the new ECB President as Mario Draghi’s term will end in October
█ Possible increase in political pressure ahead of 2020 US elections
… while keeping in mind that ambiguity over key headlines inherited from 2018 have been extended
into 2019. Developments toward the pre and post Brexit deal scheduled for March and, if delayed, the
resolution process of the Backstop element, the scale of the projected moderation in the Central &
Eastern Europe (CEE) economies, recession debates over US economy and FED’s patience on interest rate

FEBRUARY 7, 2019 TURKEY STRATEGY – A YEAR FOR OPTIMISTS
8 DENIZ INVEST RESEARCH
hikes, and last but not least, the pace of the Chinese economic growth will continue to be under spotlight
throughout the year.
We do not think DM economies are entering into a recession period. The synchronized growth pattern of
the DM economies since 2017 may have lost some steam recently. Though, we think that the ongoing still
expansionary policies will continue supporting DMs in the medium term. Of note, IMF foresees 3.5%
global growth in 2019, a mere 20 bps below 2018 forecast. In this projection, the agency sees 2.0% growth
in DM economies and 4.5% for EMs in 2019, respectively, a tad 20 bps and 30 bps lower than 2018
forecast.
We expect the portfolio flows into EMs to continue; albeit at lower rates vis-à-vis 2018. Last year’s
prime underperformers, Turkey and Argentina, have managed to bring the fire under control through
successful measures to stabilize local currency depreciation and volatility. Hence, the improvement in the
visibility of the two countries’ pricing environment is likely to bring them into the radar of global investors.
Furthermore, the positive outlook triggered by the reform expectations geared toward modernization of
the Brazilian economy after the elections has been transformed into Bolsonaro rally in the country’s
assets since September 2018. We expect the progress in the reform package regarding the privatization
program, pension reform and simplification of the tax regime will be at center stage for Brazilian assets.
US economy
Economic growth is expected to continue in 2019; albeit at slower pace. Supported by the fiscal
incentives and the corporate tax cuts, US economy is forecast to post 3% growth in 2018. According to the
January 2019 WEO report of IMF, the US GDP is forecast to grow 2.54%, which broadly in line with the
2.3% of Fed Dot Plot projection. Considering the 2.2% average GDP growth posted during the 2010-17
period, we think that rather than entering into a recession, the US economic growth is converging to its
medium-term averages. (Bloomberg consensus median stands at 2.5% with estimates ranging between
0.6-3.7%)
We expect FED to prioritize wait and see mode and closely monitor the growth momentum before
taking any action. In our recent report following the latest FOMC meeting, we have trimmed our 2x25bps
rate hike expectation within 2019 down to 1x25 bps within 4Q19 as the 35-day government shutdown and
remarks from the January FOMC meeting have reduced the likelihood of any rate action before 2h19.
US GDP growth
-4%
-3%
-2%
-1%
0%
1%
2%
3%
4%
5%
6%
19
92
19
93
19
94
19
95
19
96
19
97
19
98
19
99
20
00
20
01
20
02
20
03
20
04
20
05
20
06
20
07
20
08
20
09
20
10
20
11
20
12
20
13
20
14
20
15
20
16
20
17
US GDP (Real, annual) US GDP (Real, 3y average)US GDP (Real, annual, 1992-2007) US GDP (Real, annual, 2010-2017
Source: Bloomberg, Deniz Invest Research

TURKEY STRATEGY – A YEAR FOR OPTIMISTS FEBRUARY 7, 2019
DENIZ INVEST RESEARCH 9
Euro zone
The region is extending the momentum loss in economic activity into 2019. After posting a 2.4% GDP
growth in 2017, based on consensus figure complied by Bloomberg, the Euro zone is forecast to post 1.9%
y/y growth in 2018 as the economic activity started to cool off in 2h18, leveling off around 1.4% levels in
2019 (estimates of 50 contributors range between 1.0 and 1.8%). Our view on the US economic growth
that growth is converging to its medium-term averages would go for the Euro zone as well; hence, we are
not yet concerned with recession fears for the region’s economy. Furthermore, we think that moderate
economic growth coupled with soft pricing environment for commodities is likely to keep putting pressure
on inflation this year.
We project a 10-15 bps “symbolic” rate hike from the ECB’s deposit rate ahead of the appointment of
the new president. Obviously, one of the key topics of the year will be the selection of the successor of
Mario Draghi as the President of ECB after his term terminates in October, as it will also dictate the
outlook of the next 6 years. The debates over this subject are likely to heat up in the second half of the
year. However, as a signal of the continuation of similar policies during the new term, we expect a
symbolic deposit rate hike within 10-15 bps ahead of the appointment of the new president.
ECB may consider launching new round of the TLTRO program this year. Within the existing TLTRO
program, all operations will mature by June 2020, implying EUR500 mln repayment (68% of EUR740 mln
will be made within 2020). However, in an attempt to alleviate its potential negative impact of tapering on
the already cooling economy of the region, the Bank is likely to consider launching a new reinvestment
plan during its March or June meeting.
Euro zone GDP growth
-5%
-4%
-3%
-2%
-1%
0%
1%
2%
3%
4%
19
92
19
93
19
94
19
95
19
96
19
97
19
98
19
99
20
00
20
01
20
02
20
03
20
04
20
05
20
06
20
07
20
08
20
09
20
10
20
11
20
12
20
13
20
14
20
15
20
16
20
17
EU GDP (Real, annual) EU GDP (Real, 3y average)
EU GDP (Real, annual, 1992-2007) EU GDP (Real, annual, 2010-2017 Source: Bloomberg, Deniz Invest Research
EUR/USD
We use target EUR/USD parity of 1.15 in our 2019 forecasts. Despite the deterioration in the region’s
locomotive economies, Germany and France, and the retreat in manufacturing PMIs, we think that ECB is
still far from taking a FED-like balance sheet normalization action. Hence, rather than dynamics of the
region, the fluctuations in the EUR/USD parity are likely to be motivated by the strength of dollar against
global currencies. Hence, we think that any uptrend in the parity is likely to remain limited and short lived
(within 1.15-1.20 band). Therefore, in our projections for the year, we use an average EUR/USD of 1.15.

FEBRUARY 7, 2019 TURKEY STRATEGY – A YEAR FOR OPTIMISTS
10 DENIZ INVEST RESEARCH
China
The focus is expected to be on the US-China trade relations rather than the country’s economic growth.
After posting an average annual growth of 10.6% between 1992-2010, followed by 7.6% and 6.8% in 2011-
16 and 2015-17 periods, the Chinese economy is forecast to post 6.6% growth in 2018 and 6.2% in 2019
according to a survey on Bloomberg (estimates range between 5.9% and 6.8% for 2019). However, we
think that this year’s main topic from China side will be the developments regarding the tariffs imposed by
the Trump government on $250 bln worth Chinese goods will have a greater significance than the
country’s economic growth as it dents the asset pricing and global growth outlook on a wider scale. The
90-day trade truce declaration of the two leaders following the December G20 meeting has helped
improve the sentiment in the global markets and the risks are being overlooked for the time being.
Though, any potential negative development would dent outlook for global economic growth.

TURKEY STRATEGY – A YEAR FOR OPTIMISTS FEBRUARY 7, 2019
DENIZ INVEST RESEARCH 11
2019 outlook for Turkey…
What shaped up to be a rather stable year for Turkish equities with some positive bias until April-May
period turned out to be one of the most volatile years in the recent history. Last year, Turkish asset
prices were hit by domestic developments and a generally unfavorable global backdrop. The impact of the
300 bps rate hike in the extraordinary MPC meeting held in May 23, 2018 to soothe the currency volatility
ahead of June 2018 general elections, unfortunately, remained subdued and short-lived. The devaluation
of the lira gained pace during August amid liquidity crisis in the markets. The lira was one of the worst
performing currencies against the dollar, while lira-denominated bonds underperformed global peers on
the back of major capital outflows.
In its September 13, 2018 meeting, the CBRT took a bold move and introduced a frontloaded 625 bps hike
in the policy rate (1-week repo rate) to 24.0%. This was followed by i) market friendly 2019-21 New
Economic Program (NEP), which envisaged a slowdown in growth, prolonged double digit inflation, while
highlighting fiscal discipline, ii) steps towards improving relations with the EU, iii) resolution of the
strained ties with the US after Pastor Brunson case and Syria issue, iv) collaborative measures taken within
the scope of the fight against inflation, and v) CBRT’s decisiveness to keep tight monetary policy until
seeing signs of sustained recovery in inflation outlook. All these actions paved the way to restore, for the
most part, investor confidence and credibility of the CBRT.
Nevertheless, MSCI Turkey could not avert underperforming the MSCI EM by 32% last year, after
outperforming it by a mere 7% in 2017. In terms of multiples comparison, MSCI Turkey index, led by
comparative banking multiples, reached a 10-year low against MSCI EM towards end 2018.
A similar case is true for TRY against the FX basket (USD and EUR avg.) as the local currency depreciated by
25% ytd, while most of the move taking place during August-September period by 23%. In the previous
episodes, we had seen similar currency attacks in June 2006 and October 2008; albeit at a lower scales
(11% and 14%, respectively). TRY’s weak performance last year brought the currency close to historical
lows also in real-terms. In fact, the real effective exchange rate fell to 61.7 in September, which is the
lowest reading since the data began to be collected at the beginning of 2003. While the currency managed
to recoup some of the losses after October, the recovery in TRY still signals weak levels in real-terms (real
effective exchange rate closed the year at 75.0).
Hence, we think that risks have already been incorporated into prices within 2018, and that we are
looking into seeing a much less volatile year in Turkish assets.
Performance comparison of select currencies
80
100
120
140
160
180
200
Dec
-17
Jan
-18
Feb
-18
Mar
-18
Ap
r-1
8
May
-18
Jun
-18
Jul-
18
Au
g-1
8
Sep
-18
Oct
-18
No
v-1
8
Dec
-18
USDTRY JP MORGAN EM EURUSD DXY
*December 29, 2017 = 100
Source: Bloomberg, Deniz Invest Research
US, TR and select EM 10Y bond yields spread, bps
400
600
800
1,000
1,200
1,400
1,600
1,800
2,000
2,200
400
500
600
700
800
900
Jan
-18
Feb
-18
Mar
-18
Ap
r-1
8
May
-18
Jun
-18
Jul-
18
Au
g-1
8
Sep
-18
Oct
-18
No
v-1
8
Dec
-18
TR-US 10Y Spread
US - Fragile 4 + Russia 10Y Spread (ex Turkey) TR-US 10Y Spread (right)
Fragile 4: South Africa, Brazil, India, Indonesia
Source: Bloomberg, Deniz Invest Research

FEBRUARY 7, 2019 TURKEY STRATEGY – A YEAR FOR OPTIMISTS
12 DENIZ INVEST RESEARCH
MSCI Turkey vs MS CI EM
-19%
10%
1%
-20%
39%
-24%
23%
-20% -19%
7%
-32%
8%
-40%
-20%
0%
20%
40%
60%
2008
2009
2010
2011
2012
2013
2014
2015
2016
2017
2018
2019
Source: Bloomberg, Deniz Invest Research
MSCI Turkey vs MSCI EM
0.0
0.2
0.4
0.6
0.8
1.0
1.2
1.4
1.6
Jan
-14
May
-14
Sep
-14
Jan
-15
May
-15
Sep
-15
Jan
-16
May
-16
Sep
-16
Jan
-17
May
-17
Sep
-17
Jan
-18
May
-18
Sep
-18
Jan
-19
Source: Bloomberg, Deniz Invest Research
Key risk parameters
We see further downside for TRY volatility. On the back of the measures taken by the CBRT during the
May-September period, there has been a visible drop in the volatility of the currency. However,
considering the 7-12% range of TRY’s 3m implied volatility between May 2013 and May 2018, we think
that there is still further downside to the current 17% 3m implied volatility of the currency, which had
climbed up to 50% during the currency shock in August.
Turkey’s 5y CDS US is slipping towards pre-August period. Along with the easing political and economic
nervousness both for local and EM assets, Turkey’s 5y CDS has plummeted below 300 bps mark lately
after hitting 574 bps at the beginning of September. Nevertheless, similar to the TRY implied volatility, the
risks for cost of insuring exposure to Turkish debt is likely to converge toward the 222 bps average of the
May 2013-2017 period as the normalization process progresses.
Stabilization in the swap rates suggest possibility of 300bps rate cut within the next 1 year. 12m swap
rates have plunged from 35% in September to 21% in 2019 along with the ease in measures and the Lira
stabilization. The spread between the CBRT policy rate of 24% and swap rates is also suggesting the
expectation for at least a 300 bps cut in the weighted average cost of funding within the next 12m period.
Overall, it might be plausible to say that the normalization trend of the risk indicators is a major positive
for the pricing outlook of Turkish assets.
TR CDS vs TRY 12m swap, May 2013-February 2019
0
5
10
15
20
25
30
35
40
0
100
200
300
400
500
600
700
May
-13
Sep
-13
Jan
-14
May
-14
Sep
-14
Jan
-15
May
-15
Sep
-15
Jan
-16
May
-16
Sep
-16
Jan
-17
May
-17
Sep
-17
Jan
-18
May
-18
Sep
-18
Jan
-19
TR 5Y CDS (USD) TR 5Y CDS(05/01/2013-2017 Avg., USD)
TR 5Y CDS(2018 Avg., USD)
TRY 12M Swap
Source: Bloomberg, Deniz Invest Research
TR CDS vs TRY 12m swap, July 2018-February 2019
5
10
15
20
25
30
35
100
150
200
250
300
350
400
450
500
550
600
Jul-
18
Jul-
18
Jul-
18
Au
g-1
8
Au
g-1
8
Sep
-18
Sep
-18
Oct
-18
Oct
-18
No
v-1
8
No
v-1
8
Dec
-18
Dec
-18
Dec
-18
Jan
-19
Jan
-19
TR 5Y CDS (USD) TR 5Y CDS (2013-2017 avg, USD)
TR 5Y CDS (2018 avg, USD) TRY 12M Swap
Source: Bloomberg, Deniz Invest Research

TURKEY STRATEGY – A YEAR FOR OPTIMISTS FEBRUARY 7, 2019
DENIZ INVEST RESEARCH 13
Economic growth outlook: stabilization in 1h19 to be followed by a revival in 2h19
We now expect 2019 GDP growth of 1.0%, down from previous 4.36% projection. We anticipate the loss
in the growth momentum to prevail during the 4Q18 and 1Q19 periods, stabilizing towards 2Q19 and
recovery in the second half of the year. The extension of the temporary tax cuts introduced for select
sectors until end-March are likely to act as buffer against further deterioration in the economic activity.
Though, given its souring macro indicators, we do not entirely rule out the potential risk of softer demand
from Euro Zone. Consumer and real sector indices are heading down, whereas loan growth has picked up
lately. Of note, from our talks with banking sector officials, we got the impression that a faster than
expected recovery is also in the cards given the early indicators. In our forecasts, we use 4.0% GDP growth
in 2020 (4.40% before).
Nevertheless, our deceleration assumption in the growth outlook predominantly stems from;
█ Slowdown in domestic demand
█ Ongoing downtrend in loan growth
█ Declining imports
█ Deferred private and public investments
█ Deterioration in the consumer confidence
█ Higher unemployment rate (12.5% in 2019E)
while, the competitive advantage created by the weakness in TRY is suggesting support for growth
composition through export and tourism revenues.
The 3Q18 GDP growth was supportive of this argument. The contribution from net exports to growth
was 7 points, while domestic demand’s contribution plunged to 0.66 levels. We think that a similar
pattern will remain in place within the first half of 2019.
The projections for 2019 and 2020 GDP growth range between 0.4% and 2.9%. According to IMF’s
October WEO report, 2019 and 2020 GDP growth is forecast at 0.37% and 2.58%, respectively. The figures
are more or less similar for the consensus estimates compiled by Bloomberg, which averaged +0.4% for
2019 and +2.9% for 2020.
Consumer and real sector confidence
80
90
100
110
120
50
60
70
80
90
2012 2013 2014 2015 2016 2017 2018 2019
Consumer confidence Real sector confidence Source: CBRT, Deniz Invest Research
FX-adjusted loan growth
-30%
-20%
-10%
0%
10%
20%
30%
40%
2015 2016 2017 2018
Total loan growth Total loans, FX-adjusted
Source: CBRT, Deniz Invest Research

FEBRUARY 7, 2019 TURKEY STRATEGY – A YEAR FOR OPTIMISTS
14 DENIZ INVEST RESEARCH
TRY: 2019 eop USD/TRY at 6.30, EUR/TRY 7.25
The performance of Lira, which has been one of the worst performing currencies last year and took its toll
on the market performance, will again be a key factor for equity market outlook this year. The new-year
started in a positive tone on the back of the supportive global backdrop given the increasing probability
for tamer than anticipated policy action outlook from global central banks.
We have positive expectations to support stronger Lira
█ Diminishing political risk factors,
█ Declining FX demand amid slowing economic activity and lower imports, particularly in the 1h19 period,
█ Lower global growth expectations,
█ According to IIF, EMs are estimated to have lured lower fund flows in 2018 ($196 bln) compared to a
year ago ($324 bln) due to strong USD and higher global yields. Hence, we think a cheaper USD and
lower yields are needed to support portfolio and capital flows in to EMs.
Though, we conservatively based our valuations on a contained depreciation in the Lira due to;
█ Chinese economic growth fears would support capital flows into safe havens,
█ In our base case, we assume the FED will keep its balance sheet normalization path in 2019, which
would reduce the liquidity of dollar,
█ The downtrend in the economic activity in the Euro Zone, particularly in the CEE region, since 2h18
might deteriorate the risk appetite for EM assets
Of note, depending on the pace of the FED policy rate hikes and ECB’s potential new round of the TLTRO
program, we do not rule out the possibility of a strengthening in EM assets, from which TRY would take its
share. Hence, we see ample downside to our eop. exchange rate assumptions. We would not be
surprised to see USD/TRY testing its 5.07 support level if the positive mood in the global markets we have
seen during January is sustained.
YTD currency performances vs USD, 2018
0.1%
0.0%
-0.2%
-2.0%
-2.1%
-3.0%
-3.9%
-4.1%
-4.2%
-4.5%
-5.1%
-5.1%
-5.4%
-5.7%
-6.8%
-7.5%
-8.1%
-8.5%
-11.3%
-13.7%
-14.6%
-17.3%
-28.2%
-50.6%
ThailandMexica
Honk KongSingapure
MalaysiaTaiwan
PeruS.Korea
RomaniaBulgaria
PhilipinesCz.Rep
ChinaIndonesia
PolandHungary
ColombiaIndiaChili
S.AfricaBrazil
RussiaTurkey
Argentina
Source: Bloomberg, Deniz Invest Research
Currency performances vs USD, 2019 ytd
-2.2%
-2.1%
-0.3%
-0.2%
-0.2%
-0.1%
-0.1%
-0.1%
0.7%
0.9%
1.0%
1.0%
1.2%
1.3%
1.5%
2.0%
2.9%
3.2%
4.0%
5.2%
6.0%
6.4%
6.4%
7.7%
RomaniaIndia
S.KoreaHonk Kong
PolandTaiwanCz.Rep
BulgaryPhilipinesMalaysia
SingapureHungary
PeruArgentina
TurkeyChina
MexicaIndonesia
ThailandColombia
BrazilChili
RussiaS.Africa
Source: Bloomberg, Deniz Invest Research

TURKEY STRATEGY – A YEAR FOR OPTIMISTS FEBRUARY 7, 2019
DENIZ INVEST RESEARCH 15
Weighted average funding cost
4.0
4.5
5.0
5.5
6.0
6.5
7.0
7.5
10
12
14
16
18
20
22
24
26
Jan
-18
Feb
-18
Mar
-18
Ap
r-1
8
May
-18
Jun
-18
Jul-
18
Au
g-1
8
Sep
-18
Oct
-18
No
v-1
8
Dec
-18
WAFC (lhs) TRY Basket Linear (WAFC (lhs))
Source: CBRT, Deniz Invest Research
Real effective exchange rate, quarter averages
60
70
80
90
100
110
120
130
140
2003
Q1
2004
Q1
2005
Q1
2006
Q1
2007
Q1
2008
Q1
2009
Q1
2010
Q1
2011
Q1
2012
Q1
2012
Q4
2013
Q4
2014
Q4
2015
Q4
2016
Q4
2017
Q4
2018
Q4
Real Effective Exchange Rate Linear (Real Effective Exchange Rate)
Note: 2003=100.
Source: CBRT, Deniz Invest Research
Interest rates: further room for downside by around 150-200 bps
We think that despite the recent drop in real and nominal rates, there is still room for further downside
given the expected inflation trajectory and potential loosening in global financial conditions led by Fed’s
expected rate hikes. Factors that might support this will be a) decline in Turkey’s risk premium due to
upbeat global risk appetite and/or reduction in geopolitical/political risks and b) secular decline in
inflation expectations with stable Lira. Last but not least, a decline in US bond yields due to a more dovish
than expected Fed and/or a slower US economy/still low US inflation would also feed into such a
momentum. We believe following factors will also be effective in the performance of Turkish bonds:
█ Turkish sovereign bonds have seen an outflow of $280 mln in 2018 and $435 mln in 2019 ytd (2019 sell
off seemed to be a rotation among asset classes away from bonds into equities). As a result foreign
ownership in Turkish bonds has declined to 15%, lowest level of all times – a positive for Turkish bonds
going forward.
█ Turkish 10-y bond yield to US10-y bond yield spread has reached close to all-time highs in 2018.
However, although the spread has narrowed lately with CBRT measures, we believe Turkey’s risk
premium and/or inflation expectations into 2020 must decline in order the spread to further decline in
the wake of potential Fed rate hikes next year.
█ Treasury’s borrowing requirement will decline this year, posing downside pressure on bond yields.
Foreign fund flows, $ bln
-10 0 10 20 30 40
2010
2011
2012
2013
2014
2015
2016
2017
2018
Bonds Equity Source: CBRT, Deniz Invest Research
Foreign ownership in government bonds
5%
7%
9%
11%
13%
15%
17%
19%
21%
23%
10%
12%
14%
16%
18%
20%
22%
24%
26%
28%
30%
Jun
-12
Oct
-12
Feb
-13
Jun
-13
Oct
-13
Feb
-14
Jun
-14
Oct
-14
Feb
-15
Jun
-15
Oct
-15
Feb
-16
Jun
-16
Oct
-16
Feb
-17
Jun
-17
Oct
-17
Feb
-18
Jun
-18
Oct
-18
Foreign ownership BENCH 10Y Source: CBRT, Deniz Invest Research

FEBRUARY 7, 2019 TURKEY STRATEGY – A YEAR FOR OPTIMISTS
16 DENIZ INVEST RESEARCH
Real interest rates
0.4%
2.2%
-1.8%
2.4%
3.1%
-0.7%
-3%
-2%
-1%
0%
1%
2%
3%
4%
5%
6%
Turk
ey
S.A
fric
a
Bra
zil
Ind
ia
Ind
on
esi
a
Ru
ssia
Ave
rage
(ex-
Turk
ey)
Turk
ey-
Gro
up
Avg
.
2014-2017 avg. 2018
Source: Bloomberg, Deniz Invest Research
Monthly external debt servicing, 2019, $ bln
0.4 0.4
4.7
0.5 0.60.4 0.3 0.4
0.9
1.6
0.5 0.4
0.0
1.0
2.0
3.0
4.0
5.0
Jan
ua
ry
Feb
rua
ry
Ma
rch
Ap
ril
Ma
y
Jun
e
July
Au
gu
st
Sep
tem
be
r
Oct
ob
er
No
vem
be
r
De
cem
be
r
Capital Interest
Source: CBRT, Deniz Invest Research
Treasury’s monthly domestic debt servicing, TRY bln
10.0
20.0
6.0
3.7 3.6
14.0
16.4
9.3
7.1
3.1
18.9
0.4
0.0
5.0
10.0
15.0
20.0
25.0
0.0
5.0
10.0
15.0
20.0
25.0
Jan
uary
Febr
uar
y
Mar
ch
Apr
il
May
June Ju
ly
Aug
ust
Sept
emb
er
Oct
ob
er
No
vem
ber
Dec
emb
er
Capital Interest
Source: Treasury, Deniz Invest Research
Treasury’s domestic debt rollover ratio
0%
20%
40%
60%
80%
100%
120%
140%
2008
2009
2010
2011
2012
2013
2014
2015
2016
2017
2018
2019
Source: Treasury, Deniz Invest Research
US 10y vs Turkey 10y bond yields
800
900
1000
1100
1200
1300
1400
1500
1600
1700
1800
1900
2000
2100
2.0
2.2
2.4
2.6
2.8
3.0
3.2
3.4
Jun
-17
Jul-
17
Au
g-1
7
Sep
-17
Oct
-17
No
v-1
7
Dec
-17
Jan
-18
Feb
-18
Mar
-18
Ap
r-1
8
May
-18
Jun
-18
Jul-
18
Au
g-1
8
Sep
-18
Oct
-18
No
v-1
8
Dec
-18
Jan
-19
US 10Y (%) TR-US 10Y Spread (Bp) (rhs)
Source: Deniz Invest Research
10y local bond yields, Turkey vs EM
6%
8%
10%
12%
14%
16%
18%
20%
22%
24%
Oca
16
Mar
16
May
16
Tem
16
Eyl 1
6
Kas
16
Oca
17
Mar
17
May
17
Tem
17
Eyl 1
7
Kas
17
Oca
18
Mar
18
May
18
Tem
18
Eyl 1
8
Kas
18
Oca
19
TR 10Y S.Africa Brazil India Indonesia Russia
Source: Bloomberg, Deniz Invest Research

TURKEY STRATEGY – A YEAR FOR OPTIMISTS FEBRUARY 7, 2019
DENIZ INVEST RESEARCH 17
Inflation: CPI is forecast to average 16.7% (15.25% eop)
█ Weak domestic demand
█ Delayed effects of CBRT monetary policy actions
█ Soft global commodity prices
█ Stability in currency
█ Measures taken on the public sector
…are expected to accommodate a downtrend in the inflation outlook, in our view.
Based on our expectations, inflation trajectory reveals a stable picture for the first half of the year due to
unfavorable base effect and pass through impact of weak TRY. We expect consumer price increase to be
within 18-20% during this period, while seeing risks to the downside given the drop in oil prices coupled
with stronger lira are likely to translate to cuts in utility prices as early as March. Though, April print may
see some pick up after the tax cuts in automotive, furniture, consumer durable and real estate sectors
expire.
On the other hand, we believe that slower growth will reduce inflationary pressures via higher slack in the
economy. Also owing to favorable base effects, we estimate that the headline figure will fall to 15.25% at
year-end (16.70% avg). However, risks are tilted to the downside depending on the trajectory of TRY and
food prices. (IMF avg. and eop. CPI forecasts for the year are 16.71% and 15.50%, respectively, while
Bloomberg consensus lies at 17.30% eop.). we see the pass through of the wide PPI-CPI spread on to retail
prices in case of a faster than anticipated recovery in the economic activity as the upside risk to our call.
CPI, y/y
2%
7%
12%
17%
22%
27%
Jan-15 Jan-16 Jan-17 Jan-18 Jan-19 2020 2021
Forecast
Source: Turkish Statistical Institute, Deniz Invest Research
Monetary policy: we expect at least 500 bps cut in policy rate in 2019
CBRT to kick off the rate cut cycle by 2h19. Recall that CBRT had taken on a tight stance and started the
normalization process during 2018 and hiked its policy rate by a total of 1,125 bps during 2018 through
weighted average funding rate (WAFR). The inflation and interest rate trajectory for 2019 is suggesting
that the CBRT will have a strong grip to start the rate cut cycle during the year, possibly within 2Q19 on a
light note (to the tune of 75 bps), accelerating during 2h19 when inflation is projected to visibly come
down. Of note, the CBRT has expressed its intention to keep rates and tight stance until seeing structural
and sustainable downward trend in the inflation outlook.
The scale of the cuts may reach up to 500 bps throughout the year, bringing policy rate down to 19.00-
20.00% range. We think that the Bank’s focus will be on the direction of the core CPI and evolution of the
PPI-CPI spread. Maintenance of open communication channels with the market participants would
eliminate potential pressure of the rate cut process on the Lira, in our opinion.

FEBRUARY 7, 2019 TURKEY STRATEGY – A YEAR FOR OPTIMISTS
18 DENIZ INVEST RESEARCH
CBRT funding rate
22.5
27.0
25.524.024.0
3%
6%
9%
12%
15%
18%
21%
24%
27%
30%
Jan ’16 Aug ’16 Mar ’17 Oct ’17 Jun ’18 Jan ’19
CBRT O/N borrowing rate Late liquidity window rate
CBRT O/N lending rate CBRT 1w repo rate
CBRT average funding rate
Source: CBRT, Deniz Invest Research
Financial conditions index
90
105
120
135
150
Jan
-11
Jul-
11
Jan
-12
Jul-
12
Jan
-13
Jul-
13
Jan
-14
Jul-
14
Jan
-15
Jul-
15
Jan
-16
Jul-
16
Jan
-17
Jul-
17
Jan
-18
Jul-
18
Jan
-19
Index 2011-2017 avg. 2018 avg.
Index: TRY basket, 10y benchmark bond, BIST-Banking index, WAFR, USDTRY 1w implied volatility and USD/TRY o/n swap.
07.01.2011 = 100
Source: Bloomberg, Deniz Invest Research
Current account balance
CAD/GDP to retreat to 2.5% levels on slowing demand. The C/A surplus averaged $1.8 bln during the
August-November period and totaled $7.4 bln on slow domestic demand. Accordingly, the 12m C/A deficit
is highly likely to level off around the $28-30 bln range in 2018. Along with prevailing soft commodity price
environment (forecast Brent oil avg. at $65/bbl) and curbed domestic demand, the C/A deficit is estimated
to contract further down to the $20-25 bln range in 2019, pointing to a CAD/GDP of -2.5% for the year (vs.
IMF forecast of -1.44% and Bloomberg consensus at -3%). That being said, we project total financing need
to decline toward $190-200 bln range in 2019.
Current account balance, $ bln
-90
-80
-70
-60
-50
-40
-30
-20
-10
0
10
20
20
00
20
01
20
02
20
03
20
04
20
05
20
06
20
07
20
08
20
09
20
10
20
11
20
12
20
13
20
14
20
15
20
16
20
17
20
18
excluding non-monetary gold and energy imports 12m cumulative
Source: CBRT, TurkStat, Deniz Invest Research

TURKEY STRATEGY – A YEAR FOR OPTIMISTS FEBRUARY 7, 2019
DENIZ INVEST RESEARCH 19
Credit rating: expecting a revision in outlook; but no change in ratings, yet
After having attained its investment grade status with the 2012-13 rating upgrades from Fitch and
Moody’s, Turkey saw back to back rating downgrades between 2016-18. In 2018, the country’s credit note
was downgraded 4 times by major credit agencies. However, considering the recovering macro balances
and political ties with the US and EU, we would not be surprised to see an upward revision in the
country’s outlook, which is currently at “negative” by all 3 major credit agencies, as the 12m watching
period will expire within 2019. We think that the conditions below will play a major role for the realization
of such a scenario;
█ Further and sustained improvement in political relations with the US and the EU,
█ A more optimistic inflation trajectory than anticipated
█ Prolonged contraction in the balance of payments deficit
█ Keeping fiscal discipline intact
█ An earlier than expected recovery in banking sector balance sheets
█ Tamer than expected slowdown in the economic activity.
Credit rating classifications
S&P Moody's Fitch
Outlook Stable Negative Negative
AAA Aaa AAA
AA+ Aa1 AA+
AA Aa2 AA
AA- Aa3 AA-
A+ A1 A+
A A2 A
A- A3 A-
BBB+ Baa1 BBB+
BBB Baa2 BBB
BBB- Baa3 BBB-
BB+ Ba1 BB+
BB Ba2 BB
BB- Ba3 BB-
B+ B1 B+
B B2 B
B- B3 B-
CCC Caa1 CCC
CC Caa2 CC
C Caa3 C
CI Ca D
R C NR
SD
D
NR
Speculative
Default or the like
Investment Grade
Non-investment
Grade
denotes Turkey’s credit rating
Source: Credit Agencies
Sovereign ratings of Turkey and countries in the same rating
Turkey Serbia VietnamNorth
MacedoniaGuatemala
FITCH BB BB BB BB BB
Turkey Vietnam Bolivia Serbia FijiDominic
Rep.Senegal
Ivory
CoastBangladesh
Moody's Ba3 Ba3 Ba3 Ba3 Ba3 Ba3 Ba3 Ba3 Ba3
Turkey Costa Rica Bahrein Benin Kenya Jordan Fiji Senegal Montenegro AlbaniaCook
Islands
S&P B+ B+ B+ B+ B+ B+ B+ B+ B+ B+ B+
Source: Credit Agencies

FEBRUARY 7, 2019 TURKEY STRATEGY – A YEAR FOR OPTIMISTS
20 DENIZ INVEST RESEARCH
Valuations
REVISIONS TO MACRO FORECASTS AND COST OF EQUITY
We have updated the assumptions in our models to incorporate the following changes:
█ Lower GDP growth both in 2019 and 2020;
█ Our new inflation projections
█ Upward revision in our USD/TRY and EUR/TRY forecasts, reflecting lira’s depreciation against hard
currencies within 2018;
█ A higher CBRT average funding rate and benchmark bond yields, taking into account the tightening of
monetary conditions.
In addition to the revisions in our macroeconomic forecasts, we have increased the lira-based risk-free
rates that we use in our company models. For lira-based models, we now use a 16.0% risk-free rate (15%
at terminal) instead of 13.0% (12.0% at terminal) to reflect the change in the long end of the curve. For
dollar-based models, we raised our risk free-rate to 6.5% (6.0% at terminal) from 6.0% (5.5% at terminal).
On average, the cost of equity for lira-based models climbs to 21.00%, while we use 11.5% for dollar-
based models. Of note, taking into account the current level of the benchmark 10y bond rate of 14.30%,
we see risks to our discount rates skewed to the downside. Though, we opt to leave this option as an
upside potential for the time being. Keep in mind that each 1 pp cut in our Rfr assumption from 16% raises
our bottom-up index target and aggregate banking valuations by 5% and 6%, respectively. This sensitivity
excludes any additional margin impact on bank valuations, which benefit from declining interest rate
environment.
Revisions to macroeconomic forecasts
2019E 2020E 2019E 2020E
GDP growth 4.40% 4.36% 1.00% 4.00%
Current account balance, % of GDP -4.60% -4.30% -2.50% -4.00%
CPI inflation, eop 12.50% 10.50% 15.25% 13.00%
2y bond yields, eop 13.50% 11.00% 15.00% 14.00%
Policy rate* 12.70% 11.50% 21.50% 14.50%
Brent oil price, $65/bbl, avg 65.0 65.0 65.0 65.0
Corporate tax rate 22.0% 22.0% 22.0% 22.0%
USD/TRY, eop 5.335 5.869 6.300 7.245
EUR/TRY, eop 6.135 6.749 7.245 8.332
Old New
*CBRT average funding rate
Source: Deniz Invest Research
EBITDA AND EARNINGS GROWTH
The developments in the lira make a significant difference in the Lira based earnings forecasts for the non-
financial companies under our coverage. Leading flagship companies such as Tupras, Erdemir, Petkim,
Turkish Airlines and glass companies with largely FX-based and/or FX-indexed revenues benefit from the lira
weakness, particularly at the operating income level. On the other hand, mostly lira-based businesses with
some hard currency costs and/or short FX balance sheet positions, such as Turk Telekom, Ulker, Migros, and
Coca-Cola Icecek companies feel the adverse impact of lira depreciation on earnings.
Our macro forecasts indicate a weaker trajectory for the lira. However, as the lira depreciated by more
than 25% against the dollar last year, this year’s estimate of 16% depreciation remains modest in
comparison. This will wipe some of the large FX losses recorded last year by companies that carry FX short
positions. At the same time, it will continue to beef up the operational performance of companies that

TURKEY STRATEGY – A YEAR FOR OPTIMISTS FEBRUARY 7, 2019
DENIZ INVEST RESEARCH 21
generate hard currency revenues. We expect sales volume growth of industrials to remain weak in
general, as, firstly, we assume consumer confidence and economic activity are likely to remain grim this
year and, secondly, companies that have suffered from the pass-through impact of the large lira
depreciation and higher interest rates on their cash flows in 2018 will be willing to increase prices. Top-
line growth of retailers, on the other hand, is likely to benefit from double digit inflation figures.
In terms of EBITDA growth, we expect food & beverage and retail sector players to manage to grow their
top-line, while keeping margins strong thanks to declining but still high inflation as well as improvements in
their sales mix. Ongoing subscriber growth and flexible price adjustments are likely to support the revenue
and EBITDA growth of telecom companies this year. On the back of their USD based guaranteed sales
contracts and upward revision in power purchase price for lignite plants, electricity producers should be able
to increase their CURs and see strong EBITDA growth in 2019. Finally, despite a weak demand environment
in the domestic market, we see Sise Group companies to grow their EBITDA figures thanks to their increasing
focus on exports.
After benefiting from strong product margins and Lira weakness as well as inventory gains in 2018, we expect
commodity plays Eregli, Kardemir and Tupras to post y/y declines in their EBITDA figures in 2019.
Furthermore, our 15% contraction forecast for the light vehicle market in 2019 (down 38% in 2018) due to
prevailing high interest rate environment and slow economic growth produced a flat to single digit y/y
slippage in Tofas and Dogus Otomotiv’s 2019e EBITDA figures. The expiration of Enka Insaat’s Build-Operate
(BO) electricity generation contracts is also likely to weigh on the conglomerate’s 2019 operational
performance. Lastly, we foresee TAV Airports to post a negative EBITDA growth in 2019 due to our
assumption for the termination of the company’s contract at its flagship Istanbul Ataturk Airport after the
scheduled transfer of Turkish Airlines’s operations to the new Istanbul Airport in March 2019. Excluding TAV
Airports, we estimate 13% y/y EBITDA growth for the aviation sector.
EBITDA growth 2017/18e and 2018e/19e
-50% 0% 50% 100% 150% 200%
Holdings
Telecom and technology
Automotive
Consumer durables
Retail
Glass
Energy
Petroleum and derivatives
Steel and construction materials
Airlines and related services
Beverage
Food
REITs
2018E 2019E Source: Deniz Invest Research
The impact of relatively less lira depreciation against the dollar and euro this year than in 2018 on
companies with high FX short positions will be felt in EPS growth. Based on our forecasts, beverages
(thanks to Coca-Cola Icecek), telecoms (due to the positive impact on Turk Telekom) and retail (due to the
positive effect on Migros) will see the highest EPS growth this year along with aviation. The relatively
weaker EPS performances will be seen in automotive, airlines and commodity related companies this year.
For banks, following the 28% earnings growth in 2017, we foresee much more moderate EPS growth in
2018 (+3%) followed by a 1% contraction in 2019. We forecast 10% loan growth, a 30 bps contraction in
swap-adjusted NIM due to higher cost of funding, 20% fee growth, 16% growth in operating expenses and

FEBRUARY 7, 2019 TURKEY STRATEGY – A YEAR FOR OPTIMISTS
22 DENIZ INVEST RESEARCH
a circa 2.0% net total cost-of-risk ratio (below 2018), resulting in flat to slightly negative earnings growth
and 12.2% ROAE, which is down from the 13.9% in 2018e. Of note, we do not rule out a possible faster
rate cut cycle by the CBRT, similar to what we have seen in the 2009-10 episode, which would materially
change the growth and margin outlook for the banks positively, while putting pressure on our net CoR
forecasts.
Earnings growth 2017/18e and 2018e/19e
-100% 0% 100% 200% 300%
Banks
Insurance
Holdings
Telecom and technology
Automotive
Consumer durables
Retail
Glass
Energy
Petroleum and derivatives
Steel and construction materials
Airlines and related services
Beverage
Food
REITs
2018E 2019E
700%
Source: Deniz Invest Research
We seem to be broadly in line with the consensus in terms of 2018-19e operational and bottom-line
performances of non-financials, while having a slightly more bullish stance for 2020 recovery. On the
other hand, we are slightly above the consensus on EPS forecasts for banks in 2019, but in line in 2020
projections.
Our earnings growth forecasts vs consensus
2018E 2018C 2019E 2019C 2020E 2020C
EBITDA growth, industria ls 45.6% 45.3% 6.0% 6.9% 21.0% 17.5%
Net income growth, industria ls 15.6% 19.2% 12.9% 14.2% 29.0% 28.1%
Net income growth, banks 3.5% 2.8% -0.8% -5.6% 32.5% 34.5%
Net income growth, coverage 10.5% 12.2% 7.4% 6.3% 30.2% 30.2% C – Bloomberg consensus (based on estimates submitted during the last 28 days).
Source: Bloomberg, Deniz Invest Research

TURKEY STRATEGY – A YEAR FOR OPTIMISTS FEBRUARY 7, 2019
DENIZ INVEST RESEARCH 23
KEY PERFORMANCE AND VALUATION METRICS FOR BIST
After lagging behind EM peers in 2018, which made it the third year of underperformance in the last four
years, MSCI Turkey is up 16% ytd (in dollar terms), posting a relative to performance of 8% against the MSCI
EM Index.
MSCI Turkey vs MSCI EM
-30%
25%
-19%
10%
1%
-20%
39%
-24%
23%
-20% -19%
7%
-32%
8%
-40%
-20%
0%
20%
40%
60%
20
06
20
07
20
08
20
09
20
10
20
11
20
12
20
13
20
14
20
15
20
16
20
17
20
18
20
19
ytd
Source: Bloomberg, Deniz Invest Research
Regional index performances, $ terms
2017 2018 2019 ytd
MSCI Turkey 41.2% -43.7% 15.7%
MSCI EM 31.5% -16.9% 7.3%
MSCI EMEA 19.4% -19.1% 8.7%
MSCI Russ ia -1.1% -6.0% 12.3%
MSCI Turkey rel . to MSCI EM 7.4% -32.2% 7.8%
MSCI Turkey rel . to MSCI EMEA 18.2% -30.4% 6.4%
MSCI Turkey rel . to MSCI Russ ia 42.8% -40.1% 3.0% Source: Bloomberg, Deniz Invest Research
Foreign ownership in BIST’s free float, which fell to 61-62% levels in 2h18, has recovered to above 66%
lately. This figure had surpassed this level back in May 2013, when Turkey garnered investment-grade
ratings from both Fitch and Moody’s. However, we should note that our calculations show that there is an
optical boost in foreign share in free-float coming from the recent surge in Denizbank (DENIZ: Not Rated)
and QNB Finansbank (QNBFB: Not Rated) shares with no visible net foreign inflow, which we estimate
would require 1.4pp downward adjustment to reach the effective level. Nevertheless, net foreign inflow
of $798 mln during January alone (excluding ~$210 mln estimated foreign participation in the Akbank
rights issue), has already recovered half of the foreign outflow from BIST equities throughout 2018.
Foreign ownership in BIST’s free float
60%
61%
62%
63%
64%
65%
66%
67%
Jan
-14
Ap
r-1
4
Jul-
14
Oct
-14
Jan
-15
Ap
r-1
5
Jul-
15
Oct
-15
Jan
-16
Ap
r-1
6
Jul-
16
Oct
-16
Jan
-17
Ap
r-1
7
Jul-
17
Oct
-17
Jan
-18
Ap
r-1
8
Jul-
18
Oct
-18
Jan
-19
Hu
nd
red
s
Source: BIST, Deniz Invest Research
Foreign transactions, $ mln
-3,000
-2,000
-1,000
0
1,000
2,000
3,000
Jan
-15
Ap
r-1
5
Jul-
15
Oct
-15
Jan
-16
Ap
r-1
6
Jul-
16
Oct
-16
Jan
-17
Ap
r-1
7
Jul-
17
Oct
-17
Jan
-18
Ap
r-1
8
Jul-
18
Oct
-18
Jan
-19
Monthly net foreign flow 12m cumulative
Source: BIST, Deniz Invest Research
The BIST has materially recovered from its historically high discounts relative to EM peers, but the index is
still below its 10y average discounts. On a 12m forward basis, the MSCI Turkey discount to the MSCI EM
index has narrowed to 40% from the lows (50%) seen following the general elections in July. The market is
trading at a 12m forward P/E of 6.9, which denotes a 20% discount to its own 10-year historical average.
Based on our revised macro assumptions and the increase in the cost of equity used in our models, we
calculate a new bottom-up 12m target of 125,000 for the BIST 100 (previously 136,000), which offers 23%
upside potential, slightly above our cost of equity (21%).
On 2019E multiples, the market is trading at a P/E of 6.9, which means that when adjusted for EPS growth,
there is still a meaningful discount below the trend line of average EM peer multiples, particularly
considering the upside to earnings through current strength of the Lira against hard currencies.

FEBRUARY 7, 2019 TURKEY STRATEGY – A YEAR FOR OPTIMISTS
24 DENIZ INVEST RESEARCH
MSCI Turkey and MSCI EM 1y forward P/E
-60%
-30%
0%
30%
60%
90%
0
3
6
9
12
15
2009 2011 2013 2015 2017 2019
MSCI Turkey 10-year avg. P/E
Discount to MSCI EM 10-year average discount Source: Bloomberg, Deniz Invest Research
Market multiples
2016 2017 2018E 2019E 2020E
EV/EBITDA, non-financia ls 7.6 6.3 5.2 5.0 4.3
P/E, non-financia ls 10.8 8.2 7.8 7.0 5.4
P/BV, banks 0.73 0.67 0.60 0.54 0.47
P/E, banks 7.3 5.5 4.5 4.6 3.5
P/E, tota l 13.1 7.9 7.2 6.9 5.3 Source: Deniz Invest Research
Select markets net income growth vs P/E, USD based
BIST 100HSI
RTS
TWSE
TA-25 JCI
IBOV TOP-40
0
10
20
30
-5% 0% 5% 10% 15% 20% 25%
20
19
E P
/E
2019E NI growth Note: Based on Bloomberg consensus estimates.
Source: Bloomberg, Deniz Invest Research
Select markets EBITDA growth vs EV/EBITDA, USD based
BIST 100
HSI
RTS
TWSE TA-25 JCI
IBOV
TOP-40
0
10
20
0% 2% 4% 6% 8% 10% 12%
20
19
E EV
/EB
ITD
A
2019E EBITDA growth Note: Based on Bloomberg consensus estimates.
Source: Bloomberg, Deniz Invest Research
Ytd, the BIST 100 index posted 13% return, which was accompanied by a 1.6 pp reduction in the cost of
equity (using Turkey’s 10y bond yields). However, at 5.8, the drop in CoE is more remarkable since the
elimination of the Brunson case from the risk premium and recovery in Turkey-US relations in October,
while the index showed only 5% gain during this period. Hence, we think that so long as the interest rates
are sustained at current levels, which we think is likely in the medium term, given the projected
downtrend of the inflation, there is more room to run for the equity market.
BIST 100 vs cost of equity
0
20,000
40,000
60,000
80,000
100,000
120,000
140,000
3%
4%
5%
6%
7%
8%
9%
10%
11%
Jan
-15
Ap
r-1
5
Jul-
15
Oct
-15
Jan
-16
Ap
r-1
6
Jul-
16
Oct
-16
Jan
-17
Ap
r-1
7
Jul-
17
Oct
-17
Jan
-18
Ap
r-1
8
Jul-
18
Oct
-18
Jan
-19
1/COE BIST 100 (rhs) Note: Cost of equity is inverted.
Source: Deniz Invest Research

TURKEY STRATEGY – A YEAR FOR OPTIMISTS FEBRUARY 7, 2019
DENIZ INVEST RESEARCH 25
On the back of the improvement in the credibility of the CBRT, diminishing political risks and bottoming up
NIM trajectory, Turkish banking stocks have rerated lately, and as a result, the 12m forward P/E of MSCI
Turkey financials has risen from its lows of 3.2 to 5.3 (based on the MSCI Turkey), narrowing the discount
with MSCI EM banks from the 65% in August to 41% as of end-January. Despite the recent
outperformance, Turkish banking stocks remain in deep underperformance territory relative to EM banks
in the long-term charts, which reflects the general rise in Turkey’s risk premium in recent years.
BIST banking index vs MSCI EM banking index
0
50
100
150
200
250
300
350
20
13
20
14
20
15
20
16
20
17
20
18
20
19
Note: 2003 = 100.
Source: Bloomberg, Deniz Invest Research
MSCI Turkey Financials and MSCI EM Financials 1y fwd P/E
-75%
-50%
-25%
0%
25%
50%
75%
0.0
2.5
5.0
7.5
10.0
12.5
2009 2011 2013 2015 2017
MSCI Turkey Fin 10-year avg. P/E
Discount to MSCI EM Financials 10-year average discount Source: Bloomberg, Deniz Invest Research
On the back of the recent fall in bond yields, the price-to-book ratios of Turkish banks have significantly
recovered lately. Furthermore, the spread between the earnings yields of banks and the benchmark bond
yield widened substantially. Further upside risk in this spread is still in the cards in our view, considering
the downside pressures on interest rates.
P/BV of banks vs interest rates
*
0.3
0.6
0.9
1.2
1.5
1.8
3%
6%
9%
12%
15%
18%
21%
24%
Feb
-12
Au
g-1
2
Feb
-13
Au
g-1
3
Feb
-14
Au
g-1
4
Feb
-15
Au
g-1
5
Feb
-16
Au
g-1
6
Feb
-17
Au
g-1
7
Feb
-18
Au
g-1
8
Interest rates P/BV (rhs)
*benchmark bond yield
Source: Bloomberg, Deniz Invest Research
Earnings yield-bond yield spread vs BIST banking index
0
5
10
15
20
25
0
50
100
150
200
250
Feb
-12
Jul-
12
Dec
-12
May
-13
Oct
-13
Mar
-14
Au
g-1
4
Jan
-15
Jun
-15
No
v-1
5
Ap
r-1
6
Sep
-16
Feb
-17
Jul-
17
Dec
-17
May
-18
Oct
-18
BIST banking index, '000 Spread, pp (rhs)
Source: Bloomberg, Deniz Invest Research
Industrials, which mostly outperformed banks until 4Q18, have generally fallen behind the banks since
September by a wide margin. Nevertheless, the 12m forward P/E discount of the MSCI Turkey Industrials
Index to the MSCI EM Industrials widened from last year’s 25-30% range to as high as 43%, well below the
ten-year average of 38%. Turkish industrials now trade at a 12m forward P/E of 6.7, a 25% discount relative
to its own average historical P/E of 9.0.

FEBRUARY 7, 2019 TURKEY STRATEGY – A YEAR FOR OPTIMISTS
26 DENIZ INVEST RESEARCH
BIST banking index vs BIST industrials index
170.0
78.0
116.0
60
75
90
105
120
135
150
165
180
Jan
-17
Mar
-17
May
-17
Jul-
17
Sep
-17
No
v-1
7
Jan
-18
Mar
-18
May
-18
Jul-
18
Sep
-18
No
v-1
8
Jan
-19
XBANK vs XUSIN 65-day moving average of XBANK vs XUSIN
Source: Deniz Invest Research
MSCI Turkey Industrials and MSCI EM Industrials, 1y forward P/E
-80%
-40%
0%
40%
80%
120%
0
3
6
9
12
15
20
09
2009
20
10
20
10
2011
20
11
20
12
20
12
20
13
20
13
20
14
20
14
20
15
20
15
2016
20
16
2017
20
17
20
18
20
18
MSCI TR Indus 10-year avg. P/E
Discount to MSCI EM Indus 10-year average discount Source: Bloomberg, Deniz Invest Research

TURKEY STRATEGY – A YEAR FOR OPTIMISTS FEBRUARY 7, 2019
DENIZ INVEST RESEARCH 27
Dividend plays
Dividend payments may not be as generous as the preceding years, particularly in banking stocks, as
companies are likely to focus on staying as liquid as possible to build buffers against potential shocks. The
theme of the year for banks will be asset quality, capital and liquidity. Furthermore, the BRSA has set forth a
threshold of minimum 12% core capital ratio to allow dividend distribution. Hence, we do not expect any of
the banking stocks to payout cash dividends from 2018 earnings in 2019.
According to our forecasts, Eregli, Is REIT, Aygaz, Turk Traktor and Emlak Konut will make up the top 5
dividend plays this year in terms of yield.
Forecast dividend yields under Deniz Invest coverage
Company Ticker
2018E gross
DPS, TRY
2018E gross
dividend, TRY mln
Market cap,
TRY mln
Gross dividend
yield, 2018E
Eregl i EREGL 1.17 4,092.6 28,980 14.1%
Is REIT ISGYO 0.14 130.1 1,026 12.7%
Aygaz AYGAZ 1.31 394.2 3,651 10.8%
Turk Traktor TTRAK 3.87 206.5 1,996 10.3%
Emlak Konut REIT EKGYO 0.16 596.3 5,852 10.2%
Dogus Otomotiv DOAS 0.47 103.7 1,045 9.9%
Tupras TUPRS 11.73 2,937.4 34,633 8.5%
Anadolu Hayat ANHYT 0.46 195.9 2,485 7.9%
Soda Sanayi SODA 0.53 529.6 6,960 7.6%
TAV Airports TAVHL 1.96 710.6 10,121 7.0%
Anadolu Cam ANACM 0.20 149.2 2,288 6.5%
Turkcel l TCELL 0.91 1,994.0 32,010 6.2%
Tofas TOASO 1.29 644.8 10,400 6.2%
Trakya Cam TRKCM 0.21 264.3 4,375 6.0%
Ford Otosan FROTO 2.93 1,029.3 20,370 5.1%
Tekfen Holding TKFEN 1.04 383.7 8,880 4.3%
Sabanci Holding SAHOL 0.36 734.6 18,629 3.9%
Petkim PETKM 0.22 357.3 9,438 3.8%
Sise Cam SISE 0.25 569.4 15,210 3.7%
Arcel ik ARCLK 0.65 439.5 12,332 3.6%
Coca Cola CCOLA 1.03 261.2 8,374 3.1%
BIM BIMAS 2.04 620.6 27,567 2.3%
Koc Holding KCHOL 0.36 919.2 43,110 2.1%
Ulker Biskuvi ULKER 0.36 123.1 6,655 1.8%
Enka Insaat ENKAI 0.09 446.5 24,500 1.8%
Anadolu Efes AEFES 0.31 184.5 12,837 1.4% *Prices as of February 5, 2019
Source: Deniz Invest Research

FEBRUARY 7, 2019 TURKEY STRATEGY – A YEAR FOR OPTIMISTS
28 DENIZ INVEST RESEARCH
Deniz Invest coverage universe
Valuations – 1/2
’18E ’19E ’20E ’18E ’19E ’20E ’18E ’19E ’20E
FINANCIALS
Akbank HOLD 6.96 7.70 36,192 52.0% 6.4 6.2 4.3 0.8 0.7 0.6 14% 12% 15%
Anadolu Hayat Emeklil ik HOLD 6.11 7.00 2,627 17.0% 10.1 9.5 8.3 2.5 2.2 1.9 26% 25% 25%
AvivaSA BUY 8.25 10.50 1,485 20.0% 7.2 5.4 5.3 4.1 3.0 2.3 65% 63% 49%
Garanti Bank HOLD 9.04 10.20 37,968 48.0% 5.7 5.5 4.1 0.8 0.7 0.6 15% 14% 16%
Halkbank HOLD 7.58 8.80 9,475 49.0% 3.7 3.8 2.7 0.3 0.3 0.3 10% 9% 11%
Isbank BUY 5.38 7.30 24,210 31.0% 4.0 3.8 3.0 0.6 0.5 0.4 14% 14% 15%
TSKB BUY 0.86 1.05 2,408 39.0% 3.6 3.6 3.1 0.5 0.6 0.5 16% 15% 17%
Vakif Bank BUY 4.72 6.20 11,800 25.0% 2.9 3.5 2.7 0.5 0.5 0.4 17% 14% 15%
Yapi Kredi Bank BUY 1.97 2.45 16,641 18.0% 3.6 3.7 3.1 0.4 0.4 0.3 14% 11% 12%
Aggregate (weighted by MCap) 5.0 5.0 3.7 0.7 0.6 0.5 15% 13% 15%
’18E ’19E ’20E ’18E ’19E ’20E ’18E ’19E ’20E
CONGLOMERATES
Enka Insaat BUY 4.88 6.20 24,400 12.0% 11.7 9.6 9.8 4.7 3.9 3.1 1.1 0.6 0.9
Koc Holding HOLD 17.27 20.50 43,795 22.0% 8.5 7.4 5.3 n.a. n.a. n.a. n.a. n.a. n.a.
Sabanci Holding BUY 9.35 11.50 19,078 44.0% 4.6 4.8 4.1 n.a. n.a. n.a. n.a. n.a. n.a.
Sisecam HOLD 6.25 7.30 14,063 34.0% 6.0 6.5 5.9 5.5 4.5 4.0 1.2 0.7 0.9
Tekfen Holding BUY 24.42 29.70 10,989 48.0% 8.6 8.8 10.7 5.4 4.6 5.3 0.7 0.0 0.5
Aggregate (weighted by MCap) 8.2 7.5 6.7 5.1 4.2 3.8 1.0 0.5 0.8
OIL AND GAS
Aygaz BUY 11.82 16.80 3,546 24.0% 7.2 5.7 4.6 5.0 3.4 2.4 0.2 0.2 0.2
Petkim BUY 5.80 7.30 9,570 44.0% 10.3 8.5 4.9 9.7 9.1 5.7 1.5 1.4 1.4
Tupras BUY 137.10 165.00 34,332 49.0% 10.4 9.1 7.7 5.4 6.4 5.1 0.5 0.5 0.4
Aggregate (weighted by MCap) 10.2 8.8 6.9 6.2 6.8 5.1 0.7 0.6 0.6
UTILITIES
Aksa Enerji BUY 2.95 4.10 1,809 21.0% 39.9 5.9 3.1 5.6 3.5 2.3 1.2 0.8 0.8
Zorlu Enerji SELL 1.43 1.45 2,860 15.0% 10.7 4.3 3.4 7.2 5.1 4.3 2.0 1.5 1.5
Aggregate (weighted by MCap) 22.0 4.9 3.3 6.6 4.5 3.5 1.6 1.2 1.2
METALS AND MINING
Erdemir HOLD 8.26 10.00 28,910 48.0% 5.5 6.5 6.3 2.9 3.4 3.3 0.9 0.8 1.3
Kardemir (D) BUY 2.46 3.30 1,919 89.0% 3.6 6.0 9.0 3.0 4.0 2.5 0.9 0.8 0.9
Aggregate (weighted by MCap) 5.4 6.4 6.5 2.9 3.5 3.3 0.9 0.8 1.2
CHEMICALS
Soda Sanayi BUY 6.57 8.60 6,570 39.0% 4.2 5.0 4.4 6.1 4.4 3.4 1.7 1.2 1.3
Aggregate (weighted by MCap) 4.2 5.0 4.4 6.1 4.4 3.4 1.7 1.2 1.3
INDUSTRIALS
Anadolu Cam HOLD 2.99 3.60 2,243 20.0% 5.0 5.3 4.4 5.0 4.2 3.3 1.2 1.0 0.9
Dogus Otomotiv BUY 4.83 6.70 1,063 15.0% 5.1 7.9 3.7 3.2 3.4 3.5 0.2 0.2 0.2
Ford Otosan BUY 57.75 80.00 20,265 18.0% 10.6 11.3 8.5 8.4 7.4 6.1 0.7 0.7 0.6
Tofas BUY 19.87 25.00 9,935 24.0% 6.9 8.6 7.9 5.1 5.4 5.0 0.7 0.6 0.8
Trakya Cam BUY 3.27 4.40 4,088 28.0% 4.3 4.2 3.7 4.1 3.2 2.6 0.8 0.7 0.8
Turk Traktor BUY 36.26 51.70 1,935 24.0% 8.8 8.2 5.4 6.1 5.7 4.1 0.8 0.7 0.9
Aggregate (weighted by MCap) 8.4 9.4 7.4 6.7 6.1 5.2 0.7 0.7 0.7
CONSUMER
Arcelik HOLD 19.46 21.00 13,150 25.0% 15.4 12.0 10.1 7.2 5.5 4.6 0.7 0.6 0.5
BIM HOLD 92.80 100.00 28,174 60.0% 24.0 19.3 15.9 14.5 12.2 9.8 0.9 0.6 0.5
Bizim Toptan HOLD 7.31 8.50 439 46.0% 22.8 15.7 13.7 2.4 1.7 1.4 0.1 0.1 0.1
Coca-Cola Icecek BUY 33.00 41.00 8,394 25.0% 27.1 14.0 10.8 5.9 4.9 4.2 1.0 0.8 0.8
Anadolu Efes HOLD 21.34 25.50 12,636 32.0% 66.5 26.3 18.3 5.7 4.7 4.1 0.9 0.7 0.8
Migros BUY 17.07 23.20 3,091 36.0% n.m. n.m. 154.5 5.0 4.9 4.5 0.3 0.3 0.3
Ulker BUY 19.25 23.50 6,584 39.0% 10.4 11.7 9.8 8.9 7.1 6.2 1.4 1.1 0.7
Vestel BUY 6.66 8.50 2,234 22.0% 24.7 31.9 19.9 2.9 4.3 3.9 0.4 0.4 0.5
Aggregate (weighted by MCap) 29.0 18.3 20.0 9.5 7.9 6.5 0.9 0.7 0.6
Rating
Last price,
TRY
Target,
TRY
MCap
TRY mln
Free
float
P/E
Free
float
Last price,
TRY
P/EMCap
TRY mln
Target,
TRY
P/BV ROAE
EV/EBITDA EV/S
Rating
*Prices as of February 5, 2019
Source: Deniz Invest Research
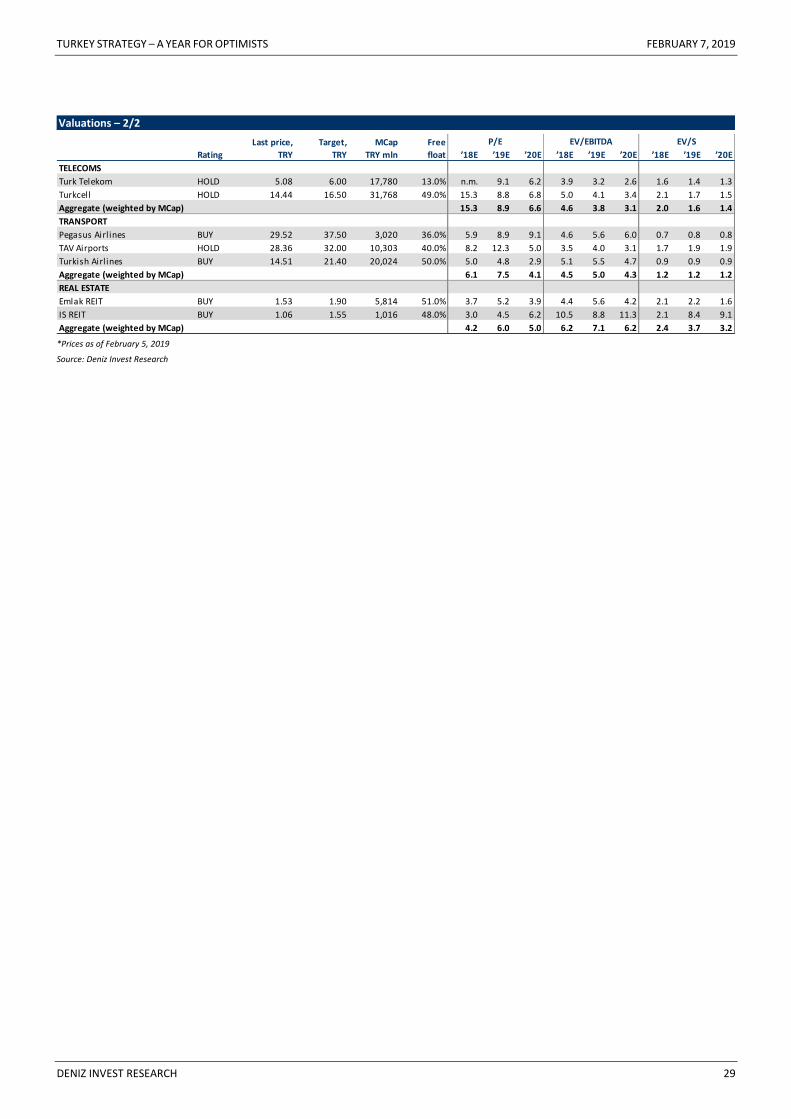
TURKEY STRATEGY – A YEAR FOR OPTIMISTS FEBRUARY 7, 2019
DENIZ INVEST RESEARCH 29
Valuations – 2/2
’18E ’19E ’20E ’18E ’19E ’20E ’18E ’19E ’20E
TELECOMS
Turk Telekom HOLD 5.08 6.00 17,780 13.0% n.m. 9.1 6.2 3.9 3.2 2.6 1.6 1.4 1.3
Turkcell HOLD 14.44 16.50 31,768 49.0% 15.3 8.8 6.8 5.0 4.1 3.4 2.1 1.7 1.5
Aggregate (weighted by MCap) 15.3 8.9 6.6 4.6 3.8 3.1 2.0 1.6 1.4
TRANSPORT
Pegasus Airlines BUY 29.52 37.50 3,020 36.0% 5.9 8.9 9.1 4.6 5.6 6.0 0.7 0.8 0.8
TAV Airports HOLD 28.36 32.00 10,303 40.0% 8.2 12.3 5.0 3.5 4.0 3.1 1.7 1.9 1.9
Turkish Airlines BUY 14.51 21.40 20,024 50.0% 5.0 4.8 2.9 5.1 5.5 4.7 0.9 0.9 0.9
Aggregate (weighted by MCap) 6.1 7.5 4.1 4.5 5.0 4.3 1.2 1.2 1.2
REAL ESTATE
Emlak REIT BUY 1.53 1.90 5,814 51.0% 3.7 5.2 3.9 4.4 5.6 4.2 2.1 2.2 1.6
IS REIT BUY 1.06 1.55 1,016 48.0% 3.0 4.5 6.2 10.5 8.8 11.3 2.1 8.4 9.1
Aggregate (weighted by MCap) 4.2 6.0 5.0 6.2 7.1 6.2 2.4 3.7 3.2
P/E EV/S
Rating
Last price,
TRY
Target,
TRY
MCap
TRY mln
Free
float
EV/EBITDA
*Prices as of February 5, 2019
Source: Deniz Invest Research

FEBRUARY 7, 2019 TURKEY STRATEGY – A YEAR FOR OPTIMISTS
30 DENIZ INVEST RESEARCH
Target price and forecast revisions
Target price and forecast revisions, 1/2
Old New Old New Old New Old New Old New Old New
FINANCIALS
Akbank BUY HOLD 7.11 7.70 6,542 5,690 7,432 5,792 15% 14% 15% 12%
Garanti Bank BUY HOLD 13.39 10.20 7,298 6,638 8,112 6,850 17% 15% 16% 14%
Halkbank BUY HOLD 14.86 8.80 4,030 2,543 4,459 2,482 15% 10% 15% 9%
Isbank HOLD BUY 8.49 7.30 5,753 6,100 6,651 6,400 13% 14% 14% 14%
TSKB BUY BUY 1.53 1.05 708 661 797 660 18% 16% 18% 15%
Vakif Bank BUY BUY 8.68 6.20 3,967 4,064 4,638 3,416 16% 17% 16% 14%
Yapi Kredi Bank BUY BUY 3.02 2.45 4,277 4,667 5,223 4,520 13% 14% 14% 11%
INSURANCE
Anadolu Hayat Emeklil ik HOLD HOLD 8.14 7.00 307 259 400 276 30% 26% 34% 25%
AvivaSA BUY BUY 15.27 10.50 106 205 150 273 39% 65% 47% 63%
Old New Old New Old New Old New Old New Old New
CONGLOMERATES
Enka Insaat HOLD BUY 5.59 6.20 2,997 2,077 2,529 2,532 2,950 3,283 2,110 3,089
Koc Holding BUY HOLD 22.20 20.50 5,326 5,150 5,540 5,950 n/a n/a n/a n/a
Sabanci Holding BUY BUY 15.00 11.50 3,476 4,178 4,248 3,945 n/a n/a n/a n/a
Sisecam HOLD HOLD 5.76 7.30 1,287 2,326 1,434 2,150 2,787 3,384 3,091 4,150
Tekfen Holding BUY BUY 27.70 29.70 1,317 1,273 1,277 1,248 1,419 1,439 1,492 1,424
OIL AND GAS
Aygaz HOLD BUY 15.97 16.80 586 495 595 624 424 349 490 447
Petkim BUY BUY 6.70 7.30 1,003 928 1,437 1,120 1,544 1,534 2,150 1,623
Tupras BUY BUY 145.00 165.00 3,288 3,287 3,100 3,755 7,897 7,897 6,830 6,843
UTILITIES
Aksa Enerji BUY BUY 5.10 4.10 73 45 176 306 1,058 1,076 1,162 1,550
Zorlu Enerji HOLD SELL 2.00 1.45 274 268 592 661 1,261 1,786 1,553 2,350
METALS AND MINING
Erdemir BUY HOLD 11.35 10.00 4,154 5,225 4,021 4,475 5,874 8,597 5,787 7,100
Kardemir (D) BUY BUY 3.99 3.30 144 529 322 318 606 1,018 757 702
CHEMICALS
Soda Sanayi BUY BUY 5.96 8.60 639 1,556 638 1,325 615 958 728 1,250
INDUSTRIALS
Anadolu Cam HOLD HOLD 3.66 3.60 216 451 253 420 589 755 658 915
Dogus Otomotiv BUY BUY 9.34 6.70 284 207 402 134 592 675 690 648
Ford Otosan BUY BUY 68.25 80.00 2,029 1,917 2,133 1,786 2,946 2,796 3,314 3,245
Tofas BUY BUY 38.40 25.00 1,301 1,433 1,260 1,153 2,079 2,423 2,273 2,351
Trakya Cam BUY BUY 5.91 4.40 672 958 745 980 1,070 1,192 1,228 1,475
Turk Traktor BUY BUY 94.38 51.70 387 221 440 237 617 509 685 528
CONSUMER
Arcelik BUY HOLD 20.00 21.00 950 852 1,150 1,100 2,700 2,727 3,000 3,768
BIM SELL HOLD 71.40 100.00 1,014 1,176 1,136 1,457 1,475 1,851 1,726 2,166
Bizim Toptan BUY HOLD 11.51 8.50 10 19 14 28 76 118 91 142
Coca-Cola Icecek BUY BUY 42.00 41.00 410 310 571 600 1,514 1,850 1,791 2,159
Anadolu Efes Under Review HOLD n/a 25.50 n/a 190 n/a 480 n/a 2,869 n/a 3,452
Migros BUY BUY 37.91 23.20 90 -535 268 -380 1,000 1,067 1,207 1,233
Ulker HOLD BUY 25.49 23.50 413 630 502 561 796 873 898 1,084
Vestel BUY BUY 8.00 8.50 228 90 356 70 1,057 2,128 1,075 1,488
2018E ROE 2019E ROE
2018E EBITDA 2019E EBITDA
Rating Target Price, TRY/shr 2018E Net Income 2019E Net Income
Target Price, TRY/shr 2018E Net Income 2019E Net IncomeRating
Source: Deniz Invest Research

TURKEY STRATEGY – A YEAR FOR OPTIMISTS FEBRUARY 7, 2019
DENIZ INVEST RESEARCH 31
Target price and forecast revisions, 2/2
Old New Old New Old New Old New Old New Old New
TELECOMS
Turk Telekom BUY HOLD 5.65 6.00 -639 -1,391 1,600 1,950 8,686 8,557 9,564 10,163
Turkcell BUY HOLD 15.75 16.50 1,999 2,077 3,037 3,620 8,826 8,826 10,123 10,247
TRANSPORT
Pegasus Airlines BUY BUY 42.49 37.50 416 510 371 338 896 1,239 1,053 1,445
TAV Airports BUY HOLD 33.60 32.00 1,670 1,257 921 838 3,550 3,327 2,445 2,377
Turkish Airlines BUY BUY 20.00 21.40 2,377 4,024 3,764 4,162 7,547 11,616 9,361 13,045
REAL ESTATE
Emlak REIT HOLD BUY 2.71 1.90 1,842 1,570 1,940 1,110 1,622 1,800 1,695 1,360
IS REIT Under Review BUY n/a 1.55 n/a 342 n/a 225 n/a 216 n/a 230
2018E EBITDA 2019E EBITDARating Target Price, TRY/shr 2018E Net Income 2019E Net Income
Source: Deniz Invest Research

FEBRUARY 7, 2019 TURKEY STRATEGY – A YEAR FOR OPTIMISTS
32 DENIZ INVEST RESEARCH
Appendix – 1: Termination of coverage
With this strategy note, we are terminating coverage of Alarko Holding, Albaraka Turk, Net Holding, Tat Gida
and Turcas due to a reallocation of resources. Any references to be made in our reports to these stocks from
now on are based on consensus estimates. Our final recommendations and target prices for the companies
were as follows:
█ Alarko Holding (Under Review)
█ Albaraka Turk (BUY, TRY1.95/share)
█ Net Holding (BUY, TRY3.16/share)
█ Tat Gıda (BUY, TRY6.62/share)
█ Turcas (BUY, TRY3.70/share)
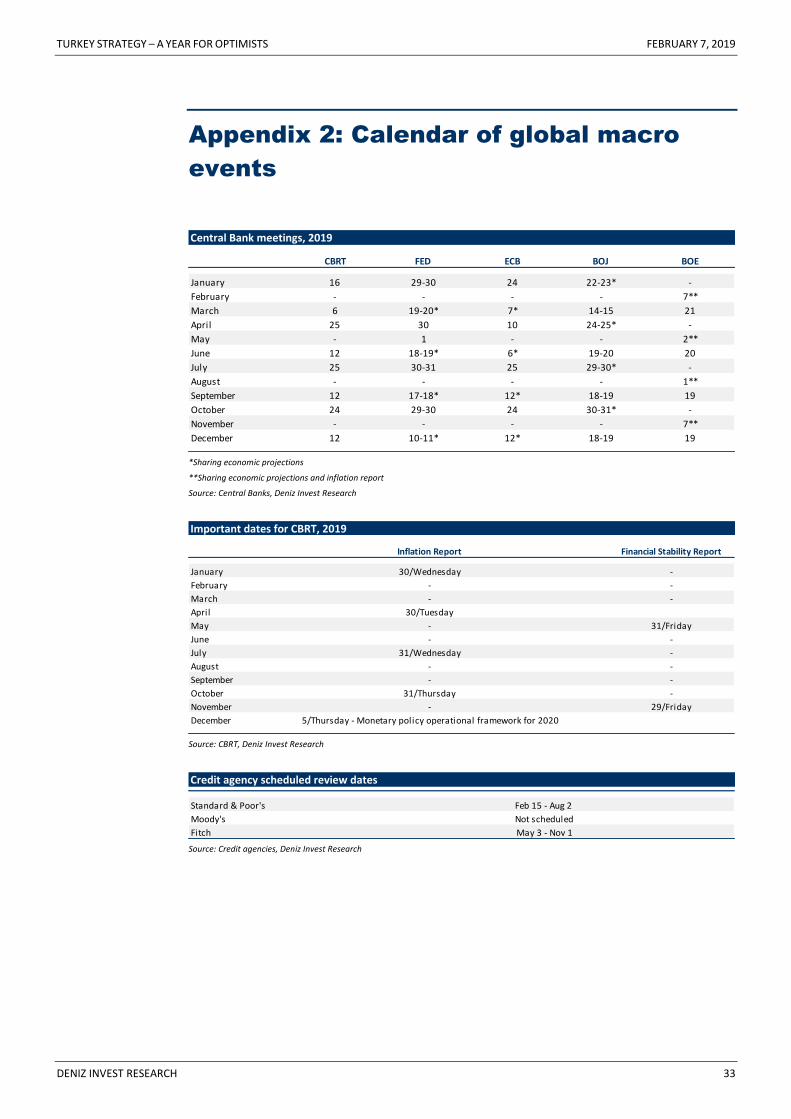
TURKEY STRATEGY – A YEAR FOR OPTIMISTS FEBRUARY 7, 2019
DENIZ INVEST RESEARCH 33
Appendix 2: Calendar of global macro
events
Central Bank meetings, 2019
CBRT FED ECB BOJ BOE
January 16 29-30 24 22-23* -
February - - - - 7**
March 6 19-20* 7* 14-15 21
April 25 30 10 24-25* -
May - 1 - - 2**
June 12 18-19* 6* 19-20 20
July 25 30-31 25 29-30* -
August - - - - 1**
September 12 17-18* 12* 18-19 19
October 24 29-30 24 30-31* -
November - - - - 7**
December 12 10-11* 12* 18-19 19
*Sharing economic projections
**Sharing economic projections and inflation report
Source: Central Banks, Deniz Invest Research
Important dates for CBRT, 2019
Inflation Report Financial Stability Report
January 30/Wednesday -
February - -
March - -
April 30/Tuesday
May - 31/Friday
June - -
July 31/Wednesday -
August - -
September - -
October 31/Thursday -
November - 29/Friday
December 5/Thursday - Monetary policy operational framework for 2020
Source: CBRT, Deniz Invest Research
Credit agency scheduled review dates
Standard & Poor's Feb 15 - Aug 2
Moody's Not scheduled
Fitch May 3 - Nov 1 Source: Credit agencies, Deniz Invest Research

FEBRUARY 7, 2019 TURKEY STRATEGY – A YEAR FOR OPTIMISTS
34 DENIZ INVEST RESEARCH
Analyst certification
The following analyst(s) hereby certify that the views expressed in this research report accurately reflect
such research analyst's personal views about the subject securities and issuers and that no part of his or
her compensation was, is, or will be directly or indirectly related to the specific recommendations or views
contained in the research report: Selim Kunter and Orkun Gödek.

Disclaimer and Confidentiality Note
This document has been produced under the responsibility of Deniz Yatirim, a subsidiary of Denizbank. Deniz Yatirim is licensed and supervised by the Capital Markets Board of Turkey, the regulatory body. This document is exclusively intended for persons that qualify as 'eligible counterparties' or 'professional clients' and it is not intended to be distributed or passed on, directly or indirectly, to 'retail clients' (as such terms are defined under Directive 2004/39/EC of the European Parliament and of the Council).
This document is intended only to provide general information and constitutes investment research. It cannot be construed as an investment advice or a personal recommendation as it has been prepared without regard to the individual financial and other circumstances of persons who receive it.
This document does not constitute an offer or solicitation for the sale, purchase or subscription of any financial instrument in any jurisdiction. It cannot be considered as an offer for the provision of investment services either. Although all reasonable care has been taken by Deniz Yatirim to ensure that the information contained in this document is accurate, neither Denizbank nor their affiliated companies, nor their directors, advisors or employees can be held liable for any incorrect, incomplete or missing information, or for any direct or indirect damages, losses, costs, claims, liabilities or other expenses which would result from the use of, or reliance on, this document, except in case of willful misconduct and fraud. All opinions, estimates and projections contained in this document are those of Deniz Yatirim as of the date hereof and are subject to change without notice.
Investors should carefully read the entire document and any references made therein in order to obtain complete information concerning the analyst's views. This document or any part of it cannot be reproduced, distributed or published without the prior written consent of Deniz Yatirim.
Our salespeople, traders and other professionals may provide oral or written comments to our clients that reflect opinions that may differ from the opinions or recommendations expressed in this document. The asset management area, proprietary trading desks and investment businesses of Denizbank, its affiliates may make investment decisions that are inconsistent with the recommendations expressed in this document.
Any entity of Denizbank reserves the right to perform banking, brokerage and advisory services for or on behalf of any entity referred to in this document. Furthermore, any entity of Denizbank may trade or hold a position in any financial instrument referred to in this document or any other financial instrument, as a broker, market maker, or in any other role, either independently or for the benefit of third parties.
This document is not intended to be distributed to citizens of United States and does not constitute an offer to sell securities or a solicitation of an offer to buy securities within the United States.
© DENIZ INVEST 2019