DECEMBER 2007 - Public Policy Institute of California
42
DECEMBER 2007
Transcript of DECEMBER 2007 - Public Policy Institute of California

D E C E M B E R 2 0 0 7


TABLE OF CONTENTS
About the Survey 1
Press Release 3
February 5th Primary 7
State and National Issues 15
Regional Map 24
Methodology 25
Questionnaire and Results 27


ABOUT THE SURVEY
The PPIC Statewide Survey provides policymakers, the media, and the general public with objective, advocacy-free information on the perceptions, opinions, and public policy preferences of California residents. Inaugurated in April 1998, this is the 82nd PPIC Statewide Survey in a series that has generated a database that includes the responses of more than 174,000 Californians. This survey is the 26th in the Californians and Their Government series, which is conducted periodically to examine the social, economic, and political trends that influence public policy preferences and ballot choices. It is supported with funding from The James Irvine Foundation.
The current survey seeks to raise public awareness, inform decision makers, and stimulate public discussion about the Feb. 5 primary election and state and national issues. We examine Californians’ attitudes and preferences in the 2008 presidential primaries, their support for Proposition 93, and their attitudes toward the Electoral College. We also examine their opinions on the overall direction of the state and its economy, their perceptions of state elected officials, and their attitudes and preferences on other state issues including the budget, disaster response, and legislative and health care reforms. We also analyze residents’ attitudes toward the president, the U.S. Congress and their own federal representatives; their perceptions and preferences regarding immigration policy reform; and their views on the current situation in Iraq.
This report presents the responses of 2,002 California adult residents on these specific topics:
The Feb. 5 presidential primary election, including candidate preferences in the Democratic and Republican primaries and satisfaction with candidate choices; views on the most important issues and satisfaction with the attention given to these issues; support for Proposition 93 and its term-limits provisions; voters’ attitudes toward the Electoral College system and proposed state and national changes. We examine how Californians perceive the move of the presidential primary from June to February, their attention to news about the primary, and the effect of the state’s holding three elections in 2008.
State and national issues, including perceptions of the most important issues facing California today; opinions about the general direction of the state, the outlook for the state’s economy in the next 12 months, and the financial impact of the current housing situation; approval ratings for Governor Schwarzenegger, the state legislature overall, and for respondents’ own state representatives; attitudes toward the state budget deficit, health care reform, and the government role in responding to recent disasters in California. Nationally, we consider approval ratings for President Bush and the U.S. Congress overall and for respondents’ own congressional representatives; perceptions of the need for immigration policy reforms and attitudes regarding giving illegal immigrants driver’s licenses as well as a path to citizenship for working immigrants; and perceptions of the situation in Iraq and of changes in Iraq policy.
The extent to which Californians—based on their political party affiliation, region of residence, race/ethnicity, and other demographics—may differ with regard to perceptions, attitudes, and preferences involving state and national issues.
Copies of this report may be ordered online (www.ppic.org) or by phone (415-291-4400). For questions about the survey, please contact [email protected]. View our searchable PPIC Statewide Survey database online at http://www.ppic.org/main/survAdvancedSearch.asp.
1


PRESS RELEASE
Para ver este comunicado de prensa en español, por favor visite nuestra página de internet: http://www.ppic.org/main/pressreleaseindex.asp
PPIC STATEWIDE SURVEY: CALIFORNIANS AND THEIR GOVERNMENT High Anxiety: Californians Edgy as Economic Woes Escalate, Progress on Policy Issues Stalls TERM LIMITS INITIATIVE LACKS MAJORITY SUPPORT, DESPITE DESIRE FOR REFORM VOTERS DING PRESIDENTIAL CANDIDATES ON ISSUES
SAN FRANCISCO, California, December 12, 2007 — With growing fears about their personal finances and rising frustration over the lack of attention to the policy issues they care about, Californians are not in a celebratory mood as the new year nears, according to a survey released today by the Public Policy Institute of California (PPIC) with funding from The James Irvine Foundation. Their sour state of mind contrasts sharply with their optimism about many economic and political issues a year ago.
Two in three state residents (65%) expect bad economic times in the coming year—a 6-point increase since September (59%) and a 26-point increase since January 2007 (39%). Likely voters are as negative, with 68 percent expecting bad economic times. In fact, Californians have not been this pessimistic about economic conditions since February 2003 (71% bad times). And the attitude is pervasive: Majorities across all the state’s regions and income levels say troubled economic times are on the way. These financial anxieties have only deepened broader concerns about the future: Half of Californians (52%) today believe the state is generally headed in the wrong direction—a 15-point jump since January (37%).
IN THE DUMPS OVER HOUSING SLUMP AND OTHER ECONOMIC ISSUES
Why the dark mood? Spillover from the sub-prime mortgage crisis certainly has people edgy: About half of adult residents think the current housing situation in California will hurt their own financial circumstances a great deal (28%) or somewhat (24%). Renters (62%) are far more likely than homeowners (46%) to say the housing situation will affect their own finances. “This is an early warning of widespread fallout from the housing market crisis,” says PPIC president and CEO Mark Baldassare. “Renters are among the most vulnerable to economic shocks.” Reinforcing this point, Latinos (73%) and those with household incomes under $40,000 (63%) are much more likely than whites (41%) and those with incomes over $80,000 (46%) to expect the housing situation to have an effect on their own pocketbooks.
Not surprisingly, given the growing worries about everything from mortgage rates to housing prices, the percentage of Californians who name housing as the most important issue facing the state has grown, doubling from 4 percent in June to 8 percent today. In January, housing did not register as an issue. Economic misgivings are also reflected in the top three issues—immigration (18%), jobs and the economy (18%) and health care (10%). Since September, the percentage of state residents citing jobs and the economy as the most important issue has jumped by 5 points (from 13% to 18%). “Anyone who follows politics in California knows that this combination of concern about immigration and escalating economic anxieties makes for a highly charged and unpredictable political atmosphere, especially as we head into an election year,” says Baldassare.
3
Californians and Their Government
BRIGHT SPOT: RATINGS OF GOVERNOR, LEGISLATURE LOOKING UP…
Declining economic confidence is often accompanied by a slide in approval of elected leaders. Surprisingly, the opposite is true today at the state level—ratings for both Governor Arnold Schwarzenegger and the state legislature are up by a respectable margin. Governor Schwarzenegger’s approval rating is up from 50 percent in September to 57 percent today. Among likely voters, his support is up from 59 percent in September to 63 percent today. Although approval ratings for the state legislature continue to lag the governor’s, they have also risen by 7 points since September among state residents (from 34% to 41%) and 6 points among likely voters (from 29% to 35%). Californians’ ratings of their particular representatives in the state legislature took a double-digit leap: 51 percent of state residents now approve of the job performance of their own assemblymember or senator, compared to 41 percent in September.
Why are state residents upbeat about their state leaders despite their grim economic view? One reason may be the ongoing special legislative session on health care—one of the key issues for Californians. As the governor and legislature try to address the issue of providing health care to all Californians, an overwhelming majority of adult residents (92%) think the number of people without health insurance is a problem in the state. Most state residents (71%) and likely voters (63%) say they favor the current proposal to require all Californians to have some form of health insurance coverage, with costs shared by employers, health care providers, and individuals. Democrats (76%) and independents (71%) are more likely than Republicans (50%) to favor such a plan. As for the specifics, majorities of state residents continue to think it is a good idea to require health insurance for all California residents, with public programs for low-income people (75%), and to require employers to provide health insurance for employees or pay fees to the state to help cover health care costs (75%). They remain less enamored of a requirement that hospitals pay a fee to the state to help cover the costs of health care (47%).
…BUT HOW LONG WILL IT LAST?
“Californians are clearly holding out hope that their elected leaders can make good on their promise to provide health care reform,” says Baldassare. “But if they fail to act on this critical issue, there will be consequences.”
Another possible threat to high approval ratings is a looming budget crisis and how to handle it. The state Legislative Analyst has forecast a multibillion-dollar deficit next fiscal year. Two in three residents (68%) support Governor Schwarzenegger’s recent call for a 10 percent cut in spending by state agencies. A sizeable majority (65%) also oppose the idea of tax increases being included in the governor’s budget. In fact, the percentage saying that tax increases should not be included in the budget has risen 14 points since January 2004 (from 51% to 65%). When asked how they would most prefer to deal with the state’s budget gap, more Californians prefer spending cuts (42%) to a mix of spending cuts and tax increases (36%). The potential for a partisan fight over next year’s budget is great: A majority of Democrats (51%) want to deal with the budget gap through a mix of cuts and taxes while most Republicans (61%) prefer spending cuts.
IS PROPOSITION 93 THE TERM LIMITS REFORM VOTERS ARE LOOKING FOR?
Ratings may be up, but one thing remains constant: Californians generally distrust government and see term limits as a check on the system. Two in three likely voters say that term limits are a good thing for the state. This view is shared across the political spectrum, although Republicans (76%) and independents (70%) are more likely than Democrats (54%) to say that term limits are a good thing. Still, despite this steadfast support, most likely voters (69%) also say that the state’s current system of term limits needs major (29%) or minor (40%) reform.
4 PPIC Statewide Survey
Press Release
Proposition 93—the “Limits on Legislators’ Terms in Office Initiative Constitutional Amendment”—is a term limits reform measure on the February statewide ballot. When read the official title and label for this initiative, 47 percent of likely voters say they support the measure, while 38 percent oppose it. Majorities of Republicans (55%) and independents (52%) say they would vote yes on Proposition 93, while Democrats are divided (43% yes, 44% no). Of likely voters who would vote yes on the measure, 81 percent describe term limits as a good thing and only 25 percent believe major changes are needed.
Currently, there is solid support for two of the three key provisions of Proposition 93. Majorities of likely voters like the idea of reducing the total amount of legislative service from 14 to 12 years (67%) and allowing that service to take place in the assembly, senate, or a combination of both (58%). However, likely voters are divided about providing a transition period to allow current legislators to serve 12 years in their current house, regardless of prior service in another house (42% good idea, 46% bad idea).
CAN WE TALK? VOTERS WANT MORE FROM PRESIDENTIAL HOPEFULS ON KEY ISSUES
Besides term limits reform, voters will be choosing among candidates in the presidential primary in February. Where do voters stand today? Among Democratic primary likely voters (Democrats as well as independents who say they will vote the Democratic primary ballot), Senator Hillary Clinton (44%) continues to lead the pack, followed by Senator Barack Obama (20%) and former Senator John Edwards (12%). Among Republican contenders, former New York Mayor Rudy Giuliani remains the frontrunner (24%), followed by former Massachusetts Governor Mitt Romney (15%), former Arkansas Governor Mike Huckabee (12%), Senator John McCain (11%), and former Senator Fred Thompson (10%). The story in the Republican race? Since September, support for Mike Huckabee has jumped 10 points (from 2% to 12%).
Overall, far more Democratic primary likely voters (71%) than Republican likely voters (54%) are satisfied with their choice of candidates. But regardless of party affiliation or ideology, likely voters have one thing in common: They are dissatisfied (58%) with how much attention presidential candidates are paying to the issues that matter to them. Majorities of Democrats (54%), Republicans (57%), liberals (56%), and conservatives (57%) share this view. What are the issues they would most like to hear the candidates talk about? The top mentions are immigration (19%), Iraq (18%), health care (13%), and the economy (10%).
IMMIGRATION ATTITUDES A MIXED BAG
When it comes to immigration policy in the United States, the vast majority of Californians (73%) and likely voters (76%) believe major changes are needed. Most state residents (61%) and half of likely voters (51%) think immigrants are a benefit to California because of their hard work and job skills, while fewer (32% residents, 42% likely voters) say they are a burden because they use public services. The belief that immigrants benefit the state has become more widespread over the past decade (from 46% in April 1998 to 61% today). Consistent with this perspective, most Californians (72%) and likely voters (63%) say that illegal immigrants who have lived and worked in the United States for at least two years should be given a chance to keep their jobs and eventually apply for legal status. But they shouldn’t drive: Half of state residents (52%) and 66 percent of likely voters oppose state legislation allowing illegal immigrants to receive a California driver’s license.
PERSISTENT ANGST OVER IRAQ
The war in Iraq continues to dominate the national landscape and distress the vast majority of Californians: Although seven in 10 state residents say things are not going well for the U.S. in Iraq, that negative view is down 5 points since September (from 74% to 69% today). A majority of state residents (60%) believe the U.S. should bring its troops home as soon as possible, while 35 percent think troops should be kept in Iraq until the situation has stabilized. Likely voters are more divided (50% bring troops
December 2007 5
Californians and Their Government
6 PPIC Statewide Survey
home, 46% keep troops there). And as with all questions related to Iraq, there is a huge partisan divide: Democrats (71%) and independents (57%) want to bring the troops home as soon as possible while Republicans (72%) prefer to keep troops in Iraq until the situation has stabilized. Overall, more Californians feel that victory in Iraq is no longer possible than hold out hope for a positive outcome (59% to 35%).
MORE KEY FINDINGS
Electoral College reform? Yes and no — Page 13 Californians strongly support a long-standing idea to change the way the nation elects its president from the Electoral College system to a direct popular vote. Sixty-five percent of likely voters would support such a change. They are far more tepid about a recent proposal to change presidential elections in California from a winner-take-all system to one where Electoral College votes would be awarded by congressional district. Currently, likely voters are divided about this proposal, with 44 percent saying it is a good idea and 41 percent calling it a bad idea.
Can the government deal with disasters? Sometimes — Page 20 Most Californians rate the government’s handling of recent wildfires in Southern California as excellent (26%) or good (50%). They are far less favorable about the response to the recent oil spill in the San Francisco Bay: Only one in three (33%) give an excellent (4%) or good (29%) rating, and 46 percent view the response as not so good (25%) or poor (21%). Not surprisingly given these results, residents express much more confidence in the government’s readiness to handle wildfires (40% great deal, 43% some) than environmental disasters (16% great deal, 47% some). Republicans are more likely than Democrats and independents to be confident about the government’s ability to respond.
Approval ratings of national leaders: How low can they go? — Page 21 Large majorities of Californians and likely voters (67% each) continue to disapprove of President George W. Bush. Opinions of the U.S. Congress are similarly negative: 62 percent of state residents and 72 percent of likely voters disapprove of its performance.
Year of Education? Maybe not — Page 27 Despite the governor’s much-publicized declaration that 2008 would be the Year of Education Reform, Californians appear to have other priorities. Only 7 percent of state residents name education as their most important issue, down from 18 percent in January.
ABOUT THE SURVEY
This edition of the PPIC Statewide Survey is part of the Californians and Their Government series and is supported by funding from The James Irvine Foundation. The survey is intended to raise public awareness, inform decisionmakers, and stimulate public discussions about the social, economic, and political trends that influence Californians’ public policy preferences and ballot choices. Findings are based on a telephone survey of 2,002 California adult residents interviewed between November 27 and December 4, 2007. Interviews were conducted in English or Spanish. The sampling error for the total sample is +/- 2% and for the 1,015 likely voters is +/- 3%. The sampling error for the 444 Democratic presidential primary likely voters and the 346 Republican presidential primary likely voters is +/- 5%. For more information on methodology, see page 25.
Mark Baldassare is president and CEO of PPIC, where he holds the Arjay and Frances Fearing Miller Chair in Public Policy. He is founder of the PPIC Statewide Survey, which he has directed since 1998.
PPIC is a private, nonprofit organization dedicated to informing and improving public policy in California through independent, objective, nonpartisan research on major economic, social, and political issues. The institute was established in 1994 with an endowment from William R. Hewlett. PPIC does not take or support positions on any ballot measure or on any local, state, or federal legislation, nor does it endorse, support, or oppose any political parties or candidates for public office. ###

FEBRUARY 5TH PRIMARY
10
1819
13
0
10
20
30
Immigration War inIraq
Healthcare
Jobs,economy
Per
cent
like
ly v
oter
s
One Issue Voters Would Most Like Presidential Candidates to Discuss
67
49
65 6367
68 66
19 17 20 18 18 16 150
20
40
60
80
100
Oct 1
998
Dec 2
001
Sep 2
004
Oct 2
005
May
200
6
Mar
2007
Dec 2
007
Per
cent
like
ly v
oter
sGood thing for California
Bad thing for California
Perceptions of Existing Legislative Term Limits
26
52
19
3
Very closely
Fairly closely
Not too closely
Not at all closely
How Closely Voters Are Following News About Presidential Candidates
Likely voters
KEY FINDINGS
Likely voters are dissatisfied with the presidential candidates’ attention to issues important to them. They are most interested in hearing about immigration, Iraq, health care, and the economy. Hillary Clinton and Rudy Giuliani continue to hold leads in their respective presidential primaries. (pages 8,9)
Nearly half of likely voters (47%) support Proposition 93. Of the three components of this term-limits initiative, the proposal to reduce total time in office has the strongest support. Two in three say existing term limits are a good thing in California, while seven in 10 think they are in need of major (29%) or minor changes (40%). (pages 10-12)
California’s likely voters are divided over a proposed change to the way that Electoral College votes are allocated in California (44% good idea, 41% bad idea). Meanwhile, a solid majority of likely voters (65%) would support changing the national system so that the president is elected by direct popular vote. (page 13)
Forty-five percent of likely voters think it was a good idea for the governor and legislature to move the 2008 presidential primary from June to February. And 44 percent think it is a good thing to hold three elections in 2008 – the February presidential primary, the June primary, and the November general election. There is significant interest in the upcoming February 5th primary, with nearly eight in 10 likely voters saying they are very or fairly closely following news about the presidential candidates. (page 14)
7

Californians and Their Government
2008 PRESIDENTIAL PRIMARY ELECTION
When asked what one issue they would most like to hear the candidates talk about, the four that receive top mention among likely voters are immigration (19%), the war in Iraq (18%), health care (13%), and the economy (10%). Nationally, Iraq (26%) and health care (25%) top the list, according to a recent CBS News poll. Strong majorities of California likely voters across party lines and political ideology are dissatisfied with the amount of attention candidates are paying to the issues most important to them.
“Would you say you are satisfied or dissatisfied with the amount of attention that the candidates for president are spending on the issues most important to you?”
Party Ideology Gender Likely voters only
All Likely Voters Dem Rep Liberal Conservative Men Women
Satisfied 33% 37% 33% 37% 32% 32% 33%
Dissatisfied 58 54 57 56 57 61 55
Don't know 9 9 10 7 11 7 12
With the presidential primary just two months away, how are the candidates faring with the state’s likely voters?
Among likely voters in the Democratic primary (which includes Democrats as well as independents who say they will vote in the Democratic primary), Sen. Hillary Clinton (44%) continues to lead all candidates, followed by Sen. Barack Obama (20%) and former Sen. John Edwards (12%). Eleven percent would vote for another candidate, and 13 percent are undecided. Clinton is the leading candidate among liberals (41%) and other ideologies (46%) and among women (49%) and men (36%).
Democratic primary voters’ preferences today are similar to their preferences in September (41% Clinton, 23% Obama, 14% Edwards) and have not shifted much since June (41% Clinton, 25% Obama, 12% Edwards).
Preferences among California’s Democratic likely voters are similar to those of Democrats nationwide, according to a recent Los Angeles Times/Bloomberg poll conducted earlier this month (45% Clinton, 21% Obama, 11% Edwards).
“If the Democratic primary for president were being held today and these were the candidates, who would you vote for?”
Ideology Gender Democratic primary likely voters only Likely Voters
Liberal Other Men Women
Hillary Clinton 44% 41% 46% 36% 49%
Barack Obama 20 25 15 23 19
John Edwards 12 16 7 14 10
Joe Biden 3 2 5 4 3
Dennis Kucinich 3 5 1 2 3
Bill Richardson 3 3 4 6 1
Chris Dodd - - 1 1 -
Mike Gravel - - - - 1
Someone else 2 - 4 2 2
Don't know 13 8 17 12 12
8 PPIC Statewide Survey

February 5th Primary
2008 PRESIDENTIAL PRIMARY ELECTION (CONTINUED)
Among likely voters in the Republican primary, which includes only Republicans (independents are not allowed to vote in this primary), former New York City Mayor Rudy Giuliani (24%) continues to hold the lead. Former Massachusetts Gov. Mitt Romney (15%), former Arkansas Gov. Mike Huckabee (12%), Sen. John McCain (11%) and former Sen. Fred Thompson (10%) are clustered in a second tier, while 11 percent of likely voters say they would vote for someone else and 17 percent are undecided.
Giuliani is the leading candidate among conservatives (26%) and among both women (25%) and men (23%); McCain leads among Republicans who do not self-identify as conservatives (19%). One in five women (21%) are undecided, while only 14 percent of men say they are.
Since September, Huckabee has gained 10 points among likely voters in the Republican primary (2% to 12%), while preferences for Giuliani (22% to 24%) and Romney (16% to 15%) have remained constant.
According to the LA Times/Bloomberg poll, California Republicans (24%) are as likely as Republicans nationwide (23%) to prefer Giuliani, while nationally, Huckabee (17%) and Thompson (14%) remain in a close second position.
“If the Republican primary for president were being held today and these were the candidates, who would you vote for?”
Ideology Gender Republican primary likely voters only Likely Voters
Conservative Other Men Women
Rudy Giuliani 24% 26% 17% 23% 25%
Mitt Romney 15 17 12 14 17
Mike Huckabee 12 13 10 10 15
John McCain 11 8 19 13 8
Fred Thompson 10 11 9 12 8
Duncan Hunter 3 3 2 4 1
Ron Paul 3 3 3 5 1
Tom Tancredo 3 2 5 3 2
Someone else 2 0 6 2 2
Don't know 17 17 17 14 21
Sixty-one percent of likely voters today say they are satisfied with their choice of candidates in the presidential primary, which is similar to satisfaction levels expressed in June (63%) and September (62%). However, satisfaction varies across parties (71% Democrats, 54% Republicans) and ideology (71% liberal, 58% conservative), although not by gender (61% men, 62% women). California Democrats and Republicans are more satisfied with their candidate choices than Democrats (63%) and Republicans (48%) nationwide, according to a similar question in a recent CBS News poll.
“In general, would you say you are satisfied or not satisfied with your choices of candidates in the presidential primary?”
Party Ideology Gender Likely voters only
All Likely Voters Dem Rep Liberal Conservative Men Women
Satisfied 61% 71% 54% 71% 58% 61% 62%
Not satisfied 34 26 41 25 36 36 32
Don't know 5 3 5 4 6 3 6
December 2007 9

Californians and Their Government
PROPOSITION 93-TERM LIMITS
The February state ballot includes Proposition 93, which would reduce the amount of time a state legislator can serve in office from 14 to 12 years, but allow the 12 years to be served in either one house or a combination of both houses. It also contains a provision which would allow current legislators to serve 12 years in their current house regardless of prior service. PPIC asked about this proposition earlier in the year, using different wording in the question. The current survey uses the Secretary of State’s recently posted official title and label – this is the language voters will see on the ballot. Forty-seven percent of likely voters say they would vote yes on Proposition 93, 38 percent would vote no, and 15 percent are undecided.
Republicans (55%) and independents (52%) are more supportive of Proposition 93 than Democrats (43%). Across the state’s regions, likely voters in the Central Valley (53%) are the most likely to vote yes on Proposition 93, followed by the Other Southern California region (48%), the San Francisco Bay Area (47%), and Los Angeles (44%). Support for the proposition is higher among men than women (51% to 44%), but similar between Latinos (48%) and whites (49%). Support is higher among likely voters with a household income of more than $40,000 than those with lower incomes.
“Proposition 93 is called the ‘Limits on Legislators’ Terms in Office Initiative Constitutional Amendment.’ It reduces permissible state legislative service to 12 years. It allows 12 years’ service in one house. Current legislators can serve 12 years in current house, regardless of prior legislative service. There
would be no direct fiscal effect on state or local governments. If the election were held today would you vote yes or no on Proposition 93?”
Likely voters only Yes No Don't know
All likely voters 47% 38% 15%
Democrat 43 44 13
Republican 55 34 11 Party
Independent 52 32 16
Central Valley 53 36 11
San Francisco Bay Area 47 40 13
Los Angeles 44 42 14 Region
Other Southern California 48 36 16
Men 51 39 10 Gender
Women 44 38 18
Latino 48 42 10 Race/Ethnicity
White 49 36 15
18 to 34 44 49 7
35 to 54 48 38 14 Age
55 and older 48 35 17
HS or less 47 39 14
Some college 53 36 11 Education
College graduate 44 40 16
Under $40,000 40 40 20
$40,000 to $79,999 51 36 13 Income
$80,000 and over 49 38 13
10 PPIC Statewide Survey

February 5th Primary
PROPOSITION 93-TERM LIMITS (CONTINUED)
In our May survey, we used the proposition’s provisional title and summary from the Secretary of State. We found that 53 percent of likely voters said they would vote yes. By September, the proposition had qualified for the ballot and the PPIC Statewide Survey that month again used the title and summary and found similar results: 55 percent said they would vote yes. Unlike the ballot label, the summary statement specifically mentions that the total time in office is reduced from 14 to 12 years.
To better understand voters’ views on the various provisions of Proposition 93, we asked three follow-up questions. A strong majority of likely voters (67%) believe that reducing the total amount of legislative service from 14 to 12 years is a good idea, while a smaller majority of likely voters (58%) also believe that allowing 12 years of service in either the assembly or senate or a combination of both is a good idea. Likely voters are divided when asked about providing a transition period to allow current legislators to serve 12 years in their current house, regardless of prior service in another house (42% good idea, 46% bad idea).
“The proposed ‘Limits on Legislators’ Terms in Office Initiative Constitutional Amendment’ would alter current term limits in a number of ways. For each of the following please
tell me if you think this provision is a good idea or a bad idea. How about…”
Party Likely voters only
All Likely Voters Dem Rep Ind
Good idea 67% 61% 75% 70%
Bad idea 26 32 19 24 …reducing the total amount of time a person may serve in the state legislature from 14 years to 12 years?
Don't know 7 7 6 6
Good idea 58 52 60 72
Bad idea 34 38 33 23 …allowing a person to serve a total of 12 years either in the assembly, the senate, or a combination of both?
Don't know 8 10 7 5
Good idea 42 45 34 49
Bad idea 46 42 56 39
… providing a transition period to allow current members to serve a total of 12 consecutive years in the house in which they are currently serving, regardless of any prior service in another house? Don't know 12 13 10 12
Across parties, Republicans are the most likely to say that reducing total service from 14 to 12 years is a good idea (75% Republicans, 70% independents, 61% Democrats). Independents are the most likely to say allowing 12 years of service in one house or as a combination in both houses is a good idea (72% independents, 60% Republicans, 52% Democrats). Republicans are the least likely to call the transition period for current members a good idea (34% Republicans, 45% Democrats, 49% independents).
Of likely voters who would vote yes on Proposition 93, 86 percent say reducing service from 14 to 12 years is a good idea, and 75 percent say allowing 12 years in one or both houses is a good idea. However, these “yes” voters are divided on whether the transition period is a good idea (47% good idea, 46% bad idea).
December 2007 11

Californians and Their Government
LEGISLATIVE TERM LIMITS
California voters passed Proposition 140 in 1990, which established the current terms limits under which the state legislature operates. It allows for up to eight years in the state senate (two four-year terms) and up to six years in the state assembly (three two-year terms). When asked whether term limits are a good thing or a bad thing for California, a strong majority of likely voters (66%) say term limits are a good thing. Similarly high percentages of likely voters have expressed this viewpoint in previous PPIC Statewide Surveys, dating back to October 1998, with the sole exception of December 2001 (49% good thing).
Among likely voters across political parties today, 76 percent of Republicans and 70 percent of independents express positive views about term limits, while only 54 percent of Democrats think that term limits are a good thing. A solid majority of likely voters across demographic groups and throughout the state’s regions consider term limits a good thing, including 62 percent of Latinos, 67 percent of whites, and at least six in 10 in the Other Southern California region (74%), the Central Valley (67%), the San Francisco Bay Area (64%), and Los Angeles (61%).
Of likely voters who would vote yes on Proposition 93, 81 percent say term limits are a good thing; of those who would vote no, only 50 percent believe term limits are a good thing.
“Do you think that term limits are a good thing or a bad thing for California, or do they make no difference?”
Party Proposition 93 Likely voters only Likely Voters
Dem Rep Ind Yes No
Good thing 66% 54% 76% 70% 81% 50%
Bad thing 15 24 9 11 6 27
No difference 15 18 13 16 11 20
Don't know 4 4 2 3 2 3
Despite their positive opinions on term limits, most likely voters (69%) believe term limits need major (29%) or minor (40%) changes, which is similar to the views expressed in September (64% changes needed—32% major, 32% minor). More Democratic voters (35%) than Republicans (27%) or independents (20%) say major changes are needed, while more Republicans (31%) than Democrats (21%) or independents (19%) say term limits are fine the way they are. Across regions and demographic groups, fewer than three in 10 say term limits are fine the way they are, with pluralities in most groups saying that at least minor changes are needed.
Among the likely voters who would vote yes on Proposition 93, just 25 percent believe major changes are needed, while 48 percent say that minor changes are needed; of those who would vote no, 36 percent say that major changes are needed, while 32 percent say that only minor changes are required.
“Do you think that the current term limits in California are in need of major changes, minor changes, or are they fine the way they are?”
Party Proposition 93 Likely voters only Likely Voters
Dem Rep Ind Yes No
Major changes 29% 35% 27% 20% 25% 36%
Minor changes 40 36 37 52 48 32
Fine the way they are 24 21 31 19 21 29
Don't know 7 8 5 9 6 3
12 PPIC Statewide Survey
February 5th Primary
ELECTORAL COLLEGE
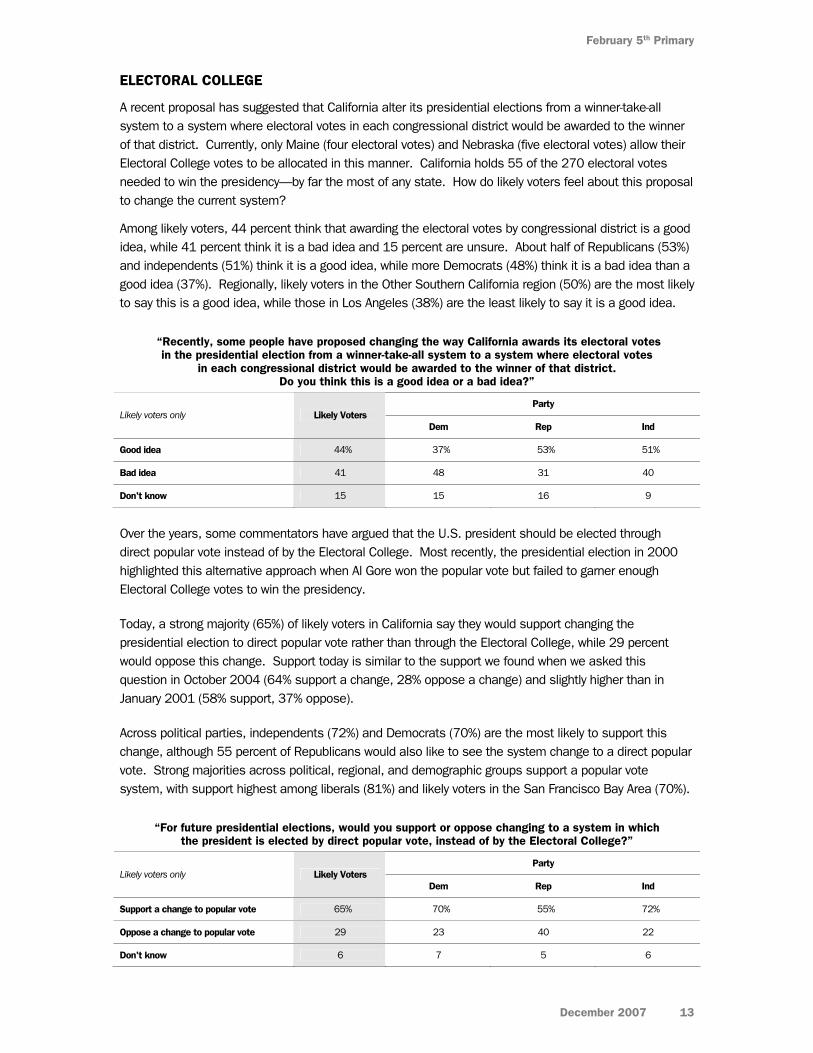
A recent proposal has suggested that California alter its presidential elections from a winner-take-all system to a system where electoral votes in each congressional district would be awarded to the winner of that district. Currently, only Maine (four electoral votes) and Nebraska (five electoral votes) allow their Electoral College votes to be allocated in this manner. California holds 55 of the 270 electoral votes needed to win the presidency—by far the most of any state. How do likely voters feel about this proposal to change the current system?
Among likely voters, 44 percent think that awarding the electoral votes by congressional district is a good idea, while 41 percent think it is a bad idea and 15 percent are unsure. About half of Republicans (53%) and independents (51%) think it is a good idea, while more Democrats (48%) think it is a bad idea than a good idea (37%). Regionally, likely voters in the Other Southern California region (50%) are the most likely to say this is a good idea, while those in Los Angeles (38%) are the least likely to say it is a good idea.
“Recently, some people have proposed changing the way California awards its electoral votes in the presidential election from a winner-take-all system to a system where electoral votes
in each congressional district would be awarded to the winner of that district. Do you think this is a good idea or a bad idea?”
Party Likely voters only Likely Voters
Dem Rep Ind
Good idea 44% 37% 53% 51%
Bad idea 41 48 31 40
Don't know 15 15 16 9
Over the years, some commentators have argued that the U.S. president should be elected through direct popular vote instead of by the Electoral College. Most recently, the presidential election in 2000 highlighted this alternative approach when Al Gore won the popular vote but failed to garner enough Electoral College votes to win the presidency.
Today, a strong majority (65%) of likely voters in California say they would support changing the presidential election to direct popular vote rather than through the Electoral College, while 29 percent would oppose this change. Support today is similar to the support we found when we asked this question in October 2004 (64% support a change, 28% oppose a change) and slightly higher than in January 2001 (58% support, 37% oppose).
Across political parties, independents (72%) and Democrats (70%) are the most likely to support this change, although 55 percent of Republicans would also like to see the system change to a direct popular vote. Strong majorities across political, regional, and demographic groups support a popular vote system, with support highest among liberals (81%) and likely voters in the San Francisco Bay Area (70%).
“For future presidential elections, would you support or oppose changing to a system in which the president is elected by direct popular vote, instead of by the Electoral College?”
Party Likely voters only Likely Voters
Dem Rep Ind
Support a change to popular vote 65% 70% 55% 72%
Oppose a change to popular vote 29 23 40 22
Don't know 6 7 5 6
December 2007 13
Californians and Their Government
14 PPIC Statewide Survey
CALIFORNIA ELECTIONS IN 2008
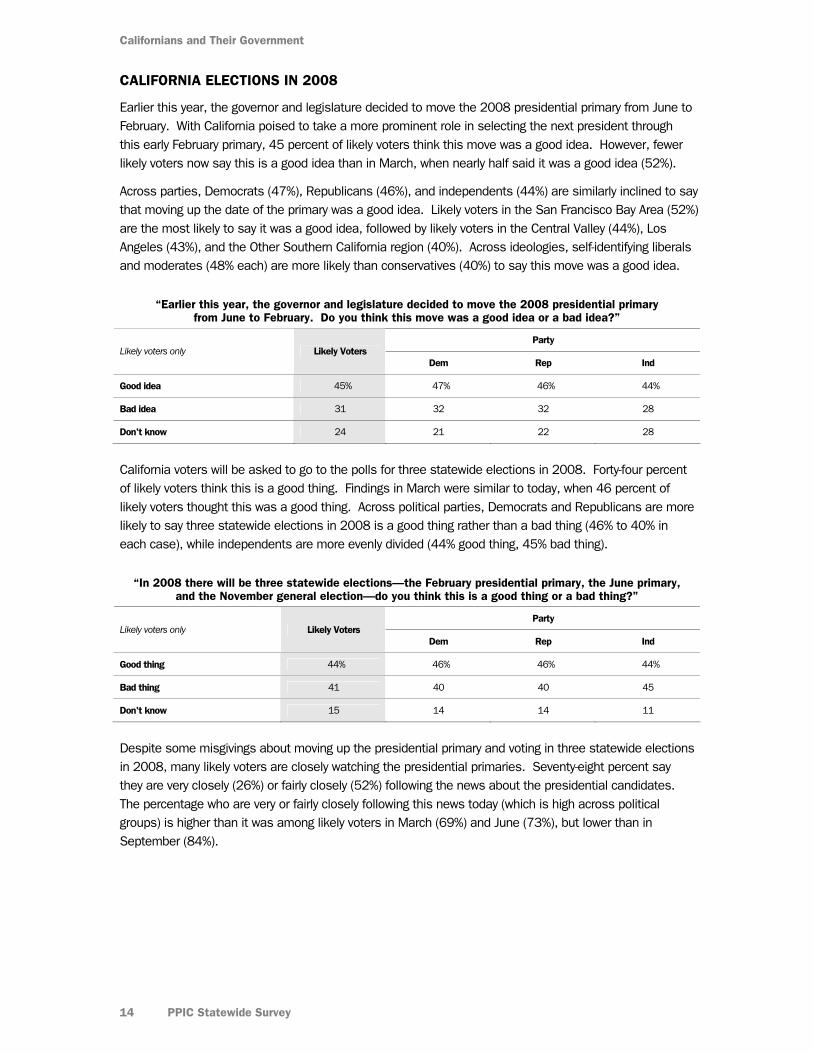
Earlier this year, the governor and legislature decided to move the 2008 presidential primary from June to February. With California poised to take a more prominent role in selecting the next president through this early February primary, 45 percent of likely voters think this move was a good idea. However, fewer likely voters now say this is a good idea than in March, when nearly half said it was a good idea (52%).
Across parties, Democrats (47%), Republicans (46%), and independents (44%) are similarly inclined to say that moving up the date of the primary was a good idea. Likely voters in the San Francisco Bay Area (52%) are the most likely to say it was a good idea, followed by likely voters in the Central Valley (44%), Los Angeles (43%), and the Other Southern California region (40%). Across ideologies, self-identifying liberals and moderates (48% each) are more likely than conservatives (40%) to say this move was a good idea.
“Earlier this year, the governor and legislature decided to move the 2008 presidential primary from June to February. Do you think this move was a good idea or a bad idea?”
Party Likely voters only Likely Voters
Dem Rep Ind
Good idea 45% 47% 46% 44%
Bad idea 31 32 32 28
Don't know 24 21 22 28
California voters will be asked to go to the polls for three statewide elections in 2008. Forty-four percent of likely voters think this is a good thing. Findings in March were similar to today, when 46 percent of likely voters thought this was a good thing. Across political parties, Democrats and Republicans are more likely to say three statewide elections in 2008 is a good thing rather than a bad thing (46% to 40% in each case), while independents are more evenly divided (44% good thing, 45% bad thing).
“In 2008 there will be three statewide elections—the February presidential primary, the June primary, and the November general election—do you think this is a good thing or a bad thing?”
Party Likely voters only Likely Voters
Dem Rep Ind
Good thing 44% 46% 46% 44%
Bad thing 41 40 40 45
Don't know 15 14 14 11
Despite some misgivings about moving up the presidential primary and voting in three statewide elections in 2008, many likely voters are closely watching the presidential primaries. Seventy-eight percent say they are very closely (26%) or fairly closely (52%) following the news about the presidential candidates. The percentage who are very or fairly closely following this news today (which is high across political groups) is higher than it was among likely voters in March (69%) and June (73%), but lower than in September (84%).

STATE AND NATIONAL ISSUES
KEY FINDINGS
Most Californians have a negative outlook on the direction of the state (52%) and the economy (65%) for the next year, and on the impact of the current housing situation on their own finances (52%). Immigration, the economy, health care, and housing top the list of issues residents say are most important now. (page 16)
A solid majority of Californians approve of the governor’s job performance (57%), but fewer offer positive assessments of the state legislature overall (41%) or their own elected representatives (51%). (page 17)
Most Californians continue to believe that the number of people without health insurance is a big problem (76%). Seven in 10 still support a legislative proposal to expand health coverage. (page 18)
Likely voters are divided when asked how to deal with the state’s impending multi-billion dollar budget deficit, with 43 percent supporting spending cuts and 41 percent preferring a mix of spending cuts and tax increases. (page 19)
Only 33 percent rate the government’s handling of the recent San Francisco Bay oil spill as excellent or good, while 76 percent hold that opinion of its handling of wildfires in Southern California. Few residents (16%) have a great deal of confidence in the government’s ability to respond to environmental disasters. (page 20)
More than six in 10 Californians disapprove of President Bush and the U.S. Congress, and six in 10 say the U.S. goal of achieving victory in Iraq is not possible. More than seven in 10 say immigration policies need change and favor a path to citizenship for working illegal immigrants. (pages 21-23)
18 18
10
8
0
10
20
Immigration Jobs,economy
Healthcare
Housing
Per
cent
all
adul
ts
Most Important Issue Facing California
58
364040
6064
5953
57
40
262926
374036 4137
0
20
40
60
80
100
Jan
2004
May
200
4
Jan
2005
May
200
5
Jan
2006
May
200
6
Jan
2007
May
200
7
Dec 2
007
Per
cent
all
adul
ts
Governor
Legislature
Approval Ratings of State Elected Officials
Percent who approve
42
35 3733 33 31
42
2936 34 33
28 27 29
0
20
40
60
80
Oct 2
005
Mar
2006
Sep 2
006
Jan
2007
Jun
2007
Sep 2
007
Dec 2
007
Per
cent
all
adul
ts
U.S. Congress
President Bush
Approval Ratings of Federal Elected Officials
Percent who approve
15
Californians and Their Government
OVERALL MOOD
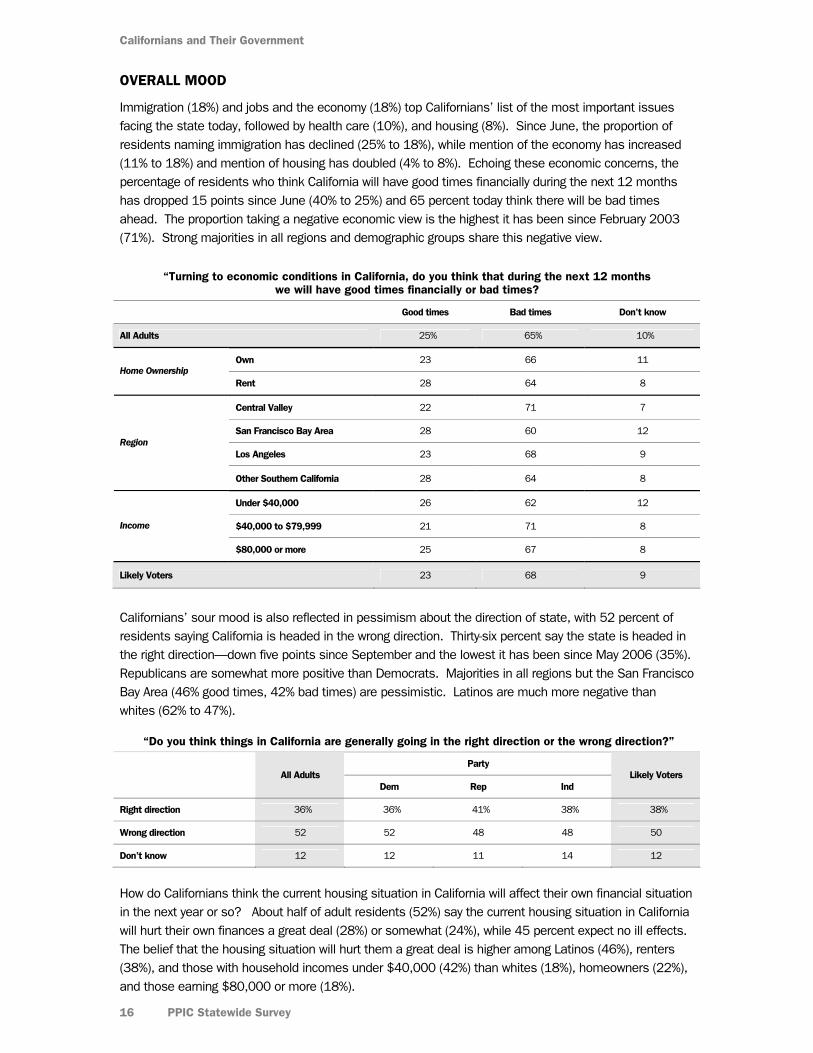
Immigration (18%) and jobs and the economy (18%) top Californians’ list of the most important issues facing the state today, followed by health care (10%), and housing (8%). Since June, the proportion of residents naming immigration has declined (25% to 18%), while mention of the economy has increased (11% to 18%) and mention of housing has doubled (4% to 8%). Echoing these economic concerns, the percentage of residents who think California will have good times financially during the next 12 months has dropped 15 points since June (40% to 25%) and 65 percent today think there will be bad times ahead. The proportion taking a negative economic view is the highest it has been since February 2003 (71%). Strong majorities in all regions and demographic groups share this negative view.
“Turning to economic conditions in California, do you think that during the next 12 months we will have good times financially or bad times?
Good times Bad times Don't know
All Adults 25% 65% 10%
Own 23 66 11 Home Ownership
Rent 28 64 8
Central Valley 22 71 7
San Francisco Bay Area 28 60 12
Los Angeles 23 68 9 Region
Other Southern California 28 64 8
Under $40,000 26 62 12
$40,000 to $79,999 21 71 8 Income
$80,000 or more 25 67 8
Likely Voters 23 68 9
Californians’ sour mood is also reflected in pessimism about the direction of state, with 52 percent of residents saying California is headed in the wrong direction. Thirty-six percent say the state is headed in the right direction—down five points since September and the lowest it has been since May 2006 (35%). Republicans are somewhat more positive than Democrats. Majorities in all regions but the San Francisco Bay Area (46% good times, 42% bad times) are pessimistic. Latinos are much more negative than whites (62% to 47%).
“Do you think things in California are generally going in the right direction or the wrong direction?”
Party All Adults
Dem Rep Ind Likely Voters
Right direction 36% 36% 41% 38% 38%
Wrong direction 52 52 48 48 50
Don’t know 12 12 11 14 12
How do Californians think the current housing situation in California will affect their own financial situation in the next year or so? About half of adult residents (52%) say the current housing situation in California will hurt their own finances a great deal (28%) or somewhat (24%), while 45 percent expect no ill effects. The belief that the housing situation will hurt them a great deal is higher among Latinos (46%), renters (38%), and those with household incomes under $40,000 (42%) than whites (18%), homeowners (22%), and those earning $80,000 or more (18%).
16 PPIC Statewide Survey
State and National Issues
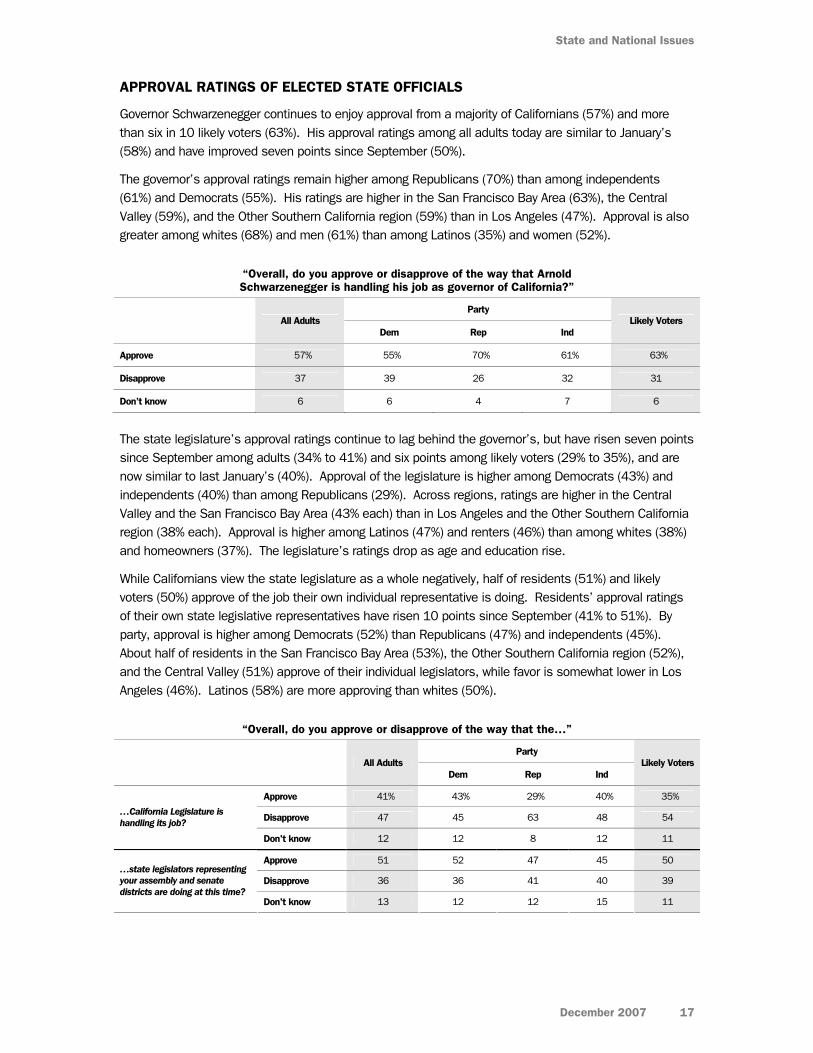
APPROVAL RATINGS OF ELECTED STATE OFFICIALS
Governor Schwarzenegger continues to enjoy approval from a majority of Californians (57%) and more than six in 10 likely voters (63%). His approval ratings among all adults today are similar to January’s (58%) and have improved seven points since September (50%).
The governor’s approval ratings remain higher among Republicans (70%) than among independents (61%) and Democrats (55%). His ratings are higher in the San Francisco Bay Area (63%), the Central Valley (59%), and the Other Southern California region (59%) than in Los Angeles (47%). Approval is also greater among whites (68%) and men (61%) than among Latinos (35%) and women (52%).
“Overall, do you approve or disapprove of the way that Arnold Schwarzenegger is handling his job as governor of California?”
Party All Adults
Dem Rep Ind Likely Voters
Approve 57% 55% 70% 61% 63%
Disapprove 37 39 26 32 31
Don’t know 6 6 4 7 6
The state legislature’s approval ratings continue to lag behind the governor’s, but have risen seven points since September among adults (34% to 41%) and six points among likely voters (29% to 35%), and are now similar to last January’s (40%). Approval of the legislature is higher among Democrats (43%) and independents (40%) than among Republicans (29%). Across regions, ratings are higher in the Central Valley and the San Francisco Bay Area (43% each) than in Los Angeles and the Other Southern California region (38% each). Approval is higher among Latinos (47%) and renters (46%) than among whites (38%) and homeowners (37%). The legislature’s ratings drop as age and education rise.
While Californians view the state legislature as a whole negatively, half of residents (51%) and likely voters (50%) approve of the job their own individual representative is doing. Residents’ approval ratings of their own state legislative representatives have risen 10 points since September (41% to 51%). By party, approval is higher among Democrats (52%) than Republicans (47%) and independents (45%). About half of residents in the San Francisco Bay Area (53%), the Other Southern California region (52%), and the Central Valley (51%) approve of their individual legislators, while favor is somewhat lower in Los Angeles (46%). Latinos (58%) are more approving than whites (50%).
“Overall, do you approve or disapprove of the way that the…”
Party All Adults
Dem Rep Ind Likely Voters
Approve 41% 43% 29% 40% 35%
Disapprove 47 45 63 48 54 …California Legislature is handling its job?
Don't know 12 12 8 12 11
Approve 51 52 47 45 50
Disapprove 36 36 41 40 39 …state legislators representing your assembly and senate districts are doing at this time?
Don't know 13 12 12 15 11
December 2007 17

Californians and Their Government
HEALTH CARE REFORM
As the governor and the legislature try to address the issue of providing health care to all Californians, an overwhelming majority (92%) of residents and likely voters (93%) think the number of people without health insurance is a big (76%) or somewhat of a problem (16%) in the state.
The legislature is currently considering a proposal that would require all Californians to have some form of health insurance coverage. Most adults (71%) and likely voters (63%) say they favor requiring coverage, with costs shared by employers, health care providers, and individuals. Support for this health coverage proposal has remained at this high level since January.
Today, Democrats (76%) and independents (71%) are more likely than Republicans (50%) to favor this plan, while support is strong across demographic groups.
“Would you favor or oppose a plan requiring all Californians to have health insurance, with costs shared by employers, health care providers, and individuals?”
Party All Adults
Dem Rep Ind Likely Voters
Favor 71% 76% 50% 71% 63%
Oppose 24 19 42 23 31
Don’t know 5 5 8 6 6
As for specific details of health care reform, strong majorities of adults (75%) and likely voters (65%) think it is a good idea to require all Californians to have health insurance and to provide public programs for low-income people. Republicans (52%) are less likely than independents (71%) and Democrats (80%) to think this is a good idea. Similarly, strong majorities of adults (75%) and likely voters (67%) say it is a good idea to require employers to provide health insurance for employees or pay a fee to the state to help cover heath care costs. Republicans (56%) are less likely than independents (70%) and Democrats (82%) to like this idea. Support declines, however, for requiring hospitals to pay fees to the state to help cover the costs of health care. Fewer than half of Californians (47%) and likely voters (33%) say this is a good idea. Once again, Republicans (25%) are less likely than independents (42%) and Democrats (47%) to support this idea. When almost identical questions were asked in March, views were very similar.
“Please tell me if each of the following ideas to reform health care in California is a good idea or a bad idea…”
Party All Adults
Dem Rep Ind
Likely Voters
Good idea 75% 80% 52% 71% 65%
Bad idea 22 15 44 25 30
All California residents should be required to have health insurance, with public programs available for low-income persons. Don't know 3 5 4 4 5
Good idea 75 82 56 70 67
Bad idea 21 15 40 26 29
Employers should be required to provide health insurance for their employees or pay a fee to the state to help cover the costs of health care. Don't know 4 3 4 4 4
Good idea 47 47 25 42 33
Bad idea 45 43 69 50 58
Hospitals should be required to pay a fee to the state to help cover the costs of health care.
Don't know 8 10 6 8 9
18 PPIC Statewide Survey

State and National Issues
BUDGET DEFICIT
With the state facing a potential multi-billion dollar deficit next year, how do Californians view potential methods to address the shortfall? Two in three residents (68%) and three in four likely voters (73%) think it’s a good idea that Governor Schwarzenegger recently told state agency leaders to prepare budgets that cut their spending by 10 percent. Support is high in all political parties, but is much stronger among Republicans (88%) than among independents (71%) and Democrats (61%).
More than six in 10 in all regions think a 10 percent budget cut across all state agencies is a good idea, with support highest in the Central Valley (72%) and the Other Southern California region (71%). Whites (76%) and men (72%) are more likely than Latinos (56%) and women (64%) to say this plan is a good idea. Percentages favoring such cuts across state agencies increase as age, education, and income levels increase. Homeowners (73%) are more likely than renters (61%) to hold this view.
“With the state facing a potential multi-billion dollar deficit next year, Governor Schwarzenegger recently informed state agency leaders to prepare budgets
that cut their spending by 10 percent. Do you think this is a good idea or a bad idea?”
Party All Adults
Dem Rep Ind Likely Voters
Good idea 68% 61% 88% 71% 73%
Bad idea 27 33 9 24 23
Don’t know 5 6 3 5 4
As for the prospect of including tax increases in the governor’s budget plan, only three in 10 residents (30%) and likely voters (32%) are in favor. Support falls below 40 percent across political parties, regions, and demographic groups. Support for tax increases is higher among Democrats (38%), while only 20 percent of Republicans and 29 percent of independents agree. The percentage saying that tax increases should not be included in the budget has risen 14 points since January 2004 (51% to 65%).
Still, when asked how they would most prefer to deal with the state’s budget gap, four in 10 Californians (42%) say mostly through spending cuts, while 36 percent opt for a mix of spending cuts and tax increases. Far fewer say mostly through tax increases (7%) or that it is okay for the state to borrow money and run a budget deficit (7%). Democrats (51%) are most likely to say a mix of spending cuts and tax increases should be used, while Republicans (61%) are most likely to want spending cuts, and independents are divided (41% mix, 40% spending cuts). Across regions, residents of the San Francisco Bay Area prefer a mix of spending cuts and tax increases, while residents of the state’s other regions prefer spending cuts. The number of residents wanting to solve the budget gap with spending cuts alone has risen 13 points since we last asked this question in May 2005 (29%).
“How would you prefer to deal with the state's budget gap?”
Party
All Adults Dem Rep Ind
Likely Voters
Mostly through spending cuts 42% 29% 61% 40% 43%
Mostly through tax increases 7 8 4 7 5
Through a mix of spending cuts and tax increases
36 51 25 41 41
Okay for the state to borrow money and run a budget deficit
7 5 4 5 4
Other (volunteered) 3 2 4 3 3
Don’t know 5 5 2 4 4
December 2007 19

Californians and Their Government
CALIFORNIA DISASTERS
In the wake of the recent oil spill in San Francisco Bay and the wildfires in Southern California, how do Californians rate the government’s handling of these situations? That depends on the disaster.
When asked how they would rate the government’s handling of the oil spill in San Francisco Bay, one in three Californians give an excellent (4%) or good (29%) rating, while 46 percent say not so good (25%) or poor (21%), and 21 percent are unsure. Residents living closest to the spill are the most likely to have an opinion and to be the most critical, with 58 percent in the San Francisco Bay Area giving not so good (33%) or poor (25%) ratings. Democrats are also more negative, with 53 percent rating the response as not so good (28%) or poor (25%).
“Please tell me how you would rate the government’s handling of the recent oil spill in the San Francisco Bay?”
Region All Adults
Central Valley San Francisco Bay Area Los Angeles Other Southern
California
Likely Voters
Excellent 4% 5% 5% 3% 3% 5%
Good 29 33 31 24 30 31
Not so good 25 22 33 29 19 24
Poor 21 21 25 22 19 21
Don’t know 21 19 6 22 29 19
Californians are much more positive about the government’s handling of the recent wildfires in Southern California. Three in four rate the government’s response as excellent (26%) or good (50%), while one in five say not so good (12%) or poor (7%). Southern California residents are fairly favorable, although Los Angeles residents are somewhat less positive (26% excellent, 45% good) than those in the Other Southern California region (30% excellent, 47% good). Across parties, Republicans give more positive reviews than do Democrats and independents.
“Please tell me how you would rate the government’s handling of the wildfires in Southern California over the last few months?”
Region All Adults
Central Valley San Francisco Bay Area Los Angeles Other Southern
California
Likely Voters
Excellent 26% 28% 16% 26% 30% 29%
Good 50 50 64 45 47 52
Not so good 12 7 10 16 14 10
Poor 7 9 4 8 8 5
Don’t know 5 6 6 5 1 4
We also asked respondents how much confidence they have in the government’s readiness to respond to wildfires and environmental disasters, such as oil spills, in California. Residents are much more confident in the government’s readiness to handle wildfires (40% a great deal, 43% some), than environmental disasters (16% a great deal, 47% some). In both cases, Republicans are more likely than Democrats and independents to express confidence in the government’s ability to respond.
20 PPIC Statewide Survey
State and National Issues
APPROVAL RATINGS OF ELECTED FEDERAL OFFICIALS
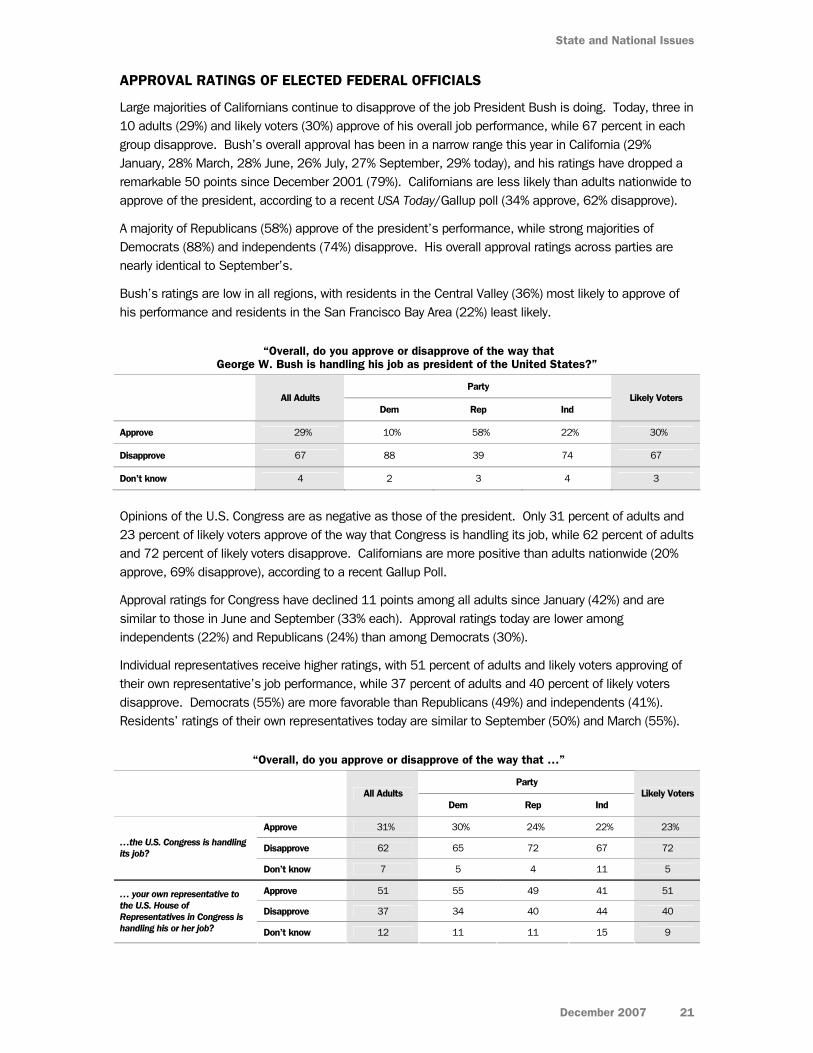
Large majorities of Californians continue to disapprove of the job President Bush is doing. Today, three in 10 adults (29%) and likely voters (30%) approve of his overall job performance, while 67 percent in each group disapprove. Bush’s overall approval has been in a narrow range this year in California (29% January, 28% March, 28% June, 26% July, 27% September, 29% today), and his ratings have dropped a remarkable 50 points since December 2001 (79%). Californians are less likely than adults nationwide to approve of the president, according to a recent USA Today/Gallup poll (34% approve, 62% disapprove).
A majority of Republicans (58%) approve of the president’s performance, while strong majorities of Democrats (88%) and independents (74%) disapprove. His overall approval ratings across parties are nearly identical to September’s.
Bush’s ratings are low in all regions, with residents in the Central Valley (36%) most likely to approve of his performance and residents in the San Francisco Bay Area (22%) least likely.
“Overall, do you approve or disapprove of the way that George W. Bush is handling his job as president of the United States?”
Party All Adults
Dem Rep Ind Likely Voters
Approve 29% 10% 58% 22% 30%
Disapprove 67 88 39 74 67
Don’t know 4 2 3 4 3
Opinions of the U.S. Congress are as negative as those of the president. Only 31 percent of adults and 23 percent of likely voters approve of the way that Congress is handling its job, while 62 percent of adults and 72 percent of likely voters disapprove. Californians are more positive than adults nationwide (20% approve, 69% disapprove), according to a recent Gallup Poll.
Approval ratings for Congress have declined 11 points among all adults since January (42%) and are similar to those in June and September (33% each). Approval ratings today are lower among independents (22%) and Republicans (24%) than among Democrats (30%).
Individual representatives receive higher ratings, with 51 percent of adults and likely voters approving of their own representative’s job performance, while 37 percent of adults and 40 percent of likely voters disapprove. Democrats (55%) are more favorable than Republicans (49%) and independents (41%). Residents’ ratings of their own representatives today are similar to September (50%) and March (55%).
“Overall, do you approve or disapprove of the way that …”
Party All Adults
Dem Rep Ind Likely Voters
Approve 31% 30% 24% 22% 23%
Disapprove 62 65 72 67 72 …the U.S. Congress is handling its job?
Don’t know 7 5 4 11 5
Approve 51 55 49 41 51
Disapprove 37 34 40 44 40
… your own representative to the U.S. House of Representatives in Congress is handling his or her job? Don’t know 12 11 11 15 9
December 2007 21

Californians and Their Government
IMMIGRATION POLICY
When it comes to immigration policy in the United States, the vast majority of residents (73%) believe major changes are needed, and another 18 percent believe minor changes are needed. Findings were nearly identical six months ago when the subject was under debate in the U.S. Congress. More than two in three residents across political, regional, and demographic groups believe major changes are needed.
Most adults (61%) and half of likely voters (51%) believe immigrants are a benefit to California because of their hard work and job skills, while fewer (32% adults, 42% likely voters) believe they are a burden because they use public services. Majorities of Democrats (65%) and independents (58%) believe immigrants benefit California, while 57 percent of Republicans believe they are a burden. The belief among all Californians that immigrants benefit the state has grown steadily since this question was first asked, from 46 percent in April 1998.
One contentious policy issue today is how to handle illegal immigrants who have been living and working in the United States for at least two years. A strong majority of California residents (72%) and 63 percent of likely voters believe these immigrants should be given a chance to keep their jobs and eventually apply for legal status. Twenty-four percent of residents and 32 percent of likely voters believe these immigrants should be deported back to their native countries. Residents’ views were similar in June (74% chance to keep jobs, 23% deported). Today, support for giving working illegal immigrants the chance to keep their jobs and apply for legal status varies across parties (77% Democrats, 66% independents, 51% Republicans (51%), and racial/ethnic groups (92% Latino, 63% whites).
“If you had to choose, what do you think should happen to most illegal immigrants who have lived and worked in the United States for at least two years?”
Party All
Adults Dem Rep Ind Likely Voters
They should be given a chance to keep their jobs and eventually apply for legal status
72% 77% 51% 66% 63%
They should be deported back to their native country 24 19 43 28 32
Don’t know 4 4 6 6 5
On another controversial issue, half of Californians (52%) and two in three likely voters (66%) would oppose state legislation allowing illegal immigrants to get California drivers’ licenses. Residents expressed similar opposition in March (54%). Today, Republicans (82%) are far more likely than independents (59%) or Democrats (51%) to oppose this idea. Opposition increases sharply with age, education, and income. While 84 percent of Latinos and 77 percent of foreign-born residents favor this proposal, 67 percent of whites and 64 percent of U.S.-born residents oppose it. In an October CNN/Opinion Research Corporation survey, 76 percent of adults nationwide said states should not issue drivers’ licenses to illegal immigrants.
“Would you favor or oppose state legislation allowing illegal immigrants to get a California driver's license?”
Party All Adults
Dem Rep Ind Likely Voters
Favor 45% 45% 15% 37% 31%
Oppose 52 51 82 59 66
Don’t know 3 4 3 4 3
22 PPIC Statewide Survey

State and National Issues
December 2007 23
THE WAR IN IRAQ
Seven in 10 residents say things are not going well for the U.S. in Iraq (27% not too well, 42% not at all well). Nearly two in three likely voters hold this view (27% not too, 37% not at all well). Californians appear to be more pessimistic than adults nationwide (29% not too well, 19% not at all well), according to results from a similar question in a November Pew Research Center survey.
Although Californians remain highly negative about the war in Iraq, the proportion saying things are going not at all well has declined six points since September (48%) and 11 points since June (53%). Residents are sharply divided by party, with 56 percent of Democrats and 46 percent of independents saying things are going not at all well, while six in 10 Republicans say things are going very (17%) or somewhat well (44%).
A majority of residents (60%) believe the U.S. should bring its troops home as soon as possible, while 35 percent believe troops should be kept in Iraq until the situation has stabilized. Likely voters are more divided (46% keep troops there, 50% bring troops home). Californians are slightly more likely to support bringing troops home than adults nationwide (54%) according to the Pew Research Center survey.
California Democrats and Republicans are about equally divided on this issue, with 71 percent of Democrats saying troops should be brought home as soon as possible and 72 percent of Republicans wanting the troops to stay until the situation has stabilized. While at least half in all regions and most demographic groups favor bringing the troops home as soon as possible, Latinos are far more likely than whites (84% to 47%) and women are more likely than men (66% to 54%) to hold this view.
“Do you think the U.S. should keep military troops in Iraq until the situation has stabilized, or do you think the U.S. should bring its troops home as soon as possible?”
Party All Adults
Dem Rep Ind Likely Voters
Keep troops in Iraq until the situation has stabilized
35% 24% 72% 38% 46%
Bring its troops home as soon as possible
60 71 25 57 50
Don’t know 5 5 3 5 4
Californians are pessimistic about the war’s outcome: Six in 10 residents and likely voters (59% each) believe the U.S. goal of achieving victory in Iraq is no longer possible. California residents are only somewhat more negative than adults nationwide, 54 percent of whom said victory is not possible in a recent NBC News/Wall Street Journal survey.
Again, opinions divide along party lines, with 79 percent of Democrats saying victory is not possible, and 59 percent of Republicans saying it is. More than half of residents across regions and demographic groups believe victory is impossible for the U.S. in Iraq, but women (66%) and Latinos (65%) are more likely than men (53%) and whites (56%) to hold this view.
“Do you think the U.S. goal of achieving victory in Iraq is still possible, or not?”
Party All Adults
Dem Rep Ind Likely Voters
Still possible 35% 18% 59% 35% 36%
Not still possible 59 79 33 60 59
Don’t know 6 3 8 5 5

REGIONAL MAP
24

METHODOLOGY
The PPIC Statewide Survey is directed by Mark Baldassare, president and CEO and survey director at the Public Policy Institute of California, with assistance in research and writing from Dean Bonner, project manager for this survey, and survey research associates Jennifer Paluch and Sonja Petek. This survey was conducted with funding from The James Irvine Foundation and benefited from discussions with foundation staff, grantees, and policy experts; however, the survey methods, questions, and content of this report were solely determined by Mark Baldassare.
The findings in this report are based on a telephone survey of 2,002 California adult residents interviewed from Nov. 27 to Dec. 4, 2007. Interviewing took place on weekday nights and weekend days, using a computer-generated random sample of telephone numbers that ensured that both listed and unlisted numbers were called. All landline telephone exchanges in California were eligible. Telephone numbers in the survey sample were called up to six times to increase the likelihood of reaching eligible households. Once a household was reached, an adult respondent (age 18 or older) was randomly chosen for interviewing using the “last birthday method” to avoid biases in age and gender. Each interview took an average of 19 minutes to complete. Interviewing was conducted in English or Spanish. Accent on Languages translated the survey into Spanish with assistance from Renatta DeFever. Schulman, Ronca & Bucuvalas, Inc. conducted the telephone interviewing.
We used recent U.S. Census and state data to compare the demographic characteristics of the survey sample with characteristics of California’s adult population. The survey sample was closely comparable to the census and state figures. The survey data in this report were statistically weighted to account for any demographic differences.
The sampling error for the total sample of 2,002 adults is +/- 2 percent at the 95 percent confidence level. This means that 95 times out of 100, the results will be within 2 percentage points of what they would be if all adults in California were interviewed. The sampling error for subgroups is larger: For the 1,442 registered voters, it is +/- 2.5 percent; for the 1,015 likely voters, it is +/- 3 percent; for the 444 Democratic presidential primary likely voters and the 346 Republican presidential primary likely voters, it is +/- 5 percent. Sampling error is only one type of error to which surveys are subject. Results may also be affected by factors such as question wording, question order, and survey timing.
We present results for four geographic regions, accounting for approximately 90 percent of the state population. “Central Valley” includes Butte, Colusa, El Dorado, Fresno, Glenn, Kern, Kings, Madera, Merced, Placer, Sacramento, San Joaquin, Shasta, Stanislaus, Sutter, Tehama, Tulare, Yolo, and Yuba Counties. “San Francisco Bay Area” includes Alameda, Contra Costa, Marin, Napa, San Francisco, San Mateo, Santa Clara, Solano, and Sonoma Counties. “Los Angeles” refers to Los Angeles County, and “Other Southern California” includes Orange, Riverside, San Bernardino, and San Diego Counties. Residents from other geographic areas are included in the results reported for all adults, registered voters, and likely voters. Sample sizes for these less populated areas are not large enough to report separately. We present specific results for Latinos because they account for about 30 percent of the state’s adult population and constitute one of the fastest growing voter groups. Sample sizes for African Americans and Asian Americans are not large enough for separate analysis. We compare the opinions of registered Democrats, Republicans, and independents (those who are registered as “decline to state”). We also include the responses of “likely voters”— those who are most likely to vote in the state’s elections based on past voting, current interest, and voting intentions. We compare current PPIC Statewide Survey results to those in national surveys by CBS News, CNN/Opinion Research Corporation, Gallup, Los Angeles Times/Bloomberg, NBC News/Wall Street Journal, the Pew Research Center, and USA Today/Gallup.
25


QUESTIONNAIRE AND RESULTS
CALIFORNIANS AND THEIR GOVERNMENT
November 27 - December 4, 2007 2,002 California Adult Residents: English, Spanish
MARGIN OF ERROR +/-2% AT 95% CONFIDENCE LEVEL FOR TOTAL SAMPLE
1. First, thinking about the state as a whole, what do you think is the most important issue facing people in California today?
[code, don’t read]
18% immigration, illegal immigration 18 jobs, economy 10 health care, health costs 8 housing costs, housing availability,
subprime housing crisis 7 education, schools 5 crime, gangs, drugs 5 environment, pollution 4 gasoline prices, oil prices 3 state budget, deficit, taxes 3 traffic, transportation, infrastructure 3 water, water quality, water availability 11 other 5 don’t know
2. Do you think things in California are generally going in the right direction or the wrong direction?
36% right direction 52 wrong direction 12 don’t know
3. Turning to economic conditions in California, do you think that during the next 12 months we will have good times financially or bad times?
25% good times 65 bad times 10 don’t know
4. Do you think the current housing situation in California will hurt your financial situation in the next year or so? (if yes: do you think it will hurt your financial situation a great deal or only somewhat?)
28% yes, a great deal 24 yes, only somewhat 45 no 3 don’t know
5. Next, some people are registered to vote and others are not. Are you absolutely certain that you are registered to vote in California?
72% yes [ask q5a] 27 no [skip to q6e] 1 don’t know [skip to q6e]
5a. Are you registered as a Democrat, a Republican, another party, or as an independent?
42% Democrat [ask q6] 33 Republican [skip to q6a] 5 another party (specify) [skip to q9] 20 independent [skip to q6b]
6. Would you call yourself a strong Democrat or not a very strong Democrat?
54% strong 43 not very strong 3 don’t know
[skip to q7]
27

Californians and Their Government
6a. Would you call yourself a strong Republican or not a very strong Republican?
53% strong 43 not very strong 4 don’t know
[skip to q8]
6b. Would you join a political party if it was a good reflection of your political views or do you prefer to be unaffiliated with any specific party?
22% join a political party 76 remain unaffiliated 2 don’t know
6c. And were you previously registered with a major party or have you always been an independent?
38% previously registered [ask q6d] 61 always an independent [skip to q6e] 1 don’t know [skip to q6e]
6d. And what party were you previously registered with?
[code, don’t read]
41% Republican Party 51 Democratic Party 3 American Independent 1 Libertarian 4 other (specify)
6e. Do you think of yourself as closer to the Republican Party or Democratic Party?
21% Republican Party 38 Democratic Party 28 neither (volunteered) 13 don’t know
[delayed skip: if q5=no or don’t know, skip to
q10]
6f. California voters like yourself will be able to choose between voting in the Democratic primary, or selecting a nonpartisan ballot on February 5th. Both ballots include state proposition measures. Do you plan to vote in the Democratic primary, or on the nonpartisan ballot?
20% Democratic primary [ask q7] 55 nonpartisan ballot [skip to q9] 6 not planning to vote (volunteered)
[skip to q9] 19 don’t know [skip to q9]
[Responses recorded for questions 7 to 22
are for likely voters only.]
7. If the Democratic primary for president were being held today, and these were the candidates, who would you vote for?
[rotate names and then ask “or someone
else?”]
44% Hillary Clinton 20 Barack Obama 12 John Edwards 3 Joe Biden 3 Dennis Kucinich 3 Bill Richardson -- Chris Dodd -- Mike Gravel 2 someone else (specify) 13 don’t know
[skip to q9]
8. If the Republican primary for president were being held today, and these were the candidates, who would you vote for?
[rotate names and then ask “or someone
else?”]
24% Rudy Giuliani 15 Mitt Romney 12 Mike Huckabee 11 John McCain 10 Fred Thompson 3 Duncan Hunter 3 Ron Paul 3 Tom Tancredo 2 someone else (specify) 17 don’t know
28 PPIC Statewide Survey
Questionnaire and Results
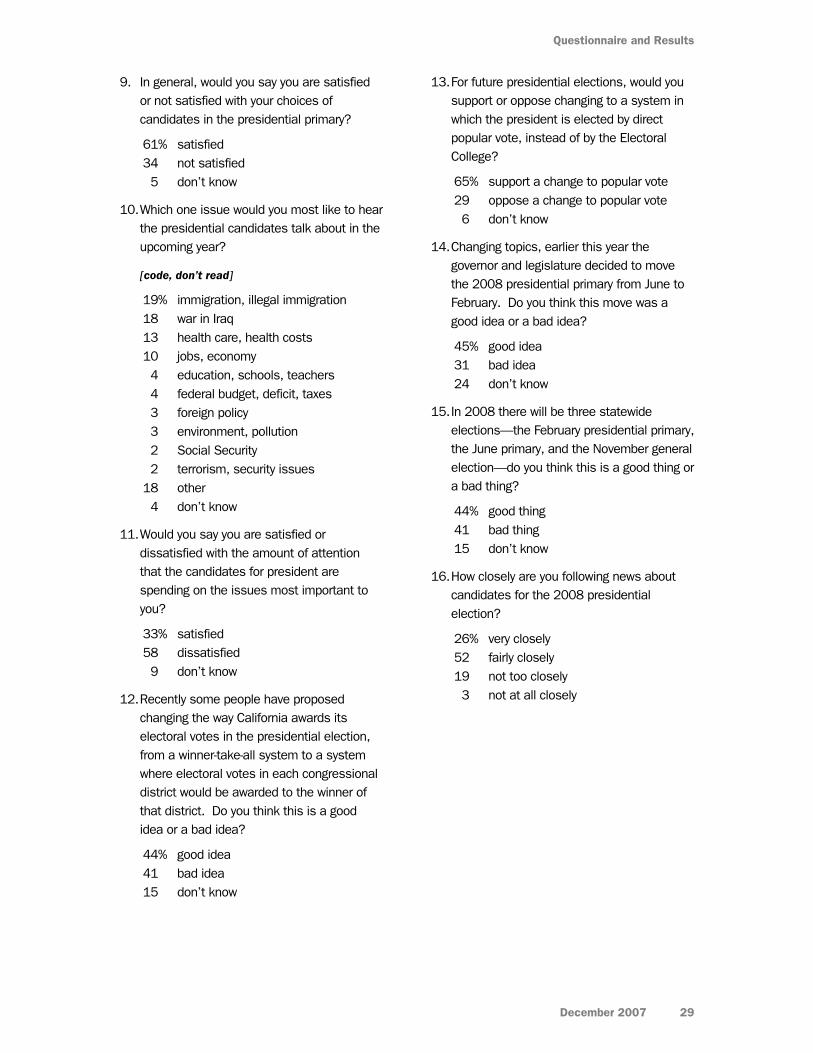
9. In general, would you say you are satisfied or not satisfied with your choices of candidates in the presidential primary?
61% satisfied 34 not satisfied 5 don’t know
10. Which one issue would you most like to hear the presidential candidates talk about in the upcoming year?
[code, don’t read]
19% immigration, illegal immigration 18 war in Iraq 13 health care, health costs 10 jobs, economy 4 education, schools, teachers 4 federal budget, deficit, taxes 3 foreign policy 3 environment, pollution 2 Social Security 2 terrorism, security issues 18 other 4 don’t know
11. Would you say you are satisfied or dissatisfied with the amount of attention that the candidates for president are spending on the issues most important to you?
33% satisfied 58 dissatisfied 9 don’t know
12. Recently some people have proposed changing the way California awards its electoral votes in the presidential election, from a winner-take-all system to a system where electoral votes in each congressional district would be awarded to the winner of that district. Do you think this is a good idea or a bad idea?
44% good idea 41 bad idea 15 don’t know
13. For future presidential elections, would you support or oppose changing to a system in which the president is elected by direct popular vote, instead of by the Electoral College?
65% support a change to popular vote 29 oppose a change to popular vote 6 don’t know
14. Changing topics, earlier this year the governor and legislature decided to move the 2008 presidential primary from June to February. Do you think this move was a good idea or a bad idea?
45% good idea 31 bad idea 24 don’t know
15. In 2008 there will be three statewide elections—the February presidential primary, the June primary, and the November general election—do you think this is a good thing or a bad thing?
44% good thing 41 bad thing 15 don’t know
16. How closely are you following news about candidates for the 2008 presidential election?
26% very closely 52 fairly closely 19 not too closely 3 not at all closely
December 2007 29

Californians and Their Government
17. Next, Proposition 93 is called the “Limits on Legislators’ Terms in Office Initiative Constitutional Amendment.” It reduces permissible state legislative service to 12 years. It allows 12 years’ service in one house. Current legislators can serve 12 years in current house, regardless of prior legislative service. There would be no direct fiscal effect on state or local governments. If the election were held today would you vote yes or no on Proposition 93?
47% yes 38 no 15 don’t know
The proposed “Limits on Legislators’ Terms in Office Initiative Constitutional Amendment” would alter current term limits in a number of ways. For each of the following please tell me if you think this provision is a good idea or a bad idea.
[rotate questions 18 and 19]
18. How about reducing the total amount of time a person may serve in the state legislature from 14 years to 12 years?
67% good idea 26 bad idea 7 don’t know
19. How about allowing a person to serve a total of 12 years either in the assembly, the senate, or a combination of both?
58% good idea 34 bad idea 8 don’t know
20. How about providing a transition period to allow current members to serve a total of 12 consecutive years in the house in which they are currently serving, regardless of any prior service in another house?
42% good idea 46 bad idea 12 don’t know
21. The California legislature has operated under term limits since 1990, meaning that members of the state senate and state assembly are limited in the number of terms they can hold their elected office. Do you think that term limits are a good thing or a bad thing for California, or do they make no difference?
66% good thing 15 bad thing 15 no difference 4 don’t know
22. Do you think that the current term limits in California are in need of major changes, minor changes, or are they fine the way they are?
29% major changes 40 minor changes 24 fine the way they are 7 don’t know
23. Next, overall, do you approve or disapprove of the way that Arnold Schwarzenegger is handling his job as governor of California?
57% approve 37 disapprove 6 don’t know
24. Overall, do you approve or disapprove of the way that the California Legislature is handling its job?
41% approve 47 disapprove 12 don’t know
25. Overall, do you approve or disapprove of the job that the state legislators representing your assembly and senate districts are doing at this time?
51% approve 36 disapprove 13 don’t know
30 PPIC Statewide Survey

Questionnaire and Results
26. Next, with the state facing a potential multi-billion dollar deficit next year, Governor Schwarzenegger recently informed state agency leaders to prepare budgets that cut their spending by 10 percent. Do you think this is a good idea or a bad idea?
68% good idea 27 bad idea 5 don’t know
27. Do you think that tax increases should be included in the governor’s budget plan?
30% yes 65 no 5 don’t know
28 How would you prefer to deal with the state's budget gap—mostly through spending cuts; mostly through tax increases; through a mix of spending cuts and tax increases; or do you think that it is okay for the state to borrow money and run a budget deficit?
42% spending cuts 7 tax increases 36 mix of spending cuts and tax
increases 7 okay to borrow money and run a
budget deficit 3 other (specify) 5 don’t know
29. Changing topics, do you think the number of people without health insurance is a big problem, somewhat of a problem, or not a problem in California today?
76% big problem 16 somewhat of a problem 7 not a problem 1 don’t know
30. Would you favor or oppose a plan requiring all Californians to have health insurance, with costs shared by employers, health care providers, and individuals?
71% favor 24 oppose 5 don’t know
Next, please tell me if each of the following ideas to reform heath care in California is a good idea or a bad idea.
[rotate questions 31 to 33]
31. All California residents should be required to have health insurance, with public programs available for low-income persons.
75% good idea 22 bad idea 3 don’t know
32. Employers should be required to provide health insurance for their employees or pay a fee to the state to help cover the costs of health care.
75% good idea 21 bad idea 4 don’t know
33. Hospitals should be required to pay a fee to the state to help cover the costs of health care.
47% good idea 45 bad idea 8 don’t know
Next,
[rotate 2 blocks of questions randomly: (1)
34, 35; (2) 36, 37]
34. Please tell me how you would rate the government’s handling of the recent oil spill in the San Francisco Bay—would you say excellent, good, not so good, or poor?
4% excellent 29 good 25 not so good 21 poor 21 don’t know
December 2007 31

Californians and Their Government
35. How much confidence do you have in the government in terms of its readiness to respond to environmental disasters, such as oil spills, in California?
16% a great deal 47 some 25 very little 9 none 3 don’t know
36. Please tell me how you would rate the government’s handling of the wildfires in Southern California over the last few months—would you say excellent, good, not so good, or poor?
26% excellent 50 good 12 not so good 7 poor 5 don’t know
37. How much confidence do you have in the government in terms of its readiness to respond to wildfires in California?
40% a great deal 43 some 11 very little 5 none 1 don’t know
38. On another topic, overall, do you approve or disapprove of the way that George W. Bush is handling his job as president of the United States?
29% approve 67 disapprove 4 don’t know
39. Overall, do you approve or disapprove of the way the U.S. Congress is handling its job?
31% approve 62 disapprove 7 don’t know
40. Overall, do you approve or disapprove of the way your own representative to the U.S. House of Representatives in Congress is handling his or her job?
51% approve 37 disapprove 12 don’t know
41. Next, in general, how would you say things are going for the U.S. in Iraq?
7% very well 23 somewhat well 27 not too well 42 not at all well 1 don’t know
42. Do you think the U.S. should keep military troops in Iraq until the situation has stabilized, or do you think the U.S. should bring its troops home as soon as possible?
35% keep in Iraq until stabilized 60 bring home as soon as possible 5 don’t know
43. Do you think the U.S. goal of achieving victory in Iraq is still possible, or not?
35% is still possible 59 is not still possible 6 don’t know
44. On another topic, please indicate which statement comes closest to your own view —even if neither is exactly right: [rotate]
[1] Immigrants today are a benefit to California because of their hard work and job skills [or] [2] Immigrants today are a burden to California because they use public services.
61% immigrants are a benefit to California 32 immigrants are a burden to California 7 don’t know
32 PPIC Statewide Survey

Questionnaire and Results
December 2007 33
45. Do you think that immigration policy in the United States today is in need of major changes, minor changes, or is it basically fine the way it is?
73% major changes 18 minor changes 6 fine the way it is 3 don’t know
46. Would you favor or oppose state legislation allowing illegal immigrants to get a California driver's license?
45% favor 52 oppose 3 don’t know
47. If you had to choose, what do you think should happen to most illegal immigrants who have lived and worked in the United States for at least two years? [rotate] [1] They should be given a chance to keep their jobs and eventually apply for legal status [or] [2] They should be deported back to their native country.
72% chance to keep jobs 24 deported 4 don’t know
48. Next, would you consider yourself to be politically:
[read list, rotate order top to bottom]
12% very liberal 19 somewhat liberal 32 middle-of-the-road 24 somewhat conservative 11 very conservative 2 don’t know
49. Generally speaking, how much interest would you say you have in politics?
23% great deal 40 fair amount 31 only a little 5 none 1 don’t know
[d1 to d13: demographic questions]


PPIC STATEWIDE SURVEY ADVISORY COMMITTEE
Ruben Barrales President and Chief Executive Officer San Diego Regional Chamber of Commerce
Angela Blackwell Founder and Chief Executive Officer PolicyLink
Paul Brest President The William and Flora Hewlett Foundation
Mollyann Brodie Vice President Kaiser Family Foundation
Bruce E. Cain Director Institute of Governmental Studies University of California, Berkeley
James E. Canales President The James Irvine Foundation
Jon Cohen Director of Polling The Washington Post
Matthew K. Fong Special Counsel Sheppard, Mullin, Richter & Hampton, LLP
Russell Hancock President and Chief Executive Officer Joint Venture Silicon Valley Network
William Hauck President California Business Roundtable
Sherry Bebitch Jeffe Senior Scholar School of Policy, Planning, and Development University of Southern California
Carol S. Larson President and Chief Executive Officer The David and Lucile Packard Foundation
Monica Lozano Publisher and Chief Executive Officer La Opinión
Donna Lucas Chief Executive Officer Lucas Public Affairs
Dan Rosenheim News Director KPIX-TV
Carol Stogsdill President Stogsdill Consulting
Cathy Taylor Vice President and Editorial Commentary Director Orange County Register
Raymond L. Watson Vice Chairman of the Board Emeritus The Irvine Company
Carol Whiteside President Great Valley Center
The PPIC Statewide Survey Advisory Committee is a diverse group of experts who provide advice on survey issues.
However, survey methods, questions, content, and timing are determined solely by PPIC.

PUBLIC POLICY INSTITUTE OF CALIFORNIA
BOARD OF DIRECTORS
Thomas C. Sutton, Chair Retired Chairman and Chief Executive Officer Pacific Life Insurance Company
Mark Baldassare President and Chief Executive Officer Public Policy Institute of California
Ruben Barrales President and Chief Executive Officer San Diego Regional Chamber of Commerce
Linda Griego President and Chief Executive Officer Griego Enterprises, Inc.
Edward K. Hamilton Chairman Hamilton, Rabinovitz & Associates, Inc.
Gary K. Hart Former State Senator and Secretary of Education State of California
Walter B. Hewlett Director Center for Computer Assisted Research in the Humanities
Donna Lucas Chief Executive Officer Lucas Public Affairs
Leon E. Panetta Director The Leon & Sylvia Panetta Institute for Public Policy
Ki Suh Park Design and Managing Partner Gruen Associates
Constance L. Rice Co-Director The Advancement Project
Raymond L. Watson Vice Chairman of the Board Emeritus The Irvine Company
Carol Whiteside President Great Valley Center

Copyright © 2007 by Public Policy Institute of CaliforniaAll rights reservedSan Francisco, CA
Short sections of text, not to exceed three paragraphs, may be quoted without written permission provided that full attribution is given to the source and the above copyright notice is included.