
DebugFactory Builder for MN101C/E Tutorial · DebugFactory Builder for MN101C/E Tutorial September...
54
DebugFactory Builder for MN101C/E Tutorial September 29, 2006 3rd Printing Software & Solutions Development Center 2-2 Corporate System LSI Division Semiconductor Company Matsushita Electric Industrial Co., Ltd. 1
Transcript of DebugFactory Builder for MN101C/E Tutorial · DebugFactory Builder for MN101C/E Tutorial September...

DebugFactory Builder for MN101C/E Tutorial
September 29, 2006 3rd Printing
Software & Solutions Development Center 2-2
Corporate System LSI Division
Semiconductor Company
Matsushita Electric Industrial Co., Ltd.
1

0. Introduction....................................................................................................................4
0.1. Purpose..................................................................................................................4 0.2. Requirement..........................................................................................................4 0.3. Organization..........................................................................................................4 0.4. Other information .................................................................................................4
1. What is DebugFactory Builder? .....................................................................................5 1.1. Overview................................................................................................................5 1.2. Operating environment ........................................................................................7 1.3. Design mode / Debug mode...................................................................................7 1.4. Target environment ..............................................................................................7 1.5. License...................................................................................................................8
2. Preparation ....................................................................................................................9 2.1. Installation............................................................................................................9 2.2. Run the program................................................................................................. 11 2.3. Window configuration .........................................................................................12
3. Use DebugFactory Builder...........................................................................................14 3.1. Basic development flow ......................................................................................14
3.1.1. Read a project...............................................................................................14 3.1.2. Coding...........................................................................................................16 3.1.3. Create an executable file (Make).................................................................17 3.1.4. Debug ...........................................................................................................17
4. Commonly-used functions ...........................................................................................22 4.1. Project..................................................................................................................22
4.1.1. Create a new project (Project creation wizard)...........................................22 4.1.2. Add a file to the project................................................................................25 4.1.3. Create a project for debugging ....................................................................26 4.1.4. Create a project from an execution file .......................................................28
4.2. Make ....................................................................................................................30 4.2.1. Specify the way to make ..............................................................................30 4.2.2. Select language tools ...................................................................................31 4.2.3. Specify paths of header files for language tools, and paths of library files 32 4.2.4. Option setting for language tools ................................................................33 4.2.5. Section setting of an executable file............................................................33 4.2.6. Set an execution file name ..........................................................................34
2

4.3. Debug...................................................................................................................35 4.3.1. How to set debugging function ....................................................................35 4.3.2. Set Software break / Hardware break ........................................................35 4.3.3. Execute a program.......................................................................................38 4.3.4. Display / Change register ............................................................................38 4.3.5. Display / Change memory ...........................................................................39 4.3.6. Display / Change variable ...........................................................................40 4.3.7. Display / Change microcomputer special registers ....................................42 4.3.8. Display execution history ............................................................................43
5. Useful functions ...........................................................................................................45 5.1. How to run DebugFactory Builder .....................................................................45
5.1.1. Settings for startup......................................................................................45 5.1.2. Command options ........................................................................................45
5.2. Control debug mode ............................................................................................46 5.2.1. Control by commands ..................................................................................46 5.2.2. Settings for debug mode ..............................................................................46
5.3. User processing of make function ......................................................................47 5.4. Measure performance .........................................................................................47
5.4.1. Profile function (PROF) ...............................................................................47 5.4.2. Coverage function (COV).............................................................................48
5.5. Edit / Execute macro...........................................................................................48 5.6. Save debugging functions ...................................................................................50
5.6.1. Save/Load debugging settings.....................................................................50 5.6.2. Restore previous debug setting ...................................................................50
5.7. Customize............................................................................................................50 6. Appendix......................................................................................................................52
6.1. Debug function list..............................................................................................52 6.2. Environment file (*.df4 / *.dft / DFbuild.ini) .....................................................53
3

0. Introduction 0.1. Purpose
This tutorial is written to present basic functions of Integrated Development Environment (DebugFactory Builder for MN101C/E, hereinafter DebugFactory Builder) and how to operate it.
0.2. Requirement This tutorial is for users who have general knowledge of microcomputer, C language, assembler and debugger, and basic knowledge about Microsoft Windows operation method.
0.3. Organization This tutorial is divided into 6 chapters as follows:
Chapter1 Introduction Chapter2 What is DebugFactory Builder? Chapter3 Use DebugFactory Builder Chapter4 Commonly-used functions Chapter5 Useful functions Chapter6 Appendix (Debug function list)
0.4. Other information This tutorial does not describe individual functions of DebugFactory Builder in detail, but describes representative operations, mainly menus, as means to realize the functions. Please note that other means such as tool buttons of tool bars or shortcuts can also be used, however not all of means are explained here. For details, refer to the online documentation, from the [Start] menu, select [Program]-[Panasonic DebugFactory Builder4]-[Mn101ce]-[Help].
4

1. What is DebugFactory Builder? 1.1. Overview
DebugFactory Builder is the integrated development environment for the microcomputer program development and debugging, and provides comfortable operation for source code editing, compiling and linking, setting compiling options as well as debugging with actual hardware. DebugFactory Builder is loaded with a simulator so that debugging can be easily performed without actual hardware. DebugFactory Builder has the following functions. 1. Project management function
Create project files (*.df4). Information such as related source file names and compile options are included in a project file. A makefile is created by these information. Debug setting information such as screen position, breakpoints, etc. at the time DebugFactory Builder is terminated are stored in a temporary file with an extension (*.dft) in the folder containing a project file. A project file can be easily created using the project creation wizard by specifying required information such as project type (Standard, For debug, Specify execution file).
2. Source code editing function DebugFactory Builder provides an editor,in which functions such as code assist, color display of reserved words, symbol list display, string searching, advanced searching/replacing such as GREP, etc. are prepared for source code editing. The file outline function enables to list functions or variables described in a file being displayed with the editor. If one of the items in the list is clicked, corresponding section is highlighted. Instead of the built-in editor, you can specify a commercially available editor with the option setting. Then a source can be displayed on the specified editor when specifying the source in the source file list, for example.
3. Build function DebugFactory Builder incorporates a make tool. Compiling and linking can be performed by one clicking. It is necessary to set compiler path before compiling. DebugFactory Builder does not include a compiler therefore it must be purchased
5
separately. However for trial compiling, the trial version compiler incorporated in DebugFactory Builder can be used. Note that the trial version compiler is available only for MN101E. DebugFactory Builder can automatically generate a makefile. Instead of using a makefile generated by DebugFactory Builder or the incorporated make tool, it is also possible to use an existing makefile or an existing make tool, or to compile or to link by specifying a batch file.
4. Debugging function There are two types of debugging: debugging with actual hardware such as an in-circuit emulator (ICE) and debugging without actual hardware using a simulator. The debugging functions include displaying and operating memory or register, Go execution, step execution, step-out execution, COME execution, forcible break, software break, inspection display, watch display, RAM monitor, real time trace, profiler, coverage, etc.
5. Supporting functions for debugging with a simulator The microcomputer simulator of DebugFactory Builder equips not only a debugging function which is as sophisticated as ICE but also following supporting functions to effectively perform debugging without actual hardware.
Panel tool Panel tool is used to debug user interface processing. Swap function Swap function is used to execute a function for
debugging in place of the lower function in the microcomputer program.
Memory access event Memory access event is used to execute a specified function when the microcomputer program accesses a specified memory space.
Timer event Timer event is used to execute a specified function at specified time.
6

1.2. Operating environment Following minimum systems are required for DebugFactory Builder.
OS Windows98/Me/2000/XP (Windows2000/XP are recommended)
CPU Intel Pentium III 450MHz or higher (Pentium III 1GHz or higher recommended)
Memory 256MB minimum (512MB or more recommended)
Hard disk space 400MB minimum (1GB or more recommended)
1.3. Design mode / Debug mode DebugFactory Builder has the design mode and the debug mode. The design mode is used for operations to creating executable files to be debugged, such as setting projects, editing sources and Make, while the debug mode is for debugging operations in connected to the target. Switching modes can be performed by connecting to the target (select [Debug]-[Start of debugging] in the main menu) when switching from design mode to debug mode, and by disconnecting from the target (select [Debug]-[End of debugging] in the main menu) when switching from debug mode to design mode.
1.4. Target environment DebugFactory Builder supports a simulator environment and an in-circuit emulator environment as a target environment where executable files can be operated in the debug mode.
Simulator environment DebugFactory Builder incorporates an instruction set simulator that operates in the host computer (Windows) and performs debugging by executing a program to be debugged in the simulator. In this target environment, only the DebugFactory Builder software is used. In-circuit emulator environment DebugFactory Builder executes a program to be debugged with the actual microcomputer on the target board and performs debugging. In this target environment, the in-circuit emulator (ICE), etc. in addition to the
7

DebugFactory Builder software are needed. To switch target environment, select [Debug]-[Target setting…] in the main menu, and specify in [Target type] in the “Target setting” dialog box.
1.5. License If DebugFactory Builder was made available via download, it can be used on a trial basis for up to 30 days. The trial versions of language processor tools such as a C compiler, an assembler and a linker are also embedded. However for full-scale usage as product development, please purchase a license of DebugFactory Builder, and prepare language processor tools such as a C compiler, an assembler and a linker separately. If you purchased a license during the trial period, open the user registration dialog box by selecting [Help]-[Licenses] in the main menu, and enter your key code. After the key code has been confirmed, the trial period is cleared. Even if the trial period has already been expired, the same dialog box appears when running DebugFactory Builder, therefore enter the key code in the same way. DebugFactory Builder license key (DFKey) is written on the sticker in the CD case of “PanaX Series Setup Disk” packed at first-time purchase. Please note that CD key (used when installing other software tools) as well as DebugFactory Builder license key (DFKey) are written on the sticker in the CD case. When upgrading from the conventional debugger, we will issue a license key and send it to you by FAX, etc. upon application.
8

2. Preparation 2.1. Installation
When using Windows 2000/XP, installation must be done by users (including Power User) who belong to the Administrator group. Set “PanaX Series Setup Disk” in the CD drive and execute a file in the following folder.
[Setup file name] “CD drive name” :\DebugFactory\ ”mn101e” \DFBuilder101CE_vXXXXE.exe “CD drive name” :\DebugFactory\mn101c\ice(blue)\DFBuilder101CE_vXXXXE.exe
(Type version number for XXXX) Run the setup program and click <Next> following the instructions. After having accepted the license agreement, the key code input screen appears.
Enter DebugFactory Builder license key (DFKey: written on the sticker in the CD case of a software tool packed at first-time purchase) issued at the time of purchase or upgrading. Even if you do not have a DebugFactory Builder license key, you can use it on a trial basis for up to 30 days. When the trial period is over, the program does not run unless a license key is entered.
9

In this wizard, specify a folder where DebugFactory Builder will be installed, then click [Next].
In this wizard, specify a program folder name of DebugFactory Builder.
Specify whether to create a shortcut on the desktop.
10

After installation has been successfully completed, this wizard appears. Click <Finish> and restart the computer.
2.2. Run the program After the setup is completed in 2.1, the [Panasonic DebugFactory Builder 4]-[MN101CE] group is created in [Programs] on the [Start] menu. Note that the program folder name specified in 2.1 is displayed in [Panasonic DebugFactory Builder 4]. (Default is [Panasonic DebugFactory Builder 4].)
DebugFactory Builder can be started as follow. Click the [start] menu, and select
[Programs]-[Panasonic DebugFactory Builder 4]-[MN101CE]-[Builder].
11

2.3. Window configuration The following window shows the basic configuration of DebugFactory Builder.
Design mode
Main window Project tree
Command window
File outline window
Make output window (Tab) Code window
12

Debug mode
Main window Project tree
Register window
Code window
Stack window
Disassembler window (Tab)
Debug setting tree Command window Memory window
13
3. Use DebugFactory Builder 3.1. Basic development flow
In this section, you can experience and understand the basic development flow of DebugFactory Builder using a completed sample program. The procedures for the development flow are outlined below.
(1) Read a project * For creating a new project, refer to 4.1.1. (2) Coding (3) Create an executable file (Build) (4) Debug
3.1.1. Read a project
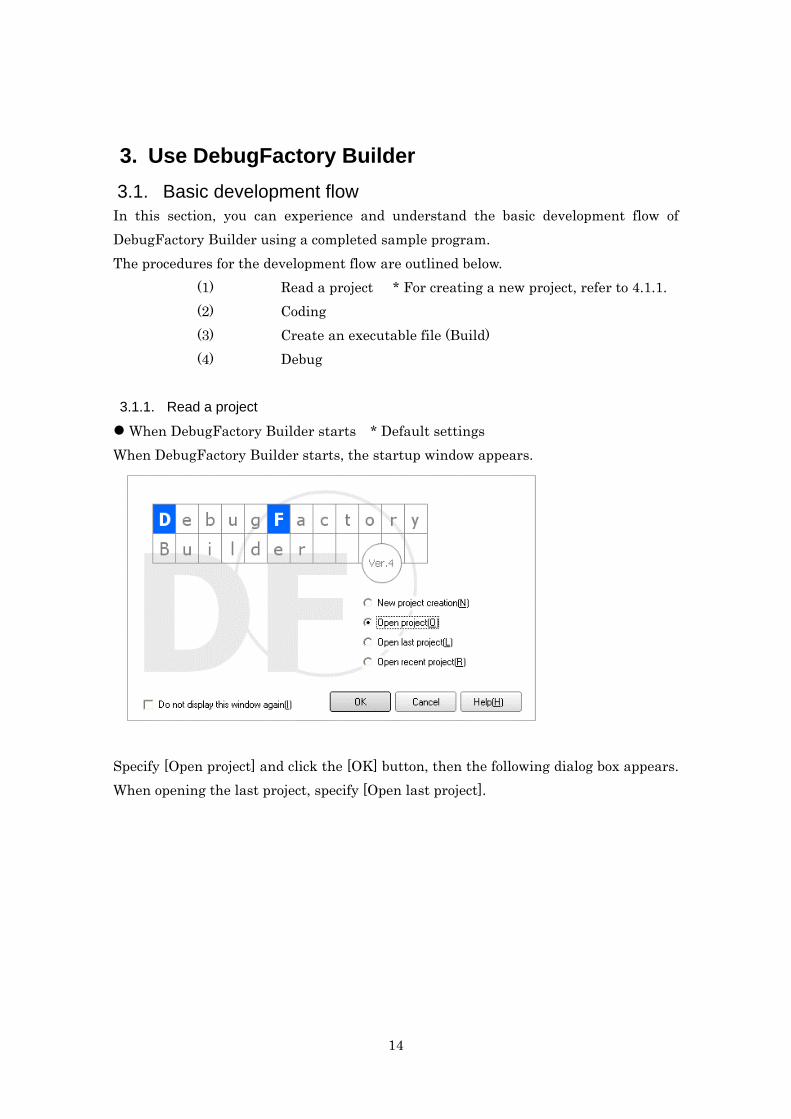
When DebugFactory Builder starts * Default settings When DebugFactory Builder starts, the startup window appears.
Specify [Open project] and click the [OK] button, then the following dialog box appears. When opening the last project, specify [Open last project].
14

Select an existing project (Example: C:\My Documents\Panasonic\DebugFactory Builder\"101ce"\Project\test1.df4). * When creating a new project, specify [New project creation] in the startup window, click [OK] and then the “Project creation wizard” appears. Specify required items following the instructions and a project is created. For details, refer to 4.1.1.
After DebugFactory Builder started Select [File]-[Open project...] in the main menu, and the dialog box appears. Select a project as described above. * When creating a new project, select [File]-[New]-[Project] in the main menu. Then a
project is created.
15

3.1.2. Coding
Open a file in the code window. The file can be edited directly.
Project tree Code window
Pop-up menu of Code window
When opening a new file, select [File]-[Open in code window...] in the main menu. When displaying files that are already opened in the code window, files can be switched by clicking the tab. It is also possible to open a file registered in the project tree by double-clicking or selecting [Open in code window...] in the pop-up menu, or selecting [Open source file...] or [Open…] in a pop-up menu in the code window.
16

3.1.3. Create an executable file (Make)
Create an executable file of the project. This operation is called ‘make’. When performing ‘make’, select [Make]-[Make] in the main menu. During ‘make’, compiling status, etc. is displayed in the “Make output” window.
3.1.4. Debug
1. Select / Set a target Select a target environment to debug the executable file created in 3.1.3. The target environment is for executing an executable file. It can be set in the “Target setting” dialog box opened by selecting [Debug]-[Target setting…] in the main menu. ● Target setting (Environment setting)
Set items depend on a selected target type. There are two tabs; one for environment settings and the other for target specific settings. For details on set items of each target, refer to the online help. Multiple target information can be saved or managed with different target set name, therefore target setting can be easily switched by specifying target set name.
17

● When selecting Simulator ● When selecting In-circuit emulator
2. Start debugging Select [Debug]-[Debugging start] in the main menu. This operation is called “Open a target”. If debugging has successfully started, “Start of debug mode” is displayed in the command window, and "[PC=****]" is added in the caption of the main window. If there is an executable file of the project, the following message appears to ask whether to load.
If “Yes” is selected, the executable file to be debugged of the project is loaded. This file can be confirmed in the project tree or the debug source tree.
3. Load an execution file An execution file can be loaded by selecting [Debug]-[Execution file load] in the main menu. Loading starts (after connected to the target in the case of design mode) if there is an executable file of the project. When loading is completed, “Load completed” is displayed in the command window. By opening the debug source tree, a source file list of loaded execution files is displayed from the debug information.
18

When the code window or the disassembler window is being opened, the current PC position is displayed. For loading an executable file, select [Debug]-[Load a specified file], or select [Load] in the pop-up menu of the command window to specify a file.
4. Execute the program For executing the program, select [Debug]-[Go] in the main menu. When the program is executed, the value of the PC being executed is displayed in the caption of the main window.
Simulator (The changing value of the PC is displayed. (Circled in red))
Emulator (The changing value of the PC is displayed. (Circled in red))
5. Break setting When setting a software breakpoint by specifying a source line of the program.
Display the source in the code window, move the cursor, display the pop-up menu by right-clicking and select [Software breakpoint setting]. Or it can be set by clicking the circle mark on the left side to the line number in the code window. If set, both the mark and the line are colored. (The color can be customized. Default is red)
19
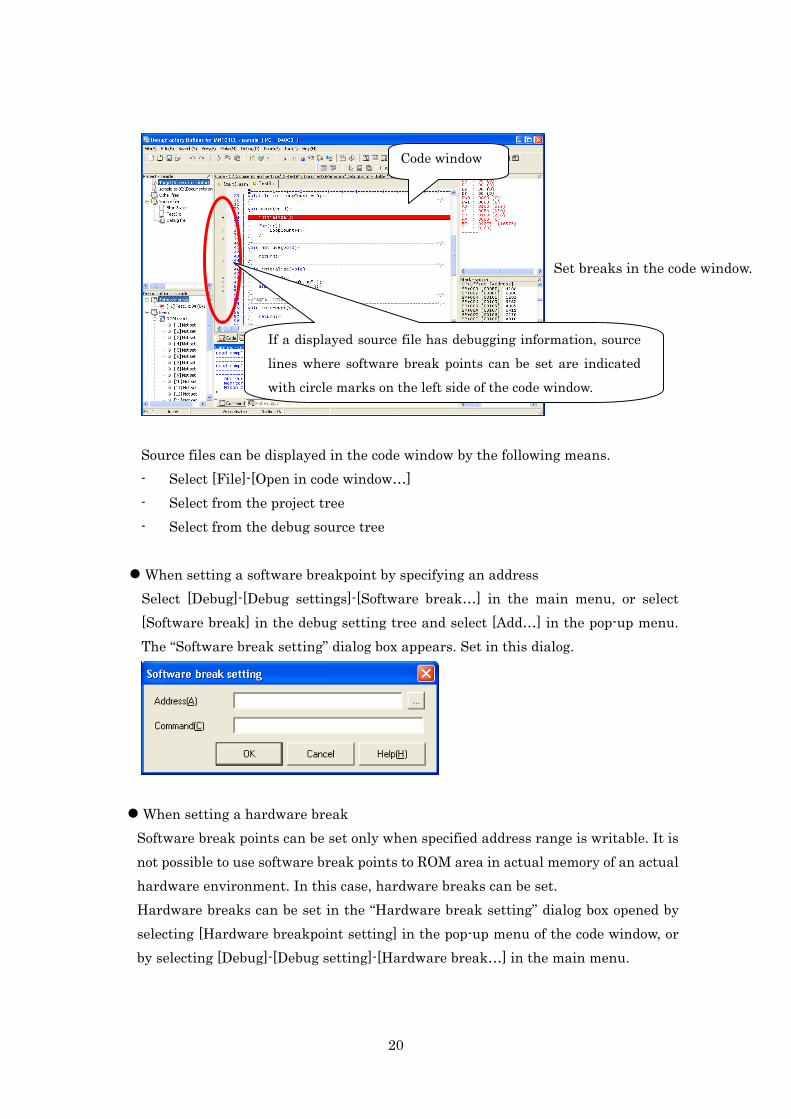
Set breaks in the code window.
If a displayed source file has debugging information, source
lines where software break points can be set are indicated
with circle marks on the left side of the code window.
Code window
Source files can be displayed in the code window by the following means. - Select [File]-[Open in code window…] - Select from the project tree - Select from the debug source tree
When setting a software breakpoint by specifying an address Select [Debug]-[Debug settings]-[Software break…] in the main menu, or select [Software break] in the debug setting tree and select [Add…] in the pop-up menu. The “Software break setting” dialog box appears. Set in this dialog.
When setting a hardware break Software break points can be set only when specified address range is writable. It is not possible to use software break points to ROM area in actual memory of an actual hardware environment. In this case, hardware breaks can be set. Hardware breaks can be set in the “Hardware break setting” dialog box opened by selecting [Hardware breakpoint setting] in the pop-up menu of the code window, or by selecting [Debug]-[Debug setting]-[Hardware break…] in the main menu.
20

6. Stop the program When the program executed the breakpoint set in 5, the program stops. It is also possible to stop the program forcibly by selecting [Debug]-[Stop] in the main menu (or pressing the Esc key). When the program stops, the source that was being executed is displayed in the code window, and the entire source line where the program stops is colored.
7. End of debugging Select [Debug]-[Debugging end] in the main menu. This is called “Close the target”. If this operation has been succeeded, “End of debug mode” is displayed in the command window.
21

4. Commonly-used functions 4.1. Project
4.1.1. Create a new project (Project creation wizard)
When DebugFactory Builder starts * Default settings When DebugFactory Builder starts, the startup window appears. Specify [New project creation] and the wizard starts to create a project.
In the “Project creation wizard”, select a project type first, and set requirements such as a project name, a folder to save, language tool, target environment, etc. depending on project types. Then a new project can be created. There are three project types as follow. - Standard Specify when creating a standard project (can be used to create and edit source
code, create makefiles, and debug code). - For debugging
Specify when creating a project that will be used only for debugging. Although source code addition and make functionality are not available, it is possible to begin debugging immediately by starting in the debug mode.
- Specify execution file Specify when execution and component source files already exist and you want to edit and make code in addition to just debugging. Setting an execution file and source search path allows source file information contained in execution files to be automatically analyzed and added to the project.
22

In this section, creating procedures for a standard project are described. For the other types, refer to 4.1.3 or 4.1.4. Project type
Select the type of a project to be created. Here, select “Standard” and click “Next” to move to project setting.
Project setting Specify a project name, a destination folder to save files, and sample source files to be added to the project. Component source files can be added after the project was created, therefore add source files as sample here. After setting required items, click “Next” to move to language tool setting.
23

Language tool setting *Default available (Use the trial version) Specify a language tool to be used for a created project. The trial version is selected by default. When using your language tools, check “Use a following language tool” and set execution files of compiler, assembler and linker respectively. After setting, click “Next” to move to target setting.
Target setting Specify target environment of the project. Select an existing target from the “Target setting list”, or create target settings.
List of target setting informationthat has already been set or created
When using existing settings, select from the target setting list. When creating target settings, click the “New” button to display the “Target setting”
24

dialog box, and set required items including target environment (Instruction set simulator, In-circuit emulator). It is also possible to edit existing target settings. In this case, select a target from the list and click the “Edit” button, and set items in this dialog. For details on each setting items, refer to the online help.
Click “End” in the project creation wizard, and project creating will be completed.
After DebugFactory Builder started Select [File]-[New]-[Project] in the main menu. The “Project creating wizard” appears. Set items following the instruction as described above.
4.1.2. Add a file to the project
An added file to the project is to be a file for ‘make’ at creating an executable file or to be displayed in the code window at source code debugging. Select [Make]-[Source file addition/deletion…] in the main menu, and set a source file in the “Source file setting” dialog box.
25

It is also possible to display this dialog by selecting an execution file in the project tree and selecting [Source file addition/deletion…] in the pop-up menu. Or source files can be added in the “Source file addition” dialog box opened by selecting [Source file] in the project tree and selecting [Add source…] in the pop-up menu. Header files, debug files and other files can also be added to the project. Besides adding existing source files, it is also possible to add a new file by selecting [Source file] and selecting [New source creation] in the pop-up menu, as well as to add folders by selecting [Add folder…] in the pop-up menu when the logical tree view is applied.
4.1.3. Create a project for debugging
This function enables to debug an executable file created in an existing development environment (editor, make environment, etc). This function is effective for users who upgraded from the conventional PanaX debugger to DebugFactory Builder, since an existing developing environment can remain to be used. When DebugFactory Builder starts * Default settings When DebugFactory Builder starts, the startup window appears. Specify [New project creation] and the wizard starts to create a project.
26

Specify [For debugging] and set required items. Source search path setting Specify a folder that stores source files comprising an executable file to be debugged. When displaying the stop position in the code window at the time the program stops, etc., folders registered as source search path are firstly searched. Source search path can also be added after the project is created.
Set other items in the same way as a standard project. For details, refer to 4.1.1 “Create a new project”. After DebugFactory Builder started Select [File]-[New]-[Project] in the main menu. Then the “Project creation wizard” starts as is the case with startup. Follow the
27

procedures described above.
4.1.4. Create a project from an execution file
This function is incorporated to support easily creating a project from an executable file created in an existing development environment (editor, make environment, etc.). This makes possible to add component source files of the project automatically from the debugging information of a specified execution file, therefore it enables to omit the procedures in 4.1.2 for adding files. However path information of a source file to be registered depends on debugging information (the compiler used), therefore it needs to be set as a source search path as well as setting an execution file. The difference between a project for debugging in 4.1.3 and this project is that the former is exclusively for debugging while the latter enables to edit source codes, make as well as debugging based on source files automatically registered.
When DebugFactory Builder starts * Default settings When DebugFactory Builder starts, the startup window appears. Specify [New project creation] and the wizard starts to create a project.
Specify [Specify execution file] to set required items. Execution file setting Specify an execution file to be debugged.
28

Source search path setting Specify a folder which stores source files comprising an executable file to be debugged. When displaying the stop position in the code window at the time the program stops, etc., folders registered as source search path are firstly searched. Source search path can also be added after the project is created.
Set other items in the same way as a standard project. For details, refer to 4.1.1 “Create a new project”. After DebugFactory Builder started Select [File]-[New]-[Project] in the main menu. Then the “Project creation wizard” starts as is the case with startup. Follow the procedures described above.
29

4.2. Make 4.2.1. Specify the way to make
DebugFactory Builder has three ways to make. 1. Execute make by reading a makefile that is automatically generated by the
make tool incorporated in DebugFactory Builder. (When only using the incorporated functions such as a make tool, a makefile, etc.)
2. Execute make by reading an existing makefile using a make tool on the market.
3. Use a batch file.
Specify either way as environment setting of the make function.
Select [Make]-[Environment settings…] in the main menu, and the “Environment settings” dialog box appears. For the check box “Make method selection” in the “Make method” tab, check “Use make file” for No1 and 2, or select “Use batch file” for No3. The tabs to be displayed are changed depending on the way you choose. For No1, uncheck “Use existing make file” in the “Make file/make tool” tab, and for No2, check it and specify a makefile and a make tool to be used.
30

For 1, uncheck “Use existing make file”For 2. check it and set items below.
For No3, specify a batch file to
be used in the “Batch file” tab.
4.2.2. Select language tools
Select [Make]-[Environment setting] in the main menu, and the “Environment settings” dialog box appears. Select the “Language tool” tab, uncheck “Use a trial-version language tool”, and specify a compiler, an assembler and a linker to be used. However product development is not allowed using the trial version compiler. Therefore purchase the compiler if needed.
31

Note that this setting is needed when executing make using the incorporated make tool, therefore if specifying another way, this setting is not reflected in make.
4.2.3. Specify paths of header files for language tools, and paths of library files
Select [Make]-[Compiler option…] in the main menu, and the “Compiler option” dialog box appears. Specify include paths for a compiler and an assembler as well as a library path for a linker.
Example of compiler setting
Note that this setting is needed when executing make using the incorporated make tool, therefore if specifying another way, this setting is not reflected in make.
32

4.2.4. Option setting for language tools
Select [Make]-[Compile options…] in the main menu, and the “Compiler option” dialog box appears. Set options in the “Compiler”, “Assembler” and “Linker” tabs.
For specifying options other than options of radio buttons and check boxes, type directly in the [Option] item. Make sure to specify options with a hyphen ‘-’. Note that this setting is needed when executing make using the incorporated make tool, therefore if specifying another way, this setting is not reflected in make.
4.2.5. Section setting of an executable file
Specify an object to be linked and memory mapping of code and data. Select [Make]-[Section setting…] in the main menu, and the “Section setting” dialog box appears. Specify mapping addresses and mapping order of objects to be mapped.
33

Note that this setting is needed when executing make using the incorporated make tool, therefore if specifying another way, this setting is not reflected in make.
4.2.6. Set an execution file name
Select [Make]-[Execution file/Library name change…] in the main menu, and the “Execution file name change” dialog box appears. Specify an execution file name and an output folder.
The executable file specified here is to be loaded when connecting to the target, (opening the target), and to be an object to confirm whether compiling or not. Note that this function cannot be used in a project for debugging.
34
4.3. Debug 4.3.1. How to set debugging function
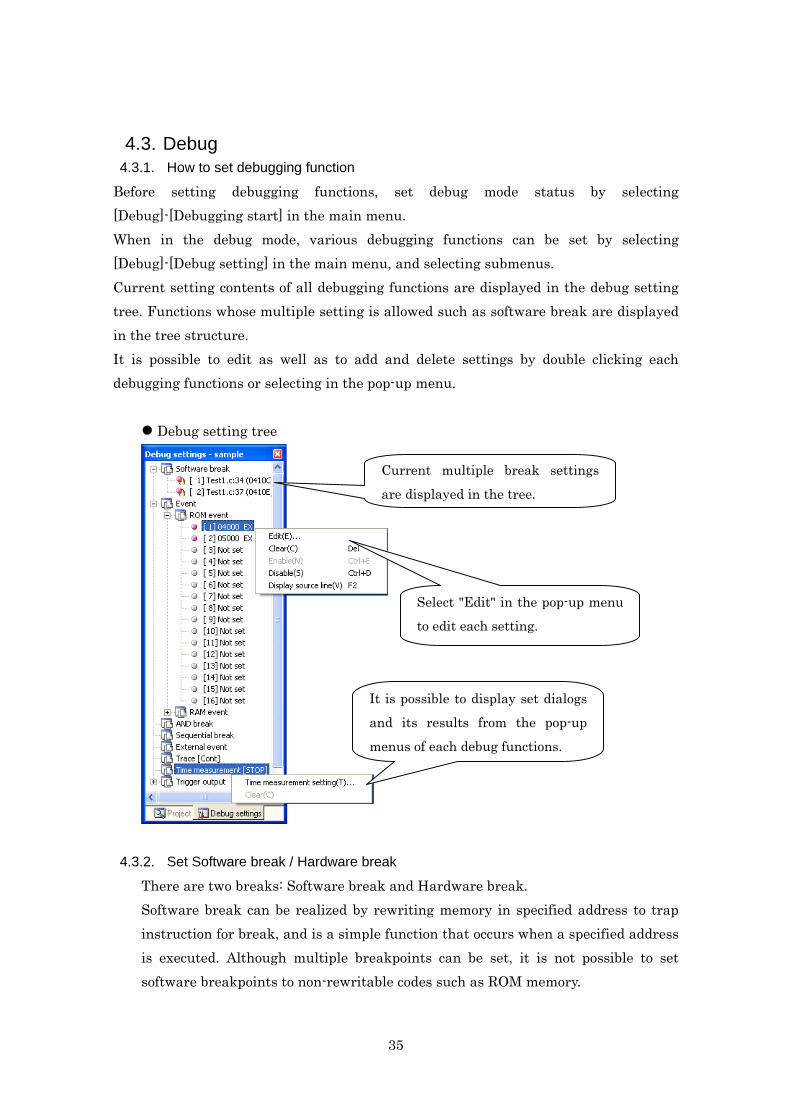
Before setting debugging functions, set debug mode status by selecting [Debug]-[Debugging start] in the main menu. When in the debug mode, various debugging functions can be set by selecting [Debug]-[Debug setting] in the main menu, and selecting submenus. Current setting contents of all debugging functions are displayed in the debug setting tree. Functions whose multiple setting is allowed such as software break are displayed in the tree structure. It is possible to edit as well as to add and delete settings by double clicking each debugging functions or selecting in the pop-up menu.
Debug setting tree
Current multiple break settings
are displayed in the tree.
Select "Edit" in the pop-up menuto edit each setting.
It is possible to display set dialogs
and its results from the pop-up
menus of each debug functions.
4.3.2. Set Software break / Hardware break
There are two breaks: Software break and Hardware break. Software break can be realized by rewriting memory in specified address to trap instruction for break, and is a simple function that occurs when a specified address is executed. Although multiple breakpoints can be set, it is not possible to set software breakpoints to non-rewritable codes such as ROM memory.
35

Hardware break can be realized by in-circuit emulator or microcomputer debugging circuit, and complicated break conditions can be set. However conditions depend on hardware resources to be realized. Although it is possible to set hardware breaks in non-rewritable area such as ROM memory, settable number of breaks is generally fewer than that of software breakpoints.
Hardware break is effective basically only when the target type is in-circuit emulator. However hardware break with a simulator can be realized as if that with in-circuit emulator, therefore it is possible to set hardware breaks with a simulator.
How to set a software breakpoint 1. When specifying a source file and a line number
A) Select [Software breakpoint setting] in the pop-up menu of the code window, and a software breakpoint is set in the cursor line. By selecting the menu again, the setting is cleared.
B) Click the circle mark on the left side to a line number in the code window, and a software breakpoint is set in the line. By clicking the mark again, the setting is cleared. No circle mark in a line indicates the line does not have corresponding code output by a compiler. (Example: When optimization is enabled in compiler option setting)
C) BP command Specify a source file and a line number directly with the BP command. (Example: Type “BP .Test.c:77” when setting a breakpoint in the 77th line of the source file “Test.c”.)
2. When specifying an address A) Select [Debug]-[Debug setting]-[Software break…] in the main menu, then
the “Software breakpoint setting” dialog box appears. Set an address in it.
36

B) Select [Software break] in the debug setting tree and select [Add…] from the pop-up menu, and the “Software breakpoint setting” dialog box appears. Set an address in it as A).
C) BP command Specify a source file and a line number directly with the BP command.
How to set a hardware break
1. When specifying a source file and a line number A) Select [Hardware breakpoint setting] in the pop-up menu of the code window,
and a hardware break is set in the cursor line. By selecting the menu again, the setting is cleared.
B) Hold down the Ctrl key while click the circle mark on the left side to a line number in the code window, and a hardware break is set in the line. By clicking the mark again, the setting is cleared. No circle mark in a line indicates the line does not have corresponding code output by a compiler. (Example: When optimization is enabled in compiler option setting)
C) BH command Specify a source file and a line number directly with the BH command. (Example: Type “BP .Test.c:77” when setting a breakpoint in the 77th line of the source file “Test.c”.)
2. When specifying an address
A) Select [Event] in the debug setting tree and select [Add…] from the pop-up menu, and the “Event setting” dialog box appears. Set required items such as addressed, status, etc. in it. When setting a break, check the “Break” check box.
37

Check here
B) BH command Specify an address directly with the BH command.
A hardware break can be cleared from the pop-up menu of each break settings displayed in the debug setting tree, or with the BC/BHC command.
4.3.3. Execute a program
The following four ways are available to execute a program. A) Go ---------------- Execution continues until a break occurs.
Select [Debug]-[Go] in the main menu or execute with the G command. B) Step-in ---------- Execute one line.
Select [Debug]-[Step-in] in the main menu or execute with the T command. C) Step-over ------- Execute one line. (Regard a function call and a jump
instruction as one line) Select [Debug]-[Step-over] in the main menu or execute with the P command.
D) Step-out -------- Run the user program until the current function returns to its caller. Select [Debug]-[Step-out] in the main menu or execute with the G@ command.
4.3.4. Display / Change register
The following ways are available to display or change microcomputer’s general purpose register values.
38
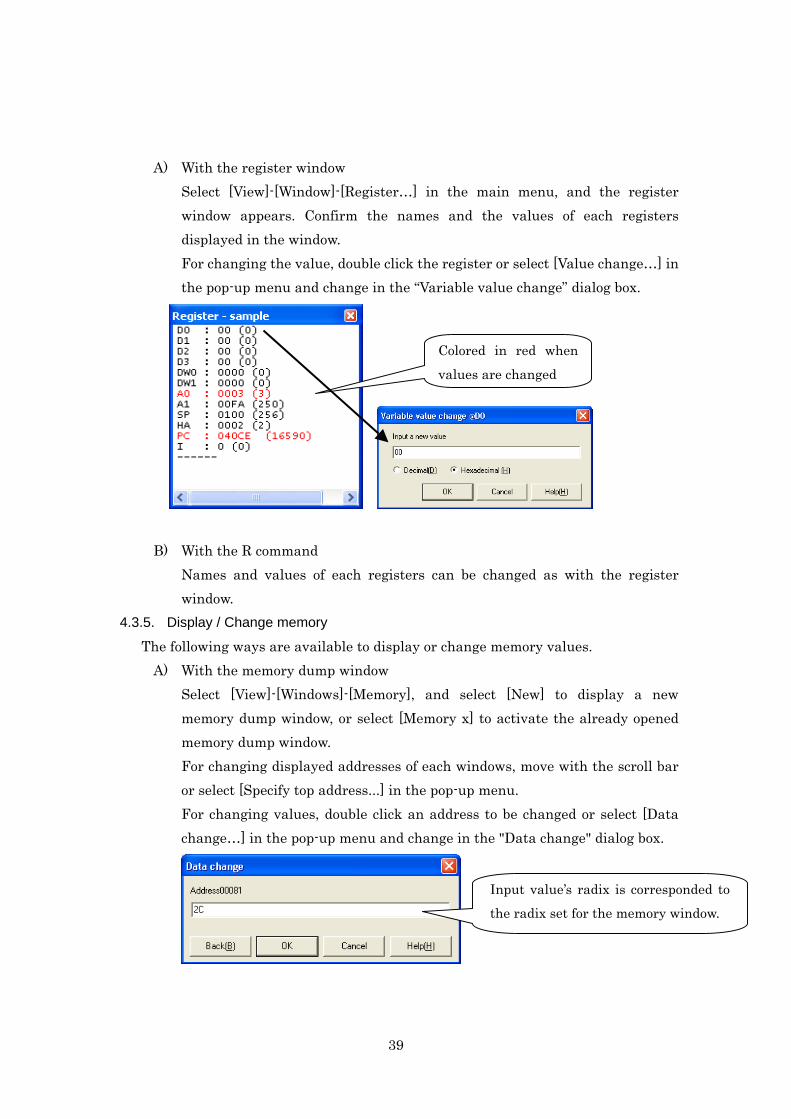
A) With the register window
Select [View]-[Window]-[Register…] in the main menu, and the register window appears. Confirm the names and the values of each registers displayed in the window. For changing the value, double click the register or select [Value change…] in the pop-up menu and change in the “Variable value change” dialog box.
Colored in red when
values are changed
B) With the R command
Names and values of each registers can be changed as with the register window.
4.3.5. Display / Change memory
The following ways are available to display or change memory values. A) With the memory dump window
Select [View]-[Windows]-[Memory], and select [New] to display a new memory dump window, or select [Memory x] to activate the already opened memory dump window. For changing displayed addresses of each windows, move with the scroll bar or select [Specify top address...] in the pop-up menu. For changing values, double click an address to be changed or select [Data change…] in the pop-up menu and change in the "Data change" dialog box.
Input value’s radix is corresponded tothe radix set for the memory window.
39

B) With the D command / the E, F command Memory values of specified address can be displayed with the D command and changed with the E, F command.
4.3.6. Display / Change variable
The following ways are available to display or change variable (symbol) values. A) With the Real-time watch window
Select [View]-[Window]-[Real-time watch…] in the main menu, and the “Real-time watch” window appears.
For displaying or changing variable (symbol) values, the variable (symbol) needs to be registered as watch. Select [Add watch…] in the pop-up menu of the “Real time watch” window, and the “Watch registration” dialog box appears. Specify register variable (symbol) values in it.
Variable (symbol) values can be selected from the variable (symbol) list of source files. Click the […] button at the right of the [Symbol/address] entry box in the [Watch registration] dialog, and select a variable in the [Address specification] dialog box.
40

When a file is selected from the filelist, its variable list is displayed.
It is also possible to directly register variable (symbol) values in the code window by selecting the value with the mouse and selecting [Debug]-[Watch registration] in the pop-up menu. For changing values, select the variable (symbol) to be changed in the “Real-time watch” window, double click it or select [Value change…] in the pop-up menu, and the “Variable value change” dialog box appears. Type and change values in this dialog box.
B) With the Local variable-call history window For displaying or changing local variable values, use the “Local variable/call history” window. Local variable values which can be referred within the current scope are displayed in the “Local variable/call history” window when the program stops.
41
Values can be changed as described in A) “Real-time watch window“.
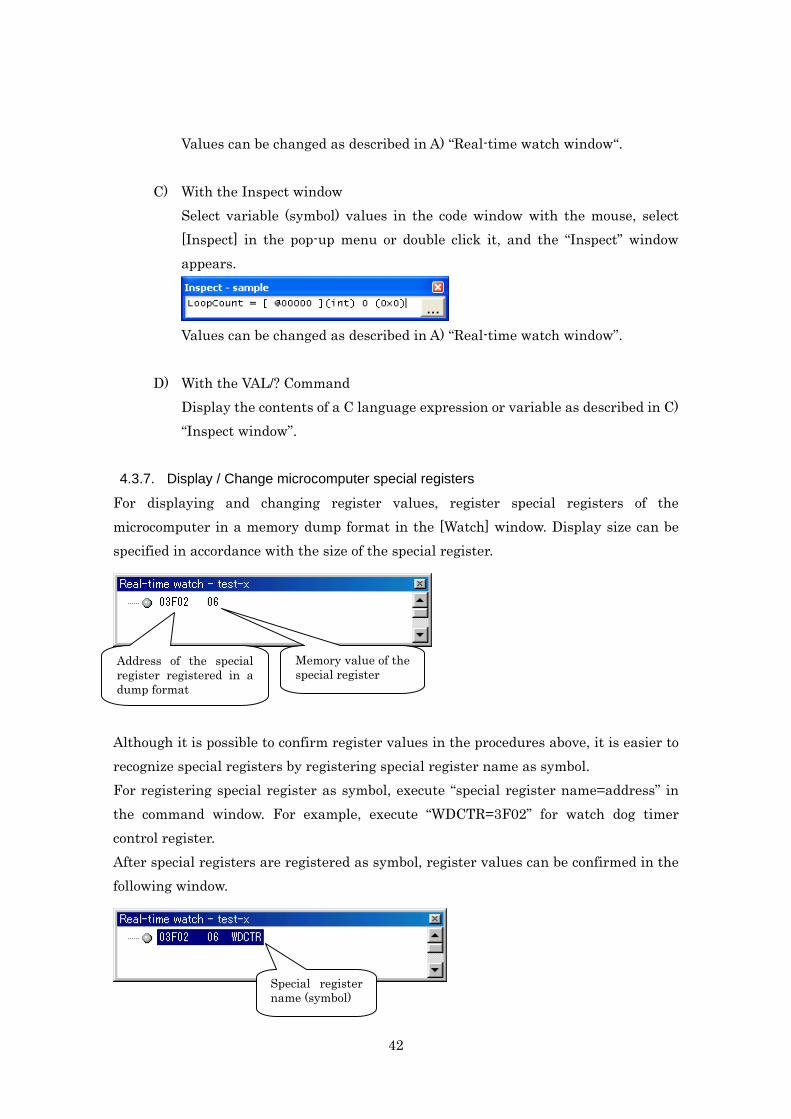
C) With the Inspect window Select variable (symbol) values in the code window with the mouse, select [Inspect] in the pop-up menu or double click it, and the “Inspect” window appears.
Values can be changed as described in A) “Real-time watch window”.
D) With the VAL/? Command Display the contents of a C language expression or variable as described in C) “Inspect window”.
4.3.7. Display / Change microcomputer special registers
For displaying and changing register values, register special registers of the microcomputer in a memory dump format in the [Watch] window. Display size can be specified in accordance with the size of the special register.
Address of the specialregister registered in adump format
Memory value of thespecial register
Although it is possible to confirm register values in the procedures above, it is easier to recognize special registers by registering special register name as symbol. For registering special register as symbol, execute “special register name=address” in the command window. For example, execute “WDCTR=3F02” for watch dog timer control register. After special registers are registered as symbol, register values can be confirmed in the following window.
Special registername (symbol)
42

For special register definition information, get special register routine files from our microcomputer development tool download site. Note that if special variables are registered in a memory dump format in the [Watch] window, register values cannot be changed. Use the E command for changing the value. 4.3.8. Display execution history
Program execution histories (execution addresses) can be displayed and confirmed in the “Real-time trace” window. For displaying the window, select [View]- [Window]- [Real-time trace…] in the main menu. By default, execution histories from the program start to the end are recorded. When the program stops, the histories are automatically displayed in the window. As the real-time trace function, it has various functions such as storing execution histories of between area events, after an event and events being executed, as well as storing information on memory access.
Trace window (When selecting disassembler / source output mode)
Disassembler output can be
displayed from the pop-up
menu of the “Trace” window.
Source output can be displayed
from the pop-up menu of the
“Trace” window.
Note that there is limitation on tracing therefore older execution histories are overwritten in the normal mode if exceeded. (Later execution histories before stop are stored.) For setting real-time trace, select [Debug]-[Debug settings]-[Trace…] in the main menu, or select [Trace] in the debug setting tree and select [Trace setting…] in the pop-up menu.
43

For details, refer to the online help.
44
5. Useful functions 5.1. How to run DebugFactory Builder
5.1.1. Settings for startup
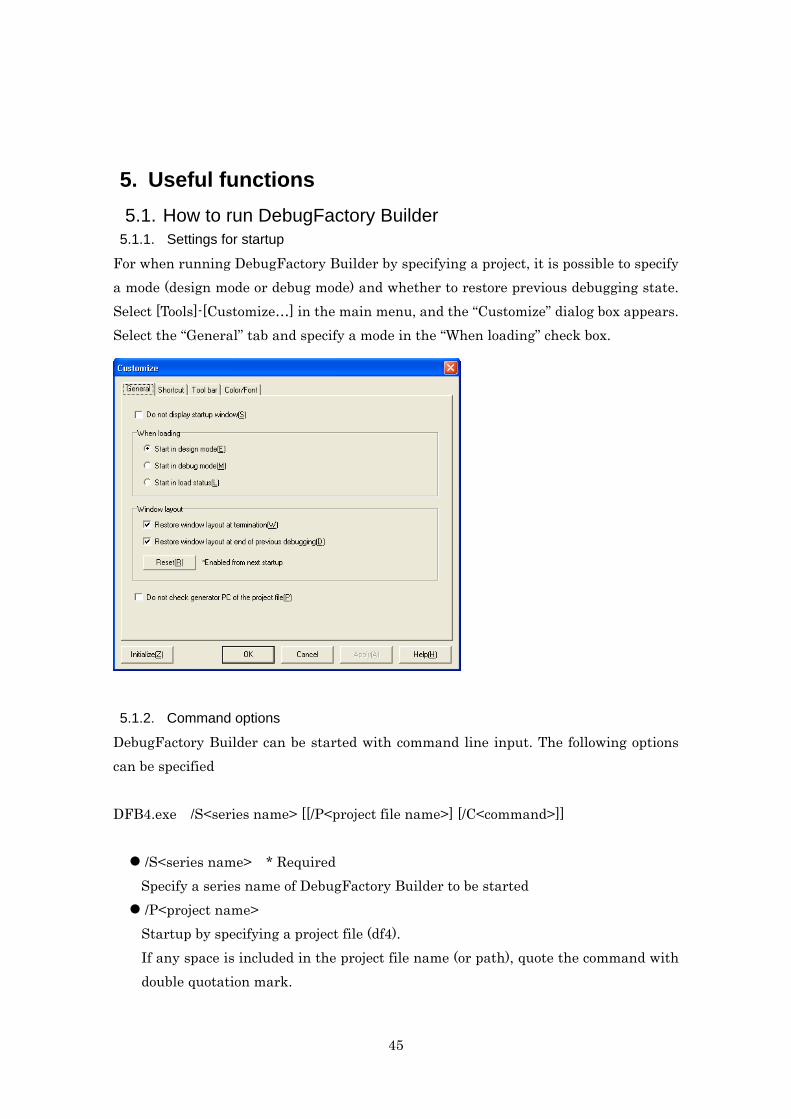
For when running DebugFactory Builder by specifying a project, it is possible to specify a mode (design mode or debug mode) and whether to restore previous debugging state. Select [Tools]-[Customize…] in the main menu, and the “Customize” dialog box appears. Select the “General” tab and specify a mode in the “When loading” check box.
5.1.2. Command options
DebugFactory Builder can be started with command line input. The following options can be specified DFB4.exe /S<series name> [[/P<project file name>] [/C<command>]]
/S<series name> * Required Specify a series name of DebugFactory Builder to be started /P<project name> Startup by specifying a project file (df4). If any space is included in the project file name (or path), quote the command with double quotation mark.
45

/C<command> Execute a command at startup. If any space is included in the command, quote the command with double quotation mark.
By combining the following options with options in 5.2 ”Control debug mode” or the q! command for forcible termination, continuous test using batch file can be performed.
5.2. Control debug mode 5.2.1. Control by commands
DebugFactory Builder has the DEBUGMODE command which can control debug mode with command line input. The following options can be specified and used for automatic testing just like startup options.
/OPEN Open the target on the basis of the target settings set in the project. Switch to the debug mode. /CLOSE Close the target. Switch to the design mode. /LOAD Open the target on the basis of the target settings set in the project, and load the program to be debugged set in the project.
5.2.2. Settings for debug mode
DebugFactory Builder can execute commands in a macro file “Init.mcr” when the debug mode is turned on by starting debugging (opening the target) if the macro file is stored in the same folder as a project file. If preprocesses (loading executable files, setting register values, etc.) needed for debugging executable files are previously written, they are automatically executed every time. The Init.mcr file can be edited in the “Macro editing/execution” window. For details, refer to 5.5 “Edit macro”.
46

5.3. User processing of make function When using incorporated make environment as make method, a make file is generated using information from component source files in the project tree, compile options, section settings, etc. It becomes possible to execute user processing after make (link) by editing this make file. Specifically, add user processing in the following place in a make file. #======================================================== # User definition processing after make #======================================================== #===================DFUSRADEF_S========================= **Add user processing here** #===================DFUSRADEF_E========================= With this function, it is possible to convert a EX format execution file to a HEX format file simultaneously with make processing of DebugFactory Builder, for example. An example of user definition processing is shown below. #======================================================== # User definition processing after make #======================================================== #===================DFUSRADEF_S========================= excv101.exe $(PROJECT) #===================DFUSRADEF_E=========================
5.4. Measure performance 5.4.1. Profile function (PROF)
The profile function calculates frequency of access (execution) of each function (subroutines). By this function, it can be presumed that the execution speed of which function (subroutine) should be raised to enhance the total performance. For using the profile function, this function needs to be enabled with the PROF command (enter “PROF ON”) before executing the program. After the program is executed and stopped, if the PROF command is executed (enter “PROF”), the calculated result is output. Note that this function is realized by sampling the program counter during user program execution, therefore use this calculated result only as a guide.
47

5.4.2. Coverage function (COV)
The coverage function indicates which addresses in the program were executed and which addresses were not executed during user program execution. When the range in functions (or in files) is specified, the achievement ratio in the unit can be acquired. This function is effective in confirming at the end of the test whether all the programs have been tested. For using the coverage function, this function needs to be enabled with the COV command (enter “COV ON”) before executing the program. After the program is executed and stopped, coverage information is displayed with the COV command. (For options of the COV command, refer to the online help)
5.5. Edit / Execute macro The macro function builds new commands by combining multiple dialog commands, and has a C language-like control structure (if, for, while, do, break, etc.) so that efficient new commands can be defined. Created macro commands can be executed just as other dialog commands. New macros can be defined using the {...} command in the command window. However, DebugFactory Builder has the “Macro editing/execution” window which specialized in macro editing, etc. as more convenient means. The “Macro editing/execution” window can be opened by selecting [Tool]-[Macro editing…] in the main menu, or by clicking the leftmost icon button in the tool bar for macro. (In order to display the "Edit/Execute macro" window, it is necessary to previously check “McrExec” in the “Plug-in setting” dialog box displayed by selecting [Tool]-[Plug-in setting…] in the main menu.)
48

The macro Init.mcr described in 5.2.2 and other 5 macros can be defined and registered, and they can also be executed in the same dialog. The registered macros can be executed by selecting [Tools]-[Macro execution]-[Macro x] or from the tool bar for macro.
49

5.6. Save debugging functions 5.6.1. Save/Load debugging settings
DebugFactory Builder allows you to save three settings for software break, hardware event (break) and real-time watch respectively. For saving settings, select [Software breakpoint] or [Hardware break] in the debug setting tree, or display the “Real-time watch” window, and select [Save settings]-[Setting x] from the pop-up menu. For restoring these settings, select [Load settings]-[Setting x] from the pop-up menu. For other debugging functions (such as trace, timer and trigger settings), only the last setting can be saved and restored. For details, refer to 5.6.2. 5.6.2. Restore previous debug setting
DebugFactory Builder allows you to save debug setting status such as break, real-time trace, timer, etc at the end of debugging. When the same executable file is loaded, the previous debug setting status can be restored. In order to enable this function, select [Tools]-[Debugger options…] in the main menu and the “Debugger options” dialog box appears. Select the “General” tab and check “Restore previous debugging setting”.
5.7. Customize DebugFactory Builder allows you to customize the following settings.
Shortcut key It is possible to allocate shortcut keys for each functions and select PanaX, etc. as shortcut type. Tool bar
Control which tool bars are displayed in the main window. Each windows’ settings
Set the color scheme and font for DebugFactory Builder windows. Editor setting Set details such as tab setting and automatic saving.
For customizing shortcut tool bar and each window settings, use the “Customize” dialog box (select [Tool]-[Customize…] in the main menu), and for editor settings, the “Editor option” dialog box (select [Tool]-[Editor option…] in the main menu).
50

Settings using the customize function are reflected in all projects.
51

6. Appendix 6.1. Debug function list
Break Software break: Up to 255 points
Hardware break Execution address break: Up to 16 events
Condition: area specification, pass count specification Data access break: Up to 16 events
Condition: area specification, pass count specification data(bit mask) specification read, write, access (read/write) specification
match/not match specification AND break: One breakpoint Sequential break: (9 levels) One breakpoint Trace full break External break: 8 bit (data comparison, mask enable)
Trace 32K frames Normal mode, Delayed trigger mode, Multi mode ROM/RAM event (OR, AND, SEQ) All cycles
Time measurement Continuous measurement mode, Partial one-shot mode, Partial maximum mode Time watch mode
Trigger output 8 bits (event output enable, RAM data output enable) RAM monitor Fixed area: 128K bytes Switchable area: 128K bytes Profile Correct function access ratios Coverage Instruction/Data coverage
For details, refer to the online help.
52

6.2. Environment file (*.df4 / *.dft / DFbuild.ini) DebugFactory Builder creates the following three files (*.df4 / *.dft / DFbuild.ini) to save projects and user information. [*.df4] As basic information about the project, the following contents are stored.
- Component source files of the project - Target setting information (selected product type, target type, etc) - Make settings (language tool, compile option, section setting, etc.)
This file is essential to DebugFactory Builder. [*.dft] As temporary information used for debugging (mode), the following contents are stored.
- Debug setting information to be restored (watch registration, break setting, event setting)
[DFBuilder.ini] As information on user environment, the following contents are stored.
- Customized settings Common customized settings (shortcut key, tool bar, etc.) Editor options (character code, external editor, etc.) Debugger options (verify check, symbol display specification, etc) Plug-in settings, External tool settings
- Window layout One file is created for each user environment, and this file is stored under the following directory in the Windows 2000/XP environment.
C:\Documents and Settings\<account name of Windows>\ApplicationData \Panasonic\DebugFactory Builder\MN101CE\
53
Contact for inquiry
For any inquiries concerning technical material on this manual, please contact us at the following URL.
User support Semiconductor Company Matsushita Electric Industrial Co., Ltd. URL: http://panasonic.co.jp/semicon/e-micom/inquiry
DebugFa
Septem
Matsushit
MN101C/E Series ctory Builder for MN101C/E
Tutorial
ber 29, 2006 3rd Printing
a Electric Industrial Co., Ltd.
54


![DebugFactory Builder 4 for AMOT Users Manual - OBJECT · DebugFactory Builder 4 for AMOT Users Manual - 7 - [2] Attached Software and Documents 2.1 CD-ROM Attached CD-ROM includes](https://static.fdocuments.us/doc/165x107/5afa97be7f8b9a32348e0109/debugfactory-builder-4-for-amot-users-manual-builder-4-for-amot-users-manual-.jpg)


