Dealmakers - Pitcher
30
Dealmakers: Mid-market M&A in Australia 2021 2021
Transcript of Dealmakers - Pitcher

Dealmakers:Mid-market M&A in Australia 2021
2021

ContentsExecutive summary 1
Trend and survery highlights 2
Confidence in Australia remains strong 3
Mid-market deal drivers 10
Buyer and seller alignment 14
Deal completion challenges 17
Spotlight on sectors 20
Methodology 25
About the surveyWelcome to Dealmakers: Mid-market M&A in Australia 2021, produced in collaboration with Mergermarket, an Acuris company. Pitcher Partners has commissioned Mergermarket to again canvass the opinions of 60 M&A dealmakers in Australia regarding their expectations for the year. Interviews were carried out from October to November 2020.

1
Executive summaryAfter a tough year for Australian M&A amid the COVID-19 pandemic, there is cautious optimism about the outlook for the year ahead, particularly in the mid-market.Merger and acquisition (M&A) activity in Australia slowed sharply during 2020, an inevitable consequence of the COVID-19 pandemic. However, by the fourth quarter of the year, appetite for dealmaking started to recover – and this research suggests that this recovery will strengthen over the course of 2021 and beyond.
Indeed, Australia looks set to bounce back from the pandemic more quickly than other Asia-Pacific markets, with respondents praising the country’s response to the COVID-19 pandemic. As a result, the majority of respondents now anticipate increasing their investment and M&A activity during 2021. Despite the impact of the COVID-19 pandemic, respondents give Australia an 81% confidence score when asked to score the current environment for M&A in the country, based on factors such as ease of doing deals, sourcing opportunities and greater confidence in the economy given the relatively mild impact of the pandemic compared to other countries.
The mid-market segment (deals valued between AU$10m and AU$250m) is expected to enjoy a particularly strong uplift in M&A. Two-thirds of respondents say Australia’s mid-market offers better opportunities for dealmaking than what is available in other countries, and more than half expect to undertake at least one mid-market transaction over the next 12 months.
However, it would be too optimistic to assume that M&A activity will be restored to pre-COVID-19 levels overnight. While the promise of COVID-19 vaccines offers hope that the end of the pandemic is in sight, considerable uncertainty remains, although relative to the rest of the world Australia appears to be more open for M&A business.
Much, however, will depend on the ability of buyers and sellers to agree on pricing. This research suggests the valuation gap remains one of the most significant obstacles to dealmaking in the Australian M&A market. Competition for targets is now expected to reduce given buyers are more conscious of the ongoing risk, and thus sellers will need to manage their expectations. Indeed, almost nine in 10 respondents expect to attach a risk premium to their deals – in some cases, that premium will be considerable. In contrast, rising public stock valuations may prompt sellers to seek out higher prices.
Nevertheless, the evidence of this research is that dealmakers in Australia are beginning to think about putting the COVID-19 pandemic behind them, with the mid-market leading the way. Such optimism must be tempered by caution, but the country’s impressive management of the crisis has left it in a strong position to bounce back.
Respondents give Australia an 81% confidence score
when asked to rate the current environment for
M&A in the country, based on factors such as ease of doing deals and sourcing
opportunities.
81%
NEG
ATIVE
POSITIV
E
CO
NFID
ENC
E SCO
RE
Abo
ut P
itche
r Pa
rtne
rsSp
otlig
ht o
n se
ctor
sD
eal c
ompl
etio
n ch
alle
nges
Buye
r and
sel
ler
alig
nmen
tM
id-m
arke
t dea
l dr
iver
s
Con
fiden
ce in
A
ustr
alia
rem
ains
st
rong
Tren
ds a
nd
surv
ey h
ighl
ight
sEx
ecut
ive
sum
mar
yC
onte
nts

2
Trends and survey highlights
75%of dealmakers say Australia’s
economic recovery will be quicker and stronger than other markets
in the Asia-Pacific region
65%say Australia’s mid-market M&A
opportunities are superior to those in other markets
-19%Change in 2020 deal volume (246) for mid-market M&A in Australia since 2019 (302)
TMT is seen as the top opportunity sector, followed by consumer and
pharma, medical and biotech
-17%Change in 2020 deal value
(AU$14.6bn) for mid-market M&A in Australia since 2019 (AU$17.7bn)
Valuation gaps between buyers and sellers will be the top challenge
facing mid-market dealmakers in 2021, alongside access to capital
and financing
61%say Australian M&A will bounce back to pre-COVID-19 levels by the end of 2021
78%say private equity deploying capital
is predicted to be the main deal driver in the mid-market in 2021
58%say they are planning to make
an acquisition into the Australian mid-market in the year ahead,
an increase from the 42% who said the same in June 2020
Abo
ut P
itche
r Pa
rtne
rsSp
otlig
ht o
n se
ctor
sD
eal c
ompl
etio
n ch
alle
nges
Buye
r and
sel
ler
alig
nmen
tM
id-m
arke
t dea
l dr
iver
s
Con
fiden
ce in
A
ustr
alia
rem
ains
st
rong
Tren
ds a
nd
surv
ey h
ighl
ight
sEx
ecut
ive
sum
mar
yC
onte
nts

Confidence in Australia remains strong

4
Confidence in Australia remains strongWhile M&A in Australia has inevitably slowed during 2020, due primarily to the negative impacts of COVID-19, dealmakers expect a significant improvement in 2021.As the COVID-19 pandemic wreaked havoc on markets around the world, Australian M&A took an expected hit in 2020, particularly during the first six months of the year and in line with global trends. Yet, whilst overall deal activity has declined, there is now widespread confidence that M&A will bounce back strongly over the next 12 months.
Amongst dealmakers surveyed, 84% plan to conduct M&A in Australia in 2021, more than any other market in the Asia-Pacific region (figure 1). Three-quarters of respondents tip Australia to make one of the quickest economic recoveries in the region, a view shared by the International Monetary Fund. It expects Australia’s economy to have shrunk by 4.2% during 2020, a smaller decline than other advanced economies in the region, and to rebound 3% in 2021.1
Such forecasts reflect Australia’s robust economic performance over a number of years (which respondents in previous iterations of this report have consistently recognised) as well as its resilience during the pandemic. “We want to invest in destinations that offer a stable economy,” says one respondent. “And the prospects of a faster recovery adds to [Australia’s] appeal as we assess whether we can implement our plans successfully.”
Additionally, Australia’s widely-praised handling of the pandemic – a combination of tough lockdowns and a well-organised test and trace strategy, as well as economic support for businesses and individuals – has boosted its appeal as an investment destination. As such, 63% of respondents believe the country’s management of the pandemic has made it more attractive to investors and will contribute to a greater uplift in M&A (figure 2).
“The mild economic impact of the pandemic is important,” says one respondent. “We can go ahead with investment decisions much more confidently.”
For these reasons and many others, on average, respondents give Australia a rating of 8.1 out of 10 (81% confidence score) when asked to evaluate the current environment for M&A in the country, based on factors such as ease of doing deals and sourcing opportunities. This sentiment looks set to translate into significantly increased deal activity in the coming months.
Respondents also widely regard the country as offering better deal opportunities than other markets, both overall (53%) and, particularly, at the mid-market level (65%) (figure 3). Looking across the whole market, 86% of respondents believe Australia offers deals that are better than, or at least as good as, opportunities available elsewhere.
1 World Economic Outlook, IMF, October 2020. [https://www.imf.org/en/Publications/WEO/Issues/2020/09/30/world-economic-outlook-october-2020]
Figure 1: Which of the following geographies within Asia-Pacific will see the quickest economic recovery from the COVID-19 health crisis? Where will you be looking for M&A opportunities within the next 12 months?
India
Korea
Hong Kong
Japan
Singapore
Emerging Southeast Asia (excluding Singapore)
China
Australia
Quickest economic recovery Planned M&A within next 12 months
75%
84%
62%
16%
80%
56%
90%
13%
33%
13%
50%
11%
62%
16%
25%
13%
Abo
ut P
itche
r Pa
rtne
rsSp
otlig
ht o
n se
ctor
sD
eal c
ompl
etio
n ch
alle
nges
Buye
r and
sel
ler
alig
nmen
tM
id-m
arke
t dea
l dr
iver
s
Con
fiden
ce in
A
ustr
alia
rem
ains
st
rong
Tren
ds a
nd
surv
ey h
ighl
ight
sEx
ecut
ive
sum
mar
yC
onte
nts

5
Figure 2: Has Australia’s COVID-19 response and relatively mild economic impact from the pandemic increased its appeal as an investment destination compared to alternative markets?
Figure 3: Generally, do you feel Australia offers better or worse M&A opportunities compared to other markets?
63%Yes
5%Unsure
32%No
Mid-market opportunities
Overall M&A opportunities
Better Worse No di�erence
53%
65% 5% 30%
13% 33%
“We want to invest in destinations that offer a stable economy, and
the prospects of a faster recovery add to [Australia’s] appeal as we assess whether we can
implement our plans successfully.”
RESPONDENT
Abo
ut P
itche
r Pa
rtne
rsSp
otlig
ht o
n se
ctor
sD
eal c
ompl
etio
n ch
alle
nges
Buye
r and
sel
ler
alig
nmen
tM
id-m
arke
t dea
l dr
iver
s
Con
fiden
ce in
A
ustr
alia
rem
ains
st
rong
Tren
ds a
nd
surv
ey h
ighl
ight
sEx
ecut
ive
sum
mar
yC
onte
nts

“We see four key drivers leading M&A in 2021: (1) a likely return to normal
deal levels driven by succession and other related factors; (2) deals put on hold due to COVID-19 will now
move forward; (3) an acceleration in capital markets prompting owners
to potentially test the waters; and (4) potential increasing distressed M&A as
Government stimulus pacakges end and winding up laws are tightened.
Optimism needs to be somewhat tempered due to how quickly things
can change. M&A is driven by confidence and if COVID-19 remains under control and we see stability on capital markets, then signs are good
for a strong year ahead.”
PITCHER PARTNERS
6
The mid-market opportunityAustralia’s mid-market (deals valued between AU$10m and AU$250m) stands out as an area regarded as particularly fruitful by dealmakers. As figure 3 shows, enthusiasm for the quality of mid-market opportunities in Australia compared to other locations is even higher than for the rest of the market.
Many of these respondents have already sought to capitalise on such opportunities: the majority have completed at least one or two such deals over the past 24 months. Now the pace of dealmaking is set to accelerate, with 58% of respondents planning to undertake still further transactions in 2021 (figure 4).
Such a response underlines how quickly confidence in Australia’s mid-market has bounced back since the early months of 2020. “The Australian mid-market is flourishing,” says one respondent. “We are already sourcing targets to improve our technology capabilities.”
Australia’s advantagesThe strong support for Australia reflects the broad-based strengths that have attracted investment over an extended period. Respondents highlight several of these key features which have long been the stalwart of Australia’s primary advantages, stable but strongly reinforced throughout the COVID-19 pandemic:
Political and regulatory stability Australia’s stable political and regulatory climate ranks as the country’s most significant in terms of M&A. Large numbers of respondents also
praise Australia’s transparent and well-understood legal system. These fundamental attributes will continue to drive a competitive advantage in a world where volatility and unpredictability are prevalent. With economic and geopolitical tensions continuing, many investors are looking for safe-haven territories.
New and advanced technologyAustralian businesses continue to invest in innovation and R&D, with new technologies driving disruption and value creation across
a spread of industries. For dealmakers, Australian businesses often represent an opportunity to acquire significant intellectual property assets, as well as to access the country’s dynamic workforce. Mid-market companies are particularly attractive in this regard. “New and advanced technology standards have been very high,” says one respondent.
Deal sourcing opportunitiesAustralia offers attractive opportunities to source good deals at competitive prices. Some 28% of respondents pick this out as an
important attraction in the current environment. Allied to this point, 31% of respondents see valuations as attractive. In particular, “deal sourcing opportunities in the mid-market segment are higher in comparison to other regions in the Asia-Pacific region,” says one respondent. “These targets have shown strong performance, even in the past few months.”
Low risk The ease of doing business in Australia makes the country relatively low-risk for dealmaking, particularly in relation to other markets in Asia-
Pacific. This is quite important in the current environment, where investors remain bruised by the volatility of the past year; risk-averse dealmakers are especially likely to focus on less daunting markets such as Australia.
Abo
ut P
itche
r Pa
rtne
rsSp
otlig
ht o
n se
ctor
sD
eal c
ompl
etio
n ch
alle
nges
Buye
r and
sel
ler
alig
nmen
tM
id-m
arke
t dea
l dr
iver
s
Con
fiden
ce in
A
ustr
alia
rem
ains
st
rong
Tren
ds a
nd
surv
ey h
ighl
ight
sEx
ecut
ive
sum
mar
yC
onte
nts

7
Figure 4: Are you currently considering an acquisition into the Australian mid-market in the year ahead?
Figure 5: What makes Australia an attractive market for M&A?
Yes No Unsure
2020H
Y 20202021
58%37%
42%47%
65%
5%
5%30%
12%
Overall M&A
Mid-market M&A
70%
Government response to and containment of Covid-19
Low risk compared to regional markets
Competitive environment (relatively few buyers/competitors)
Deal sourcing opportunities
Positive economic recovery and outlook (compared to other regional and global markets)
Favourable tax regime
Valuations/Returns
New/Advanced technology
Legal certainty
Political/Regulatory stability
Government response to and containment of Covid-19
Low risk compared to regional markets
Competitive environment (relatively few buyers/competitors)
Deal sourcing opportunities
Positive economic recovery and outlook (compared to other regional and global markets)
Favourable tax regime
Valuations/Returns
New/Advanced technology
Legal certainty
Political/Regulatory stability53%
50%
60%
32%
28%
30%
33%
52%
57%
58%
47%
48%
65%
62%
82%
82%
82%
73%
70%
“Deal sourcing opportunities in the mid-market segment are higher in comparison to other
regions in the Asia-Pacific region. These targets have shown strong
performance, even in the past few months.”
RESPONDENT
Abo
ut P
itche
r Pa
rtne
rsSp
otlig
ht o
n se
ctor
sD
eal c
ompl
etio
n ch
alle
nges
Buye
r and
sel
ler
alig
nmen
tM
id-m
arke
t dea
l dr
iver
s
Con
fiden
ce in
A
ustr
alia
rem
ains
st
rong
Tren
ds a
nd
surv
ey h
ighl
ight
sEx
ecut
ive
sum
mar
yC
onte
nts

Australian M&A: The road to recovery
More than a third of respondents (38%) expect Australian M&A to bounce back to its pre-COVID-19 level by the end of the first half of 2021 – and a further 23% expect the rebound to have been completed by the end of the year (figure 6). Still, it is important to note that significant minorities expect the recovery to take longer, with 23% warning that activity may remain depressed in 2022 and beyond.
Sentiment has improved since the mid-year update to this research was published, with a larger proportion of respondents now anticipating a more rapid return to higher levels of M&A. Nevertheless, the consensus view appears to be that it will take some time for previous levels of buoyancy to return.
This year’s deal data underlines the scale of the recovery now needed simply for Australia to get back to where it was prior to the pandemic. In 2020, Australia reported 963 deals, a 20% decline compared to figures for 2019 (1,204 transactions). The decline was not quite so precipitous in value terms, slipping 4% to AU$94.3bn from AU$97.7bn in 2019, though this was still a significant decline.
As figure 7 shows, the second half of the year did see the beginnings of a recovery. Deal volumes increased sharply during the third quarter, with deal values bouncing back especially strongly during the final three months of the year. Indeed, Q4 saw AU$55.7bn in deals, a large swing in deal value from Q1 (AU$11.5bn) and comparatively better in value terms than Q4 in 2019 (AU$25.7bn).
For the half-year, deal values increased 170% in value (AU$68.8bn) and 23% (531 deals) in volume in H2 compared to H1 (AU$25.4bn, 432 deals).
In part at least, the fourth quarter’s strong showing was due to a number of larger transactions, with volumes still at more modest levels. Notable examples of large fourth-quarter deals included Bain Capital’s AU$3.5bn restructuring of Virgin Australia, the AU$1.7bn demerger of Deterra Royalties in the mining sector, and the AU$1.5bn takeover of Infigen Energy by Spain’s Iberdrola.
Figure 6: When do you expect Australian M&A to be back at pre-COVID-19 levels?
End of H1 2021 End of H2 2021 Later than H2 2022End of H1 2022
38% 23% 15% 23%
Figure 7: Australian M&A
100200300400500600700800900
100011001200130014001500
10,000
20,000
30,000
40,000
50,000
60,000
70,000
Q4Q3Q2Q1Q4Q3Q2Q1Q4Q3Q2Q1Q4Q3Q2Q1Q4Q3Q2Q12016 2017 2018 2019 2020
Dea
l vol
ume
Deal value (AU
$m)
Deal Volume Deal Value (AU$m)Trailing 12 months (Deal volume)Source: Dealogic
8
Abo
ut P
itche
r Pa
rtne
rsSp
otlig
ht o
n se
ctor
sD
eal c
ompl
etio
n ch
alle
nges
Buye
r and
sel
ler
alig
nmen
tM
id-m
arke
t dea
l dr
iver
s
Con
fiden
ce in
A
ustr
alia
rem
ains
st
rong
Tren
ds a
nd
surv
ey h
ighl
ight
sEx
ecut
ive
sum
mar
yC
onte
nts

Australian M&A: The road to recovery (cont)
Lessons from the pastOne possible indicator of when deal activity might recover from the pandemic is the experience of similar market crises in the past. Following the global financial crisis of 2007, it was notable that Australia’s M&A saw two years of sharp declines in deal values before recording a modest recovery in 2010; it was not until 2015 that the average deal size exceeded the 2007 figure (figure 8). Deal volumes were also muted in the wake of the global financial crisis, only rising back above the previous peak in 2011.
That said, the post-financial crisis headline data masks some significant variations. As figure 9 shows, private equity M&A activity remained relatively stable during the crisis and thereafter, while mid-market deal volumes and inbound deals declined over an extended period, albeit with some stronger years. In value terms, private equity has seen an uptick over the years since 2012, spiking sharply higher over the past two years. But other areas of the market have been much less consistent; the energy sector, for example, has seen both values and volumes fall markedly in recent times.
Source: Dealogic Source: Dealogic
0
300
600
900
1200
1500
20202019201820172016201520142013201220112010200920082007
Num
ber o
f dea
ls
Private equity Foreign inbound Mid-marketEnergy, mining and utilities (EMU) Total deals (excl EMU)
Figure 9: Australian M&A: deal volumes by deal typeFigure 8: Australian M&A by average deal size and median deal value
$0
$30
$60
$90
$120
$150
20202019201820172016201520142013201220112010200920082007
Dea
l Val
ue (A
U$m
)
Average deal size (AU$m) Median (AU$m)
9
Abo
ut P
itche
r Pa
rtne
rsSp
otlig
ht o
n se
ctor
sD
eal c
ompl
etio
n ch
alle
nges
Buye
r and
sel
ler
alig
nmen
tM
id-m
arke
t dea
l dr
iver
s
Con
fiden
ce in
A
ustr
alia
rem
ains
st
rong
Tren
ds a
nd
surv
ey h
ighl
ight
sEx
ecut
ive
sum
mar
yC
onte
nts

Mid-market deal drivers

11
Mid-market deal drivers
2 Pitchbook, December 2020. [https://pitchbook.com/blog/what-is-dry-powder]
“PE firms will be looking to take advantage of the lower valuations and distressed deal opportunities.”
RESPONDENT
Respondents say private equity will drive M&A in the mid-market, although offshore investment may decline as travel restrictions remain in place and borders stay closed.With private equity (PE) continuing to sit on record amounts of dry powder – more than US$1.5 trillion by some estimates 2 – respondents say the sector will be the leading driver of M&A in Australia’s mid-market over 2020. “PE firms will be looking to take advantage of the lower valuations and distressed deal opportunities,” says one respondent. Some 78% of respondents point to this driver, with 65% suggesting that succession planning will also be an important driver of mid-market dealmaking (figure 10).
Other important drivers in the mid-market include agreement on valuations between buyers and sellers – potentially reflecting the decreased competition for assets during the COVID-19 pandemic.
Considering the market overall, many respondents predict that corporates will engage in restructuring exercises as they focus on survival and a bounce-back in their businesses. Almost three-quarters (73%) of respondents expect divestments of non-core assets to drive M&A activity. Another 55% say that dealmakers will turn to M&A given the headwinds impeding organic growth.
Looking forward, PE activity in Australia’s mid-market is set to be sustained – and to increase – during 2021. Most respondents (84%) expect PE deals to increase over the next 12 months, including 37% who expect a significant increase (figure 11). “PE firms are more stable financially,” points out one respondent. “They will capitalise on the increase in distressed debt opportunities.”
Figure 10: What will be the main drivers of M&A activity in 2020?
Public-to-private deals
Distress driven (financially forced/insolvency)
Listed companies seeking growth via M&A in light of low organic environment
Low interest rates
Divestiture of non-core assets
Foreign dealmakers into Australia
Valuation alignment between sellers and buyers
Succession planning
Amount of capital to be deployed by Private Equity
Overall M&A Market Mid-market
22%78%
65%
55%
22%
47%
47%
48%
38%
25%73%
12%
15%
10%
7%2%
13%
22%
Abo
ut P
itche
r Pa
rtne
rsSp
otlig
ht o
n se
ctor
sD
eal c
ompl
etio
n ch
alle
nges
Buye
r and
sel
ler
alig
nmen
tM
id-m
arke
t dea
l dr
iver
s
Con
fiden
ce in
A
ustr
alia
rem
ains
st
rong
Tren
ds a
nd
surv
ey h
ighl
ight
sEx
ecut
ive
sum
mar
yC
onte
nts

12
“While our borders are largely closed to international travellers,
there remains interest from foreign buyers in Australian assets. Those with existing
operations are leaning heavily on their local teams to get deals
done. Such is the appetite for Australian assets – new entrants
are pushing the limits of video conferencing and virtual data
rooms to make deals happen.”
PITCHER PARTNERS
Figure 11: What do you expect will happen to the level of mid-market deal activity for the following types of deals over the next 12 months?
Increase significantly Increase moderately Remain the same Decrease moderately Decrease significantly
Distressed M&A
Private equity deals
Outbound M&A
Foreign inbound M&A
Domestic M&A
Overall M&A
18%
3%
37%
13%
57%
48%
42%
28%
47%
63% 22% 2%
13% 3%
26% 23% 23%
20% 23% 12%
26% 8%
11% 32%
Indeed, there is good reason to expect an increase in distressed M&A activity as the pandemic and the related economic slowdown continue to take their toll. More than three-quarters of respondents (76%) predict an increase in this kind of dealmaking over the next 12 months, particularly as the Jobkeeper program and insolvency moratoriums come to an end.
Foreign inbound M&A: Reversing the downtrend?By contrast, the outlook on foreign investment in Australian mid-market companies is more uncertain. While 38% of respondents expect increased foreign investment in 2021, this is much lower than the 75% who said the same before the pandemic began. So far this year, inbound M&A across the whole Australian market has fallen by 2% in value and 32% in volume compared to 2019; inbound mid-market M&A has registered declines of 33% and 38% respectively.
The pandemic has added to the caution of many investors. As figure 11 shows, while 45% of respondents to this research think there will be an increase in inbound M&A over the next 12 months, 35% expect it to fall.
“Dealmakers with previous experience of investing in Australia will want to take advantage of new opportunities here,” says one respondent. But another warns: “Buyers will be more cautious about investing overseas.”
Clearly, while market participants have turned to technology to pursue cross-border M&A activity – conducting virtual roadshows and online due diligence, for example – the difficulties of international travel and face-to-face meetings during the pandemic have hindered international dealmaking.
Abo
ut P
itche
r Pa
rtne
rsSp
otlig
ht o
n se
ctor
sD
eal c
ompl
etio
n ch
alle
nges
Buye
r and
sel
ler
alig
nmen
tM
id-m
arke
t dea
l dr
iver
s
Con
fiden
ce in
A
ustr
alia
rem
ains
st
rong
Tren
ds a
nd
surv
ey h
ighl
ight
sEx
ecut
ive
sum
mar
yC
onte
nts

13
However, there is some prospect for a revision of those views on the upside. As the COVID-19 pandemic abates, countries will be able to reopen their borders and ease travel restrictions. These should have a significant impact on cross-border M&A: 45% suggest such changes would have a positive impact on such deals (figure 12).
Respondents also believe such a shift would help domestic dealmaking – perhaps because of the lift to confidence and the boost to economic activity that easier restrictions would deliver. Some 61% say easing travel restrictions would have a positive effect on dealmaking.
Declining competitionWith foreign investors fewer in number, respondents say the competition for assets will not be as fierce over the next 12 months. Some 75% predict competition will decline, providing an opportunity for some acquirers to capitalise (figure 13).
“The economic situation will restrict inbound investment,” predicts one respondent. Another says: “Raising capital for acquisitions will be tougher.”
Amongst the minority of respondents who do anticipate greater competition, the most likely sources are regarded as corporate buyers within the same industry and domestic PE investors (figure 14). “Investors with higher risk thresholds can make some opportunistic buys,” says one respondent.
Figure 12: What impact would lifted international and domestic travel restrictions and opened borders have on increasing inbound/cross-border dealmaking into Australia?
International
Domestic
Very positive Moderately positive Neutral Moderately negative Very negative
28% 22% 2%15%33%
5% 40% 25% 12% 18%
Figure 13: Do you expect to see increasing competition for assets in the next 12 months?
25%Yes
75%No
International private equity and other funds
Australian private equity and other funds
Corporate buyers in dierent industries (cross-industry)
Corporate buyers within the same industry
2021 2020
47%
53%
93%
73%
100%
31%
92%
39%
Figure 14: If you selected “Yes” to the previous question, from which of the following groups? (Select all that apply)
International
Domestic
Very positive Moderately positive Neutral Moderately negative Very negative
28% 22% 2%15%33%
5% 40% 25% 12% 18%
Abo
ut P
itche
r Pa
rtne
rsSp
otlig
ht o
n se
ctor
sD
eal c
ompl
etio
n ch
alle
nges
Buye
r and
sel
ler
alig
nmen
tM
id-m
arke
t dea
l dr
iver
s
Con
fiden
ce in
A
ustr
alia
rem
ains
st
rong
Tren
ds a
nd
surv
ey h
ighl
ight
sEx
ecut
ive
sum
mar
yC
onte
nts

Buyer and seller alignment

15
Buyer and seller alignmentValuations and financing will pose the greatest challenge to dealmakers in the year ahead.Respondents believe the biggest challenges facing dealmakers in Australia’s mid-market will be centred on valuation issues (the gap between sellers’ expectations on price and what buyers are prepared to pay) and possible financing and capital constraints (figure 15).
ValuationsHalf of respondents see this as standing in the way of dealmaking over the next 12 months. “Targets will not be ready to compromise on the value of their companies,” says one respondent.
Strikingly, however, this figure is down sharply from the 70% who cited the same obstacle in last year’s report.
Many respondents believe sellers are now being more realistic about the prices they can achieve – or will be forced to do so – with less competition for assets and a challenging economic backdrop. The valuation gap has shrunken accordingly – though it still exists.
In the current market environment, cautious buyers may not be prepared to pay the prices they might once have considered. There is also evidence for this view amongst respondents, with more than nine in 10 warning they would apply an additional risk premium to deals under consideration (figure 15). For about a third of respondents, that premium would be more than 10%.
That brings the debate back to the valuation issue. “We need to be able to compensate for any loss of returns because of market instability,” insists one respondent. “We simply cannot ignore the economic and financial risks still posed by COVID-19,” says another. Many market participants clearly intend to take a tough line with sellers.
One additional complication here is the rising value of publicly-listed equities, given that Australia’s stock market – in line with world equity markets – posted strong gains during the final months of the year. Having hit a low of 15.3 in March 2020, the price to earnings ratio of the average Australian stock had risen above 40 by the end of the year. Rising public stock valuations may prompt sellers to once again seek out higher prices in M&A transactions.
FinancingBy contrast, while only 25% of respondents anticipated difficulties with access to finance standing in the way of dealmaking last year, this figure has now doubled, rising to
“Whilst buyers expect vendors to temper their valuation
expectations in the current environment, our experience
begs to differ. Businesses coming to market presently are likely to have performed well in the face
of the pandemic. If anything, vendors coming to market are expecting a premium for their business as they have proven
to be near bullet proof. As such we expect even more robust
discussions on what represents a fair multiple.”
PITCHER PARTNERS
Figure 15: Regarding pricing expectations and changes in expected rates of return, would you apply an additional risk premium to your deals?
38%Yes, between 5% and 10%
5%Yes, up to 5%
45%Yes, greater
than 10%
12%No
Abo
ut P
itche
r Pa
rtne
rsSp
otlig
ht o
n se
ctor
sD
eal c
ompl
etio
n ch
alle
nges
Buye
r and
sel
ler
alig
nmen
tM
id-m
arke
t dea
l dr
iver
s
Con
fiden
ce in
A
ustr
alia
rem
ains
st
rong
Tren
ds a
nd
surv
ey h
ighl
ight
sEx
ecut
ive
sum
mar
yC
onte
nts

16
50% among respondents. “Access to capital will be limited while the effects of COVID-19 linger,” says one respondent.
While buyers with financing available may be able to find M&A opportunities, those that would need to raise capital to fund an acquisition may struggle to do so.
Still, one possible source of that capital may be buyers undertaking internal restructurings. Many respondents said they intended to use the proceeds of divestments to meet their financing needs – for ongoing operational requirements, but also, potentially, for future acquisitions. “Divesting is a good option for raising growth capital,” says one respondent. “We will be expanding our operations and a sale is a better option than other financing sources.”
Worth mentioning, for those borrowers to whom lenders feel comfortable making advances, the cost of debt is at an all-time low. With monetary policy so accommodating, more than half of respondents say they would be prepared to pay a premium for the right deal: between 5-10% more for 20% of respondents, and more than 10% extra for 32% of respondents (figure 17).
Earn-out structuresAs buyers contemplate these issues, one possibility is that they will seek to share risk with sellers, using mechanisms such as earn-out structures, which tie a portion of the purchase price to future earnings targets. “This is the optimal way to share responsibility,” says one respondent. “The interests of sellers and buyers are aligned, and sellers will be focused and attentive.”
However, while such mechanisms offer an opportunity to help bridge the valuation gap, many sellers will feel anxious about their ability to hit pre-determined earnings targets given the ongoing volatility and uncertainty of the operating environment. “In a COVID-19 environment, the threats are unpredictable,” warns one respondent.
Indeed, as figure 18 shows, 40% of respondents to this research are concerned that earn-out structures may not be practical in the context of COVID-19 – though 52% believe they still have a role to play (figure 18).
Figure 16: What are the top challenges facing mid-market dealmakers in Australia in the next 12 months?
7%
Unstable political environment at homeUnstable political environment at home13%
8%Social and environmental activism or unrestSocial and environmental activism or unrest
50%
2%5%
Corruption and reputational riskCorruption and reputational risk
7%3%
Oil price volatilityOil price volatility
23%23%
Regulatory changeRegulatory change
28%43%
Delays in governmental approvals for foreign investmentDelays in governmental approvals for foreign investment
35%27%
Di�culties with the due diligence process (travel restrictions, closed borders, etc)Di�culties with the due diligence process (travel restrictions, closed borders, etc)
40%Uncertainty around economic recovery*Uncertainty around economic recovery*
43%47%
Volatility on equities marketsVolatility on equities markets
50%25%
Access to capital or financingAccess to capital or financing
50%70%
Valuation gap between buyer and sellerValuation gap between buyer and seller
2021 2020
Figure 17: Conversely, does the current low cost of debt encourage you to take more risks and thus does this flow into your willingness to pay additional consideration?
32%Yes, greater than 10%
20%Yes, between 5% and 10%
48%No
Figure 18: Do you consider that the use of an earn-out structure is practicable in a COVID-19 environment?
52%Yes
40%No
8%Unsure
*Option not included in 2020 survey.
Abo
ut P
itche
r Pa
rtne
rsSp
otlig
ht o
n se
ctor
sD
eal c
ompl
etio
n ch
alle
nges
Buye
r and
sel
ler
alig
nmen
tM
id-m
arke
t dea
l dr
iver
s
Con
fiden
ce in
A
ustr
alia
rem
ains
st
rong
Tren
ds a
nd
surv
ey h
ighl
ight
sEx
ecut
ive
sum
mar
yC
onte
nts

Deal completion challenges
18
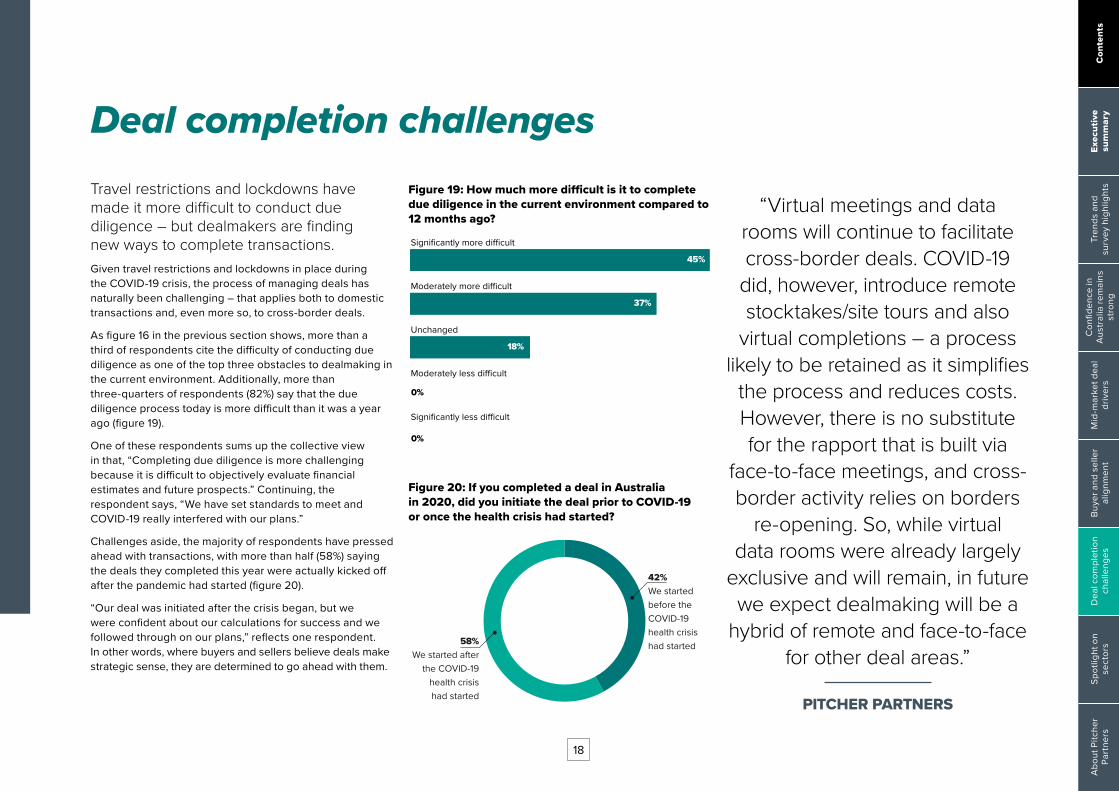
Deal completion challengesTravel restrictions and lockdowns have made it more difficult to conduct due diligence – but dealmakers are finding new ways to complete transactions.Given travel restrictions and lockdowns in place during the COVID-19 crisis, the process of managing deals has naturally been challenging – that applies both to domestic transactions and, even more so, to cross-border deals.
As figure 16 in the previous section shows, more than a third of respondents cite the difficulty of conducting due diligence as one of the top three obstacles to dealmaking in the current environment. Additionally, more than three-quarters of respondents (82%) say that the due diligence process today is more difficult than it was a year ago (figure 19).
One of these respondents sums up the collective view in that, “Completing due diligence is more challenging because it is difficult to objectively evaluate financial estimates and future prospects.” Continuing, the respondent says, “We have set standards to meet and COVID-19 really interfered with our plans.”
Challenges aside, the majority of respondents have pressed ahead with transactions, with more than half (58%) saying the deals they completed this year were actually kicked off after the pandemic had started (figure 20).
“Our deal was initiated after the crisis began, but we were confident about our calculations for success and we followed through on our plans,” reflects one respondent. In other words, where buyers and sellers believe deals make strategic sense, they are determined to go ahead with them.
“Virtual meetings and data rooms will continue to facilitate cross-border deals. COVID-19
did, however, introduce remote stocktakes/site tours and also
virtual completions – a process likely to be retained as it simplifies
the process and reduces costs. However, there is no substitute for the rapport that is built via
face-to-face meetings, and cross- border activity relies on borders
re-opening. So, while virtual data rooms were already largely
exclusive and will remain, in future we expect dealmaking will be a
hybrid of remote and face-to-face for other deal areas.”
PITCHER PARTNERS
Figure 19: How much more difficult is it to complete due diligence in the current environment compared to 12 months ago?
Significantly less di�cult
Moderately less di�cult
Unchanged
Moderately more di�cult
Significantly more di�cult
37%
0%
0%
45%
18%
Figure 20: If you completed a deal in Australia in 2020, did you initiate the deal prior to COVID-19 or once the health crisis had started?
42%We started before the COVID-19 health crisis had started58%
We started after the COVID-19
health crisis had started
Abo
ut P
itche
r Pa
rtne
rsSp
otlig
ht o
n se
ctor
sD
eal c
ompl
etio
n ch
alle
nges
Buye
r and
sel
ler
alig
nmen
tM
id-m
arke
t dea
l dr
iver
s
Con
fiden
ce in
A
ustr
alia
rem
ains
st
rong
Tren
ds a
nd
surv
ey h
ighl
ight
sEx
ecut
ive
sum
mar
yC
onte
nts

19
Adapting to new challengesThe reality is that necessity has prompted innovation. While issues such as legal process and regulatory compliance have caused some headaches, both buyers and sellers have adapted. Virtual roadshows have taken the place of physical meetings. Electronic data rooms have enabled diligence processes. Regulators have applied the rules flexibly to ensure that digital solutions have not been stopped in their tracks.
Many of these changes will endure, providing buyers and sellers with some reassurance that dealmaking can continue, even if the pandemic and its impacts lasts longer than expected.
Respondents also point to the crucial role of external advisors, both in helping them find inventive ways to move forward with deal processes and in reassuring them that proposed deals are commercially rational. “We used the services of external expertise and legal firms to contemplate the effectiveness of our strategies and provide new insights,” says one respondent. “We wanted an outside perspective regarding the financial stability of the target.”
“We used the services of external expertise and legal firms to contemplate the effectiveness of our strategies and provide new
insights. We wanted an outside perspective regarding the financial stability of the target.”
RESPONDENT
Abo
ut P
itche
r Pa
rtne
rsSp
otlig
ht o
n se
ctor
sD
eal c
ompl
etio
n ch
alle
nges
Buye
r and
sel
ler
alig
nmen
tM
id-m
arke
t dea
l dr
iver
s
Con
fiden
ce in
A
ustr
alia
rem
ains
st
rong
Tren
ds a
nd
surv
ey h
ighl
ight
sEx
ecut
ive
sum
mar
yC
onte
nts

Spotlight on sectors

21
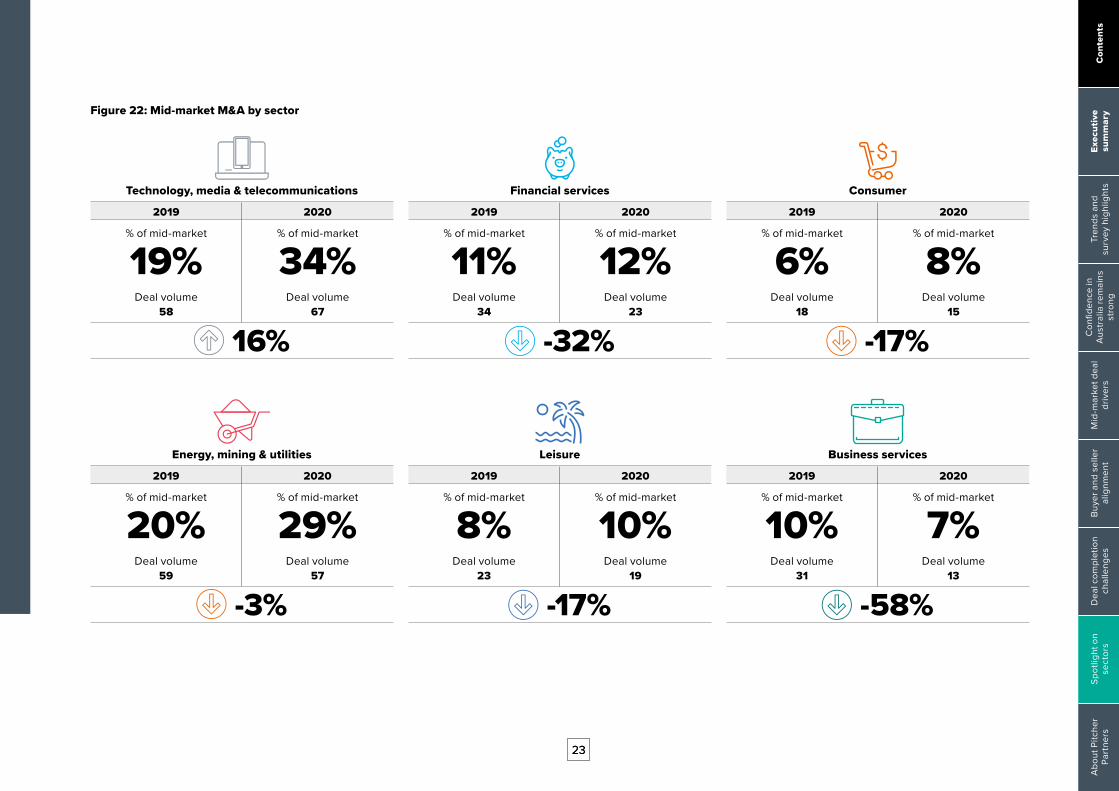
Spotlight on sectorsTechnology remains the most promising sector for mid-market dealmakers, but sentiment towards other sectors has shifted over the past 12 months.Respondents’ views on which sectors will be hotspots for mid-market M&A in Australia are similar to those in previous years (figure 21). Historical trends also show where deal execution has led to shifts in investor interest (figure 22).
TMTAs in past years, the TMT space leads both respondent sentiments and yearly totals for mid-market M&A. Indeed, Australia’s growing reputation internationally as a hub for start-ups and maturing tech firms is one driver of such expectations. It is also clear that growing numbers of companies are recognising the need to embrace digital transformation, particularly in the wake of the pandemic; accessing new technologies and intellectual property through M&A is one strategy for achieving this goal.
“Remote working has underlined the point that technology solutions are vital,” says one respondent. Another adds: “Intellectual property-led acquisitions will drive M&A activity because of the value add they offer the buyer.”
ConsumerConsumer businesses, meanwhile, have benefitted from the country’s strong economic performance in recent years, though the COVID-19 pandemic’s impacts will change the profile of M&A in this sector over the months ahead. For instance, businesses in areas that have grown strongly during the pandemic – particularly in e-commerce – make robust and resilient targets for acquirers. On the other hand, businesses forced to close or restrict their activities, such as bricks and mortars retailers, may be forced into distressed sales.
Pharma, medical and biotechSimilarly, Australian biotechs and pharma businesses have a strong track record in drug development and innovation. The sector’s role in combatting the pandemic has only added to its attractiveness. “The sector has been critical in controlling the spread of COVID-19,” says one respondent. “Drug development and testing have been accelerated, and this has increased the number of companies looking for joint ventures and long-term mergers.”
Energy, mining and utilitiesWhile the EMU sector accounted for 29% of mid-market M&A in 2020 (57 deals), only 2% of respondents expect increased activity going forward. This is a significant drop in expectations from the 33% who tipped the industry last year.
Price volatility in many commodity markets has certainly not been conducive to M&A this year, though metals prices in particular have bounced back sharply since a sell-off in the second quarter of the year. One other issue facing the sector is the pressure to shift from carbon-intensive energy production to renewables – while the latter may offer opportunities, the investment required is substantial and the returns are long-term in nature.
Shifting interest: Leisure and agricultureAgriculture and leisure stand out as examples of sectors where interest has waned. In the leisure sector, the likely explanation for this shift is that the industry has been hit hard by COVID-19 this year – and may continue to suffer if further lockdowns and restrictions prove necessary. While some distressed sales may be of interest to investors, the outlook for leisure businesses remains uncertain.
“Technology took out the gong for the most active sector in 2020, with dealmakers
anticipating it will retain top spot in 2021. In prior editions
of this report, our research has pointed to TMT being the most
active sector, but until now it hasn’t made it. Perhaps as a
result of deals being classified in other industries, an anomaly with a sector that crosses over most other areas, or a lack of maturity within the sector to
date. Regardless, TMT is likely to remain active for years to come.”
PITCHER PARTNERS
Abo
ut P
itche
r Pa
rtne
rsSp
otlig
ht o
n se
ctor
sD
eal c
ompl
etio
n ch
alle
nges
Buye
r and
sel
ler
alig
nmen
tM
id-m
arke
t dea
l dr
iver
s
Con
fiden
ce in
A
ustr
alia
rem
ains
st
rong
Tren
ds a
nd
surv
ey h
ighl
ight
sEx
ecut
ive
sum
mar
yC
onte
nts

22
Figure 21: Which of the following sectors will see increases in mid-market M&A in the next 12 months?
85%
Government
Defence
Construction
Energy, mining and utilities
Transportation
Real estate
Leisure
Agriculture
Industrials and chemicals
Financial services
Business services
Pharma, medical and biotech
Consumer
Technology, media and telecommunications
98%
67%83%
65%88%
52%55%
45%67%
28%58%
18%80%
10%75%
8%17%
3%33%
2%33%
27%
43%
35%
0%
0%
0%
2021 2020
“We are continuing to see strong activity in online related businesses within the broader
TMT sector, which is supported by both the deal data and survey respondents. Whether these be cloud storage, security, services,
or indeed consumer related online businesses, expectations
on future growth are fuelling upward price pressure particularly from the option of running a dual track process with listing being a
real option.”
PITCHER PARTNERS
Abo
ut P
itche
r Pa
rtne
rsSp
otlig
ht o
n se
ctor
sD
eal c
ompl
etio
n ch
alle
nges
Buye
r and
sel
ler
alig
nmen
tM
id-m
arke
t dea
l dr
iver
s
Con
fiden
ce in
A
ustr
alia
rem
ains
st
rong
Tren
ds a
nd
surv
ey h
ighl
ight
sEx
ecut
ive
sum
mar
yC
onte
nts
2323
Figure 22: Mid-market M&A by sector
Technology, media & telecommunications
2019 2020
% of mid-market
19%Deal volume
58
% of mid-market
34%Deal volume
67
16%
Financial services
2019 2020
% of mid-market
11%Deal volume
34
% of mid-market
12%Deal volume
23
-32%
Consumer
2019 2020
% of mid-market
6%Deal volume
18
% of mid-market
8%Deal volume
15
-17%
Energy, mining & utilities
2019 2020
% of mid-market
20%Deal volume
59
% of mid-market
29%Deal volume
57
-3%
Leisure
2019 2020
% of mid-market
8%Deal volume
23
% of mid-market
10%Deal volume
19
-17%
Business services
2019 2020
% of mid-market
10%Deal volume
31
% of mid-market
7%Deal volume
13
-58%
Abo
ut P
itche
r Pa
rtne
rsSp
otlig
ht o
n se
ctor
sD
eal c
ompl
etio
n ch
alle
nges
Buye
r and
sel
ler
alig
nmen
tM
id-m
arke
t dea
l dr
iver
s
Con
fiden
ce in
A
ustr
alia
rem
ains
st
rong
Tren
ds a
nd
surv
ey h
ighl
ight
sEx
ecut
ive
sum
mar
yC
onte
nts

2424
Figure 22: Mid-market M&A by sector
Real estate
2019 2020
% of mid-market
9%Deal volume
26
% of mid-market
6%Deal volume
12
-54%
Construction
2019 2020
% of mid-market
3%Deal volume
8
% of mid-market
4%Deal volume
8
0%
Industrials and chemicals
2019 2020
% of mid-market
4%Deal volume
11
% of mid-market
4%Deal volume
8
-27%
Agriculture
2019 2020
% of mid-market
6%Deal volume
17
% of mid-market
4%Deal volume
7
-59%
Business services
2019 2020
% of mid-market
2%Deal volume
5
% of mid-market
4%Deal volume
7
40%
Pharma, medical & biotech
2019 2020
% of mid-market
4%Deal volume
12
% of mid-market
7%Deal volume
14
17%
Abo
ut P
itche
r Pa
rtne
rsSp
otlig
ht o
n se
ctor
sD
eal c
ompl
etio
n ch
alle
nges
Buye
r and
sel
ler
alig
nmen
tM
id-m
arke
t dea
l dr
iver
s
Con
fiden
ce in
A
ustr
alia
rem
ains
st
rong
Tren
ds a
nd
surv
ey h
ighl
ight
sEx
ecut
ive
sum
mar
yC
onte
nts

25
MethodologyFor this publication, Pitcher Partners commissioned Mergermarket to canvass the opinions of 60 M&A dealmakers in Australia. 60% of the respondents were from Australian corporations, 30% were from foreign corporations with operations in Australia, 5% were from Australian private equity firms, and 5% were from foreign private equity firms.
All dollar figures, unless otherwise stated, are in Australian dollars (AUD). Data used in this report was compiled on 4 January 2021 using Dealogic data and additional sources noted within this report.
Percentages may not sum to 100% due to rounding. Unless otherwise stated, all date references refer to calendar year and not financial year.
Abo
ut P
itche
r Pa
rtne
rsM
etho
dollo
gyD
eal c
ompl
etio
n ch
alle
nges
Buye
r and
sel
ler
alig
nmen
tM
id-m
arke
t dea
l dr
iver
s
Con
fiden
ce in
A
ustr
alia
rem
ains
st
rong
Tren
ds a
nd
surv
ey h
ighl
ight
sEx
ecut
ive
sum
mar
yC
onte
nts

About Pitcher PartnersPitcher Partners has the resources and depth of expertise of a major firm, but with a boutique firm feel. We give our clients the highest level of personal service and attention. That’s the difference.Pitcher Partners is an association of accounting and business advisory firms located in Adelaide, Brisbane, Melbourne, Newcastle, Perth and Sydney. We have a strong reputation for providing personal service and quality commercial advice to our clients across a broad range of industries.
We specialise in working with middle market businesses in Australia, including privately owned, foreign controlled, listed, government owned and not-for-profits. Our clients require high technical standards, matched with a personal understanding and involvement in their affairs.
Each Pitcher Partners firm is also an independent member of Baker Tilly International, one of the world’s leading networks of independently owned and managed accountancy and business advisory firms. Our strong relationship with other Baker Tilly International member firms has allowed us to open many doors across borders for our clients.
Australian statistics
120+ partners
1,300+ people
6 independent member firms
Our commercial services to businesses
Financial essentials
Accounting and Business Advisory Services
Audit, Risk Management and Assurance
Internal Audit
Recovery, Turnarounds and Insolvency
Tax advice and Compliance
Private wealth services
Estate Planning
Family Office Management
Investment Advisory Services
Philanthropy Services
Succession Planning
Superannuation Strategies
Tax Advice and Compliance
Industry specialisations
Agriculture
Food and beverage
Government and the public sector
Health and aged care
Hospitality
Manufacturing
Not-for-profit
Professional services
Property and construction
Retail
Planning and growth
Business Consulting and Commercial Advice
Business Performance Improvement
Business Structuring
Corporate Finance
Corporate Governance
International Business Advisory
Investment Advisory Services
Succession Planning
Superannuation Services
Tax Advisory
Technology and IT Consulting
Valuations
26
Abo
ut P
itche
r Pa
rtne
rsSp
otlig
ht o
n se
ctor
sD
eal c
ompl
etio
n ch
alle
nges
Buye
r and
sel
ler
alig
nmen
tM
id-m
arke
t dea
l dr
iver
s
Con
fiden
ce in
A
ustr
alia
rem
ains
st
rong
Tren
ds a
nd
surv
ey h
ighl
ight
sEx
ecut
ive
sum
mar
yC
onte
nts

Our global reachBaker Tilly International is one of the world’s leading networks of independently owned and managed accountancy and business advisory firms united by a commitment to provide exceptional client service.Every day, 36,700+ people working out of 740 offices, in 123 member firms across 148 territories share experiences and expertise to help privately held businesses and public interest entities meet challenges and proactively respond to opportunities. International capability and global consistency of service are central to the way we work.
Baker Tilly InternationalExperts across a wide range of industry and business sectors, each Baker Tilly International member firm combines high quality services and in-depth local knowledge.
Sharing knowledge and resources, our business approach brings together the power of the global network to deliver exceptional results to clients globally.
Pitcher PartnersPitcher Partners is an independent member of Baker Tilly International. Pitcher Partners’ strong relationship with other Baker Tilly International member firms, particularly in Asia Pacific, provides clients with access to international networks, opportunities and expertise to expand globally.
Global statistics
36,700+ experienced professionals
$4.04bn Worldwide revenue 2020 (USD)
Pitcher Partners is a member of the global network of Baker Tilly International Limited, the members of which are separate and independent legal entities.
6Australian
firms
28Latin American
firms
10North American
firms
24Middle East and
African firms
41European
firms
20Asia Pacific
firms
Key
Baker Tilly
Pitcher Partners
27
Abo
ut P
itche
r Pa
rtne
rsSp
otlig
ht o
n se
ctor
sD
eal c
ompl
etio
n ch
alle
nges
Buye
r and
sel
ler
alig
nmen
tM
id-m
arke
t dea
l dr
iver
s
Con
fiden
ce in
A
ustr
alia
rem
ains
st
rong
Tren
ds a
nd
surv
ey h
ighl
ight
sEx
ecut
ive
sum
mar
yC
onte
nts

Making business personal
pitcher.com.au
Pitcher_Partners_DealMakers2021_v13_JP
Adelaide Brisbane Melbourne Newcastle Perth Sydney
Pitcher Partners is an association of independent firms. Liability limited by a scheme approved under Professional Standards Legislation. Pitcher Partners is a member of the global network of Baker Tilly International Limited, the members of which are separate and independent legal entities.
Pitcher Partners is an independent member of Baker Tilly International. Baker Tilly International Limited is an English company. Baker Tilly International provides no professional services to clients. Each member firm is a separate and independent legal entity, and each describes itself as such. Pitcher Partners is not Baker Tilly International’s agent and does not have the authority to bind Baker Tilly International or act on Baker Tilly’s behalf. None of Baker Tilly International, Pitcher Partners, nor any of the other member firms of Baker Tilly International have any liability for each other’s acts or omissions. The name Baker Tilly and its associated logo is used under license from Baker Tilly International Limited.
Alan MaxPartner Sydney p. +61 2 8236 7882 e. [email protected]
Michael SonegoPartner Melbourne p. +61 3 8610 5485 e. [email protected]
James BeaumontPartner Melbourne p. +61 3 8610 5568 e. [email protected]
Warwick FacePartner Brisbane p. +61 7 3222 8302 e. [email protected]
Andrew FaulknerPrincipal Adelaide p. +61 8 8179 2800 e. [email protected]
Bryan HughesPerth Chairman Perth p. +61 8 9322 2022 e. [email protected]
Scott EddenPartner Newcastle p. +61 2 4911 2000 e. [email protected]
Kieran WallisPartner Brisbane p. +61 7 3222 8383 e. [email protected]