DDC420 User Manual - SyxthSense KP10 -50..150 °C ... After unpacking and connecting the device,...
82
2015-07-25 v1.1 A User Manual SYX660 SYX661 SYX662
-
Upload
duongxuyen -
Category
Documents
-
view
229 -
download
0
Transcript of DDC420 User Manual - SyxthSense KP10 -50..150 °C ... After unpacking and connecting the device,...
2015-07-25 v1.1
A
User Manual
SYX660 SYX661 SYX662
2015-07-25 v1.1
A
4
This document replaces all documents with a lower version number or an older release
date.
This copy is not updated automatically.
Subject to change.
SyxthSense is not liable for damages that result directly or indirectly from the improper use
of this document.
Copyright
© 2015
SyxthSense Limited 3 Topsham Units
Dart Business Park, Topsham Exeter
United Kingdom
Tel.: 0844 840 3100, Fax: 0844 840 3200
www.syxthsense.com, [email protected]
All rights reserved. No part of this document may be reproduced in any form (by printing,
photocopying or otherwise) or processed, copied or distributed using electronic systems
without written permission from SyxthSense.
Document number: UG-SS-SYX66x Issue:
25-07-2015 v1.1
2015-07-25 v1.1
A
Table of Contents 3
Table of Contents
1 Overview.......................................................................................................... 5 1.1 Interface .......................................................................................................... 6
1.2 Configuration options ...................................................................................... 7
1.3 Device types, accessories ................................................................................ 8
1.3.1 Sensor types .................................................................................................... 8
1.3.2 Accessories ...................................................................................................... 9
2 Operation on the device ................................................................................ 10 2.1 Graphic display .............................................................................................. 11
2.2 First startup ................................................................................................... 13
2.3 Operating levels ............................................................................................. 13
2.4 Logging a user onto an operation level ......................................................... 14
2.5 Values ............................................................................................................ 16
2.6 Changing setpoints ........................................................................................ 17
2.7 Times ............................................................................................................. 20
2.7.1 Weekly program ............................................................................................ 22
2.7.2 Special times .................................................................................................. 24
2.7.3 Special entries in the date or date range ...................................................... 29
2.8 Manual Overrides (Switching) ....................................................................... 30
2.9 Trend display ................................................................................................. 32
2.9.1 Opening the trend curve dialog..................................................................... 32
2.9.2 Trend curve display ........................................................................................ 34
2.9.3 Adjusting the trend curve display ................................................................. 35
2.10 Displaying messages ...................................................................................... 37
3 Operation Using a Web Browser ................................................................... 38 3.1 Connecting ..................................................................................................... 38
3.2 Logging a user onto an operation level ......................................................... 39
3.3 Using the navigation bar ............................................................................... 40
3.4 Displaying Information .................................................................................. 41
3.5 Displaying messages ...................................................................................... 42
3.6 Displaying terminals ...................................................................................... 42
3.7 Logging a user in or out ................................................................................. 43
3.8 Values ............................................................................................................ 44
3.8.1 Displaying actual values ................................................................................ 44
3.8.2 Changing setpoints ........................................................................................ 45
3.9 Switch ............................................................................................................ 47
3.10 Times ............................................................................................................. 48
3.11 Trend display ................................................................................................. 50
2015-07-25 v1.1
A
4
3.11.1 Opening the trend curve dialog..................................................................... 51
3.11.2 Displaying the trend curve ............................................................................ 53
4 Operation Using a User Touch Screen ........................................................... 54 4.1 General information about operation ........................................................... 55
4.2 Login .............................................................................................................. 57
4.3 Plant overview ............................................................................................... 59
4.4 Switching and values ..................................................................................... 60
4.5 Editing setpoints ............................................................................................ 62
4.6 Querying messages ........................................................................................ 63
4.7 Times ............................................................................................................. 64
4.7.1 Weekly program ............................................................................................ 66
4.7.2 Special times .................................................................................................. 69
4.7.3 Editing or creating new special times............................................................ 72
4.7.4 Editing or creating new switch times of a special time ................................. 74
4.8 Trend display ................................................................................................. 77
4.8.1 Opening the trend curve dialog..................................................................... 78
4.8.2 Displaying the trend curve ............................................................................ 80
5 Servicing ........................................................................................................ 81 5.1 Changing the Battery ..................................................................................... 81
2015-07-25 v1.1
A
Overview 5
1 Overview
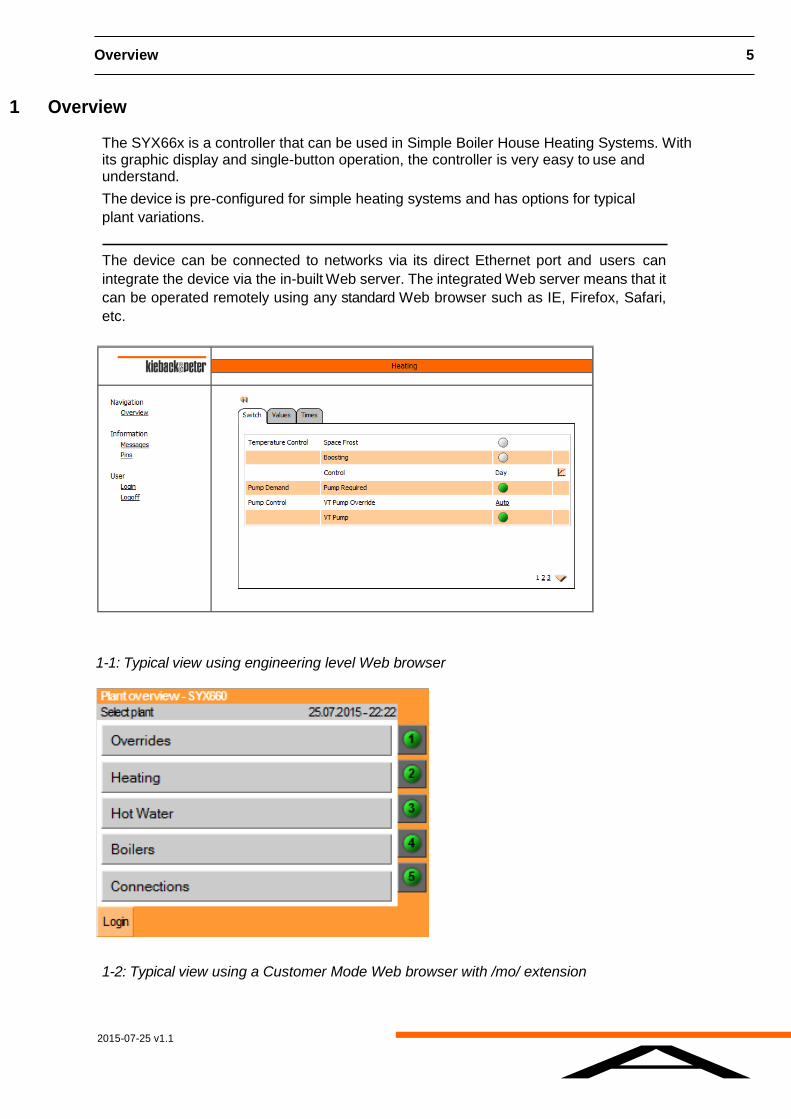
The SYX66x is a controller that can be used in Simple Boiler House Heating Systems. With its graphic display and single-button operation, the controller is very easy to use and understand.
The device is pre-configured for simple heating systems and has options for typical
plant variations.
The device can be connected to networks via its direct Ethernet port and users can
integrate the device via the in-built Web server. The integrated Web server means that it
can be operated remotely using any standard Web browser such as IE, Firefox, Safari,
etc.
1-1: Typical view using engineering level Web browser
1-2: Typical view using a Customer Mode Web browser with /mo/ extension
2015-07-25 v1.1
A
6 Overview
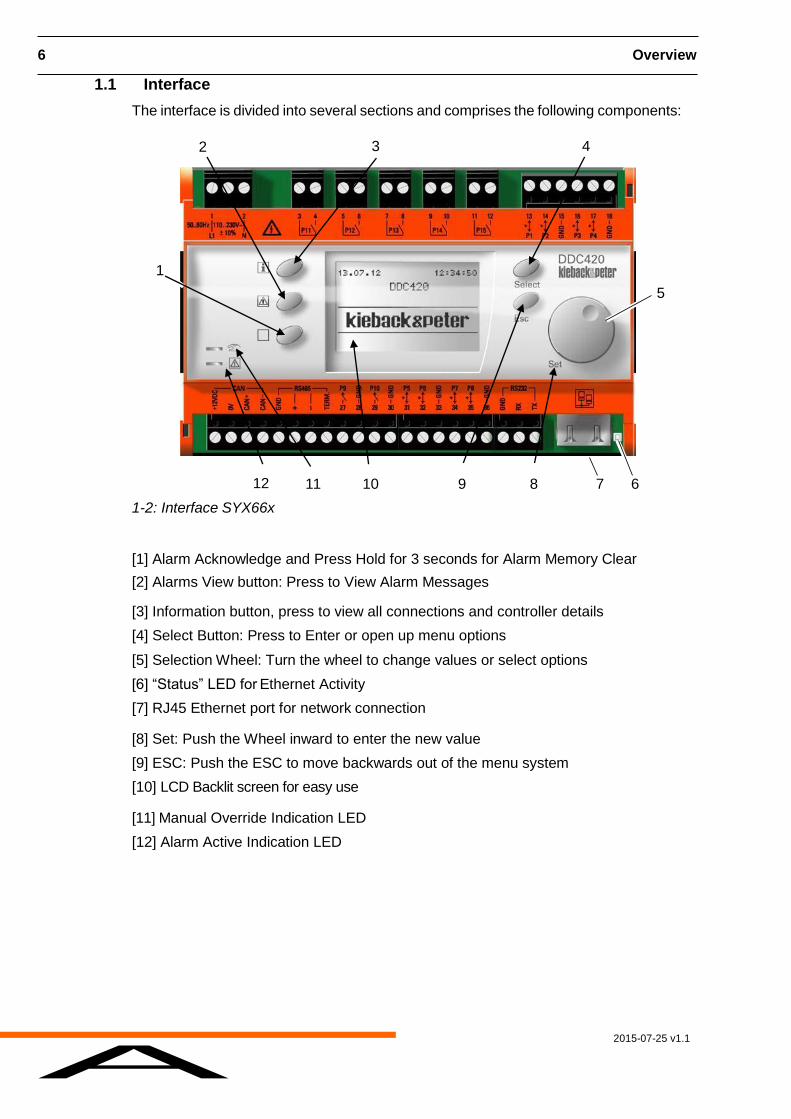
1.1 Interface
The interface is divided into several sections and comprises the following components:
2 3 4
1
5
12 11 10
1-2: Interface SYX66x
9 8 7 6
[1] Alarm Acknowledge and Press Hold for 3 seconds for Alarm Memory Clear
[2] Alarms View button: Press to View Alarm Messages
[3] Information button, press to view all connections and controller details
[4] Select Button: Press to Enter or open up menu options
[5] Selection Wheel: Turn the wheel to change values or select options
[6] “Status” LED for Ethernet Activity
[7] RJ45 Ethernet port for network connection
[8] Set: Push the Wheel inward to enter the new value
[9] ESC: Push the ESC to move backwards out of the menu system
[10] LCD Backlit screen for easy use
[11] Manual Override Indication LED
[12] Alarm Active Indication LED
2015-07-25 v1.1
A
Overview 7
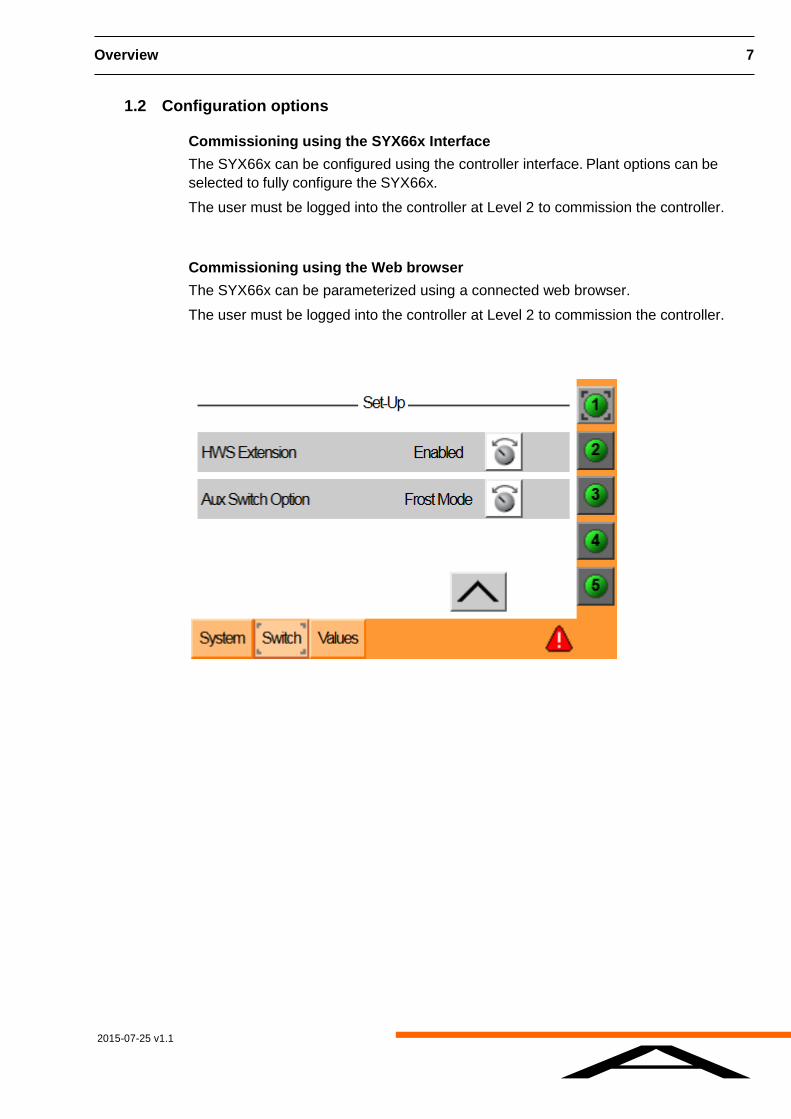
1.2 Configuration options
Commissioning using the SYX66x Interface
The SYX66x can be configured using the controller interface. Plant options can be
selected to fully configure the SYX66x.
The user must be logged into the controller at Level 2 to commission the controller.
Commissioning using the Web browser
The SYX66x can be parameterized using a connected web browser.
The user must be logged into the controller at Level 2 to commission the controller.
2015-07-25 v1.1
A
8 Overview
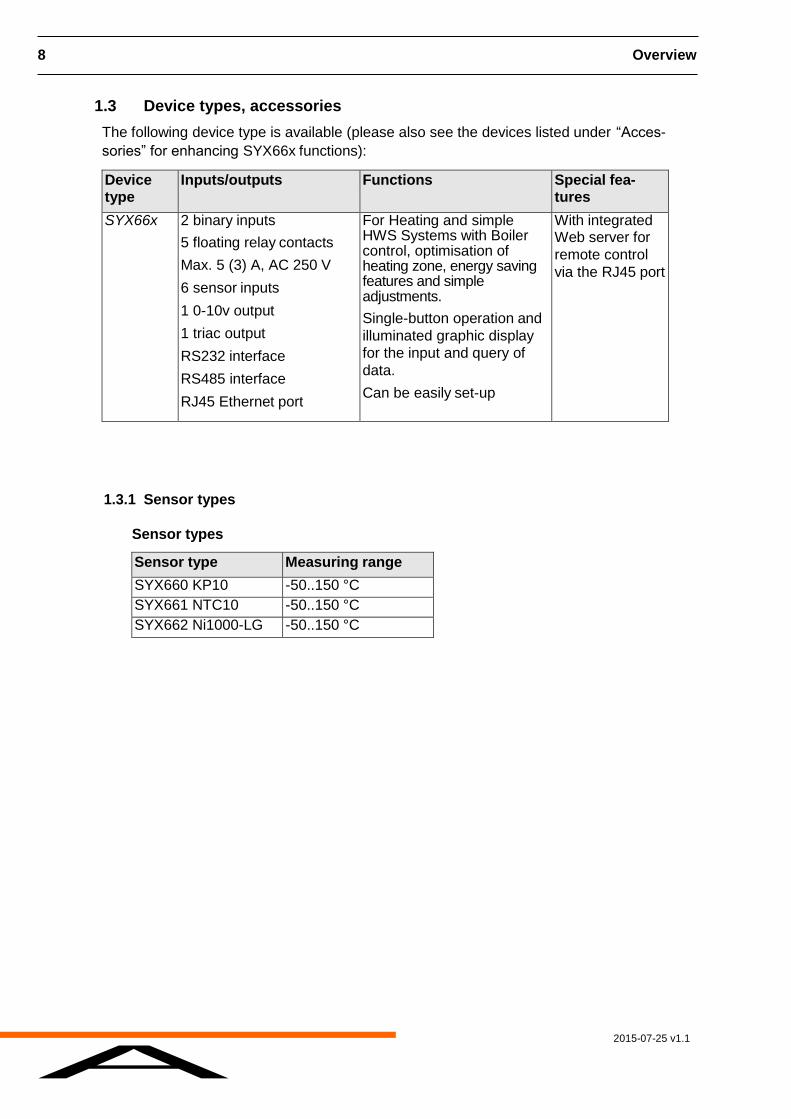
1.3 Device types, accessories
The following device type is available (please also see the devices listed under “Acces-
sories” for enhancing SYX66x functions):
Device type
Inputs/outputs Functions Special fea- tures
SYX66x 2 binary inputs
5 floating relay contacts
Max. 5 (3) A, AC 250 V
6 sensor inputs
1 0-10v output
1 triac output
RS232 interface
RS485 interface
RJ45 Ethernet port
For Heating and simple HWS Systems with Boiler control, optimisation of heating zone, energy saving features and simple adjustments.
Single-button operation and
illuminated graphic display
for the input and query of
data.
Can be easily set-up
With integrated Web server for
remote control
via the RJ45 port
1.3.1 Sensor types
Sensor types
Sensor type Measuring range
SYX660 KP10 -50..150 °C
SYX661 NTC10 -50..150 °C
SYX662 Ni1000-LG -50..150 °C
2015-07-25 v1.1
A
Overview 9
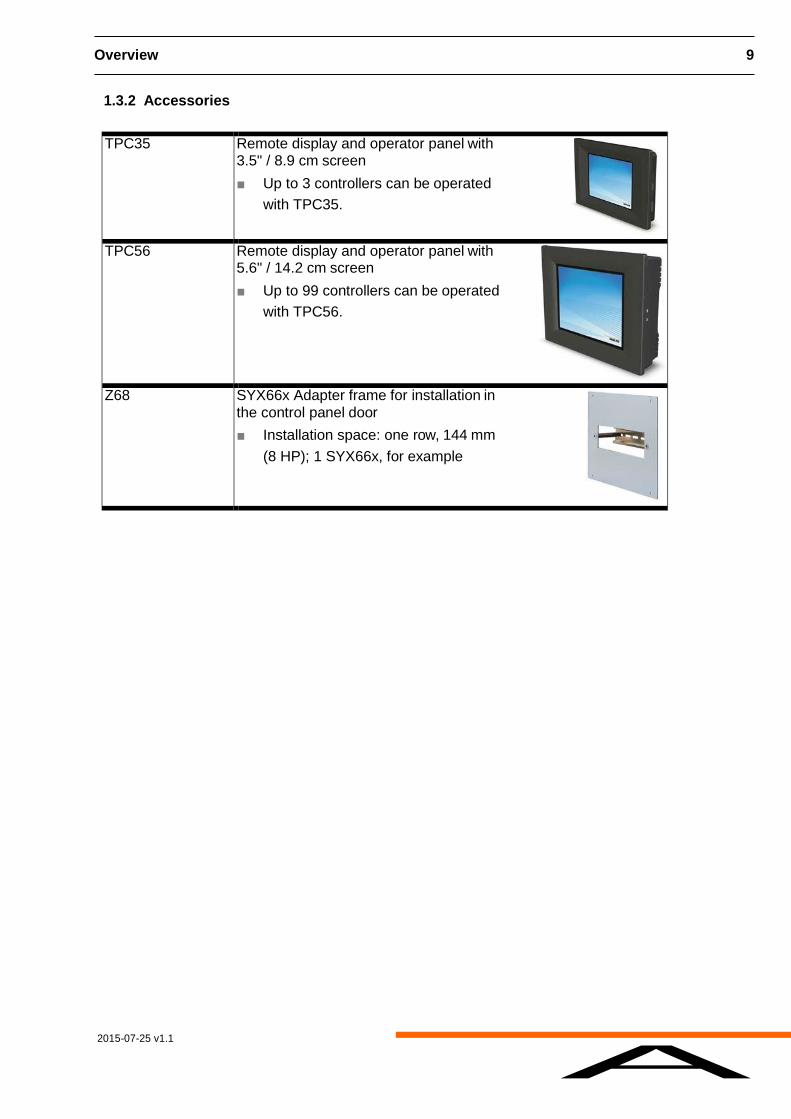
1.3.2 Accessories
TPC35 Remote display and operator panel with
3.5" / 8.9 cm screen
■ Up to 3 controllers can be operated
with TPC35.
TPC56 Remote display and operator panel with 5.6" / 14.2 cm screen
■ Up to 99 controllers can be operated
with TPC56.
Z68 SYX66x Adapter frame for installation in
the control panel door
■ Installation space: one row, 144 mm
(8 HP); 1 SYX66x, for example
2015-07-25 v1.1
A
10 Operation on the device
1
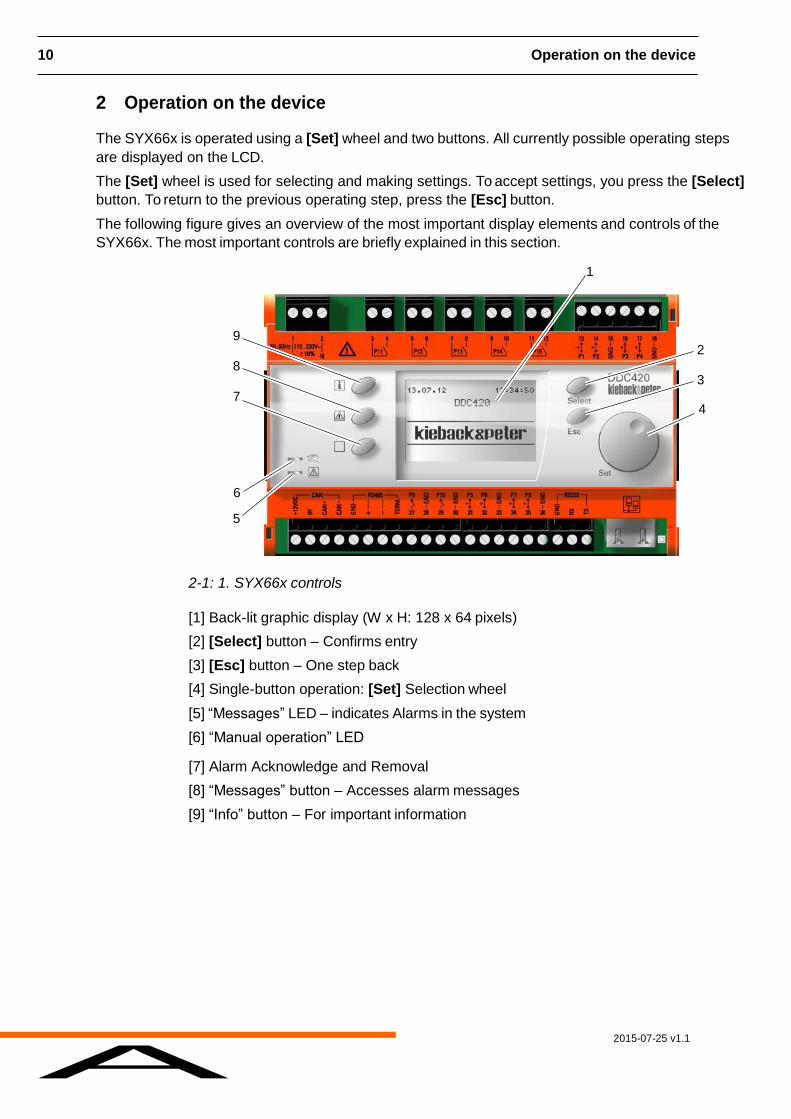
2 Operation on the device
The SYX66x is operated using a [Set] wheel and two buttons. All currently possible operating steps
are displayed on the LCD.
The [Set] wheel is used for selecting and making settings. To accept settings, you press the [Select]
button. To return to the previous operating step, press the [Esc] button.
The following figure gives an overview of the most important display elements and controls of the
SYX66x. The most important controls are briefly explained in this section.
9 2
8 3
7 4
6
5
2-1: 1. SYX66x controls
[1] Back-lit graphic display (W x H: 128 x 64 pixels)
[2] [Select] button – Confirms entry
[3] [Esc] button – One step back
[4] Single-button operation: [Set] Selection wheel
[5] “Messages” LED – indicates Alarms in the system
[6] “Manual operation” LED
[7] Alarm Acknowledge and Removal
[8] “Messages” button – Accesses alarm messages
[9] “Info” button – For important information
2015-07-25 v1.1
A
Operation on the device 11
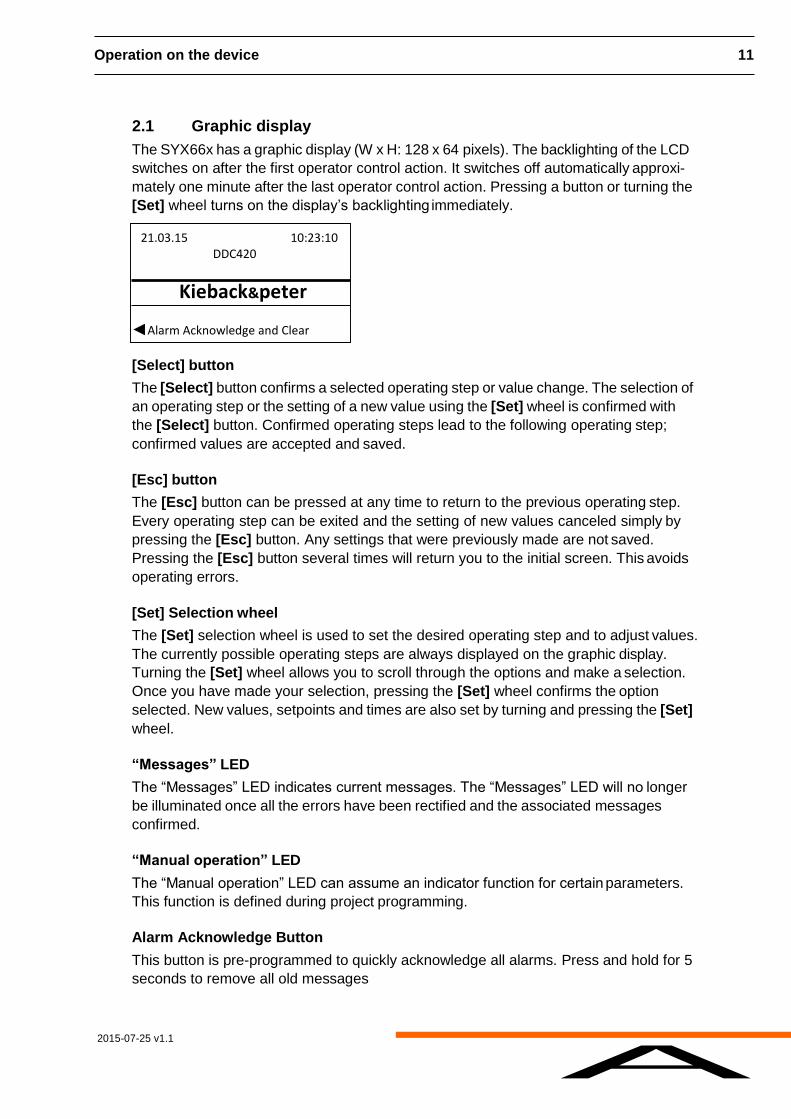
2.1 Graphic display
The SYX66x has a graphic display (W x H: 128 x 64 pixels). The backlighting of the LCD
switches on after the first operator control action. It switches off automatically approxi-
mately one minute after the last operator control action. Pressing a button or turning the
[Set] wheel turns on the display’s backlighting immediately.
[Select] button
The [Select] button confirms a selected operating step or value change. The selection of
an operating step or the setting of a new value using the [Set] wheel is confirmed with
the [Select] button. Confirmed operating steps lead to the following operating step;
confirmed values are accepted and saved.
[Esc] button
The [Esc] button can be pressed at any time to return to the previous operating step.
Every operating step can be exited and the setting of new values canceled simply by
pressing the [Esc] button. Any settings that were previously made are not saved.
Pressing the [Esc] button several times will return you to the initial screen. This avoids
operating errors.
[Set] Selection wheel
The [Set] selection wheel is used to set the desired operating step and to adjust values.
The currently possible operating steps are always displayed on the graphic display.
Turning the [Set] wheel allows you to scroll through the options and make a selection.
Once you have made your selection, pressing the [Set] wheel confirms the option
selected. New values, setpoints and times are also set by turning and pressing the [Set]
wheel.
“Messages” LED
The “Messages” LED indicates current messages. The “Messages” LED will no longer
be illuminated once all the errors have been rectified and the associated messages
confirmed.
“Manual operation” LED
The “Manual operation” LED can assume an indicator function for certain parameters.
This function is defined during project programming.
Alarm Acknowledge Button
This button is pre-programmed to quickly acknowledge all alarms. Press and hold for 5
seconds to remove all old messages
21.03.15 10:23:10 DDC420
Kieback&peter Alarm Acknowledge and Clear
2015-07-25 v1.1
A
12 Operation on the device
[Messages] button
Use the [Messages] button to display malfunction messages as text. The “Messages”
LED will no longer be illuminated once all the errors have been rectified and the
associated messages confirmed.
[Info] button
Use the [Info] button to retrieve pin information, connection assignment and device infor-
mation, such as SYX66x version and IP address.
2015-07-25 v1.1
A
Operation on the device 13
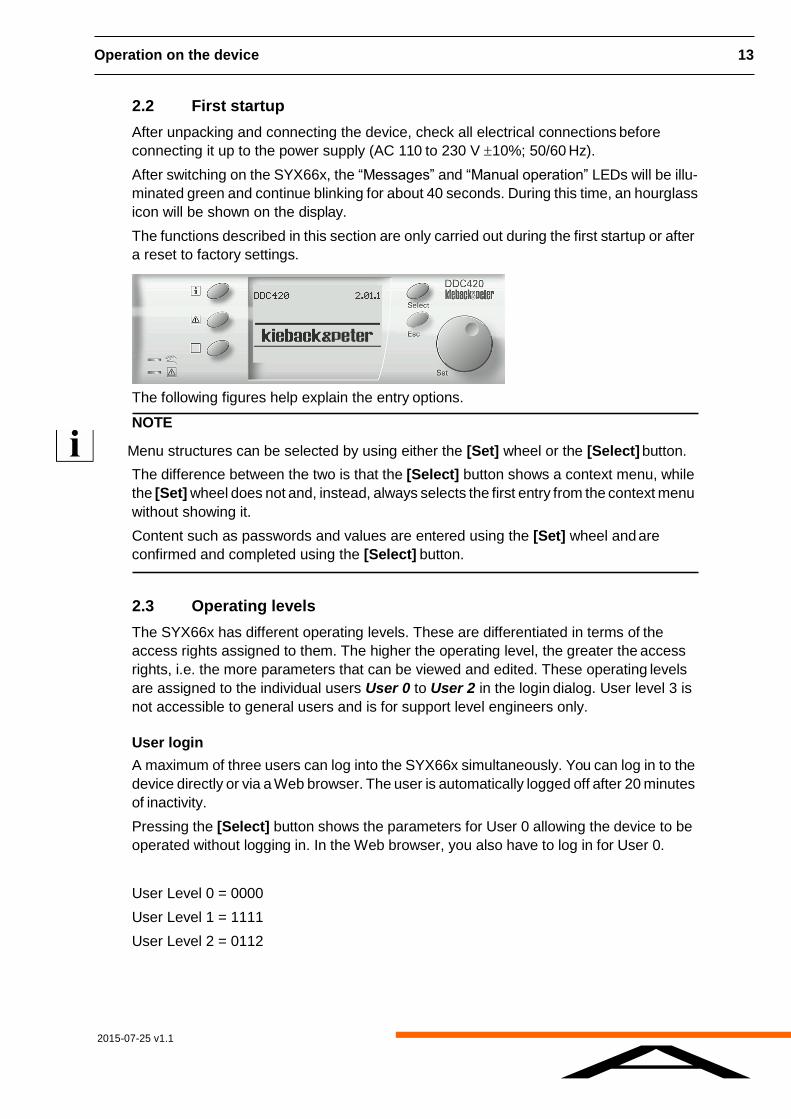
2.2 First startup
After unpacking and connecting the device, check all electrical connections before
connecting it up to the power supply (AC 110 to 230 V 10%; 50/60 Hz).
After switching on the SYX66x, the “Messages” and “Manual operation” LEDs will be illu-
minated green and continue blinking for about 40 seconds. During this time, an hourglass
icon will be shown on the display.
The functions described in this section are only carried out during the first startup or after
a reset to factory settings.
The following figures help explain the entry options.
NOTE
Menu structures can be selected by using either the [Set] wheel or the [Select] button.
The difference between the two is that the [Select] button shows a context menu, while
the [Set] wheel does not and, instead, always selects the first entry from the context menu
without showing it.
Content such as passwords and values are entered using the [Set] wheel and are
confirmed and completed using the [Select] button.
2.3 Operating levels
The SYX66x has different operating levels. These are differentiated in terms of the
access rights assigned to them. The higher the operating level, the greater the access
rights, i.e. the more parameters that can be viewed and edited. These operating levels
are assigned to the individual users User 0 to User 2 in the login dialog. User level 3 is
not accessible to general users and is for support level engineers only.
User login
A maximum of three users can log into the SYX66x simultaneously. You can log in to the
device directly or via a Web browser. The user is automatically logged off after 20 minutes
of inactivity.
Pressing the [Select] button shows the parameters for User 0 allowing the device to be
operated without logging in. In the Web browser, you also have to log in for User 0.
User Level 0 = 0000
User Level 1 = 1111
User Level 2 = 0112

14 Operation on the device
2015-07-25 v1.1
A
2.4 Logging a user onto an operation level
In order to avoid incorrect operation, the SYX66x has various operating levels, which can
be activated by entering a password. This section explains how to unlock the operating
level directly in the SYX66x.
NOTE
Menu structures can be selected by using either the [Set] wheel or the [Select] button.
The difference between the two is that the [Select] button shows a context menu, while
the [Set] wheel does not and, instead, always selects the first entry from the context menu
without showing it.
Content such as passwords and values are entered using the [Set] wheel and are
confirmed and completed using the [Select] button.
Initial screen
This login is not required for user 0 (operating level 0).
► Pressing the [Select] button takes you directly to the operator tree.
For the other operating levels, users log in as follows:
► Hold down the [Esc] button for approximately 5 seconds. The following display
appears:
► Turn the [Set] wheel to select the user (operating level) you require.
► Pressing the [Set] wheel or the [Select] button will open a password entry screen.
21.03.15 10:23:10 DDC420
Kieback&peter Alarm Acknowledge and Clear

2015-07-25 v1.1
A
Operation on the device 15
► You can select a character by turning the [Set] wheel.
► Once you have made your selection, press the [Set] wheel or Select button to accept
each character.
► Once you have entered your password, press the [Select] button to confirm. Your
password will then be verified.
Once you have successfully logged in, you will be returned to the initial screen.
► Press the [Select] button to open the operator tree.
The operator tree is displayed.
21.03.15 10:23:10 DDC420
Kieback&peter Alarm Acknowledge and Clear
MC1400 Overrides Heating Hot Water Boilers Alarm Acknowledge and Clear
2015-07-25 v1.1
A
16 Operation on the device
2.5 Values
Displaying actual values
In the following steps, you will learn how to display current/actual values.
NOTE
Menu structures can be selected by using either the [Set] wheel or the [Select] button.
The difference between the two is that the [Select] button shows a context menu, while
the [Set] wheel does not and, instead, always selects the first entry from the context menu
without showing it.
Content such as passwords and values are entered using the [Set] wheel and are
confirmed and completed using the [Select] button.
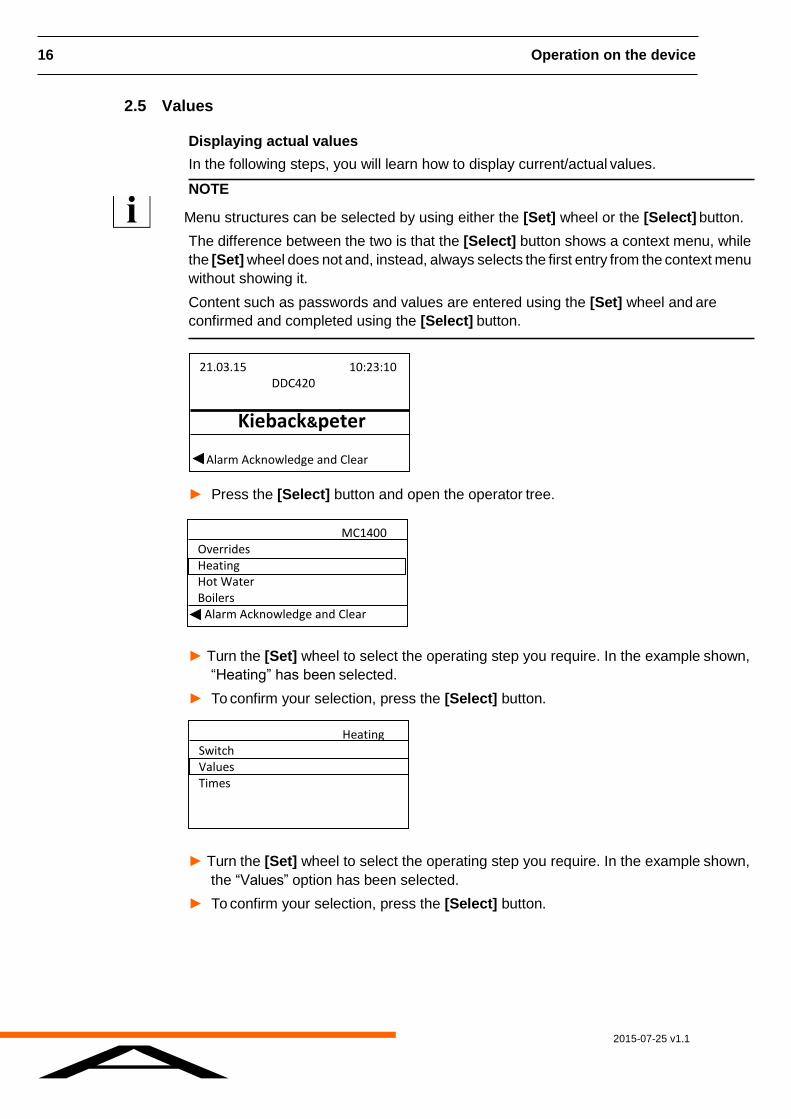
► Press the [Select] button and open the operator tree.
► Turn the [Set] wheel to select the operating step you require. In the example shown,
“Heating” has been selected.
► To confirm your selection, press the [Select] button.
► Turn the [Set] wheel to select the operating step you require. In the example shown,
the “Values” option has been selected.
► To confirm your selection, press the [Select] button.
21.03.15 10:23:10 DDC420
Kieback&peter Alarm Acknowledge and Clear
MC1400 Overrides Heating Hot Water Boilers Alarm Acknowledge and Clear
Heating Switch Values Times

2015-07-25 v1.1
A
Operation on the device 17
► Turn the [Set] wheel to select the operating step you require. In the example shown,
the “Temperature Control” option has been selected.
► To confirm your selection, press the [Select] button.
You will now see an overview of the various values:
► Turn the [Set] wheel to select the operating step you require. In the example shown,
the “VT Sensor.” (heating flow temperature) option has been selected.
► To confirm your selection, press the [Select] button.
The actual value is displayed. The example here shows the actual values for “VT
Sensor.”:
2.6 Changing setpoints
In the following steps, you will learn how to change setpoints.
NOTE
Menu structures can be selected by using either the [Set] wheel or the [Select] button.
The difference between the two is that the [Select] button shows a context menu, while
the [Set] wheel does not and, instead, always selects the first entry from the context menu
without showing it.
Content such as passwords and values are entered using the [Set] wheel and are
confirmed and completed using the [Select] button.
Heating - Values Temperature Control VT Valve
Temperature Control - Values VT Sensor 45°C VT Setpoint 46°C Space Setpoint 21°C VT Valve Position 51% Space Temp 21°C
Temperature Control VT Sensor
45°C

2015-07-25 v1.1
A
18 Operation on the device
► Press the [Select] button and open the operator tree.
► Turn the [Set] wheel to select the operating step you require. In the example shown,
the “Heating” option has been selected.
► To confirm your selection, press the [Select] button.
► Turn the [Set] wheel to select the operating step you require. In the example shown,
the “Values” option has been selected.
► To confirm your selection, press the [Select] button.
► Turn the [Set] wheel to select the operating step you require. In the example shown,
the “Control” option has been selected.
► To confirm your selection, press the [Select] button.
You will now see an overview of the various actual values and setpoints.
21.03.15 10:23:10 DDC420
Kieback&peter Alarm Acknowledge and Clear
MC1400 Overrides Heating Hot Water Boilers Alarm Acknowledge and Clear
Heating Switch Values Times
Heating - Values Temperature Control VT Valve
2015-07-25 v1.1
A
Operation on the device 19
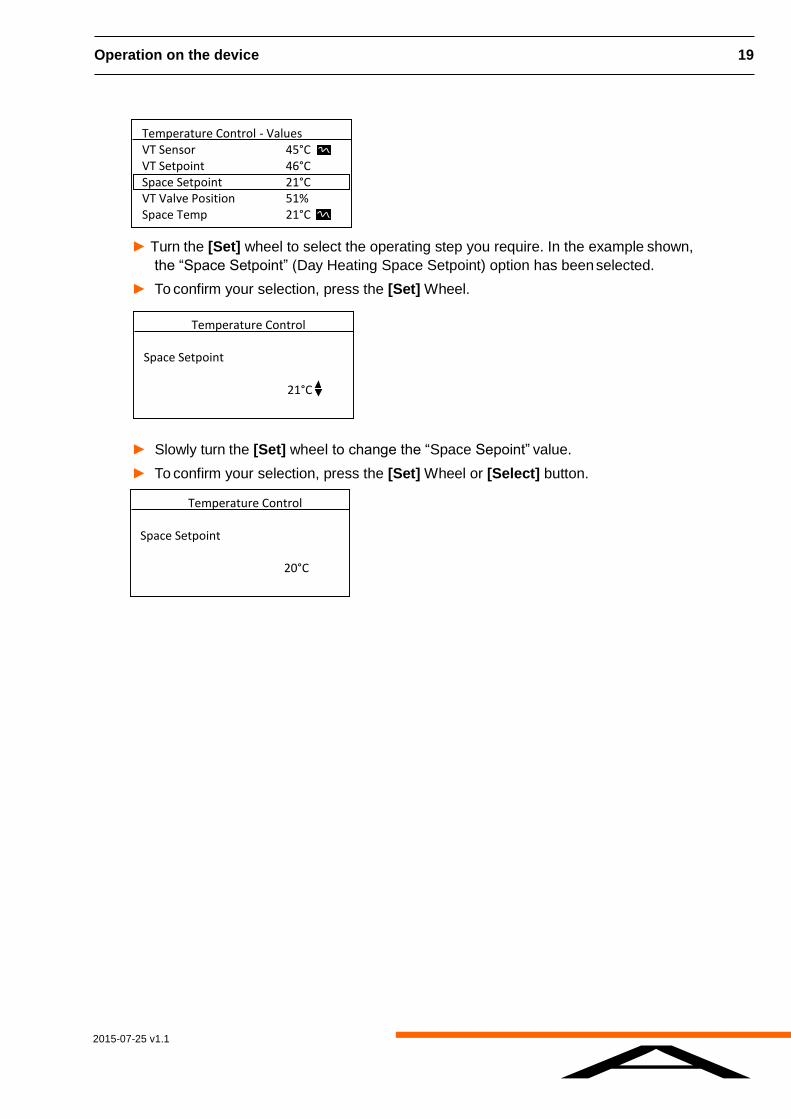
► Turn the [Set] wheel to select the operating step you require. In the example shown,
the “Space Setpoint” (Day Heating Space Setpoint) option has been selected.
► To confirm your selection, press the [Set] Wheel.
► Slowly turn the [Set] wheel to change the “Space Sepoint” value.
► To confirm your selection, press the [Set] Wheel or [Select] button.
Temperature Control - Values VT Sensor 45°C VT Setpoint 46°C Space Setpoint 21°C VT Valve Position 51% Space Temp 21°C
Temperature Control Space Setpoint
20°C
Temperature Control Space Setpoint
21°C
2015-07-25 v1.1
A
20 Operation on the device
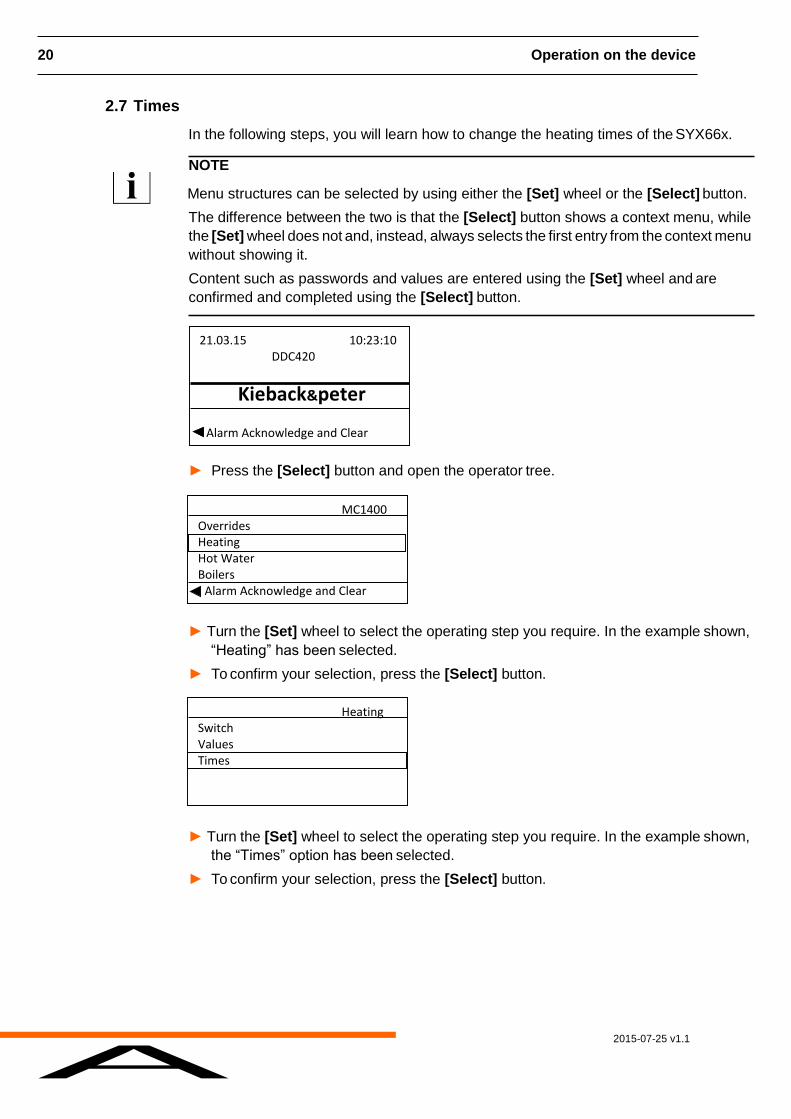
2.7 Times
In the following steps, you will learn how to change the heating times of the SYX66x.
NOTE
Menu structures can be selected by using either the [Set] wheel or the [Select] button.
The difference between the two is that the [Select] button shows a context menu, while
the [Set] wheel does not and, instead, always selects the first entry from the context menu
without showing it.
Content such as passwords and values are entered using the [Set] wheel and are
confirmed and completed using the [Select] button.
► Press the [Select] button and open the operator tree.
► Turn the [Set] wheel to select the operating step you require. In the example shown,
“Heating” has been selected.
► To confirm your selection, press the [Select] button.
► Turn the [Set] wheel to select the operating step you require. In the example shown,
the “Times” option has been selected.
► To confirm your selection, press the [Select] button.
21.03.15 10:23:10 DDC420
Kieback&peter Alarm Acknowledge and Clear
MC1400 Overrides Heating Hot Water Boilers Alarm Acknowledge and Clear
Heating Switch Values Times
2015-07-25 v1.1
A
Operation on the device 21
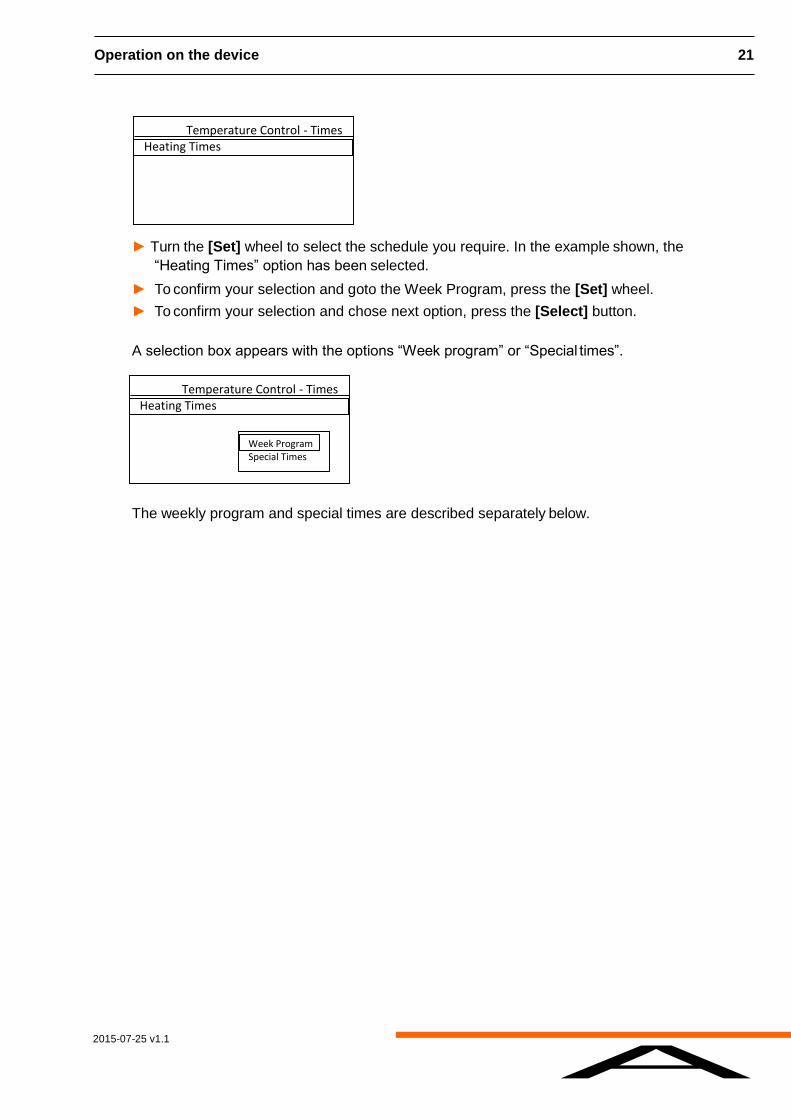
► Turn the [Set] wheel to select the schedule you require. In the example shown, the
“Heating Times” option has been selected.
► To confirm your selection and goto the Week Program, press the [Set] wheel.
► To confirm your selection and chose next option, press the [Select] button.
A selection box appears with the options “Week program” or “Special times”.
The weekly program and special times are described separately below.
Temperature Control - Times Heating Times
Temperature Control - Times Heating Times
Week Program Special Times
2015-07-25 v1.1
A
22 Operation on the device
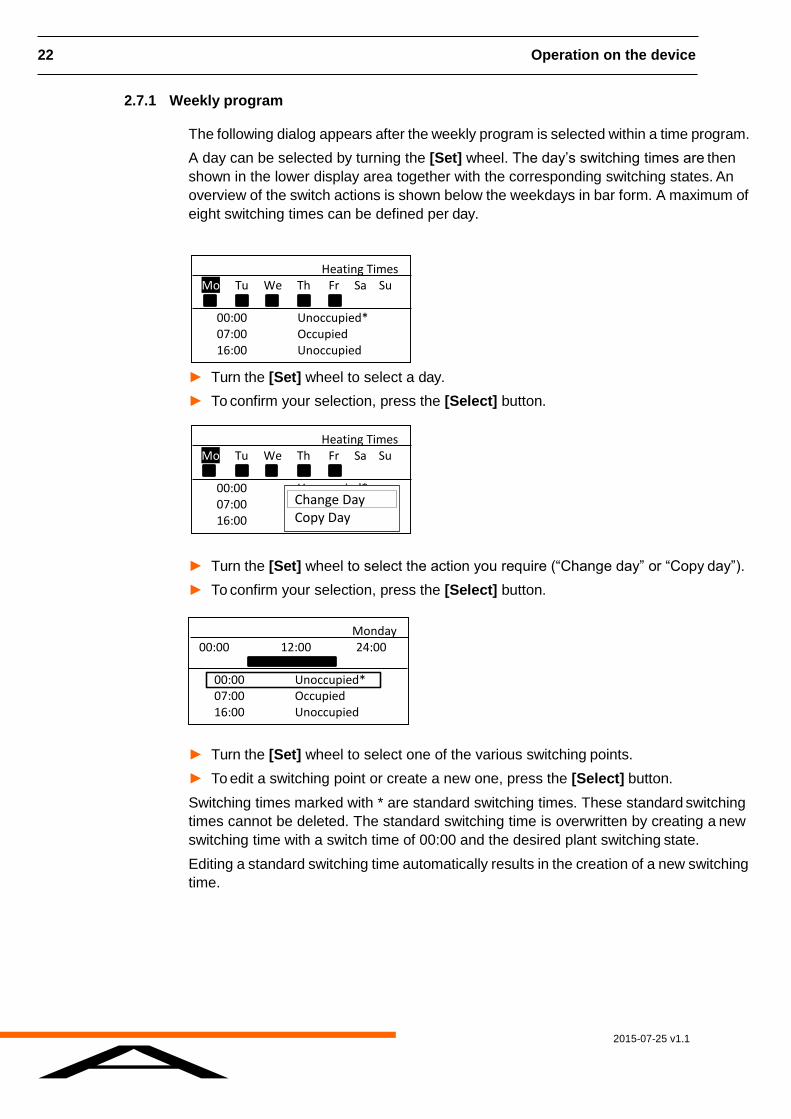
2.7.1 Weekly program
The following dialog appears after the weekly program is selected within a time program.
A day can be selected by turning the [Set] wheel. The day’s switching times are then
shown in the lower display area together with the corresponding switching states. An
overview of the switch actions is shown below the weekdays in bar form. A maximum of
eight switching times can be defined per day.
► Turn the [Set] wheel to select a day.
► To confirm your selection, press the [Select] button.
► Turn the [Set] wheel to select the action you require (“Change day” or “Copy day”).
► To confirm your selection, press the [Select] button.
► Turn the [Set] wheel to select one of the various switching points.
► To edit a switching point or create a new one, press the [Select] button.
Switching times marked with * are standard switching times. These standard switching
times cannot be deleted. The standard switching time is overwritten by creating a new
switching time with a switch time of 00:00 and the desired plant switching state.
Editing a standard switching time automatically results in the creation of a new switching
time.
Heating Times Mo Tu We Th Fr Sa Su 00:00 Unoccupied* 07:00 Occupied 16:00 Unoccupied
Heating Times Mo Tu We Th Fr Sa Su 00:00 Unoccupied* 07:00 Occupied 16:00 Unoccupied
Change Day Copy Day
Monday 00:00 12:00 24:00 00:00 Unoccupied* 07:00 Occupied 16:00 Unoccupied
2015-07-25 v1.1
A
Operation on the device 23
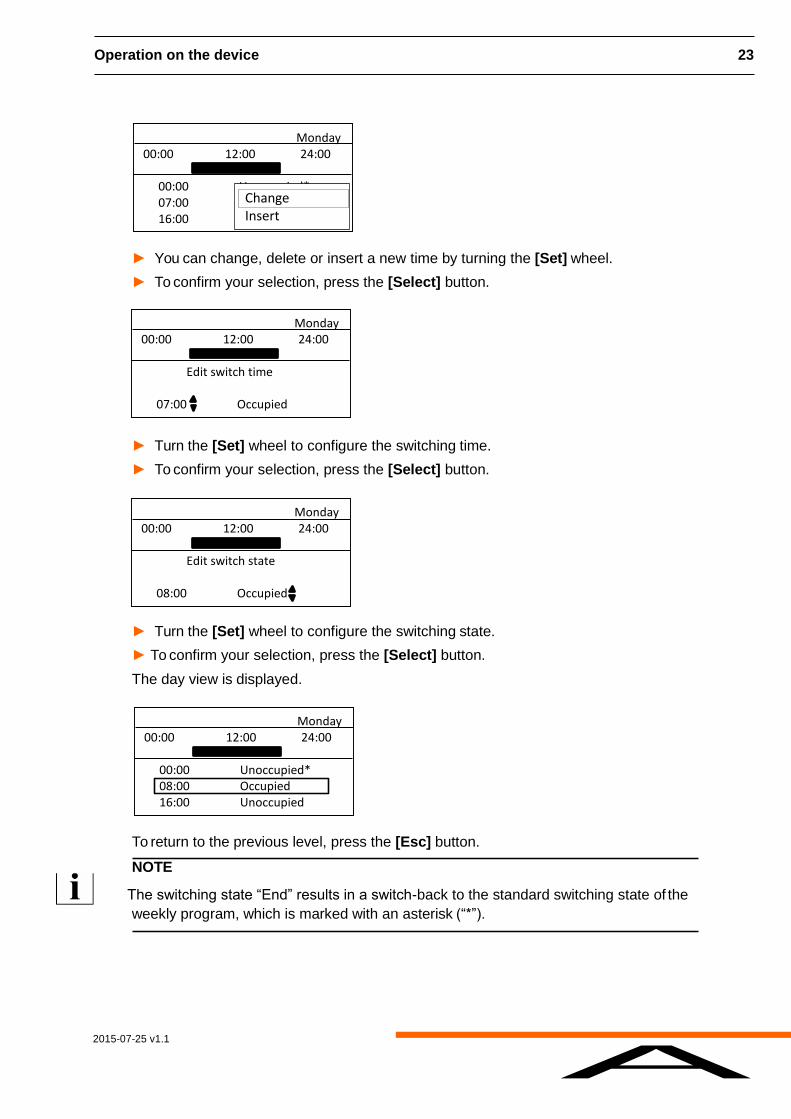
► You can change, delete or insert a new time by turning the [Set] wheel.
► To confirm your selection, press the [Select] button.
► Turn the [Set] wheel to configure the switching time.
► To confirm your selection, press the [Select] button.
► Turn the [Set] wheel to configure the switching state.
► To confirm your selection, press the [Select] button.
The day view is displayed.
To return to the previous level, press the [Esc] button.
NOTE
The switching state “End” results in a switch-back to the standard switching state of the
weekly program, which is marked with an asterisk (“*”).
Monday 00:00 12:00 24:00 00:00 Unoccupied* 07:00 Occupied 16:00 Unoccupied
Change Insert
Monday 00:00 12:00 24:00 Edit switch time 07:00 Occupied
Monday 00:00 12:00 24:00 Edit switch state 08:00 Occupied
Monday 00:00 12:00 24:00 00:00 Unoccupied* 08:00 Occupied 16:00 Unoccupied
2015-07-25 v1.1
A
24 Operation on the device
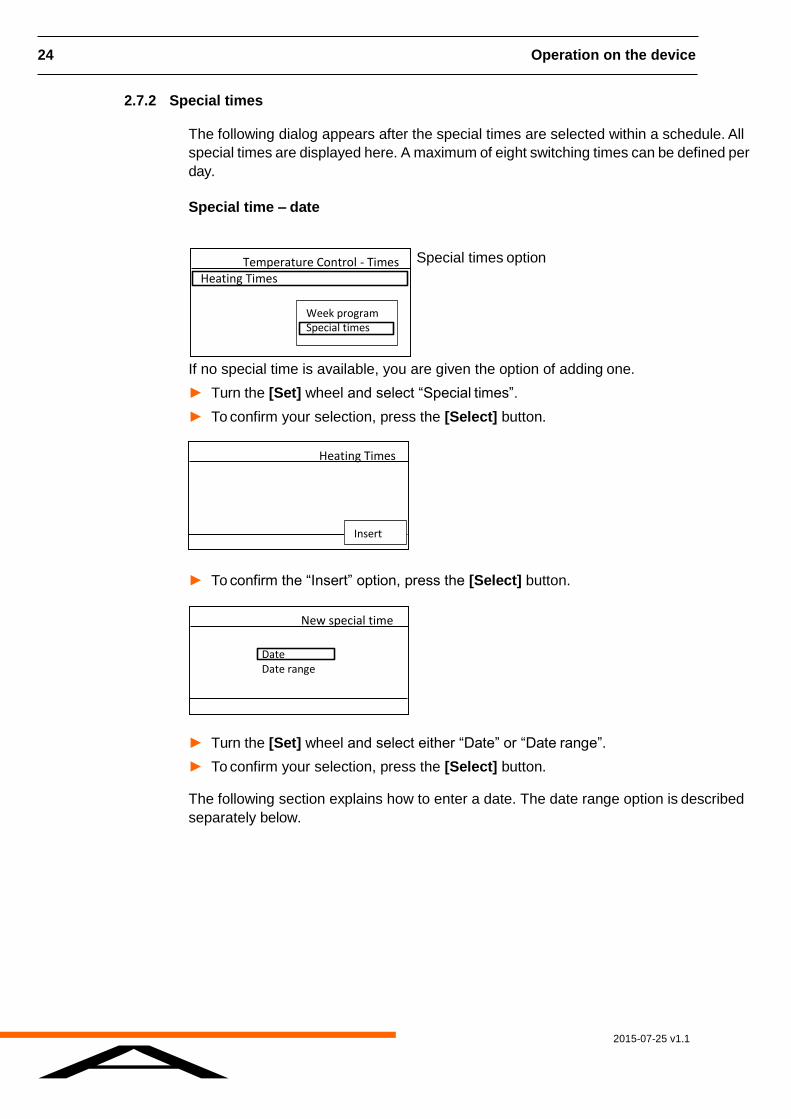
2.7.2 Special times
The following dialog appears after the special times are selected within a schedule. All
special times are displayed here. A maximum of eight switching times can be defined per
day.
Special time – date
Special times option
If no special time is available, you are given the option of adding one.
► Turn the [Set] wheel and select “Special times”.
► To confirm your selection, press the [Select] button.
► To confirm the “Insert” option, press the [Select] button.
► Turn the [Set] wheel and select either “Date” or “Date range”.
► To confirm your selection, press the [Select] button.
The following section explains how to enter a date. The date range option is described
separately below.
Temperature Control - Times Heating Times
Week program Special times
Heating Times
Insert
New special time
Date Date range
2015-07-25 v1.1
A
Operation on the device 25
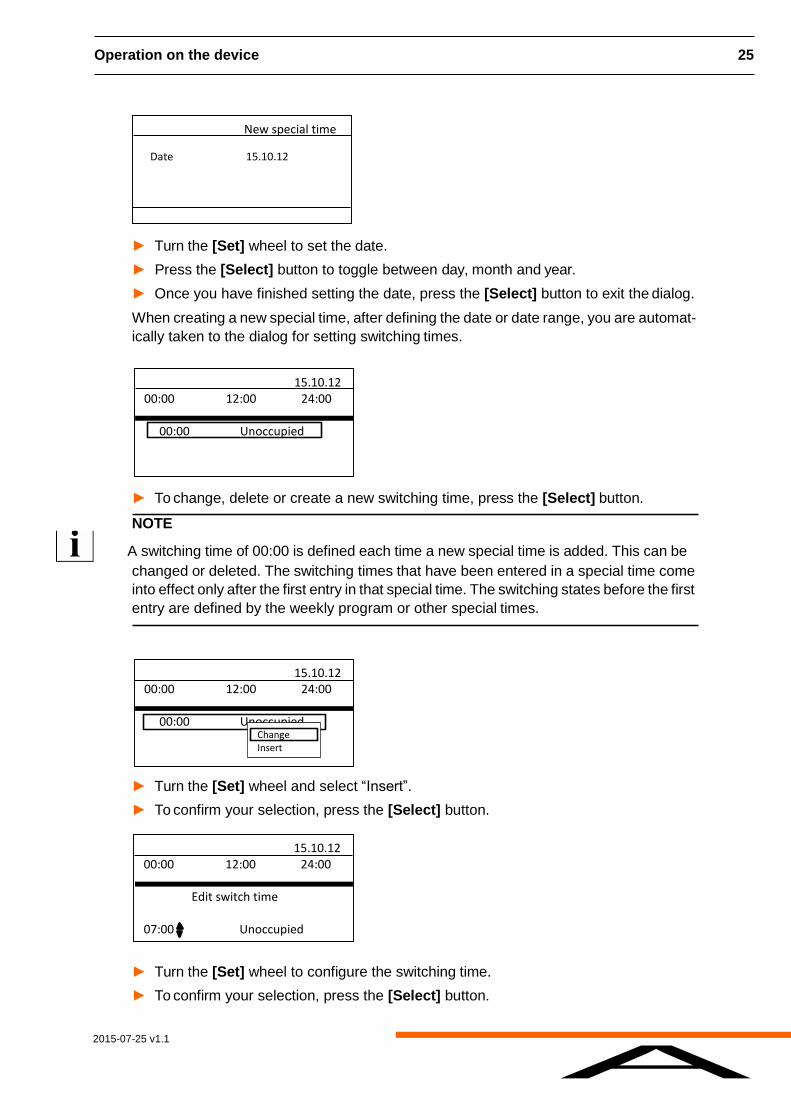
► Turn the [Set] wheel to set the date.
► Press the [Select] button to toggle between day, month and year.
► Once you have finished setting the date, press the [Select] button to exit the dialog.
When creating a new special time, after defining the date or date range, you are automat-
ically taken to the dialog for setting switching times.
► To change, delete or create a new switching time, press the [Select] button.
NOTE
A switching time of 00:00 is defined each time a new special time is added. This can be
changed or deleted. The switching times that have been entered in a special time come
into effect only after the first entry in that special time. The switching states before the first
entry are defined by the weekly program or other special times.
► Turn the [Set] wheel and select “Insert”.
► To confirm your selection, press the [Select] button.
► Turn the [Set] wheel to configure the switching time.
► To confirm your selection, press the [Select] button.
15.10.12 00:00 12:00 24:00 00:00 Unoccupied
15.10.12 00:00 12:00 24:00 00:00 Unoccupied
Change Insert
15.10.12 00:00 12:00 24:00 Edit switch time 07:00 Unoccupied
New special time
Date 15.10.12
2015-07-25 v1.1
A
26 Operation on the device
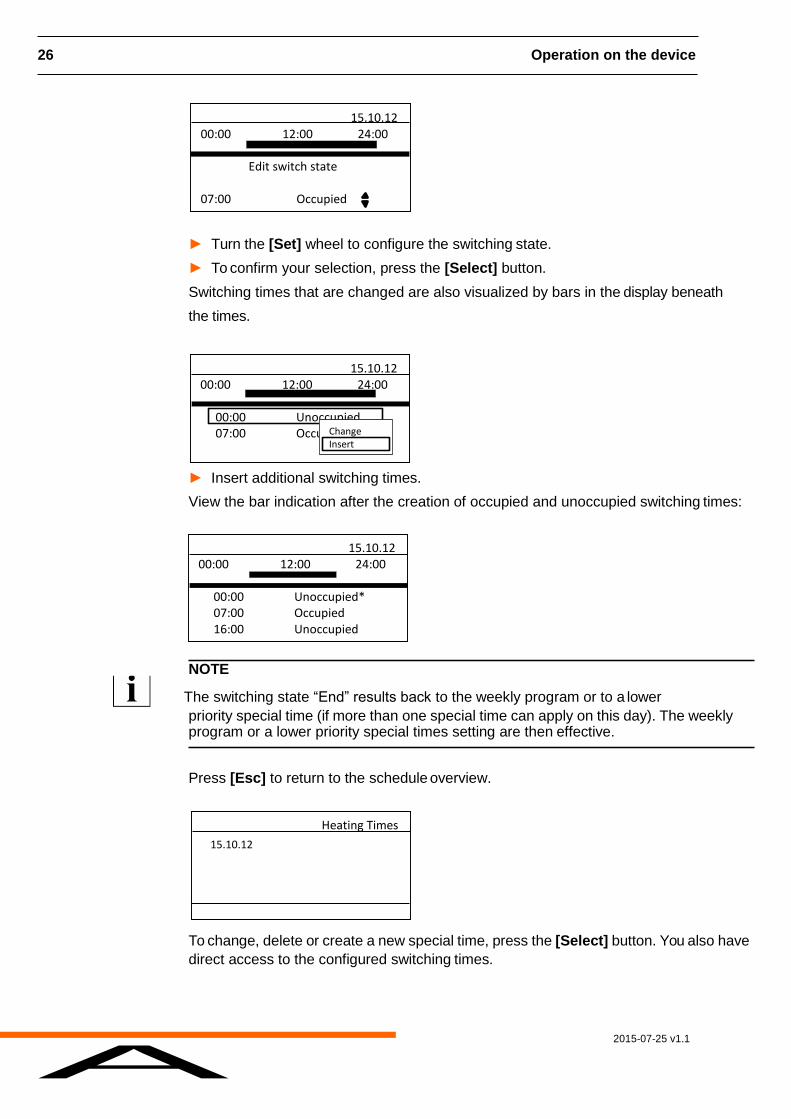
► Turn the [Set] wheel to configure the switching state.
► To confirm your selection, press the [Select] button.
Switching times that are changed are also visualized by bars in the display beneath
the times.
► Insert additional switching times.
View the bar indication after the creation of occupied and unoccupied switching times:
NOTE
The switching state “End” results back to the weekly program or to a lower
priority special time (if more than one special time can apply on this day). The weekly program or a lower priority special times setting are then effective.
Press [Esc] to return to the schedule overview.
To change, delete or create a new special time, press the [Select] button. You also have
direct access to the configured switching times.
15.10.12 00:00 12:00 24:00 Edit switch state 07:00 Occupied
15.10.12 00:00 12:00 24:00 00:00 Unoccupied 07:00 Occupied
Change Insert
15.10.12 00:00 12:00 24:00 00:00 Unoccupied* 07:00 Occupied 16:00 Unoccupied
Heating Times
15.10.12
2015-07-25 v1.1
A
Operation on the device 27
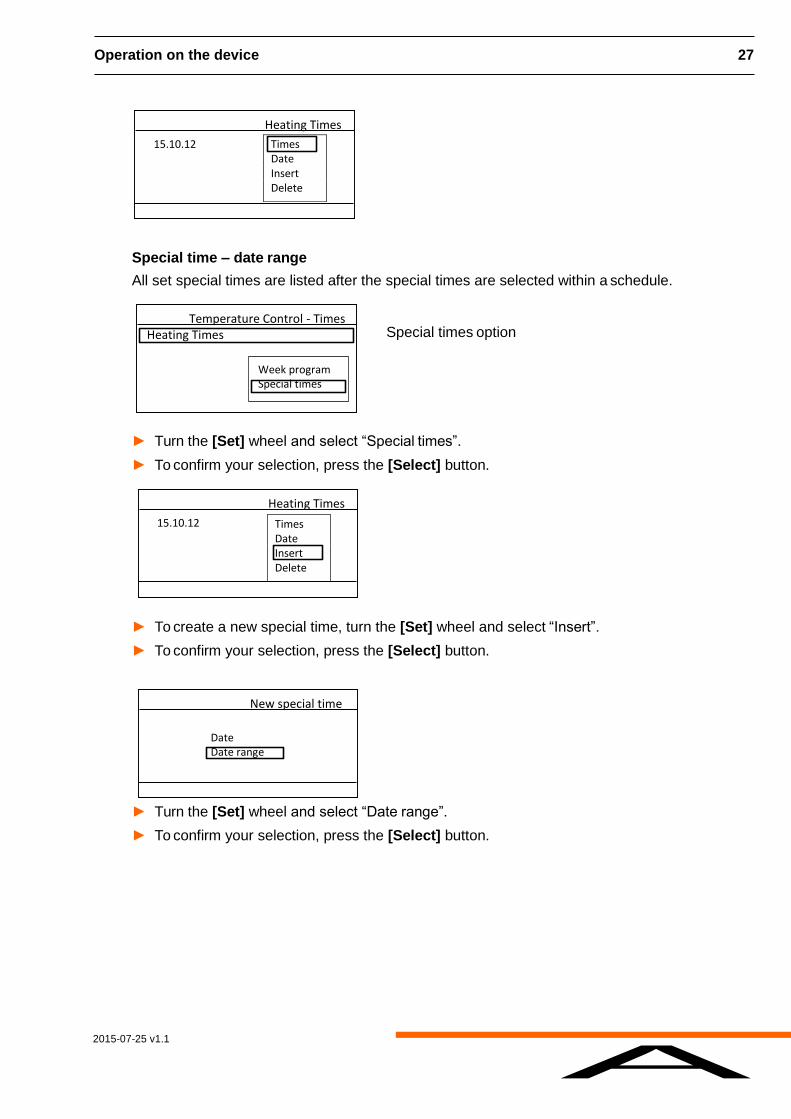
Special time – date range
All set special times are listed after the special times are selected within a schedule.
Special times option
► Turn the [Set] wheel and select “Special times”.
► To confirm your selection, press the [Select] button.
► To create a new special time, turn the [Set] wheel and select “Insert”.
► To confirm your selection, press the [Select] button.
► Turn the [Set] wheel and select “Date range”.
► To confirm your selection, press the [Select] button.
Heating Times
15.10.12 Times Date Insert Delete
Temperature Control - Times Heating Times
Week program Special times
Heating Times
15.10.12 Times Date Insert Delete
New special time
Date Date range
2015-07-25 v1.1
A
28 Operation on the device
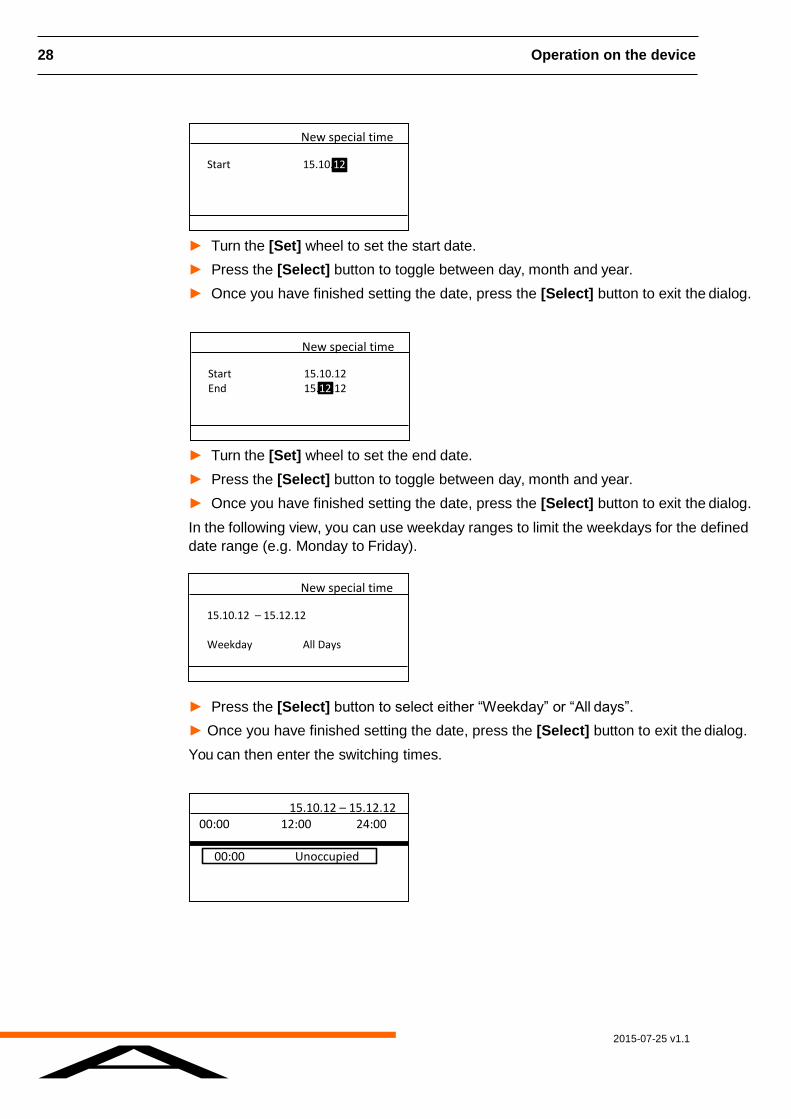
► Turn the [Set] wheel to set the start date.
► Press the [Select] button to toggle between day, month and year.
► Once you have finished setting the date, press the [Select] button to exit the dialog.
► Turn the [Set] wheel to set the end date.
► Press the [Select] button to toggle between day, month and year.
► Once you have finished setting the date, press the [Select] button to exit the dialog.
In the following view, you can use weekday ranges to limit the weekdays for the defined
date range (e.g. Monday to Friday).
► Press the [Select] button to select either “Weekday” or “All days”.
► Once you have finished setting the date, press the [Select] button to exit the dialog.
You can then enter the switching times.
New special time
Start 15.10.12
New special time
Start 15.10.12 End 15.12.12
New special time
15.10.12 – 15.12.12 Weekday All Days
15.10.12 – 15.12.12 00:00 12:00 24:00 00:00 Unoccupied
2015-07-25 v1.1
A
Operation on the device 29
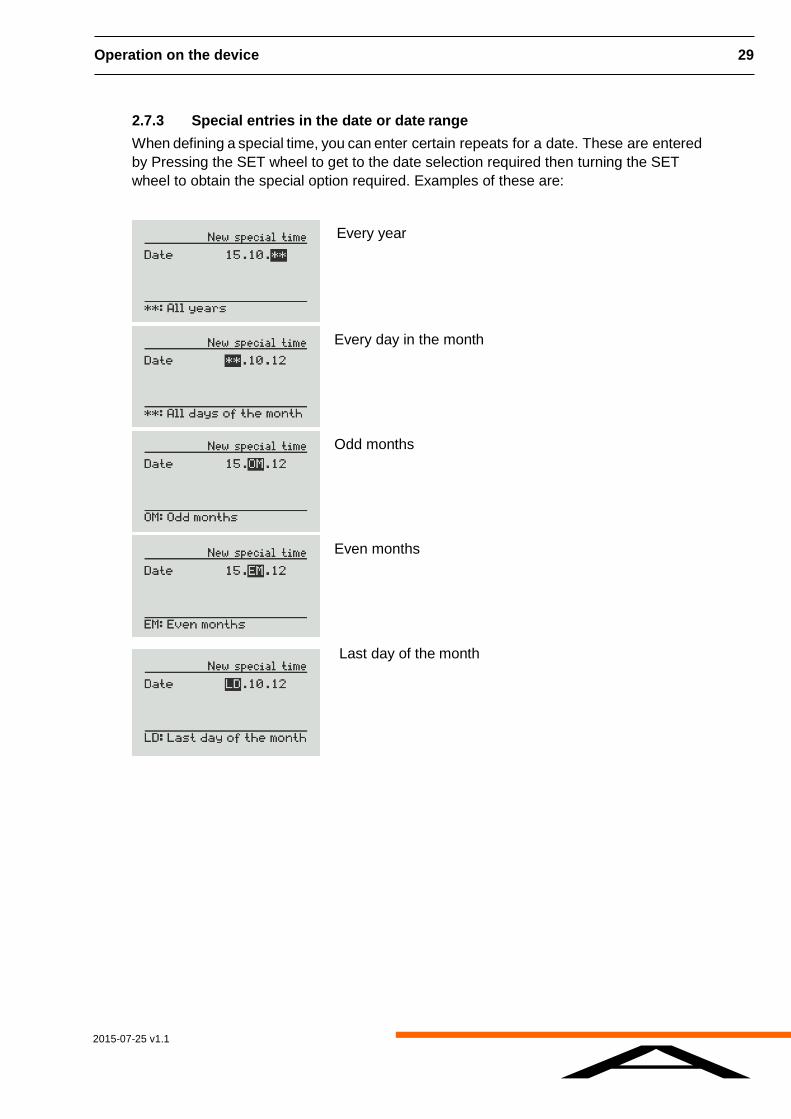
2.7.3 Special entries in the date or date range
When defining a special time, you can enter certain repeats for a date. These are entered
by Pressing the SET wheel to get to the date selection required then turning the SET
wheel to obtain the special option required. Examples of these are:
Every year
Every day in the month
Odd months
Even months
Last day of the month
2015-07-25 v1.1
A
30 Operation on the device
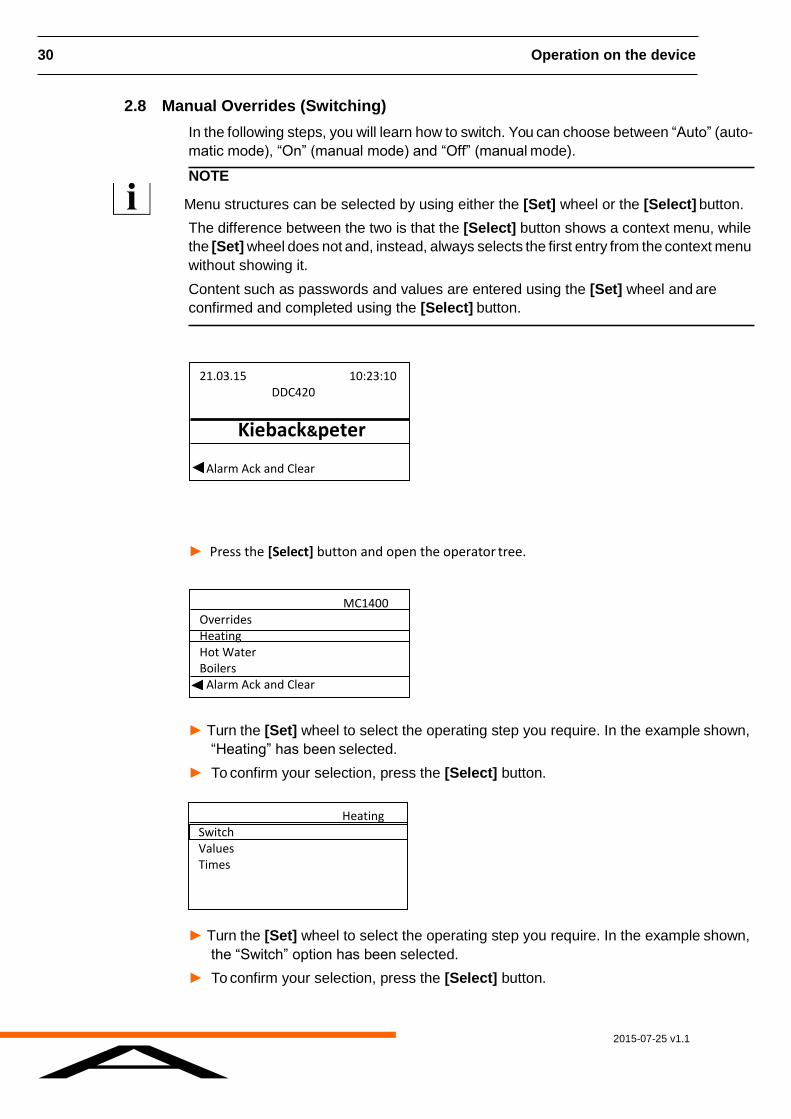
2.8 Manual Overrides (Switching)
In the following steps, you will learn how to switch. You can choose between “Auto” (auto-
matic mode), “On” (manual mode) and “Off” (manual mode).
NOTE
Menu structures can be selected by using either the [Set] wheel or the [Select] button.
The difference between the two is that the [Select] button shows a context menu, while
the [Set] wheel does not and, instead, always selects the first entry from the context menu
without showing it.
Content such as passwords and values are entered using the [Set] wheel and are
confirmed and completed using the [Select] button.
► Press the [Select] button and open the operator tree.
► Turn the [Set] wheel to select the operating step you require. In the example shown,
“Heating” has been selected.
► To confirm your selection, press the [Select] button.
► Turn the [Set] wheel to select the operating step you require. In the example shown,
the “Switch” option has been selected.
► To confirm your selection, press the [Select] button.
MC1400 Overrides Heating Hot Water Boilers Alarm Ack and Clear
21.03.15 10:23:10 DDC420
Kieback&peter Alarm Ack and Clear
Heating Switch Values Times
2015-07-25 v1.1
A
Operation on the device 31
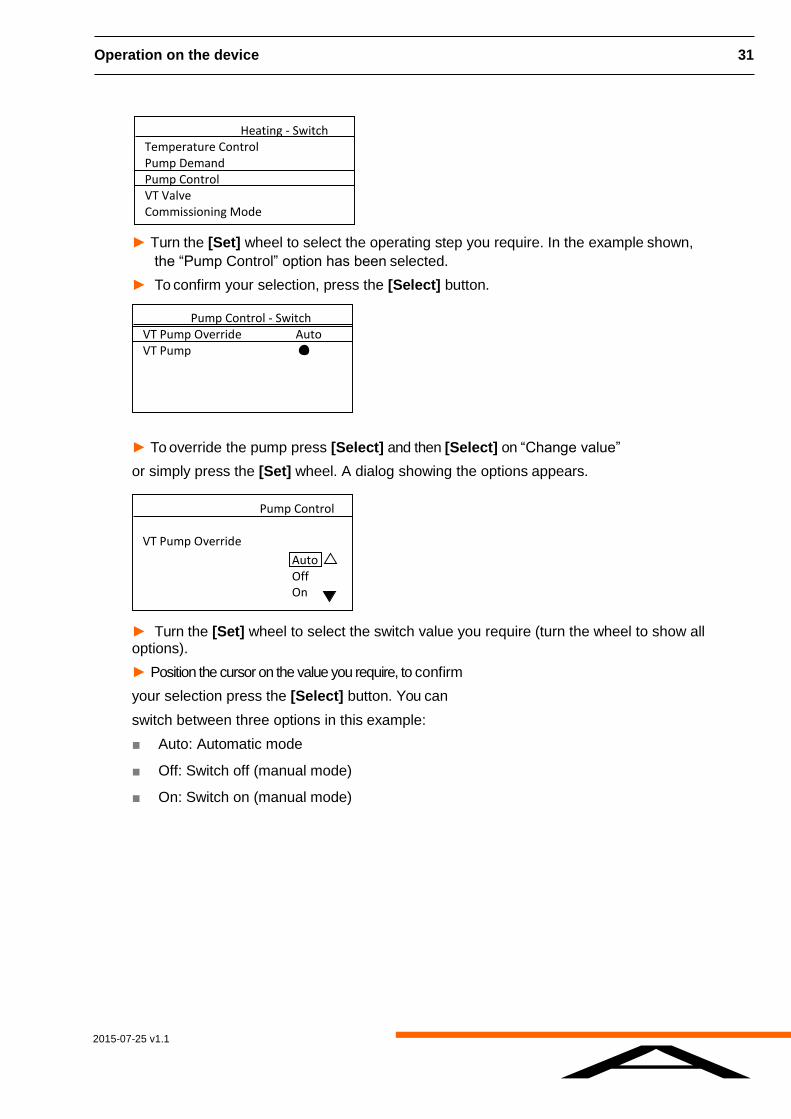
► Turn the [Set] wheel to select the operating step you require. In the example shown,
the “Pump Control” option has been selected.
► To confirm your selection, press the [Select] button.
► To override the pump press [Select] and then [Select] on “Change value”
or simply press the [Set] wheel. A dialog showing the options appears.
► Turn the [Set] wheel to select the switch value you require (turn the wheel to show all options).
► Position the cursor on the value you require, to confirm
your selection press the [Select] button. You can
switch between three options in this example:
■ Auto: Automatic mode
■ Off: Switch off (manual mode)
■ On: Switch on (manual mode)
Heating - Switch Temperature Control Pump Demand Pump Control VT Valve Commissioning Mode
Pump Control - Switch VT Pump Override Auto VT Pump
Pump Control VT Pump Override
Auto Off On
2015-07-25 v1.1
A
32 Operation on the device
2.9 Trend display
An important feature of Kieback&Peter controllers is the trend function. The controller
automatically records and saves changes of value over an extended period. This saved
data can be displayed graphically on the SYX66x. This is the purpose of the SYX66x’s
trend function.
2.9.1 Opening the trend curve dialog
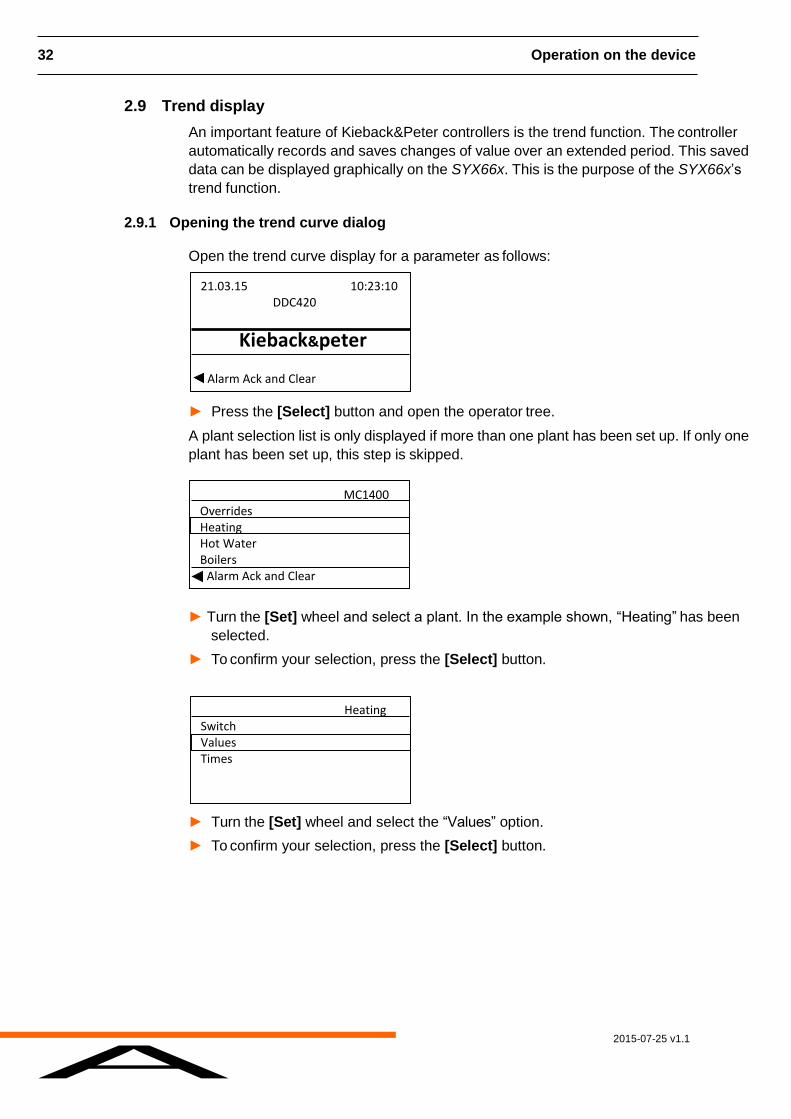
Open the trend curve display for a parameter as follows:
► Press the [Select] button and open the operator tree.
A plant selection list is only displayed if more than one plant has been set up. If only one
plant has been set up, this step is skipped.
► Turn the [Set] wheel and select a plant. In the example shown, “Heating” has been
selected.
► To confirm your selection, press the [Select] button.
► Turn the [Set] wheel and select the “Values” option.
► To confirm your selection, press the [Select] button.
21.03.15 10:23:10 DDC420
Kieback&peter Alarm Ack and Clear
MC1400 Overrides Heating Hot Water Boilers Alarm Ack and Clear
Heating Switch Values Times
2015-07-25 v1.1
A
Operation on the device 33
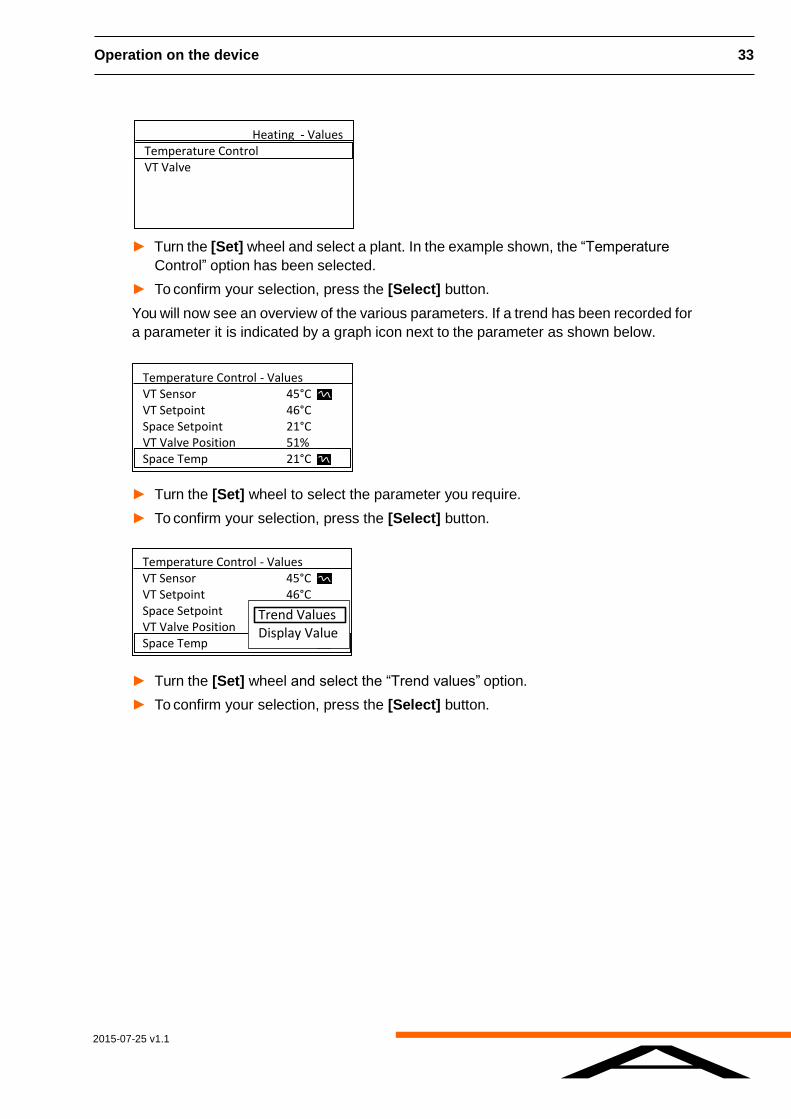
► Turn the [Set] wheel and select a plant. In the example shown, the “Temperature
Control” option has been selected.
► To confirm your selection, press the [Select] button.
You will now see an overview of the various parameters. If a trend has been recorded for
a parameter it is indicated by a graph icon next to the parameter as shown below.
► Turn the [Set] wheel to select the parameter you require.
► To confirm your selection, press the [Select] button.
► Turn the [Set] wheel and select the “Trend values” option.
► To confirm your selection, press the [Select] button.
Heating - Values Temperature Control VT Valve
Temperature Control - Values VT Sensor 45°C VT Setpoint 46°C Space Setpoint 21°C VT Valve Position 51% Space Temp 21°C
Temperature Control - Values VT Sensor 45°C VT Setpoint 46°C Space Setpoint 21°C VT Valve Position 51% Space Temp 21°C
Trend Values Display Value
2015-07-25 v1.1
A
34 Operation on the device
2.9.2 Trend curve display
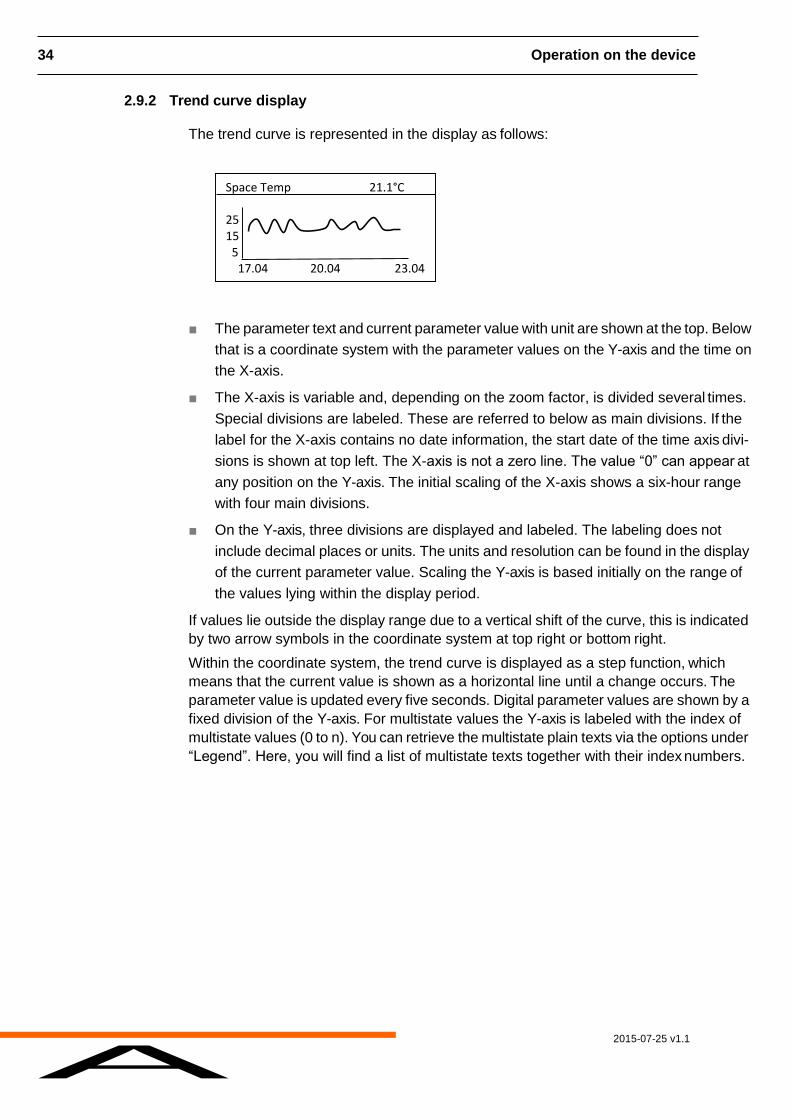
The trend curve is represented in the display as follows:
■ The parameter text and current parameter value with unit are shown at the top. Below
that is a coordinate system with the parameter values on the Y-axis and the time on
the X-axis.
■ The X-axis is variable and, depending on the zoom factor, is divided several times.
Special divisions are labeled. These are referred to below as main divisions. If the
label for the X-axis contains no date information, the start date of the time axis divi-
sions is shown at top left. The X-axis is not a zero line. The value “0” can appear at
any position on the Y-axis. The initial scaling of the X-axis shows a six-hour range
with four main divisions.
■ On the Y-axis, three divisions are displayed and labeled. The labeling does not
include decimal places or units. The units and resolution can be found in the display
of the current parameter value. Scaling the Y-axis is based initially on the range of
the values lying within the display period.
If values lie outside the display range due to a vertical shift of the curve, this is indicated
by two arrow symbols in the coordinate system at top right or bottom right.
Within the coordinate system, the trend curve is displayed as a step function, which
means that the current value is shown as a horizontal line until a change occurs. The
parameter value is updated every five seconds. Digital parameter values are shown by a
fixed division of the Y-axis. For multistate values the Y-axis is labeled with the index of
multistate values (0 to n). You can retrieve the multistate plain texts via the options under
“Legend”. Here, you will find a list of multistate texts together with their index numbers.
Space Temp 21.1°C 25 15 5 17.04 20.04 23.04
2015-07-25 v1.1
A
Operation on the device 35
2.9.3 Adjusting the trend curve display
You can adapt the trend curve display to your needs. You can zoom in and out of the trend
curve or move it. If the current trend value is visible in the trend view, the trend curve
continues with newly incoming trend values.
You have a special range of options for adjusting the display of the trend curve. These
can be called up in the trend curve display by pressing the [Select] button.
NOTE
Menu structures can be selected by using either the [Set] wheel or the [Select] button.
The difference between the two is that the [Select] button shows a context menu, while
the [Set] wheel does not and, instead, always selects the first entry from the context menu
without showing it.
Content such as passwords and values are entered using the [Set] wheel and are
confirmed and completed using the [Select] button.
These include the following selection options:
■ To the start
The start of the trend recording, i.e. the oldest trend values are displayed. Time and
value axes are scaled if required.
■ To the end
The most recent trend values are displayed. Time and value axes are scaled if
required.
■ Legend
Only available for multistate parameters. Select this option and confirm by pressing
the [Select] button to display a list of the multistate texts and their corresponding
index numbers.
■ Scaling values
Zoom the trend curve using the value range.
■ Scaling time
Zoom the trend curve using time.
■ Moving vertically
Move the trend curve up or down.
Move horizontally
You can move the trend curve left and right along the time axis directly in the trend curve
display by turning the [Set] wheel on the SYX66x, provided that it is not already displayed
in full. With each grid step you move the trend curve by one main horizontal pitch.
2015-07-25 v1.1
A
36 Operation on the device
Moving vertically
► Call up the options in the trend curve display by pressing the [Select] button.
► Select the “Move vertically” option and confirm by pressing the [Select] button.
The view changes again in the trend curve display. The Y-axis label flashes.
► Turn the [Set] wheel until you reach the desired display.
With each grid step you move the trend curve up or down by one main division. It stops
moving when the biggest/smallest existing trend value can be displayed, regardless of
whether the curve is visible in the current view.
► Press the [Select] button.
The setting is applied and you exit setting mode.
Zooming using time
► Call up the options in the trend curve display by pressing the [Select] button.
► Select the “Scale time” option and confirm by pressing the [Select] button.
The view changes again in the trend curve display. The X-axis label flashes.
► Turn the [Set] wheel to change the zoom factor.
The zoom mid-point is the center of the display.
► Press the [Select] button to confirm.
The setting is applied and you exit setting mode.
Zooming using the value range
► Call up the options in the trend curve display by pressing the [Select] button.
► Select the “Scale values” option and confirm by pressing the [Select] button.
The view changes again in the trend curve display. The Y-axis label flashes.
► Turn the [Set] wheel to change the zoom factor.
The zoom mid-point is the center of the display.
► Press the [Select] button to confirm.
The setting is applied and you exit setting mode.
2015-07-25 v1.1
A
Operation on the device 37
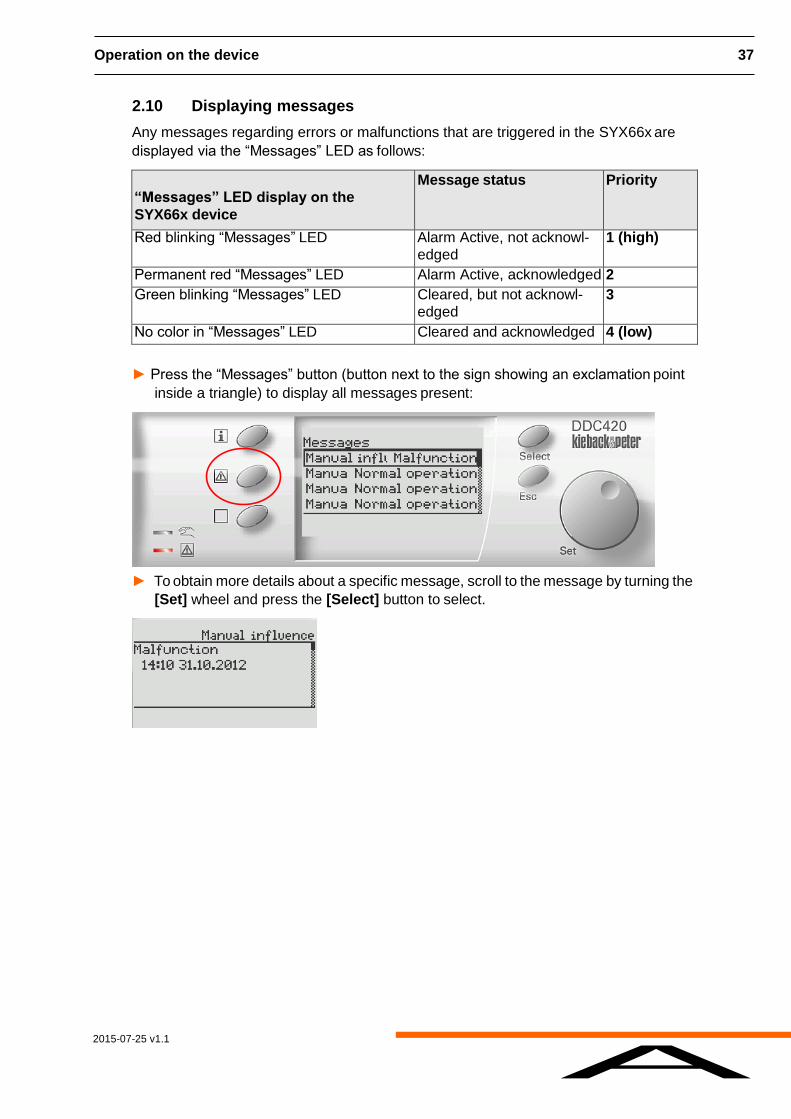
2.10 Displaying messages
Any messages regarding errors or malfunctions that are triggered in the SYX66x are
displayed via the “Messages” LED as follows:
“Messages” LED display on the
SYX66x device
Message status Priority
Red blinking “Messages” LED Alarm Active, not acknowl-
edged
1 (high)
Permanent red “Messages” LED Alarm Active, acknowledged 2
Green blinking “Messages” LED Cleared, but not acknowl-
edged
3
No color in “Messages” LED Cleared and acknowledged 4 (low)
► Press the “Messages” button (button next to the sign showing an exclamation point
inside a triangle) to display all messages present:
► To obtain more details about a specific message, scroll to the message by turning the
[Set] wheel and press the [Select] button to select.
2015-07-25 v1.1
A
38 Operation Using a Web Browser
3 Operation Using a Web Browser
The SYX66x can also be operated using the Web browser of a PC or laptop.
To be able to access the SYX66x from the Web browser, the computer must be
connected to the SYX66x with a network cable. If the SYX66x is connected directly to
the PC, use a crossover cable, otherwise use a patch cable.
3.1 Connecting
A PC or laptop with a Web browser, for example Internet Explorer or Firefox, must be
available in order to access the Web server of the SYX66x. The IP address of the
SYX66x can be found, for example, on the device under “Info button/Device info”. The
IP address of the SYX66x is then entered into the address field of the browser.
► Enter the IP address, e.g. “172.22.200.215,” into the address bar of your browser as
follows:
http://172.22.200.215
NOTE
Entering a leading “0” in the IP address is not allowed.
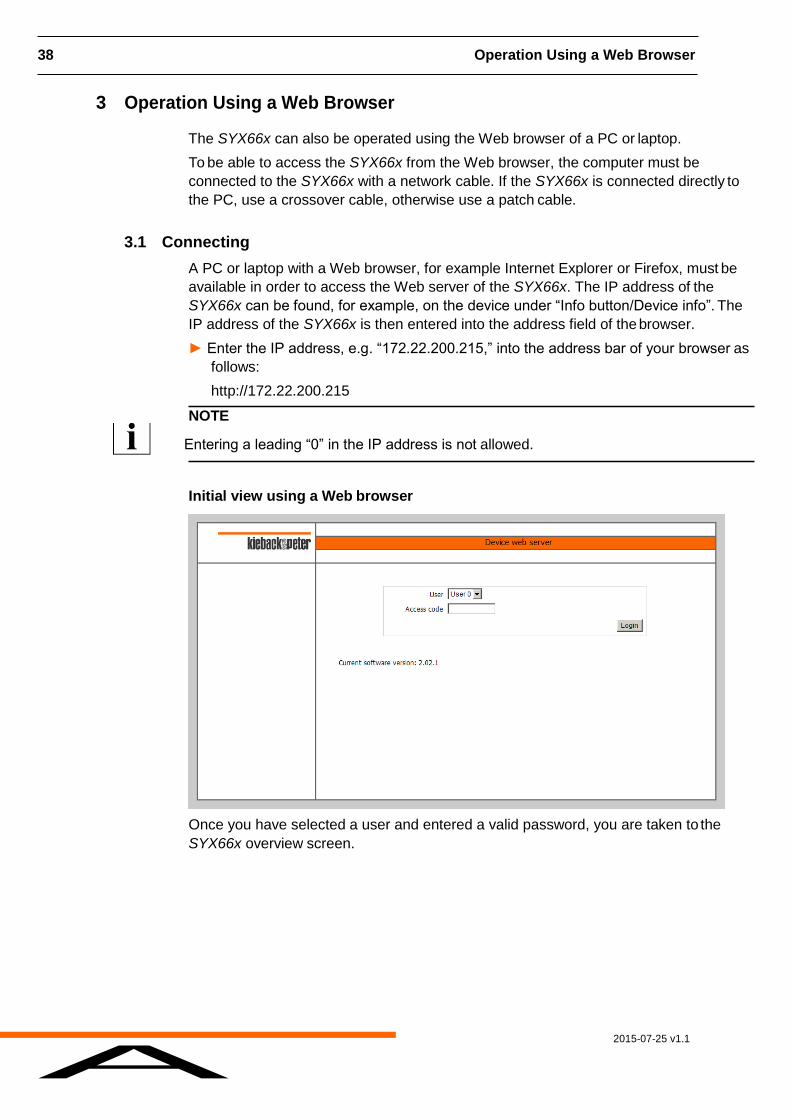
Initial view using a Web browser
Once you have selected a user and entered a valid password, you are taken to the
SYX66x overview screen.
2015-07-25 v1.1
A
Operation Using a Web Browser 39
3.2 Logging a user onto an operation level
In order to avoid incorrect operation, the SYX66x has various operating levels, which can
be activated by entering a password.
In this section, you will learn how to unlock the operating level when you are operating
the SYX66x with the Web browser.
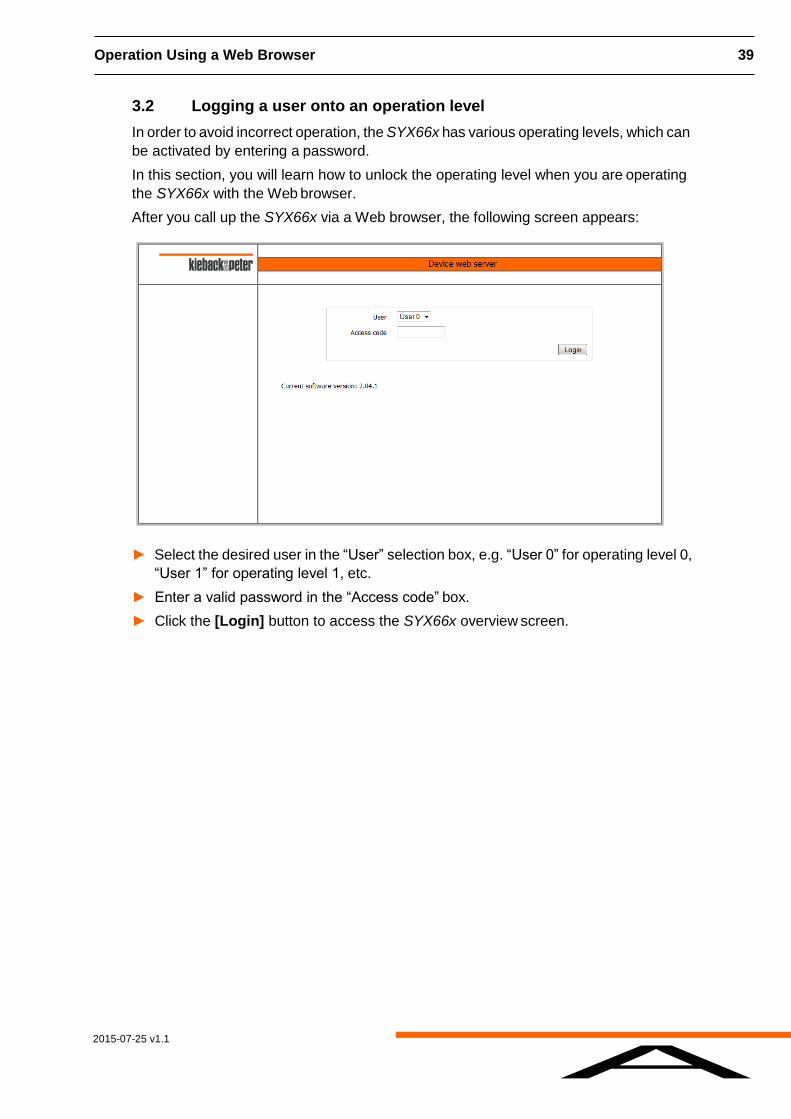
After you call up the SYX66x via a Web browser, the following screen appears:
► Select the desired user in the “User” selection box, e.g. “User 0” for operating level 0,
“User 1” for operating level 1, etc.
► Enter a valid password in the “Access code” box.
► Click the [Login] button to access the SYX66x overview screen.
2015-07-25 v1.1
A
40 Operation Using a Web Browser
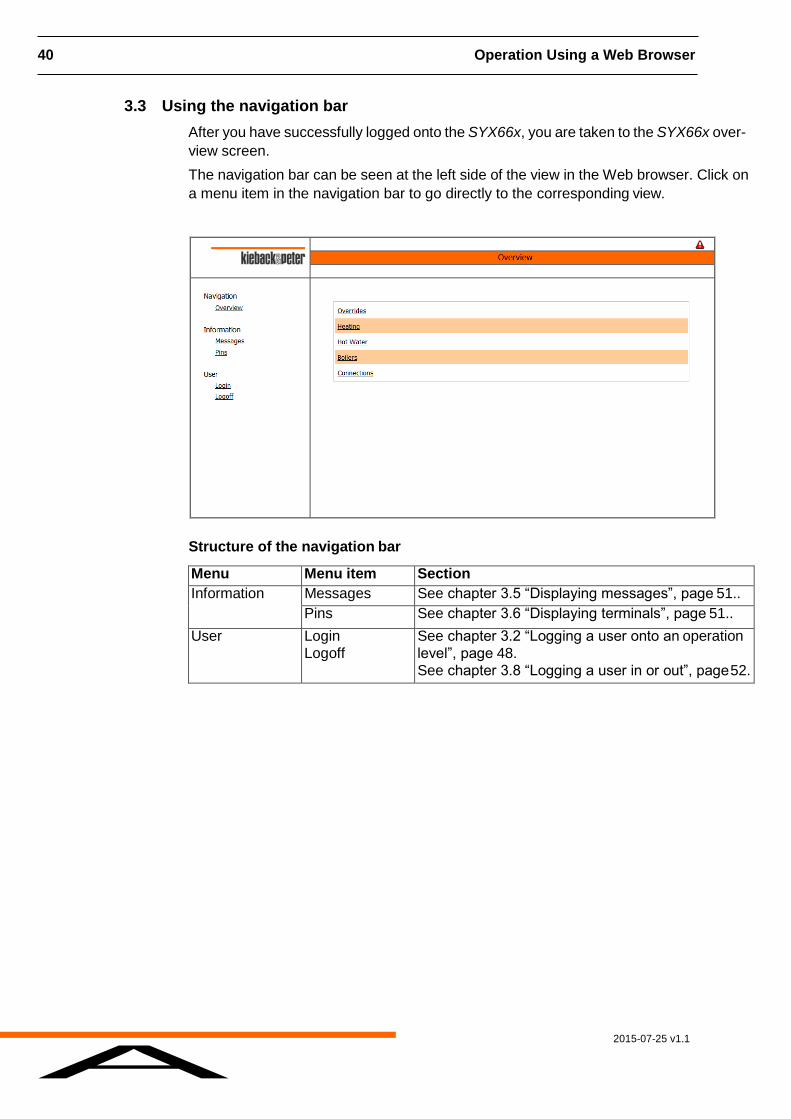
3.3 Using the navigation bar
After you have successfully logged onto the SYX66x, you are taken to the SYX66x over-
view screen.
The navigation bar can be seen at the left side of the view in the Web browser. Click on
a menu item in the navigation bar to go directly to the corresponding view.
Structure of the navigation bar
Menu Menu item Section
Information Messages See chapter 3.5 “Displaying messages”, page 51..
Pins See chapter 3.6 “Displaying terminals”, page 51..
User Login
Logoff
See chapter 3.2 “Logging a user onto an operation
level”, page 48.
See chapter 3.8 “Logging a user in or out”, page 52.
2015-07-25 v1.1
A
Operation Using a Web Browser 41
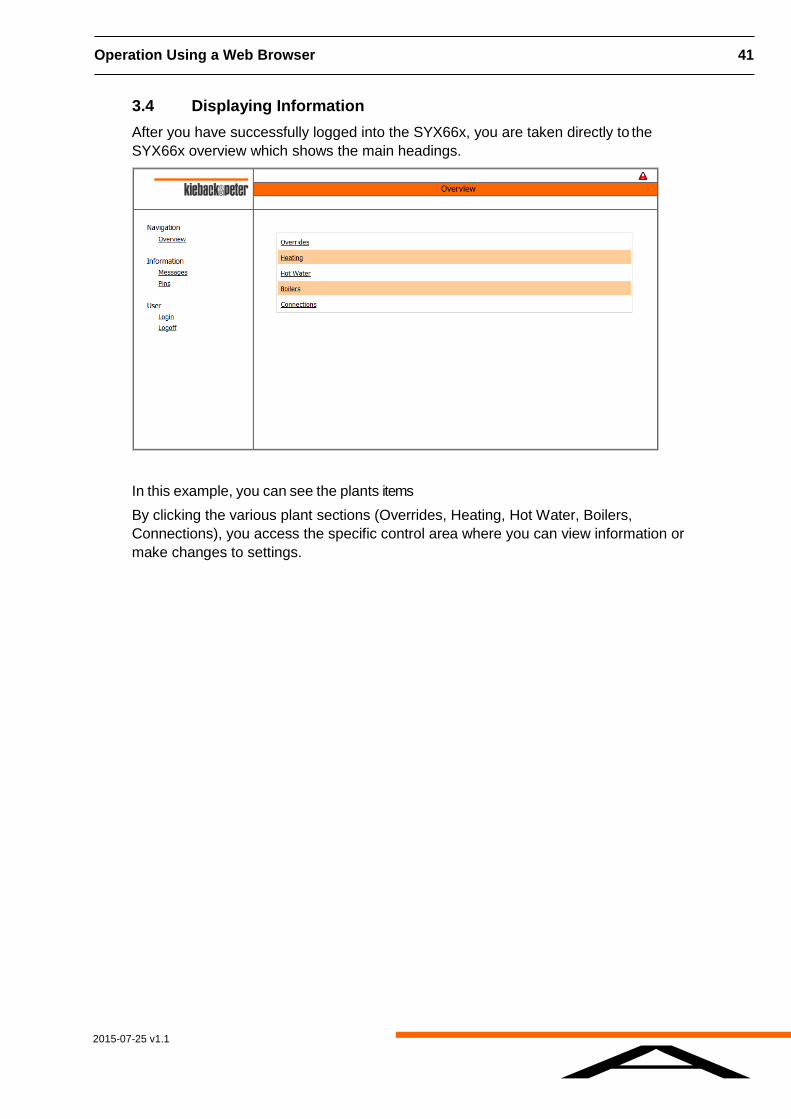
3.4 Displaying Information
After you have successfully logged into the SYX66x, you are taken directly to the
SYX66x overview which shows the main headings.
In this example, you can see the plants items
By clicking the various plant sections (Overrides, Heating, Hot Water, Boilers,
Connections), you access the specific control area where you can view information or
make changes to settings.
2015-07-25 v1.1
A
42 Operation Using a Web Browser
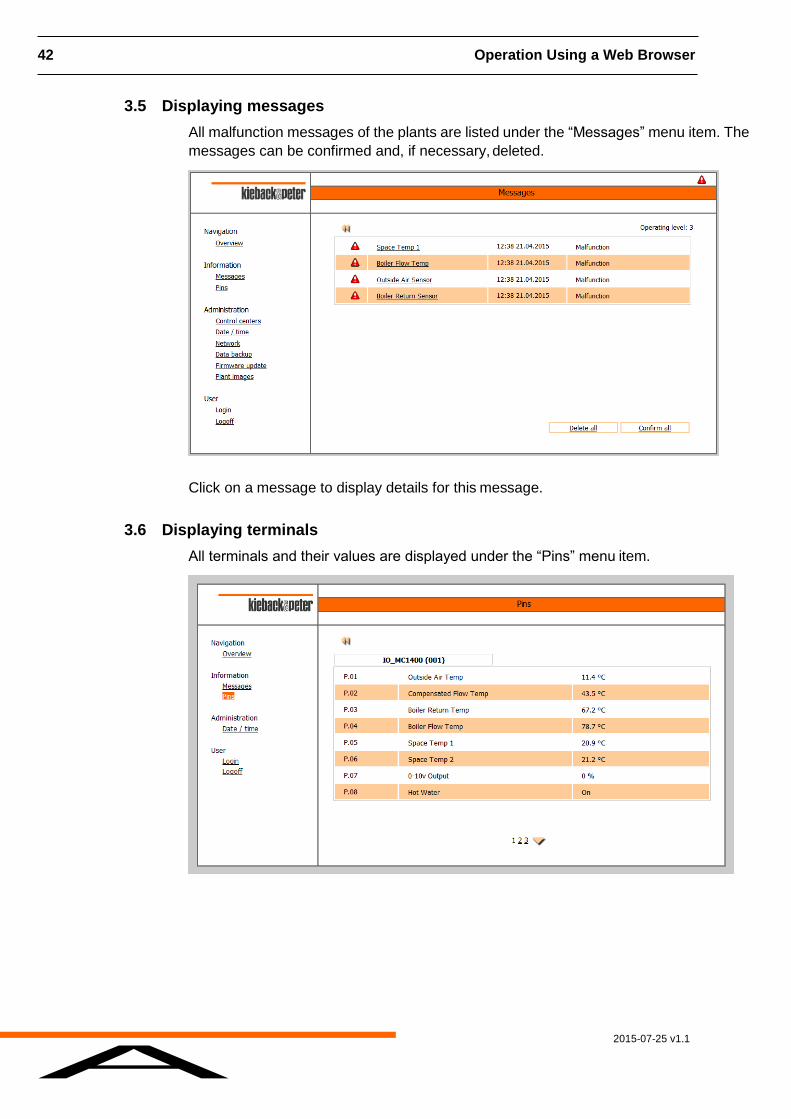
3.5 Displaying messages
All malfunction messages of the plants are listed under the “Messages” menu item. The
messages can be confirmed and, if necessary, deleted.
Click on a message to display details for this message.
3.6 Displaying terminals
All terminals and their values are displayed under the “Pins” menu item.
2015-07-25 v1.1
A
Operation Using a Web Browser 43
3.7 Logging a user in or out
The “Login” menu item can be used to access the various user levels. See
chapter 3.2 “Logging a user onto an operation level”, page 48.
Use “Logoff” to leave the current operating level.
2015-07-25 v1.1
A
44 Operation Using a Web Browser
3.8 Values
3.8.1 Displaying actual values
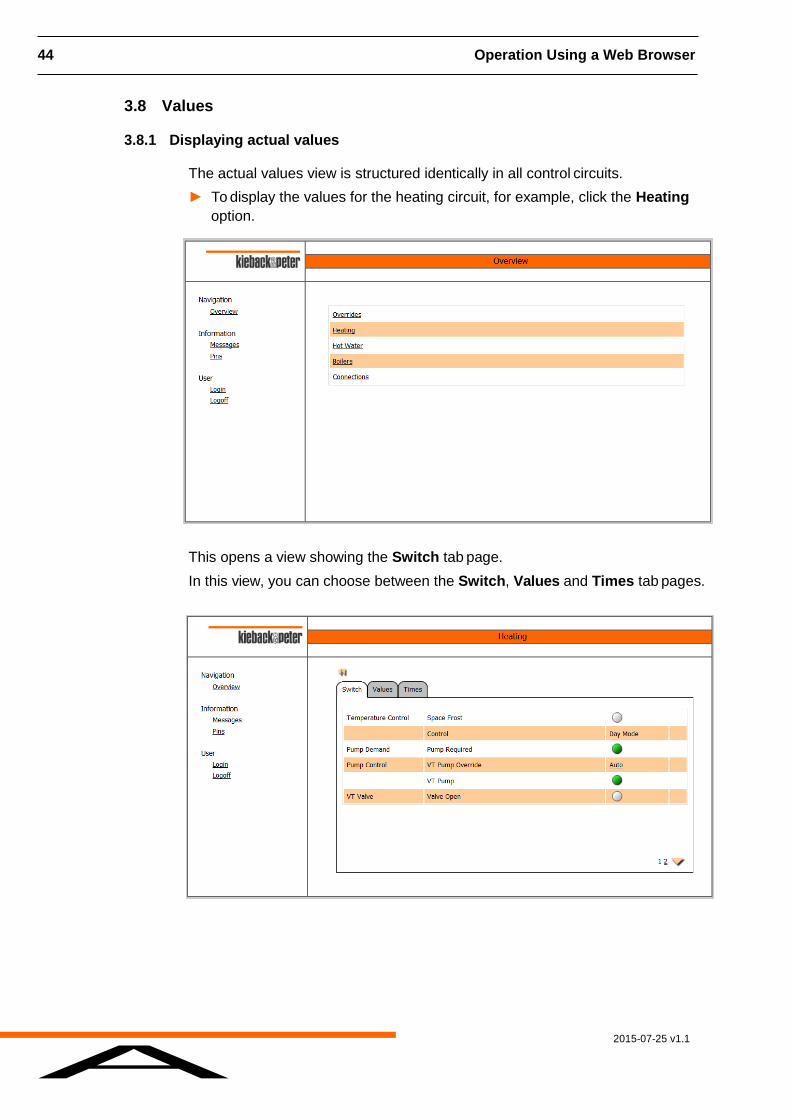
The actual values view is structured identically in all control circuits.
► To display the values for the heating circuit, for example, click the Heating
option.
This opens a view showing the Switch tab page.
In this view, you can choose between the Switch, Values and Times tab pages.
2015-07-25 v1.1
A
Operation Using a Web Browser 45
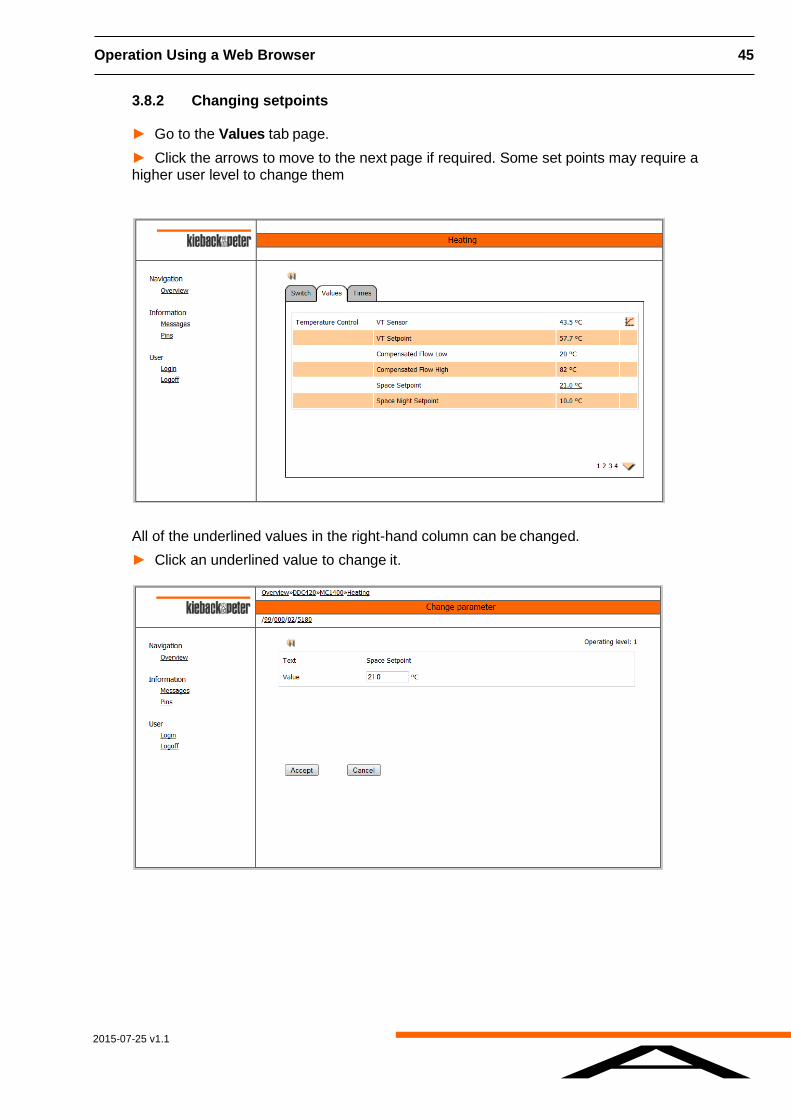
3.8.2 Changing setpoints
► Go to the Values tab page.
► Click the arrows to move to the next page if required. Some set points may require a higher user level to change them
All of the underlined values in the right-hand column can be changed.
► Click an underlined value to change it.
2015-07-25 v1.1
A
46 Operation Using a Web Browser
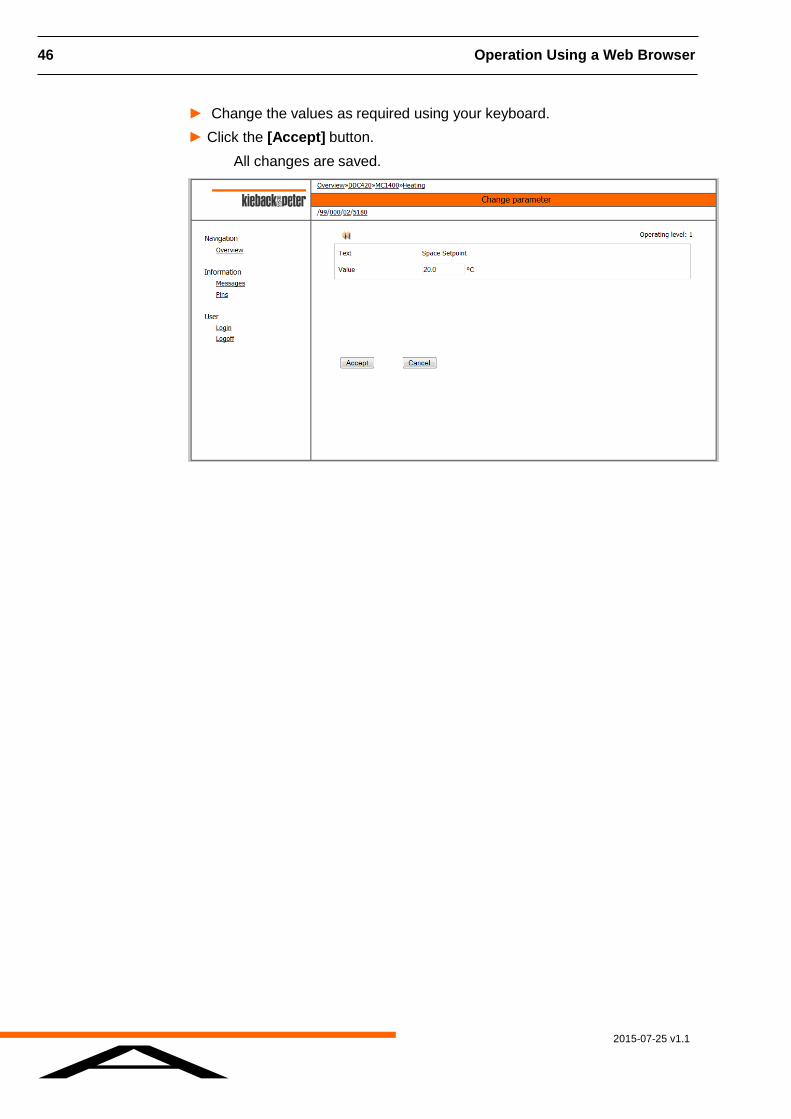
► Change the values as required using your keyboard.
► Click the [Accept] button.
All changes are saved.
2015-07-25 v1.1
A
Operation Using a Web Browser 47
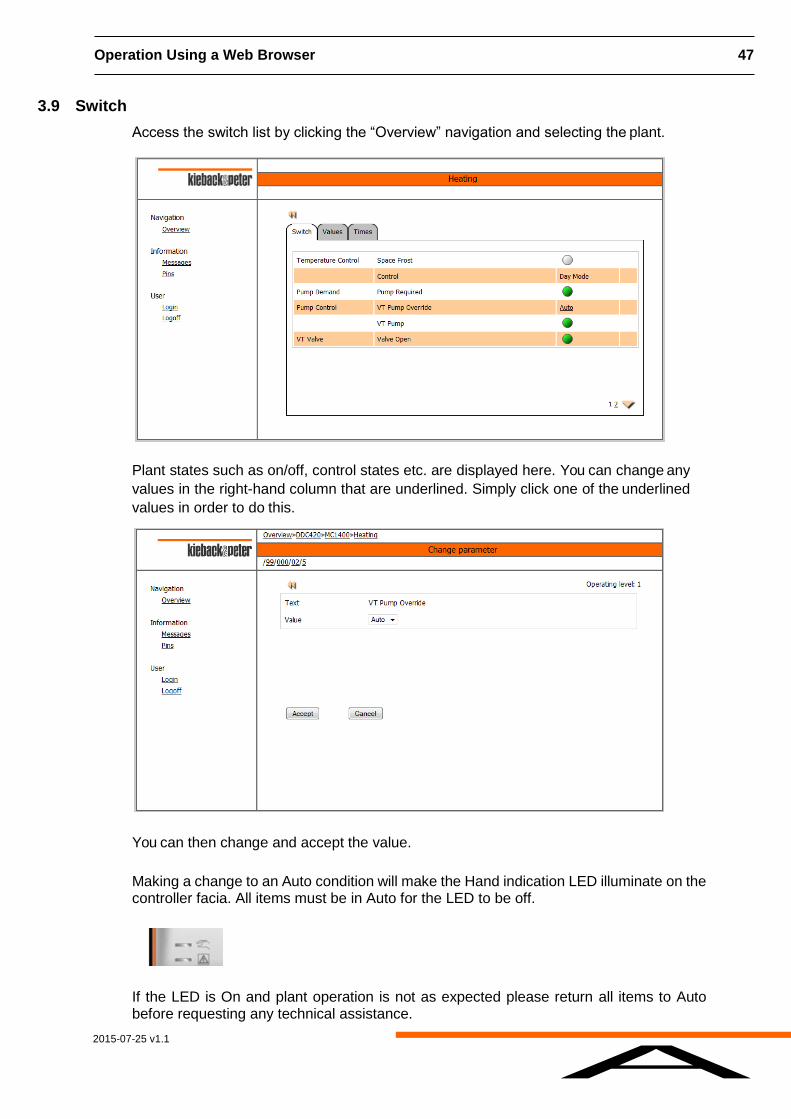
3.9 Switch
Access the switch list by clicking the “Overview” navigation and selecting the plant.
Plant states such as on/off, control states etc. are displayed here. You can change any
values in the right-hand column that are underlined. Simply click one of the underlined
values in order to do this.
You can then change and accept the value.
Making a change to an Auto condition will make the Hand indication LED illuminate on the controller facia. All items must be in Auto for the LED to be off.
If the LED is On and plant operation is not as expected please return all items to Auto before requesting any technical assistance.
2015-07-25 v1.1
A
48 Operation Using a Web Browser
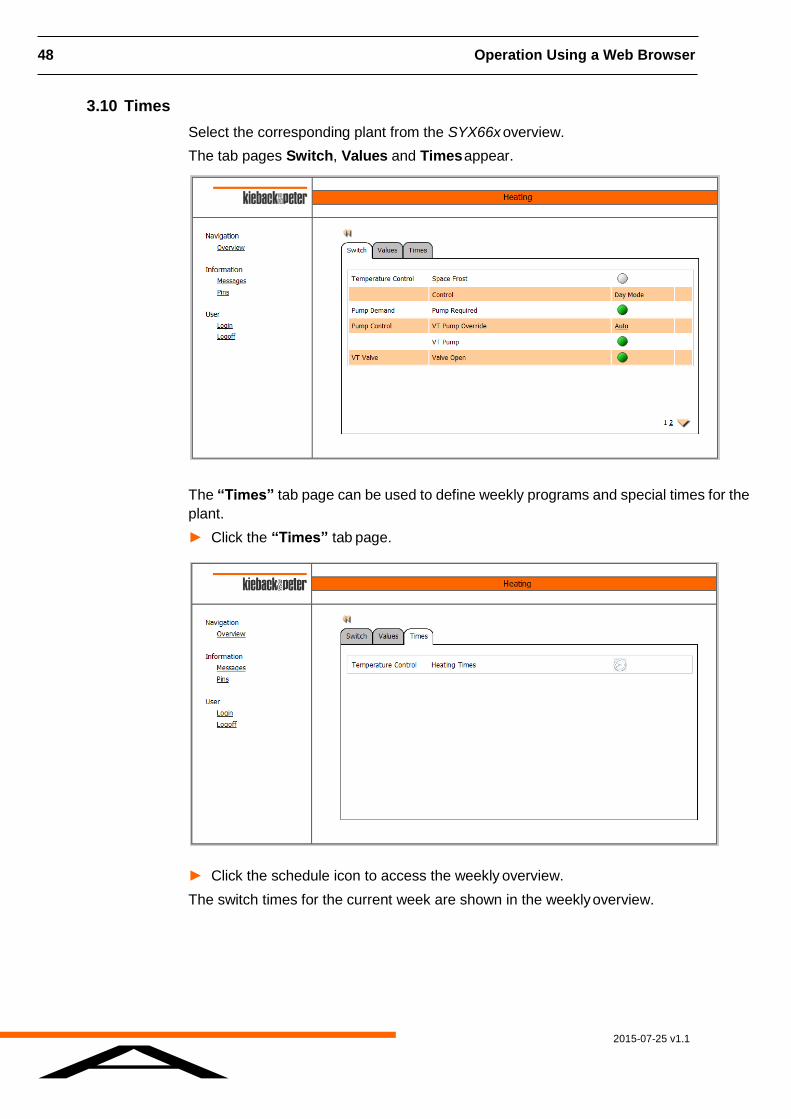
3.10 Times
Select the corresponding plant from the SYX66x overview.
The tab pages Switch, Values and Times appear.
The “Times” tab page can be used to define weekly programs and special times for the
plant.
► Click the “Times” tab page.
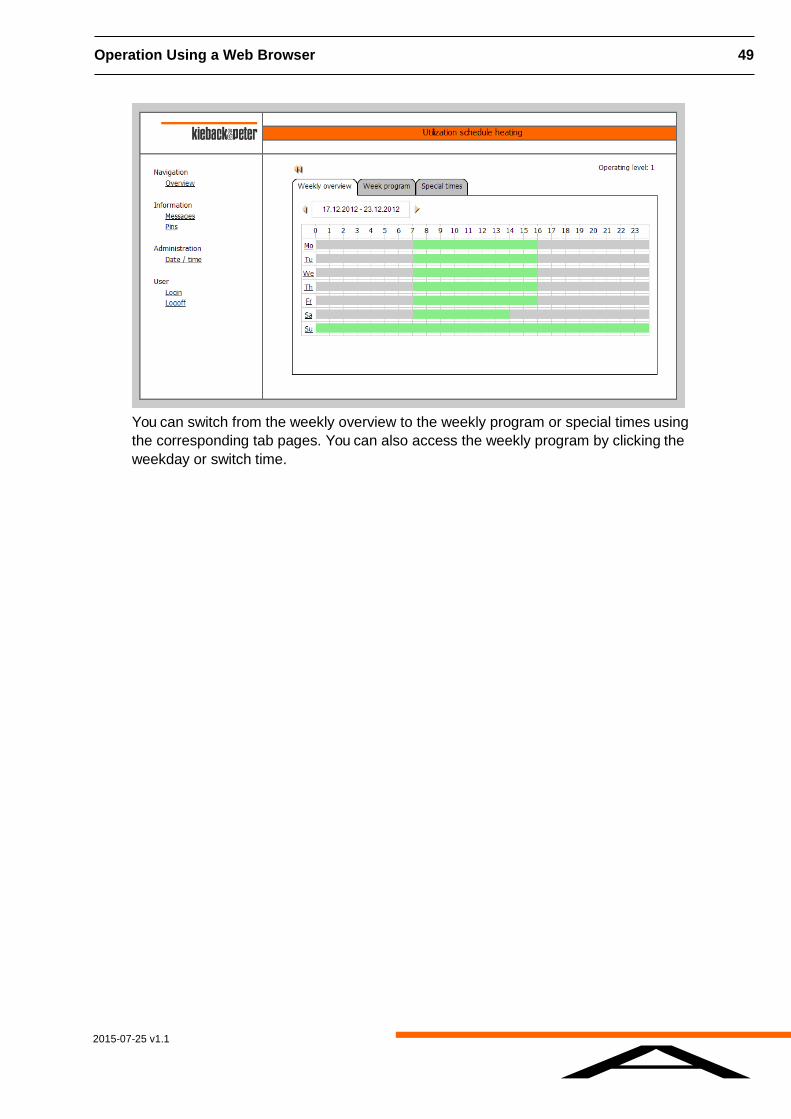
► Click the schedule icon to access the weekly overview.
The switch times for the current week are shown in the weekly overview.
2015-07-25 v1.1
A
Operation Using a Web Browser 49
You can switch from the weekly overview to the weekly program or special times using
the corresponding tab pages. You can also access the weekly program by clicking the
weekday or switch time.
2015-07-25 v1.1
A
50 Operation Using a Web Browser
3.11 Trend display
If a trend has been recorded for a parameter, you can display the trend curve in the Web
browser.
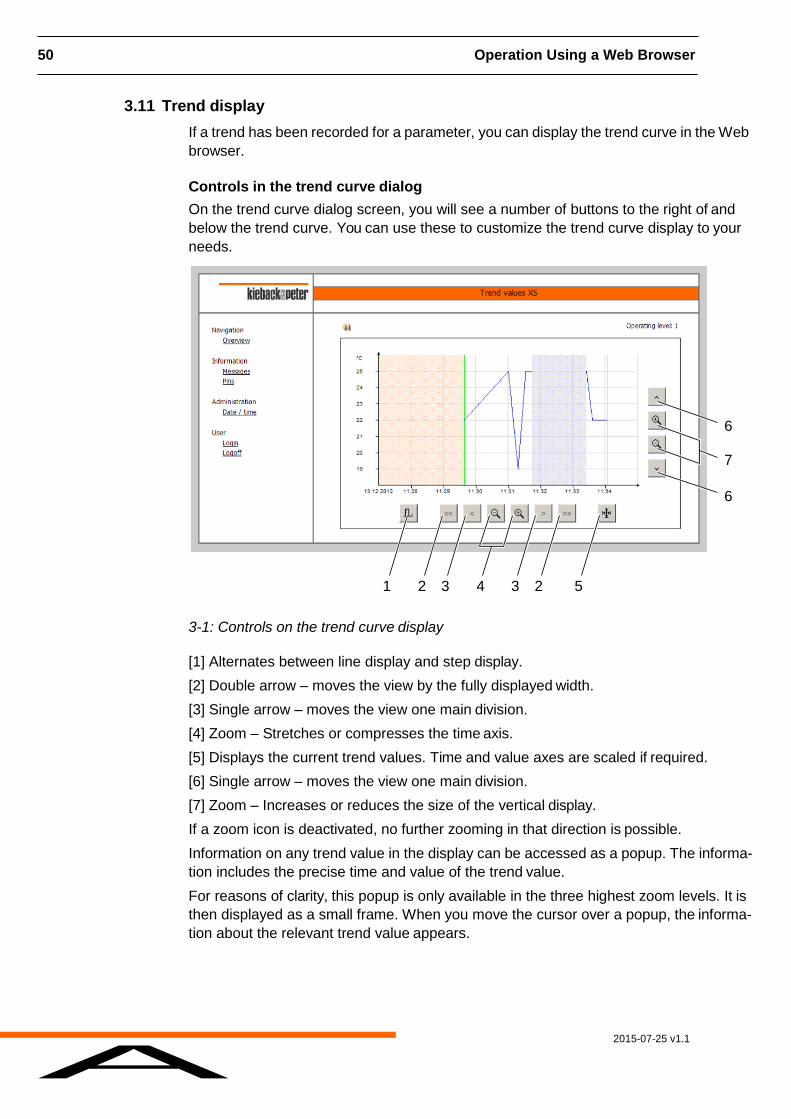
Controls in the trend curve dialog
On the trend curve dialog screen, you will see a number of buttons to the right of and
below the trend curve. You can use these to customize the trend curve display to your
needs.
6
7
6
1 2 3 4 3 2 5
3-1: Controls on the trend curve display
[1] Alternates between line display and step display.
[2] Double arrow – moves the view by the fully displayed width.
[3] Single arrow – moves the view one main division.
[4] Zoom – Stretches or compresses the time axis.
[5] Displays the current trend values. Time and value axes are scaled if required.
[6] Single arrow – moves the view one main division.
[7] Zoom – Increases or reduces the size of the vertical display.
If a zoom icon is deactivated, no further zooming in that direction is possible.
Information on any trend value in the display can be accessed as a popup. The informa-
tion includes the precise time and value of the trend value.
For reasons of clarity, this popup is only available in the three highest zoom levels. It is
then displayed as a small frame. When you move the cursor over a popup, the informa-
tion about the relevant trend value appears.
2015-07-25 v1.1
A
Operation Using a Web Browser 51
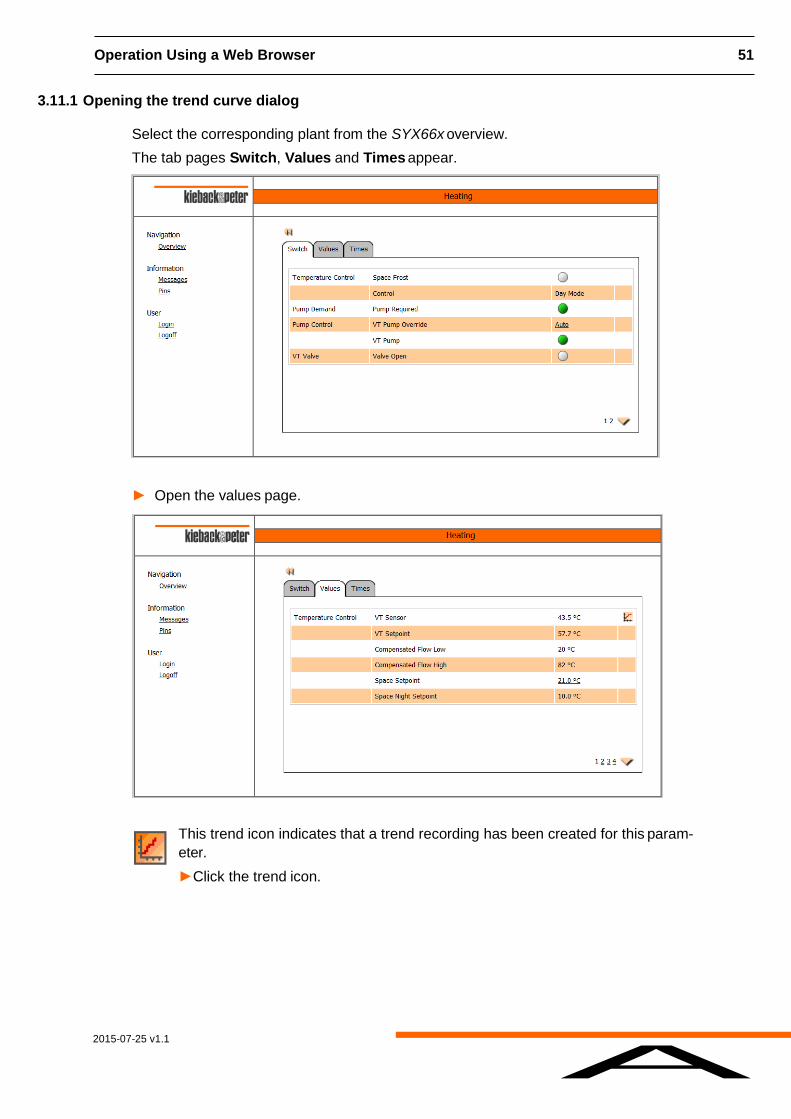
3.11.1 Opening the trend curve dialog
Select the corresponding plant from the SYX66x overview.
The tab pages Switch, Values and Times appear.
► Open the values page.
This trend icon indicates that a trend recording has been created for this param-
eter.
►Click the trend icon.
2015-07-25 v1.1
A
52 Operation Using a Web Browser
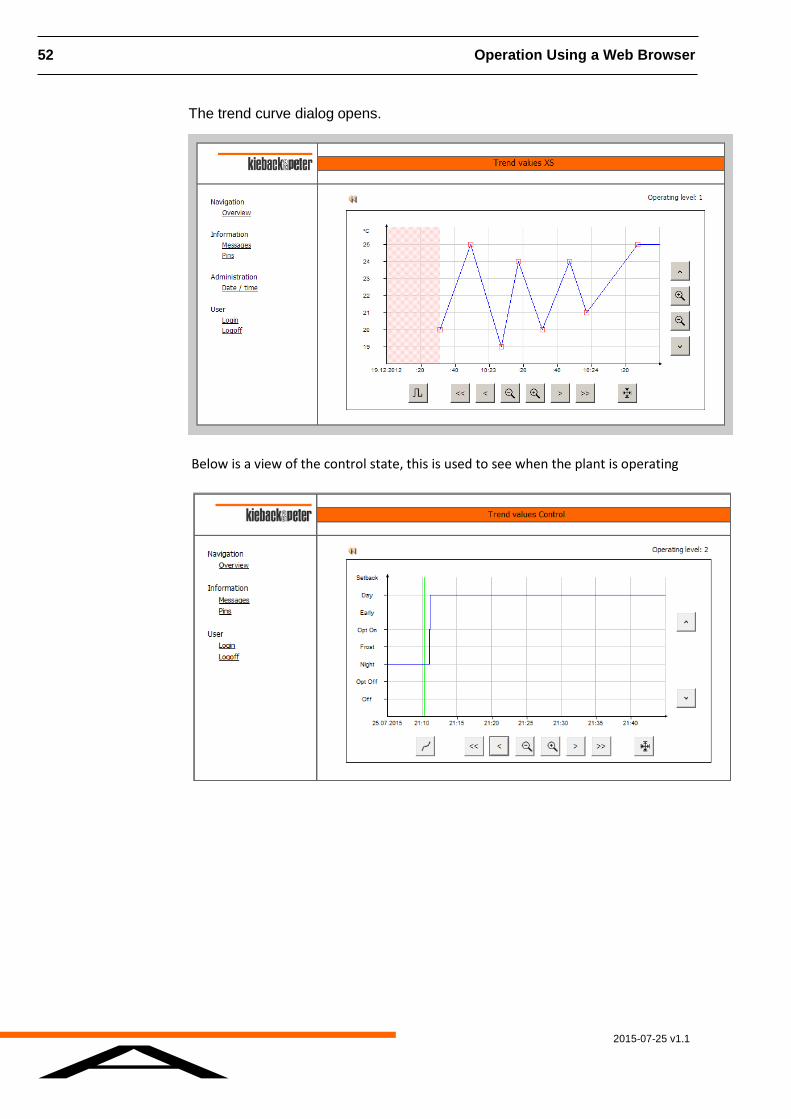
The trend curve dialog opens.
Below is a view of the control state, this is used to see when the plant is operating
2015-07-25 v1.1
A
Operation Using a Web Browser 53
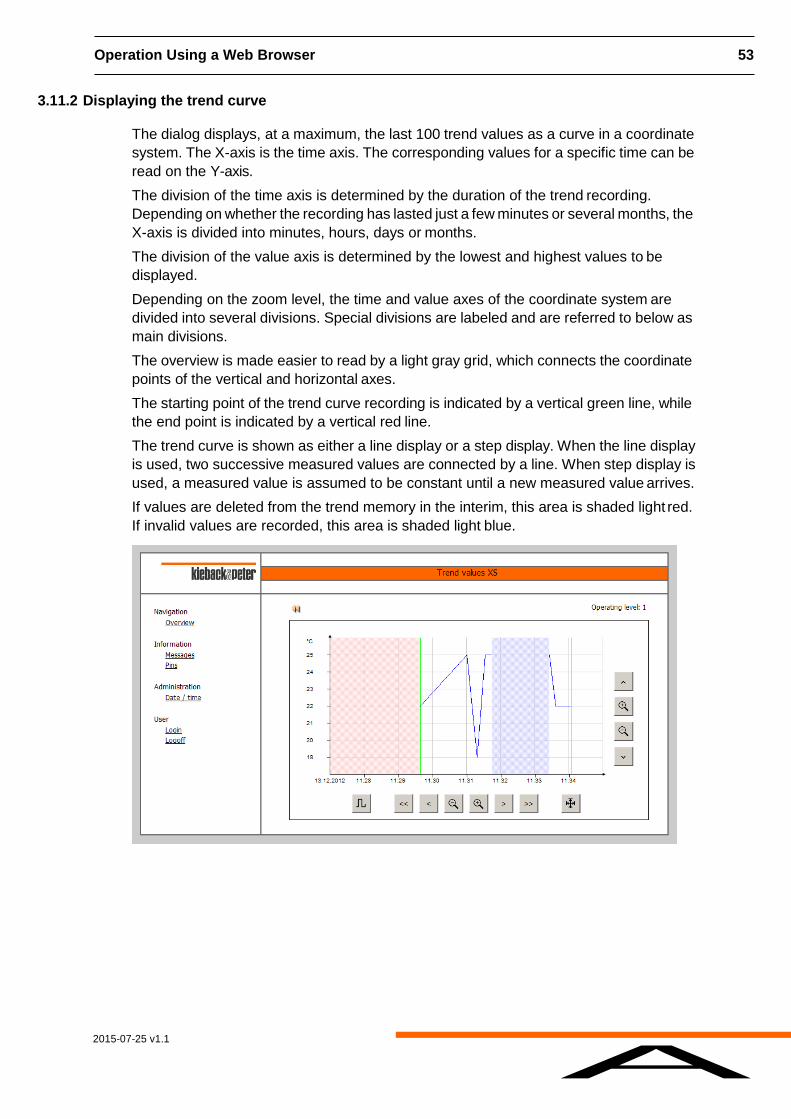
3.11.2 Displaying the trend curve
The dialog displays, at a maximum, the last 100 trend values as a curve in a coordinate
system. The X-axis is the time axis. The corresponding values for a specific time can be
read on the Y-axis.
The division of the time axis is determined by the duration of the trend recording.
Depending on whether the recording has lasted just a few minutes or several months, the
X-axis is divided into minutes, hours, days or months.
The division of the value axis is determined by the lowest and highest values to be
displayed.
Depending on the zoom level, the time and value axes of the coordinate system are
divided into several divisions. Special divisions are labeled and are referred to below as
main divisions.
The overview is made easier to read by a light gray grid, which connects the coordinate
points of the vertical and horizontal axes.
The starting point of the trend curve recording is indicated by a vertical green line, while
the end point is indicated by a vertical red line.
The trend curve is shown as either a line display or a step display. When the line display
is used, two successive measured values are connected by a line. When step display is
used, a measured value is assumed to be constant until a new measured value arrives.
If values are deleted from the trend memory in the interim, this area is shaded light red.
If invalid values are recorded, this area is shaded light blue.
2015-07-25 v1.1
A
54 Operation Using a User Touch Screen
4 Operation Using a User Touch Screen
The SYX66x can also be controlled using a touch panel. A touch panel is a screen that
responds to touch. A touch panel can be installed anywhere. The prerequisites for this
are an Ethernet connection to the SYX66x and a connection to a power supply.
The same touch screen user experience is available by using a Web Browser and
inserting /mo/ after the controller IP address.
The touch panel is available in two sizes:
■ TPC35 touch panel:
Screen size 3.5"
Resolution 320x240 pixels
Maximum of four lines for displaying contents in the main area
■ TPC56 touch panel:
Screen size 5.6"
Resolution 320x240 pixels
Maximum of five lines for displaying contents in the main area
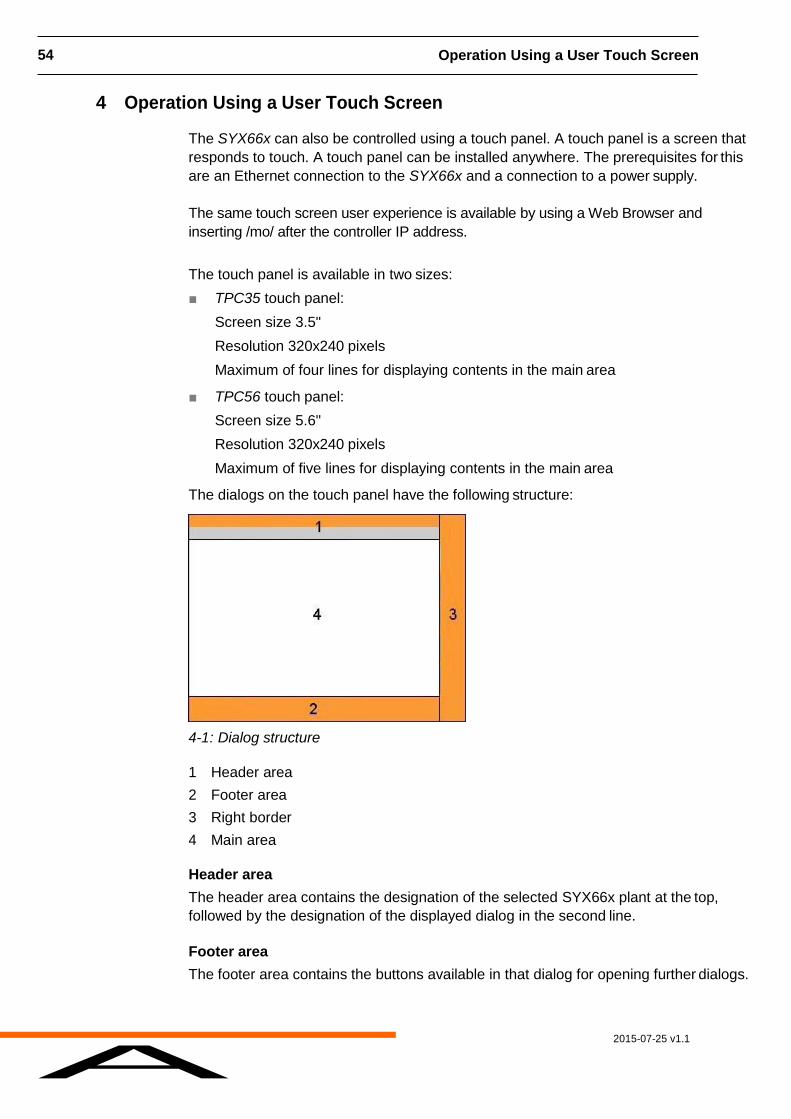
The dialogs on the touch panel have the following structure:
4-1 : Dialog structure
1 Header area
2 Footer area
3 Right border
4 Main area
Header area
The header area contains the designation of the selected SYX66x plant at the top,
followed by the designation of the displayed dialog in the second line.
Footer area
The footer area contains the buttons available in that dialog for opening further dialogs.
2015-07-25 v1.1
A
Operation Using a User Touch Screen 55
Right border
The right border contains numbered buttons. The numbers are assigned to the plants for
which project planning has been carried out for the SYX66x. You can switch quickly to a
different plant by touching one of these buttons.
These buttons are not present in editors, i.e. dialogs for editing values and times. If more
plants are being planned for the SYX66x than can be displayed on the right border, up/
down arrows appear above and below the buttons. You can use these up/down arrows
to scroll up or down through the list of plants.
Main area
The main area contains the current information of the relevant dialog.
If there is more information to display in the main area than will fit in the available lines,
up/down arrows are displayed in the bottom line, with which you can scroll through the
list.
4.1 General information about operation
You use a touch panel by directly touching buttons displayed on the screen.
After ten minutes of inactivity, the display exits the current dialog and returns to the start
screen.
If you are in an editor and have not input anything for 30 seconds, the display automati-
cally switches from the editor to the current dialog. This means that incoming messages
can be seen in the form of message icons, as these are not displayed in an editor.
You will see the following buttons in various dialogs:
■ [SET]
Use this to confirm an entry.
■ [CL]
Use this to delete an entry in an entry field.
■ [ESC]
Use this to move back to the previous dialog.
■ Editor icon beside information:
If this is active, you can open an editor that allows you to make entries. ■Clock icon beside information:
If this is active, you can switch directly into an editor that allows you to
make time settings.
■ Trash can icon beside information:
Use this to delete the entry in the corresponding line, without first receiving
another prompt.
■ Up/down arrows:

2015-07-25 v1.1
A
56 Operation Using a User Touch Screen
Use these to scroll through a list.
■ Message icon:
This icon appears at bottom right in the footer line, as soon as a message
arrives. It is only used in dialogs, not in editors.
2015-07-25 v1.1
A
Operation Using a User Touch Screen 57
4.2 Login
If you have performed no operation on the touch panel for a longer period, the welcome
screen appears automatically.
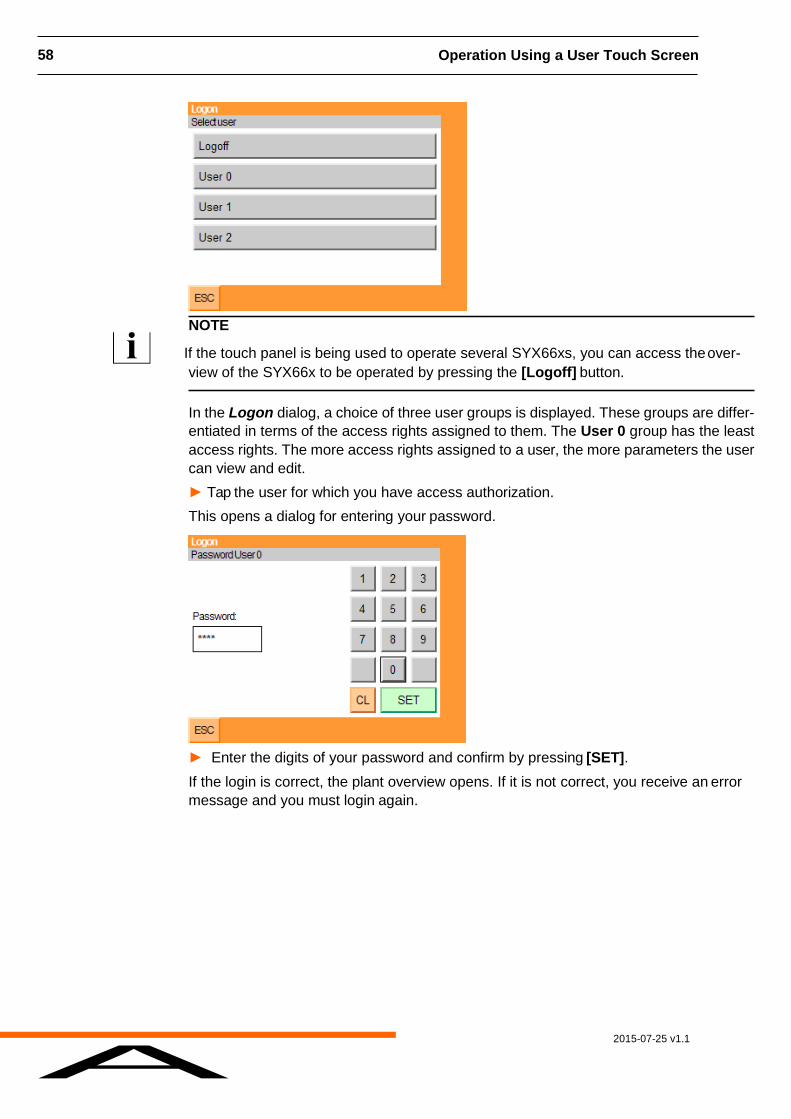
► Touch any point on the screen.
This opens either the plant overview or, if several SYX66xs are operated with the touch
panel, an overview of the SYX66xs that can be operated. You must select one SYX66x
from the list of SYX66xs in order to see its plant overview.
You are automatically logged in as User 0.
► Touch the [Login] button.
The logon dialog opens.
Here you can log out or you can log in as another user.
2015-07-25 v1.1
A
58 Operation Using a User Touch Screen
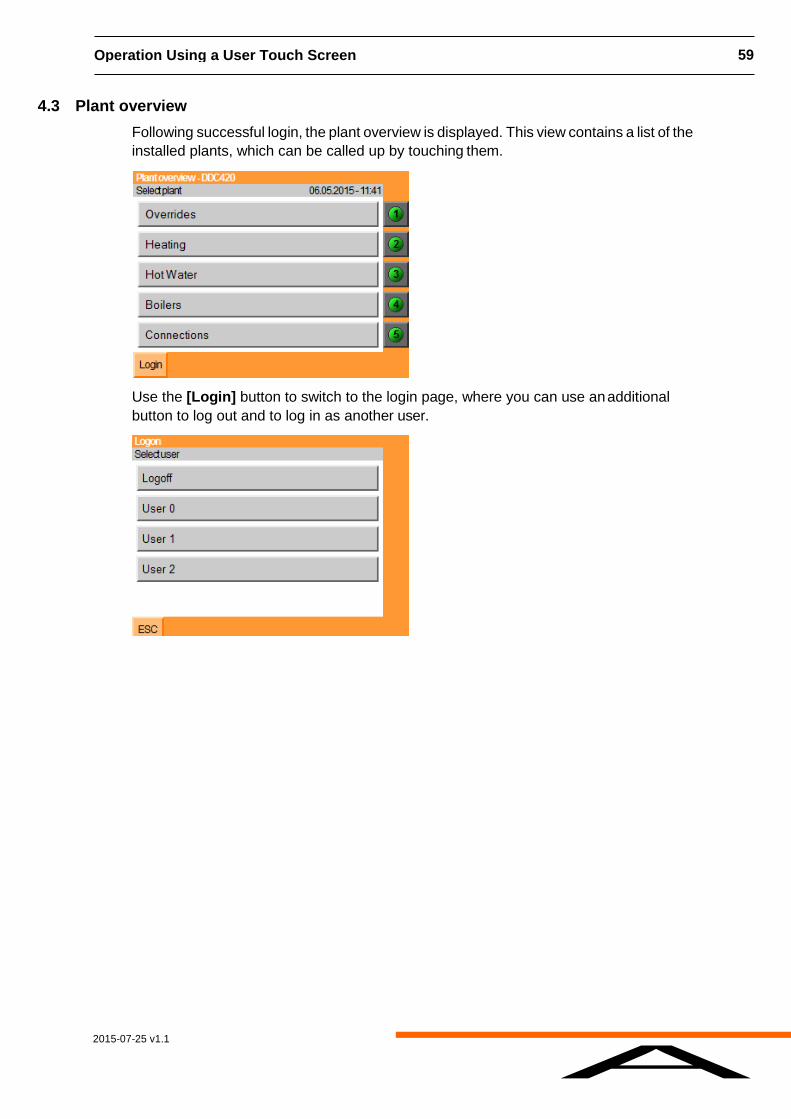
NOTE
If the touch panel is being used to operate several SYX66xs, you can access the over-
view of the SYX66x to be operated by pressing the [Logoff] button.
In the Logon dialog, a choice of three user groups is displayed. These groups are differ-
entiated in terms of the access rights assigned to them. The User 0 group has the least
access rights. The more access rights assigned to a user, the more parameters the user
can view and edit.
► Tap the user for which you have access authorization.
This opens a dialog for entering your password.
► Enter the digits of your password and confirm by pressing [SET].
If the login is correct, the plant overview opens. If it is not correct, you receive an error
message and you must login again.
2015-07-25 v1.1
A
Operation Using a User Touch Screen 59
4.3 Plant overview
Following successful login, the plant overview is displayed. This view contains a list of the
installed plants, which can be called up by touching them.
Use the [Login] button to switch to the login page, where you can use an additional
button to log out and to log in as another user.
2015-07-25 v1.1
A
60 Operation Using a User Touch Screen
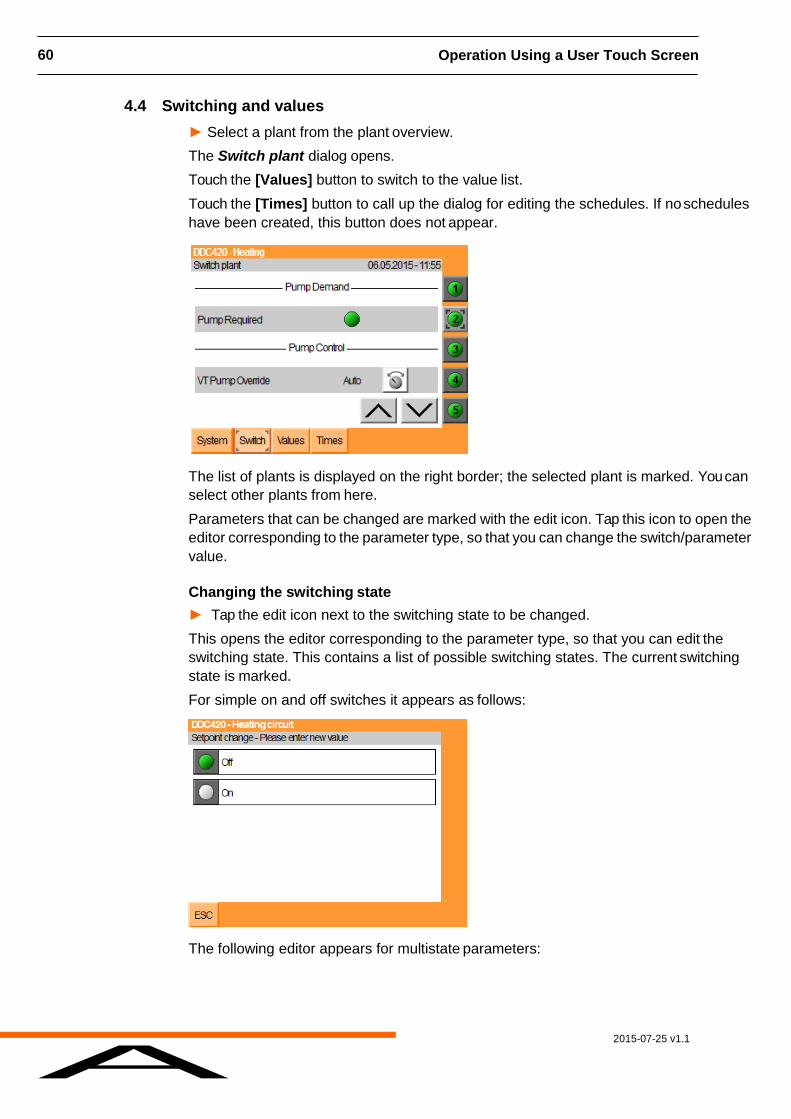
4.4 Switching and values
► Select a plant from the plant overview.
The Switch plant dialog opens.
Touch the [Values] button to switch to the value list.
Touch the [Times] button to call up the dialog for editing the schedules. If no schedules
have been created, this button does not appear.
The list of plants is displayed on the right border; the selected plant is marked. You can
select other plants from here.
Parameters that can be changed are marked with the edit icon. Tap this icon to open the
editor corresponding to the parameter type, so that you can change the switch/parameter
value.
Changing the switching state
► Tap the edit icon next to the switching state to be changed.
This opens the editor corresponding to the parameter type, so that you can edit the
switching state. This contains a list of possible switching states. The current switching
state is marked.
For simple on and off switches it appears as follows:
The following editor appears for multistate parameters:
2015-07-25 v1.1
A
Operation Using a User Touch Screen 61
I
f
a
m
u
l
t
i
s
t
a
t
e
p
a
r
a
m
e
t
e
r
h
a
s
m
o
r
e
t
h
a
n
f
i
v
e
states, use the up/down arrows to go to the other states.
► Tap an alternative value.
The new value is applied and the display reverts back to the Switch dialog.
Making a change to an Auto condition will make the Hand indication LED illuminate on the controller facia. All items must be in Auto for the LED to be off.
If the LED is On and plant operation is not as expected please return all items to Auto before requesting any technical assistance.
2015-07-25 v1.1
A
62 Operation Using a User Touch Screen
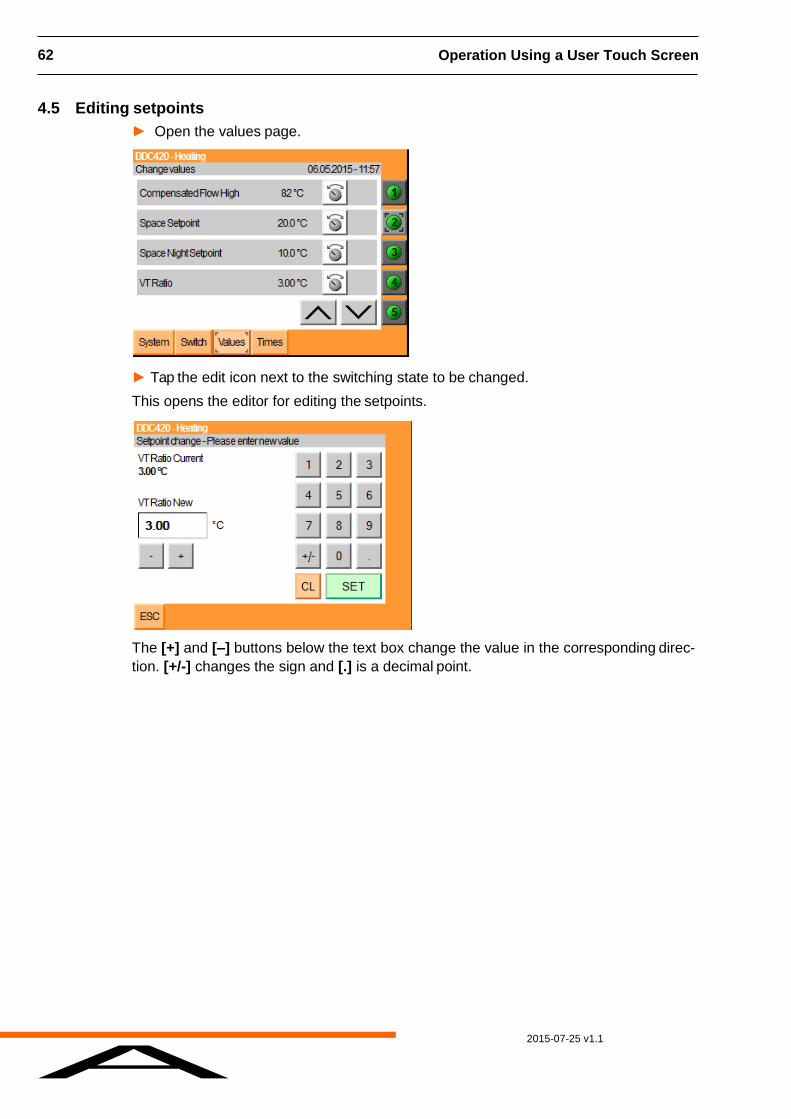
4.5 Editing setpoints
► Open the values page.
► Tap the edit icon next to the switching state to be changed.
This opens the editor for editing the setpoints.
The [+] and [–] buttons below the text box change the value in the corresponding direc-
tion. [+/-] changes the sign and [.] is a decimal point.
2015-07-25 v1.1
A
Operation Using a User Touch Screen 63
If not all buttons are required for a dialog, the labeling is hidden and the button is inactive.
► Change the setpoint and confirm by pressing [SET].
The new value is applied and the display reverts back to the Values dialog.
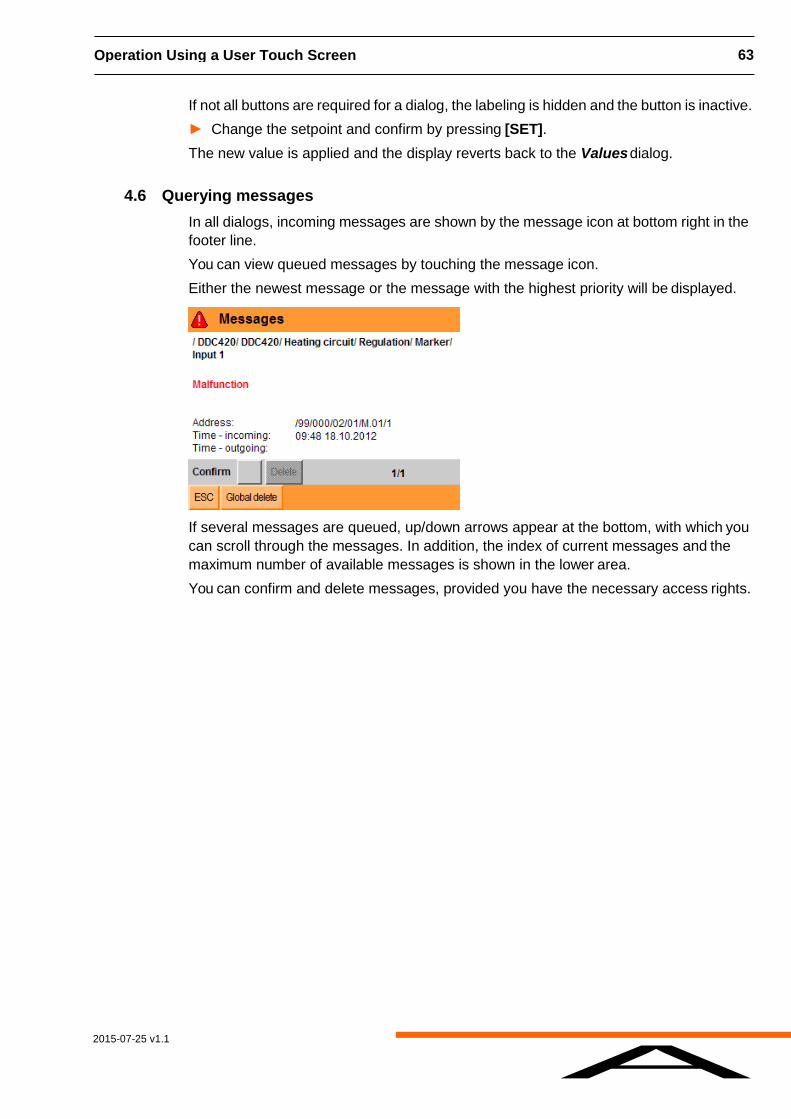
4.6 Querying messages
In all dialogs, incoming messages are shown by the message icon at bottom right in the
footer line.
You can view queued messages by touching the message icon.
Either the newest message or the message with the highest priority will be displayed.
If several messages are queued, up/down arrows appear at the bottom, with which you
can scroll through the messages. In addition, the index of current messages and the
maximum number of available messages is shown in the lower area.
You can confirm and delete messages, provided you have the necessary access rights.

2015-07-25 v1.1
A
64 Operation Using a User Touch Screen
4.7 Times
If schedules are configured for a selected plant, you can display and edit these schedules,
switch times and switching states.
Weekly overview
► Select the plant either in the plant overview or using the numbered buttons on the right
border of any dialog.
The Switch plant dialog opens.
If schedules are configured for the selected plant, the [Times] button is available.
► Touch the [Times] button.
This opens an overview of all the weekly programs of the selected plant.
► Select the weekly program.
The overview for the current week is displayed.
You can switch to a week later or earlier using the arrows at the top.
If special times are in effect for a day, the buttons for this day (left edge) are shaded
yellow.
2015-07-25 v1.1
A
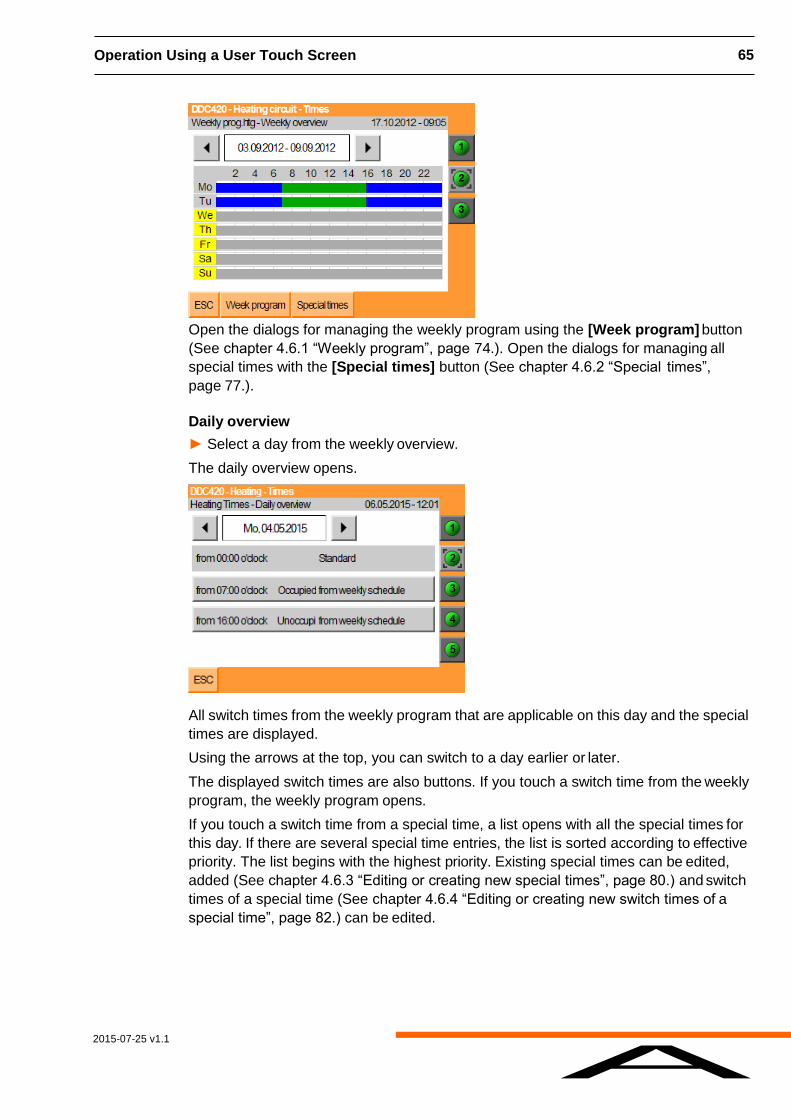
Operation Using a User Touch Screen 65
Open the dialogs for managing the weekly program using the [Week program] button
(See chapter 4.6.1 “Weekly program”, page 74.). Open the dialogs for managing all
special times with the [Special times] button (See chapter 4.6.2 “Special times”,
page 77.).
Daily overview
► Select a day from the weekly overview.
The daily overview opens.
All switch times from the weekly program that are applicable on this day and the special
times are displayed.
Using the arrows at the top, you can switch to a day earlier or later.
The displayed switch times are also buttons. If you touch a switch time from the weekly
program, the weekly program opens.
If you touch a switch time from a special time, a list opens with all the special times for
this day. If there are several special time entries, the list is sorted according to effective
priority. The list begins with the highest priority. Existing special times can be edited,
added (See chapter 4.6.3 “Editing or creating new special times”, page 80.) and switch
times of a special time (See chapter 4.6.4 “Editing or creating new switch times of a
special time”, page 82.) can be edited.
2015-07-25 v1.1
A
66 Operation Using a User Touch Screen
4.7.1 Weekly program
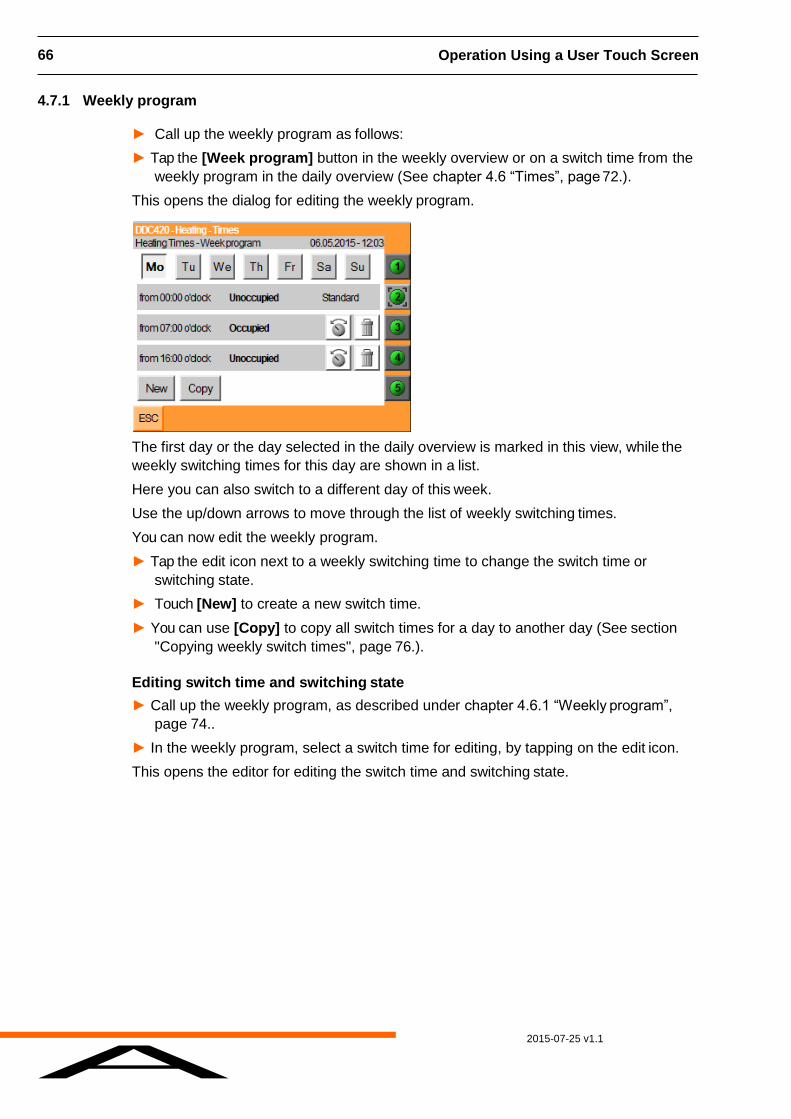
► Call up the weekly program as follows:
► Tap the [Week program] button in the weekly overview or on a switch time from the
weekly program in the daily overview (See chapter 4.6 “Times”, page 72.).
This opens the dialog for editing the weekly program.
The first day or the day selected in the daily overview is marked in this view, while the
weekly switching times for this day are shown in a list.
Here you can also switch to a different day of this week.
Use the up/down arrows to move through the list of weekly switching times.
You can now edit the weekly program.
► Tap the edit icon next to a weekly switching time to change the switch time or
switching state.
► Touch [New] to create a new switch time.
► You can use [Copy] to copy all switch times for a day to another day (See section
"Copying weekly switch times", page 76.).
Editing switch time and switching state
► Call up the weekly program, as described under chapter 4.6.1 “Weekly program”,
page 74..
► In the weekly program, select a switch time for editing, by tapping on the edit icon.
This opens the editor for editing the switch time and switching state.
2015-07-25 v1.1
A
Operation Using a User Touch Screen 67
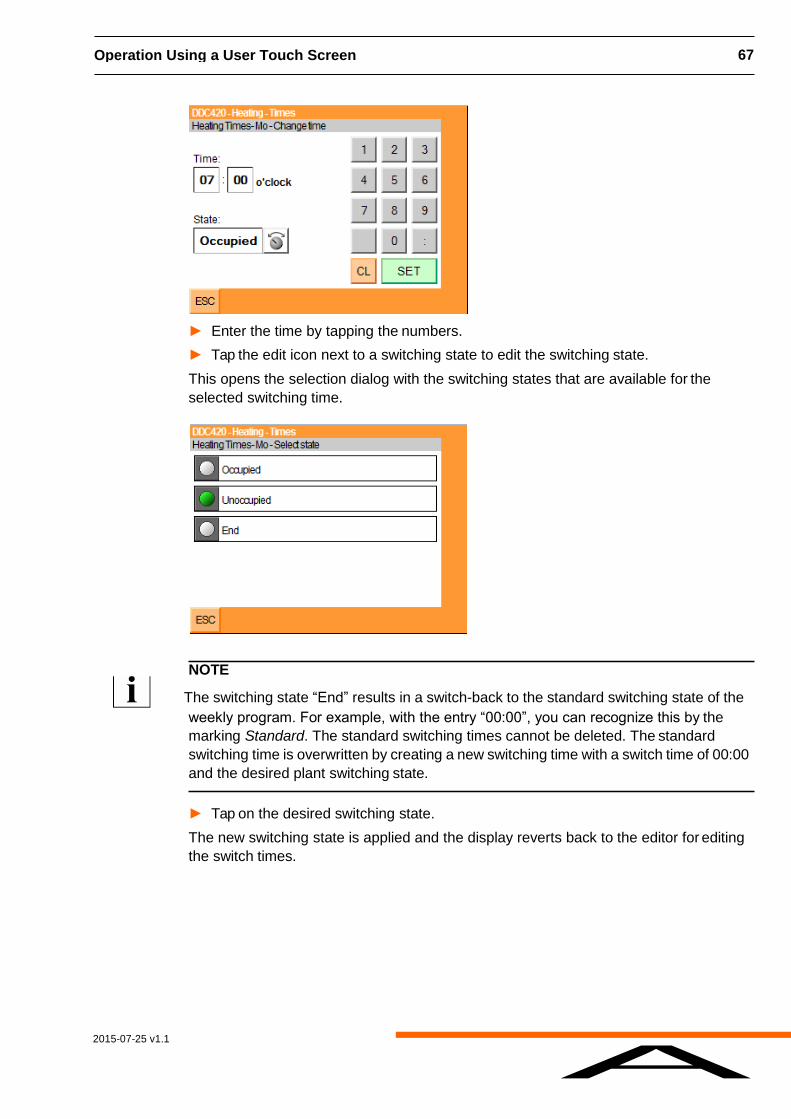
► Enter the time by tapping the numbers.
► Tap the edit icon next to a switching state to edit the switching state.
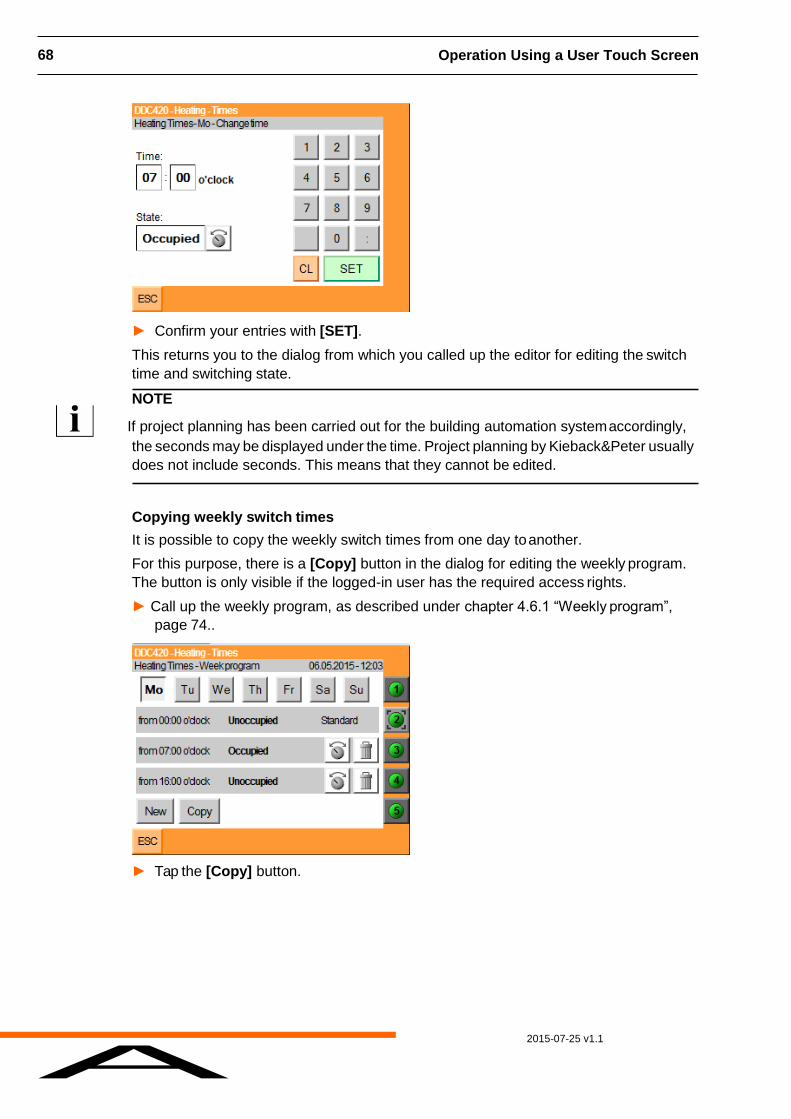
This opens the selection dialog with the switching states that are available for the
selected switching time.
NOTE
The switching state “End” results in a switch-back to the standard switching state of the
weekly program. For example, with the entry “00:00”, you can recognize this by the
marking Standard. The standard switching times cannot be deleted. The standard
switching time is overwritten by creating a new switching time with a switch time of 00:00
and the desired plant switching state.
► Tap on the desired switching state.
The new switching state is applied and the display reverts back to the editor for editing
the switch times.
2015-07-25 v1.1
A
68 Operation Using a User Touch Screen
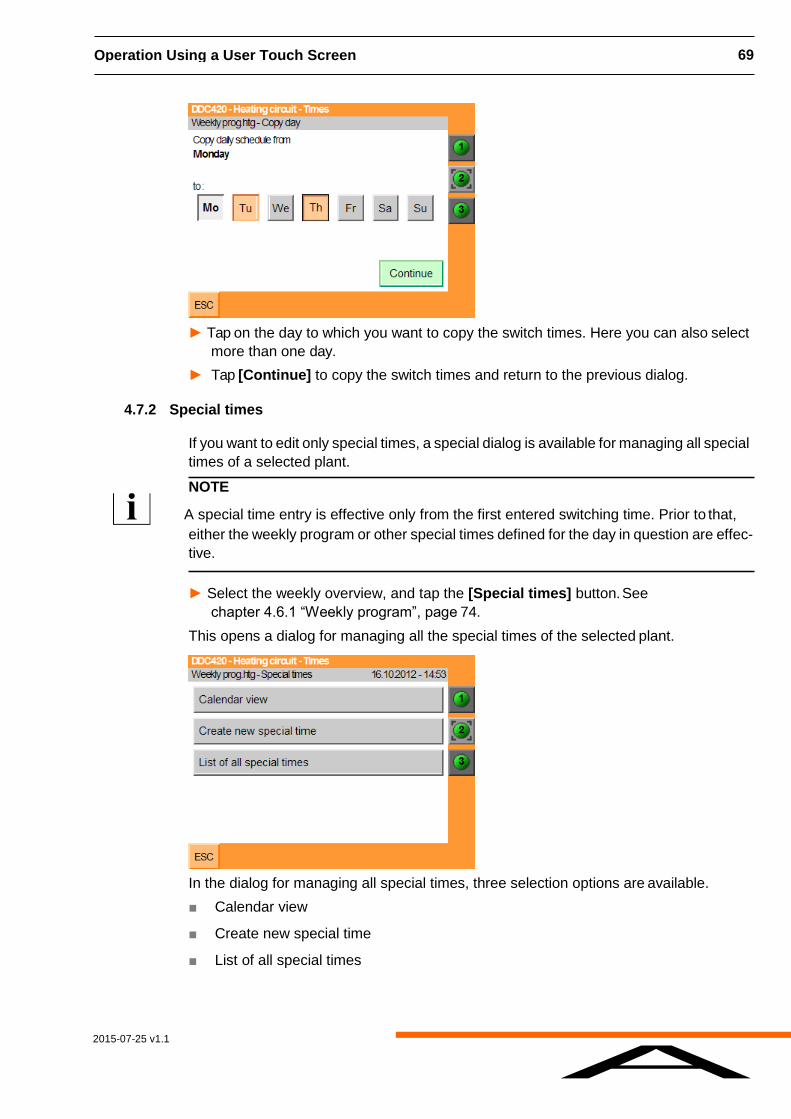
► Confirm your entries with [SET].
This returns you to the dialog from which you called up the editor for editing the switch
time and switching state.
NOTE
If project planning has been carried out for the building automation system accordingly,
the seconds may be displayed under the time. Project planning by Kieback&Peter usually
does not include seconds. This means that they cannot be edited.
Copying weekly switch times
It is possible to copy the weekly switch times from one day to another.
For this purpose, there is a [Copy] button in the dialog for editing the weekly program.
The button is only visible if the logged-in user has the required access rights.
► Call up the weekly program, as described under chapter 4.6.1 “Weekly program”,
page 74..
► Tap the [Copy] button.
2015-07-25 v1.1
A
Operation Using a User Touch Screen 69
► Tap on the day to which you want to copy the switch times. Here you can also select
more than one day.
► Tap [Continue] to copy the switch times and return to the previous dialog.
4.7.2 Special times
If you want to edit only special times, a special dialog is available for managing all special
times of a selected plant.
NOTE
A special time entry is effective only from the first entered switching time. Prior to that,
either the weekly program or other special times defined for the day in question are effec-
tive.
► Select the weekly overview, and tap the [Special times] button. See
chapter 4.6.1 “Weekly program”, page 74.
This opens a dialog for managing all the special times of the selected plant.
In the dialog for managing all special times, three selection options are available.
■ Calendar view
■ Create new special time
■ List of all special times
2015-07-25 v1.1
A
70 Operation Using a User Touch Screen
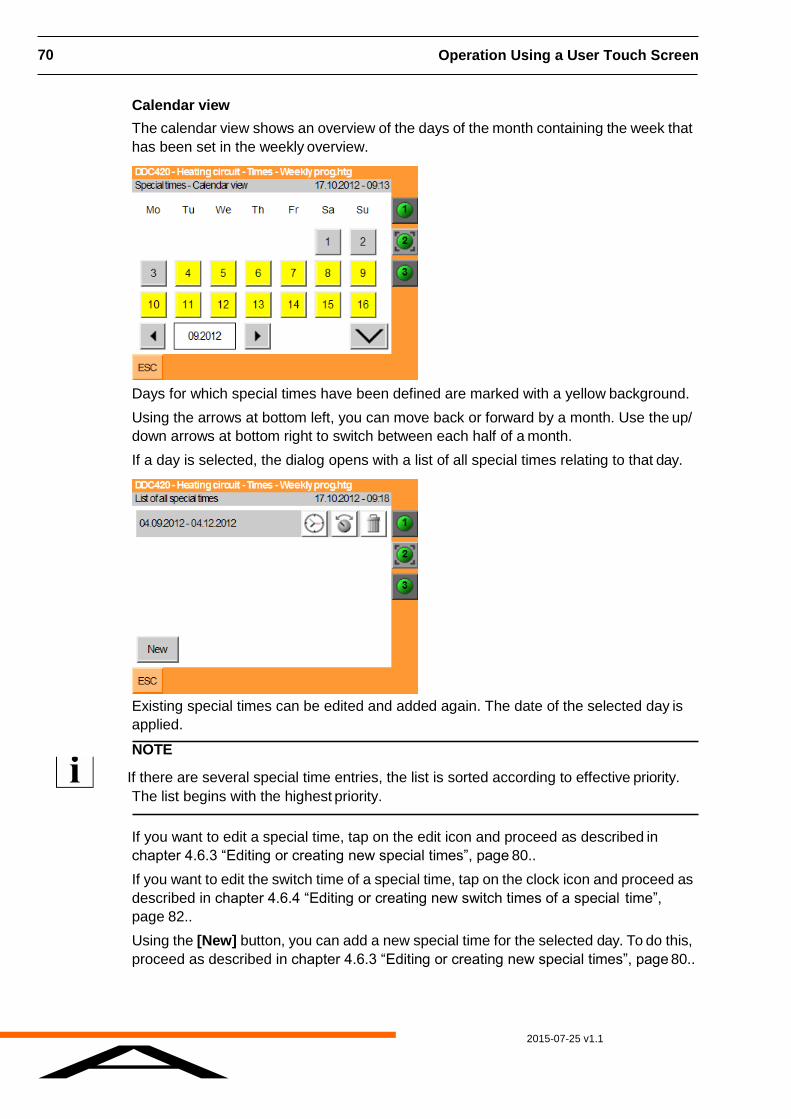
Calendar view
The calendar view shows an overview of the days of the month containing the week that
has been set in the weekly overview.
Days for which special times have been defined are marked with a yellow background.
Using the arrows at bottom left, you can move back or forward by a month. Use the up/
down arrows at bottom right to switch between each half of a month.
If a day is selected, the dialog opens with a list of all special times relating to that day.
Existing special times can be edited and added again. The date of the selected day is
applied.
NOTE
If there are several special time entries, the list is sorted according to effective priority.
The list begins with the highest priority.
If you want to edit a special time, tap on the edit icon and proceed as described in
chapter 4.6.3 “Editing or creating new special times”, page 80..
If you want to edit the switch time of a special time, tap on the clock icon and proceed as
described in chapter 4.6.4 “Editing or creating new switch times of a special time”,
page 82..
Using the [New] button, you can add a new special time for the selected day. To do this,
proceed as described in chapter 4.6.3 “Editing or creating new special times”, page 80..
2015-07-25 v1.1
A
Operation Using a User Touch Screen 71
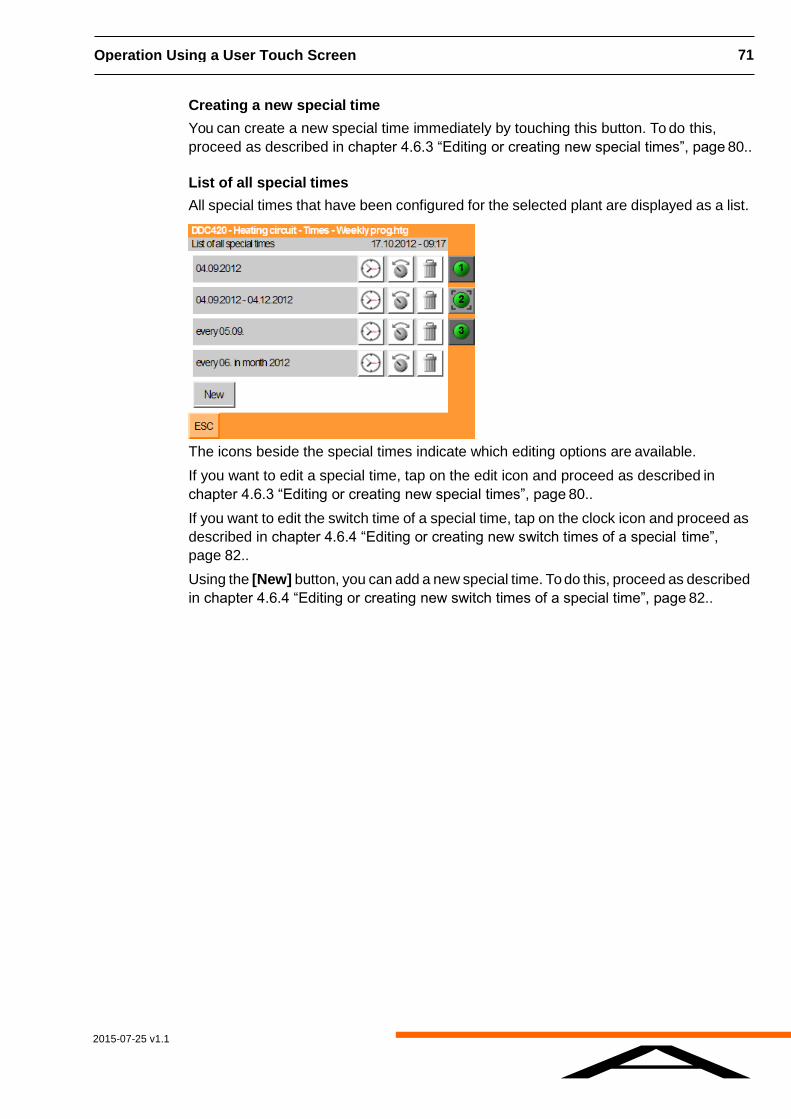
Creating a new special time
You can create a new special time immediately by touching this button. To do this,
proceed as described in chapter 4.6.3 “Editing or creating new special times”, page 80..
List of all special times
All special times that have been configured for the selected plant are displayed as a list.
The icons beside the special times indicate which editing options are available.
If you want to edit a special time, tap on the edit icon and proceed as described in
chapter 4.6.3 “Editing or creating new special times”, page 80..
If you want to edit the switch time of a special time, tap on the clock icon and proceed as
described in chapter 4.6.4 “Editing or creating new switch times of a special time”,
page 82..
Using the [New] button, you can add a new special time. To do this, proceed as described
in chapter 4.6.4 “Editing or creating new switch times of a special time”, page 82..
2015-07-25 v1.1
A
72 Operation Using a User Touch Screen
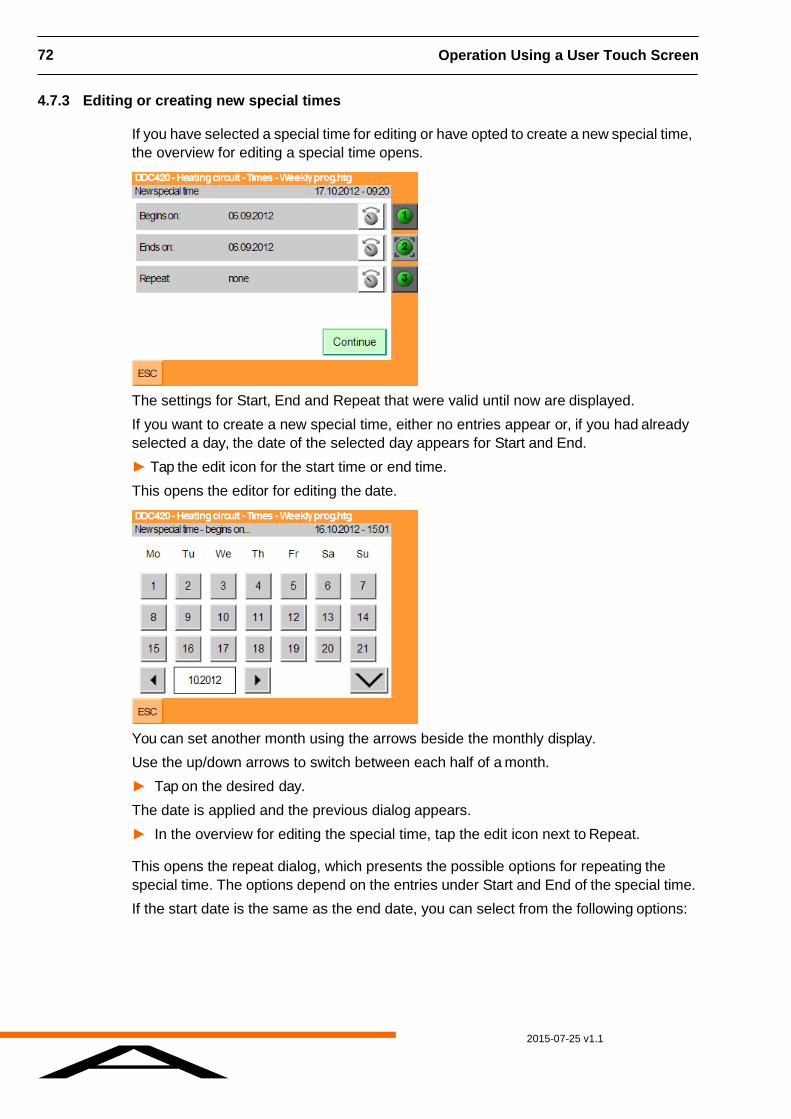
4.7.3 Editing or creating new special times
If you have selected a special time for editing or have opted to create a new special time,
the overview for editing a special time opens.
The settings for Start, End and Repeat that were valid until now are displayed.
If you want to create a new special time, either no entries appear or, if you had already
selected a day, the date of the selected day appears for Start and End.
► Tap the edit icon for the start time or end time.
This opens the editor for editing the date.
You can set another month using the arrows beside the monthly display.
Use the up/down arrows to switch between each half of a month.
► Tap on the desired day.
The date is applied and the previous dialog appears.
► In the overview for editing the special time, tap the edit icon next to Repeat.
This opens the repeat dialog, which presents the possible options for repeating the
special time. The options depend on the entries under Start and End of the special time.
If the start date is the same as the end date, you can select from the following options:
2015-07-25 v1.1
A
Operation Using a User Touch Screen 73
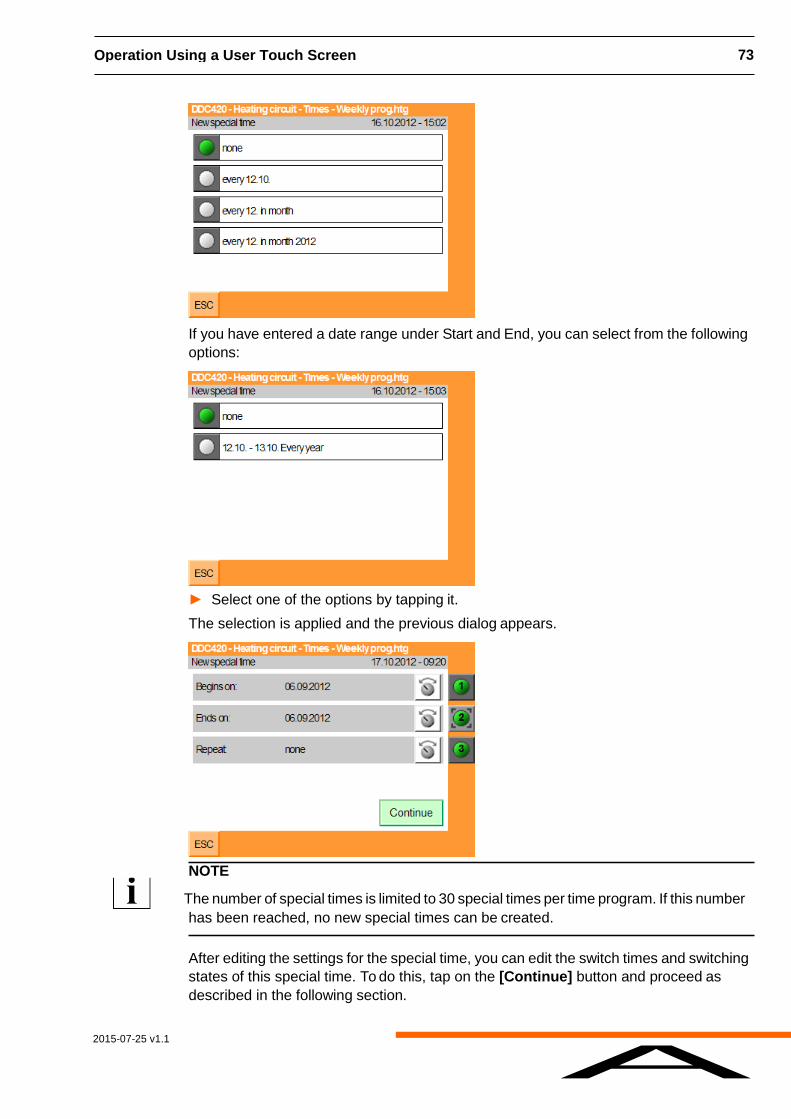
If you have entered a date range under Start and End, you can select from the following
options:
► Select one of the options by tapping it.
The selection is applied and the previous dialog appears.
NOTE
The number of special times is limited to 30 special times per time program. If this number
has been reached, no new special times can be created.
After editing the settings for the special time, you can edit the switch times and switching
states of this special time. To do this, tap on the [Continue] button and proceed as
described in the following section.
2015-07-25 v1.1
A
74 Operation Using a User Touch Screen
4.7.4 Editing or creating new switch times of a special time
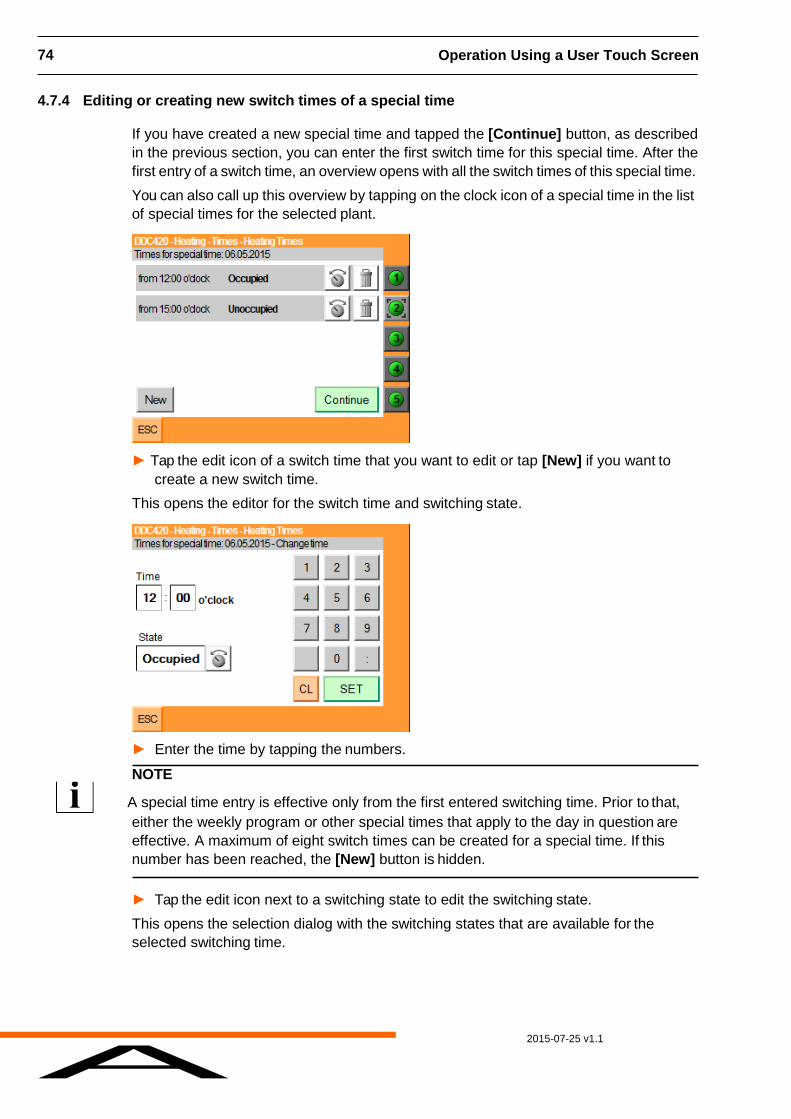
If you have created a new special time and tapped the [Continue] button, as described
in the previous section, you can enter the first switch time for this special time. After the
first entry of a switch time, an overview opens with all the switch times of this special time.
You can also call up this overview by tapping on the clock icon of a special time in the list
of special times for the selected plant.
► Tap the edit icon of a switch time that you want to edit or tap [New] if you want to
create a new switch time.
This opens the editor for the switch time and switching state.
► Enter the time by tapping the numbers.
NOTE
A special time entry is effective only from the first entered switching time. Prior to that,
either the weekly program or other special times that apply to the day in question are
effective. A maximum of eight switch times can be created for a special time. If this
number has been reached, the [New] button is hidden.
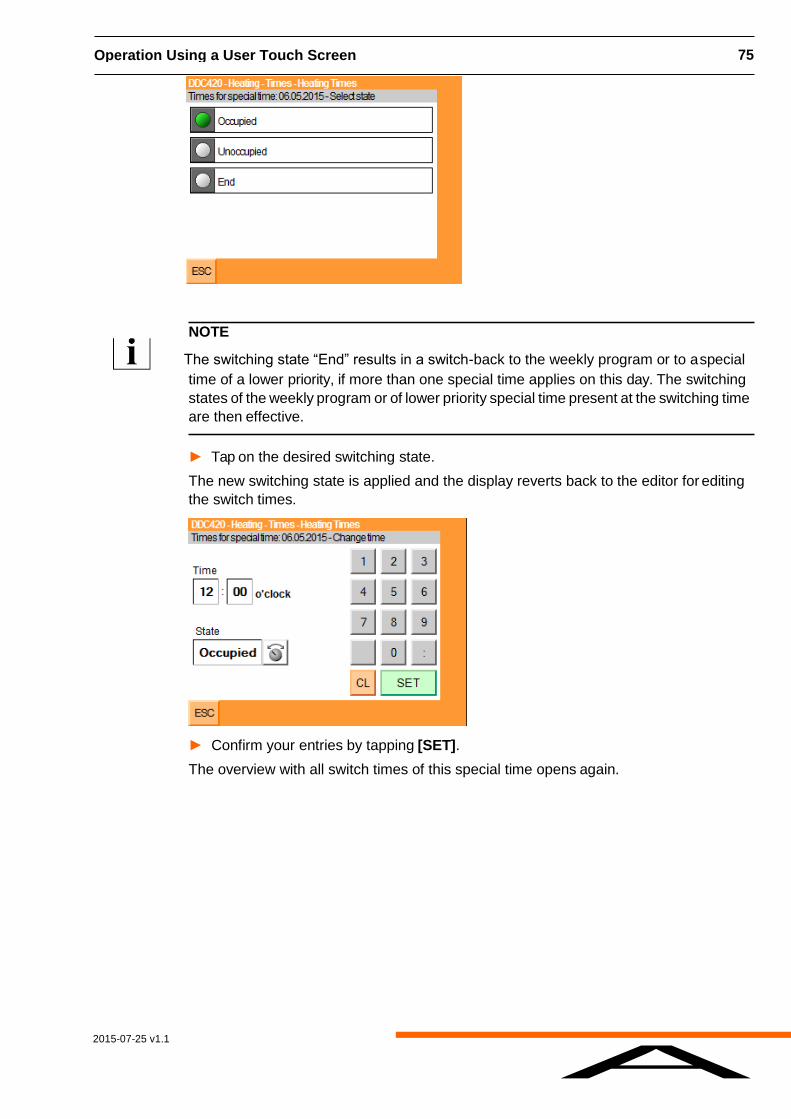
► Tap the edit icon next to a switching state to edit the switching state.
This opens the selection dialog with the switching states that are available for the
selected switching time.
2015-07-25 v1.1
A
Operation Using a User Touch Screen 75
NOTE
The switching state “End” results in a switch-back to the weekly program or to a special
time of a lower priority, if more than one special time applies on this day. The switching
states of the weekly program or of lower priority special time present at the switching time
are then effective.
► Tap on the desired switching state.
The new switching state is applied and the display reverts back to the editor for editing
the switch times.
► Confirm your entries by tapping [SET].
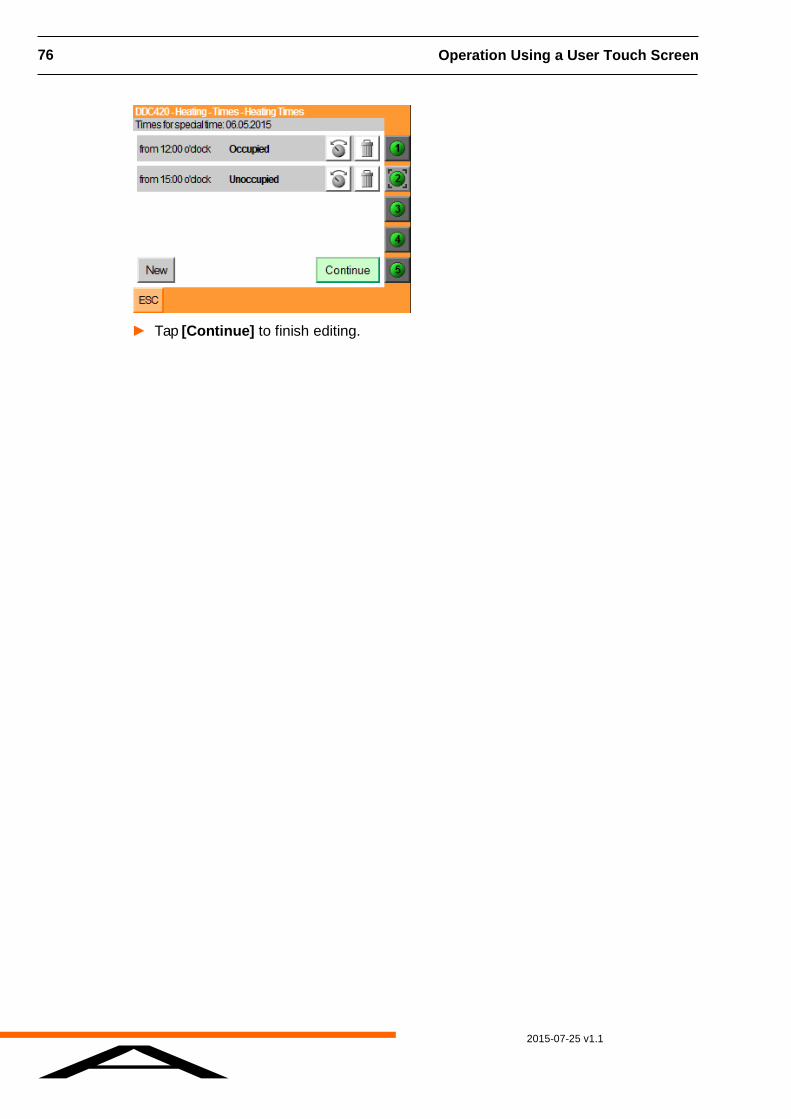
The overview with all switch times of this special time opens again.
2015-07-25 v1.1
A
76 Operation Using a User Touch Screen
► Tap [Continue] to finish editing.
2015-07-25 v1.1
A
Operation Using a User Touch Screen 77
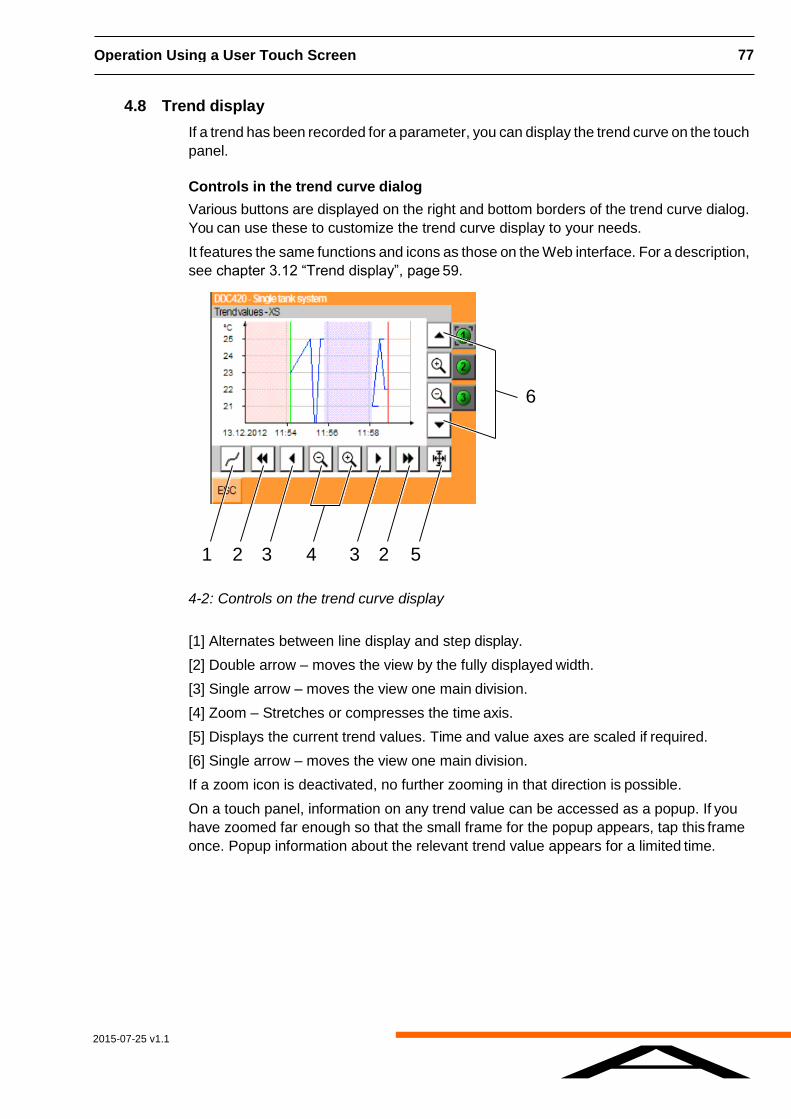
4.8 Trend display
If a trend has been recorded for a parameter, you can display the trend curve on the touch
panel.
Controls in the trend curve dialog
Various buttons are displayed on the right and bottom borders of the trend curve dialog.
You can use these to customize the trend curve display to your needs.
It features the same functions and icons as those on the Web interface. For a description,
see chapter 3.12 “Trend display”, page 59.
6
1 2 3 4 3 2 5
4-2 : Controls on the trend curve display
[1] Alternates between line display and step display.
[2] Double arrow – moves the view by the fully displayed width.
[3] Single arrow – moves the view one main division.
[4] Zoom – Stretches or compresses the time axis.
[5] Displays the current trend values. Time and value axes are scaled if required.
[6] Single arrow – moves the view one main division.
If a zoom icon is deactivated, no further zooming in that direction is possible.
On a touch panel, information on any trend value can be accessed as a popup. If you
have zoomed far enough so that the small frame for the popup appears, tap this frame
once. Popup information about the relevant trend value appears for a limited time.
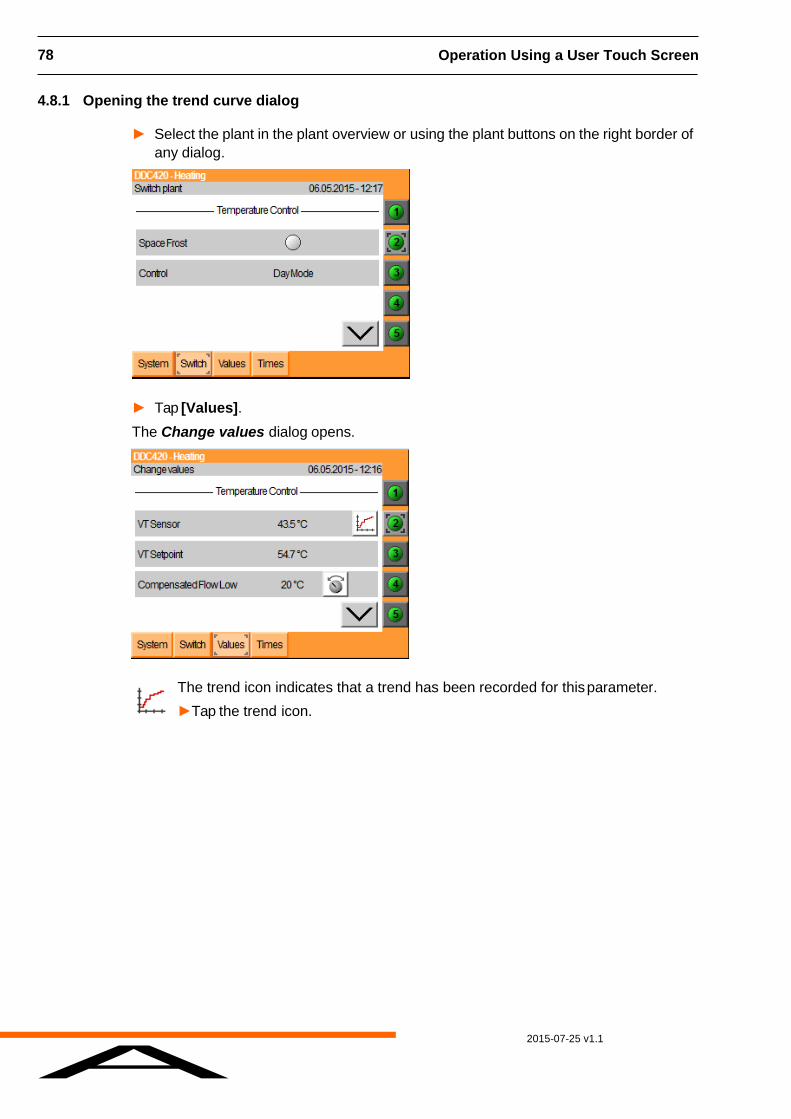
2015-07-25 v1.1
A
78 Operation Using a User Touch Screen
4.8.1 Opening the trend curve dialog
► Select the plant in the plant overview or using the plant buttons on the right border of
any dialog.
The Switch plant dialog opens.
► Tap [Values].
The Change values dialog opens.
The trend icon indicates that a trend has been recorded for this parameter.
►Tap the trend icon.
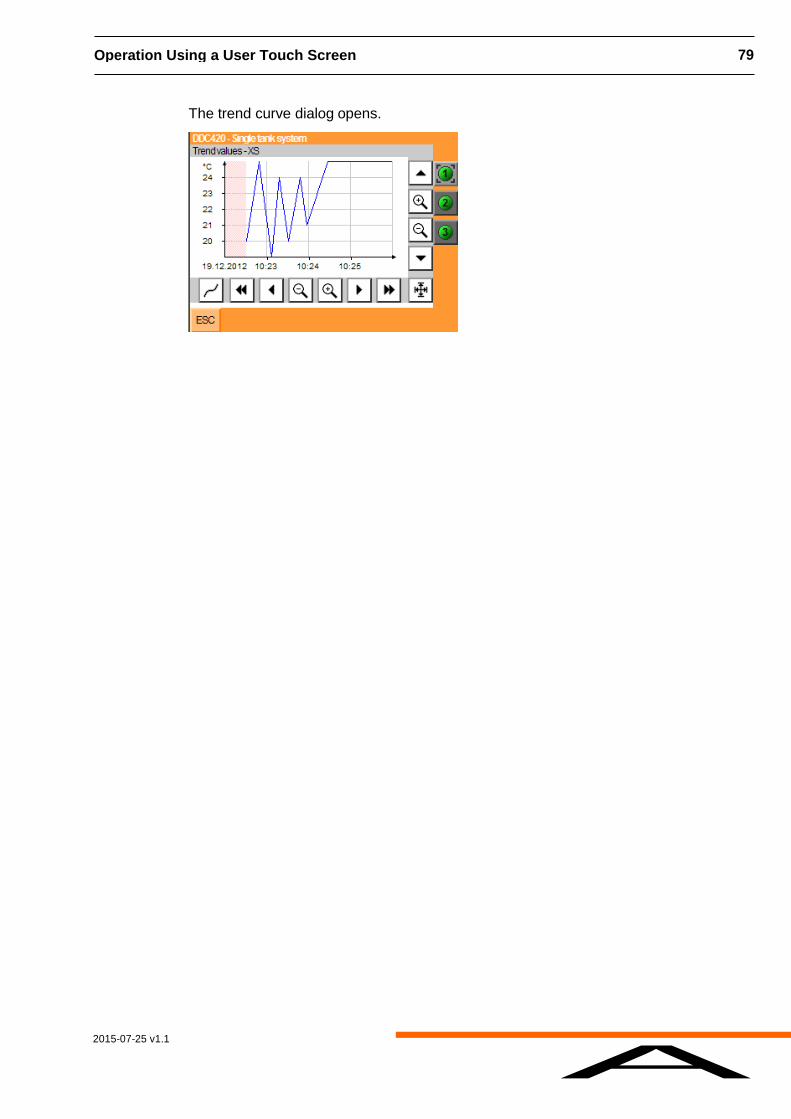
2015-07-25 v1.1
A
Operation Using a User Touch Screen 79
The trend curve dialog opens.

2015-07-25 v1.1
A
80 Operation Using a User Touch Screen
4.8.2 Displaying the trend curve
The trend curve is displayed almost exactly as it is in the Web browser. For a description,
see chapter 3.12.2 “Displaying the trend curve”, page 62.
Again, the trend curve can be shown as either a line display or a step display. However,
for the touch panel, the step display is the default setting.
It features the same functions and icons as those on the Web interface. For a description,
see chapter 3.12 “Trend display”, page 59.
NOTE
On 3.5" touch panels, only the step display is possible.
If values are deleted from the trend memory in the interim, this area is shaded light red.
If invalid values are recorded, this area is shaded light blue.
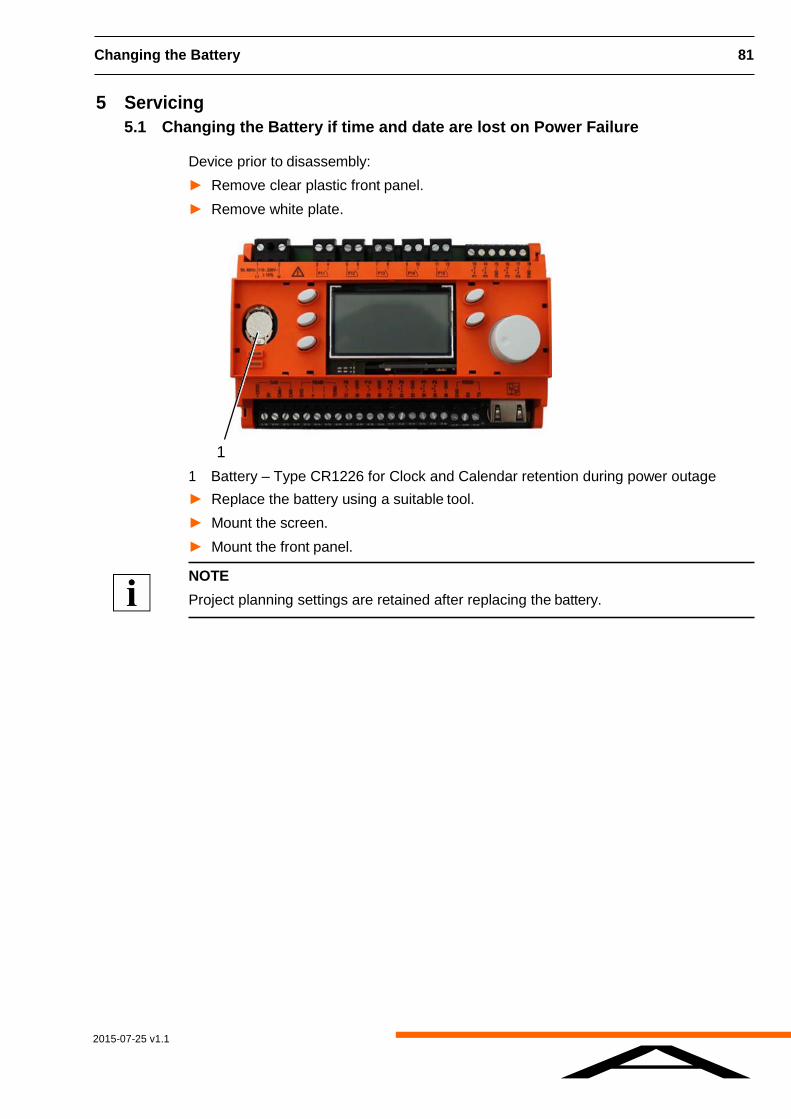
2015-07-25 v1.1
A
Changing the Battery 81
5 Servicing
5.1 Changing the Battery if time and date are lost on Power Failure
Device prior to disassembly:
► Remove clear plastic front panel.
► Remove white plate.
1
1 Battery – Type CR1226 for Clock and Calendar retention during power outage
► Replace the battery using a suitable tool.
► Mount the screen.
► Mount the front panel.
NOTE
Project planning settings are retained after replacing the battery.

2015-07-25 v1.1
A
82