Dave Chou i5osperf61 - IBM
38
2008 2Q EPSA seminar © 2008 IBM Corporation version6 version6 Performance Changes/Enhancements 周啟民 周啟民 周啟民 周啟民 Dave Chou [email protected]
Transcript of Dave Chou i5osperf61 - IBM

2008 2Q EPSA seminar
© 2008
IBM Corporation
version6version6
Performance Changes/Enhancements
周啟民周啟民周啟民周啟民Dave [email protected]

v6r1
© 2008 IBM Corporation2
Table of Contents
� Overview of i5/OS Performance Capabilities
– Collection Services
– Disk Watcher
– Job Watcher
– Wait Analysis
� V6R1 Performance Tools Changes
� V6R1 Performance Data Investigator

v6r1
© 2008 IBM Corporation3
i5/OS Performance Tools Strengths
� Industry leading capabilities in performance analysis
– Patented Wait Accounting Technology
– Collection Services always on 24x7 non-intrusive data collection
– Integrated database for performance data mining
– Graphical Interface for analysis

v6r1
© 2008 IBM Corporation4
Performance Tools on i5/OS
Collection
Services
Comm/Network
Middleware
Resource Usage
Response Time
I/O Service Time,
utilization, throughputWorkload activity
DatabaseTransactio
ns
i5/OS
System i
Instrumentation
Reporting/Analysis
ToolsISV / BP
Tools
System i
Navigator
Workload
Estimator
EWLM
Data
Collection
iDoctor
PEX Analyzer
Performance
Explorer (PEX)
Interval Data
Job/Thread
Summary
PM for System
i5 Factory
Summary Data Trace Data
Job Watcher
ARM
, Platform
services
Wait Buckets
Disk Watcher
Disk Watcher
Web Perf
Advisor
Trace Data
Pgm/Mod/Method
Detailed
Collection
Services
Performance
Tools
Batch Model
Job Watcher
PM for
System i5
IBM Director
CIM Metric
Providers

v6r1
© 2008 IBM Corporation5
Collection Services
� Collection Services is an i5/OS function that samples system and
job level performance data for later analysis
� Collects performance data 24x7 with minimal overhead
– It is recommended to always be running Collection Services
� Collects data from many system resources including:
– Hardware
– SLIC
– i5/OS
– Middleware
– Application

v6r1
© 2008 IBM Corporation6
Disk Watcher
� Disk Watcher is a new performance data collector for disk performance
– Evaluates I/O performance of programs or workload
– Evaluates I/O performance on multipath drives
– Evaluates I/O queuing performance
– Determines how performance may be improved if I/O related
– Determines optimal placement of devices, IOAs, buses
� STRDW command to start data collection
– Statistics
– Trace
� Data is written to DB2 files
– SQL is the only way to analyze the data in V5R3 and V5R4
– Investigate Performance Data will graph Disk Watcher data in V6R1
• New feature in Performance Tools product

v6r1
© 2008 IBM Corporation7
Disk Watcher Definition

v6r1
© 2008 IBM Corporation8
Start Disk Watcher

v6r1
© 2008 IBM Corporation9
Wait Analysis
� Wait analysis is the method used to determine what is not happening
– When a job is not running, what is it doing?
– Many waits are normal, many waits are not normal
• Helps to determine if a wait condition is a problem
� i5/OS has instrumented most of the wait conditions on the system
– Wait information is collected by Collection Services and Job Watcher
• Job Watcher and Collection Services use the same set of wait buckets (32)

v6r1
© 2008 IBM Corporation10
the run/wait summary for a snapshot interval
running waiting
01 02 … 05 06 … 16 17 18 … 32
wait buckets harvested
CPUq Syn DASD LockCPU
Job
the system maintains counts and accumulated time for all jobs/threads/tasks
Wait Accounting
v6r1
© 2008 IBM Corporation11
Job Watcher
� Job Watcher returns real-time information about a selected set of jobs, threads, or LIC tasks
� Job Watcher collects different types of data than Collection Services, and more frequent intervals so more overhead.
– Wait times
– CPU
– I/O activity
– Call Stacks
– SQL statements
– Communications statistics
– Activation Group statistics

v6r1
© 2008 IBM Corporation12
Job Watcher
� Job Watcher data can be externalized in the following ways
– SQL for experts
– Job Watcher component of iDoctor
– Job Watcher via Performance Data Investigator in V6R1
• Delivered as a new option of PT1

v6r1
© 2008 IBM Corporation13
i5/OS V6R1 Performance Tools Enhancements

v6r1
© 2008 IBM Corporation14
V6R1 Simplification and Integration of i5/OS Performance Tools
� Easier to find and use performance functions
� Expanded collection management
� Powerful, consolidated performance data investigation

v6r1
© 2008 IBM Corporation15
What’s New - Overview
� Collection Services enhancements
� Expanded function in i5/OS
� Powerful web-based performance data investigation capabilities (the “investigate data” task) to view and analyze performance data.
– Improved organization and accessibility via web-based
tasks and the new “Performance” navigation category.
– Common commands and web-based tasks to manage
performance collections independent of collector
� Job Watcher & Disk Watcher graphical analysis function available as options of the Performance Tools (PT/1) LPP.

v6r1
© 2008 IBM Corporation16
Performance Tools 5761-PT1 Packaging
� The complete Performance Tools Licensed Product
– 5761PT1 *BASE IBM Performance Tools for i5/OS
– 5761PT1 Option 1 Performance Tools - Manager Feature
– 5761PT1 Option 2 Performance Tools - Agent Feature
– 5761PT1 Option 3 Performance Tools - Job Watcher
� Orderable combinations that will work
– *Base + Option 1 (includes Disk Watcher)
– *Base + Option 1 + Option 3 (includes Disk Watcher and Job Watcher)
– *Base + Option 2
– *Base + Option 2 + Option 3 (includes Job Watcher)
– *Base + Option 3 (includes Job Watcher)
v6r1
© 2008 IBM Corporation17
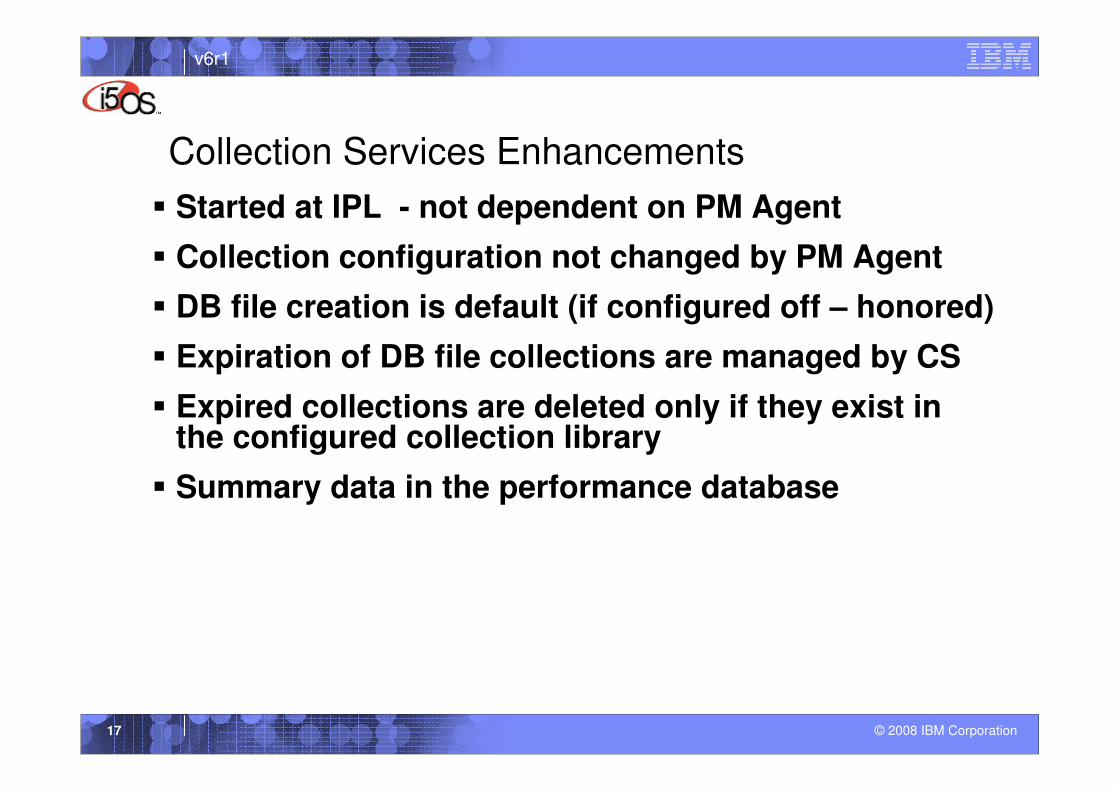
Collection Services Enhancements
� Started at IPL - not dependent on PM Agent
� Collection configuration not changed by PM Agent
� DB file creation is default (if configured off – honored)
� Expiration of DB file collections are managed by CS
� Expired collections are deleted only if they exist in the configured collection library
� Summary data in the performance database

v6r1
© 2008 IBM Corporation18
Collection Services Enhancements (cont’d)
� New file added:
� QAPMJVM - contains data for Java Virtual Machines (JVM) that are active within a process at the time the data was sampled. There is one record per interval for each process that has a JVM active.
– Note: The only supported JVM is IBM Technology for Java (J9).
– New fields in QAPMJOBMI file to support QAPMJVM.
• BJVMF - JVM started. Indicates if this process has ever started a JVM
• JBJVMT - JVM Type If JBJVMF is set to something other than x ’00’, it indicates the type of JVM that was started. (x’00 = unknown/not defined)
• JBJTHDT – JVM Thread type

v6r1
© 2008 IBM Corporation19
Expanded function in i5/OS
� Job Watcher Collector
– Commands formerly part of the iDoctor offering are included in base operating system
– Job Watcher definitions
� Disk Watcher Collector
– Part of base operating system
– Disk Watcher definitions
� WRKSYSACT
– moved from PT/1 to base operating system.
� PRTPEXRPT
– moved from PT/1 to base operating system.
(see note page)

v6r1
© 2008 IBM Corporation20
Collection Services default configuration
v6r1
© 2008 IBM Corporation21
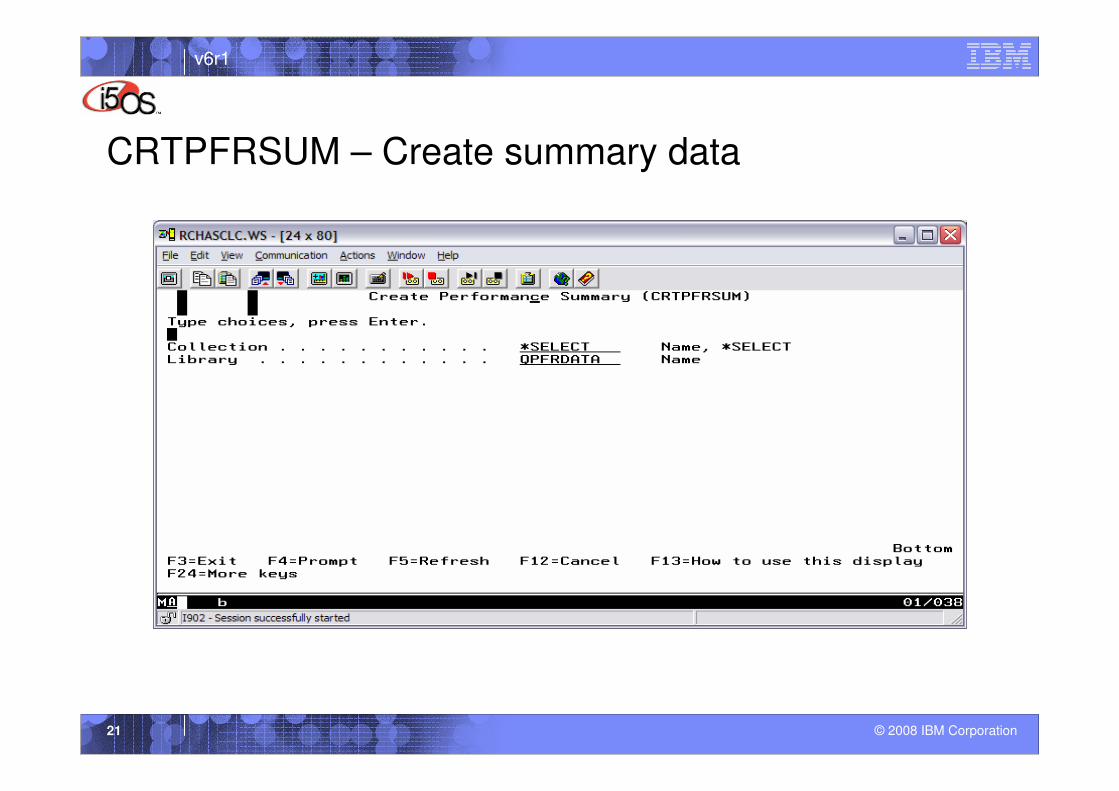
CRTPFRSUM – Create summary data

v6r1
© 2008 IBM Corporation22
Investigate Performance Data
� Investigate performance data/Visualizer is a web-based graphical analysis interface for i5/OS performance data
– Easy to find and use performance functions
– Powerful, consolidated collection visualization
– Expanded collection management
– Supports analysis of data from
• Collection Services (free with base operating system)• Disk Watcher (included with PT1)• Job Watcher (new chargeable option of PT1)

v6r1
© 2008 IBM Corporation23
Performance Data Visualization - Investigate Data
� Visualize data in charts and tables
– Fully-interactive charts allow zooming/panning/selecting
– Tables offer sorting, filtering, searching of entire data set.
� Drill-down to related charts, retaining context-sensitive data
– Time range
– Job names
– Subsystems
– Etc.
� Save customized charts/tables for future reference
– Or share URL with others!
� Supports Collection Services, Disk Watcher and Job Watcher database file collections.
� Extensible architecture to support other (IBM or ISV based) datacollections
v6r1
© 2008 IBM Corporation24
Simplify User Interface of Existing Functions
� A new “Performance” category is provided in the web hierarchy to serve as the starting point for performance related web enabled functions.
� Most tasks associated with the Collection Services, Disk Watcher, and Job Watcher collectors and the collections they produce have been web enabled.
– This includes a web task for Collection Services configuration
� xxxPFRCOL commands have been created to perform common collection management activities. These include: copy, delete, save, and restore a performance collection.
� CVTPFRCOL has been enhanced to also support PEX database collections.

v6r1
© 2008 IBM Corporation25
Investigate Performance

v6r1
© 2008 IBM Corporation26
CPU Utilization and Waits – zoomed in
v6r1
© 2008 IBM Corporation27
xxxPFRCOL commands
� CFGPFRCOL – changes collection services properties
– Standard Data Retention (STDDTARET) parm – specifies the period (days) to keep the members in the QAPM* files. – New at V6R1.
� CPYPFRCOL – creates a copy of a performance collection
� CVTPFRCOL – converts from previous release to format needed for Performance Tools
– Collection Types:
> *CSFILE – Collection Services files
> *PEXFILE – PEX files
> *ALL – all files
v6r1
© 2008 IBM Corporation28
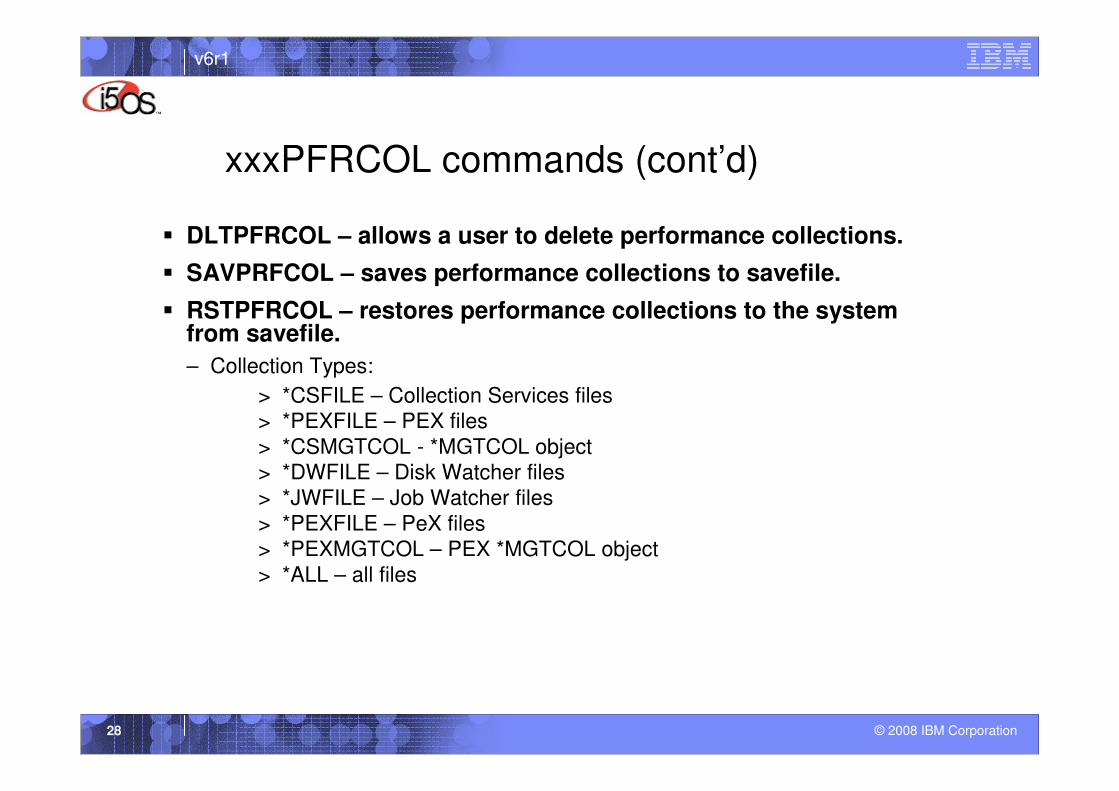
xxxPFRCOL commands (cont’d)
� DLTPFRCOL – allows a user to delete performance collections.
� SAVPRFCOL – saves performance collections to savefile.
� RSTPFRCOL – restores performance collections to the system from savefile.
– Collection Types:
> *CSFILE – Collection Services files
> *PEXFILE – PEX files
> *CSMGTCOL - *MGTCOL object
> *DWFILE – Disk Watcher files
> *JWFILE – Job Watcher files
> *PEXFILE – PeX files
> *PEXMGTCOL – PEX *MGTCOL object
> *ALL – all files

v6r1
© 2008 IBM Corporation29
Simplify User Interface View and Manage performance collections
� New web collection manager function: “Collections” task.
� Lists collections created by Collection Services, PEX, Disk Watcher and Job Watcher collectors.
� Supports filter, sort, and search capabilities based on many collection attributes. Most attributes have been made common across the supported collectors and their collections.
� “Actions” are supported to initiate management tasks such as copy, delete, save, investigate data, etc. on a collection based on its attributes.

v6r1
© 2008 IBM Corporation30
What is iDoctor?
� Product developed by the Support Center to enable effective resolution of customer performance problems
� Graphical analysis
� Heavy focus on wait analysis
� Main components
– Job Watcher – detailed job data and analysis
– PEX Analyzer - PEX data analysis

v6r1
© 2008 IBM Corporation31
Job Watcher Directions
� Job Watcher data collection free on all systems with V6R1
� Job Watcher Investigate Performance Data will be a new option ofthe Performance Tools product
• 5761-PT1, option 3
• Allows user to start and view Job Watcher
• English only
� Job Watcher Investigate Performance Data is not a direct migration of the Job Watcher feature of iDoctor
� iDoctor for iSeries Windows client will continue to be available

v6r1
© 2008 IBM Corporation32
Job Watcher commands
� ADDJWDFN – adds a new Job Watcher definition to the system.
� RMVJWDFN – removes Job Watcher definition(s) from the system.
� STRJW – starts Job Watcher to run for specific time period (intervals) or until a maximum size (in MB) is reached.
� ENDJW – ends Job Watcher.

v6r1
© 2008 IBM Corporation33
Job Watcher

v6r1
© 2008 IBM Corporation34
Explain Disk Watcher Chart

v6r1
© 2008 IBM Corporation35
View at the Stacked Bar

v6r1
© 2008 IBM Corporation36
References
� iDoctor for iSeries
– http://www-912.ibm.com/i_dir/idoctor.nsf
� Performance Management for IBM System i
– http://www-03.ibm.com/servers/eserver/iseries/perfmgmt/
� Application and Program Performance Analysis Using PEX Statistics on IBM i5/OS
– http://www.redbooks.ibm.com/redbooks/pdfs/sg247457.pdf
� IBM eServer iSeries Performance Management Tools
– http://www.redbooks.ibm.com/redpapers/pdfs/redp4026.pdf

v6r1
© 2008 IBM Corporation37
Published Articles on Performance Topics
� Using Wait State Accounting to Determine Disk Performance
– http://www.systeminetwork.com/artarchive/20700/index.html
� Understanding Disk Performance, Part 2: Disk Operation on i5/OS
– http://www.systeminetwork.com/artarchive/20870/Understanding
_Disk_Performance__Part_2__Disk_Operation_on_i5_OS.html
� A New Way to Look at Disk Performance
– http://www.ibmsystemsmag.com/i5/may07/administrator/15631p1.aspx
v6r1
© 2008 IBM Corporation38
Trademarks and Disclaimers8 IBM Corporation 1994-2007. All rights reserved.
References in this document to IBM products or services do not imply that IBM intends to make them available in every country.Trademarks of International Business Machines Corporation in the United States, other countries, or both can be found on the World Wide Web at
http://www.ibm.com/legal/copytrade.shtml.Adobe, Acrobat, PostScript and all Adobe-based trademarks are either registered trademarks or trademarks of Adobe Systems Incorporated in the United States, other
countries, or both.Intel, Intel logo, Intel Inside, Intel Inside logo, Intel Centrino, Intel Centrino logo, Celeron, Intel Xeon, Intel SpeedStep, Itanium, and Pentium are trademarks or registered
trademarks of Intel Corporation or its subsidiaries in the United States and other countries.
Linux is a registered trademark of Linus Torvalds in the United States, other countries, or both.Microsoft, Windows, Windows NT, and the Windows logo are trademarks of Microsoft Corporation in the United States, other countries, or both.IT Infrastructure Library is a registered trademark of the Central Computer and Telecommunications Agency which is now part of the Office of Government Commerce.ITIL is a registered trademark, and a registered community trademark of the Office of Government Commerce, and is registered in the U.S. Patent and Trademark Office.UNIX is a registered trademark of The Open Group in the United States and other countries.Cell Broadband Engine and Cell/B.E. are trademarks of Sony Computer Entertainment, Inc., in the United States, other countries, or both and are used under license
therefrom.Java and all Java-based trademarks are trademarks of Sun Microsystems, Inc. in the United States, other countries, or both.Other company, product, or service names may be trademarks or service marks of others.
Information is provided "AS IS" without warranty of any kind.
The customer examples described are presented as illustrations of how those customers have used IBM products and the results they may have achieved. Actual environmental costs and performance characteristics may vary by customer.
Information concerning non-IBM products was obtained from a supplier of these products, published announcement material, or other publicly available sources and does not constitute an endorsement of such products by IBM. Sources for non-IBM list prices and performance numbers are taken from publicly available information, including vendor announcements and vendor worldwide homepages. IBM has not tested these products and cannot confirm the accuracy of performance, capability, or any other claims related to non-IBM products. Questions on the capability of non-IBM products should be addressed to the supplier of those products.
All statements regarding IBM future direction and intent are subject to change or withdrawal without notice, and represent goals and objectives only.
Some information addresses anticipated future capabilities. Such information is not intended as a definitive statement of a commitment to specific levels of performance, function or delivery schedules with respect to any future products. Such commitments are only made in IBM product announcements. The information is presented here to communicate IBM's current investment and development activities as a good faith effort to help with our customers' future planning.
Performance is based on measurements and projections using standard IBM benchmarks in a controlled environment. The actual throughput or performance that any user will experience will vary depending upon considerations such as the amount of multiprogramming in the user's job stream, the I/O configuration, the storage configuration, and the workload processed. Therefore, no assurance can be given that an individual user will achieve throughput or performance improvements equivalent to the ratios stated here.
Prices are suggested U.S. list prices and are subject to change without notice. Contact your IBM representative or Business Partner for the most current pricing in your geography.